Article

The Relationship Between Tectono-Magmatism and Gold (Polymetallic) Deposits in the Northeastern Hunan Province, Jiangnan Orogen: Insight from Three-Dimensional Electrical Structures

1
School of Geophysics and Information Technology, China University of Geosciences, Beijing 100083, China
2
School of Geoscience, Hebei GEO University, Shijiazhuang 050031, China
3
Key Laboratory of Intraplate Volcanoes and Earthquakes, China University of Geosciences, Ministry of Education, Beijing 100083, China
*
Authors to whom correspondence should be addressed.
Minerals 2025, 15(12), 1244; https://doi.org/10.3390/min15121244
Submission received: 11 October 2025 / Revised: 19 November 2025 / Accepted: 21 November 2025 / Published: 25 November 2025
(This article belongs to the Special Issue Geoelectricity and Electrical Methods in Mineral Exploration)

Abstract

The Northeastern Hunan Province (NEH), situated within the Central Jiangnan Orogen, hosts abundant Au-polymetallic deposits. However, the coupling mechanism between the deep tectono-magmatism and Au-polymetallic mineralization remains poorly understood. In this study, a three-dimensional (3D) resistivity model derived from 59 magnetotelluric (MT) stations is presented to investigate the lithospheric architecture and its relationship to Au-polymetallic mineralization. The model reveals three prominent mid-to-lower crustal conductors (3–30 Ω·m) at 15–35 km depth beneath Au-polymetallic deposits along NE faults. These anomalies are interpreted as source zones and pathways for magmatic-hydrothermal fluids during the Late Mesozoic tectono-magmatism, likely formed by the enrichment of graphite films and sulfides along faults, which thus account for the observed conductive features. Moreover, the model reveals a thinning electrical lithosphere–asthenosphere boundary (eLAB) at ~80 km depth beneath the Southeastern NEH, attributed to lithospheric delamination triggered by the rollback of the Paleo-Pacific plate. This delamination facilitated the upwelling and lateral migration of asthenospheric materials, which promoted intense extension and crust–mantle interaction. Consequently, metallic elements were extensively extracted from the crust and concentrated into large-scale Au-polymetallic deposits in the NEH. Integrating with previous geochemical study, a deep-seated magmatic underplating and MASH model is proposed as key drivers of Au-polymetallic enrichment in the NEH, effectively linking deep tectono-magmatism with shallow mineralization. From a rheological perspective, three low-viscosity zones within the mid-to-lower crust likely acted as both vertical conduits and deep sources for metallogenic fluids, providing favorable pathways for their migration and accumulation.

1. Introduction

The South China Block (SCB), situated at the convergent margin of the Paleo-Asian, Tethyan, and Paleo-Pacific tectonic regimes, has undergone complex tectonic evolution [1]. During the Mesozoic, a tectonic transition from the Tethyan regime to the Paleo-Pacific framework yielded the dominant NE-trending structure, accompanied by extensive tectono-magmatism and polymetallic mineralization [2,3,4,5]. As the collisional boundary between the Yangtze and Cathaysia blocks (Figure 1a), the Jiangnan Orogen recorded multiple episodes of intracontinental orogeny and polymetallic mineralization [6,7]. The NEH (112°45′–114° E, 28–29° N), within the Central segment of the Jiangnan Orogen, is characterized by NE-trending faults, extensional domes, and widespread Late Mesozoic tectono-magmatism [8]. It hosts diverse mineral resources, including Au, Cu, Pb-Zn, and rare metals (Nb-Ta, Li, Be, etc.), making the NEH serve as a representative region for studying intracontinental mineralization [8].
The formation of mineral deposits originates from the stepwise enrichment of metallogenic materials, driven by complex physical and chemical processes operating across multiple geological systems [9]. The integration of geophysical and geochemical datasets provides a powerful framework for delineating magma–hydrothermal pathways and tracing lithospheric material cycling, thereby enabling the reconstruction of the spatial and temporal coupling between tectono-magmatism and mineralization [6,10]. Extensive petrological and geochemical investigations in NEH have constrained the structural framework, magmatic chronology, fluid evolution, and metallogenic processes associated with Au-Cu-Pb-Zn-Co mineralization, with particular emphasis on the genetic links between tectono-magmatism and gold (polymetallic) mineralization—e.g., [8,11,12,13]. These studies indicate that ore formation predominantly occurred under a lithospheric extensional regime during the Middle Jurassic to Early Cretaceous, with isotopic (C-H-O-S-Pb) and noble gas (He-Ar) evidence further supporting a genetic relationship between mineralizing fluids and contemporaneous magmatism [14,15,16,17]. Additionally, some geophysical studies—including seismology, gravity, aeromagnetic, and magnetotelluric methods—have been utilized to investigate the lithospheric architecture and its control on Au-Cu mineralization within the Jiangnan Orogen—e.g., [6,7,18,19]. Seismic tomography reveals pervasive low-velocity anomalies in the upper mantle beneath Eastern SCB, interpreted as residual magmatic heat from dehydration of the subducting Paleo-Pacific slab, which may have driven the Yanshanian metallogenic events—e.g., [18,20]. Deep crustal boundaries and major faults in the Jiangnan Orogen not only acted as ore-fluid conduits, but also served as pathways for mantle-derived metallogenic materials (e.g., Cu-Au) emplaced during early collisional stages [19,21]. Subsequent tectonic reactivation promoted the remobilization and redistribution of these materials along secondary faults, ultimately forming Cu-Au deposits with varied metallogenetic ages and types [7,21].
Despite these advancements, current regional geophysical models and geochemical studies are insufficient to investigate fine lithospheric structures, nor can they effectively track the 3D material architecture of the lithosphere [22,23]. Against this backdrop, magnetotelluric (MT) sounding emerges as a powerful tool for imaging the lithospheric electrical structures via natural electromagnetic signals, and is particularly effective in detecting conductive zones associated with high-temperature melts, hydrothermal fluids, and rheologically weak structures [24]. Additionally, MT imaging conducted in numerous giant mineral provinces worldwide has demonstrated a strong spatial correlation between crustal conductors and major iron oxide-apatite (IOA) or iron oxide-copper-gold (IOCG) deposits—e.g., [25,26,27,28]. Although geophysical images capture the present structure, the Late Mesozoic epoch witnessed the strongest and youngest regional tectono-magmatism in the NEH [2], enabling the use of present resistivity structures as proxies for investigating the Late Mesozoic magmatism and metallogenesis [29].
In this context, we employ 3D inversion of 59 MT stations to resolve the deep electrical structure of Au-polymetallic- deposits in the NEH. By integrating electrical and rheological analyses, we aim to elucidate the genetic link between tectono-magmatism and the Au-polymetallic mineralization in the NEH.

2. Geological Setting

2.1. Tectonic Outline

The Jiangnan Orogen was formed during the Neoproterozoic collision and amalgamation of the Yangtze and Cathaysia blocks (Figure 1a), and accumulating evidence suggests that the Jiangnan Orogen has undergone multiple tectonic episodes, including the Early Paleozoic (460–420 Ma) orogeny, Middle Triassic collision with peripheral blocks (Indochina and North China Block), and subsequent Mesozoic subduction of the Paleo-Pacific plate [1]. Since the Late Mesozoic (~150 Ma), rollback of the Paleo-Pacific slab induced a transition to an extensional and strike-slip tectonic regime, resulting in the development of NE–SW trending normal faults (Figure 1b), extensional domes, syn-tectonic magmatism, and basin-and-range-style structures—e.g., [1,2]. These Phanerozoic tectono-magmatisms not only reworked the underlying Precambrian basement, primarily composed of the Meso-Neoproterozoic shallow metamorphic volcaniclastic-sedimentary sequences [1], but also triggered widespread polymetallic mineralization—e.g., [2,6].
Within the framework of an NW–SE oriented regional stress field, the NEH developed a series of prominent faults and shear zones, including NNE-trending Xinning-Huitang Fault (XHF), Changsha-Pingjiang Fault (CPF), and Liling-Hengdong Fault (LHF), as well as near-EW trending ductile shear zones (Figure 1b), together with NE-trending basin and range tectonics [8]. This tectonic regime encompasses major basins and uplifts such as the Dongting Basin, Mufushan-Wangxiang Uplift, Changsha-Pingjiang Depression, Liuyang-Hengdong Uplift, and Liling-Youxian Depression (Figure 1b) [11]. Among these, the long-lived CPF plays a key role in controlling the distribution of Cretaceous red-bed basins, as well as Late Mesozoic magmatism and associated metallogenesis [11]. The Late Mesozoic witnessed the emplacement of extensive felsic batholiths in the NEH (including the Wangxiang and Mufushan granite intrusions), as well as mafic dikes and metamorphic core complexes, all of which are genetically associated with regional extensional regimes [11,30]. The regional basement was composed of the paleo-mesoproterozoic metamorphic units, such as the Lianyunshan and Lengjiaxi Groups [8]. Notably, the coupling between the strong gold enrichment (1–8 times the crustal Clarke value) in the Neoproterozoic Lengjiaxi Group and the Pb–S isotopic composition of gold-bearing sulfides points decisively to this metamorphic basement as the principal metal source—e.g., [8,31].

2.2. Mineral Deposits

The NEH, located within the core area of the Central segment of the Qin-Hang metallogenic belt, hosts a variety of mineral deposits, including gold, copper, lead-zinc, and rare metals such as lithium, beryllium, and niobium-tantalum—e.g., [8,12,13,32]. Gold mineralization, such as Dadong-Wangu, Huangjindong, and Yanlinsi, is predominantly concentrated in fault-related uplift zones and uplift-depression transition zones, and mainly hosted at the lithological contacts between shallow metamorphic clastic rocks of the Neoproterozoic Lengjiaxi Group and the Late Mesozoic intrusions [8,11]. The principal metallogenic epoch in the NEH corresponds to the Late Mesozoic (ca. 150–130 Ma), with additional metallogenic records during the Indosinian and Caledonian orogenic events—e.g., [13,33]. Fluid inclusion and isotopic (e.g., H-O and He-Ar) studies suggest that metallogenic fluids were primarily derived from metamorphic and magmatic sources, with contributions from mantle-derived fluids and meteoric water—e.g., [14,15,34]. Moreover, the spatial zoning of mineralization around the Lianyunshan pluton—transitioning from proximal high-temperature to distal low-temperature assemblages—highlights the genetic link between the Late Mesozoic tectono-magmatism and mineralization [11].
Lead-zinc polymetallic deposits (e.g., Taolin, Lishan, and Jingchong) are similarly located at the contacts between Yanshanian granitic plutons and the Lengjiaxi Group, and their metallogenic age (121–138 Ma) postdates the emplacement of the Mufushan and Lianyunshan plutons (~140 Ma), indicating a temporal association with late-stage magmatism [12,17]. Isotopic (e.g., O-H, He-Ar, S-Pb) evidences suggest that metallogenic fluids were predominantly derived from crustal magmatic fluids, with minor admixture of meteoric water and mantle-derived components—e.g., [17,35]. In addition, the Mufushan–Lianyunshan area is characterized by granitic pegmatite dikes hosting significant Nb–Ta–Li–Be mineralization [36]. Microstructural analyses of tourmaline and B isotopic data reveal that metallogenic fluids exhibit transitional characteristics of magmatic-hydrothermal fluids, derived primarily from volatile-rich melts produced during late-stage magmatic differentiation [32,37,38]. The metamorphic basement of the Lengjiaxi Group not only served as a magma source, but its partial melting also contributed material for Nb-Ta mineralization [32].
In summary, the Mesozoic mineralization shows a significant spatio-temporal link with tectono-magmatism in the NEH. Elucidating the sources and migration pathways of magmatic-hydrothermal fluids is therefore critical for understanding the Au-polymetallic metallogenic system.

3. Regional Geophysical Setting

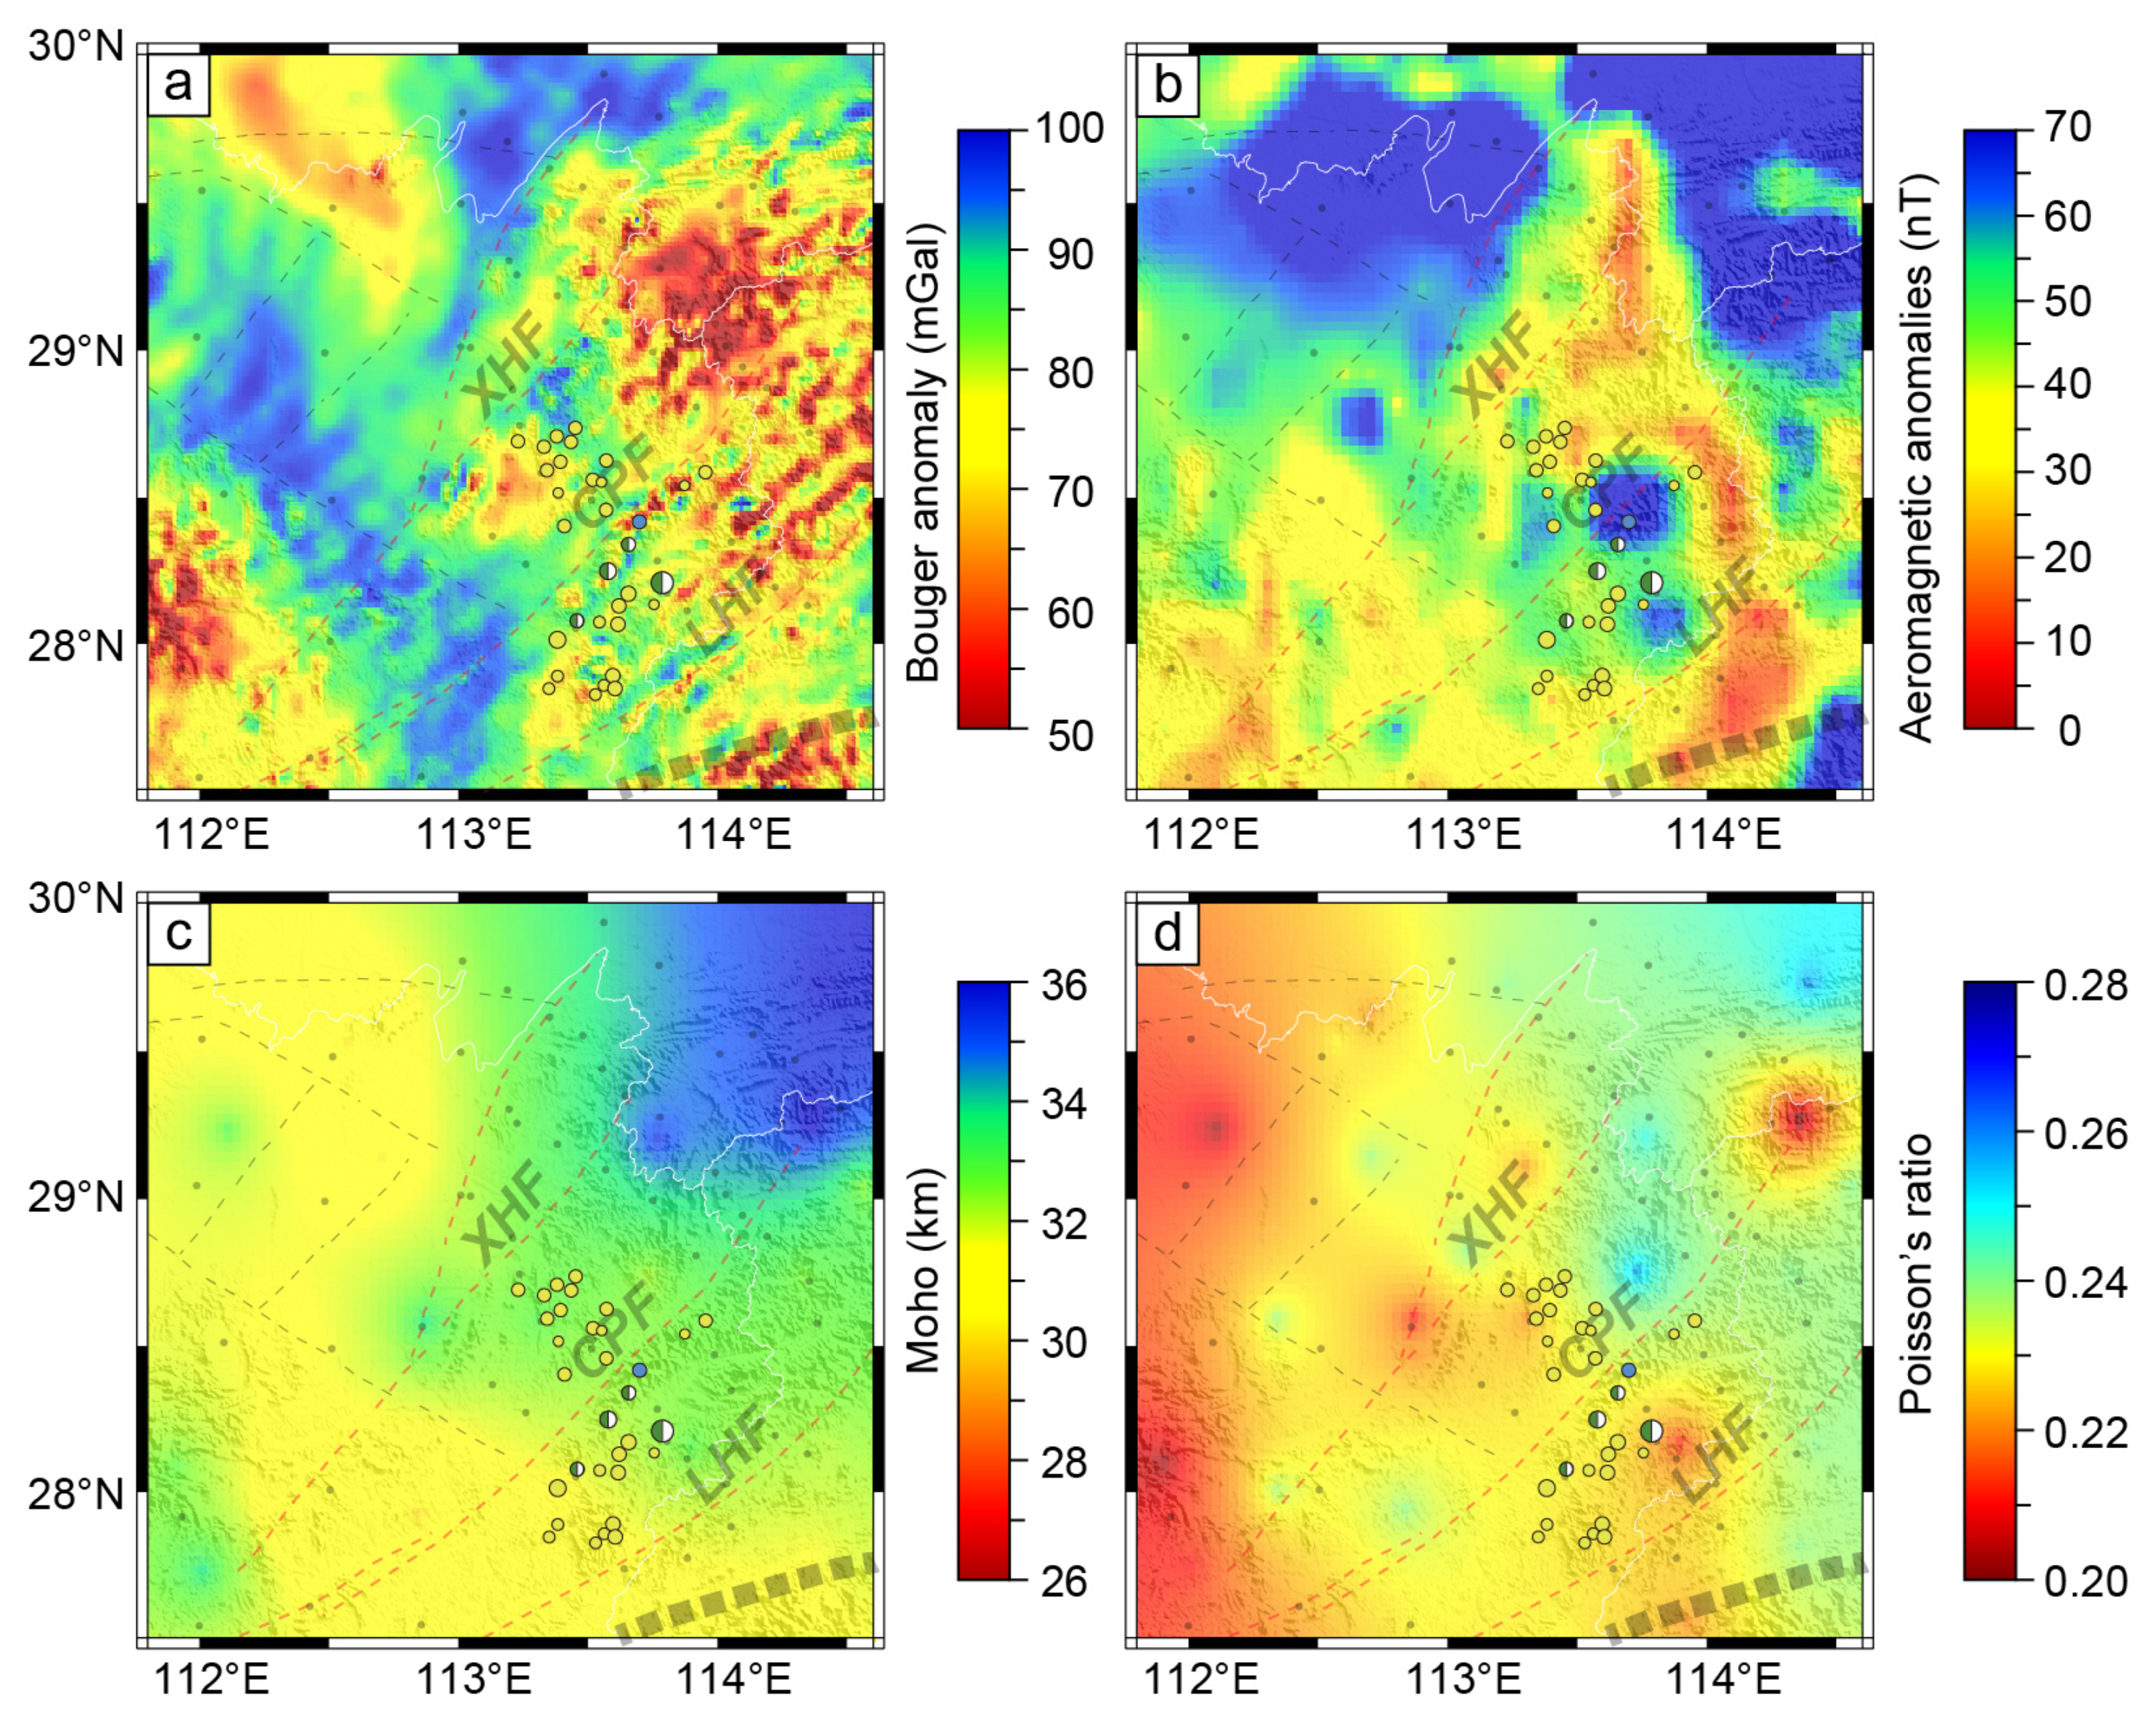
The deep-seated crustal architecture of the NEH preserves a pronounced imprint of multi-stage tectono-magmatism, and regional geophysical imaging offers critical constraints for delineating the metallogenic framework. Density measurements indicated significant contrasts among the exposed Yanshanian granitic intrusions (2.4~2.49 g/cm3), ore bodies (2.62~2.69 g/cm3), and strata (2.49~2.59 g/cm3) in the NEH [39], underscoring the geophysical detectability of key lithological units. According to the WGM2012 model [40], the Western Dongting Basin is characterized by high gravity values (>80 mGal) (Figure 2a), corresponding to an uplifted, high-density crystalline basement. In contrast, the Eastern domain, marked by lower gravity values (<80 mGal), correlates spatially with the extensive low-density Yanshanian granites, including the Mufushan, Wangxiang, and Lianyunshan plutons [39]. Magnetic susceptibility statistics suggested that the exposed strata, granitic rocks, and ore bodies within NEH are generally non-magnetic to weakly magnetic, and therefore insufficient to produce prominent regional magnetic anomalies [39]. Nevertheless, magmatic–hydrothermal alteration processes could facilitate the precipitation and concentration of ferromagnetic minerals, resulting in localized magnetic anomalies [39]. The amplitude-aeromagnetic anomaly [41] across the NEH (Figure 2b) displays a background of low to moderate intensity, with several prominent high-amplitude anomalies occurring in proximity to Yanshanian granitic plutons. These anomalies are attributed to enriched ferromagnetic minerals, which are likely linked to the Late Mesozoic magmatic-hydrothermal events.
Crustal thickness and Poisson’s ratio (or Vp/Vs ratio) are key parameters for studying crustal isostasy, crust–mantle interactions, lithospheric deformation, and crustal composition. In the NEH, most receiver function images studies consistently indicate a relatively thin crust (31–35 km) and low Poisson’s ratio (<0.26) (Figure 2c,d) [42]. However, the marked discrepancy between present crustal thickness and that of the pre-Mesozoic crust (>45 km) [43], as well as the spatial correspondence between locally elevated Poisson’s ratio (>0.26) and mafic dikes [30], provides compelling evidence for lithospheric thinning, asthenosphere upwelling, and mafic magmatic underplating. The integrated interpretation of gravity, magnetic, crustal thickness, and Poisson’s ratio data in the NEH effectively delineates the structural imprints of the Mesozoic tectono-magmatism and highlights the feasibility of geophysical methods in reconstructing the tectono-magmatic and metallogenic system. Nevertheless, the absence of fine geophysical models and the limited understanding of crust–mantle interactions continue to hinder comprehensive interpretations regarding the Mesozoic tectono-magmatism and associated mineralization.

4. Data and Method

4.1. Data Acquisition and Processing

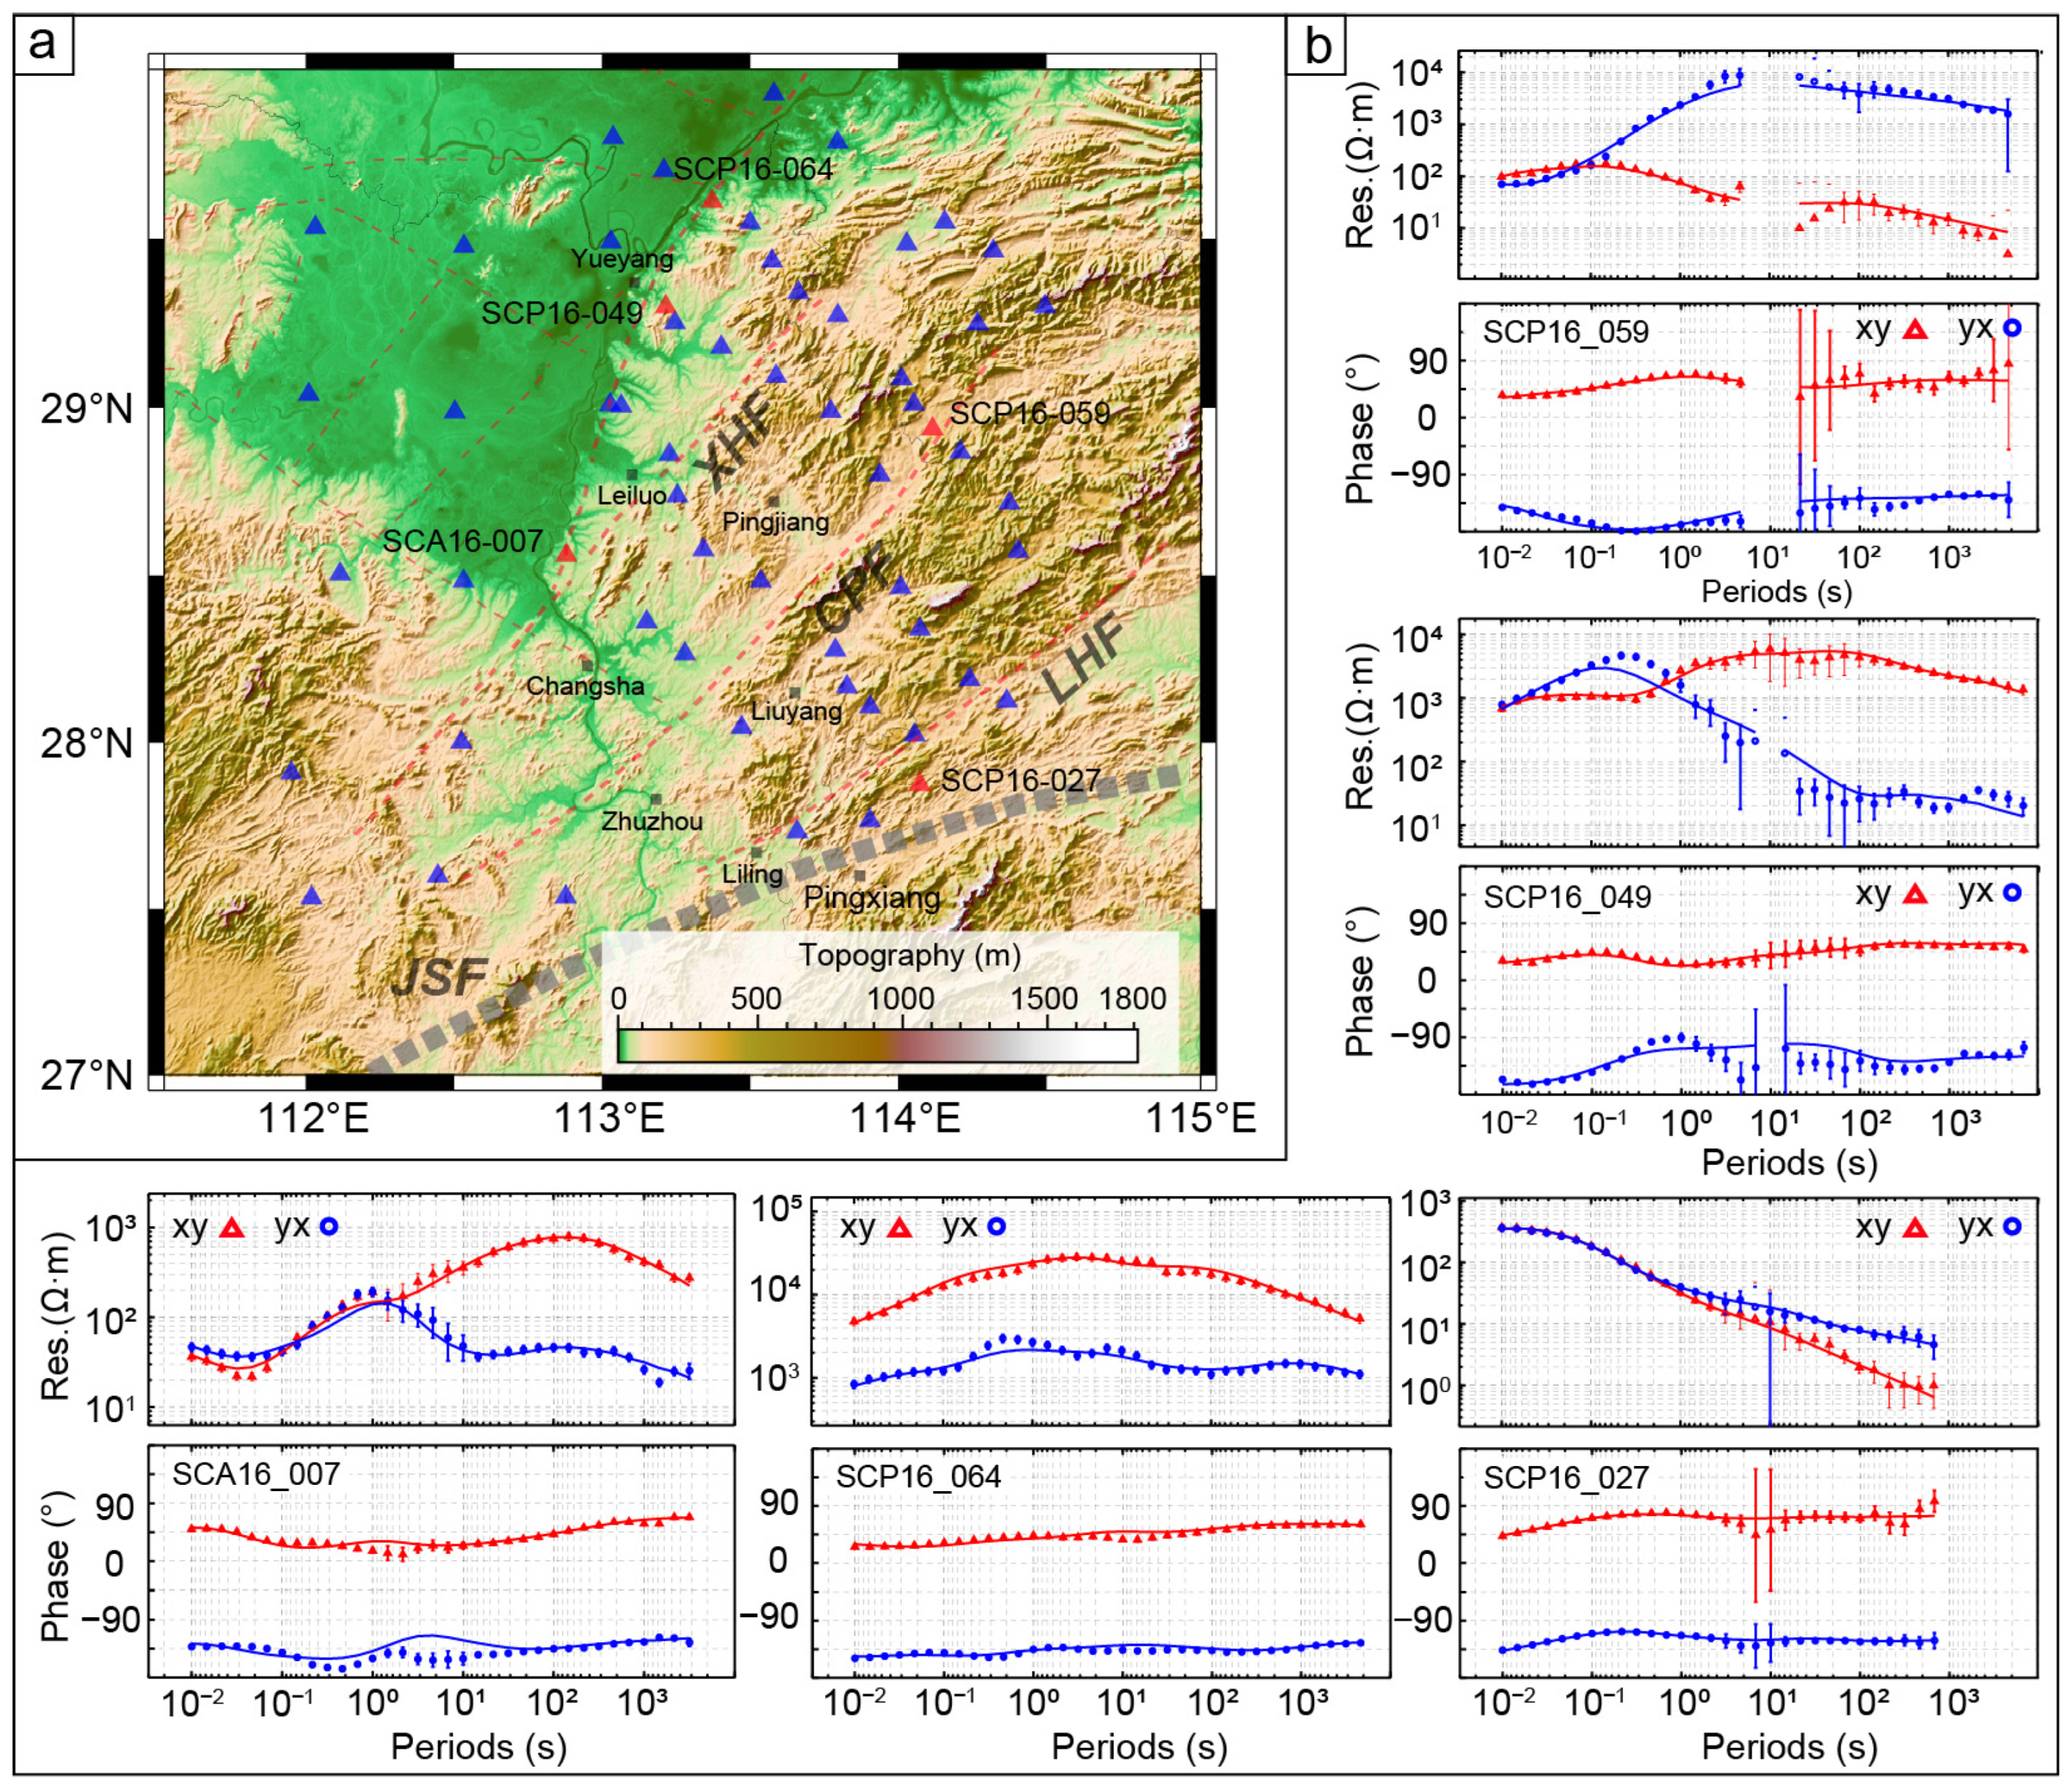
In this study, 59 broadband MT stations were deployed across the NEH and adjacent areas (112–115° E, 27–30° N) (Figure 3a), providing a comprehensive coverage of Au-polymetallic deposits. Although these stations were non-uniformly distributed, denser stations with a spacing of approximately 10–20 km were achieved in the eastern deposit-bearing region. Data acquisition was carried out using the MTU-5A electromagnetic system (Phoenix Geophysics Ltd., Ontario, Canada), with recording durations exceeding 40 h at each MT station to ensure sufficient signal quality, particularly in the low-frequency band. At every station, two orthogonal horizontal electric field components (Ex and Ey) and three magnetic field components (Hx, Hy, and Hz), aligned with the North–South, East–West, and vertical directions, respectively, were synchronously measured.
The acquired raw time-series data were processed by the fast Fourier transform and Robust estimation techniques [44] to obtain impedance tensor components (Zxx, Zxy, Zyx, and Zyy). Indeed, some MT stations must not be placed around the interference facilities, such as high-voltage power grids or transformers. The main electromagnetic interference factors in this area can be divided into the following categories: high-voltage power grid, transformer, substation, electrified railway, and mining activities. In the face of these electromagnetic interferences, measures such as extending the observation time, utilizing the remote reference technology [45], and incorporating power spectrum analysis have been attempted to enhance data quality. Nevertheless, some specific periods were still affected by strong electromagnetic interference, and these low-quality data were removed using the MT-Editor software. After that, the final dataset covered effective periods ranging from approximately 0.003 to 10,000 s. Some representative apparent resistivity and phase curves of the off-diagonal impedance components (Zxy and Zyx) are shown in Figure 3b. These curves display smooth trends with small error bars, indicating high overall data quality. Moreover, substantial variations in apparent resistivity among different MT stations highlight the presence of pronounced lateral heterogeneity in the subsurface electrical structure across the NEH. For example, at station SCP16_059 near the CPF, the XY component shows a decreasing trend for periods over 1 s, while the YX component exhibits a trend of first increasing and then decreasing—indicating a potential resistivity interface in the deep-seated zones. At station SCP16_027 near the Jiangshan–Shaoxing Fault Zone, both the XY and YX components display obvious decreasing trends, with the minimum apparent resistivity reaching 1.0 Ω·m. This suggests the presence of a conductivity anomaly near the JSF, which may extend to the upper mantle depth.

4.2. Dimensionality Analysis

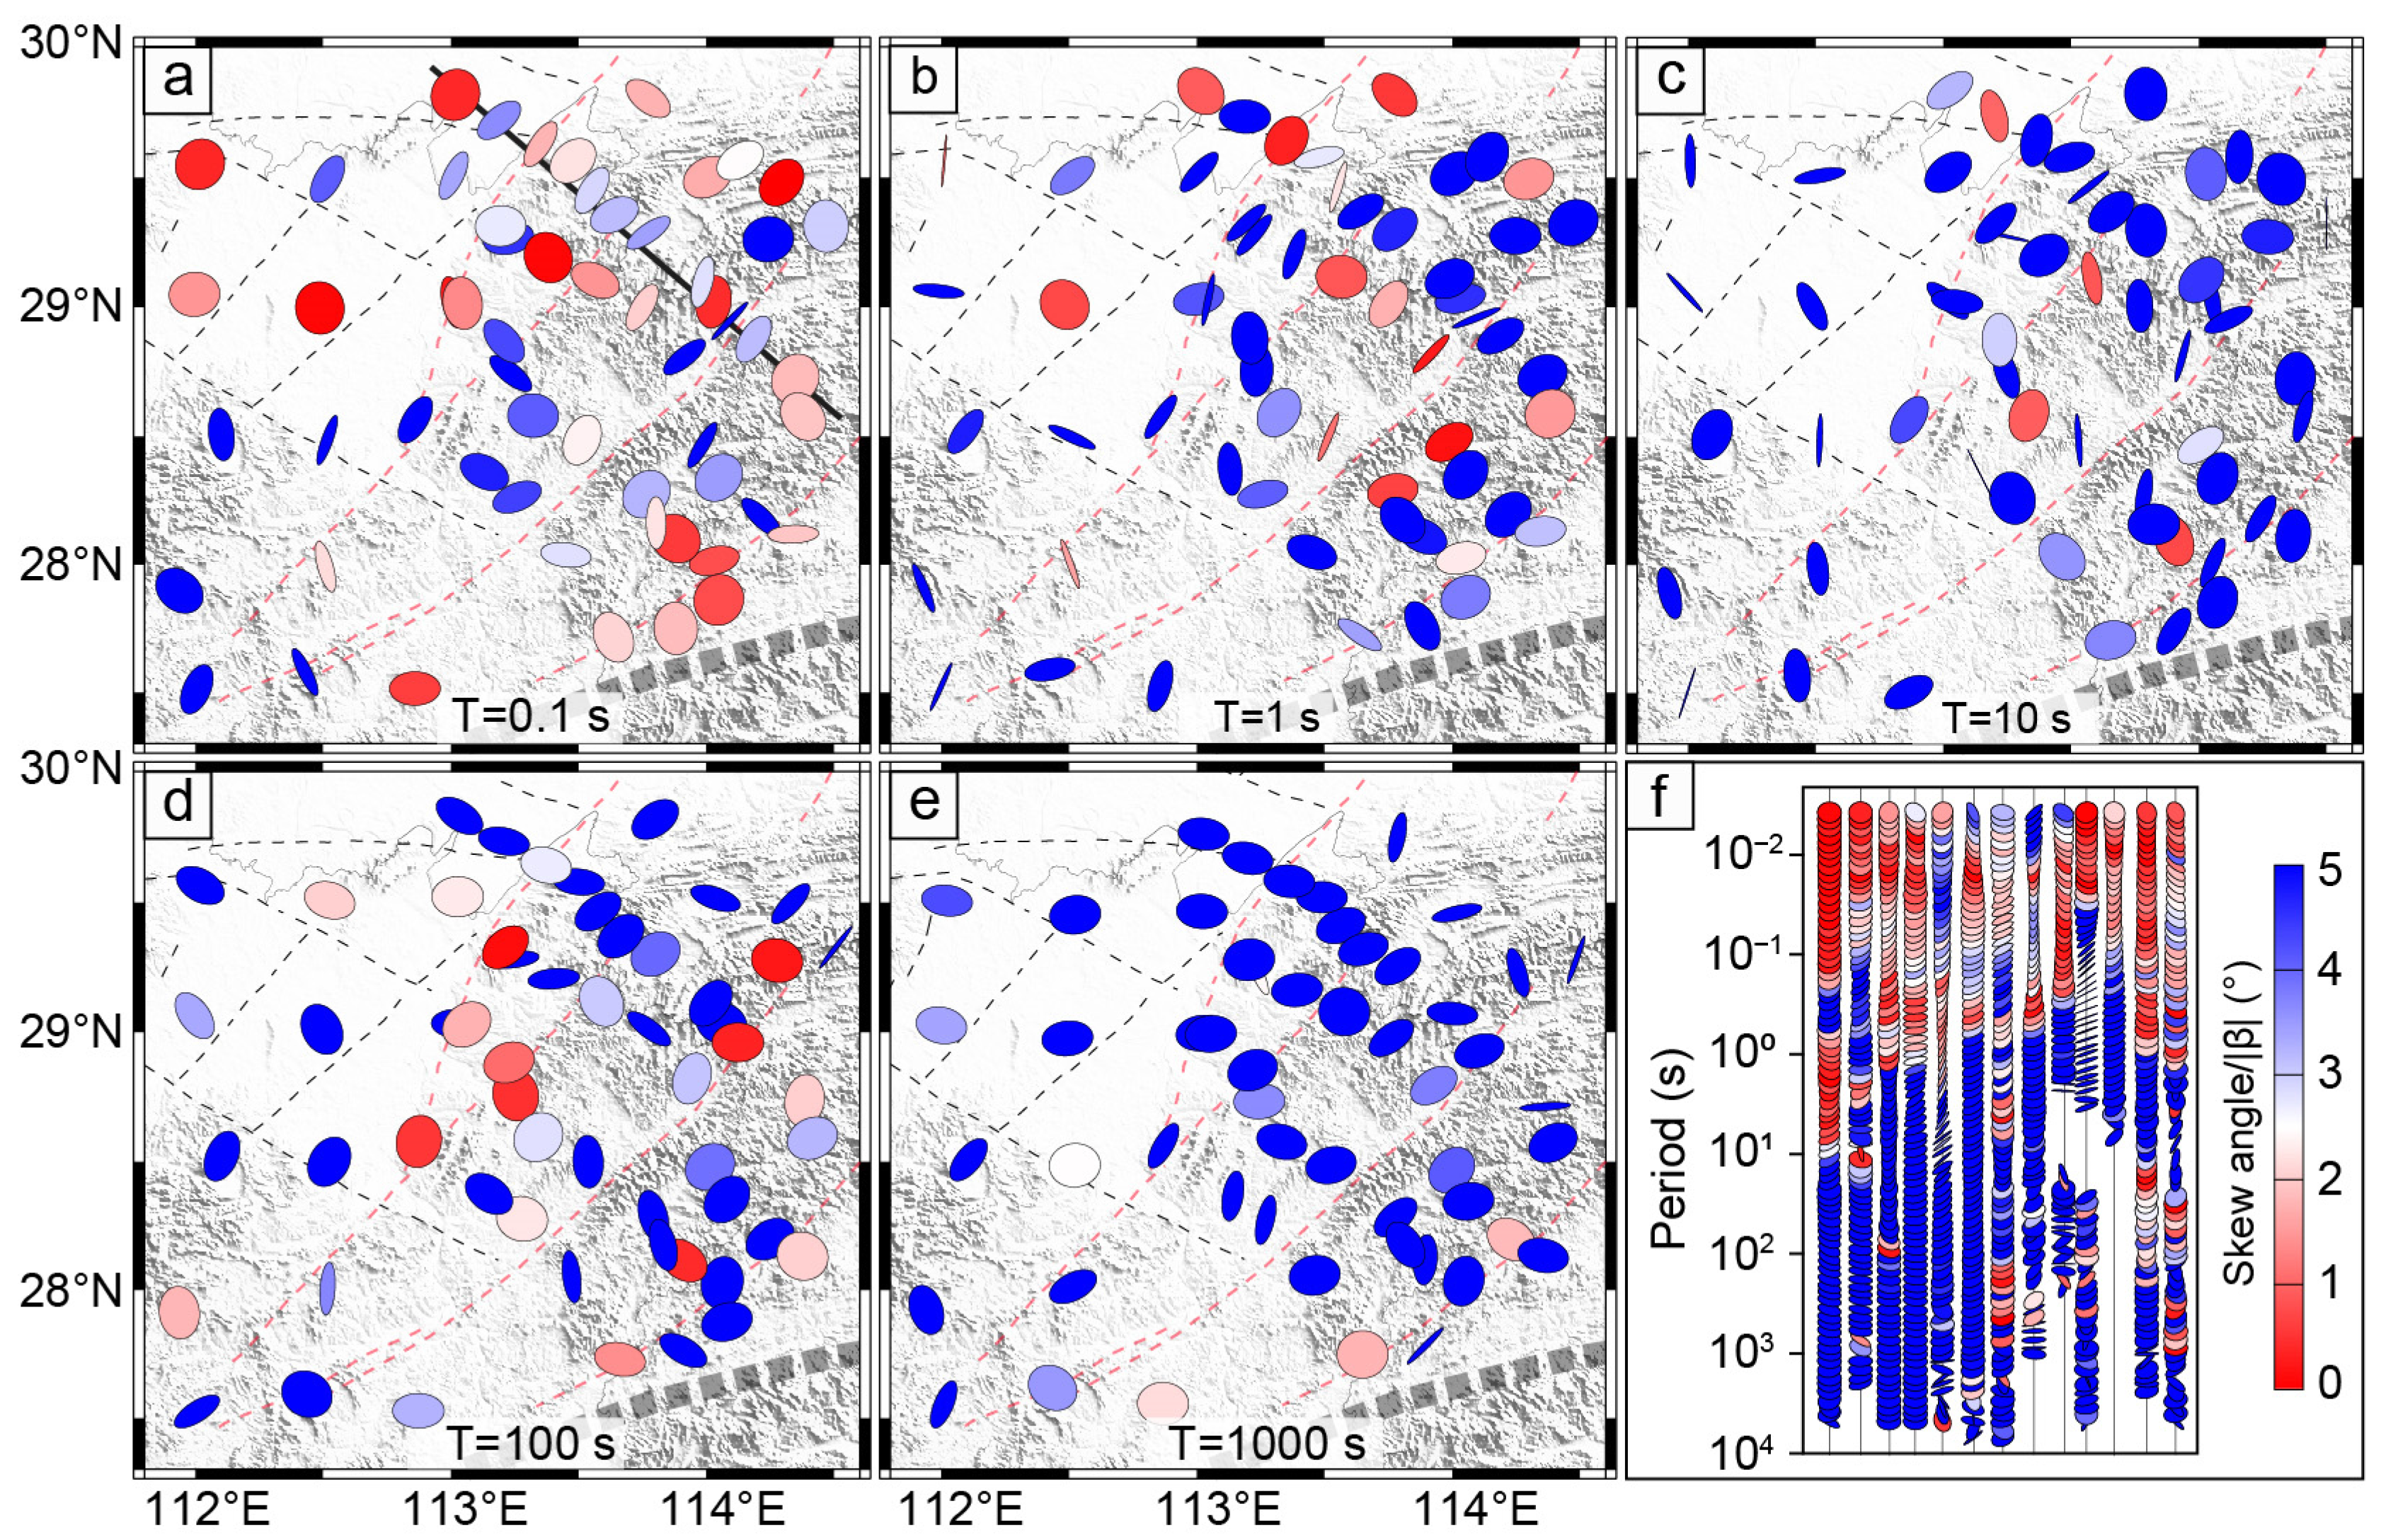
The MT phase tensor, which circumvents the limitations of 2D assumptions and mitigates the distortion effects inherent in impedance data, has been widely adopted for evaluating subsurface dimensionality and variations in deep electrical conductivity [46,47]. The MT phase tensor is graphically represented by a series of ellipses, where the orientation of the major or minor axis indicates the principal direction of induced current flows, thereby reflecting lateral variations in the subsurface resistivity structure. The color fill of each ellipse denotes the phase tensor skew angle (β), a key parameter used to assess structural dimensionality [46]. In general, for 1D or 2D electrical structures, the absolute values of skew angles (|β|) remain below approximately 3° [48].
In this study, MT data were analyzed using the MTpy software package [47]. The resulting phase tensor ellipses across multiple periods display large absolute skew angles (|β| > 3°) and non-elliptical or irregular shapes (Figure 4a–e), indicating strong 3D resistivity characteristics within the NEH. Furthermore, phase tensor ellipses plotted along a representative MT profile crossing the NE-trending tectonic structures in the NEH reveal that most MT stations exhibit consistently high |β| values (>3°) at periods greater than 1 s (Figure 4f), suggesting that a complex 3D electrical structures in the NEH. In summary, phase tensor analysis and the apparent resistivity and phase of representative MT stations reveal pronounced 3D electrical characteristics in the NEH and collectively underscore the necessity of applying 3D MT inversion and modeling techniques to accurately resolve the deep electrical architecture.

4.3. Three-Dimensional Inversion

Over recent decades, advances in computational resources and inversion algorithms have enabled the widespread application of 3D inversion to large MT datasets [49,50]. Among various approaches, the Nonlinear Conjugate Gradient (NLCG) algorithm iteratively adjusts model parameters to minimize the discrepancy between observed and simulated responses, enabling accurate recovery of subsurface electrical structure [51]. In this study, full impedance tensor data at 59 MT stations were obtained using 3D inversion of the ModEM package [51,52]. The observed impedance tensor was resampled at six periods per logarithmic decade, yielding a total of 37 log-spaced periods ranging from 0.01 to 10,000 s. To account for data uncertainty, an error floor of 5 % | Z x y Z y x | was applied to off-diagonal impedance components ( Z x y and Z y x ), and 10 % | Z x y Z y x | was used for diagonal components ( Z x x and Z y y ).
In defining inversion meshes, the horizontal grid size was determined based on approximately 1/3–1/5 of the average inter-station spacing, as recommended by previous studies [53,54]. Consequently, the core model region was discretized with a uniform 5 km grid spacing, and 10 padding cells were added on each horizontal boundary to satisfy the requirement of at least 3–5 times the electromagnetic skin depth [55]. Vertically, the model comprised an initial layer thickness of 50 m, which progressively increased by a factor of 1.1 up to the 60th layer. An additional nine layers with a growth factor of 1.5 were appended to extend the model to depths exceeding 3000 km. The final computational mesh consists of 80 × 77 × 69 cells. Given that the NEH study area lies over 600 km inland from the nearest coastline, the effects of seawater were not incorporated into the model domain. Additionally, topographic relief in Eastern SCB is less than 2 km, and models derived from terrain-included inversion are highly similar to those without terrain consideration [56,57]—particularly in the study area, where the topographic relief is less than 1 km, and the impact is even more negligible. Therefore, the impact of terrain is not considered in this study.
In 3D MT inversion, the initial resistivity and covariance factor (Cov) significantly influenced the final resistivity models [58]. In previous 3D MT inversion practices in the SCB, uniform half-space models with varying resistivities (50, 100, 200, and 500 Ω·m) as initial conditions [56,59]. These studies revealed that, although the resulting models displayed similar overall resistivity structures, the model initialized with a 100 Ω·m half-space yielded the lowest normalized root-mean-square (nRMS) misfit [56]. Covariance factor (Cov) balances model complexity and geological plausibility by controlling inversion smoothness; higher Cov yields smoother resistivity distributions, while lower values risk overly complex or geologically implausible results [58]. Based on previous inversion practices in the SCB, a covariance value of 0.3 has been found effective in capturing key geoelectrical features while suppressing artificial anomalies such as abrupt resistivity contrasts or excessive smoothing [56,60]. Accordingly, we adopted a uniform half-space with a resistivity of 100 Ω·m as the initial model and set both horizontal and vertical covariance factors to 0.3.
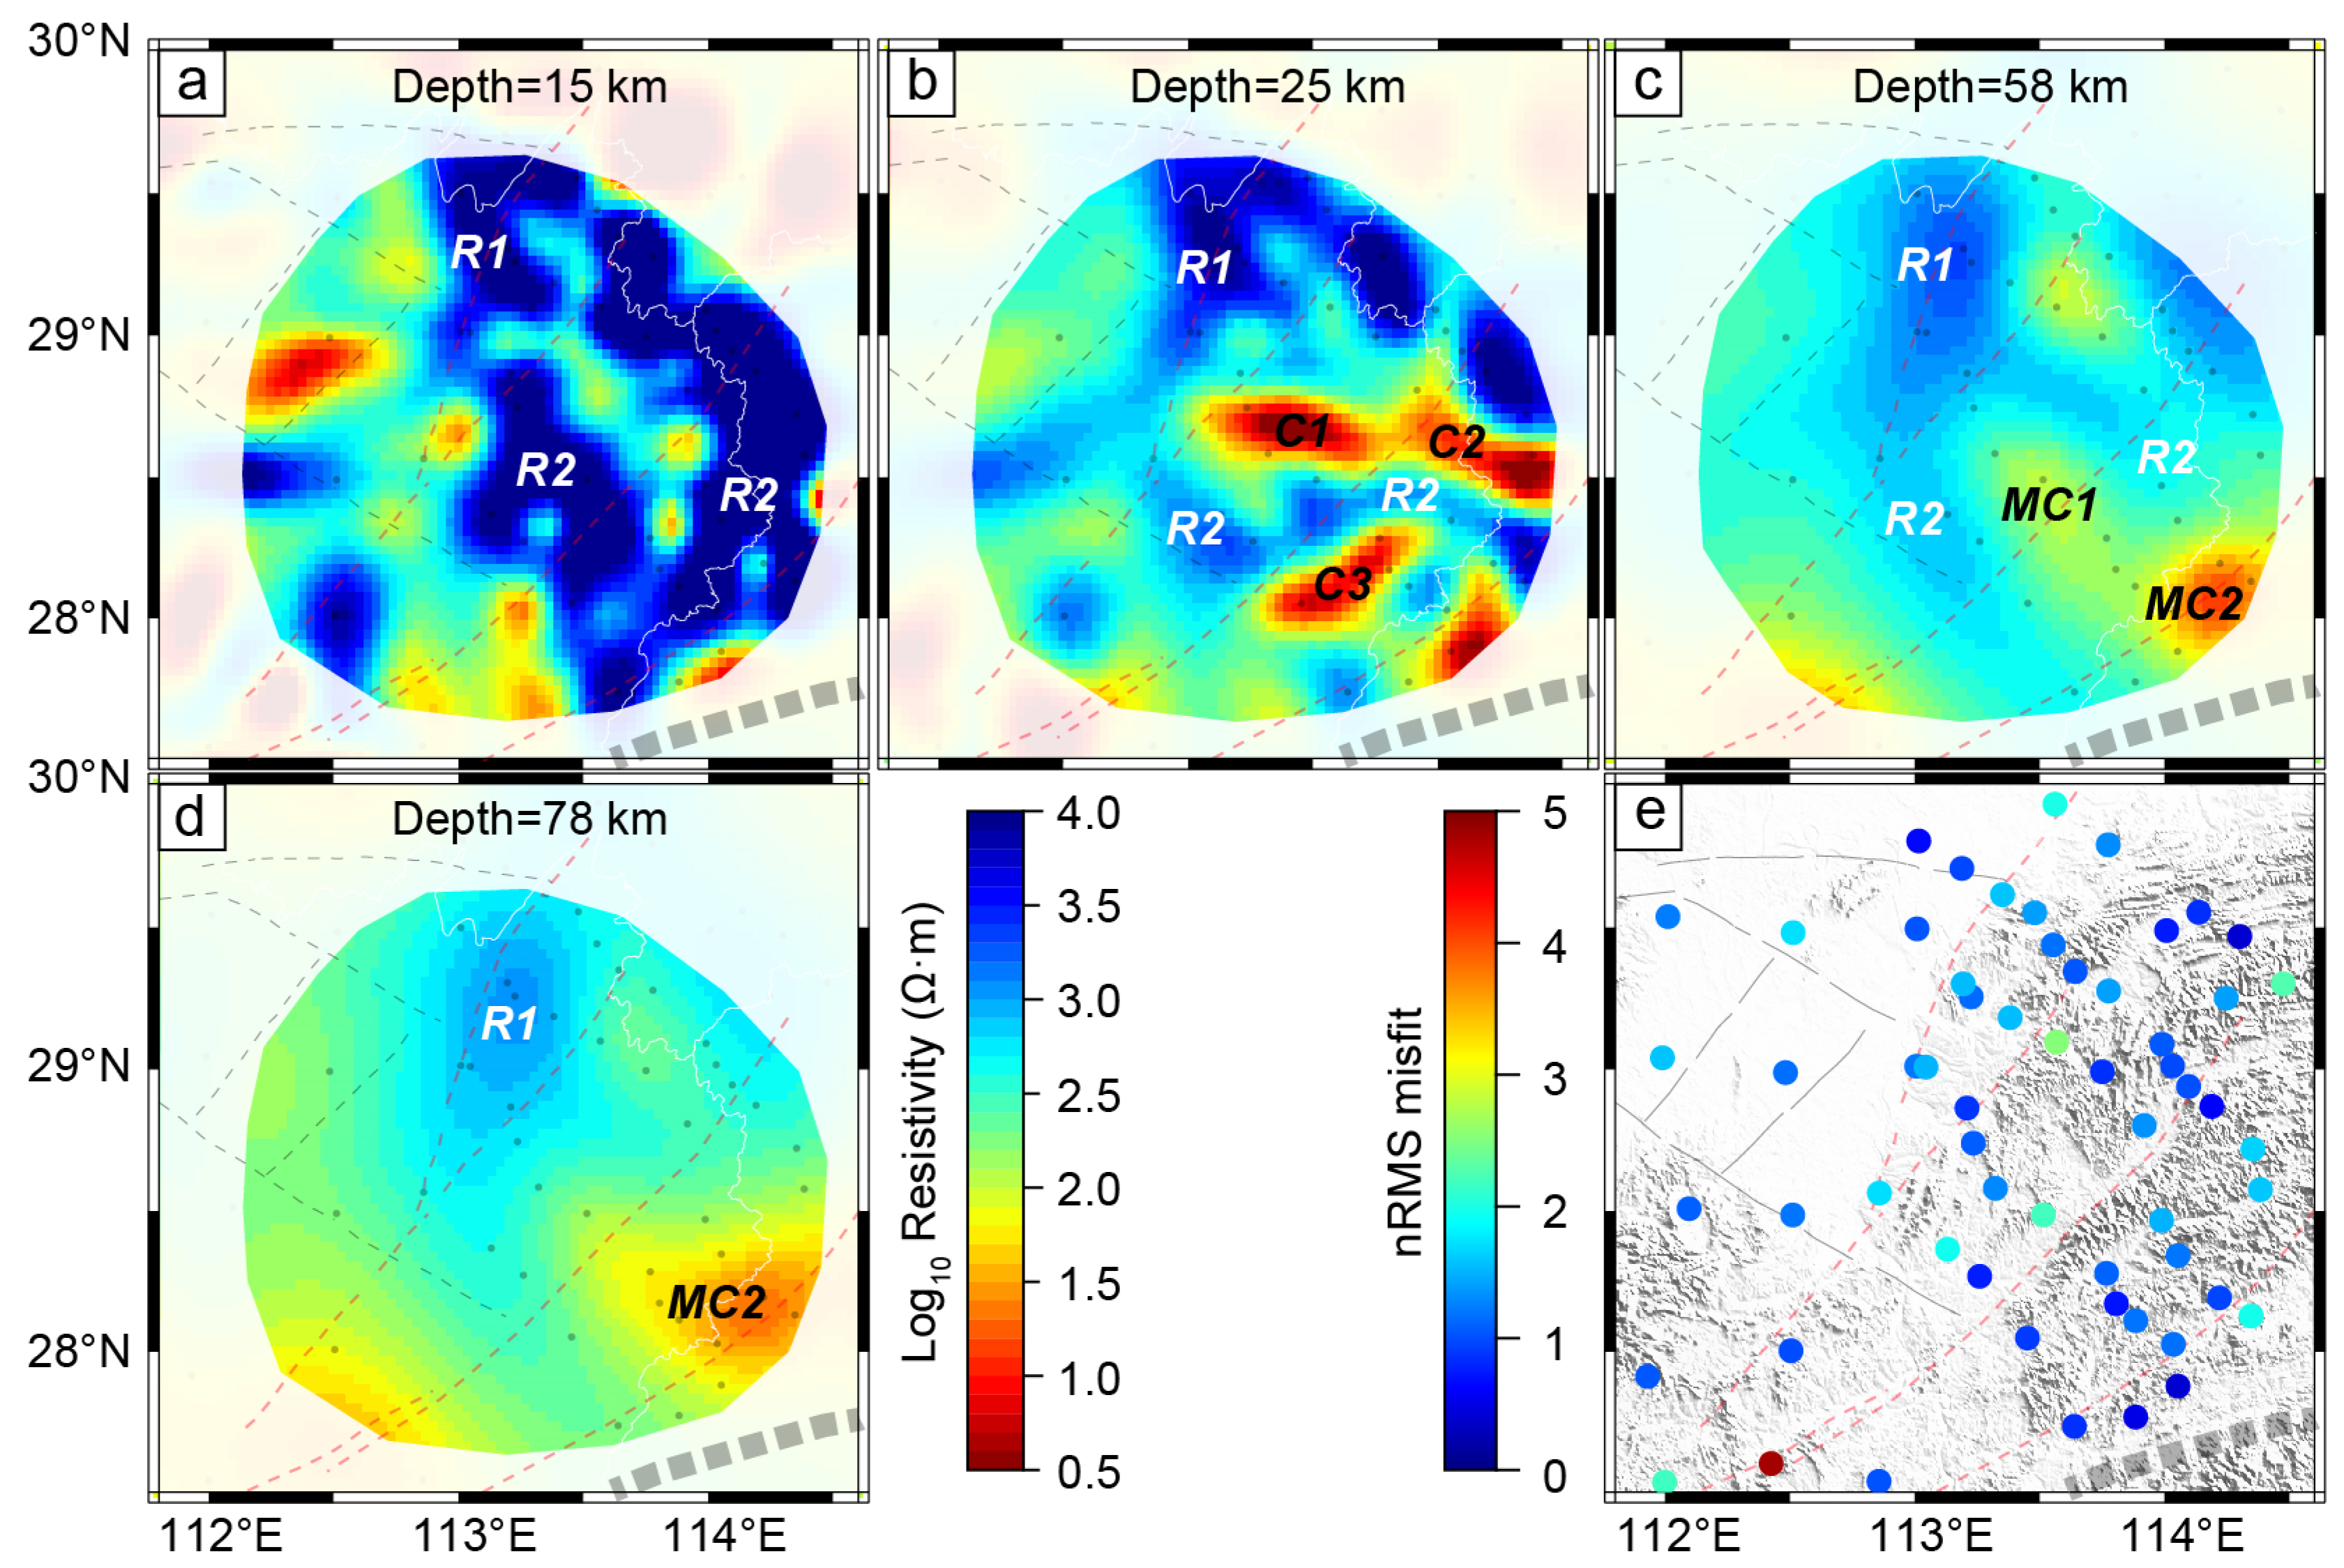
As the damping parameter lambda (λ) with an initial value of 100 decreases during 3D inversion, the model progressively improves data fitting by incorporating smaller-scale structures and larger conductivity contrasts [58]. Once the reduction in RMS per iteration falls below a predefined threshold (default 1.0−3), λ is reduced by a factor of 10, and then this procedure is repeated iteratively until either λ reaches the exit threshold of 1.0 × 10⁻⁸. After 189 inversion iterations, the final nRMS misfit was reduced to 1.50 (Figure 5e). The majority of MT stations exhibited nRMS values below 2.0 (blue to green), indicating that the inversion model provides a robust fit to the observed data.

4.4. Resistivity Model

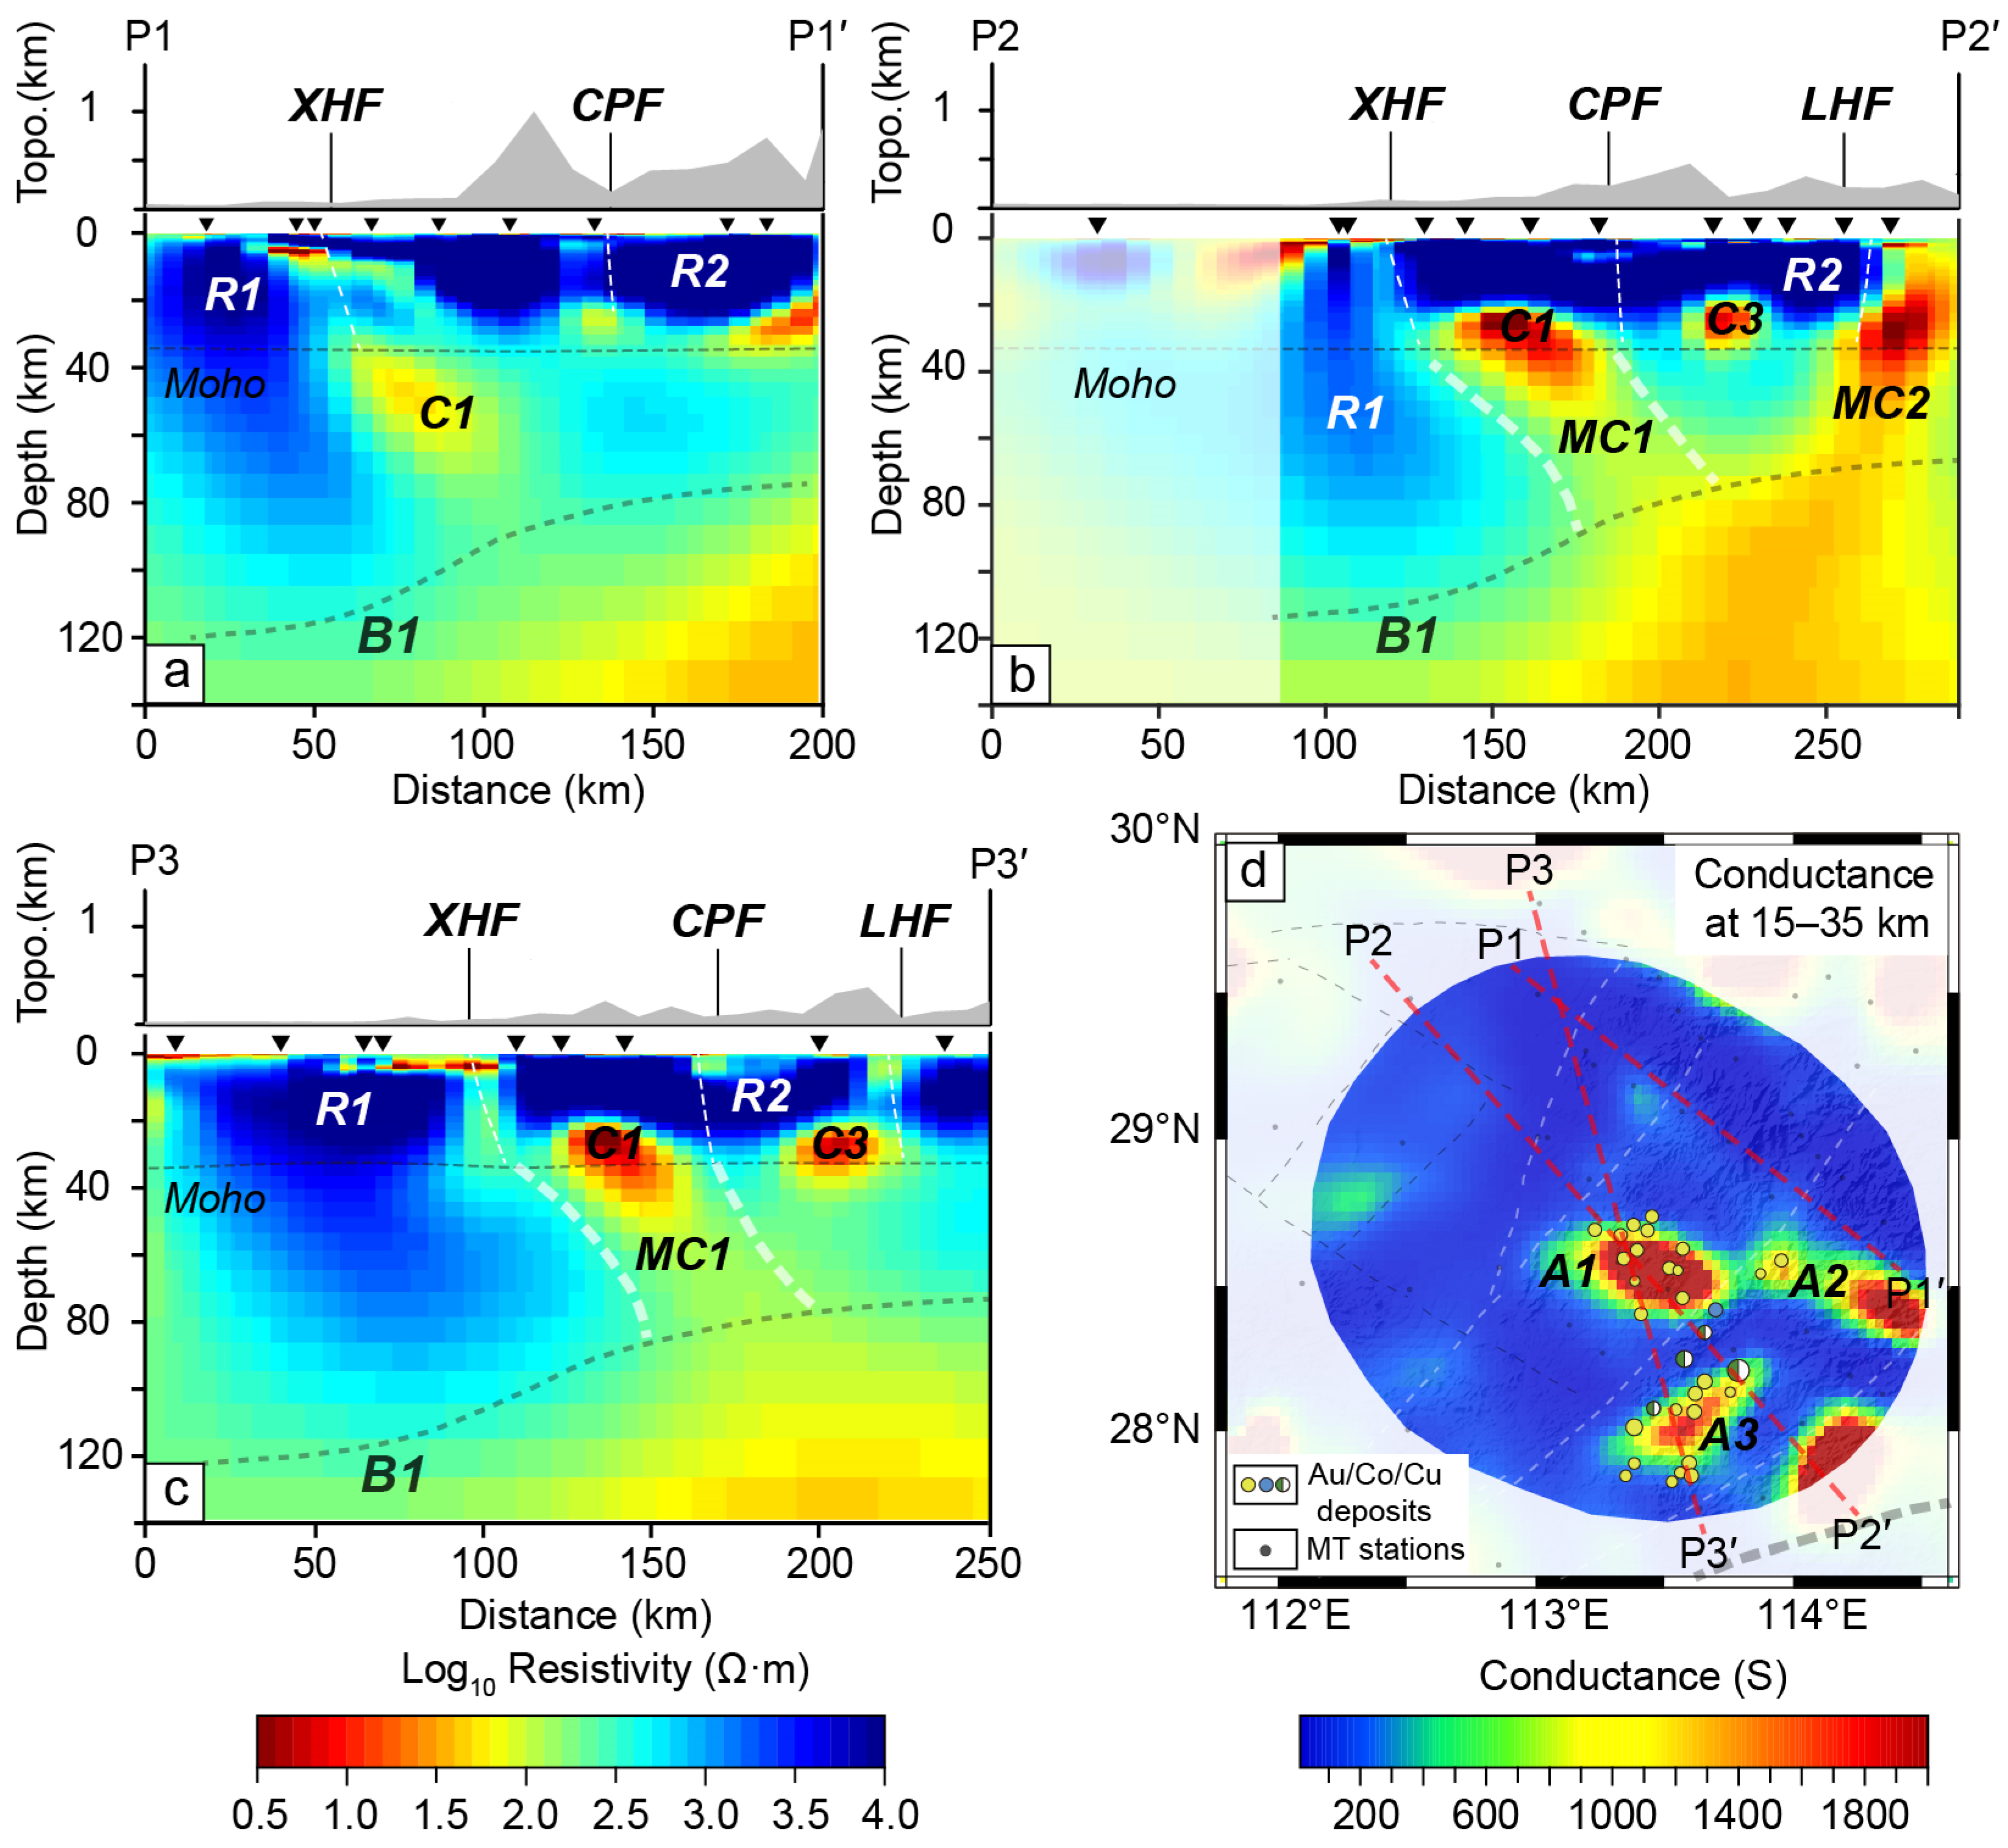
Through the aforementioned 3D inversion, a preferred 3D resistivity model was constructed for the NEH. Owing to the limited spatial coverage of MT data and the weak correlation between peripheral structures and Au-polymetallic mineralization, features at the NEH margins (white shaded areas) are not further discussed (Figure 5 and Figure 6). Overall, the resistivity model reveals pronounced lateral and vertical heterogeneity, characterized by two high-resistivity bodies (R1 and R2) and three prominent crustal conductors (C1–C3) (Figure 5 and Figure 6).
The resistive body R1 with resistivity exceeding 1000 Ω·m occurs mainly in the Southwestern NEH, extending from near the surface to the upper mantle. In contrast, the resistive body R2 (>1000 Ω·m) is restricted to the upper and middle crust within the core of the NEH. At a depth of 15 km, the NEH is dominated by high resistivity (Figure 5a), though weak conductivity anomalies are observed along NE faults, including XHF, CPF, and LHF. At a depth of 25 km, approximately corresponding to the lower crust, the lateral extent of R2 is destroyed, while three well-defined conductors (C1, C2, and C3) are identified within the interior of NEH (Figure 5b), reflecting significant crustal modification by tectono-magmatism. The conductor C1 lies beneath the XHF and CPF and extends from the middle crust into the uppermost mantle (Figure 5b and Figure 6b,c). Conductors C2 and C3, situated between the CPF and LHF, are largely confined to the lower crust (Figure 5b). At greater depths within the upper mantle, R2 becomes less resistive and laterally discontinuous, likely representing residual lithospheric mantle (Figure 5c,d). In addition, two upper mantle conductors (MC1 and MC2) are imaged beneath the NEH, representing the electrical signature of lithospheric weak zones (Figure 5c and Figure 6b). The conductor MC1, with the resistivity ranging from 30 to 100 Ω·m, is located between XHF and CPF, showing a weak connection with the conductor C1. The conductor MC2, with the resistivity ranging from 10 to 30 Ω·m, is close to JSF, extending from near-surface to upper mantle, and reflects the electrical properties of a lithospheric suture zone (Figure 6b).

4.5. Sensitivity Tests

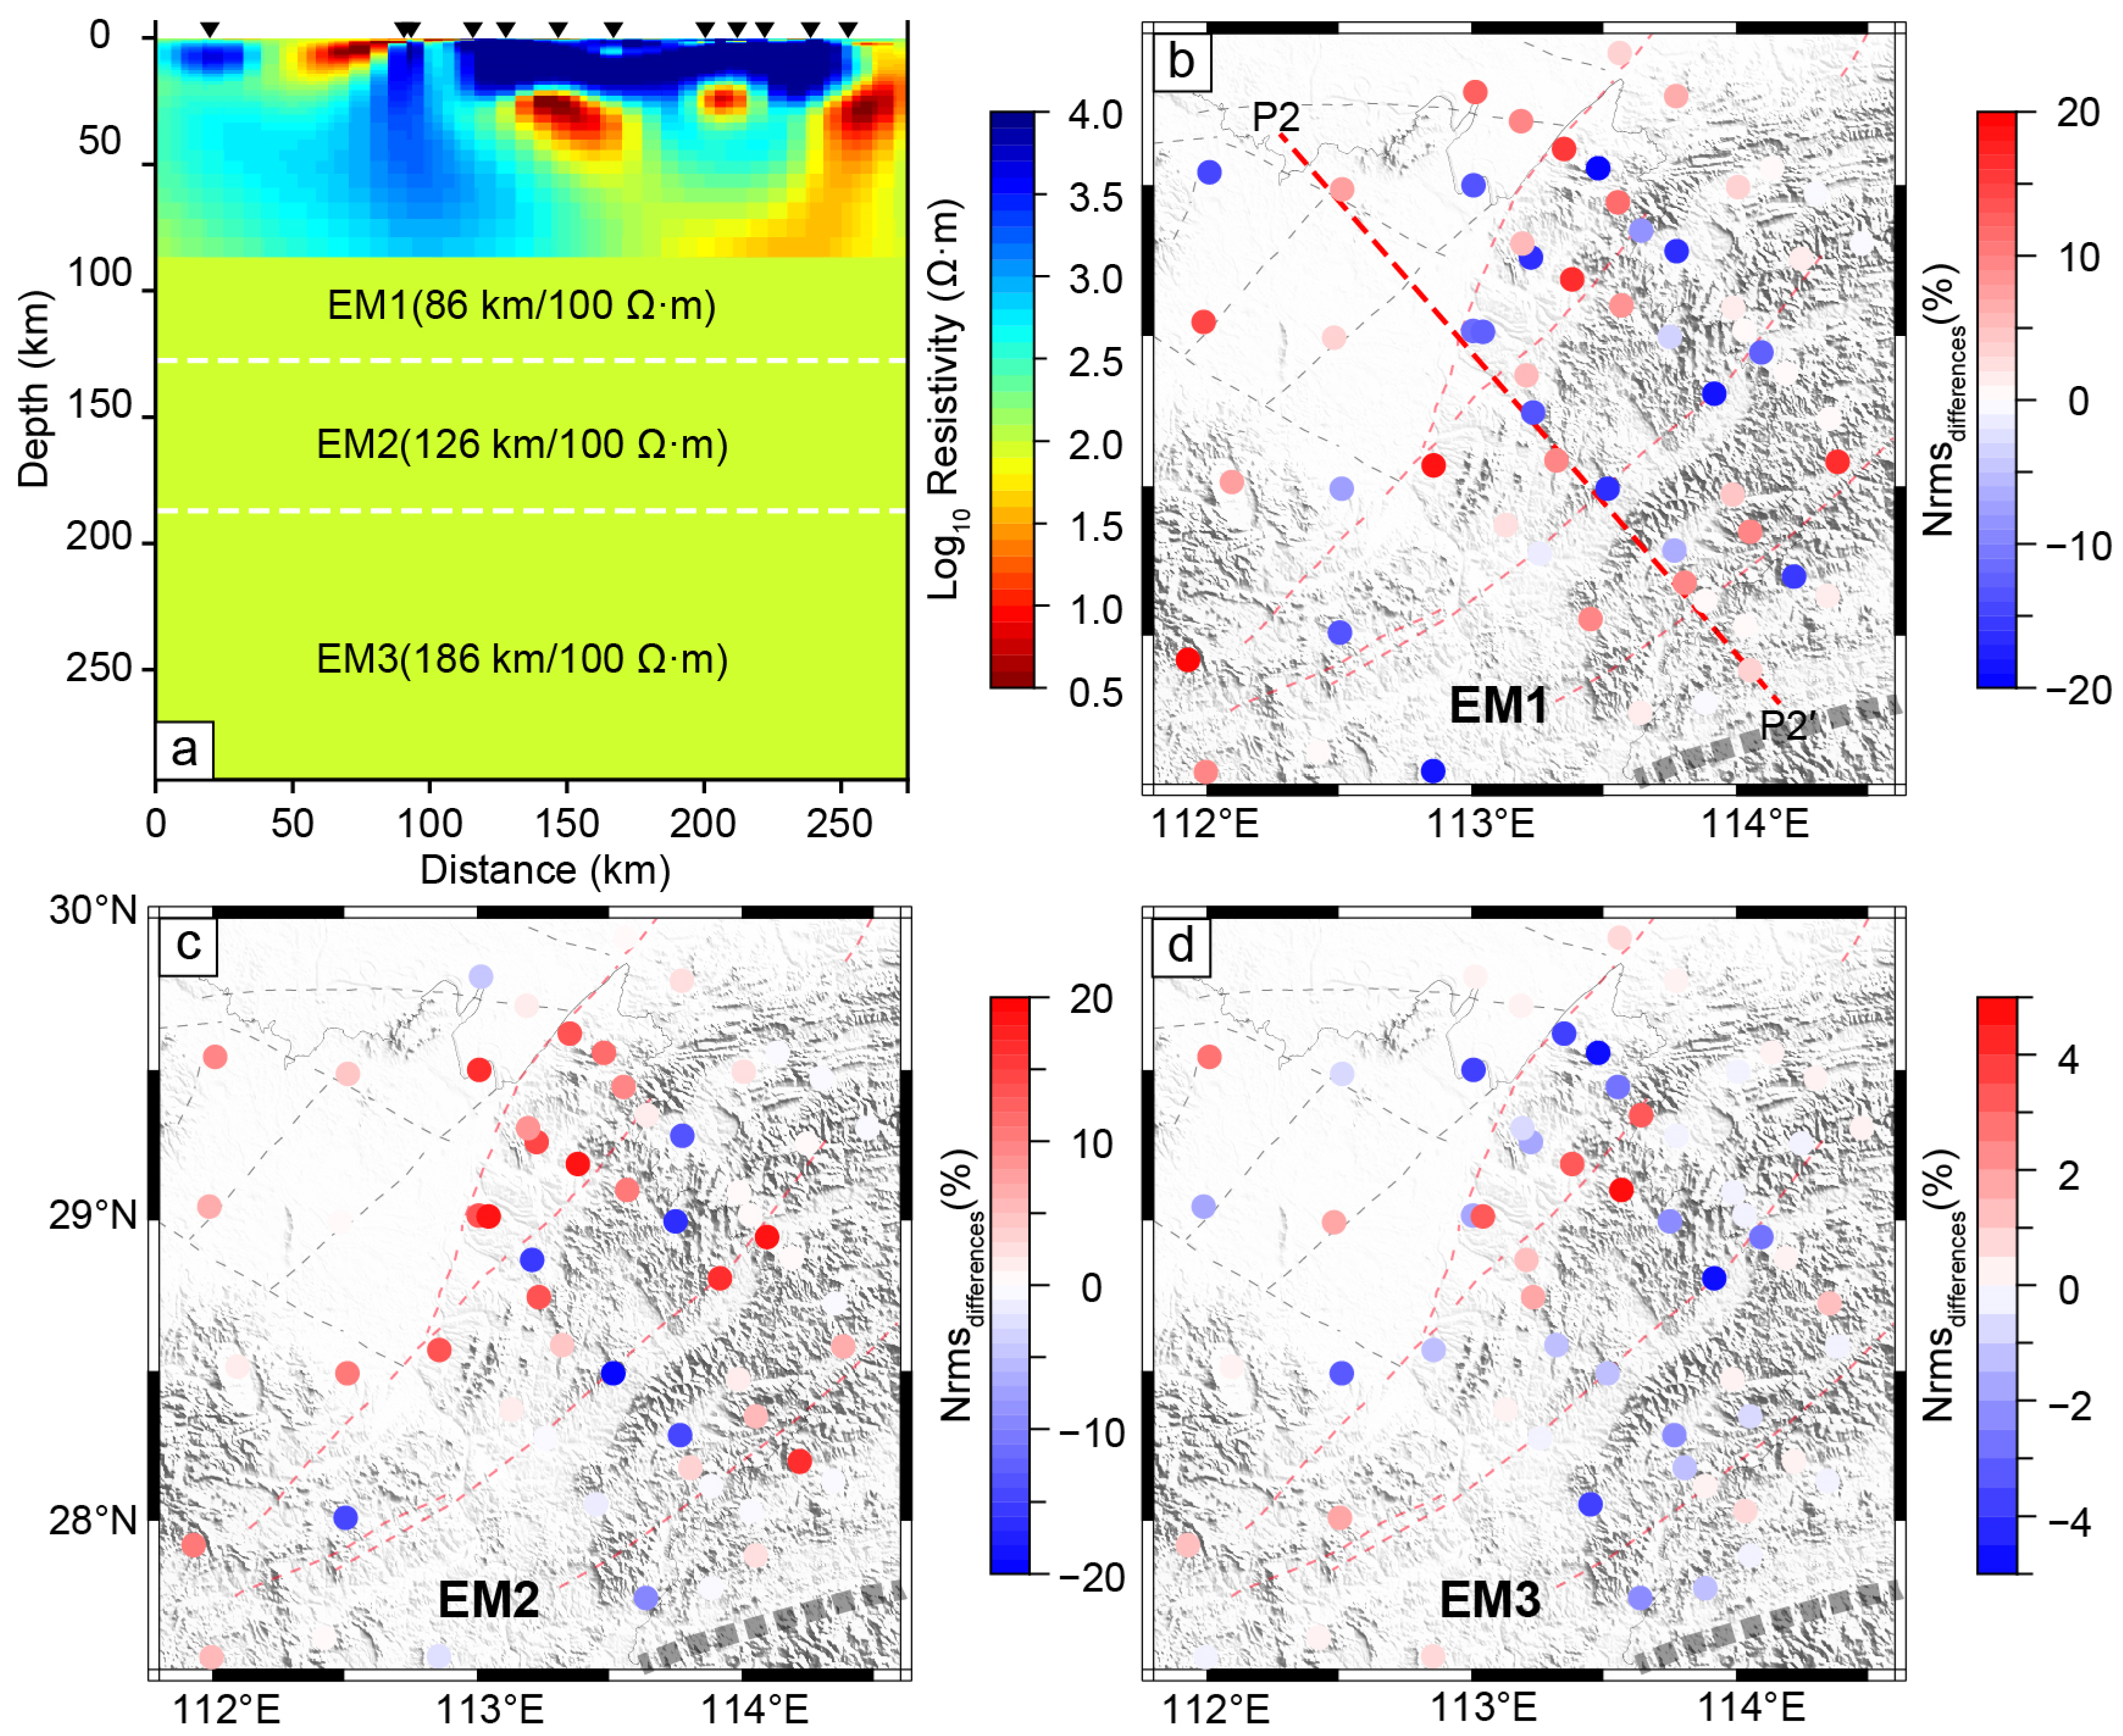
Given the inherent non-uniqueness of MT inversion [61], a series of sensitivity tests was conducted to assess the robustness and depth resolution of the inferred electrical structures [56,60]. The sensitivity tests were divided into two groups, and the first set of tests aimed to verify the reliability of the final inversion model at different depths. For this purpose, the final model below depths of 86 km, 126 km, and 186 km were replaced with a mantle resistivity of 100 Ω·m, generating modified models EM1, EM2, and EM3 (Figure 7a). Forward modeling was then performed to calculate the overall nRMS misfit, site-specific n R M S d i f f e r e n c e , and changes in apparent resistivity and phase curves. For the three edited models EM1, EM2, and EM3, the updated nRMS misfits for EM1, EM2, and EM3 were 1.75, 1.69, and 1.53, respectively. In edited models EM1 and EM2, most MT stations exhibited an n R M S d i f f e r e n c e greater than 20% (Figure 7b,c), indicating that the MT dataset effectively constrains the electrical structures at these two depths. In contrast, for the edited model EM3, the n R M S d i f f e r e n c e at individual sites exceeded 5% (Figure 7d), suggesting only limited constraint on electrical structures at depths beyond 186 km. Additionally, compared to the preferred resistivity model, EM1 and EM2 showed notable changes in apparent resistivity and phase curves (Supplementary materials, Figure S2).
The second set of tests aimed to verify the reliability of the lithospheric conductors MC1 and MC2 in the final inversion model. Conductor MC1 was replaced with a block of average mantle resistivity of 1000 Ω·m (Supplementary Material, Figure S3). The modified model produced a higher nRMS misfit (1.71) than the original model (1.50), with increased nRMS misfit at MT sites above the conductor MC1 and significant changes in both apparent resistivity and phase curves (Supplementary Material, Figure S3). A similar test was performed to evaluate the robustness of conductor MC2, in which it was replaced in the original model with a resistive block of 1000 Ω·m. The revised model also produced a higher nRMS misfit (1.55) than the original model (1.50), along with notable changes in apparent resistivity and phase curves (Supplementary Material, Figure S3). Based on these tests, the conductive anomalies (MC1–MC2) are essential to the final model, indicating that these conductive features are reliable and necessary to fit the MT data. Overall, sensitivity tests confirm that the observed MT responses are sensitive to the electrical structure down to ~126 km depth beneath the NEH. Based on this constraint, all subsequent interpretation and discussion focus on anomalies within this depth range.

5. Discussion

5.1. Crustal Electrical Structure and Geophysical Interpretation
Overall, the resistivity structure in NEH is characterized by lateral block segmentation and vertical stratification. Vertically, the crustal resistivity shows clear stratification, a resistive upper to middle crust overlies a lower crust with alternating resistive and conductive domains (Figure 6). In the upper to middle crust, lateral resistivity variations (Figure 5a) broadly correspond to the distribution of stratigraphic sequences, intrusions, and fault basins, further segmented by steeply dipping conductive zones. Widespread high resistivity (R1 and R2, >1000 Ω·m) is consistent with resistive granitic intrusions—particularly the Yanshanian plutons—as well as subordinate Neoproterozoic, Caledonian, and Indosinian magmatic rocks [8]. The region also hosts extensive Precambrian lithologies, including the Neoproterozoic Banxi Group, Mesoproterozoic Lengjiaxi Group, and the Paleoproterozoic to Neoarchean Lianyunshan Group, which either lack conductive phases or contain them in insufficiently connected networks [62]. Accordingly, these observed resistive bodies, R1 and R2, are interpreted as dense crystalline rock units, likely representing the superimposed imprints of multiphase granitic intrusions and the Precambrian basement rocks. In contrast, three prominent conductors (C1, C2, and C3) are identified in the lower crust along the CPF, likely reflecting zones of intense deformation and/or fluid enrichment.
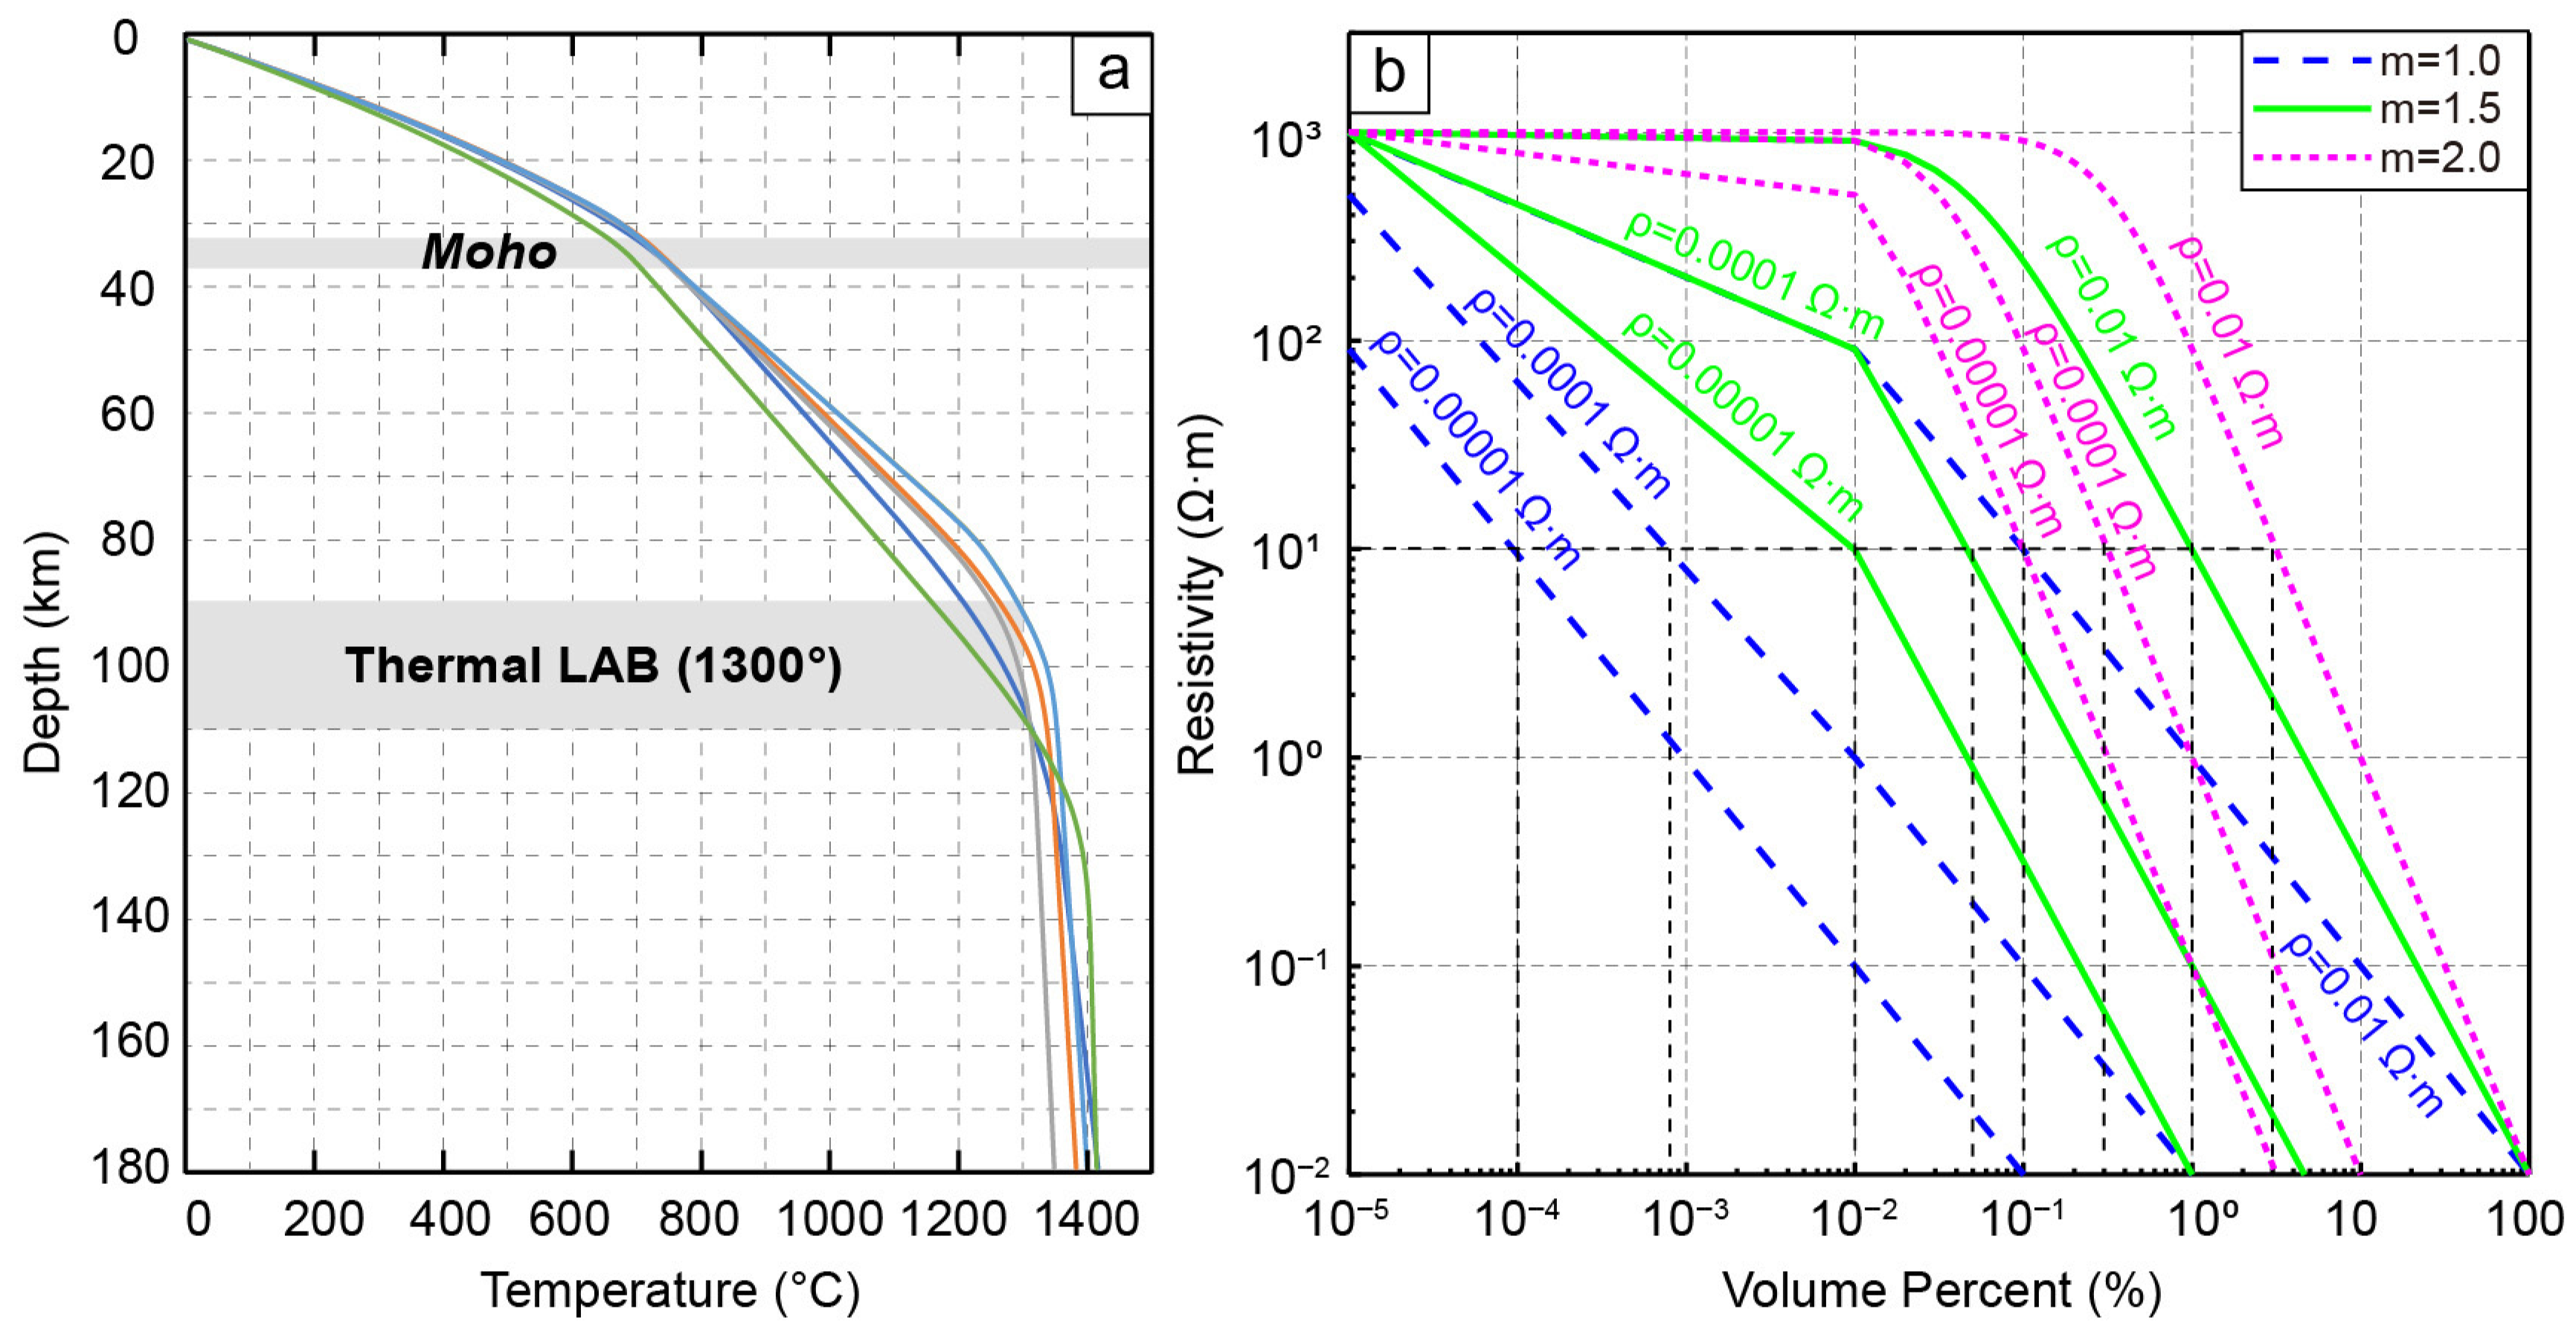
The lower crust conductive anomalies are generally attributed to saline fluids, partial melting, and accumulations of graphite or sulfide minerals [62], and thus its interpretation must be guided by regional geology and integrate structural, petrological, and geochemical evidence. The occurrence and long-term preservation of free saline fluids in the lithosphere are mainly controlled by the distribution of porosity and the intensity of active tectonics [62]. Such fluids are typically hosted within high-porosity strata in sedimentary basins, brittle fracture zones in the upper crust, and domains undergoing metamorphic dehydration reactions [62]. In contrast, elevated pressures in the lower crust significantly reduce porosity, and fluids are readily incorporated into mineral structures via retrograde metamorphic reactions, thereby inhibiting the formation of interconnected fluid networks in stable cratonic settings [63]. Specifically, multi-evidence rules out a melts-dominated mechanism in the NEH. Firstly, the low terrestrial heat flow (60 mW/m2) [64] and the lower crustal temperatures estimated from multi-observable thermal inversion below 700 °C (Figure 8a) [65] are both well below the solidus of dry felsic rocks (>1000 °C) [66], which precludes partial melting. Second, petrological data reveal no significant Cenozoic magmatism nor mineralogical signatures indicative of ongoing metamorphic devolatilization [11]. Seismic imaging data further support a predominantly solid-state regime in the lower crust. The presence of high seismic velocities and low attenuation coefficients [18,67] effectively rules out the presence of partial melting or fluids, instead suggesting solid conduction mechanisms.
Notably, the distribution of conductors C1–C3 closely coincides with the occurrence of near-surface gold deposits in the NEH. In global giant gold provinces, the lower crustal conductive anomalies are widely interpreted as graphite–sulfide enrichment associated with tectono-magmatism and mineralization—e.g., [27,59,68,69]. The extreme resistivity of pure graphite (0.00001 Ω·m) [70], magnetite (0.0001 Ω·m) [71], and sulfides (0.01 Ω·m) [69] implies that even trace amounts of these phases can significantly reduce bulk resistivity. Therefore, the conductive anomalies in the NEH lower crust can plausibly be attributed to limited graphite and sulfides.
Regarding their genesis and preservation, the lower crustal graphite may originate from the metamorphism of organic matter under amphibolite-facies conditions (~550 °C, ~20–30 km depth), from mantle-derived CO2-rich/carbonatitic fluids under reducing conditions, or by precipitation from magmatic CO2-rich fluids along grain boundaries in reduced host rocks [72]. During the Proterozoic, the closure of the ancient South China Sea promoted the accumulation of organic-rich marine sediments in the Jiangnan orogen [1], which were subsequently transformed into graphite by regional metamorphism during the Paleozoic intracontinental orogeny and the Indosinian orogeny [1,3]. Additionally, the low FeOT/(FeOT + MgO) ratios in the NEH point to reduced conditions [16,73], which are favorable for graphite formation, as evidenced by CO2- and CH4-rich fluid inclusions in mineralized veins from auriferous lodes such as Wangu, Huangjindong, and Liling [16,34,74]. In contrast, conductive anomalies associated with sulfides are typically limited due to low modal abundances and generally require independent geological verification [62,69]. Nonetheless, the features of high conductivity and magnetic susceptibility for reported sulfides (e.g., chalcopyrite and magnetite) [75] in the Huangjindong, Dawan, and Jingchong gold deposits [8] provide indirect evidence for their role in enhancing bulk conductivity. Moreover, the reduced nature of the Precambrian basement served as a redox trap, which promoted sulfide precipitation (e.g., pyrite, arsenopyrite) by interacting with Fe-rich reducing fluids [76].
Figure 8. Interpretation of the origin of crustal conductive anomalies in the study area. (a) Temperature structure of the study area, along with representative temperature ranges for the Moho and the lithosphere-asthenosphere boundary (LAB), based on data from Yang et al. [65]. (b) Modeled bulk resistivity of rocks as a function of the volumetric proportion of conductive mineral phases, calculated using the modified two-phase Archie’s law [77]. The cementation exponents m = 1.0, 1.5, and 2.0 represent scenarios of fully interconnected, moderately connected, and poorly connected conductive networks, respectively [77]. The average resistivity of solid rocks in the mid- to lower crust (15–35 km) is approximately 1000 Ω·m, whereas the average resistivity of the identified conductors (C1–C3) is approximately 10 Ω·m. Endmember resistivity values for pure graphite, magnetite, and sulfide are 0.00001 Ω·m [70], 0.0001 Ω·m [71], and 0.01 Ω·m [69], respectively.
Minerals 15 01244 g008
In summary, the lower crustal conductors (C1–C3) in the NEH are likely attributed to sulfides and magnetite formed during multi-stage geological evolution, and the modified Archie’s law [77] was applied to quantify the content of conductive minerals. Our models indicate that the average resistivity of surrounding rock within the mid-to-lower crust (15–35 km depth) is ~1000 Ω·m, while the conductive anomalies exhibit an average resistivity of roughly 10 Ω·m. These anomalies can be explained by a volumetric fraction of approximately 0.0001% graphite, 0.001% magnetite, or 0.1% sulfides in a fully interconnected system (Figure 8b). The required fractions increase to ~0.01% graphite, 0.05% magnetite, or 1% sulfide under moderate connectivity, and to 0.1% graphite, 0.3% magnetite, or 3% sulfide in a poorly interconnected system (Figure 8b). These constraints provide a quantitative framework for assessing the contribution of solid conductive phases to lower crustal conductors.

5.2. Upper Mantle Electrical Structure

The lithosphere-asthenosphere boundary (LAB), acting as the mechanically rigid lid of mantle convection, is conventionally defined either by the 1300 °C adiabatic isotherm or by the bottom of the resistive upper mantle [78]. In contrast, the underlying asthenosphere, characterized by elevated temperatures (>1300 °C), exhibits significantly enhanced conductivity, largely attributed to the presence of volatiles (e.g., H2O and CO2) and small fractions of melt [59,78]. Consequently, the transition from high-resistivity lithosphere to conductive asthenosphere, marked by a sharp resistivity drop in the upper mantle, is interpreted as the electrical lithosphere–asthenosphere boundary (eLAB) [59,78]. As shown in Figure 5 and Figure 6, resistive body R1 (1000–10,000 Ω·m) and R2 (100–10,000 Ω·m) extend from near the surface to depths of >100 km and ~80 km, respectively, and exhibit typical lithospheric resistivity characteristics. The modeled resistivity interface B1 separates R1 and R2 from the underlying conductive region and occurs at ~80–110 km depth (gray dashed lines in Figure 6a–c). This depth range agrees with constraints from teleseismic attenuation, thermodynamic estimates, and MT imaging [59,65,79], supporting its interpretation as the eLAB. Therefore, relative to the thick lithosphere (>100 km) beneath R1 in the Northwest, the lithosphere beneath the Southeastern NEH is thinned by at least ~30 km, and possibly more.
Additionally, two upper mantle conductors (MC1 and MC2) occur beneath the Southeastern NEH (Figure 5c and Figure 6b). Several mechanisms have been proposed to explain upper mantle conductive anomalies, including water in nominally anhydrous minerals (NAMs), partial melting, graphite films along grain boundaries, sulfide phases, and hydrous minerals (e.g., amphibole and phlogopite) [62,80]. However, the thermal regime of the upper mantle in this region (>730 °C; Figure 8a) precludes the stability of graphite films [65,70]. Similarly, sulfides are unlikely to be a major contributor due to their limited volumetric abundance and the high oxygen fugacity (above the fayalite–magnetite–quartz buffer; FMQ) typical of lithospheric mantle [81]. Partial melting is also improbable within the lithospheric mantle, as experimental studies indicate that the solidus of peridotite with 200 ppm H2O at 3 GPa (~100 km depth) exceeds 1400 °C [82], which is higher than the regional geotherm (≤1300 °C; Figure 8a).
For the Tecton-type mantle with a bulk water content of ~150 ppm at ~100 km depth, the modeled bulk resistivity exceeds 100 Ω·m [62]. However, mantle xenoliths from the SCB indicate an even lower average water content of 0~100 ppm [83], suggesting that water in nominally anhydrous minerals (NAMs) alone cannot fully explain the observed lithospheric resistivities below 100 Ω·m. Instead, it is more plausible that multiple mechanisms contribute to enhanced lithospheric conductivity, including water in NAMs and hydrated minerals such as phlogopite and amphibole [59,84]. Amphibole remains stable only within a restricted temperature range (~950–1150 °C) at pressures up to 3 GPa [85], implying that it is likely confined to the uppermost mantle, as deeper regions exceed its thermal stability. In contrast, phlogopite—a widely recognized product of lithospheric metasomatism, is stable up to ~1300 °C and frequently invoked to account for low-resistivity anomalies in the lithospheric mantle [59,84,86,87]. Geochemical evidence from Jurassic mafic dikes and Late Cretaceous lamprophyres in the NEH further points to a metasomatized mantle [30], in which residual amphibole and biotite could contribute to lithospheric conductors. Consequently, lithospheric conductors beneath the NEH are likely attributable to a combination of water in NAMs, amphibole, and phlogopite, consistent with several MT studies across the SCB [59,88]. Additionally, conducted in the Youjiang Basin simulated the influence of phlogopite on the electrical resistivity of the lithospheric mantle based on the lithospheric mantle composition of SCB. The results indicate that the lithospheric conductor with resistivity ranging from 10 to 20 Ω·m could be explained by water in NAMs (150–200 ppm) and 20%–28% phlogopite (Supplementary materials, Figure S4) [88]. Given that the Youjiang Basin and the NEH may share similar tectonic settings and lithospheric mantle compositions [65], the conductor MC2 with resistivity ranging from 20 to 30 Ω·m is attributed to water in NAMs and <20% phlogopite. Similarly, the conductor MC1 (30–100 Ω·m) results from water in NAMs and an even lower phlogopite concentration.

5.3. Lower Crustal Rheology and Metallogenic Control Framework

It is widely acknowledged that crustal structures fundamentally control the migration and evolution of metallogenic fluids and magmas, thereby governing the spatial distribution of mineralization [9,23]. In magmatic-hydrothermal systems, the introduction of lithospheric melts and fluids induces metasomatic reactions and partial melting, which may reduce the resistivity of fluid migration pathways [26]. Crucially, MT data are more sensitive to bulk conductance (the conductivity-thickness integral) than to the resistivity of individual layers, making it particularly useful for quantifying the remnants of paleo-fluid/melt percolation and related metasomatic alteration [89,90].
As shown in Figure 6d, three prominent conductive zones (C1–C3) with the mid-to lower crustal (15–35 km) conductance exceeding 1000 S (labeled A1 to A3) are identified beneath the Au-polymetallic deposits in the NEH, which may be the electrical signatures of fossil magma chambers. This interpretation is consistent with the genesis of the widespread Yanshanian S-type granites with adakitic affinities in the region, which were formed by partial melting of thickened lower crust due to basaltic underplating [8,11,91]. Furthermore, the isotopic evidence (e.g., H-O, S-Pb, and He-Ar) from gold deposits in the NEH further supports a magmatic-hydrothermal origin for metallogenic fluids [13,14,17]. Consequently, the high-conductance zones A1–A3 are likely indicative of the deep crustal fluid sources responsible for Au-polymetallic mineralization.
Recent studies have demonstrated that combining resistivity with rock physics enables the estimation of lithospheric viscosity [90,92], and we further apply the empirical relation of Liu et al. [93] to derive mid-lower crustal (15–35 km) effective viscosity from bulk conductance (For specific details, please see the Supplementary Materials). Figure 9 presents the distributions of effective viscosity with varying C 1 (0.5–8.0) with fixed C 0 = 2.0, and all cases show three low viscosities ranging from 1018–1020 Pa·s. With a preferred C 1 value of 1.5, the modeled viscosities beneath the NEH Au-polymetallic deposits range from ~5.51 × 10¹⁸–4.46 × 10²¹ Pa·s, consistent with the assumptions of previous geodynamic models [94]. As shown in Figure 9c, three low-viscosity zones (V1-V3) closely coincide with high-conductance zones (A1–A3, Figure 6d) and spatially correspond to Au-polymetallic deposits in the NEH. These low-viscosity domains are interpreted as crustal weak zones that facilitated the ascent and emplacement of metallogenic and magmatic fluids. Moreover, the widespread low-viscosity regions in the mid–to–lower crust may also have decoupled the upper crust from the mid-to-lower crust, enabling localized deformation in the overlying rigid strata.

5.4. Structural Evolution and Metallogenic Dynamics

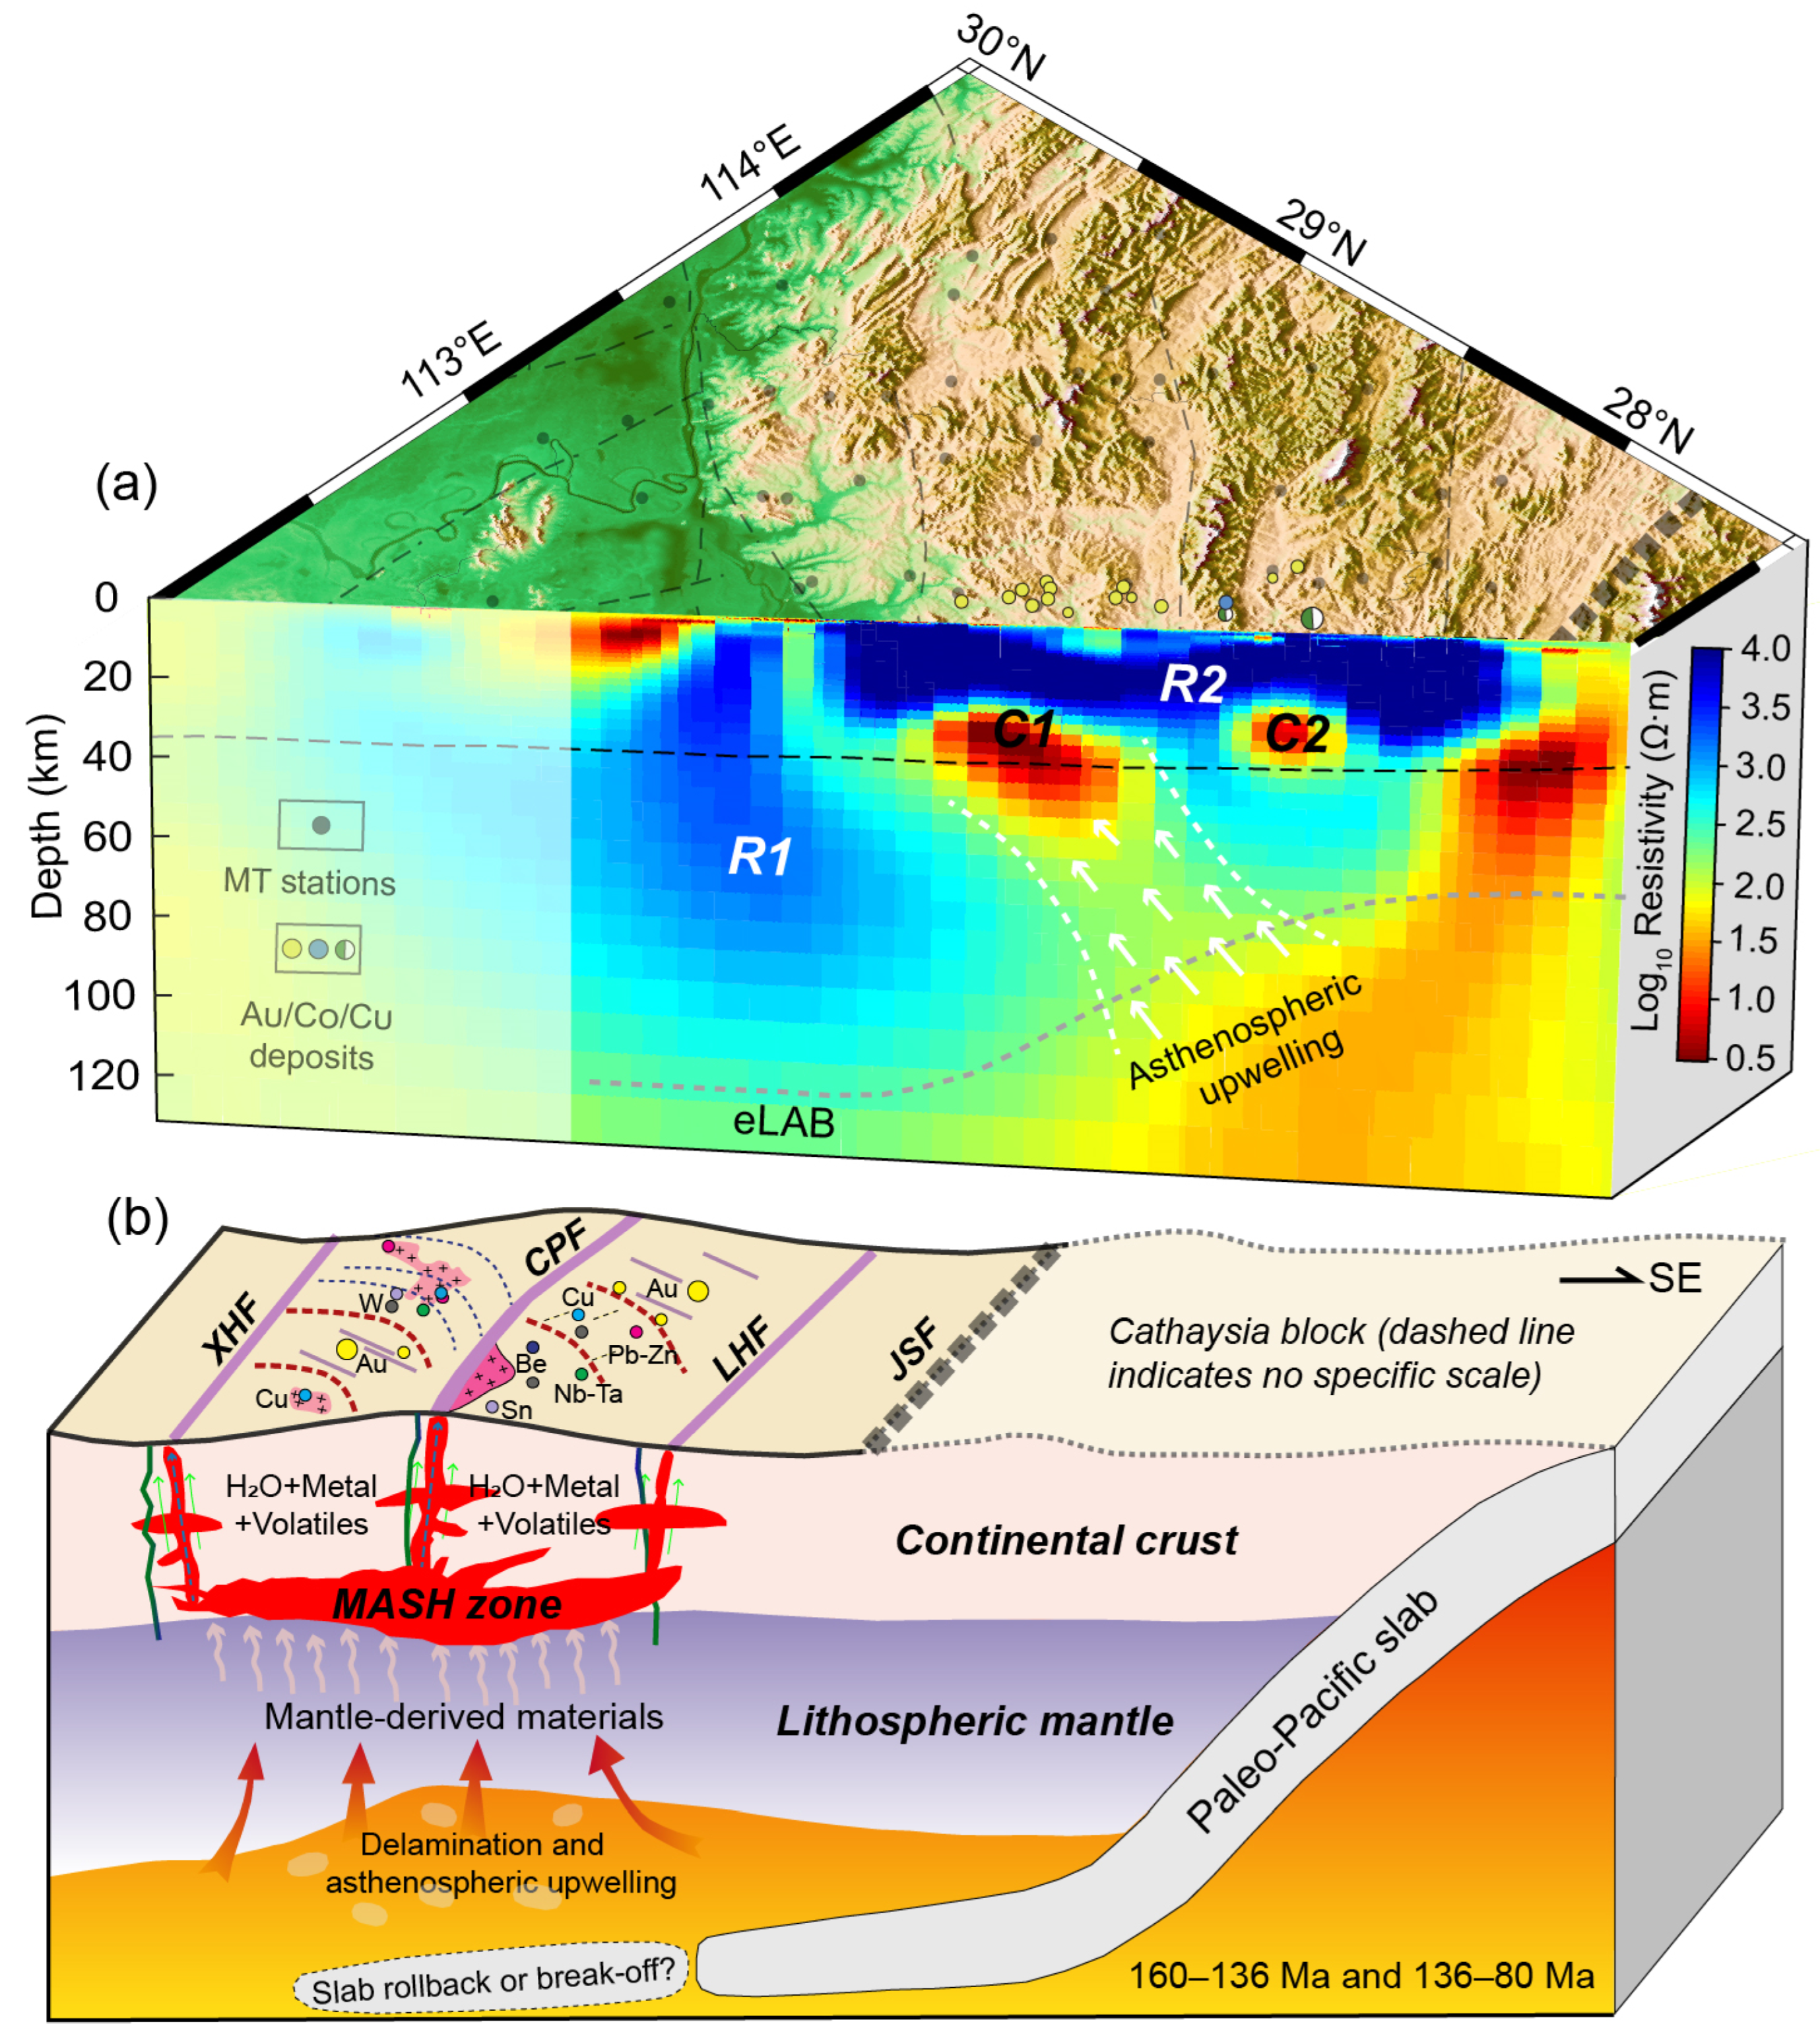
The ubiquitous occurrence of mafic to ultramafic intrusions, particularly lamprophyre dikes, within lithospheric weak zones associated with giant gold deposits provides a genetic link between gold mineralization and deep asthenospheric upwelling [9,23]. The emplacement of Jurassic lamprophyre (136.61 Ma) and Late Cretaceous diabase (86.18 Ma) dikes in the NEH provides evidence of asthenospheric mantle upwelling and subsequent partial melting of lithospheric mantle [30]. According to the SiO2 content of the Cretaceous basalts (e.g., Xilou in the Liuyang, Chunhuashan in the Changsha, Guanshijie in the Hengyang), the average magma source depths are approximately ~52 km [95], coinciding with the bottom of the conductor C1. This spatial correspondence further supports the interpretation that mantle-derived melts ascended along deep-seated lithospheric fault zones and underwent interaction and assimilation with crustal wall rocks. Conductor C1 not only serves as an intrusion channel for mantle magmas, but its weak connection with conductor MC1 (Figure 10a) also suggests that the Late Mesozoic tectono-magmatism and mineralization are controlled by asthenospheric upwelling and accompanied by heat input. Moreover, the conductor C1 at the crust-mantle transition zone indicates the MASH (melting, assimilation, storage, homogenization) zone [96], which is also corroborated by petrogeochemical evidence. The Late Mesozoic intermediate-acidic magmatic rocks possess adakitic characteristics, indicating their formation is closely related to partial melting of thickened lower crust triggered by underplating of basaltic magmas, and followed by assimilation and fractional crystallization [8,11,91]. Therefore, Au-polymetallic mineralization can be attributed to the synergistic effects of mantle material upwelling, crust-mantle mixing, and lower crustal melting, and the conductor C1 corresponds to long-term accumulated magma at the crust-mantle boundary. When the temperature and pressure conditions exceeded a critical threshold, magma migrated upward along deep faults. Geological and geophysical studies indicate that the deep NNE-trending faults, particularly the CPF, serve as primary conduits for magmatic–hydrothermal fluids, establishing a vertical connection between the lower-crustal source region and the upper-crustal mineralization zone [8,97].
Following the Late Triassic, the Jiangnan Orogen transitioned into a typical intracontinental orogenic and metallogenic regime [3,7]. During 180–160 Ma, far-field stress transmission from the Paleo-Pacific subduction induced intracontinental compression [2], but limited crustal melting at this stage suppressed extensive mineralization [8,13,33]. From the Middle Jurassic to the Early Cretaceous, the tectonic setting transitioned from compression to extension, driven by the Paleo-Pacific plate rollback and/or slab tearing, which triggered the lithospheric thinning and asthenospheric upwelling of SCB [2,18]. Geological records from the NEH during the Late Mesozoic—including fault-bounded extensional basins, metamorphic core complexes, ductile shear zones, and upper mantle conductive anomalies—collectively indicate significant lithospheric thinning accompanied by asthenospheric upwelling [8]. Associated basaltic underplating and MASH-type interactions facilitated the emplacement of syn-tectonic granitic plutons (e.g., Lianyunshan, Wangxiang, Mufushan) and contributed to the development of a crustal-dominated magmatic-hydrothermal-metallogenic system [8,39]. Integrating resistivity models (Figure 10a) with geochemical evidence supports a metallogenic model (Figure 10b) in which crustal melting—triggered by upper mantle underplating—and subsequent magmatic-metallogenic events operated under the Late Mesozoic extensional regime [8,13,16,34,98].
Specifically, during the Middle Jurassic–Early Cretaceous (~160–136 Ma), basaltic magmas underplated the base of the crust (conductor C1), inducing dehydration melting of Mesoproterozoic metamorphic basement rocks (Lengjiaxi Group), and partial assimilation of metasomatized mantle materials. This process generated Yanshanian granitic plutons and mafic dikes with adakitic affinity [11,16,91]. These magmas transported Au-As-S-enriched hydrothermal fluids along NE-trending faults and associated secondary fault intersections, where mineral precipitation occurred [8,97]. By the Late Cretaceous (136–80 Ma), the NEH entered a post-orogenic extensional regime. Compared to intense tectono-magmatism in the Eastern SCB [2,99], NEH exhibited moderate mafic-ultramafic magmatism, NNE-trending basin-range structures, and superimposed Au-polymetallic mineralization (e.g., Co–Cu–Pb–Zn–Au) along the CPF—e.g., [8,30,33,95,97]. The thermal influence of magmatism not only promoted fluid mixing but also drove fluid–rock–orebody interactions, and decompression during extension facilitated ore precipitation by creating open-space structures along NWW-EW-trending faults [100].

6. Conclusions

This study, through 3D electrical structure, reveals the coupling relationship between deep-seated tectono-magmatism and Au-polymetallic mineralization in the NEH of the Jiangnan Orogen. The inversion runs were performed on a CUGB distributed-memory Linux cluster featuring 36 physical CPU cores and 324 GB of total memory, with a total computation time of 198 h. The primary conclusions are summarized as follows:
(1) The observed eLAB depth of ~80–120 km indicates significant lithospheric thinning during the Late Mesozoic, which promoted intense extension and asthenospheric upwelling, thereby channeling the necessary heat and metallogenic materials. The resultant thermal and compositional imprints are recorded by two lithospheric conductors, probably resulting from water in NAMs and phlogopite.
(2) Three prominent conductive anomalies are detected within the mid-to-lower crust at 15–35 km depths, characterized by resistivity ranging from 3 to 30 Ω·m and conductance exceeding 1000 S. Given their spatial association with known Au-polymetallic deposits, these conductive zones are likely attributed to the enrichment of graphite films and sulfides along faults during multistage magmatic-hydrothermal processes.
(3) Conductive regions in the mid-to-lower crust exhibit weak rheology (effective viscosity <1020 Pa·s) and serve as favorable pathways f for magmatic-hydrothermal fluid ascent, controlling mineralization distribution especially along NE-trending faults.
(4) By integrating geophysical and petrogeochemical data, a metallogenic model is proposed that primarily involves the Late Mesozoic basaltic underplating, crust–mantle interaction (MASH processes), and upward fluid migration under the extensional setting. This model highlights the essential role of deep-seated geodynamics in driving metallogenic systems and facilitating the concentration of Au-polymetallic deposits.
This study provides new geophysical constraints on the deep-seated tectono-magmatism and ore-controlling mechanisms of intracontinental metallogenic systems within the Jiangnan Orogen. These findings have significant implications for guiding deep mineral exploration and improving predictive models in similar tectonic settings.

Supplementary Materials

The following supporting information can be downloaded at: https://www.mdpi.com/article/10.3390/min15121244/s1, Figure S1: Sensitivity tests and the differences of nRMS misfit; Figure S2: Typical fitting curves of the perturbed resistivity model EM2; Figure S3: Typical fitting curves of the revised model MC1 and MC2; Figure S4: The resistivity and quantitative interpretation of Upper Mantle conductors in the NEH. References [101,102,103] are cited in the supplementary materials.

Author Contributions

Conceptualization, C.L. and S.J.; software, C.L. and G.Z.; visualization, C.X.; resources, S.J., C.X., Y.S., J.J., L.Z., H.D. and Y.Y.; writing—review and editing, C.L., S.J. and C.X.; supervision, W.W.; project administration, C.X. and S.J.; funding acquisition, C.X. All authors have read and agreed to the published version of the manuscript.

Funding

This research was jointly supported by the National Key R&D Program of China (2023YFF0803301), the SINOPROBE project, and the China Geological Survey project (DD20160082).

Data Availability Statement

Data will be made available on request.

Acknowledgments

We thank the Guest Editor and anonymous reviewers for their insightful comments, which helped in significantly improving this manuscript. Special thanks to the MT team at the China University of Geoscience, Beijing (CUGB); this study would not have been possible without their efforts. The authors also thank Gary Egbert for the ModEM code. Some figures are prepared by the GMT6 software package. This work was supported by the High-performance Computing Platform of China University of Geosciences Beijing.

Conflicts of Interest

The authors declare no conflicts of interest.

References

  1. Shu, L.; Yao, J.; Wang, B.; Faure, M.; Charvet, J.; Chen, Y. Neoproterozoic plate tectonic process and Phanerozoic geodynamic evolution of the South China Block. Earth-Sci. Rev. 2021, 216, 103596. [Google Scholar] [CrossRef]
  2. Li, J.; Dong, S.; Zhao, G.; Zhang, Y.; Xin, Y.; Wang, J.; Lu, Y. Late Mesozoic continental deformation, deep processes, and geodynamic evolution of South China. Acta Geol. Sin. 2024, 98, 829–861. [Google Scholar] [CrossRef]
  3. Wang, Y.; Fan, W.; Zhang, G.; Zhang, Y. Phanerozoic tectonics of the South China Block: Key observations and controversies. Gondwana Res. 2013, 23, 1273–1305. [Google Scholar] [CrossRef]
  4. Chen, X.; Xiong, J.; Sun, H.; Huang, C. Analysis on tungsten ore-control factors and the prospecting significance to Fuquanshan area in northeast Jiangxi province. Contrib. Geol. Miner. Resour. Res. 2024, 39, 192–199. [Google Scholar]
  5. He, Y.; Huang, Z.; Huang, S.; Lü, Y.; Xu, H.; Jiang, B. Prospecting Prediction Based on Integrated Information of Geophysics and Geochemistry in Yajiangqiao Uranium area, east Hunan. Contrib. Geol. Miner. Resour. Res. 2024, 39, 249–255. [Google Scholar]
  6. Zhang, Z.; Hou, Z.; Lü, Q.; Zhang, X.; Pan, X.; Fan, X.; Zhang, Y.; Wang, C.; Lü, Y. Crustal architectural controls on critical metal ore systems in South China based on Hf isotopic mapping. Geology 2023, 51, 738–742. [Google Scholar] [CrossRef]
  7. Zeng, Y.; Wang, Q.; Groves, D.I.; Santosh, M.; Wang, Y.; Wang, T.; Yang, L.; Chen, W.; Deng, J. Prolonged Mesozoic intracontinental gold mineralization in the South China Block controlled by lithosphere architecture and evolving Paleo-Pacific Plate subduction. Earth-Sci. Rev. 2023, 240, 104387. [Google Scholar] [CrossRef]
  8. Xu, D.; Deng, T.; Chi, G.; Wang, Z.; Zou, F.; Zhang, J.; Zou, S. Gold mineralization in the Jiangnan Orogenic Belt of South China: Geological, geochemical and geochronological characteristics, ore deposit-type and geodynamic setting. Ore Geol. Rev. 2017, 88, 565–618. [Google Scholar] [CrossRef]
  9. Groves, D.I.; Santosh, M.; Zhang, L. A scale-integrated exploration model for orogenic gold deposits based on a mineral system approach. Geosci. Front. 2020, 11, 719–738. [Google Scholar] [CrossRef]
  10. Magee, C.; Stevenson, C.T.E.; Ebmeier, S.K.; Keir, D.; Hammond, J.O.S.; Gottsmann, J.H.; Whaler, K.A.; Schofield, N.; Jackson, C.A.L.; Petronis, M.S.; et al. Magma plumbing systems: A geophysical perspective. J. Petrol. 2018, 59, 1217–1251. [Google Scholar] [CrossRef]
  11. Xu, D.; Deng, T.; Dong, G.; Ning, J.; Wang, Z.; Zhang, J.; Zou, F.; Zhou, Y.; Chen, G.; Yu, D.; et al. Zircon U-Pb geochronological and geochemical characteristics of the Lianyunshan two-mica monzogranites in northeastern Hunan Province: Implications for petrogenesis and tectonic setting associated with polymetallic mineralization. Earth Sci. Front. 2017, 24, 104–122. [Google Scholar] [CrossRef]
  12. Xu, D.; Yu, D.; Wang, Z.; Li, B.; Chi, G.; Zhou, Y.; Zou, S.; Deng, T.; Zhang, S.; Wang, X. Zircon U-Pb and muscovite 40Ar/39Ar dating of Pb-Zn-(Cu) polymetallic deposits in northeastern Hunan Province, Jiangnan Orogen: Evidence for large-scale mineralization in South China at ca. 150–120 Ma. Ore Geol. Rev. 2022, 150, 105200. [Google Scholar] [CrossRef]
  13. Wang, C.; Shao, Y.-J.; Goldfarb, R.; Tan, S.-M.; Sun, J.; Zhou, C.; Zheng, H.; Liu, Q.-Q.; Xiong, Y.-Q. Superimposed gold mineralization events in the Tuanshanbei orogenic gold deposit, Central Jiangnan Orogen, South China. Econ. Geol. 2024, 119, 113–137. [Google Scholar] [CrossRef]
  14. Mao, J.; Kerrich, R.; Li, H.; Li, Y. High 3He/4He ratios in the Wangu gold deposit, Hunan province, China: Implications for mantle fluids along the Tanlu deep fault zone. Geochem. J. 2002, 36, 197–208. [Google Scholar] [CrossRef]
  15. Wang, C.; Shao, Y.-J.; Chen, X.; Xiong, Y.-Q.; Tan, S.-M.; Liu, Q.-Q. Ore-fluid source of multiphase gold mineralization at Tuanshanbei in the central Jiangnan Orogen (NE Hunan, South China): Insight from geology, quartz H-O and monazite in-situ Nd isotope compositions. Ore Geol. Rev. 2023, 157, 105420. [Google Scholar] [CrossRef]
  16. Xu, D.; Dong, G.; Wang, Z.; Ning, J. Geochemical tracing of ore deposits. In Metallogenic System and Deep-Seated Resource Prospecting for Intracontinental Gold (Polymetallic) Deposits in Northeastern Hunan Province; Xu, D., Dong, G., Wang, Z., Ning, J., Eds.; Science Press: Beijing, China, 2023; pp. 174–338. [Google Scholar]
  17. Yu, D.; Xu, D.; Wang, Z.; Xu, K.; Huang, Q.; Zou, S.; Zhao, Z.; Deng, T. Trace element geochemistry and O-S-Pb-He-Ar isotopic systematics of the Lishan Pb-Zn-Cu hydrothermal deposit, NE Hunan, South China. Ore Geol. Rev. 2021, 133, 104091. [Google Scholar] [CrossRef]
  18. Zhang, H.; Lü, Q.; Wang, X.; Han, S.; Liu, L.; Gao, L.; Wang, R.; Hou, Z. Seismically imaged lithospheric delamination and its controls on the Mesozoic Magmatic Province in South China. Nat. Commun. 2023, 14, 2718. [Google Scholar] [CrossRef]
  19. Yan, J.; Lü, Q.; Zhang, Y.; Liu, W.; Wang, X.; Chen, C.; Xu, Y.; Liu, J. The deep boundaries of Jiangnan orogenic belt and its constraints on metallogenic: From the understanding of integrated geophysics. Acta Petrol. Sin. 2022, 38, 544–558. [Google Scholar] [CrossRef]
  20. Xu, Y.; Lü, Q.; Zhao, D.; Yan, J.; Shi, D.; Zhang, Y.; Ruan, S.; Xu, Z.; Chen, C.; Zhang, W.; et al. Upper mantle shear velocity structure of the Cathaysia Block and surrounding areas: New insight into deep geodynamics. Tectonophysics 2024, 892, 230542. [Google Scholar] [CrossRef]
  21. Wang, S.; Zhou, T.; Fan, Y.; Yuan, F.; Zhang, D.; Wang, F.; Chang, Y. Linking deep processes and spatio-temporal evolution of the Yanshanian metallogenic systems in the middle-lower Yangtze River and Qin-Hang metallogenic belts. Sci. China Earth Sci. 2025, 68, 1742–1766. [Google Scholar] [CrossRef]
  22. Lü, Q.; Dong, S.; Tang, J.; Shi, D.; Chang, Y.; Group, S.C. Multi-scale and integrated geophysical data revealing mineral systems and exploring for mineral deposits at depth: A synthesis from SinoProbe-03. Chin. J. Geophys. 2015, 58, 4319–4343. [Google Scholar] [CrossRef]
  23. Müller, D.; Groves, D.I.; Santosh, M.; Yang, C. Critical metals: Their mineral systems and exploration. Geosyst. Geoenviron. 2025, 4, 100323. [Google Scholar] [CrossRef]
  24. Chave, A.D.; Jones, A.G. The Magnetotelluric Method: Theory and Practice; Cambridge University Press: New York, NY, USA, 2012; pp. 1–584. [Google Scholar]
  25. Heinson, G.; Duan, J.; Kirkby, A.; Robertson, K.; Thiel, S.; Aivazpourporgou, S.; Soyer, W. Lower crustal resistivity signature of an orogenic gold system. Sci. Rep. 2021, 11, 15807. [Google Scholar] [CrossRef] [PubMed]
  26. Kirkby, A.; Czarnota, K.; Huston, D.L.; Champion, D.C.; Doublier, M.P.; Bedrosian, P.A.; Duan, J.; Heinson, G. Lithospheric conductors reveal source regions of convergent margin mineral systems. Sci. Rep. 2022, 12, 8190. [Google Scholar] [CrossRef]
  27. Murphy, B.S.; Huizenga, J.M.; Bedrosian, P.A. Graphite as an electrically conductive indicator of ancient crustal-scale fluid flow within mineral systems. Earth Planet. Sci. Lett. 2022, 594, 117700. [Google Scholar] [CrossRef]
  28. Jin, S.; Sheng, Y.; Liu, C.; Wei, W.; Ye, G.; Jing, J.; Zhang, L.; Dong, H.; Yin, Y.; Xie, C. A review of relationship between the metallogenic system of metallic mineral deposits and lithospheric electrical structure: Insight from magnetotelluric imaging. Minerals 2024, 14, 541. [Google Scholar] [CrossRef]
  29. Yin, Y.; Jin, S.; Wei, W.; Lü, Q.; Ye, G.; Jing, J.e.; Zhang, L.; Dong, H.; Xie, C. Lithosphere structure and its implications for the metallogenesis of the Nanling Range, South China: Constraints from 3-D magnetotelluric imaging. Ore Geol. Rev. 2021, 131, 104064. [Google Scholar] [CrossRef]
  30. Jia, D.; Hu, R.; Lu, Y.; Xie, G.; Qiu, X. Characteristics of the mantle source region of sodium lamprophyres and petrogenetic tectonic setting in northeastern Hunan, China. Sci. China Ser. D Earth Sci. 2004, 47, 559–569. [Google Scholar] [CrossRef]
  31. Sun, S.; Yang, L.; Zhang, L.; Olin, P.; Gao, X.; Li, R.; Wang, J.; Li, Z.; Zhang, F.; Wen, T. In-situ trace elements on pyrite and arsenopyrite of the Zhengchong gold deposit, Jiangnan Orogen: Insights for the mineralization mechanism. Ore Geol. Rev. 2020, 122, 103486. [Google Scholar] [CrossRef]
  32. Madayipu, N.; Li, H.; Elatikpo, S.M.; Ghaderi, M.; Heritier, R.s.N.n.; Hu, X.-J.; Zheng, H.; Wu, Q.-H. Tracing fluid exsolution and hydrothermal alteration signature of the Mufushan Nb–Ta–(Li–Be–Cs) deposit, South China: An apatite perspective. J. Geol. Soc. 2024, 181, jgs2023-087. [Google Scholar] [CrossRef]
  33. Deng, T.; Xu, D.; Chi, G.; Wang, Z.; Chen, G.; Zhou, Y.; Li, Z.; Ye, T.; Yu, D. Caledonian (Early Paleozoic) veins overprinted by Yanshanian (Late Mesozoic) gold mineralization in the Jiangnan Orogen: A case study on gold deposits in northeastern Hunan, South China. Ore Geol. Rev. 2020, 124, 103586. [Google Scholar] [CrossRef]
  34. Zhang, Y.; Shao, Y.; Liu, Q.; Huang, K.; Zhang, X.; Chen, J.; Chen, Z. Constraints on the genesis of the Wangjiawan gold deposit, northeast Hunan district, Jiangnan Orogen: Evidence from fluid inclusions and H-O-S-Pb isotopes. Ore Geol. Rev. 2024, 167, 106018. [Google Scholar] [CrossRef]
  35. Wang, Z.; Zhang, X.; Liu, Q.; Shao, Y.; Wu, S.; Pan, Z.; Chen, M.; Zhang, Y.; Wu, H. Genesis of the Lishupo gold deposit in the Jiangnan Orogen, NE Hunan (South China): Biotite Ar-Ar, zircon U-Pb ages and H-O-S-Pb isotopic constraints. Ore Geol. Rev. 2022, 145, 104890. [Google Scholar] [CrossRef]
  36. Madayipu, N.; Li, H.; Ghaderi, M.; Soh Tamehe, L.; Zhou, H.-X.; Wu, Q.-H.; Zheng, H.; Chen, Y.-L.; Kang, F. Contrasting Nb-Ta mineralization between the Mufushan and Lianyunshan granites, South China: Evidence from whole-rock and zircon geochemistry and geochronology. Ore Geol. Rev. 2023, 158, 105487. [Google Scholar] [CrossRef]
  37. Madayipu, N.; Li, H.; Muhammad Elatikpo, S.; Förster, M.W.; Zhou, H.-X.; Zheng, H.; Wu, Q.-H. Magmatic-hydrothermal evolution of long-lived Nb-Ta-(Sn) mineralization in Lianyunshan, NE Hunan, South China. GSA Bull. 2023, 135, 2691–2709. [Google Scholar] [CrossRef]
  38. Madayipu, N.; Li, H.; Algeo, T.J.; Elatikpo, S.M.; Zheng, H.; Wu, Q.-H.; Chen, Y.-L.; Sun, W.-B. Chemical and boron isotopic compositions of tourmalines from the Lianyunshan Nb-Ta pegmatite in northeastern Hunan, China: Insights into fluid and metallogenic sources. Ore Geol. Rev. 2023, 152, 105263. [Google Scholar] [CrossRef]
  39. Xu, D.; Dong, G.; Wang, Z.; Ning, J. Deep resource prediction and potential evaluation. In Metallogenic System and Deep-Seated Resource Prospecting for Intracontinental Gold (Polymetallic) Deposits in Northeastern Hunan Province; Xu, D., Dong, G., Wang, Z., Ning, J., Eds.; Science Press: Beijing, China, 2023; pp. 454–545. [Google Scholar]
  40. Bonvalot, S.; Briais, A.; Kuhn, M.; Peyrefitte, A.; Vales, N.; Biancale, R.; Gabalda, G.; Moreaux, G.; Reinquin, F.; Sarrailh, M. Global grids: World Gravity Map (WGM2012). Bur. Gravim. Int. 2012. [Google Scholar] [CrossRef]
  41. Guo, L.; Gao, R. Potential-field evidence for the tectonic boundaries of the central and western Jiangnan belt in South China. Precambrian Res. 2018, 309, 45–55. [Google Scholar] [CrossRef]
  42. Han, R.; Yang, D.; Li, Q.; Huang, R.; Zhang, H.; Li, J.; Chen, H.; Ye, Z.; Fu, W. Receiver function imaging of dense seismic array and deep dynamic mechanism beneath the eastern South China. Sci. China Earth Sci. 2023, 53, 1289–1308. [Google Scholar] [CrossRef]
  43. Zheng, J.; Lee, C.T.A.; Lu, J.; Zhao, J.; Wu, Y.; Xia, B.; Li, X.; Zhang, J.; Liu, Y. Refertilization-driven destabilization of subcontinental mantle and the importance of initial lithospheric thickness for the fate of continents. Earth Planet. Sci. Lett. 2015, 409, 225–231. [Google Scholar] [CrossRef]
  44. Egbert, G.D. Robust multiple-station magnetotelluric data processing. Geophys. J. Int. 1997, 130, 475–496. [Google Scholar] [CrossRef]
  45. Gamble, T.D.; Goubau, W.M.; Clarke, J. Magnetotellurics with a remote magnetic reference. Geophysics 1979, 44, 53–68. [Google Scholar] [CrossRef]
  46. Caldwell, T.G.; Bibby, H.M.; Brown, C. The magnetotelluric phase tensor. Geophys. J. Int. 2004, 158, 457–469. [Google Scholar] [CrossRef]
  47. Kirkby, A.; Zhang, F.; Peacock, J.; Hassan, R.; Duan, J. The MTPy software package for magnetotelluric data analysis and visualisation. J. Open Source Softw. 2019, 4, 1358–1364. [Google Scholar] [CrossRef]
  48. Booker, J.R. The magnetotelluric phase tensor: A critical review. Surv. Geophys. 2014, 35, 7–40. [Google Scholar] [CrossRef]
  49. Singh, A.; Dehiya, R. An efficient 3-D inversion scheme for continental scale magnetotelluric data. Geophys. J. Int. 2025, 243, ggaf371. [Google Scholar] [CrossRef]
  50. Dong, H.; Sun, K.; Egbert, G.; Kelbert, A.; Meqbel, N. Hybrid CPU-GPU solution to regularized divergence-free curl-curl equations for electromagnetic inversion problems. Comput. Geosci. 2024, 184, 105518. [Google Scholar] [CrossRef]
  51. Egbert, G.D.; Kelbert, A. Computational recipes for electromagnetic inverse problems. Geophys. J. Int. 2012, 189, 251–267. [Google Scholar] [CrossRef]
  52. Kelbert, A.; Meqbel, N.; Egbert, G.D.; Tandon, K. ModEM: A modular system for inversion of electromagnetic geophysical data. Comput. Geosci. 2014, 66, 40–53. [Google Scholar] [CrossRef]
  53. Meqbel, N.M.; Egbert, G.D.; Wannamaker, P.E.; Kelbert, A.; Schultz, A. Deep electrical resistivity structure of the northwestern U.S. derived from 3-D inversion of USArray magnetotelluric data. Earth Planet. Sci. Lett. 2014, 402, 290–304. [Google Scholar] [CrossRef]
  54. Murphy, B.S.; Egbert, G.D. Electrical conductivity structure of southeastern North America: Implications for lithospheric architecture and Appalachian topographic rejuvenation. Earth Planet. Sci. Lett. 2017, 462, 66–75. [Google Scholar] [CrossRef]
  55. Lindsey, N.J.; Newman, G.A. Improved workflow for 3D inverse modeling of magnetotelluric data: Examples from five geothermal systems. Geothermics 2015, 53, 527–532. [Google Scholar] [CrossRef]
  56. Cheng, Y.; Hu, X.; Han, B.; Li, Y.; Kong, Y.; Tang, J. Magnetotelluric evidence for lithospheric alteration beneath the Wuyi-Yunkai Orogen: Implications for thermal structure of South China. Geochem. Geophys. Geosyst. 2022, 23, e2022GC010456. [Google Scholar] [CrossRef]
  57. Xu, S.; Unsworth, M.J.; Hu, X.; Mooney, W.D. Magnetotelluric evidence for asymmetric simple shear extension and lithospheric thinning in South China. J. Geophys. Res. Solid Earth 2019, 124, 104–124. [Google Scholar] [CrossRef]
  58. Robertson, K.; Thiel, S.; Meqbel, N. Quality over quantity: On workflow and model space exploration of 3D inversion of MT data. Earth Planets Space 2020, 72, 2. [Google Scholar] [CrossRef]
  59. Li, X.; Bai, D.; Chen, Y.; Deng, Y.; Zhang, S.; Xue, S. Magnetotelluric signatures of Neoproterozoic subduction, and subsequent lithospheric reactivation and thinning beneath central South China. Tectonophysics 2022, 833, 229365. [Google Scholar] [CrossRef]
  60. Cheng, Y.; Han, B.; Li, Y.; Guo, J.; Hu, X. Lithospheric electrical structure beneath the Cathaysia Block in South China and its tectonic implications. Tectonophysics 2021, 814, 228981. [Google Scholar] [CrossRef]
  61. Mehanee, S.; Zhdanov, M. Two-dimensional magnetotelluric inversion of blocky geoelectrical structures. J. Geophys. Res. Solid Earth 2002, 107, EPM 2-1–EPM 2-11. [Google Scholar] [CrossRef]
  62. Selway, K. Electrical discontinuities in the continental lithosphere imaged with magnetotellurics. In Lithospheric Discontinuities; Yuan, H., Romanowicz, B., Eds.; Wiley: Hoboken, NJ, USA, 2018; pp. 89–109. [Google Scholar]
  63. Yardley, B.W.D. The role of water in the evolution of the continental crust. J. Geol. Soc. 2009, 166, 585–600. [Google Scholar] [CrossRef]
  64. Wang, Y.; Liu, S.; Chen, C.; Jiang, G.; Wu, J.; Guo, L.; Wang, Y.; Zhang, H.; Wang, Z.; Jiang, X.; et al. Compilation of terrestrial heat flow data in continental China (5th edition). Chin. J. Geophys. 2024, 67, 4233–4265. [Google Scholar] [CrossRef]
  65. Yang, X.; Li, Y.; Afonso, J.C.; Yang, Y.; Zhang, A. Thermochemical state of the upper mantle beneath South China from multi-observable probabilistic inversion. J. Geophys. Res. Solid Earth 2021, 126, e2020JB021114. [Google Scholar] [CrossRef]
  66. Hashim, L.; Gaillard, F.; Champallier, R.; Le Breton, N.; Arbaret, L.; Scaillet, B. Experimental assessment of the relationships between electrical resistivity, crustal melting and strain localization beneath the Himalayan–Tibetan Belt. Earth Planet. Sci. Lett. 2013, 373, 20–30. [Google Scholar] [CrossRef]
  67. Deng, Y.; Li, S.; Fan, W.; Liu, J. Crustal structure beneath South China revealed by deep seismic soundings and its dynamics implications. Chin. J. Geophys. 2011, 54, 2560–2574. [Google Scholar] [CrossRef]
  68. Liu, C.; Jing, J.e.; Jin, S.; Yin, Y.; Xie, C.; Ye, G.; Sheng, Y.; Ji, L. The structurally-controlled polyphase Au mineralization in the southern Youjiang Basin: Insights from magnetotelluric imaging. Ore Geol. Rev. 2024, 169, 106090. [Google Scholar] [CrossRef]
  69. Jones, A.G.; Katsube, T.J.; Schwann, P. The longest conductivity anomaly in the world explained: Sulphides in fold hinges causing very high electrical anisotropy. J. Geomagn. Geoelectr. 1997, 49, 1619–1629. [Google Scholar] [CrossRef]
  70. Yoshino, T.; Noritake, F. Unstable graphite films on grain boundaries in crustal rocks. Earth Planet. Sci. Lett. 2011, 306, 186–192. [Google Scholar] [CrossRef]
  71. Myer, D.; Constable, S.; Key, K. Magnetotelluric evidence for layered mafic intrusions beneath the Vøring and Exmouth rifted margins. Phys. Earth Planet. Inter. 2013, 220, 1–10. [Google Scholar] [CrossRef]
  72. Huizenga, J.M.; Touret, J.L.R. Granulites, CO2 and graphite. Gondwana Res. 2012, 22, 799–809. [Google Scholar] [CrossRef]
  73. Shen, W.; Zhu, J.; Liu, C.; Xu, S.; Ling, H. Sm-Nd isotopic study of basement metamorphic rocks in south China and its constraints on material sources of granitoids. Acta Petrol. Sin. 1993, 9, 115–124. [Google Scholar]
  74. Ge, H.; Liang, Y.; Wang, G.; Zhou, C.; Pei, Q.; Jiao, X.; Huang, H. Gold mineralization of the Huangjindong gold deposit in the Jiangnan Orogen, South China: Constraints from fluid inclusions and LA-ICP-MS analysis of pyrite and arsenopyrite. Ore Geol. Rev. 2025, 179, 106540. [Google Scholar] [CrossRef]
  75. Kawano, S.; Yoshino, T.; Katayama, I. Electrical conductivity of magnetite-bearing serpentinite during shear deformation. Geophys. Res. Lett. 2012, 39, L20313. [Google Scholar] [CrossRef]
  76. Deng, T.; Zhou, L.; Li, Z. Fe-bearing minerals and implications for gold mineralization for the Wangu deposit in Central Jiangnan Orogen. Acta Geochim. 2023, 42, 552–571. [Google Scholar] [CrossRef]
  77. Glover, P.W.J.; Hole, M.J.; Pous, J. A modified Archie’s law for two conducting phases. Earth Planet. Sci. Lett. 2000, 180, 369–383. [Google Scholar] [CrossRef]
  78. Rychert, C.A.; Harmon, N.; Constable, S.; Wang, S. The nature of the lithosphere-asthenosphere boundary. J. Geophys. Res. Solid Earth 2020, 125, e2018JB016463. [Google Scholar] [CrossRef]
  79. Deng, Y.; Byrnes, J.S.; Bezada, M. New insights into the heterogeneity of the lithosphere-asthenosphere system beneath South China from teleseismic body-wave attenuation. Geophys. Res. Lett. 2021, 48, e2020GL091654. [Google Scholar] [CrossRef]
  80. Zhang, B.; Fei, H.; Yoshino, T.; Xia, Q. Some new insights about electrical discontinuities in the cratonic lithosphere. Earth-Sci. Rev. 2023, 246, 104592. [Google Scholar] [CrossRef]
  81. Frost, D.J.; McCammon, C.A. The redox state of Earth’s mantle. Annu. Rev. Earth Planet. Sci. 2008, 36, 389–420. [Google Scholar] [CrossRef]
  82. Aubaud, C.; Hauri, E.H.; Hirschmann, M.M. Hydrogen partition coefficients between nominally anhydrous minerals and basaltic melts. Geophys. Res. Lett. 2004, 31, L20611. [Google Scholar] [CrossRef]
  83. Hao, Y.; Xia, Q.; Jia, Z.; Zhao, Q.; Li, P.; Feng, M.; Liu, S. Regional heterogeneity in the water content of the Cenozoic lithospheric mantle of Eastern China. J. Geophys. Res. Solid Earth 2016, 121, 517–537. [Google Scholar] [CrossRef]
  84. Özaydın, S.; Selway, K. MATE: An analysis tool for the interpretation of magnetotelluric models of the mantle. Geochem. Geophys. Geosyst. 2020, 21, e2020GC009126. [Google Scholar] [CrossRef]
  85. Hu, H.; Dai, L.; Li, H.; Sun, W.; Li, B. Effect of dehydrogenation on the electrical conductivity of Fe-bearing amphibole: Implications for high conductivity anomalies in subduction zones and continental crust. Earth Planet. Sci. Lett. 2018, 498, 27–37. [Google Scholar] [CrossRef]
  86. Chase, B.F.W.; Unsworth, M.J.; Atekwana, E.A.; Evans, R.L.; Zhu, J. Magnetotelluric imaging of the lithospheric structure of the Southern Oklahoma Aulacogen: Evidence for long-term weakening caused by rifting. J. Geophys. Res. Solid Earth 2023, 128, e2023JB026555. [Google Scholar] [CrossRef]
  87. Özaydın, S.; Selway, K.; Foley, S.F.; Ezad, I.S.; Griffin, W.L.; Tarits, P.S.; Hautot, S. Role of metasomatism in the development of the East African Rift at the northern Tanzanian divergence: Insights from 3D magnetotelluric modeling. Geochem. Geophys. Geosyst. 2024, 25, e2023GC011191. [Google Scholar] [CrossRef]
  88. Yang, Z.; Li, X.; Deng, Y.; Yu, N.; Kong, W.; Chen, M.; Chen, Y.; Bai, D.; Teng, J. Magnetotelluric evidence for lithospheric hydration and thinning beneath the Youjiang Basin in southwestern China. J. Geophys. Res. Solid Earth 2025, 130, e2024JB029650. [Google Scholar] [CrossRef]
  89. Sheng, Y.; Jin, S.; Comeau, M.J.; Becken, M.; Zhang, L.; Dong, H.; Wei, W.; Ye, G. Controls on the metallogenesis of the Lhasa–Mozugongka district, Gangdese Belt, Tibetan Plateau: Constraints on melt distribution and viscosity from the 3-D electrical structure of the lithosphere. Ore Geol. Rev. 2022, 145, 104881. [Google Scholar] [CrossRef]
  90. Dong, H.; Wei, W.; Jin, S.; Ye, G.; Jones, A.G.; Zhang, L.; Jing, J.e.; Xie, C.; Yin, Y. Shaping the surface deformation of central and south Tibetan Plateau: Insights from magnetotelluric array data. J. Geophys. Res. Solid Earth 2020, 125, e2019JB019206. [Google Scholar] [CrossRef]
  91. Li, P.; Xu, D.; Chen, G.; Xia, B.; He, Z.; Fu, G. Constraints of petrography, geochemistry and Sr-Nd isotopes on the Jinjing granitoids from northeastern Hunan province, China: Implications for petrogenesis and geodynamic setting. Acta Petrol. Sin. 2005, 21, 921–934. [Google Scholar]
  92. Karato, S.-I.; Jung, H. Effects of pressure on high-temperature dislocation creep in olivine. Philos. Mag. 2010, 83, 401–414. [Google Scholar] [CrossRef]
  93. Liu, L.; Hasterok, D. High-resolution lithosphere viscosity and dynamics revealed by magnetotelluric imaging. Science 2016, 353, 1515–1519. [Google Scholar] [CrossRef]
  94. Sun, Y.; Dong, S.; Liu, M.; Zhang, H.; Shi, Y. The rheological structure of East Asian continental lithosphere. Tectonophysics 2025, 895, 230575. [Google Scholar] [CrossRef]
  95. Xu, D.; Dong, G.; Wang, Z.; Ning, J. The mechanism of intra-continental extension deformation in northeastern Hunan. In Intracontinental Extensional Deformation Structures and Their Dynamic Mechanisms of Formation and Evolution in Northeastern Hunan Province; Xu, D., Dong, G., Wang, Z., Ning, J., Eds.; Science Press: Beijing, China, 2023; pp. 512–603. [Google Scholar]
  96. Delph, J.R.; Ward, K.M.; Zandt, G.; Ducea, M.N.; Beck, S.L. Imaging a magma plumbing system from MASH zone to magma reservoir. Earth Planet. Sci. Lett. 2017, 457, 313–324. [Google Scholar] [CrossRef]
  97. Xu, D.; Dong, G.; Wang, Z.; Ning, J. The intracontinental mineralization system and geological model for mineral exploration prediction in northeastern Hunan. In Metallogenic System and Deep-Seated Resource Prospecting for Intracontinental Gold (Polymetallic) Deposits in Northeastern Hunan Province; Xu, D., Dong, G., Wang, Z., Ning, J., Eds.; Science Press: Beijing, China, 2023; pp. 339–453. [Google Scholar]
  98. Wang, C.; Wei, H.; Liu, Q.; Yang, Z. Early Cretaceous metasomatized lithospheric mantle beneath the Central Jiangnan Orogen in South China: Geochemical and Sr-Nd isotope evidence from the Tuanshanbei dolerite. Acta Geol. Sin.-Engl. Ed. 2024, 98, 602–616. [Google Scholar] [CrossRef]
  99. Zhou, X.; Sun, T.; Shen, W.; Shu, L.; Niu, Y. Petrogenesis of Mesozoic granitoids and volcanic rocks in South China: A response to tectonic evolution. Episodes 2006, 29, 26–33. [Google Scholar] [CrossRef] [PubMed]
  100. Zhou, Y.; Xu, D.; Dong, G.; Chi, G.; Deng, T.; Cai, J.; Ning, J.; Wang, Z. The role of structural reactivation for gold mineralization in northeastern Hunan Province, South China. J. Struct. Geol. 2021, 145, 104306. [Google Scholar] [CrossRef]
  101. Garcia, X.; Seillé, H.; Elsenbeck, J.; Evans, R.L.; Jegen, M.; Hölz, S.; Ledo, J.; Lovatini, A.; Marti, A.; Marcuello, A.; et al. Structure of the mantle beneath the Alboran Basin from magnetotelluric soundings. Geochem. Geophys. Geosyst. 2015, 16, 4261–4274. [Google Scholar] [CrossRef]
  102. Li, S.; Weng, A.; Li, J.; Shan, X.; Han, J.; Tang, Y.; Zhang, Y.; Wang, X. Deep origin of Cenozoic volcanoes in Northeast China revealed by 3-D electrical structure. Sci. China Earth Sci. 2020, 63, 533–547. [Google Scholar] [CrossRef]
  103. Bürgmann, R.; Dresen, G. Rheology of the lower crust and upper mantle: Evidence from rock mechanics, geodesy, and field observations. Annu. Rev. Earth Planet. Sci. 2008, 36, 531–567. [Google Scholar] [CrossRef]
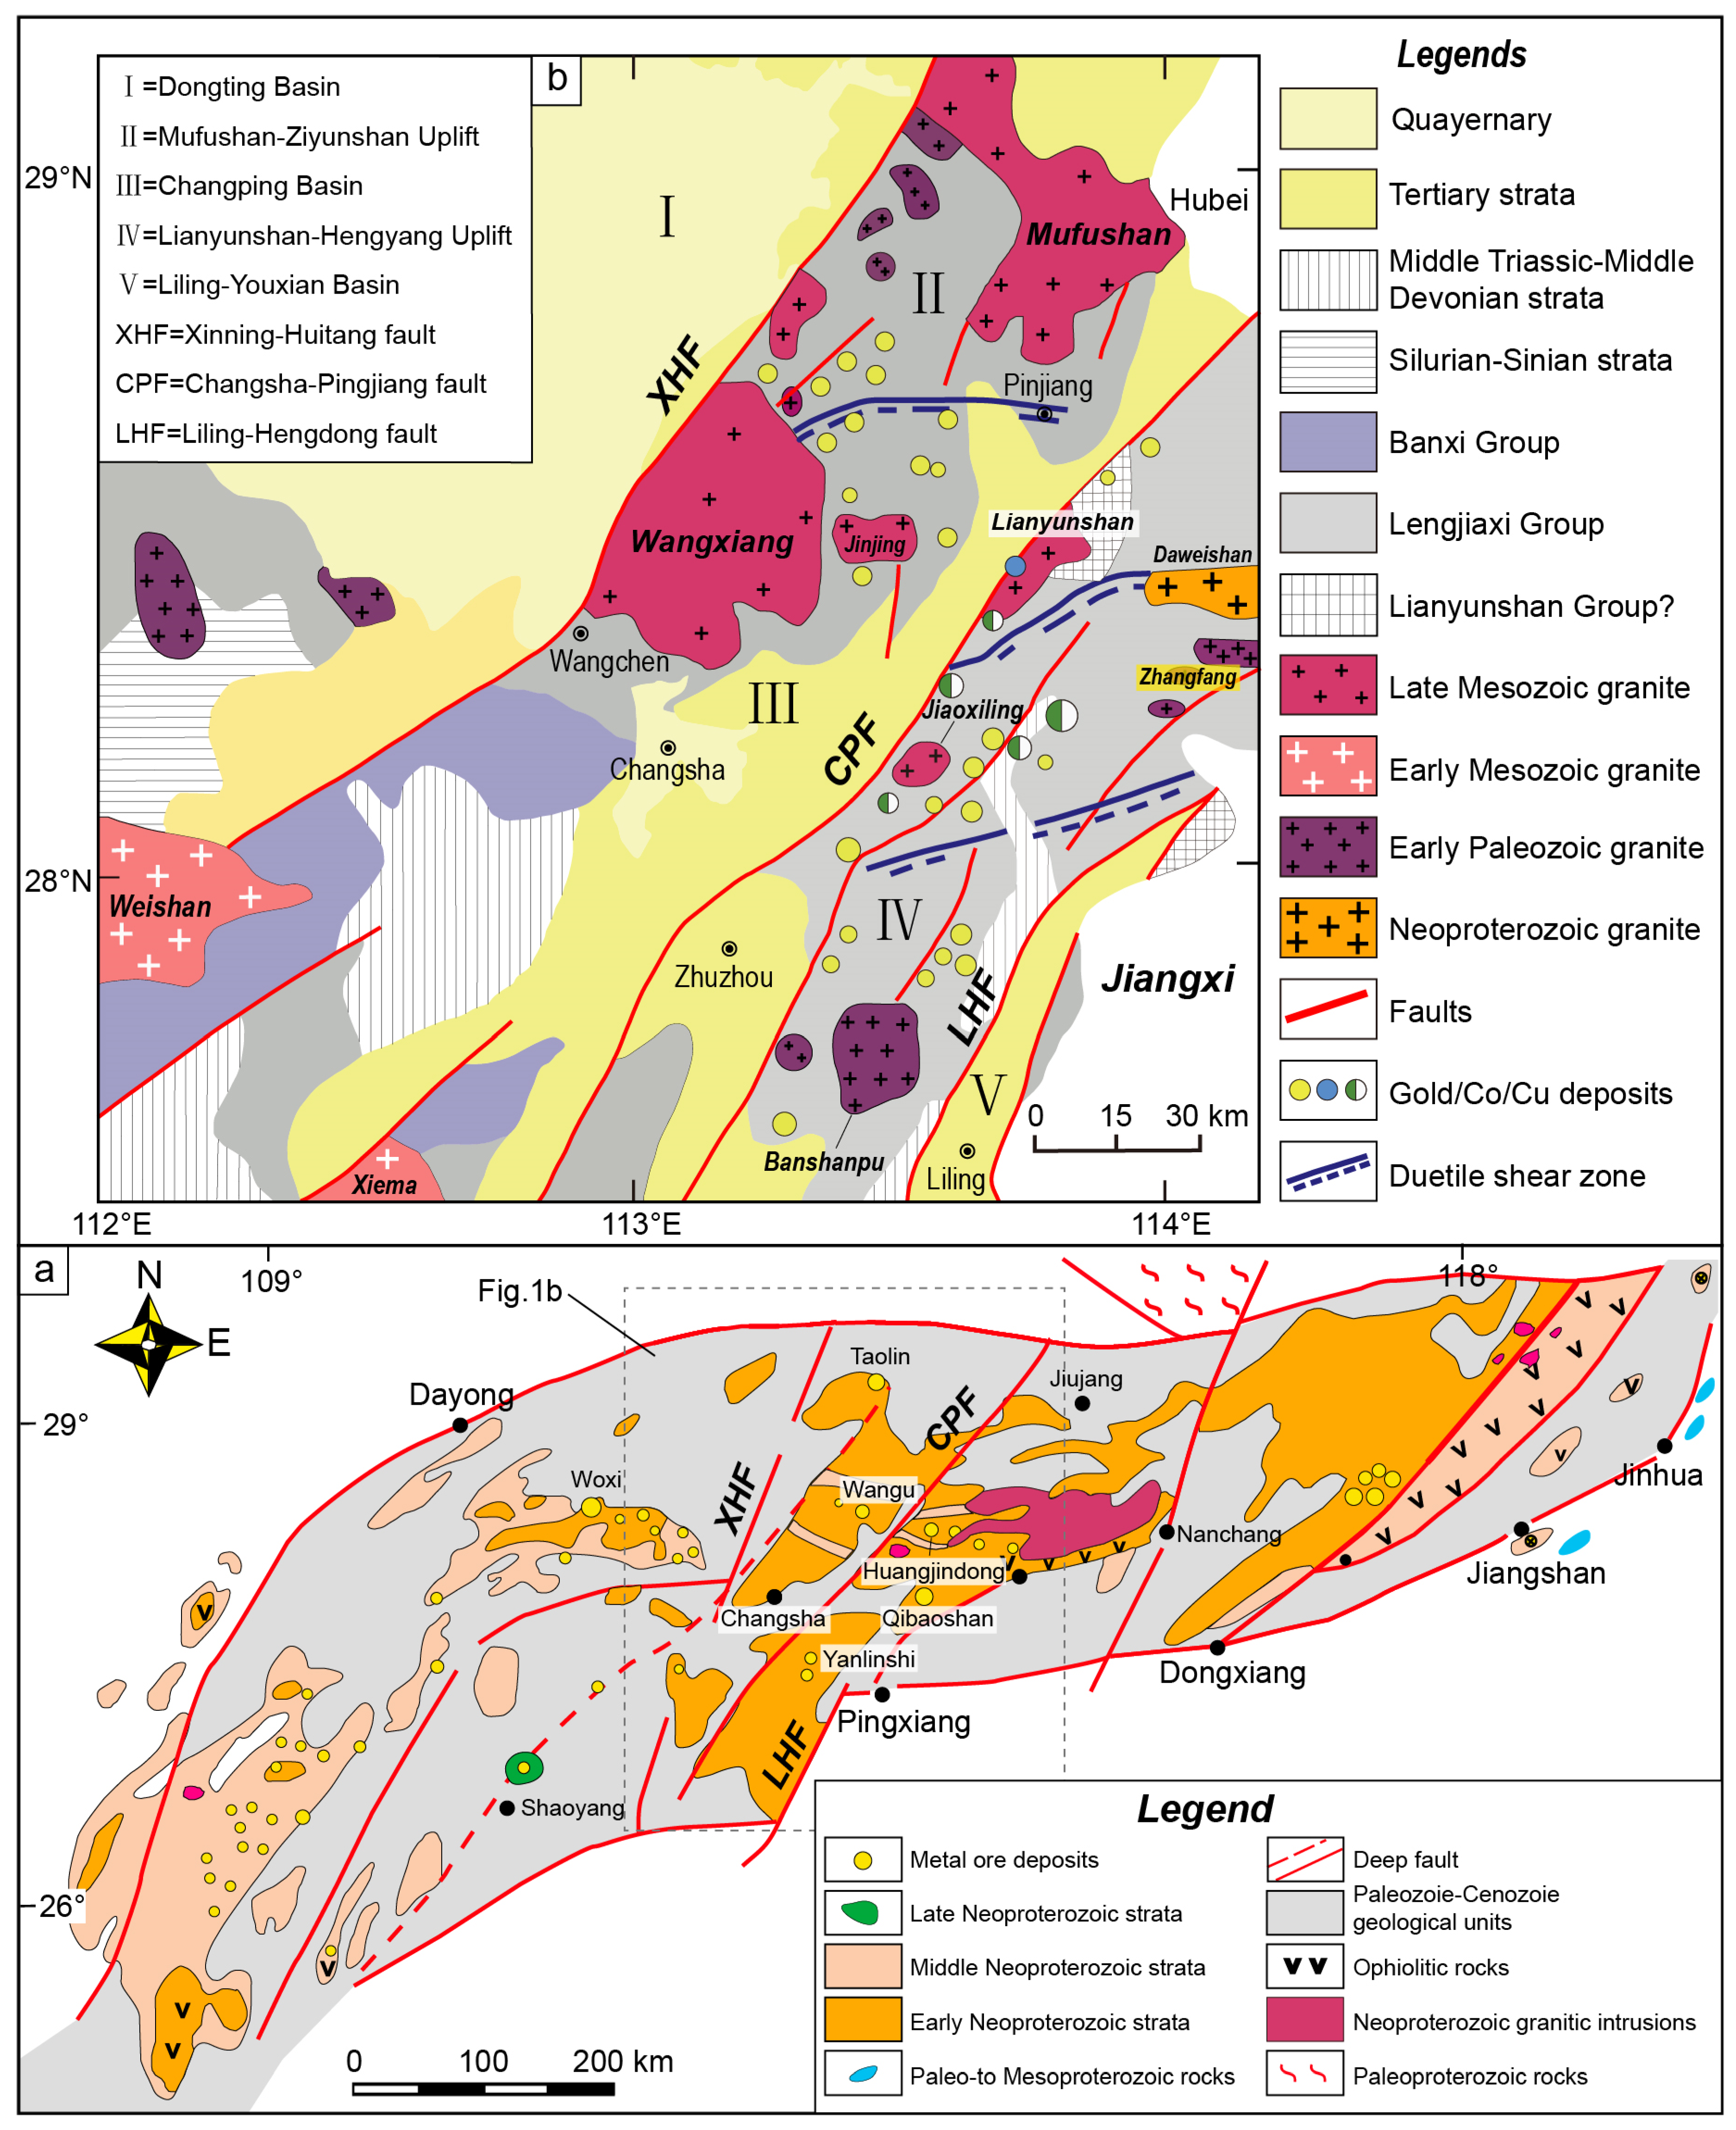
Figure 1. The distribution of tectonics and deposits in the study area. (a) The distribution of geological structure and Au-polymetallic deposits in the Jiangnan Orogen (modified from Xu et al. [8]); (b) The distribution of tectonics and metal deposit distribution in the Northeastern Hunan Province (NEH) (modified from Xu et al. [8]).
Minerals 15 01244 g001
Figure 2. Regional geophysical images in the NEH. (a) Bouguer gravity anomaly of the WGM2012 model [40]; (b) The amplitude-aeromagnetic anomaly (data is available from Guo and Gao [41]); (c) The distribution of crustal thickness (data is available from Han et al. [42]); (d) The distribution of crustal Poisson’s ratio (data is available from Han et al. [42]). Abbreviations: XHF: Xinning–Huitang Fault; CPF: Changsha–Pingjiang Fault; LHF: Liling–Hengdong Fault.
Minerals 15 01244 g002
Figure 3. Topographic map of the study area and apparent resistivity and phase curves of the off-diagonal impedance components (Zxy and Zyx) for typical MT stations. (a) Topographic map of the study area, showing major structures and MT stations. (b) Apparent resistivity and phase curves, along with fitting curves, for some typical MT stations. MT stations are shown in Figure 3a, and red and blue solid lines represent responses of Zxy and Zyx components, respectively. The fault distribution is the same as Figure 2.
Minerals 15 01244 g003
Figure 4. Phase tensors for all MT sites. (ae) Distribution of phase tensors for all MT sites at periods of 0.1 s, 1s, 10 s, 100 s, and 1000 s. (f) Vertical slice of phase tensor ellipses for all periods along a NW profile (black solid line in Figure 4a). The fault distribution is the same as Figure 2.
Minerals 15 01244 g004
Figure 5. Horizontal resistivity slices at different depths and the final iteration of nRMS misfit distribution for the preferred resistivity model. Panels (ad) show horizontal slices of the resistivity model at depths of 15 km, 25 km, 58 km, and 78 km, respectively, and panel (e) shows the final iteration of nRMS misfit distribution for the preferred resistivity model. The fault distribution is the same as Figure 2, and the white shaded area indicates the region with poor data constraints.
Minerals 15 01244 g005
Figure 6. Three Northwest-trending vertical resistivity slices and the middle to lower crustal conductance in the NEH. Panels (ac) show three Northwest-trending vertical resistivity slices, and panel (d) shows the middle to lower crustal (15–35 km depth) conductance. The profile locations of P1–P1′, P2–P2′, and P3–P3′ are displayed in Figure 6d. The fault distribution is the same as Figure 2, and the white shaded area indicates the region with poorly constrained data.
Minerals 15 01244 g006
Figure 7. Sensitivity tests and the differences in nRMS misfit. (a) Replace the resistivity models below 86, 126, and 186 km with 100 Ω·m and generate edited models (EM1, EM2, and EM3); (bd) The differences in nRMS misfit at each MT station in EM1, EM2, and EM3 models. The fault distribution is the same as Figure 2, and the location of MT profile P2–P2’ is indicated in Figure 7b.
Minerals 15 01244 g007
Figure 9. The distribution of mid-to-lower crustal (15–35 km depth) effective viscosity and metallic deposits in the NEH. (af) The distribution of effective viscosity with the coefficients of C 0 = 2.0 and C 1 varying from 0.5 to 8.0. The fault distribution is the same as Figure 2.
Minerals 15 01244 g009
Figure 10. Three-dimensional resistivity model and the conceptual metallogenic model for gold (polymetallic) deposits in the NEH. (a) The electrical structure beneath Au-polymetallic deposits in the NEH. (b) The metallogenic dynamic model of Au-polymetallic deposits in the NEH. Gray dots represent MT stations, and colored circles indicate the spatial distribution of Au-polymetallic deposits [8]. The model illustrates the spatial correlation between deep crust–mantle conductive anomalies, major lithospheric faults, and ore deposit distribution, providing geophysical constraints on the metallogenic framework of the NEH.
Minerals 15 01244 g010
Disclaimer/Publisher’s Note: The statements, opinions and data contained in all publications are solely those of the individual author(s) and contributor(s) and not of MDPI and/or the editor(s). MDPI and/or the editor(s) disclaim responsibility for any injury to people or property resulting from any ideas, methods, instructions or products referred to in the content.