1. Introduction
Pegmatites and the minerals that crystallize in them are complex. Variations in pressure, temperature, and magma/fluid composition all influence mineral compositions, and pegmatites often “stew in their own juices” [
1]. Gem minerals are grown in miarolitic cavities, or pockets, which can be isolated from the main pegmatite body [
2,
3]. These pockets result from exsolution of the vapor phase during either a reduction in confining pressure on the pegmatite or a combination of reduction in confining pressure and the crystallization of B- and Li-bearing silicates, which reduces the solubility of H
2O in the melt, causing exsolution of vapor [
4,
5]. Pockets can be sealed and then opened repetitively, allowing fluids of different compositions to interact with the growing crystals [
3], resulting in complexly zoned minerals.
Some of the planet’s most distinctly multi-color-zoned tourmalines are found in pockets in the Anjanabonoina pegmatite field in Central Madagascar. Pegmatites in the field intruded the Itremo Group; a thrust sheet developed during the East African Orogeny as the Mozambique Ocean between the Madagascar–India and Congo–Tanzania cratons closed. Deformation and metamorphism of the Itremo Group occurred before 720 Ma [
6]. Extensional collapse followed at about 550 Ma, accompanied by the intrusion of syenitic and granitic plutons [
7]. The Ibity granite in the eastern Itremo region was dated using U-Pb systematics on monazite at 565 ± 17 Ma [
6]; the Ibity granite could be related to the central Madagascar pegmatite fields.
The main pegmatite at Anjanabonoina is 800 m long and 2–12 m thick [
8,
9,
10]. All pegmatites in the field are heavily weathered and eroded. Many of the tourmaline crystals are found in the alluvial and eluvial deposits that bound the pegmatites. The alluvial setting for the tourmaline crystals, with the extremely remote location of the pegmatite field, results in the loss of all detailed contextual field relationships between the pegmatite and the host rocks. In general, the pegmatites are intruded into mica schist, metadiorite, dolomitic marble, quartzite, and orthogneiss [
10].
Many of the tourmaline specimens recovered from the Anjanabonoina pegmatite are liddicoatite: a rare Ca- and Li-rich tourmaline [
11,
12]. Liddicoatite is the calcic version of elbaite and has been mineralogically characterized [
13,
14]. Polychrome tourmaline crystals in Anjanabonoina found in large pockets are typically liddicoatite throughout; however, crystals with simpler zoning patterns, typically elbaite or dravite, are found in smaller pockets [
10]. The source of Ca is thought to be the host rocks, either mobilized from Ca-bearing minerals such as plagioclase [
15] or introduced into the pegmatite via mixing of fluids derived from the host metasedimentary rocks during contact metamorphism [
3,
8,
10]. Alternatively, Ca could be reserved in early-crystallized fluorite and later dissolved by reactive pegmatitic fluids [
15].
Several researchers have noted the mixed genetic nature of the Anjanabonoina pegmatite [
3,
8,
16]. A long-standing classification scheme for pegmatites identifies three families and their tectonic associations [
4,
17]. NYF (Nb, Y, F) pegmatites become progressively enriched in Nb, Y, and F, along with Be, REE, Sc, Ti, Zr, Th, and U, which are thought to fractionate from subaluminous to metaluminous A- and I-type granites in anorogenic, extensional tectonic settings. LCTs (Li, Cs, Ta) are enriched in Li, Ca, Ta, Rb, Be, Sn, B, P, and F and are derived largely from S- and I-type granites associated with subduction. The third family, to which the Anjanabonoina pegmatite belongs, is the mixed NYF-LCT family, thought to form by the contamination of NYF pegmatites with crustal rocks.
Tourmaline zoning records the history of the geochemical system from which it crystallized [
18]. This paper presents the results of a study of zoning in an Anjanabonoina liddicoatite crystal analyzed with Laser-Induced Breakdown Spectroscopy (LIBS). LIBS spectra record photons in the optical wavelengths were emitted during the cooling of a laser ablation plasma. All elements present in the sample emit light; those at concentrations greater than their inherent detection limits, governed by the instrument design, generate emission peaks in the spectrum. LIBS has been employed in a number of geologic investigations (see summaries in [
19,
20,
21]), including compositional mapping [
22,
23,
24,
25] and provenance determination [
26,
27,
28,
29,
30,
31]. However, LIBSs have not been used to date to understand mineral zoning in detail.
Zoning in an Anjanabonoina liddicoatite was examined using elemental concentrations determined by Electron Probe MicroAnalysis (EPMA) [
32]. In this work, single-element traverses across the crystal were used to define zones and understand their origins. In this traditional method, it is necessary to examine and compare multiple traverses to discern multi-element trends. Here, we apply the multivariate statistical technique Principal Component Analysis (PCA) to LIBS spectra to assess compositional zoning in the liddicoatite and interpret the zoning patterns in terms of fluctuating pegmatite pocket fluid composition through time. This novel and unique approach allows us to resolve and interpret tourmaline zoning by understanding simultaneous changes in the concentrations of many elements affected by open-system pegmatitic processes.
2. Materials and Methods
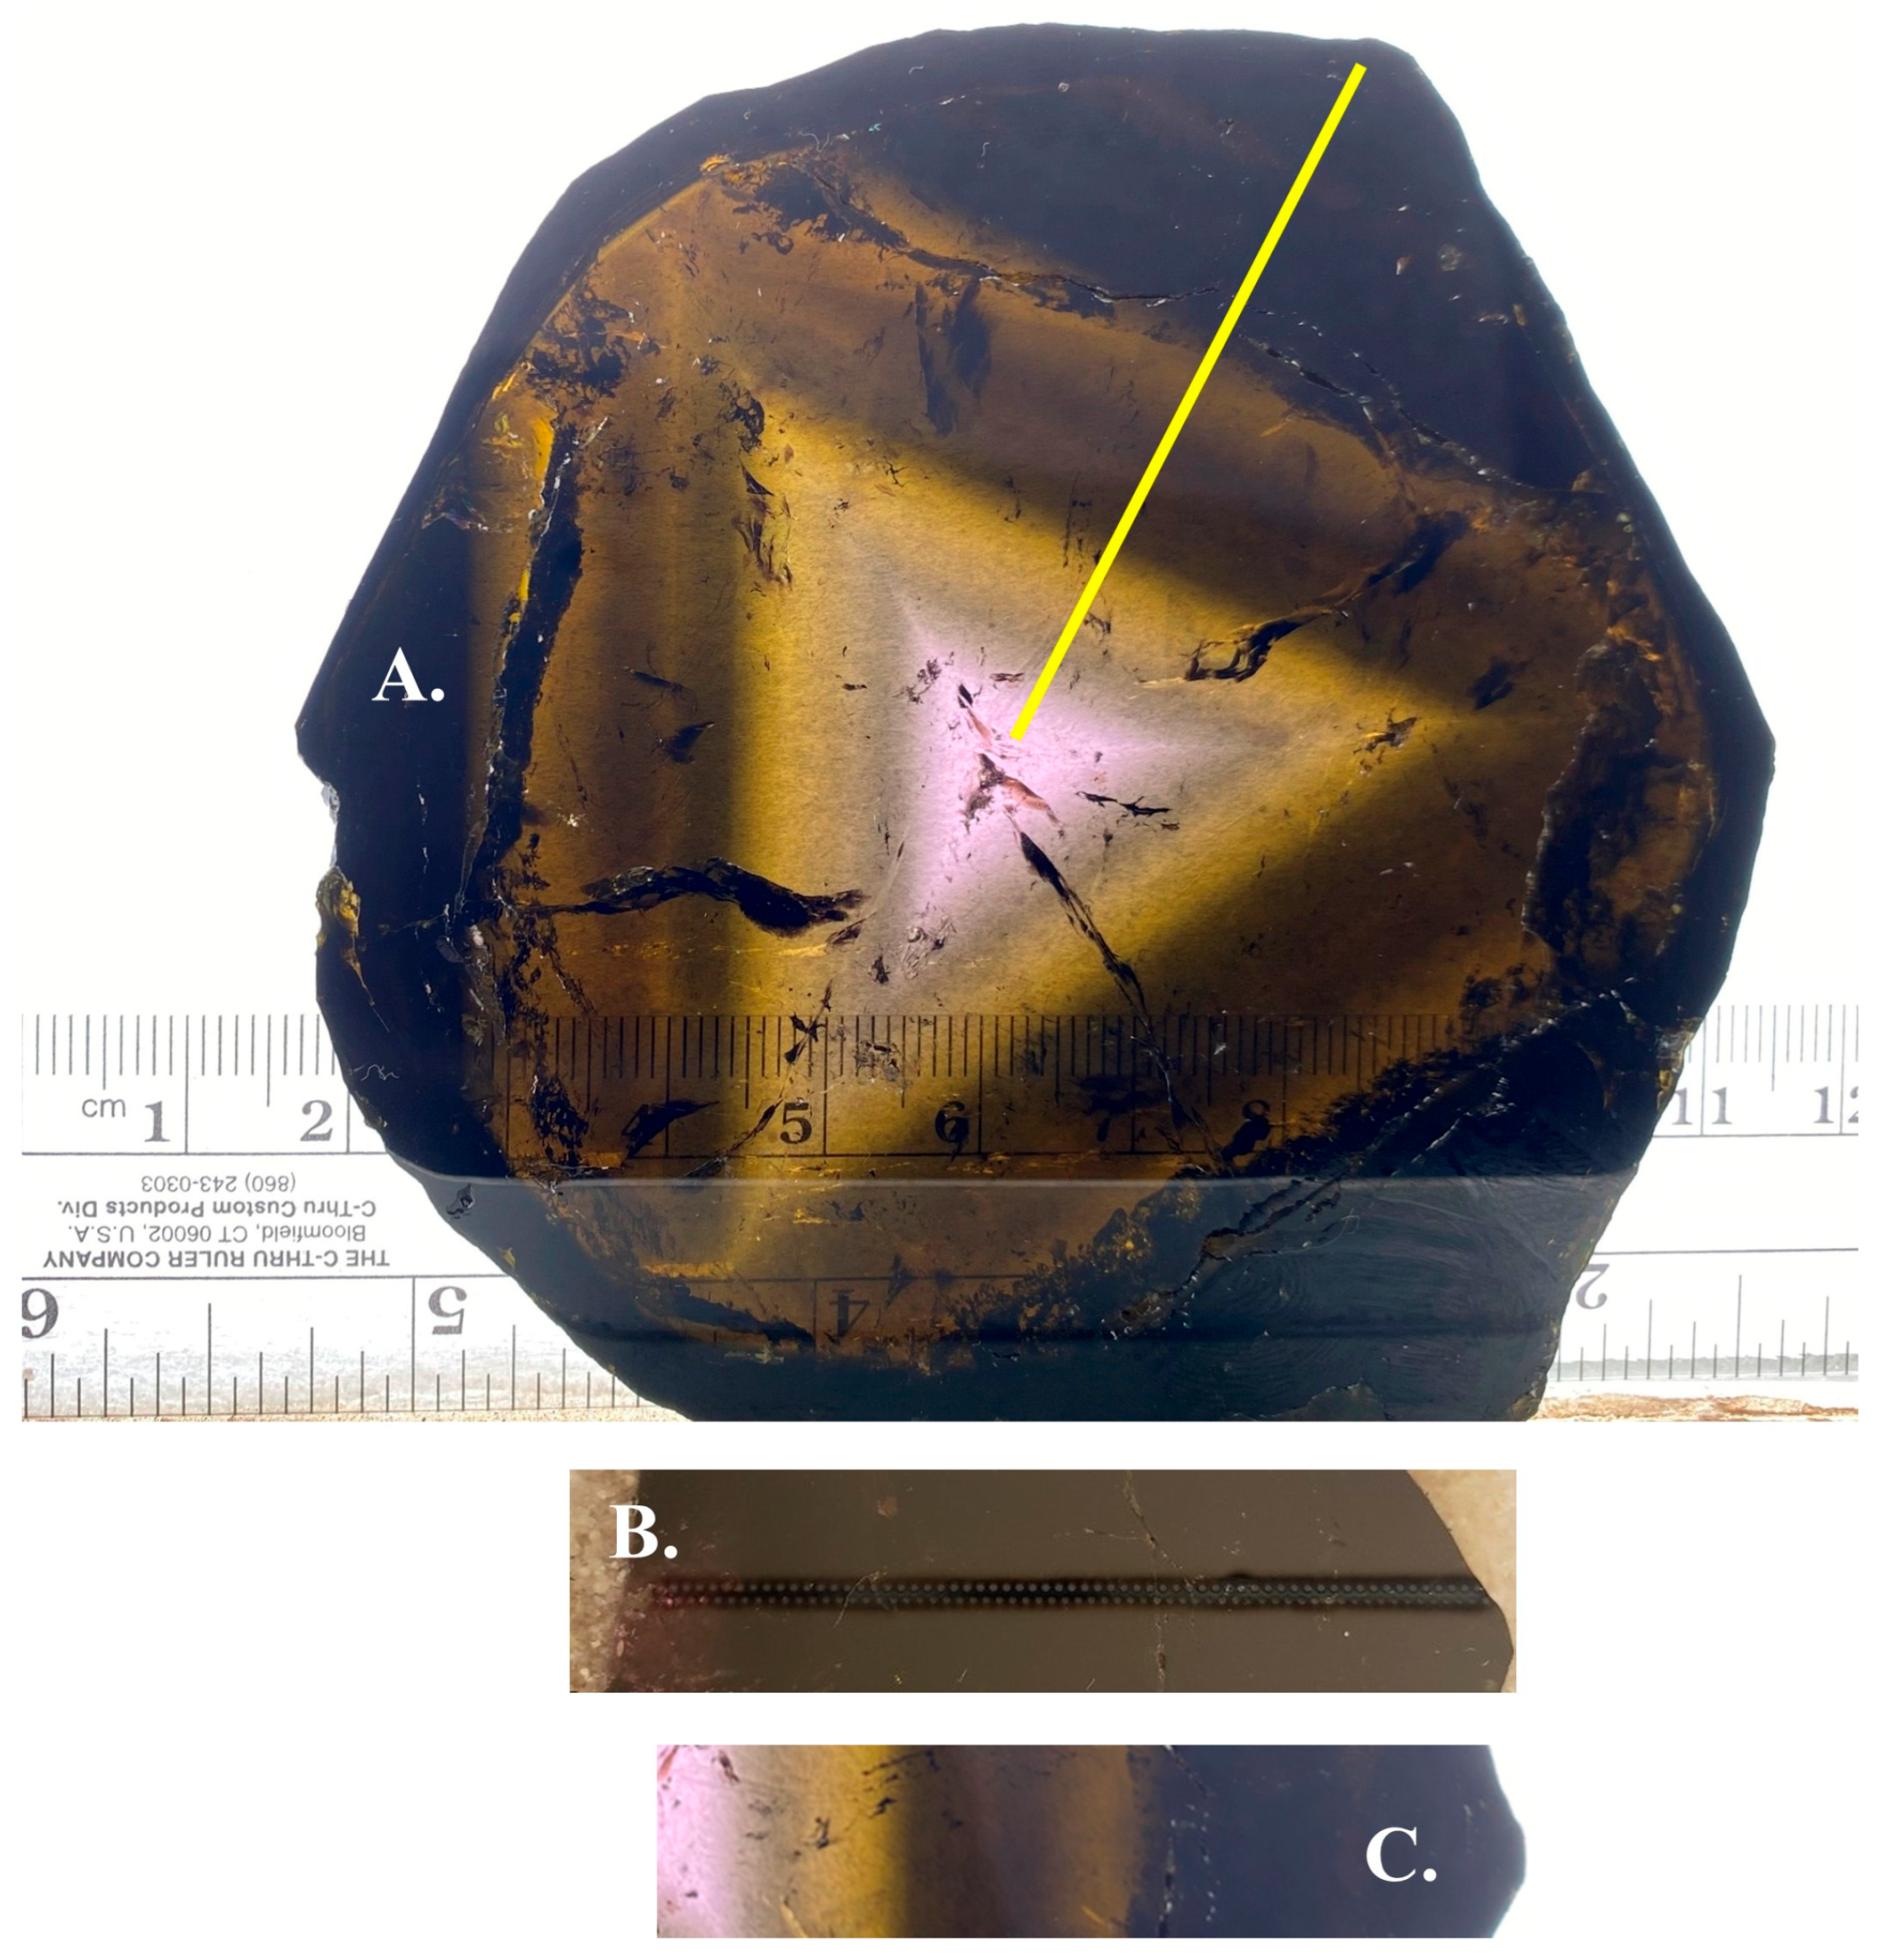
The liddicoatite sample, approximately 10 cm in diameter and 5 mm thick (
Figure 1), was purchased in 2020 at the Tucson Gem, Mineral, and Fossil show from a reputable dealer. It was cut into smaller pieces, one of which exhibits a complete core-to-rim section. This piece was embedded in epoxy to stabilize it and then polished for electron probe microanalysis (EPMA) [
33]. Although EMPA analyses were performed by [
33], this paper focuses solely on the LIBS analyses.
Details of tourmaline LIBS analysis used in this study are discussed in [
34]. LIBS analyses were performed at Materialytics Technology Corp. The instrument, manufactured by Applied Spectra (West Sacramento, CA, USA), model J200, contains an Andor (Oxford Instruments, Abingdon, UK) Mechelle ME 5000 spectrograph (λ/Δλ = 5000) and an Andor iStar ICCD (intensified charge-coupled device) camera, model DH334T-18F-03. Spectra contained photon intensities collected at 26,770 wavelength bins between 208 and 1032 nm. A Q-switched Quantel ULTRA Big Sky Laser (Bozeman, MT, USA), operated at 266 nm wavelength, laser pulse energy of 150 mJ, gate delay of 0.5 µs, gate width of 10 µs, and laser beam diameter of nominally 50 µm was used. Argon (Praxair, Killeen, TX, USA) was streamed into the sample chamber at the rate of 2.0 Ls
−1; the flow rate at the ablation site was not measured. The presence of Ar in the chamber increases signal-to-noise and improves plasma stability [
35].
Two parallel traverses, 63 and 64 shots long, were acquired from core to rim (
Figure 1B). Ten LIBS shots were acquired at each location. The distance between locations in each traverse is 800 µm, a distance empirically determined for tourmaline with this LIBS instrument to avoid the effects of recast, the material deposited around the laser ablation crater from fallout of ablated material [
34]. The second traverse was located 800 µm from the first and then offset in the rimward direction by 400 µm (
Figure 1B). The spectra from the two traverses were concatenated to create one traverse, 127 locations along with 400 µm spacing between locations.
Minor pre-processing was performed on the spectra in an effort to mitigate the shot-to-shot variation inherent in laser ablation techniques and produce a more effective relationship between the LIBS intensities and EPMA concentrations [
33]. The ten LIBS shots from each location were averaged into a single spectrum, which was then normalized to the mean spectrum intensity. Averaged spectra with total intensity less than the average total intensity of all 127 spectra minus twice the standard deviation (locations 77, 82, 88, and 101) were removed as inferior quality, probably due to poor coupling with the sample, perhaps because of a microcrack or small inclusion. All Ar peaks were masked from the spectra. In the work that follows, location 90 consistently stands out as an outlier. Its total intensity is higher than the threshold but lower than most other spectra. It is the low intensity that makes this spectrum an outlier.
Rather than using one univariate plot of LIBS intensities against distance from core to rim for each element of interest, this study applies Principal Component Analysis (PCA), a multivariate technique that discerns the latent relationships between variables (intensities for each wavelength, in this case) [
22,
36,
37,
38]. The advantage of this approach is two-fold. First, because all elements present above detection limits are theoretically represented in the LIBS spectra, PCA identifies the elements that are important in the zoning patterns. This differs from the traditional method because the suite of elements to be analyzed is not chosen prior to analysis; PCA allows the sample’s composition, rather than pre-selected input variables, to inform the model. Second, multivariate analysis, in which all elements are considered simultaneously, is advantageous for understanding tourmaline’s complex composition. PCA models were calculated using the software The Unscrambler X 10.4 by CAMO Software, now owned by Aspen Technology. The Singular Value Decomposition algorithm was used; the data were mean-centered.
In PCA, all data are plotted in n-dimensional space, where n is the number of variables in the data set (23,619 in this study after masking Ar peaks). Linear regressions, called principal components (PCs) or eigenvectors, are calculated through the data cloud. These are new, derived variables that are linear combinations of the original variables. The first PC, PC 1, contains the maximum variance of the data set and represents the most significant information. Each subsequent PC is calculated in the direction perpendicular to all prior PC and contains the next highest variance in the data set.
Two types of diagrams are commonly used to visualize PCA models. Score plots graph the position, or score, of each spectrum along the PC. In this paper, score plots of PC 1 vs. PC 2 are used, as they display the majority of the variance in the data set. In many cases, variation along PC 1 is sufficient to understand the major changes in tourmaline composition. Score plots are interpreted in the same manner as any bivariate compositional plot; samples close to each other are compositionally similar, and those far from each other are compositionally distinct.
Loading plots illustrate the influence of each variable on the position of the PC in the data cloud and are used to visualize the compositional variations in the model. Plotted individually for each PC, loading plots show the relationship between each variable (wavelength) on the x-axis and its loading, or influence, on the y-axis. They resemble spectra but have peaks in both positive and negative directions. Elements with positive peaks indicate that the intensity of the peak, and thus, the concentration of the element increases along the positive direction of the PC. Conversely, elements with peaks in the negative direction will increase in intensity/concentration along with the negative direction of the PC. Elements with loading values near 0 are not compositionally important along the PC. In this study, all loading peaks with values greater than 5% of the maximum loading value for the PC in question were identified using the NIST Atomic Spectra Database [
39] and used to interpret the zoning patterns. Peaks with smaller loadings were mostly low-intensity peaks of the elements already identified among the peaks with higher loadings.
VanDusen [
33] compared the LIBS spectra used in this paper to EPMA concentrations acquired in a traverse parallel to the LIBS traverse, 2.5 mm away from the LIBS analyses. Spacing between analyses was 400 µm, to generate an EPMA data set as similar to the LIBS data set as possible. LIBS spectra were not calibrated to the EPMA concentrations because the two sets of analyses were not exactly co-located. An important finding in this work was that the LIBS intensities mimic the EPMA concentrations very closely. Thus, in this paper, we will refer to variations in elemental concentrations in the LIBS data even though we did not calibrate the LIBS data and directly determine concentrations. This is valid because the interpretations in the paper are based on the relative changes in the intensities/concentrations, not absolute concentrations.
Generative artificial intelligence (GenAI) has not been used in this paper.
3. Results
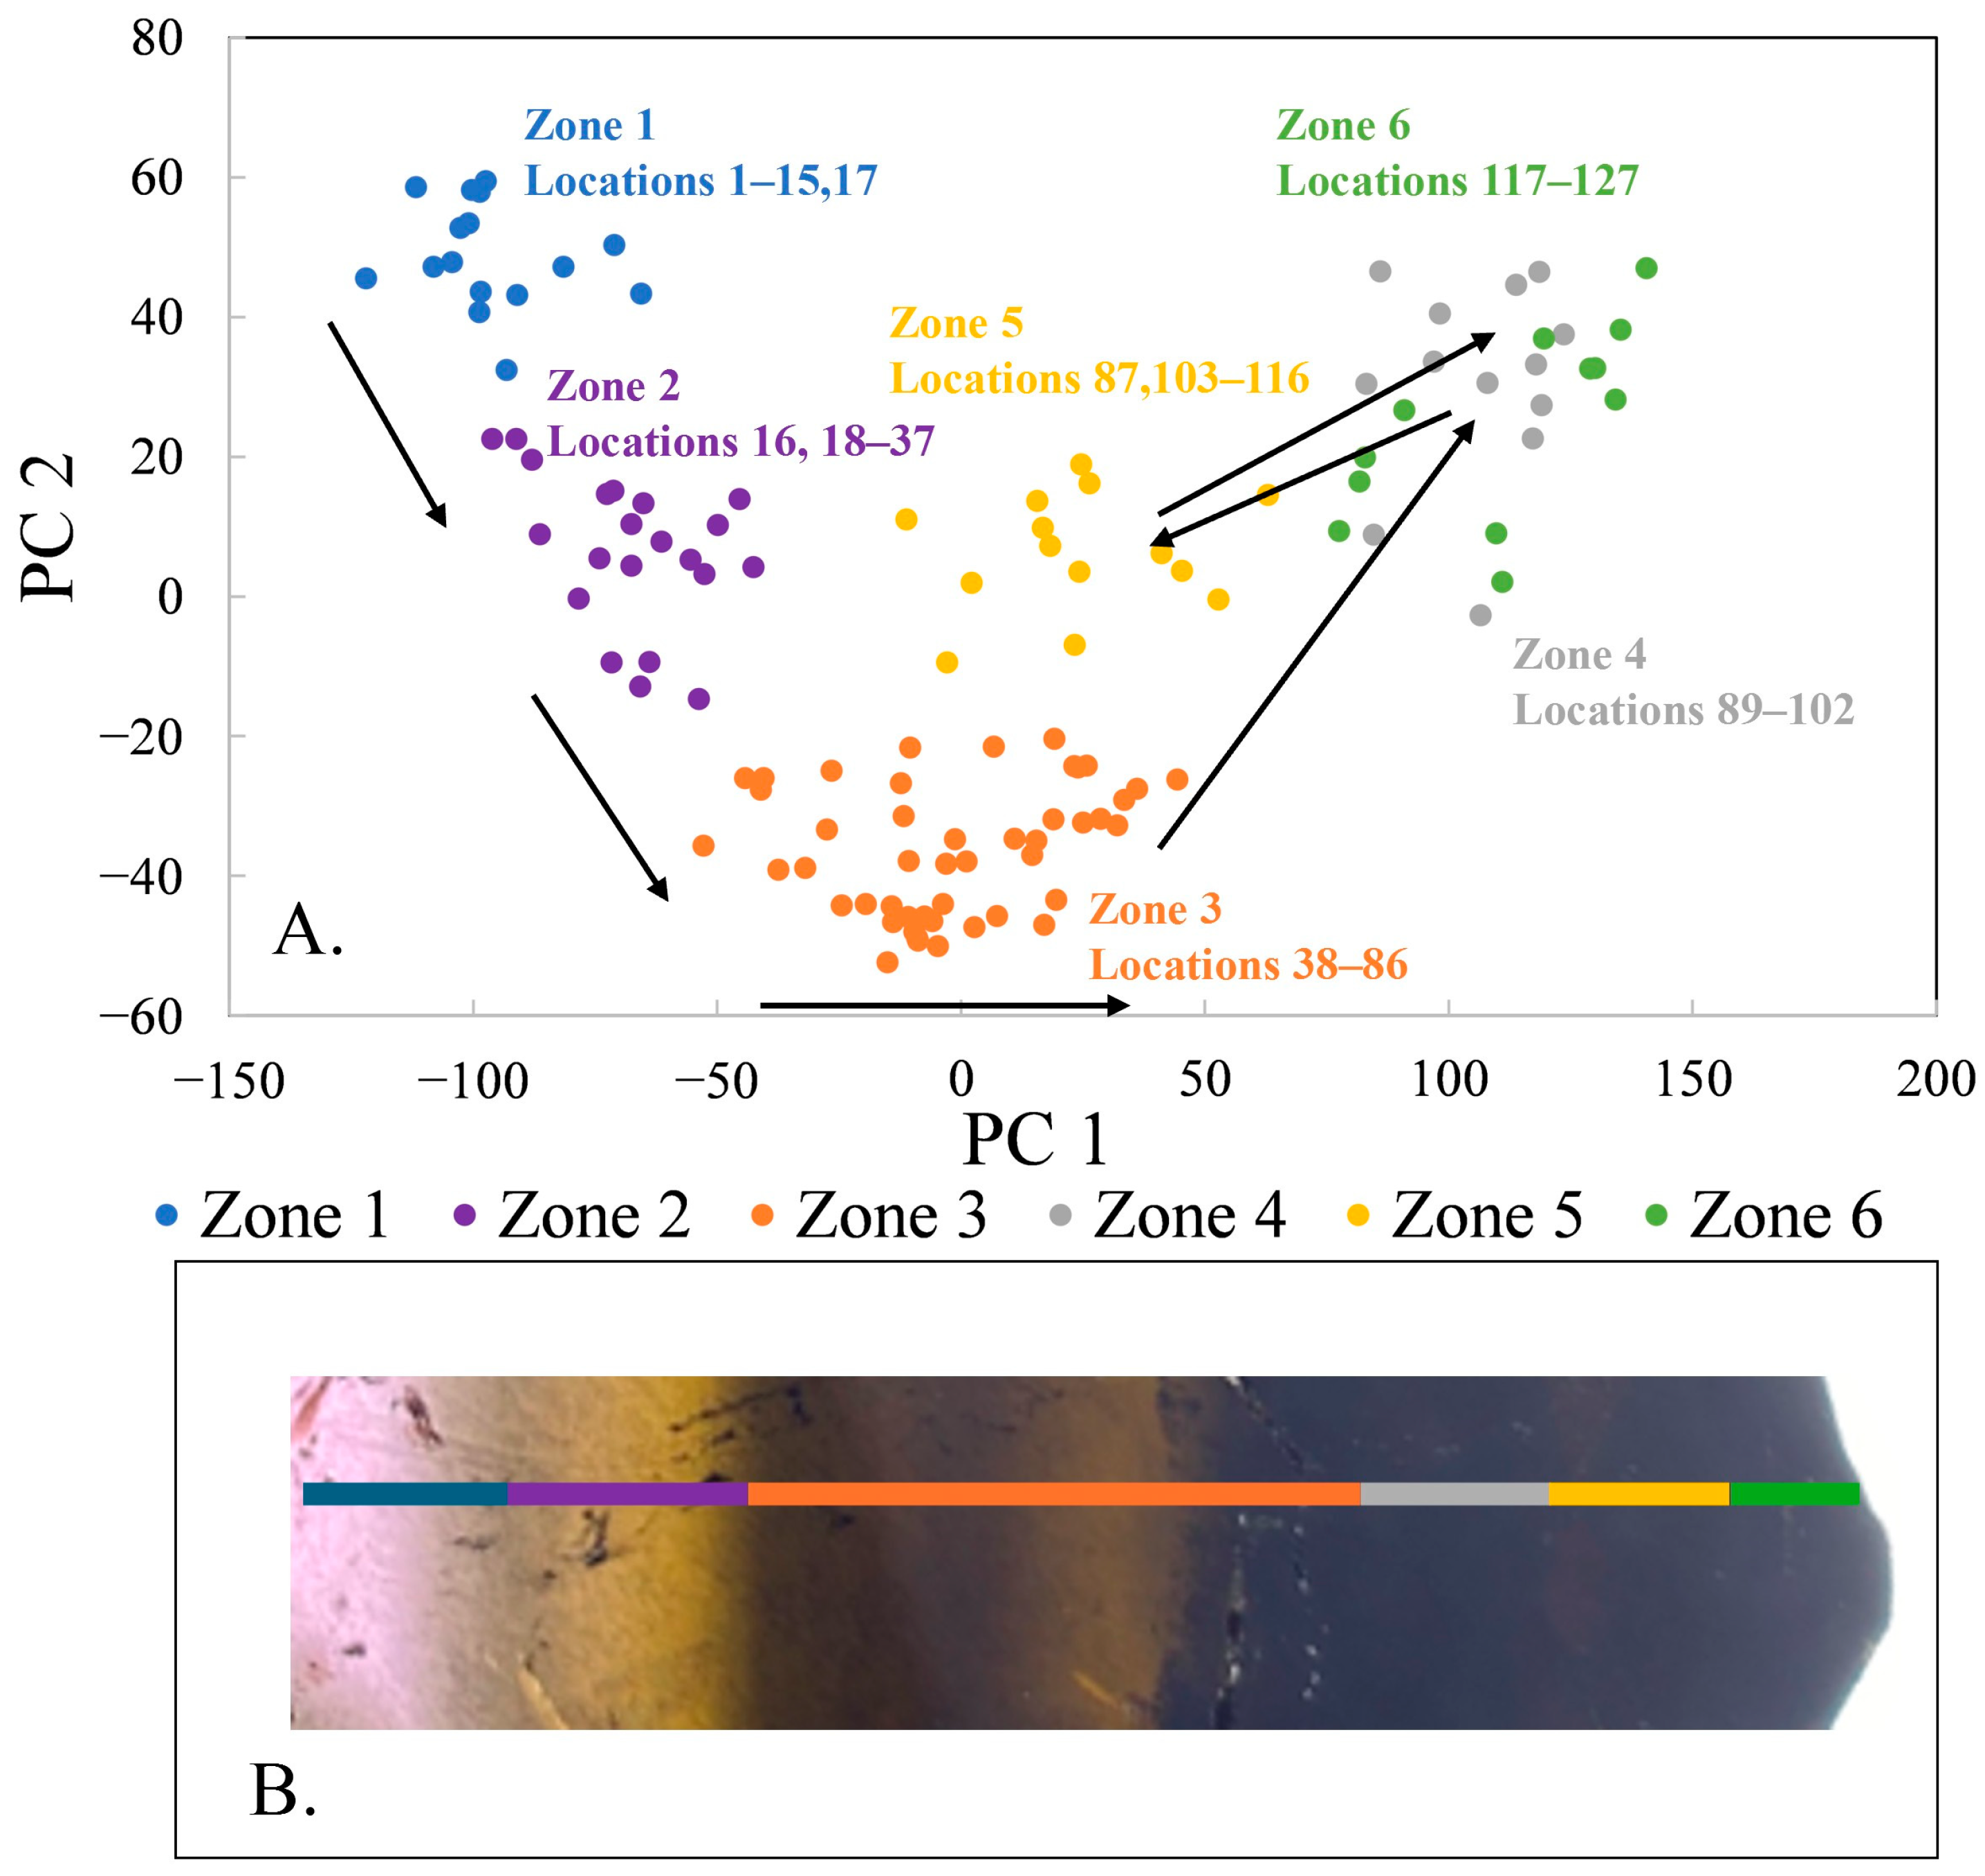
PCA of all 123 spectra reveals the presence of six zones (
Figure 2), separated in PC 1-PC 2 space. The locations that yielded spectra in each zone are listed on the figure; the zones are distinct with very little overlap or oscillation between subsequent zones. For instance, location 16 fits better with zone 2 than zone 1 and location 87 fits better with zone 5 than zones 3 or 4. Other than those spectra, the zones are defined by sequential locations along the traverse. Furthermore, all zones except zone 3 show little, if any, regular change in composition along the traverse. The elements Ca, Mn, Al, Si, Mg, Na, Li, Fe, Ti, and Sr have the highest loadings for PC 1 and PC 2 and are the most important elements in the zoning in this specimen. This broad-brush PCA model is useful to define the zones. What follows are PCA models for each pair of consecutive zones, as well as one for zone 3; these models constrain changes in composition of fluids in the pocket through time as the tourmaline crystallized.
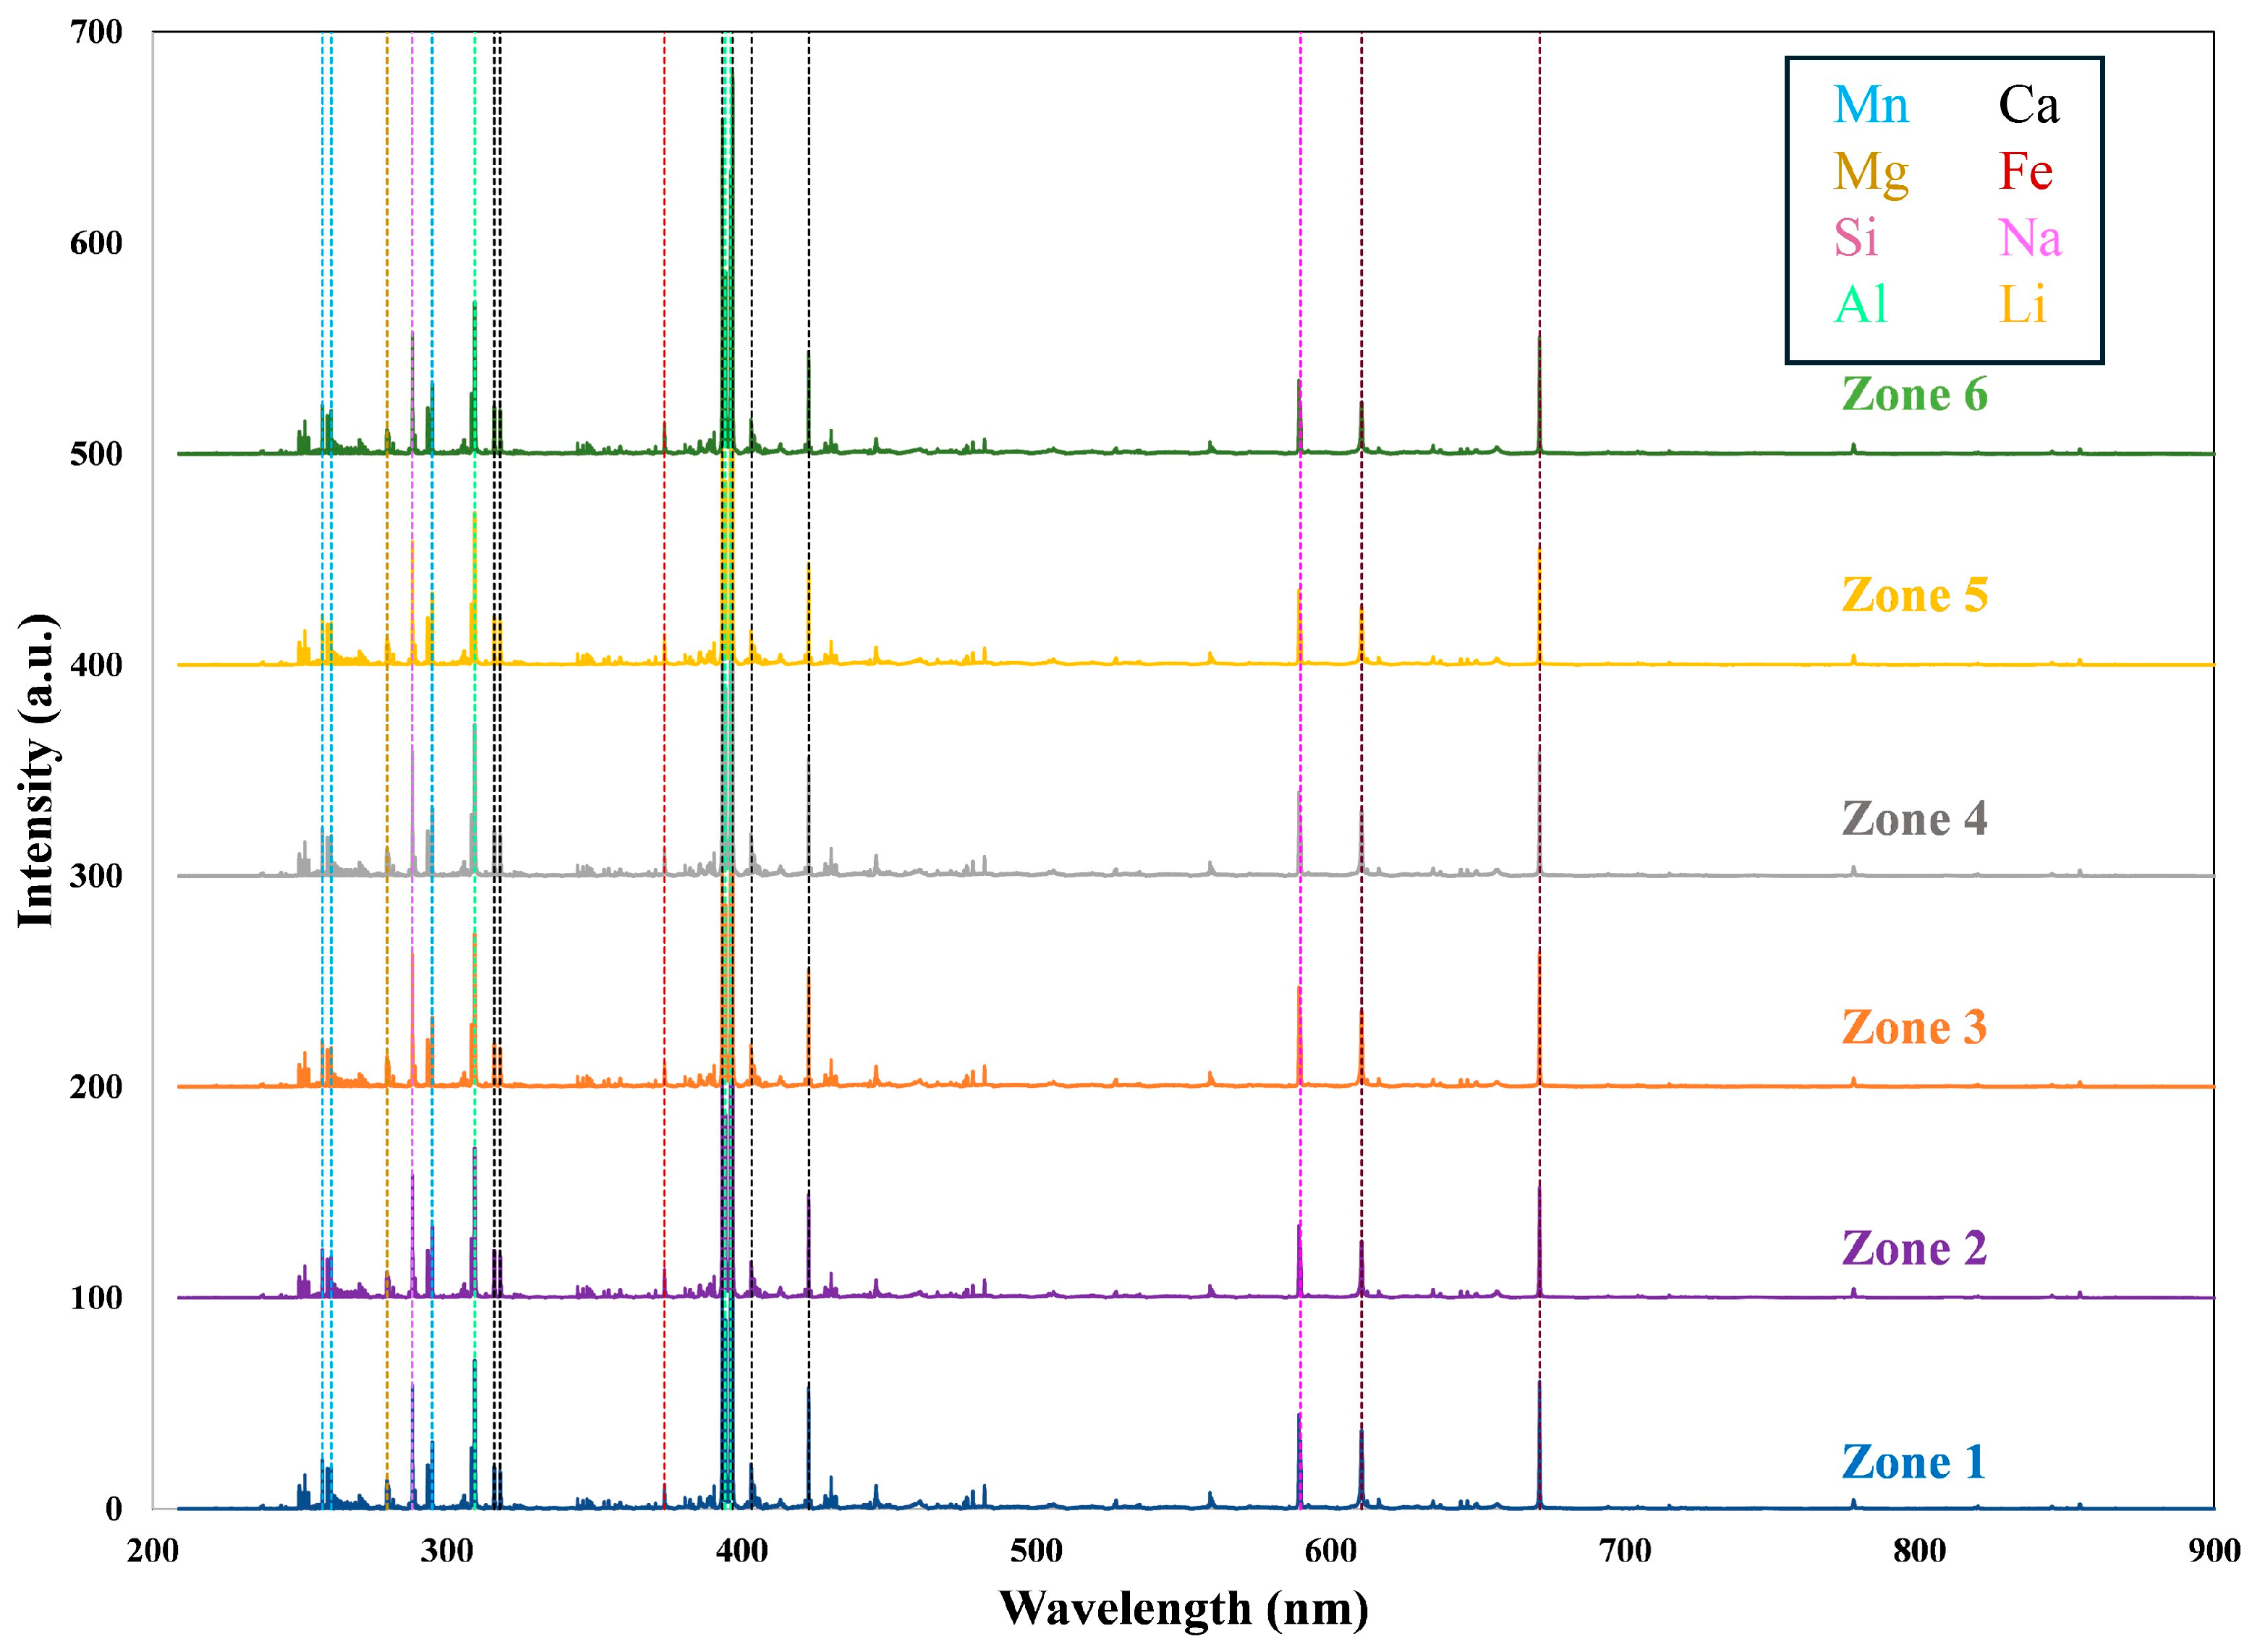
Representative spectra from the approximate middle of each zone are shown in
Figure 3. Ca and Li emission lines are significant, consistent with the liddicoatite composition of this tourmaline. Mn, Al, and Mg are also significant peaks. Although the spectra look quite similar through visual inspection, multivariate analysis is able to define statistically valid differences between them.
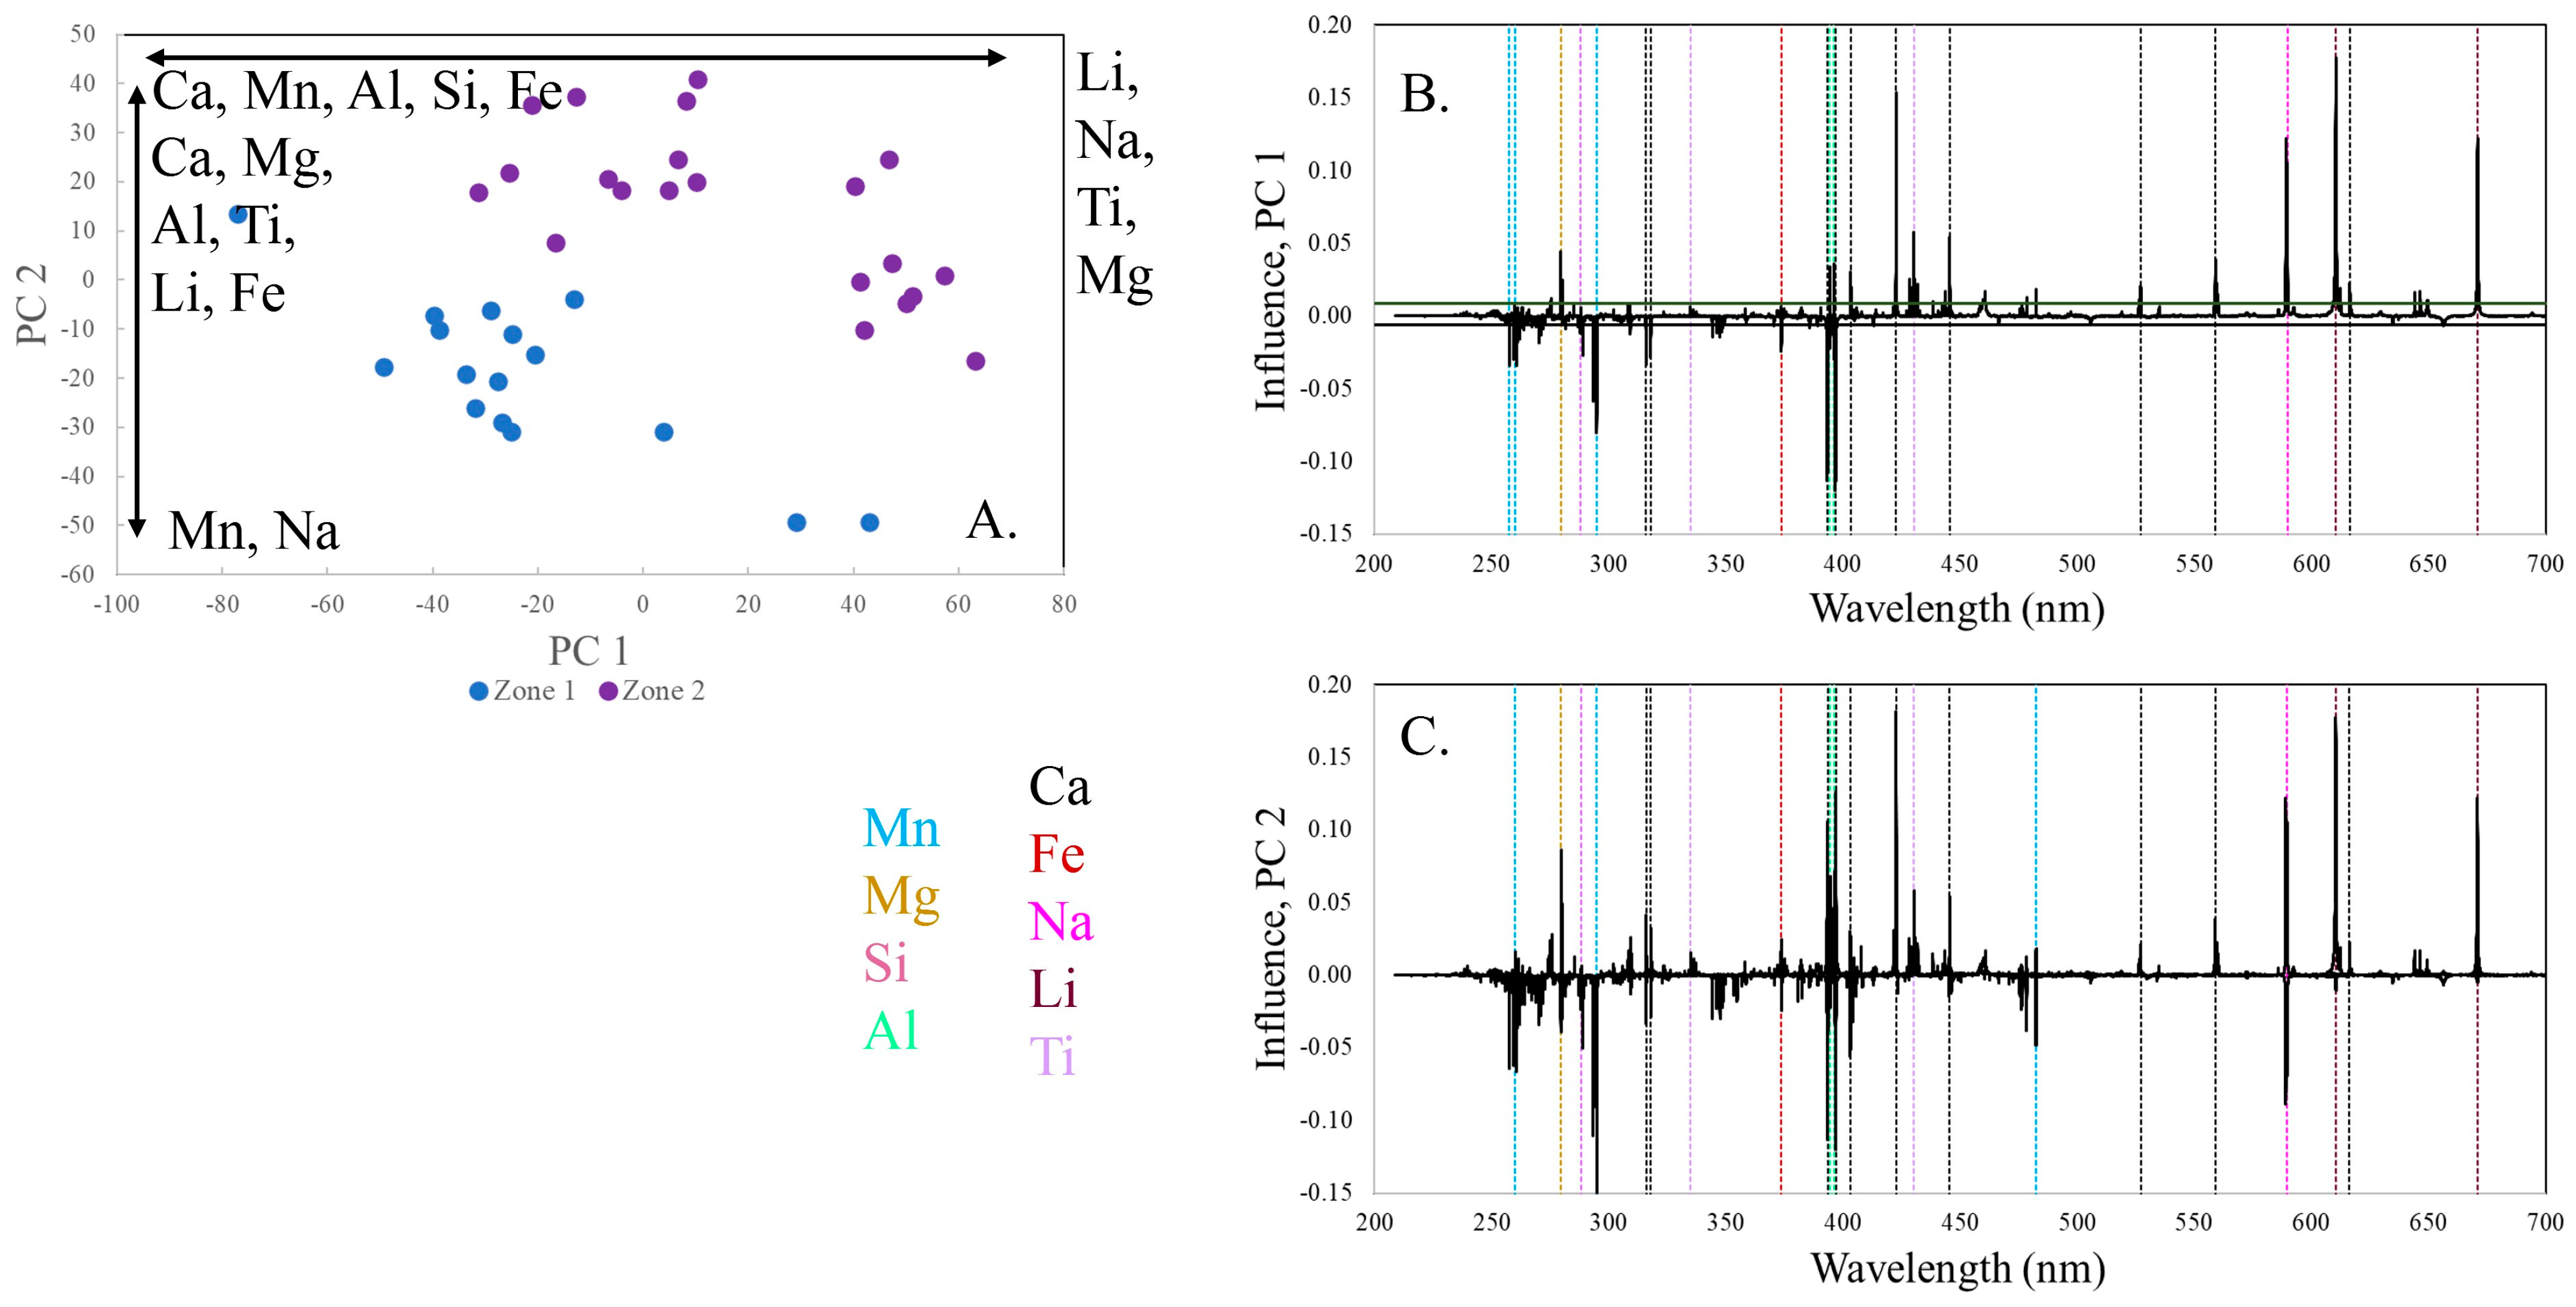
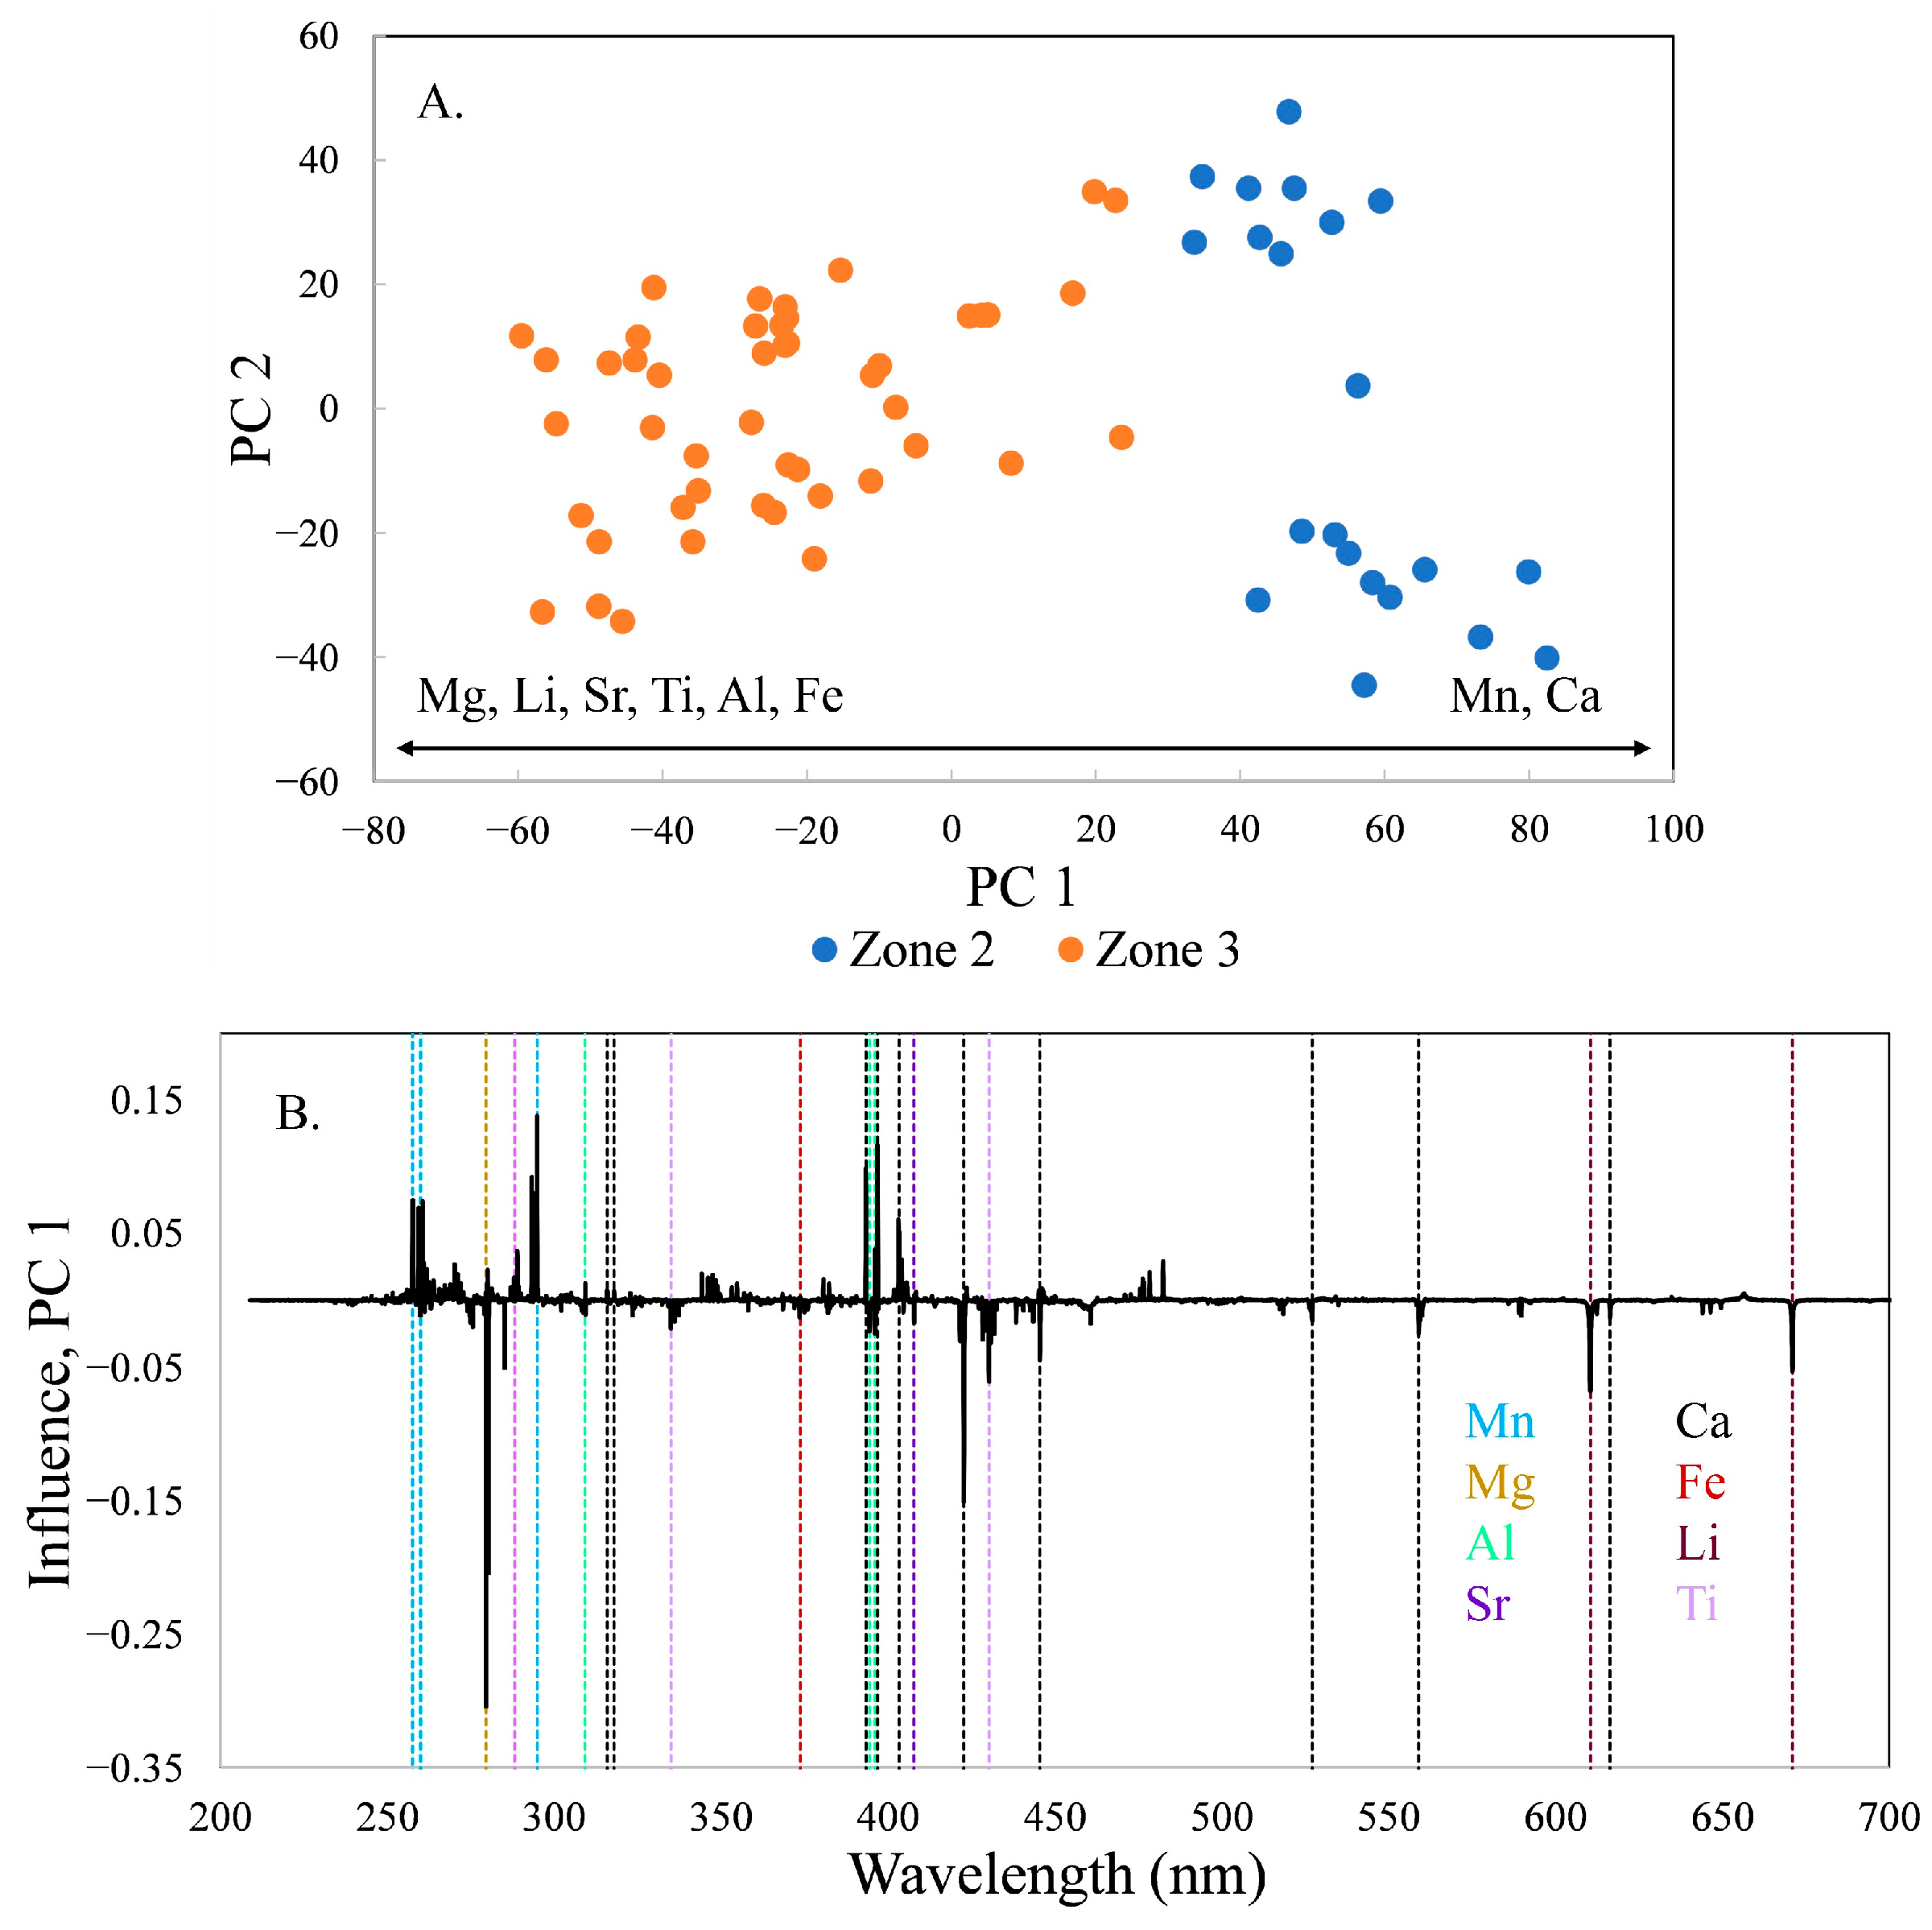
Zones 1 and 2 are distinctly different in composition on a PCA score plot (
Figure 4). PC 1 contains 54.5% of the variance in the data set and PC 2 contains 24.2%. Zone 2 plots at higher values of PC 1 and PC 2, towards the upper right corner of the plot, indicating that zone 2 has higher concentrations of Li, Ca, Na, Mg, Al, Fe, and Ti than zone 1, which has higher concentrations of Mn. In the loading plots for both PC1 and PC 2, Li has the highest loading and is thus the most influential on the location of the PCs in multivariate space.
The difference in composition between locations in zones 2 and 3 is primarily along PC 1, which contains 61.4% of the variance in the data set (
Figure 5). Mg is the most influential element, increasing in zone 3 with Li, Sr, Ti, Al, and Fe. Mn and Ca decrease from zone 2 to zone 3.
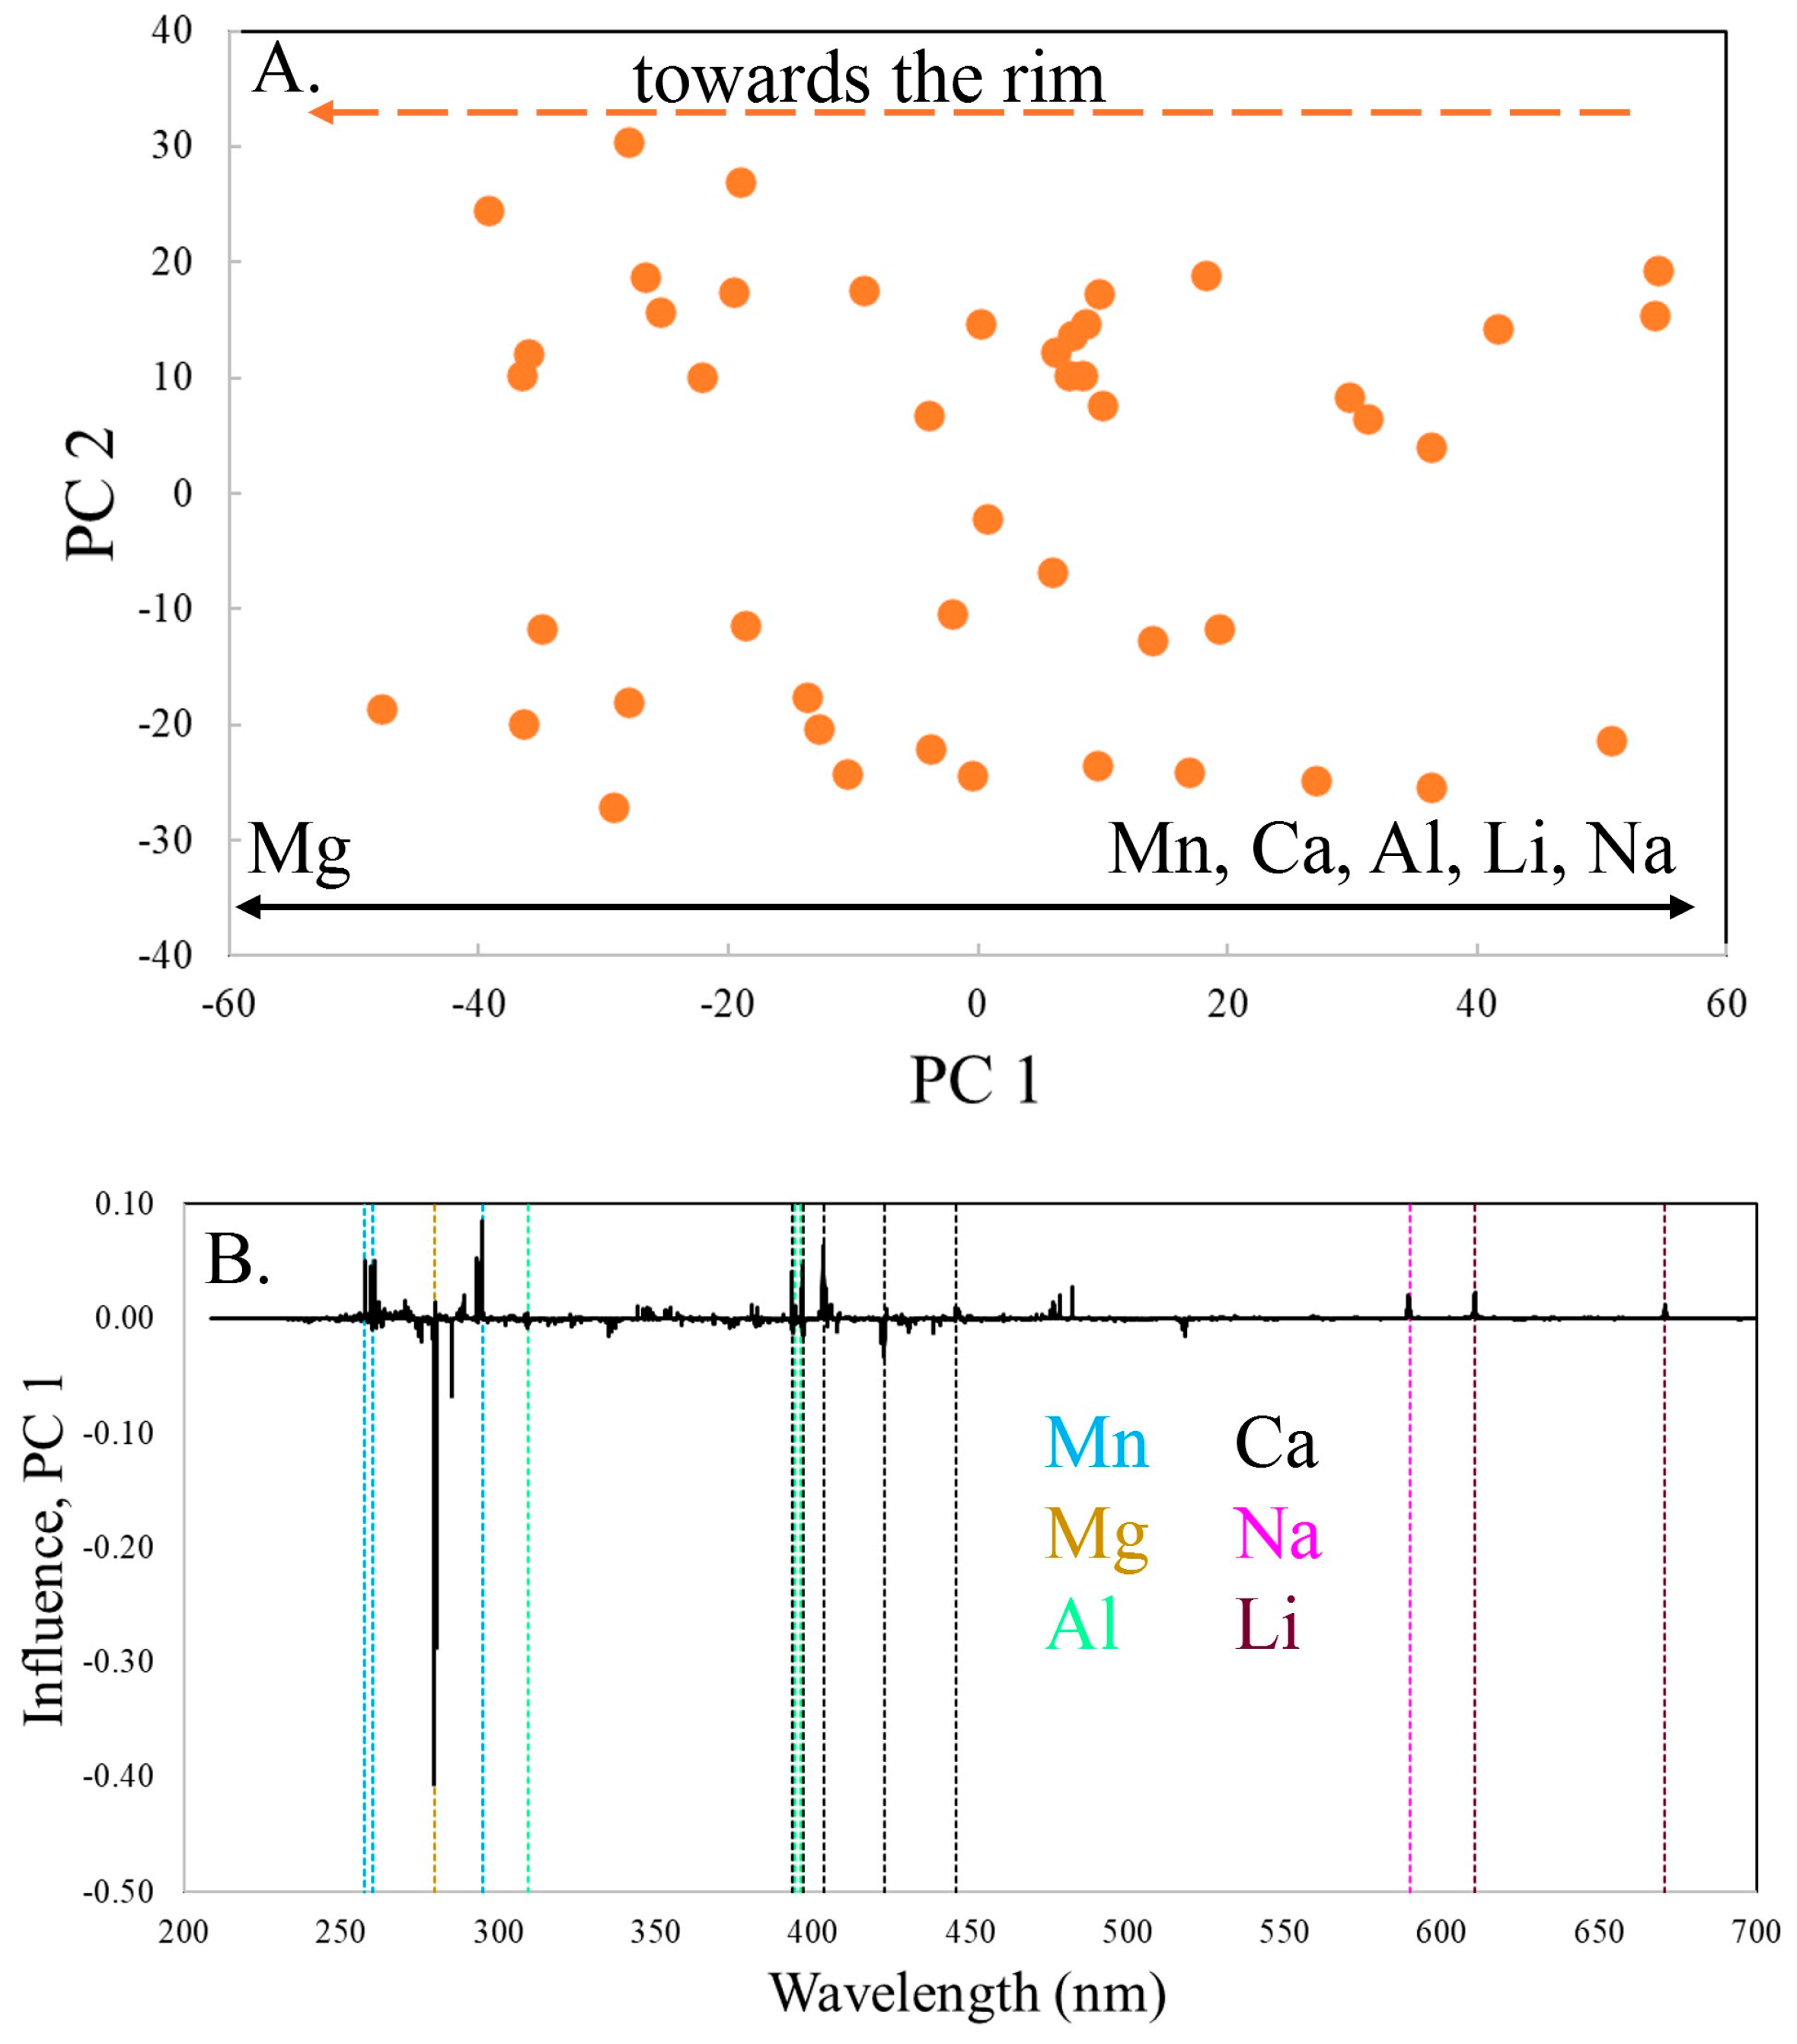
Zone 3 is unique in this specimen, as the composition gradually changes in a rimward direction (
Figure 6). The variability is primarily along PC 1, which contains 52.5% of the variance. The variation in composition between zones 1 and 2, with decreasing Mn ± Ca while other elements increase, changes in zone 3, with the tourmaline becoming distinctly more Mg-rich as Mn, Ca, Li, Al and Na all decrease. Mg is no longer coupled with other divalent ions (Ca, Fe, Sr) but now increases as they decrease. Mn continues to decrease as seen in zones 1 and 2.
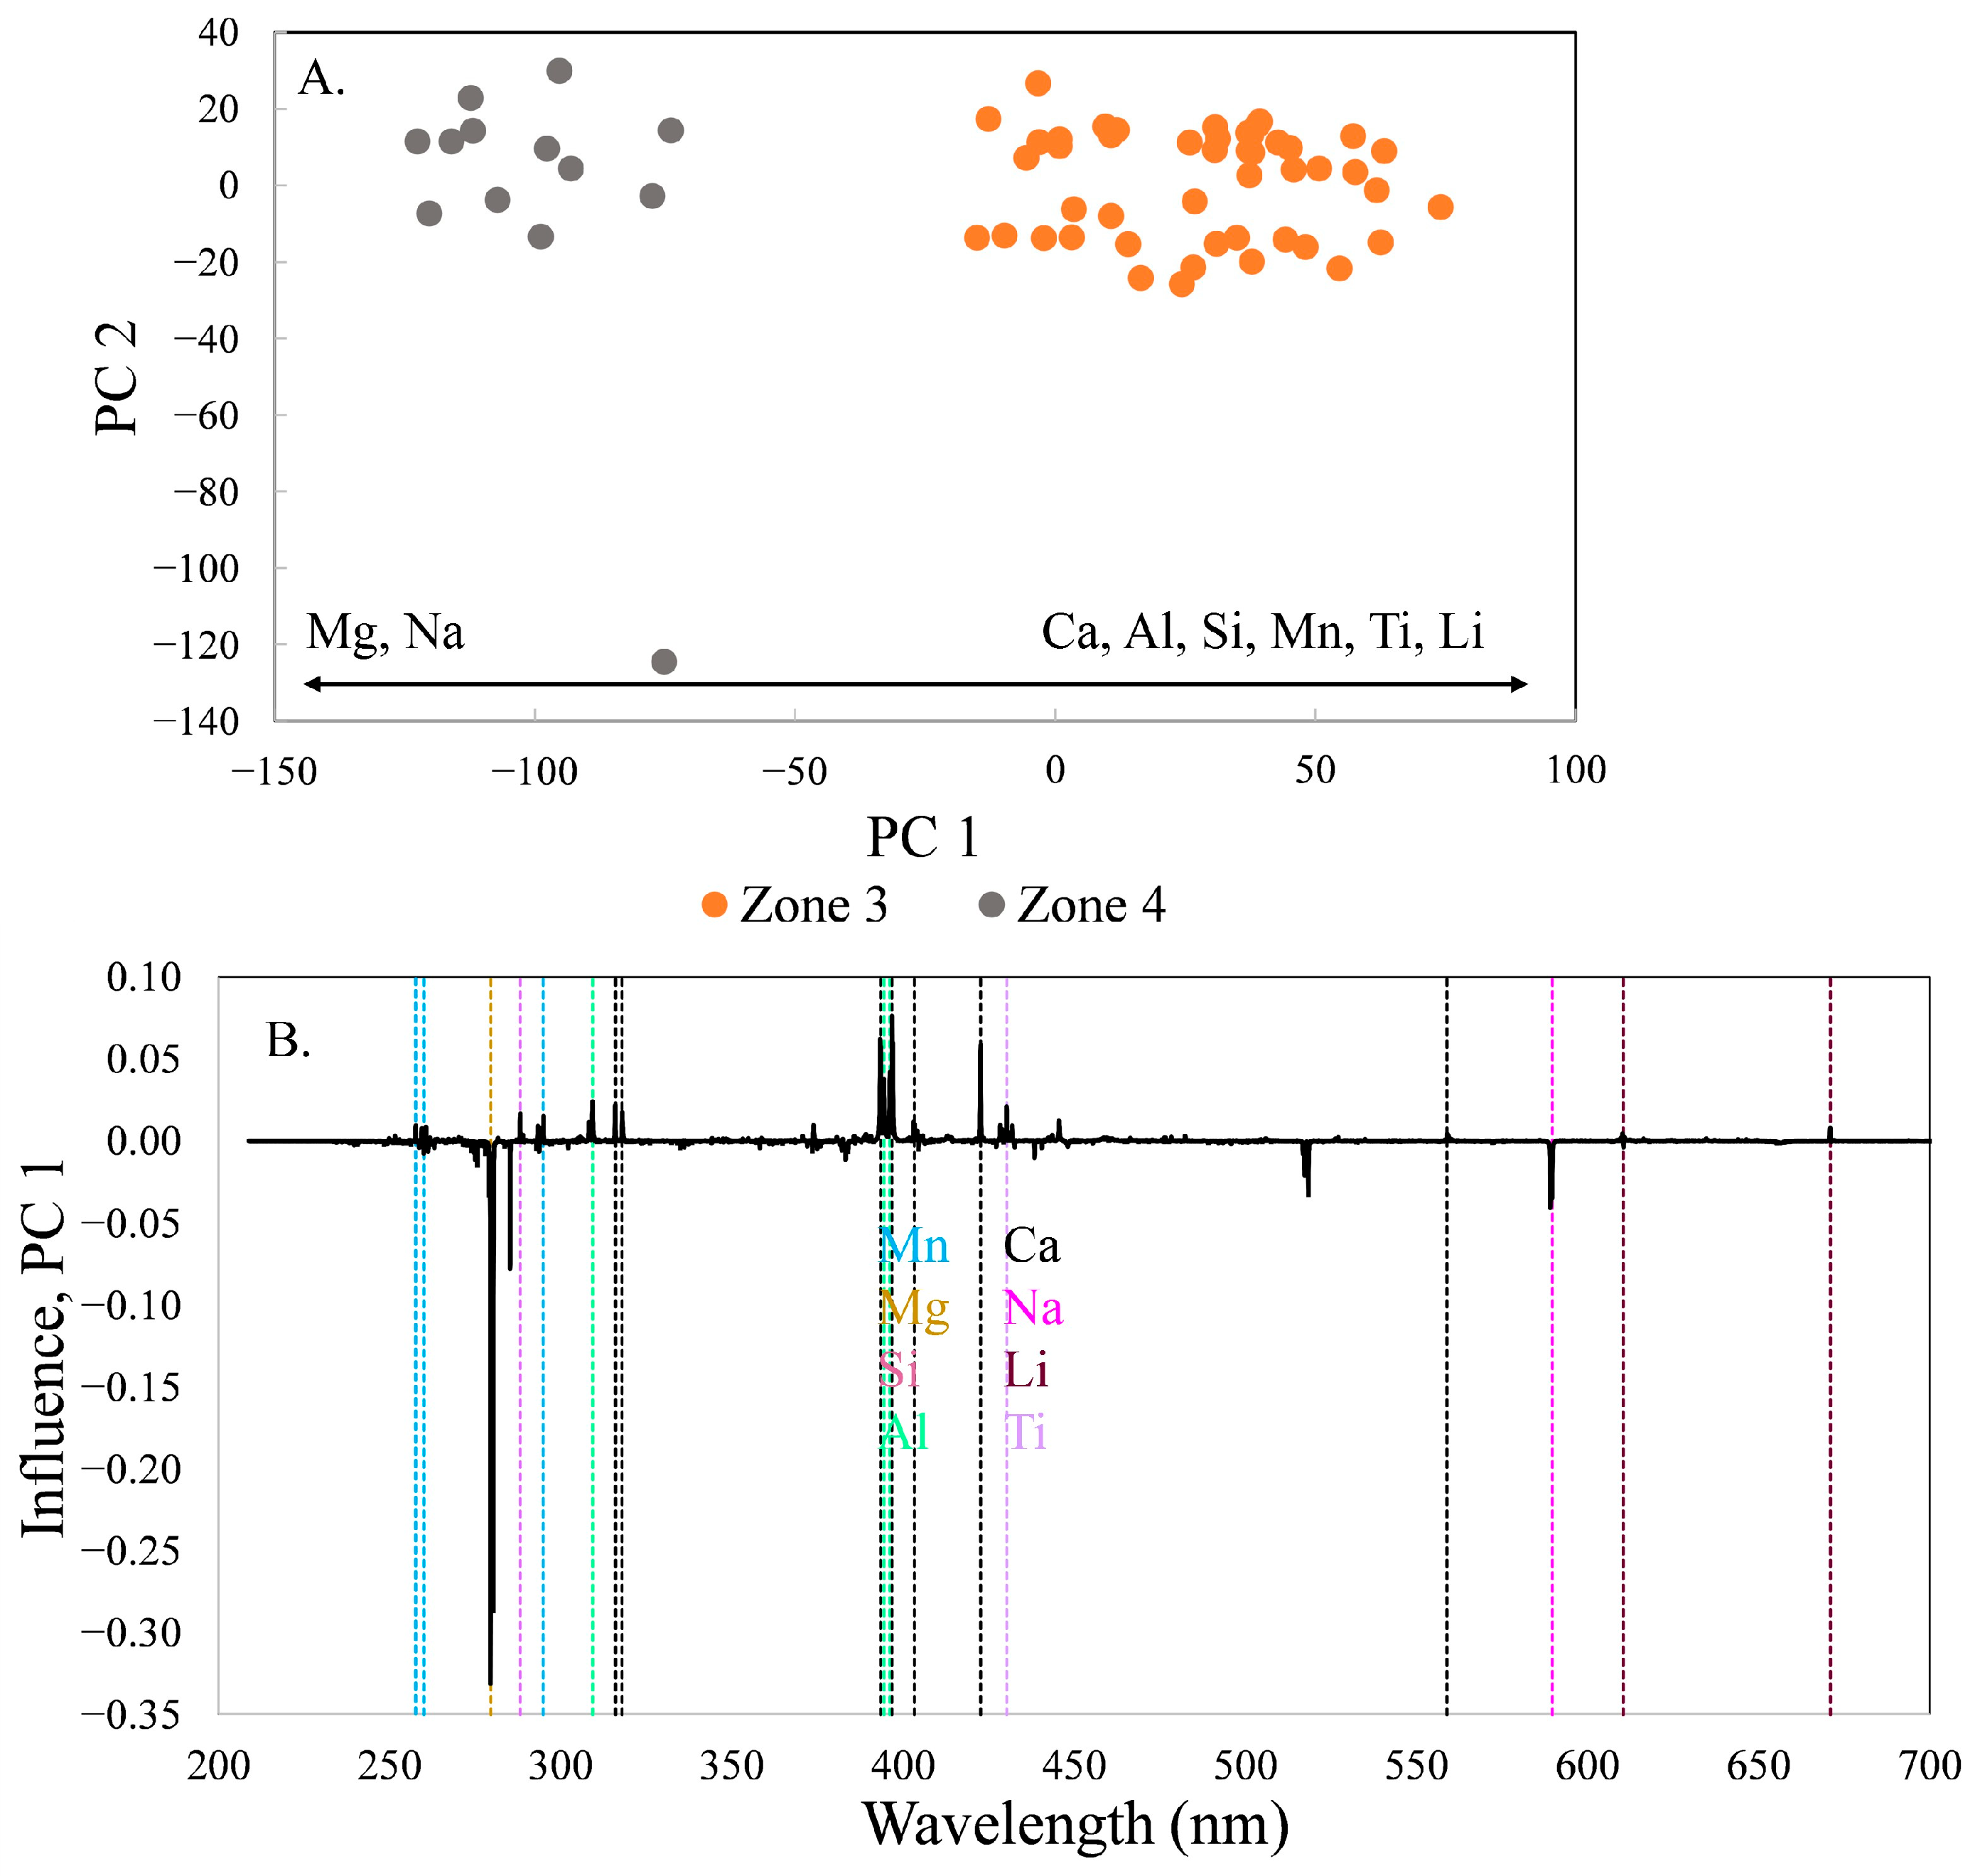
The trend of increasing Mg at the expense of Ca, Al, Si, Mn, Ti, and Li is observed in the comparison of zones 3 and 4 (
Figure 7), although Na is now correlated with Mg. The variability is primarily along PC 1, which contains 75.3% of the variance, except for location 90, in the lower part of the diagram. This spectrum has intensity higher than the threshold used to filter out low-intensity spectra, but still has intensity lower than the other spectra.
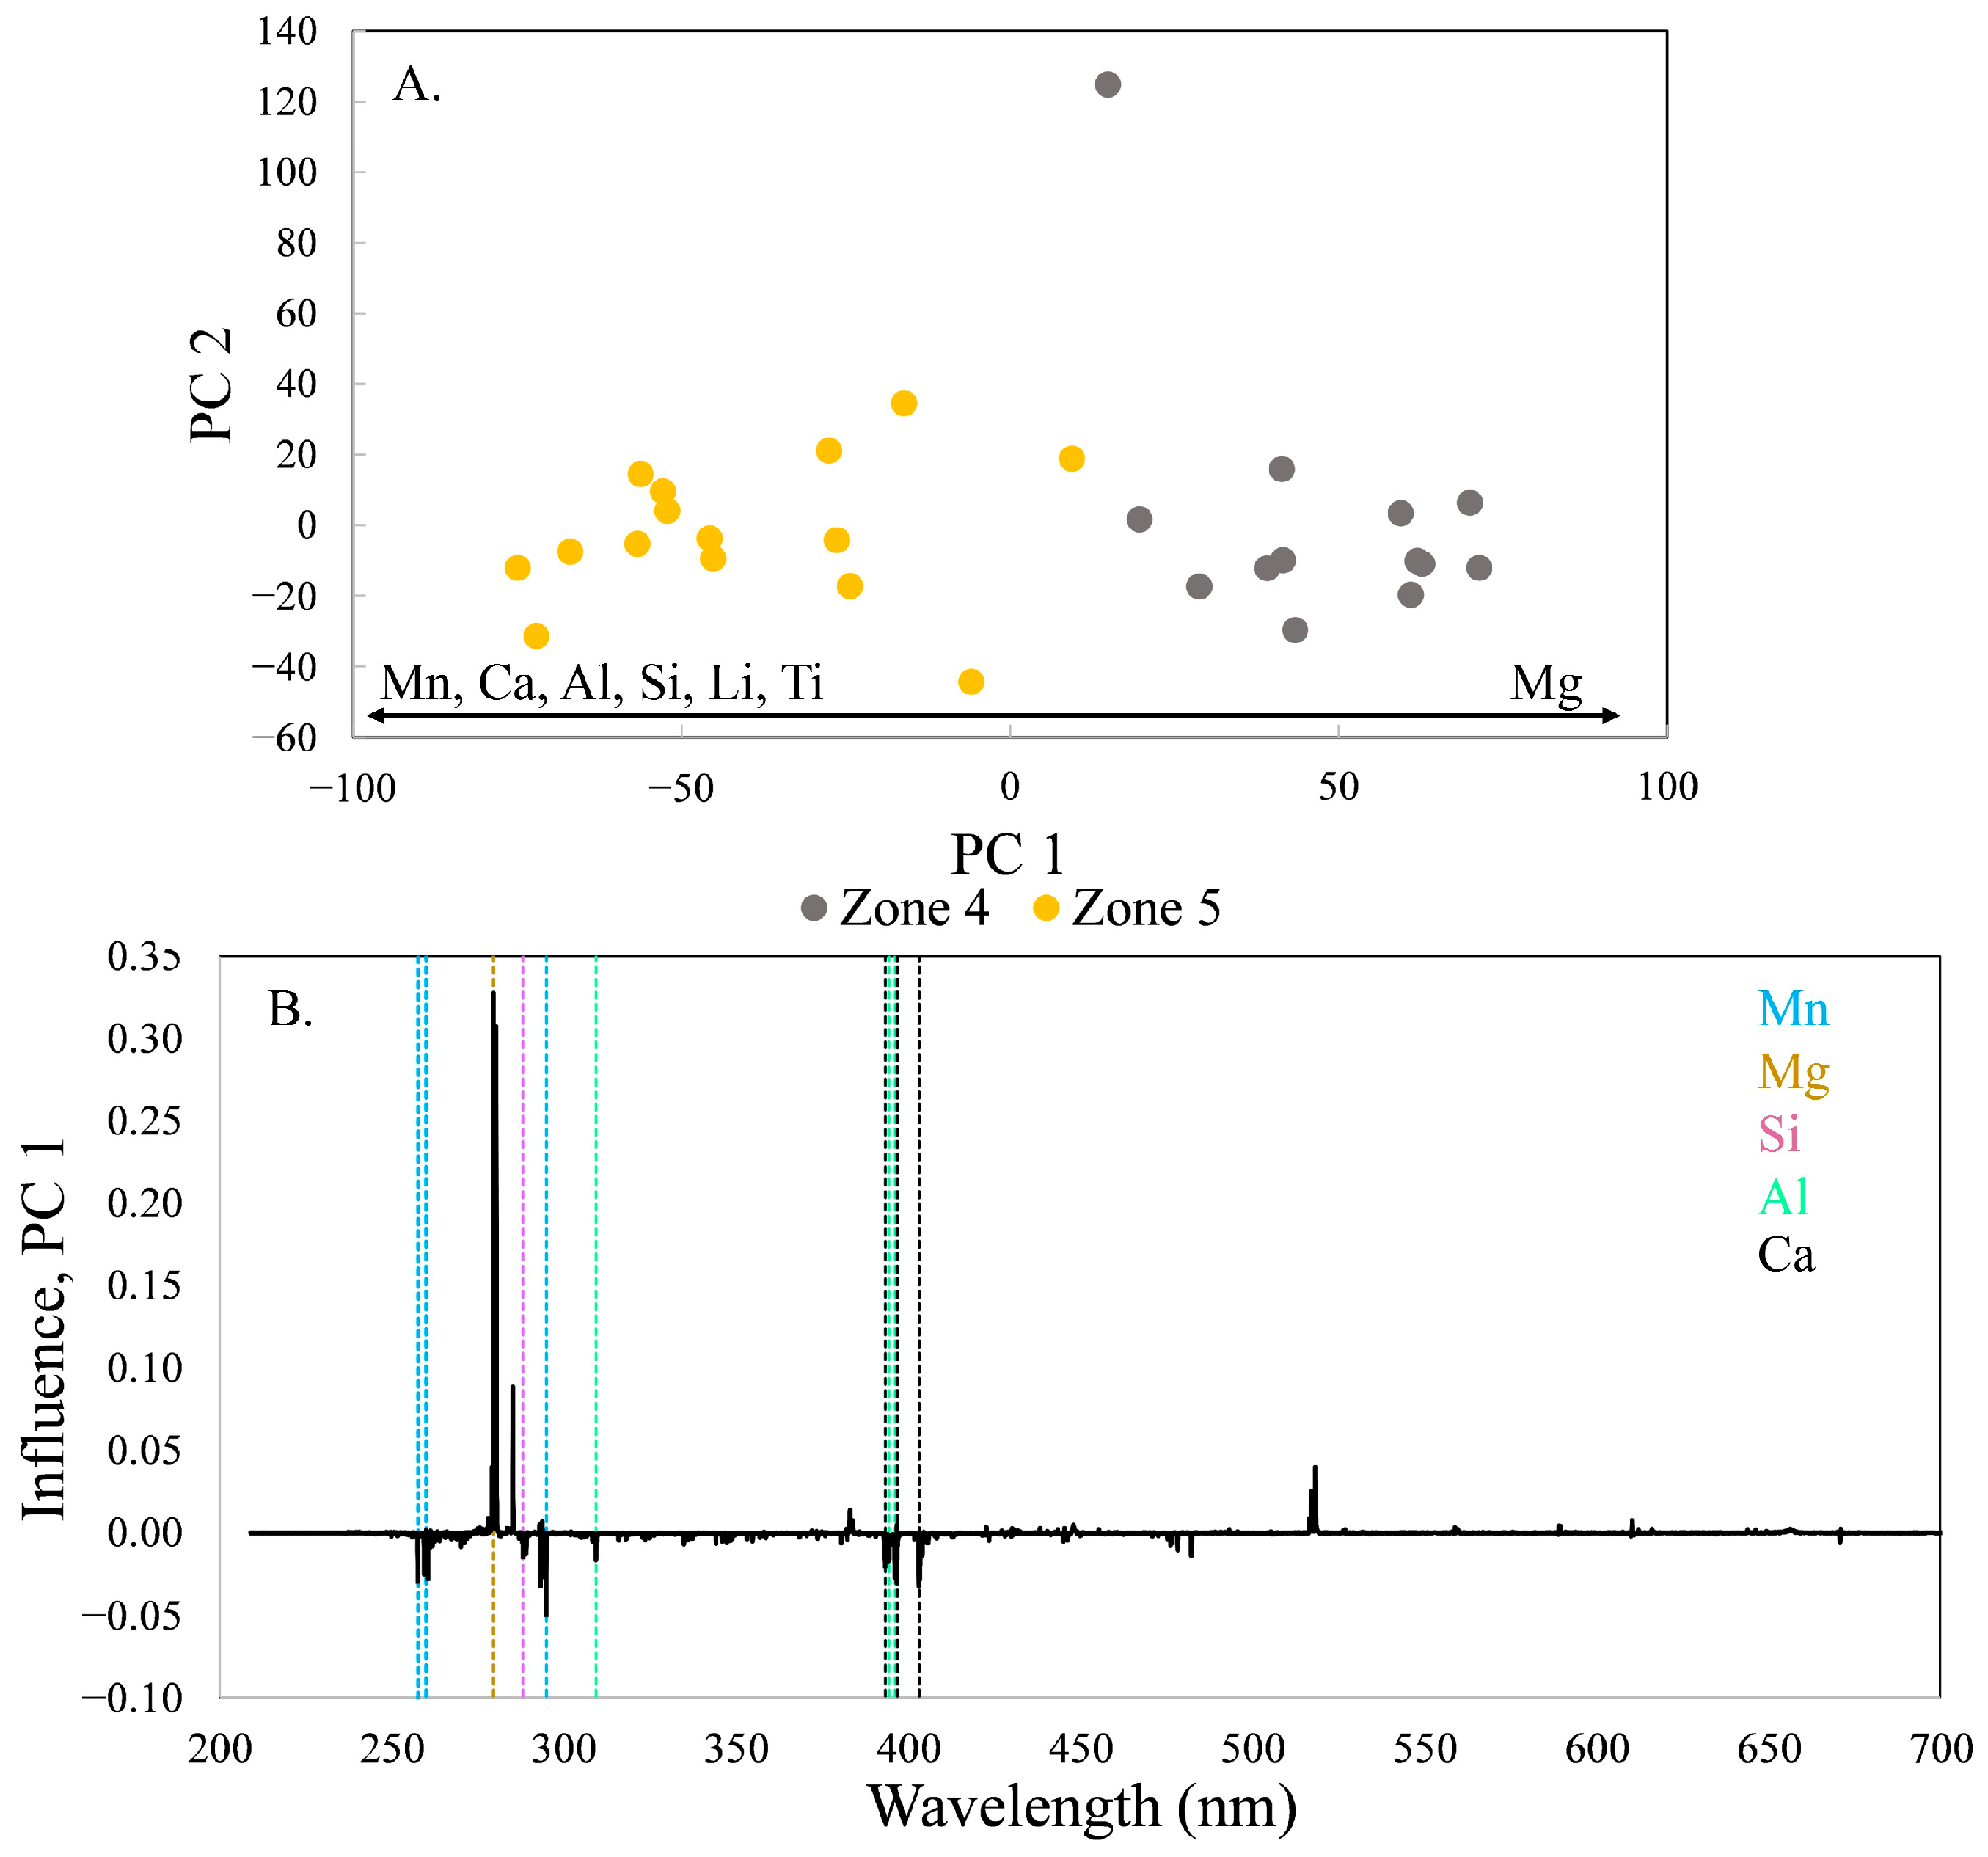
The tourmaline composition shifts distinctly between zones 4 and 5 (
Figure 8). The variation is primarily along PC 1, which contains 61.8% of the variance in the model. Again, location 90 is an outlier due to its low total intensity and plots in the upper part of the score plot. The trend of increasing Mg is reversed between zones 4 and 5; the tourmaline becomes more enriched in Mn, Ca, Al, Si, Li, and Ti and poorer in Mg during crystallization.
The final zone, number 6, is similar in composition to zone 4 (
Figure 2), revealing another reversal in composition. The variation is primarily along PC 1 (
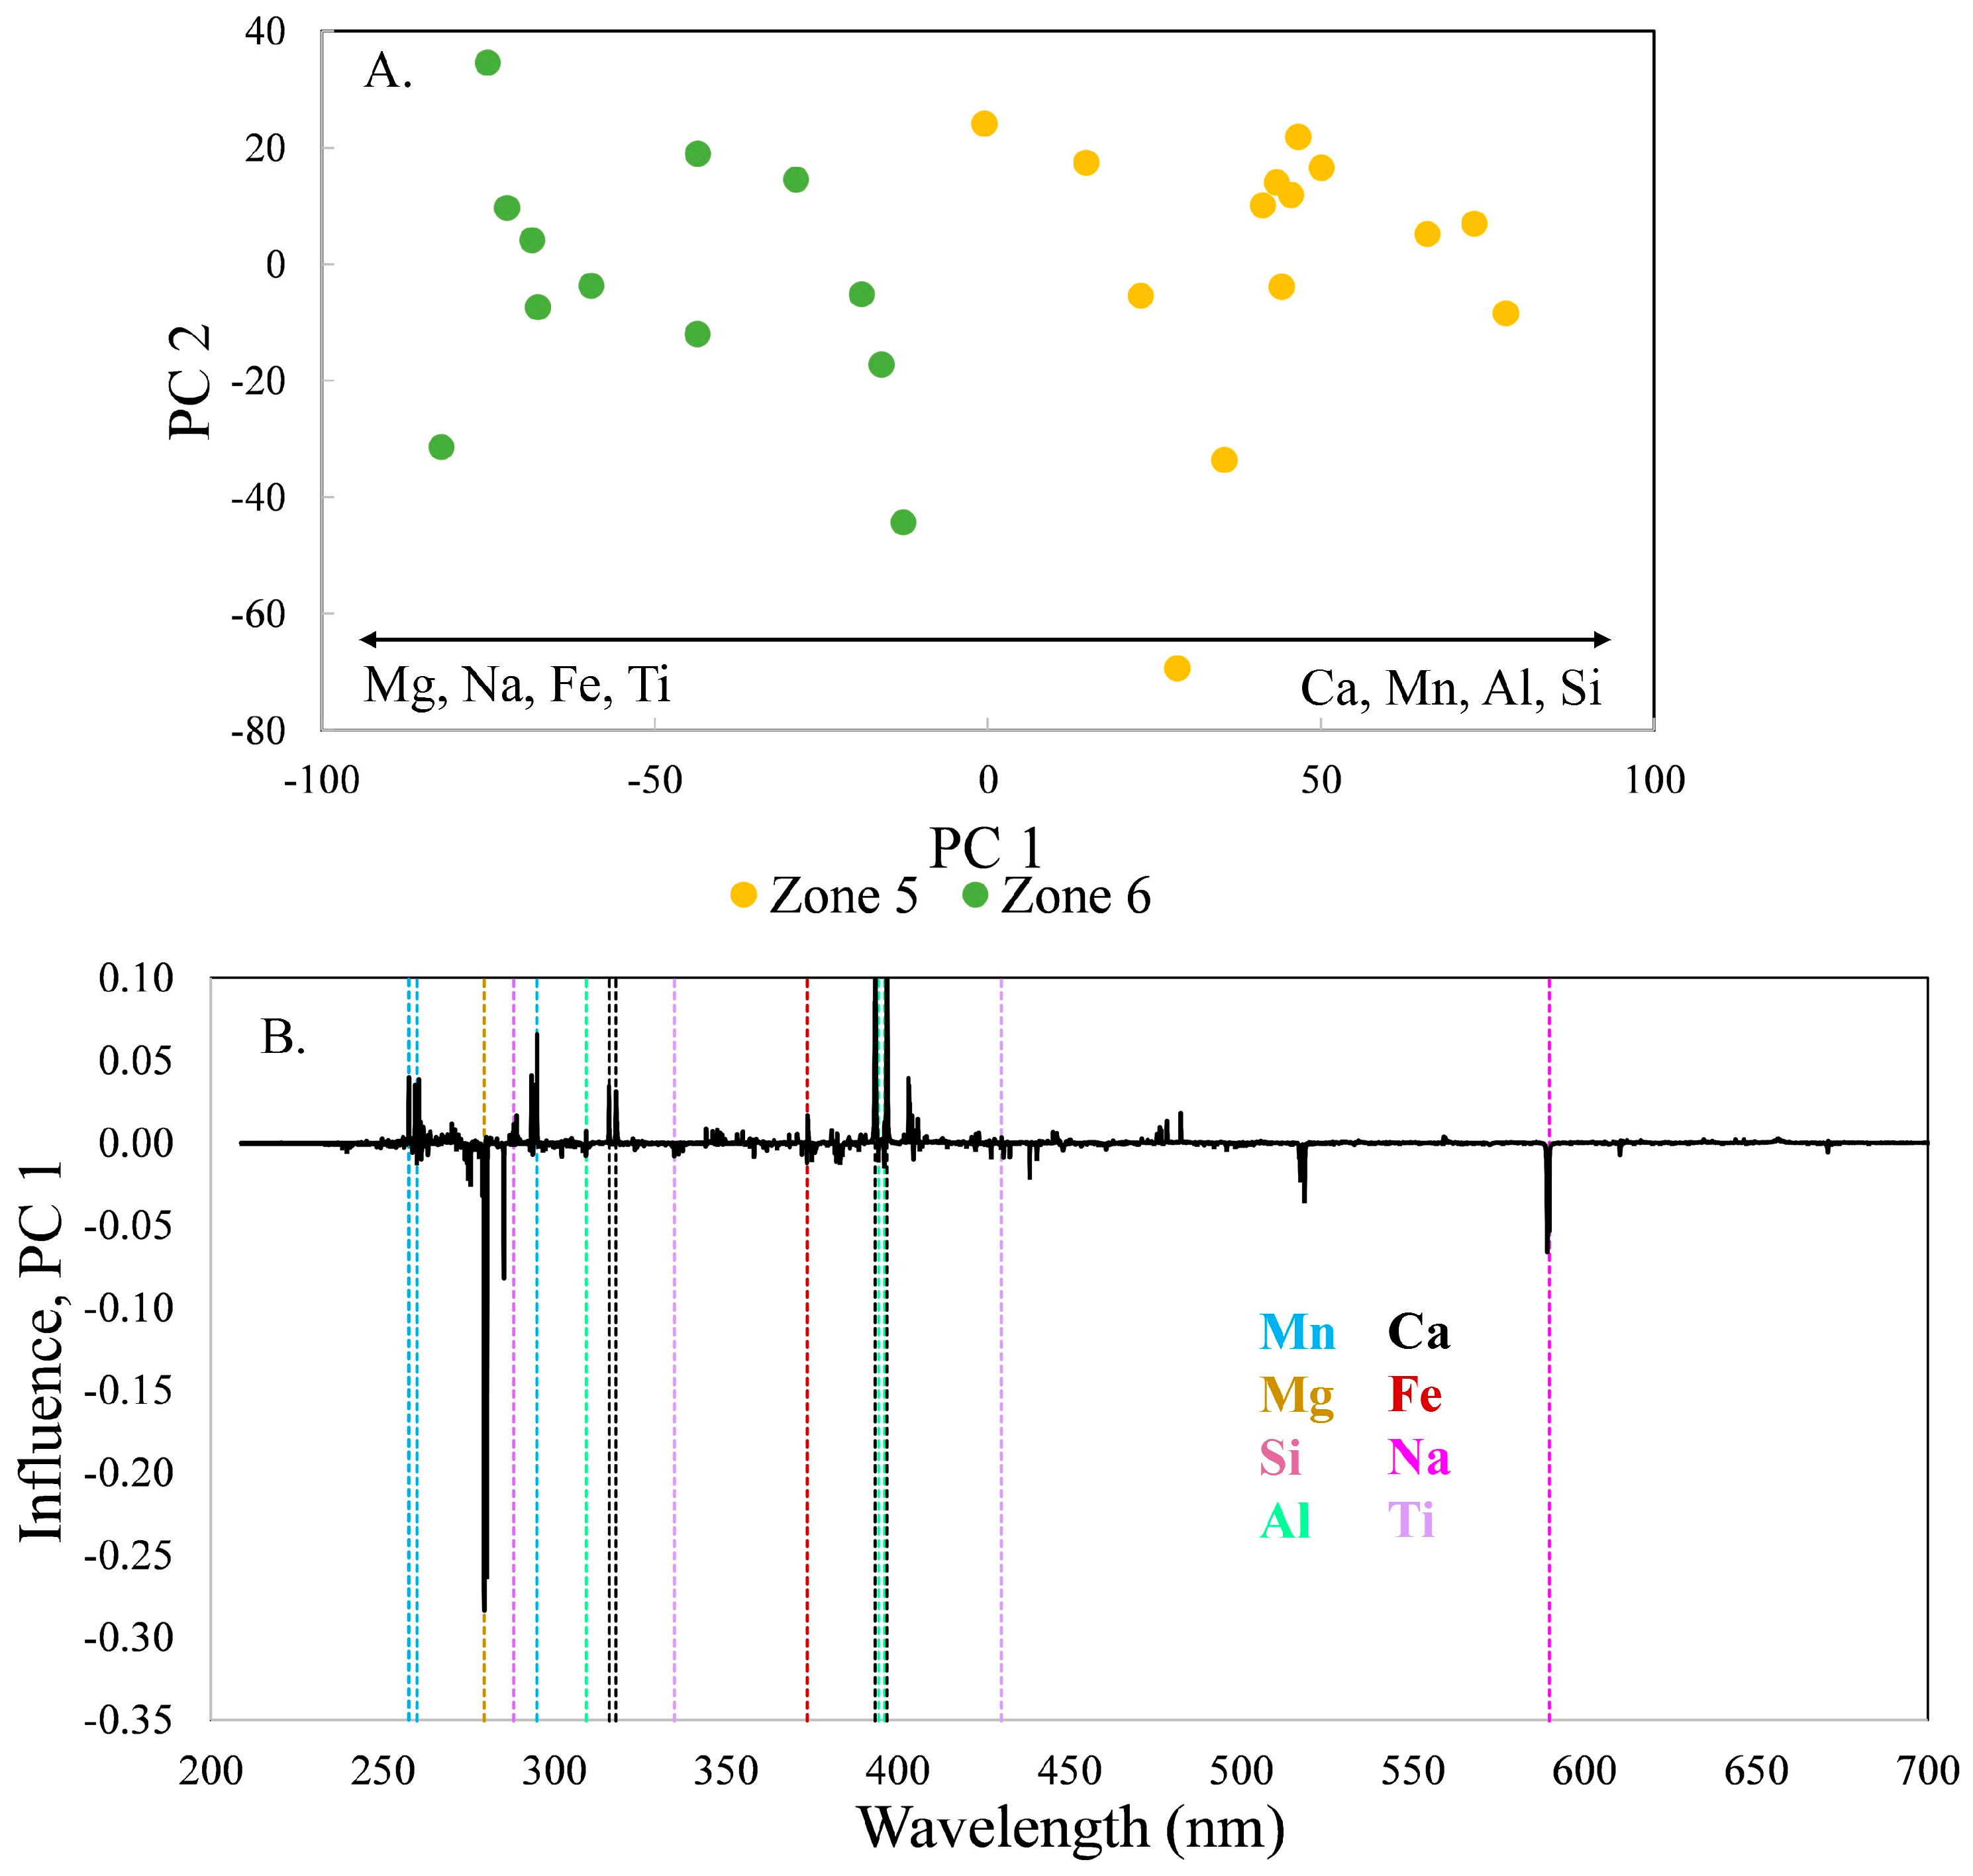
Figure 9), which contains 76.8% of the variance in the data set. During crystallization, the tourmaline became richer in Mg, Na, Fe, and Ti with decreasing Ca, Mn, Al, and Si, although Al does not have high loadings. This change is similar to the increasing Mg seen within zone 3 and between zones 3 and 4, except that increases in Mg are accompanied by increases in Na, Fe, and Ti.
In the PCA model using all 123 spectra (
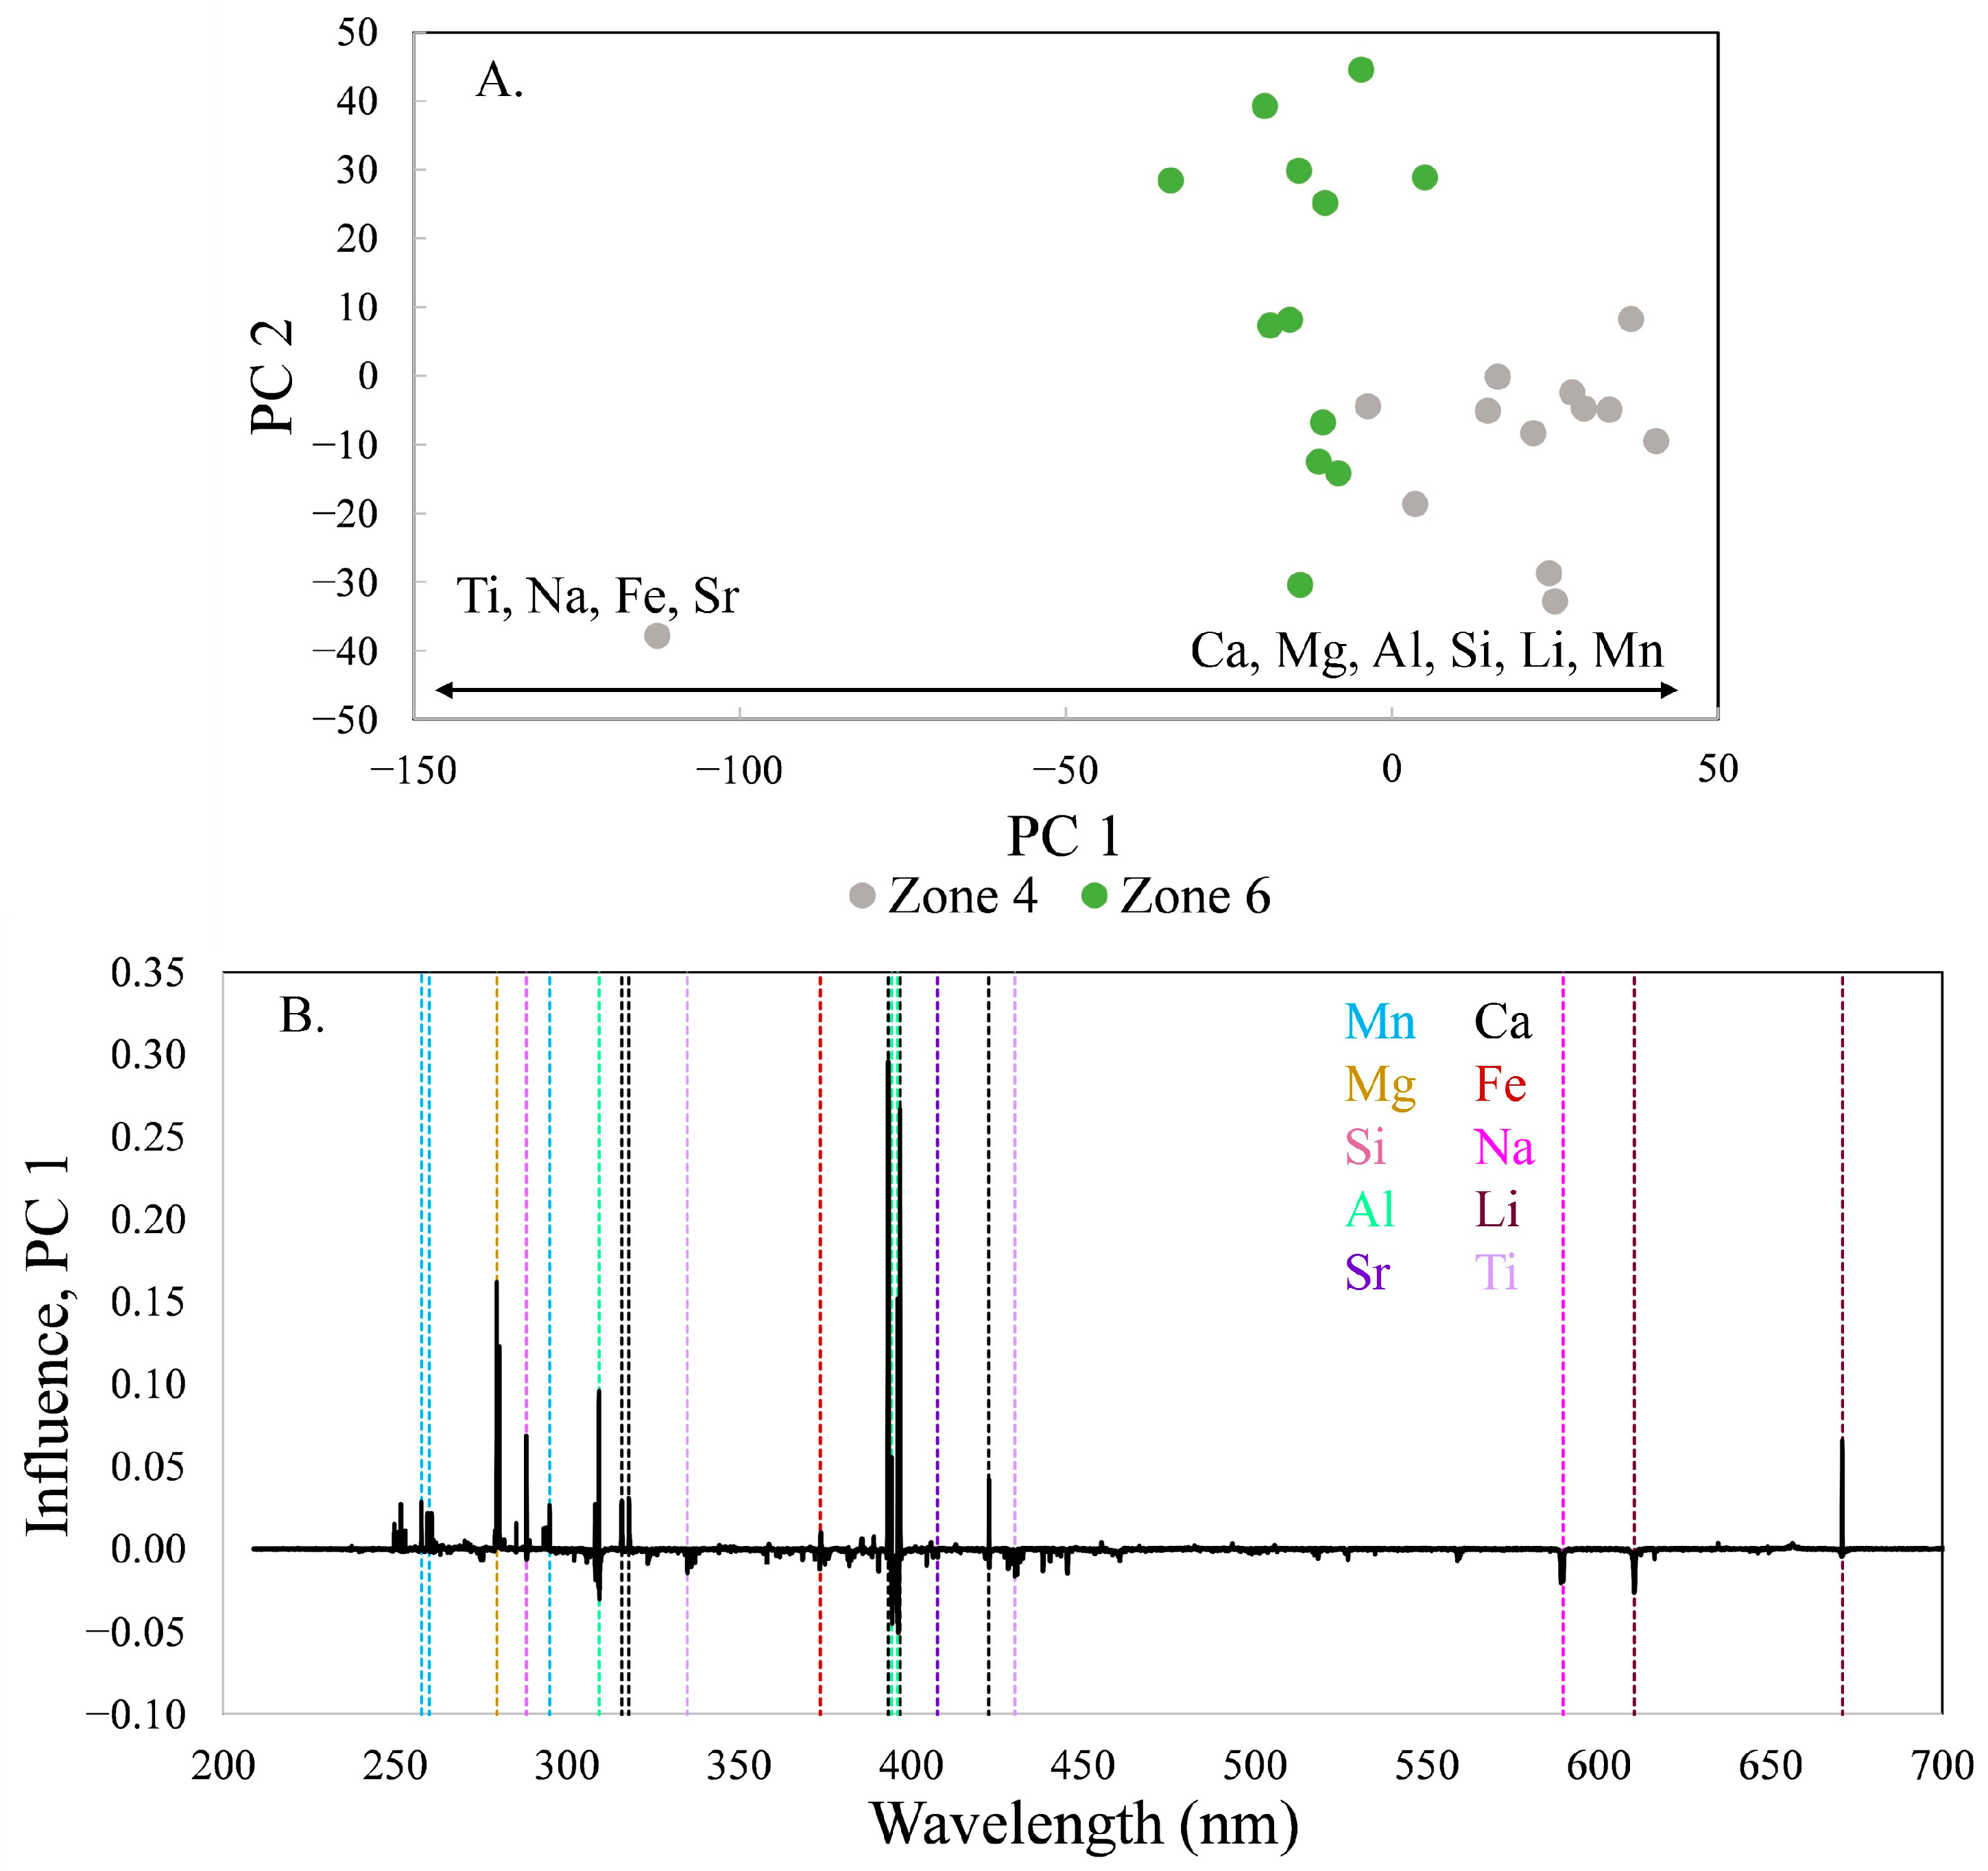
Figure 2), the spectra from zones 4 and 6 nearly completely overlap. However, a PCA model using only the spectra from these two zones reveals subtle differences between them (
Figure 10), illustrating the reason to examine the pairs of consecutive zones to fully understand the zoning relationships. Again, the variability is primarily along PC 1, which in this case contains 45.7% of the variance. Location 90 in zone 4 is an outlier, plotting on the left of the score plot. Although the compositions of tourmaline in zones 4 and 6 are similar, zone 6 tourmaline is enriched in Ti, Na, Fe, and Sr, and zone 4 in Ca, Mg, Al, Si, Li, and Mn.
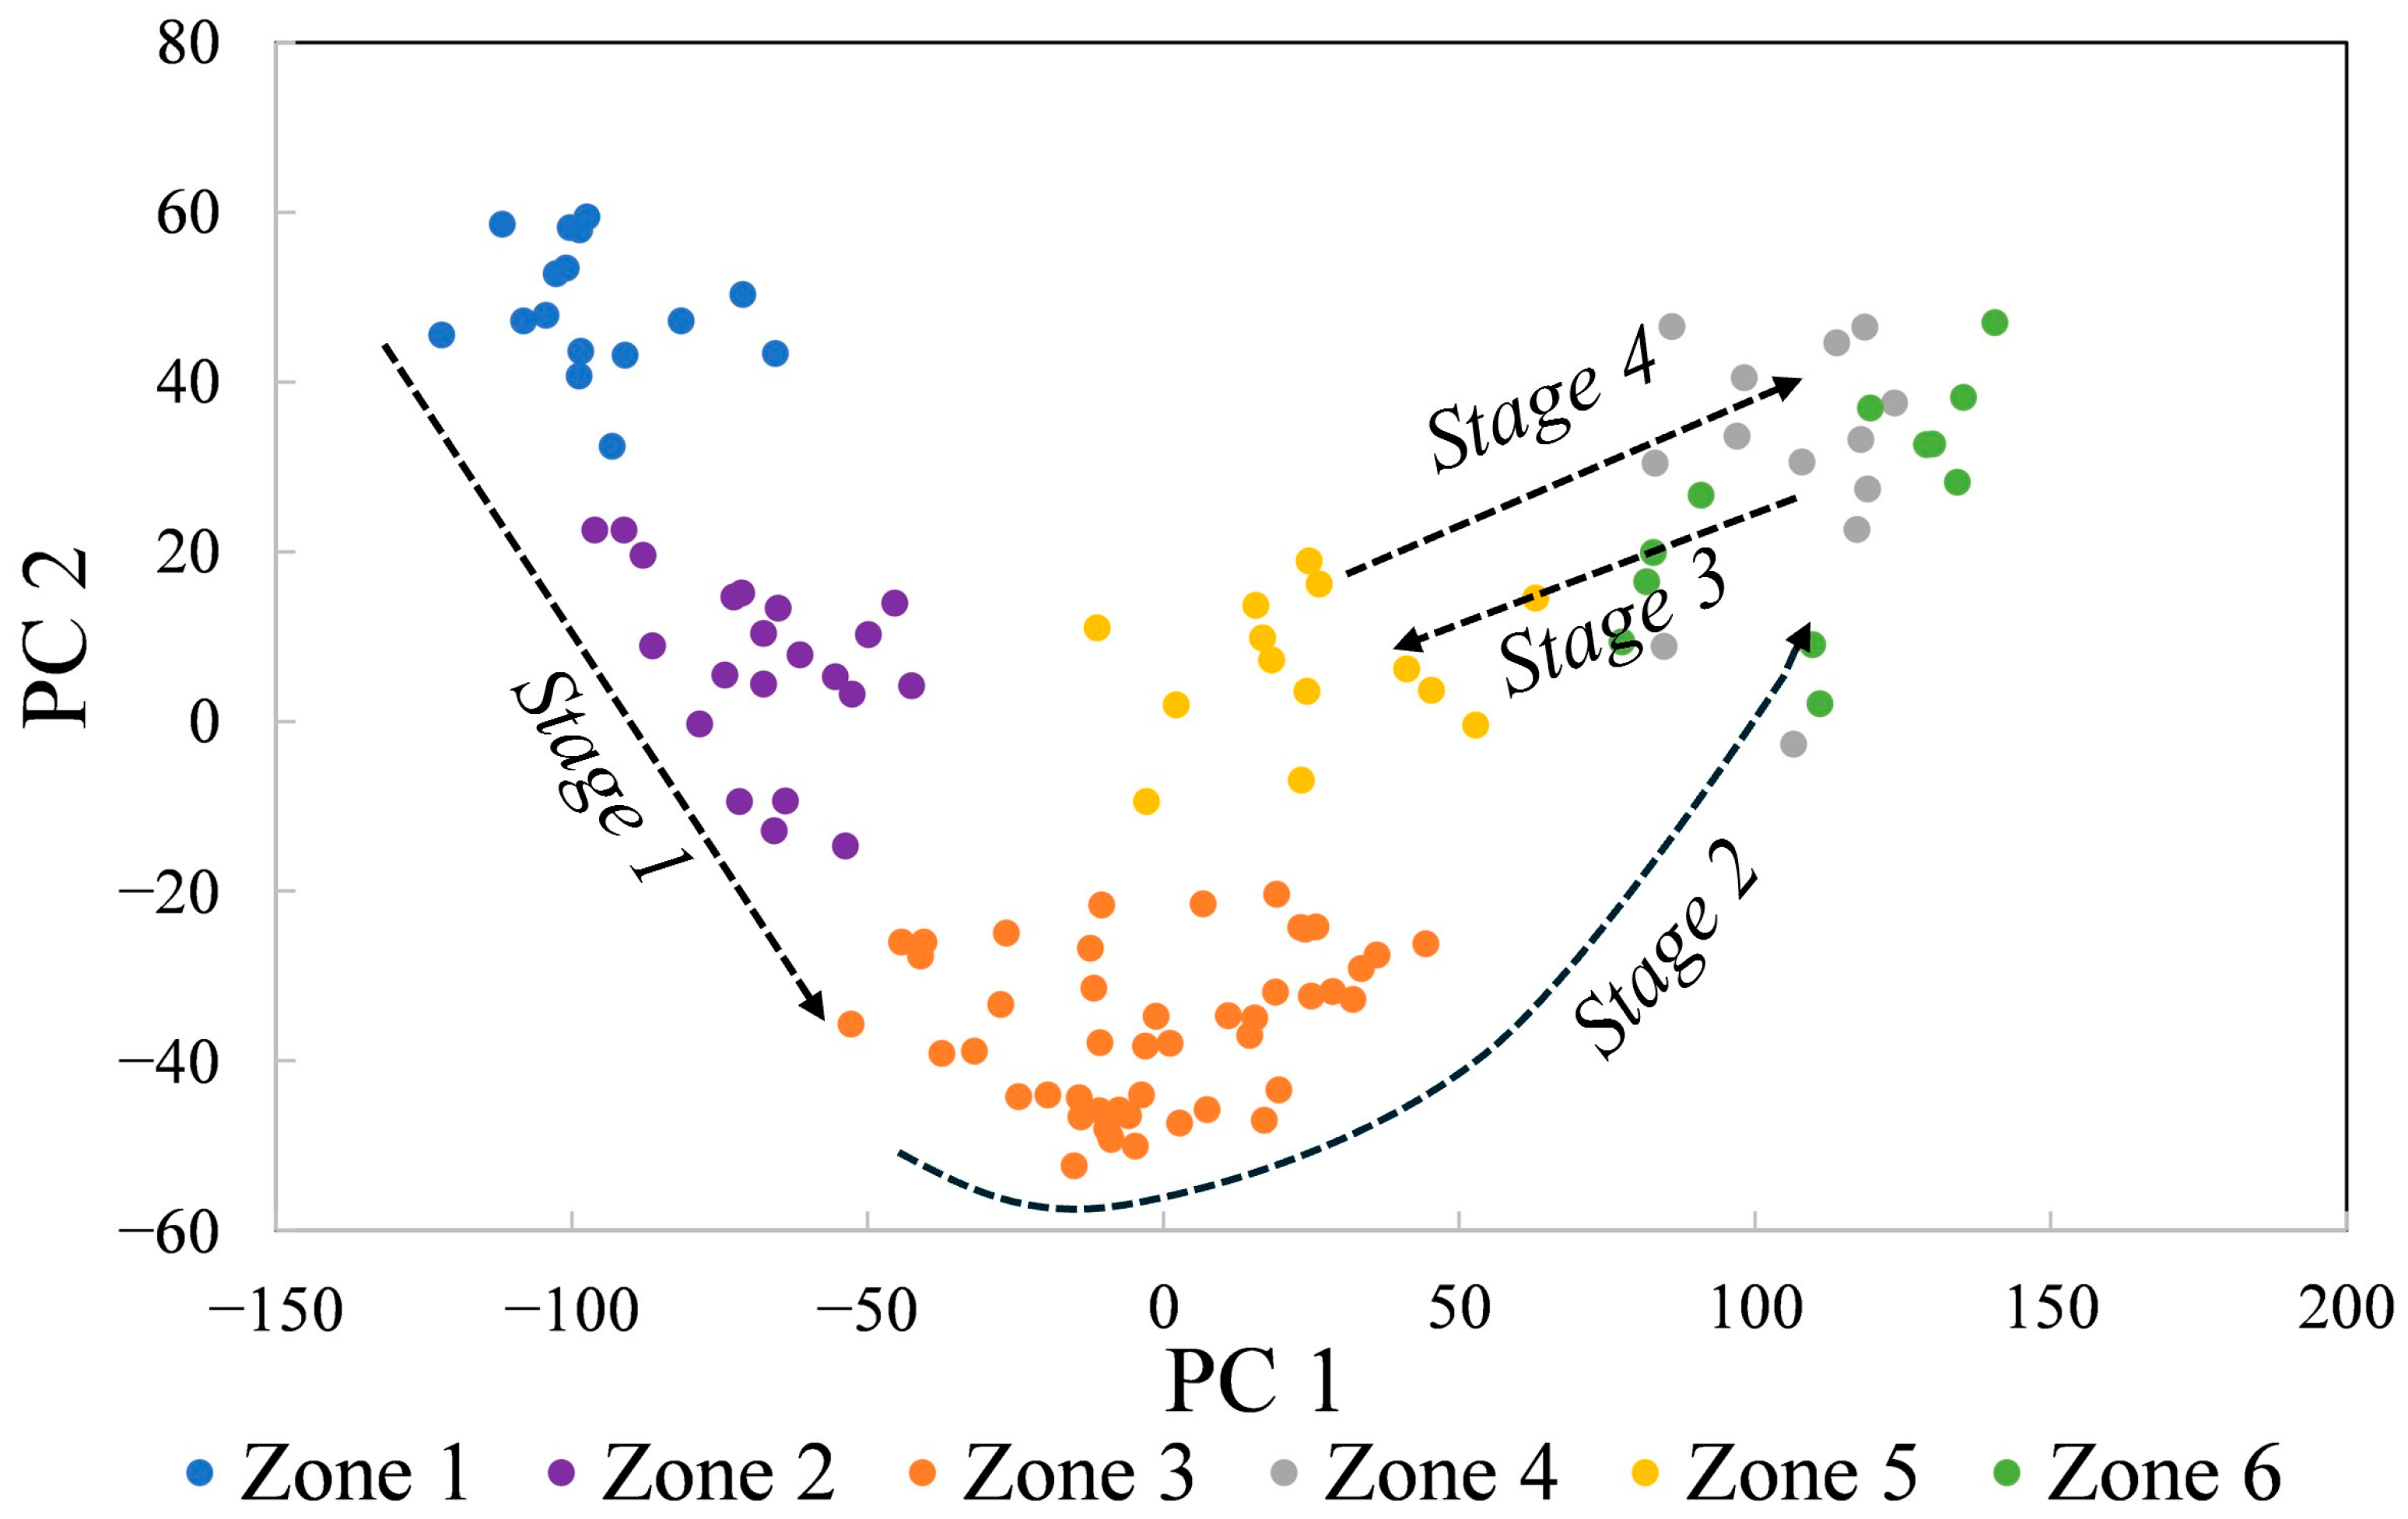
In summary, PCA of 123 spectra acquired along a core-to-rim traverse reveals 6 zones and records 4 stages of crystallization, each defined by major reversals in composition. The liddicoatite zones exhibited relatively homogenous composition across zones that are ~5–29 mm wide (13–47 locations). Stage 1 includes zones 1 and 2, in which Mn decreases while Li, Al, Mg, and Fe all increase. Stage 2 is defined by the break between zones 2 and 3, with a marked increase in Mg across zones 3 and 4. The beginning of stage 3 is defined by the abrupt change in composition between zones 4 and 5, where Mg decreases and Ca, Mn, Al, Li, and Si all increase. Finally, Stage 4 is defined by the composition of zone 6, similar to zone 4 with higher Mg, Na, Fe, and Ti. Stage 4 is not simply a return to the compositions of Stage 2 because of higher Fe and Ti in the final tourmaline compositions.
4. Discussion
Lussier and Hawthorne [
32] used EPMA to study the zoning in a large (10.8 cm diameter) Anjanabonoina tourmaline that exhibits striking oscillatory zoning. Oscillatory zoning was observed in both the pyramidal and prismatic zones. In the pyramidal zones, the pattern of an abrupt increase in Fe, Mg, and Na was followed by an exponential decrease in these elements. Simultaneously, Ca and Li exhibit the reverse behavior: an abrupt decrease followed by a gradual increase across the zone. In the prismatic zone, oscillatory bands become very narrow and are marked by an abrupt decrease in Mg and Fe followed by a gradual increase, typically to successively higher concentrations rimward. All of these variations are superimposed on gradual decreases in Mn and Na and increases in Li and Ca from core to rim. They considered open-system (mixing with fluids from the host metasedimentary rocks) and closed-system (diffusion-controlled crystallization) processes to explain these patterns and reasoned that the periodicity of the zoning pattern was inconsistent with an open-system process. Oscillatory zoning was explained by the development of a depleted boundary zone surrounding the crystal. The boundary zone has a different composition than the bulk of the fluid in the pocket, inducing conditions of effective undercooling near the growing face. Rapid crystallization from this boundary fluid extends the crystal into the non-depleted fluid, marking the end of a zone.
These observations were reinterpreted [
3] in terms of an open-system acid-reflux model, in which magmatic fluid leaves the pegmatite and enters the host rock. The fluid will likely be marginally alkaline or marginally acidic, having been in equilibrium with alkali feldspars. A convection cell develops in the host rock around the pegmatite, dissolving parts of the host rock. The fluid eventually re-enters the pegmatite and enters open pockets, mixing with existing pocket fluids. Crystallization proceeds from the new hybrid fluid composition. This type of open-system evolution has been used to explain the presence of Ca- and Li-rich liddicoatite in Anjanabonoina tourmalines by mobilizing Ca from limestone host rocks [
3,
8,
10]. It is important to understand that each pegmatite will be unique, as fluids interact with the local host rocks and bring a unique set of elements back into the pegmatite pockets [
3].
Zoning in the liddicoatite sample in this study was the result of open-system processes, based on abrupt increases in the relative concentrations of elements between zones revealed in the multivariate analysis of LIBS spectra. The core is Mn-rich, consistent with the sample in the Lussier and Hawthorne study [
32]. The six compositional zones can be explained by a four-stage model (
Figure 11). Mn decreases during Stage 1 crystallization while Li, Al, Mg, and Fe all increase. This could be the result of fractional crystallization of the Mn-rich liddicoatite or of Mn-phases such as spessartine, columbite, and pyrochlore, all of which have been reported in the Anjanabonoina pegmatites [
8,
9]. In Stage 2, an abrupt increase in Mg signals the opening of the pocket and arrival of a new fluid composition, which changes throughout the stage, with increasing Na in the later part of the stage. Interestingly, Mg increases without an increase in Ca, which would be expected if fluids interact with metadolomite host rocks [
10]. Without the context of field relationships, it is impossible to identify the exact source of contaminants; however, the high Mg content of Stage 2 liddicoatite could have been derived from Mg-rich silicates in the metadolomite host rocks. Stage 3 crystallization occurred as the pocket reopened and fluids more similar to the original pegmatitic fluids entered, with a decrease in Mg and increases in Ca, Mn, Al, Li and Si. Liddicoatite in this stage moves in multivariate space towards the core composition (
Figure 11). Finally, Stage 4 crystallization occurred when the pocket opened for a third time and fluids similar to those of Stage 2 entered. However, Stage 4 fluids had higher Fe and Ti, suggesting that convecting fluids continue to interact with different host rocks as the convection cell develops.
The liddicoatite studied here is very different from the specimen studied by Lussier and Hawthorne [
32]. Open-system acid-reflux interactions between pegmatitic-derived and host rock-derived fluids can explain the compositional relationships in a variety of pegmatites [
3]. Because the immediate host rock is different for every pegmatite, or even in different areas in a single pegmatite, the zoning patterns that result from mixing fluids will be complex and unique for each pegmatite. Different pockets in the same pegmatite can experience different histories, depending on when they open and close. Thus, the differences between the liddicoatite specimens in the two studies are to be expected.
The traditional method for assessing zoning is to plot data on either binary two-element diagrams or on single-element versus distance diagrams. These are useful methods for data visualization; however, it can be difficult to ascertain the relationships between all the elements in the zoning pattern because the human brain cannot always integrate large amounts of information contained in multiple diagrams. Multivariate techniques like PCA are advantageous because they statistically define the latent relationships within the data set. PCA can be applied to electron probe microanalysis data [
40]; however, EPMA data are generally restricted to the major and minor elements, and LIBS can potentially include variations in the trace element concentrations as well.
In this study, the zoning pattern was fairly simple, and the compositionally similar spectra were closely related spatially. PCA defined six zones with little overlap or intermingling of compositions. Spectra from the repetitive oscillatory zoning pattern observed by [
32] would result in PCA score plots in two groups, representing the first and last sections of the zones. The spectra in each group would not be spatially proximal to each other but would be an amalgamation of spectra from particular sections of all zones. Small differences between zones of similar composition can easily be identified using the multivariate technique.
