Abstract
Engineering unloading activities during deep mineral resource extraction subject the backfill materials to complex true triaxial stress conditions, where their mechanical behavior and damage mechanisms are critical to stope stability. In this article, a true triaxial testing system was employed to conduct unloading tests under different initial intermediate principal stress (σ2) conditions, aiming to elucidate the influence mechanism of σ2 on strength, deformation, failure modes, and acoustic emission (AE) characteristics of the backfill, and to establish a corresponding damage constitutive model. The results demonstrate that the σ2 governs the mechanical response and failure mode of the filling material. Within the tested range, σ2 nonlinearly enhances both the peak stress, indicating improved load-bearing. As σ2 increases, acoustic emission activity changes from intermittent to continuous high-intensity ringing counts. The transition from brittle to ductile fracture. Model predictions showed high agreement with experimental data, validating its applicability. This study provides a critical theoretical foundation and modeling framework for assessing the stability of backfill structures under deep well mining conditions and guiding engineering design.
1. Introduction
Deep mineral resource extraction represents an inevitable trend in sustaining global resource supply. However, the associated high-stress environment poses severe challenges to the stability of underground engineering structures [1,2,3,4]. Within this context, rock mass excavation during mining is essentially a typical mechanical unloading process, which is highly prone to inducing abrupt deformation and instability of the surrounding rock [5,6]. Owing to its advantages in effectively controlling ground pressure, enhancing recovery rates, and processing industrial tailings, the cut-and-fill mining method has been widely adopted, making the backfill a core structural element for maintaining stope stability [7,8,9,10,11]. Therefore, in-depth research into the mechanical properties and failure mechanisms of backfill materials under excavation-induced unloading holds critical theoretical and engineering significance for ensuring the safe and efficient extraction of deep mineral resources.
The mechanical properties of geomaterials are strongly stress-path dependent. Unlike conventional monotonic loading, rock mechanical behavior under excavation unloading exhibits distinct characteristics, such as strength degradation, deformation anisotropy, and increased brittleness [12,13]. In addition, extensive theoretical and experimental studies have confirmed that the intermediate principal stress (σ2) is a significant factor influencing the strength and deformation characteristics of rocks and rock-like materials [14,15,16,17,18]. In real engineering situations, rock masses are generally subjected to true triaxial stress conditions (σ1 > σ2 > σ3) [19]. In contrast, classical Mohr-Coulomb and Drucker-Prager criteria, derived from conventional triaxial testing (σ2 = σ3), cannot adequately reflect the influence of the intermediate principal stress [20,21]. Consequently, employing true triaxial tests to simulate an in situ stress environment and implementing unloading paths to replicate the excavation process represent the most effective approaches to reveal the true mechanical response of the backfill material. In recent decades, the mechanical properties and failure mechanisms of rock masses and cemented materials under true triaxial unloading conditions have attracted broad attention [22,23,24,25]. Early studies primarily focused on conventional triaxial conditions, neglecting the independent influence of intermediate principal stress. However, with the introduction and development of the true triaxial test method by Mogi et al. [26], the significant impact of intermediate principal stress on rock failure modes and strength criteria has gradually been revealed. More recently, numerous scholars have investigated the influence of σ2 on failure characteristics during unloading processes through experiments and numerical simulations. For example, Feng et al. [27] investigated the crack propagation in granite under intermediate principal stress unloading and found a transition in failure from shear to splitting as the intermediate principal stress increased. Feng et al. [28] further reported that the intermediate principal stress affects not only the peak strength of sandstone but also significantly alters the crack propagation pattern and energy release mechanism. Liu et al. [29] noted that variations in σ2 under unilateral unloading conditions cause the rock mass’s load-bearing capacity to first increase and then decrease, directly affecting AE energy and failure evolution. Poorsolhjouy et al. [30], through thermo-mechanical analysis, investigated the effects of intermediate principal stress and loading path on the mechanical behavior of gel materials, obtaining results consistent with true triaxial tests on rock specimens. Furthermore, Feng et al. [31] emphasized the coupled effects of unloading paths, moisture content, and microstructural variations on failure mechanisms under true triaxial unloading, providing deeper insights into the intermediate principal stress effect.
Although scholars have increasingly recognized the role of intermediate principal stress and stress path in shaping the true triaxial strength and deformation behavior of cemented tailings backfill (CTB), systematic experimental studies and constitutive modeling for CTB under different intermediate principal stress unloading conditions are still lacking. To address this gap, the present research investigates the mechanical behavior of CTB under varying intermediate principal stress unloading conditions using a true triaxial apparatus. In contrast to previous studies that primarily focused on loading paths, this work provides a systematic experimental dataset that captures the strength, deformation, failure, and AE characteristics of CTB during intermediate principal stress unloading. Furthermore, a significant novel contribution of this study is the development of a damage constitutive model that explicitly incorporates the intermediate principal stress effect through a mechanically based damage variable, capable of describing the entire process of unloading-induced damage evolution. Model parameters are calibrated and validated against experimental results. The findings aim to provide a theoretical basis for safe and efficient backfilling operations in deep mines.
2. Materials and Methods
2.1. Materials
Mine tailings and 42.5R ordinary Portland cement were selected as the primary materials. The tailings were sourced from the Xiaodonggou gold mine in Xihe County, Gansu Province. The raw ore was first crushed, followed by grinding and flotation processes to recover gold minerals. The resulting flotation tailings were utilized to prepare the backfill specimens for this study. The true density of the tailings was 2.69 g/cm3, with a bulk density of 1.147 g/cm3. The particle size distribution and chemical compositions of raw materials are crucial to the mechanical properties of cured CTB. After drying, the fundamental physical properties of the material were determined, and the particle size distributions were analyzed using an LS-POP(9) laser particle size analyzer. The equipment manufacturer is Zhuhai Oumike Instrument Co., Ltd., located in Zhuhai City, Guangdong Province, China. As illustrated in Figure 1, the tailings exhibit a bimodal particle size distribution with a median particle diameter of 13.797 μm, whereas the cement particles show a uniform distribution with a median particle diameter of 18.019 μm. The chemical composition of raw materials significantly influences the mechanical properties of CTB. In this test, the chemical composition of the tailings and cement was determined using a SHIMADZU XRF-1800 X-ray fluorescence (XRF) spectrometer. The equipment manufacturer is Shimadzu Corporation, located in Nakagyō Ward, Kyoto City, Kyoto Prefecture, Japan. The results are shown in Table 1. The mine tailings are primarily composed of SiO2 (61.75%), Al2O3 (12.69%), and CaO (9.18%), while the key constituents of ordinary Portland cement were CaO (52.65%), SiO2 (24.13%), and Al2O3 (8.96%). Before testing commenced, phase analysis of the tailings and cement was performed using a Rigaku Ultima IV X-ray diffractometer, with results presented in Figure 2. The equipment manufacturer is Rikagaku Co., Ltd., located in Akishima City, Tokyo. The crystalline phases in the tailings include Quartz, Calcite, Fluorite, Hedenbergite, and Andradite, while the crystalline phases in the cement primarily consist of Quartz and Calcium silicate. Quartz and Calcium silicate were identified as the primary mineral phases. During the hydration reaction, tricalcium silicate is the primary reactant, ultimately forming C-S-H gel and acicular AFt [32].
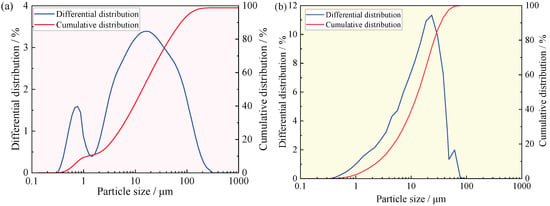
Figure 1.
Particle size distribution of raw materials: (a) Tailings; (b) Portland cement.

Table 1.
Major chemical components of tailings and cement (Component, %).
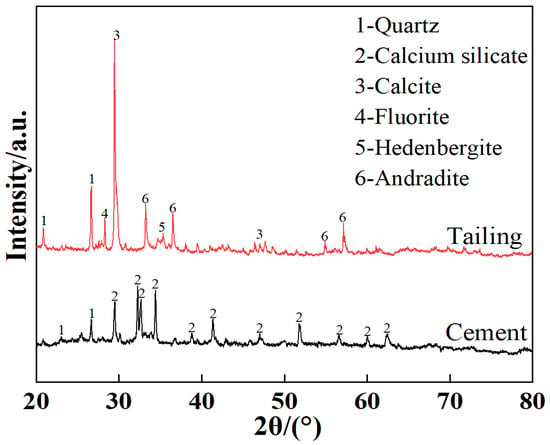
Figure 2.
XRD test results for tailings and cement.
2.2. Specimens Preparation
CTB samples were prepared by mixing mine tailings, cement, and water with a slurry concentration of 64% and a cement-to-sand ratio of 1:4. The mixed water is laboratory tap water. This study employs rectangular cross-section specimens for true triaxial unloading tests. This is because the true triaxial testing system utilized in this experiment features planar loading plates in both directions. The use of rectangular specimens ensures uniform stress transfer from the loading plates to the specimen surfaces. This avoids stress concentration and uneven loading caused by line contact between circular cross-sections and planar loading plates. The preparation procedure was as follows: tailings, cement, and water were weighed using an electronic balance with an accuracy of 0.01g. First mix the raw materials, then add water and blend for 10 min using a mixer to obtain a uniform slurry. The mixer is manufactured by Shangyu Binxin Instrument Factory in Shaoxing City, China, model NJ-160. The slurry was poured into 50 mm × 50 mm × 100 mm rectangular molds. The specimen dimensions were selected in compliance with the specifications of the true triaxial testing apparatus to ensure full and uniform contact with the loading platens, thereby guaranteeing the accurate application of stress on all three principal axes. The filled molds were placed in a standard curing chamber maintained at a constant temperature (20 ± 1 °C) and relative humidity (95 ± 1%) for 24 h. The curing chamber is a Laisen YH-40B model. After demolding, the specimens were further cured for 7 days. Selecting a 7-day curing period is crucial for determining the earliest safe exposure time for CTB following stress induced by mining operations. During specimen preparation, all procedures were strictly adhered to the specified testing protocol to minimize experimental error. Prior to testing, the end surfaces of each specimen were leveled to ensure flatness, with irregularity not exceeding 1 mm. The specimen preparation process is illustrated in Figure 3.
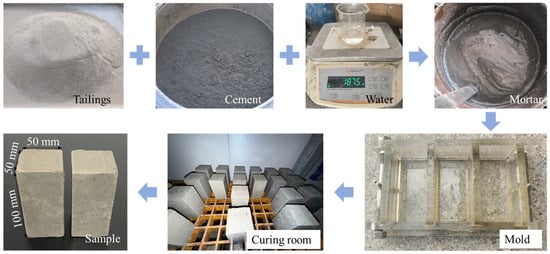
Figure 3.
Sample preparation process of CTB.
2.3. Testing Equipment
Testing was conducted using the GDS-TTA true triaxial testing system. The equipment manufacturer is Europe and America Land Instrument Equipment (China) Co., Ltd., located in Guangdong City, China. Figure 4 shows the true triaxial testing apparatus used in this study. The system enables independent loading/unloading control of σ1, σ2, and σ3. Rigid loading is applied along the σ1 and σ2 directions, while flexible loading using hydraulic pressure is applied along the σ3 direction. The device’s maximum loading capacity is 32 kN, with an accuracy of 0.001 kN (error margin within 0.1%). Before commencing formal testing, the true triaxial testing system underwent rigorous calibration. A high-vacuum grease was applied between the specimen ends and the rigid loading plate to minimize interference arisin g from friction at the contact interface between the clamping plates and the specimen. Strict control of specimen parallelism and flatness ensured the establishment of a near-uniform stress state.
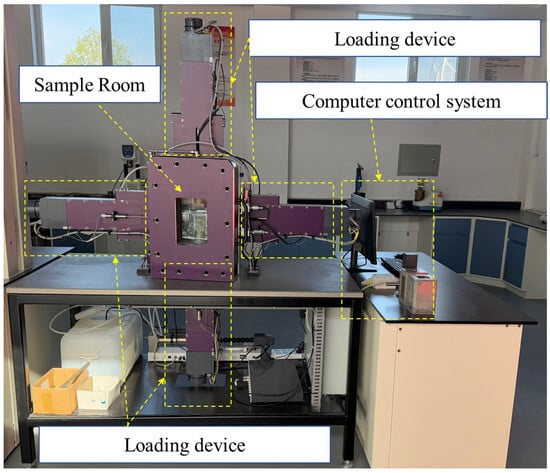
Figure 4.
Physical diagram of the true triaxial device.
To investigate the influence of complex stress paths on backfill, unloading tests were performed under varying intermediate principal stress (σ2) conditions. The loading paths and testing scheme are summarized in Table 2 and illustrated in Figure 5. The procedure consisted of three stages: Stage I is the hydrostatic loading phase, with hydraulic pressure increased from 0 to 300 kPa at a rate of 10 kPa/s. In Stage II, σ3 was maintained constant while σ1 and σ2 were continuously increased at a rate of 10 kPa/s. Once σ2 reached target values of 300 kPa, 500 kPa, 700 kPa, 900 kPa, and 1100 kPa, it was held constant, while σ1 continued to increase until 2000 kPa before entering Stage III. In Stage III, σ1 was subsequently loaded at a constant displacement rate of 0.005 mm/s, while σ2 was unloaded at a rate of 3 kPa/s until specimen failure occurred. Each condition comprises three replicate samples. The experimental results represent the mean values.

Table 2.
Unloading Test Schemes for Different Intermediate Principal Stresses.
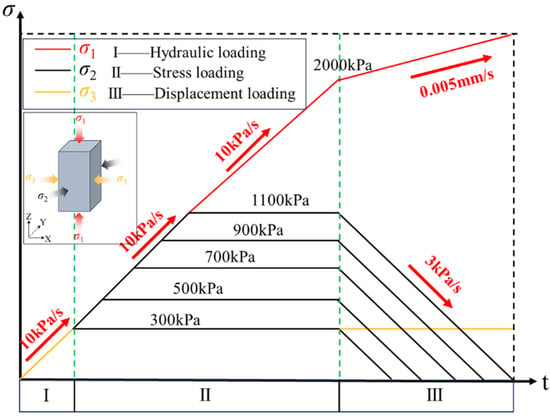
Figure 5.
Experimental loading path and process.
The initial σ1 is 2.0 MPa and σ3 is 0.3 MPa, representing the fundamental constraint state. The σ2 level encompasses scenarios ranging from isotropic stress conditions (σ2 = σ3) to significant intermediate principal stress effects (σ2 > σ3). The loading rate for σ1 was selected as 0.005 mm/s. The unloading rate for σ2 was selected as 3 kPa/s. This approach simulates a quasi-static excavation process, enabling the acoustic emission system to accurately capture damage evolution whilst avoiding the introduction of significant dynamic effects. [33].
During the loading phases (Stages I and II), stresses were applied as follows: σ1 was applied uniaxially through a rigid platen along the vertical axis of the specimen. σ2 and σ3 represent the double-axis loading of the row. During the critical unloading phase (Stage III), a uniaxial unloading of σ2 was performed while maintaining σ3 constant and continuing the displacement-controlled loading on σ1.
2.4. Acoustic Emission Monitoring
AE monitoring equipment was employed to capture the real-time acoustic responses of microcrack development within CTB. In this test, the setup used consisted of a PIC-2 AE monitoring system, equipped with an AE amplifier and a Nano30AE integrated ultrasonic sensor. The equipment manufacturer is Mischas Physical Acoustics, Inc., located in NJ, USA. The acquisition threshold was set to 40 dB, with a sampling frequency of 1 MHz. The peak definition time, hit definition time, and hit lockout time were configured as 50 μs, 100 μs, and 200 μs, respectively. A total of 8 AE sensors were arranged to record both AE signal parameters and waveforms. A total of 8 AE sensors were arranged to record both AE signal parameters and waveforms. The sensors’ schematic layout is shown in Figure 6. The arrangement and number of AE sensors were determined through preliminary experiments. The objective was to optimize the spatial coverage of the specimen and ensure the accurate capture of AE signals from potential failure zones. The final configuration of eight sensors, distributed on the two surfaces of the rectangular specimen, was found to effectively meet these requirements, providing comprehensive monitoring of three-dimensional crack development throughout the failure process.
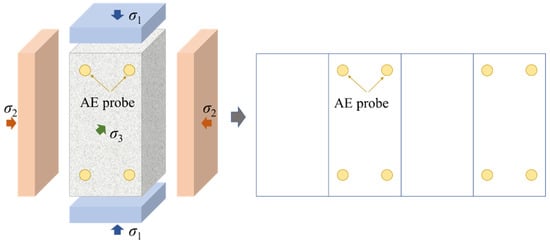
Figure 6.
Schematic diagram of AE probe arrangement.
3. Results and Discussion
3.1. True Triaxial Unloading Strength Characteristics
The unloading strength of the filler was analyzed using the axial peak stress, as shown in Figure 7. The results indicate that the true triaxial unloading strength of the filling material increases with rising σ2. The core mechanism is the additional lateral constraints provided by σ2. Previous studies have shown that the failure of fillings essentially results from the initiation, propagation, and coalescence of internal microcracks. A higher σ2 increases the resistance to crack initiation and propagation, effectively suppressing the formation of new cracks, inhibiting the lateral expansion of existing cracks, and requiring higher axial stress to cause the material failure to occur. Figure 7b illustrates the relationship between unloading strength increment and σ2. The plot shows that the increment initially rises with increasing σ2 and then declines, with 700 kPa identified as the critical σ2. The relationship between the axial peak stress increment and the σ2 is described by a Gaussian function. The relationship reflects the competing effects of strengthening and damage associated with the intermediate principal stress. Within a certain range, σ2 exerts a beneficial confining influence, densifying internal pores under lateral compression and thereby enhancing strength [34]. However, once σ2 exceeds this threshold, internal pores may become compacted to their limit. Further increases in lateral stress, while still providing confinement, also begin to induce compressive damage to the matrix [35,36]. In this study, when σ2 reached 1100 kPa, the unloading strength increment approached zero, suggesting that excessive σ2 may lead to internal damage within the CTB, ultimately reducing its unloading strength.
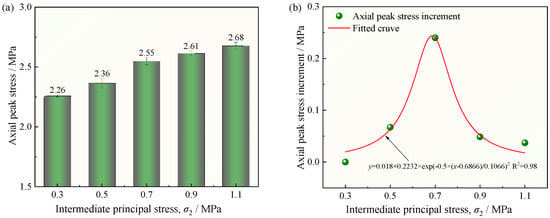
Figure 7.
Axial peak strength and peak strength increment under CTB true triaxial unloading path at different intermediate principal stresses: (a) Bar chart of axial peak strength; (b) Axial peak strength increment versus fitting curve.
3.2. Deformation Characteristics Under True Triaxial Unloading Conditions
Figure 8 shows the axial stress–strain curves of CTB under true triaxial unloading with different σ2 values, with red markers indicating the unloading points. Each stress–strain curve originates from a representative sample within each set of experiments. As shown in the figure, prior to an axial stress of 2.0 MPa, the specimens exhibited linear elastic deformation. Following the unloading, the response transitioned from the linear elastic stage to the yielding, driven by the abrupt change in the stress path that disrupted the internal stress equilibrium. According to the principles of mechanics, a reduction in σ2 can lead to an increase in the maximum shear stress. This sudden rise in shear stress rapidly reaches and exceeds the shear yield strength of the filler, causing the material to transition from an elastic state to a plastic yield state.
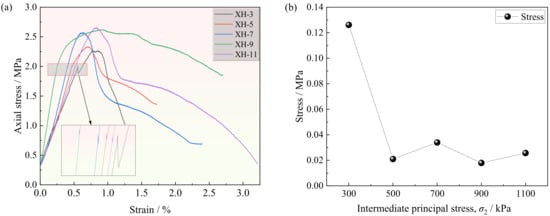
Figure 8.
Axial stress–strain curves of the CTB under different principal stresses: (a) axial stress–strain curve; (b) axial stress reduction during unloading.
In the post-peak stage, the axial stress of specimen XH-3 exhibits a relatively steep drop, indicative of brittle failure. However, as σ2 increases, the post-peak stress reduction becomes more gradual, reflecting a brittle-to-ductile transition. This effect can be attributed to stronger lateral confinement at higher σ2, significantly suppressing microcrack propagation rate and allowing the material to withstand greater deformation before failure.
Furthermore, a distinct stress reduction was also observed at the unloading point. As indicated in Figure 8b, when σ2 = σ3 (conventional triaxial condition), the axial stress at the unloading point decreases abruptly by 0.13 MPa, whereas when σ2 > σ3, the reduction was limited to 0.02–0.04 MPa. Under isotropic confinement (σ2 = σ3), unloading instantaneously disrupted stress isotropy and introduced strong stress anisotropy. The specimen undergoes rapid stress redistribution to satisfy new boundary conditions, resulting in a sudden loss of axial load-bearing capacity, expressed as a sudden drop in σ1. In contrast, when σ2 > σ3, the specimen exhibited an anisotropic but stable state. Unloading σ2 under these conditions resulted in a gradual adjustment, preventing an abrupt stress redistribution, thereby mitigating the instantaneous reduction in axial stress σ1.
3.3. Failure Mode Analysis
Under true triaxial unloading conditions, the failure mode of CTB is closely related to both the magnitude of σ2 values and the σ2 unloading paths. Figure 9 presents the failure characteristics of the CTB specimens subjected to different σ2 values. As shown in the figure, when σ2 = σ3, the fracture pattern is dominated by tensile cracks, and the primary failure mode is tensile failure. This loading condition is identical to that of conventional triaxial loading. Under this state, unloading σ2 has the same effect as unloading the minimum principal stress σ3 (since σ2 = σ3). Previous studies have demonstrated that unloading of σ3 readily induces tensile fracturing in CTB [37,38]. The reduction in lateral constraint induces significant lateral expansion (tensile strain) under axial stress σ1. Once this tensile strain exceeds the material’s tensile strength limit, cracks develop parallel to the direction of the maximum principal stress σ1. Such cracks typically exhibit as splitting fractures, representing a classic brittle failure mode.
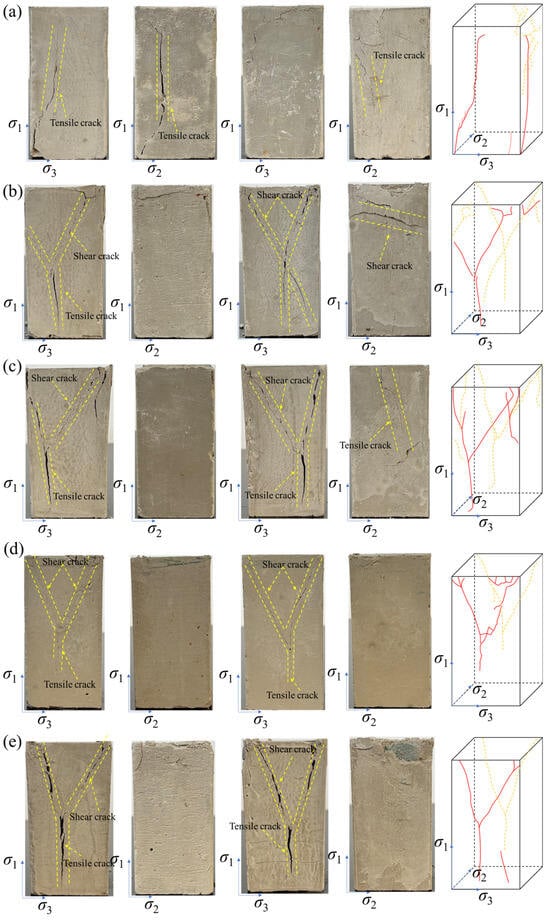
Figure 9.
Failure modes of CTB under true triaxial unloading paths: (a) XH-3; (b) XH-5; (c) XH-7; (d) XH-9; (e) XH-11.
When σ2 > σ3, the crack pattern consists of tensile and shear cracks, and the failure mode shifts to tensile-shear failure. Under this anisotropic stress state, internal stresses are unevenly distributed within the specimen, and planes of maximum shear stress become more localized. Although σ2 decreases during unloading, its initially high value still provides substantial lateral constraint, suppressing purely tensile fractures. Under these conditions, crack propagation does not occur along a single tensile plane but instead must overcome higher confining pressure and frictional resistance. Therefore, failure manifests through a two-stage process: microcracks (often tensile in nature) first initiate at stress concentration points, after which these microcracks propagate and coalesce along the direction of maximum shear stress, forming shear bands. The ultimate failure is thus governed by the combined effects of tensile crack initiation and shear crack propagation, resulting in a more ductile and complex failure mechanism.
Crack distribution was also found to be related to σ2. As shown in Figure 9, major fractures in all specimens were concentrated in the σ1-σ3 plane, as cracks tend to initiate and propagate in the direction perpendicular to the minimum constraint. In this study, σ3 consistently represents the minimum principal stress. Hence, the primary fracture plane invariably developed parallel to the σ1-σ3 plane, meaning the fracture plane is perpendicular to the σ2 direction, with cracks propagating along the σ3 direction. When σ2 = σ3, distinct cracks were also observed within the σ1-σ2 plane. Notably, samples with σ2 values of 500 kPa and 700 kPa exhibited minor cracks within the σ1-σ2 plane, while samples with σ2 values of 900 kPa and 1100 kPa showed no significant cracks within this plane. This phenomenon can be explained by the effect of lateral constraint. Under isotropic conditions (σ2 = σ3), unloading σ2 weakens constraints uniformly in the σ1-σ2 plane, creating conditions for crack initiation in multiple directions and leading to visible fractures. In contrast, at higher σ2, a strong constraint effectively prevents crack propagation in the σ1-σ2 plane, concentrating deformation and failure energy along the weaker σ3 direction. Consequently, as σ2 increases, cracks in the σ1-σ2 plane transition from “distinct” to ‘limited’ and finally to “absent”. This trend does not imply improved material integrity but demonstrates the constraining and directional effect of high σ2, which enforces fracture localization and enhances failure anisotropy.
It is worth noting that the cracks observed at the edges and corners of the specimens can be attributed to a certain extent to their rectangular cross-section. The geometric discontinuities at these locations act as inherent stress concentrators, promoting the initiation and localization of microcracks under complex true triaxial stress conditions. While this geometric effect influences the precise location and surface pattern of fracture, the fundamental transition in failure mechanism from tensile-dominated to tensile-shear composite with increasing σ2 is considered an inherent material response to the unloading stress path. The systematic variation in crack patterns with σ2 demonstrates that the observed failure modes are primarily governed by the stress state rather than being an artifact of the specimen geometry.
3.4. Acoustic Emission Results Analysis
The characteristics of AE ringing count effectively reveal the acoustic evolution of internal damage in CTB during true triaxial unloading. Figure 10 shows the variation in ringing counts during the failure process under σ2 conditions of 500 kPa, 700 kPa, and 900 kPa. The AE activity exhibits distinct three-stage characteristics, strongly dependent on the σ2 value: Stage I (pre-unloading) shows few AE events; Stage II (unloading to peak stress) demonstrates a significant increase in event count frequency, and Stage III (post-peak phase) features active AE, corresponding to accelerated crack propagation and macroscopic failure development. The cumulative ring counts followed a step-like growth trend, reflecting the intermittent and sudden nature of damage evolution. The σ2 level was identified as a key factor controlling AE behavior. At lower σ2 (σ2 = 500 kPa), pre-unloading activity was limited, followed by distinct clustered counts and a regular step-like cumulative curve after unloading. This indicates intermittent damage accumulation, primarily characterized by sudden macrocrack propagation. At higher σ2 (σ2 = 900 kPa), AE events initiate earlier in the loading process, with ringing counts distributed more uniformly and continuously. The cumulative curves exhibited an incline stepwise pattern. This reflects a gradual damage progression and enhanced ductility, with earlier crack initiation and continuous propagation. At intermediate σ2 level (σ2 = 700 kPa), AE characteristics were transitional, reflecting a shift from brittle to ductile behavior. The above analysis indicates that as σ2 increases, the failure mechanism of CTB gradually shifts from sudden brittle fracture to progressive ductile failure. The earlier onset and continuous distribution of AE activity suggest that internal damage initiation occurs earlier and develops more fully under higher σ2. From the perspective of microcrack activity, the AE ringing count results confirm that σ2 fundamentally controls the initiation time, evolution pattern, and ultimate failure mechanism of CTB by altering the strength of lateral constraints. When a significant number of ringing events began to occur, it was determined that the CTB had sustained pronounced damage, with the stress value at that moment defined as the damage stress. As shown in the figure, the damage stress of the CTB under triaxial loading ranged from 80.9% to 92.5%.
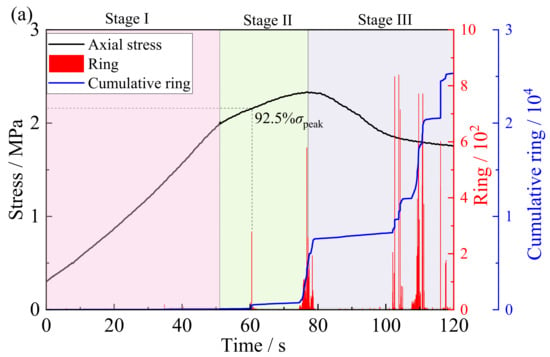
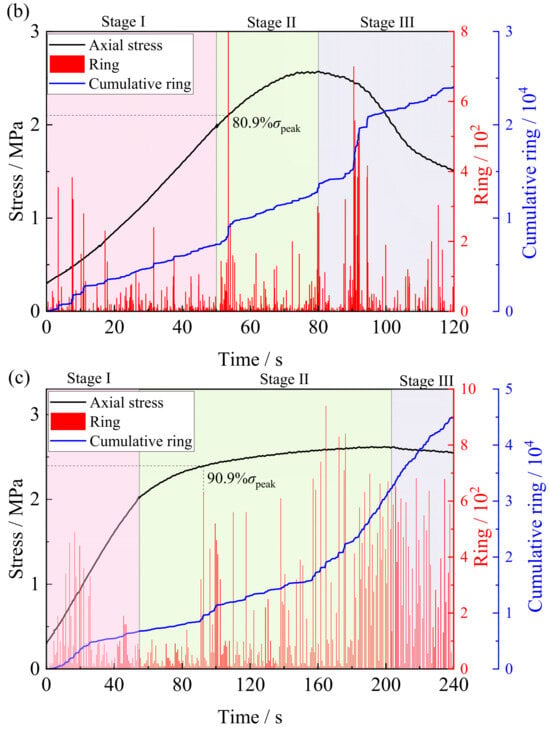
Figure 10.
CTB’s AE ringing count characteristics under true triaxial unloading at different principal stresses: (a) XH-5; (b) XH-7; and (c) XH-9.
3.5. Constitutive Equation
3.5.1. Damage Theory and Model Parameters
Under external loading, the initiation, propagation of internal damage in CTB, along with the corresponding mechanical behavior can be regarded as a continuous evolutionary process. As damage develops, internal energy progressively dissipates, and this process is inherently irreversible [39]. To quantitatively characterize the degree of material degradation, a damage variable D is typically introduced. Fundamentally, the damage variable is essentially multi-order tensor describing the evolution of a material from an intact to a degraded state [40]. Given that CTB is a typical heterogeneous medium containing numerous randomly distributed micro-pores and defects, its damage evolution under external loading is inherently stochastic. Thus, the rational selection of a damage variable is not only a prerequisite for investigating the failure behavior of materials and structures but also a crucial step for establishing a constitutive damage model that accurately reflects the degradation characteristics of fillings. The validity of damage parameters directly impacts the accuracy and applicability of model predictions. Various definitions of the damage variable have been proposed in previous studies [41]. Among these, Robotnov characterized the damage variable based on the concept of effective load-bearing area, providing an important reference for subsequent damage theory research.
In the above equation, A represents the initial cross-sectional area of the material; A’ is the effective cross-sectional area after damage.
According to the strain equivalence hypothesis, material damage is converted into modulus variation in the backfill under external loading. This hypothesis states that the deformation caused by the nominal stress σ acting on the damaged portion of the material equals the deformation caused by the effective stress σ’ acting on the undamaged portion, i.e.,
In the equation, σ’ is the effective stress matrix; σ is the nominal stress matrix.
By combining this with the generalized Hooke’s law, the following equation can be derived: (3).
In the equation, εi denotes the principal strain, where i = 1, 2, 3, corresponding to the maximum, intermediate, and minimum principal strains, respectively; σi, σj, σk are the principal stresses, where i, j, k = 1, 2, 3, and i ≠ j ≠ k; E′ is the elastic modulus of the damaged material; E is the elastic modulus of the undamaged material; and v is the Poisson’s ratio.
Combining Equation (2) and Equation (3) yields Equation (4).
Drawing on probability distribution theory in statistics, the damage variable D is defined as the ratio of the number of damaged micro-elements n under at a given stress level F to the total number of micro-elements N in the initial state, i.e.,
The micro-element strength of the backfill material is assumed to be expressed by Equation (6):
In this equation, k0 is related to the cohesion and internal friction angle of the backfill.
Accordingly, the probability density function for micro-element failure in the backfill material can be written as:
Therefore, assuming that the failure probability P of the backfill micro-elements follows the strength distribution density function ϕ(x), the following equation can be drawn.
If the micro-element strength of the backfill is assumed to follow a power-law distribution, the corresponding probability density function is given by:
By substituting Equation (9) into Equation (8), the following expression is obtained:
Furthermore, substituting Equation (10) into Equation (4) yields the following expression:
The strength of the backfill micro-elements, as described by the Mogi-Coulomb's criterion, is given by:
When Equation (12) is substituted into Equation (11), the resulting expression is:
During the true triaxial compression test of CTB specimens, the stress–strain relationship at the peak point satisfies the following conditions: when , ; and when , . In this equation, and represent the stress and the corresponding strain of the CTB on the true triaxial stress–strain curve at the peak point. Therefore, based on these boundary conditions, the parameters m and F0 are obtained as:
3.5.2. Damage Models and Validation
Based on the experimental data, the constructed damage constitutive equation was applied to determine the parameters m and F0 of the true triaxial unloading damage constitutive model for CTB under different σ2 conditions, as shown in Table 3.

Table 3.
Parameters of CTB unloading damage constitutive model under different intermediate principal stress conditions.
Figure 11 presents the relationship between parameters m and F0 and the intermediate principal stress under true triaxial unloading conditions. As illustrated, m decreases as the intermediate principal stress σ2 increases, exhibiting an exponential relationship. With the further increases in σ2, the rate decrease in m gradually slows down. When σ2 exceeds 0.7 MPa, m approaches a stable value of approximately 1.76. In contrast, parameter F0 exhibits linear growth σ2, with a fitted correlation coefficient of R2 = 0.96785, indicating a strong linear relationship between the two variables.
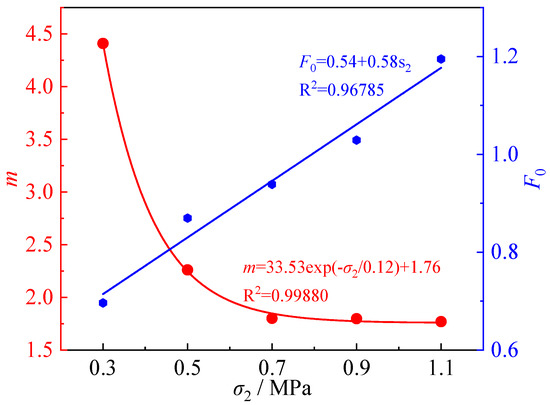
Figure 11.
Relationship between CTB damage model parameters m and F0 and the principal stress.
The proposed model was used for calculation based on the experimental stress–strain data of CTB under true triaxial unloading at different σ2 levels. The computed results were then compared with the experimental curves to verify the accuracy of the damage model. As illustrated in Figure 12, the theoretical results closely align with the experimental data. Although some discrepancies exist in the post-peak stage, the differences are minor, and both curves exhibit a high degree of consistency in their overall evolutionary trends. These findings confirm that the constitutive model developed in this study can reliably characterize the damage evolution of CTB under varying σ2 unloading conditions and its applicability for engineering evaluation.
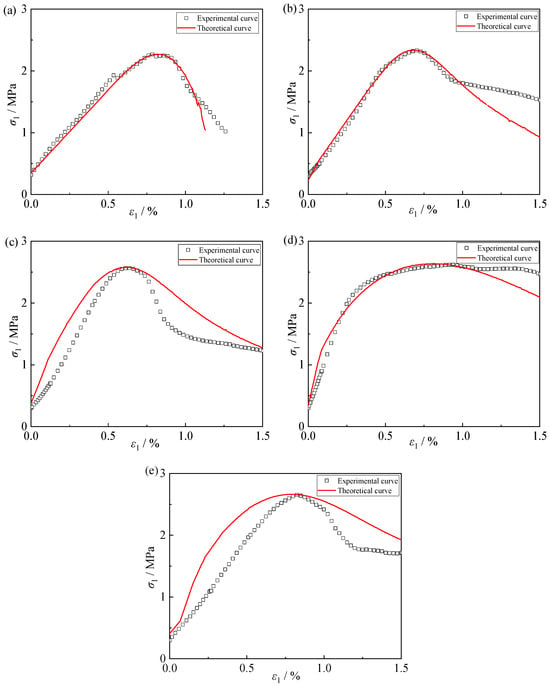
Figure 12.
Comparison of CTB true triaxial unloading experimental curves with theoretical curves under different principal stress conditions: (a) XH-3; (b) XH-5; (c) XH-7; (d) XH-9; (e) XH-11.
Damage evolution curves for CTB under different σ2 unloading conditions were further derived from the laboratory data, as shown in Figure 13. Under true triaxial unloading, the evolution characteristics of the damage variable are significantly influenced by the magnitude of σ2. Most specimens exhibit an “S-shaped” damage curve, in which the damage variable increases with strain through three distinct stages: slow growth—rapid increase—gradual stabilization. However, apparent differences are observed in the curves’ onset point, slope variation, and evolution rate under different σ2 levels. At low σ2, the damage initiation is delayed, and the accumulation process is relatively slow, indicating that crack initiation and propagation become prominent only after larger deformations. With increasing σ2, the damage curve gradually shifts forward, with the specimen entering the rapid damage phase earlier. The slope of the curve rises, indicating accelerated crack initiation and propagation, a higher damage evolution rate, and an earlier onset of unstable failure. At higher σ2, the damage curves maintain an overall “S-shaped” pattern. However, the initial slow-growth phase shortens, and the rapid-growth phase occurs earlier, highlighting more abrupt and localized damage development. It is noteworthy that specimen XH-9 exhibited a slightly different damage curve compared to other specimens. Its damage evolution was relatively delayed in the early stage and demonstrated stronger ductile characteristics, consistent with its macroscopic deformation behavior. Nevertheless, after entering the rapid growth phase, the damage accumulation trend aligned with other specimens. In summary, higher σ2 values lead to earlier onset and faster rate of damage evolution in CTB, making the material more prone to unstable failure. At medium-to-high σ2 levels, although some variability exists among specimens, the overall regularity and consistency of the damage evolution process remain prominent.
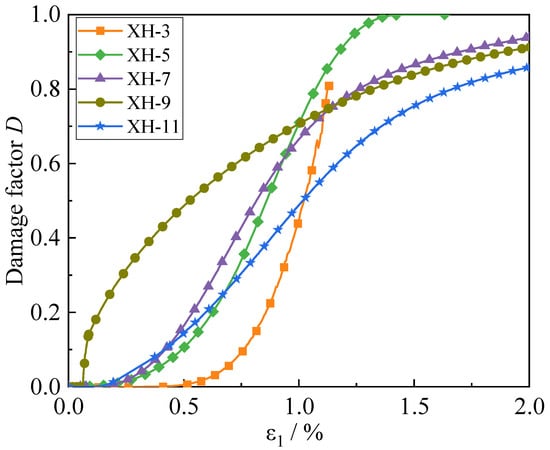
Figure 13.
CTB Damage Evolution Based on Damage Constitutive Model.
3.5.3. Model Calibration, Uncertainty, and Parametric Behavior
The model parameters m and F0 were calibrated using a nonlinear least-squares regression algorithm, to minimize the sum of squared residuals between the experimental and predicted deviatoric stress (σ1-σ3) over the entire pre-peak loading-unloading regime. The regression was weighted equally across all data points to capture the overall constitutive response without bias. The uncertainty of the fitted parameters was quantitatively assessed by calculating their asymptotic standard errors from the inverse of the Fisher information matrix (a measure derived from the covariance matrix of the fit). Table 3 below presents all parameters with their standard errors. The relatively small magnitude of these errors, compared to the parameter values themselves, indicates that the parameters were estimated with high confidence and are statistically well-constrained by the experimental data.
While a formal quantitative sensitivity analysis was not performed, the physical significance and robust behavior of the parameters provide strong evidence for the model’s stability. As discussed in Section 3.5.2 and illustrated in Figure 11, parameters m and F0 exhibit clear and consistent trends with the intermediate principal stress σ2: The parameter m, which governs the shape of the damage evolution curve, decreases exponentially and stabilizes with increasing σ2. This reflects a transition in the damage accumulation process from a more abrupt to a more gradual and stable mode. The parameter F0, which controls the scale of the damage function, increases linearly with σ2. This indicates that a higher stress level is required to initiate a comparable level of damage as the confinement increases.
These well-behaved, monotonic relationships demonstrate that the model does not rely on erratic parameter adjustments but captures a fundamental mechanical response. The agreement between model predictions and experimental data (Figure 12) is achieved with parameters that themselves behave as meaningful physical quantities, thereby underpinning the model’s reliability and reducing concerns about arbitrary parameter sensitivity. It is acknowledged that the model’s fit in the post-peak region is less accurate, as this region was not the primary focus of the calibration, which prioritized the pre-peak and peak behavior most relevant for engineering stability assessment.
3.6. Limitations and Scope for Generalization
It is important to acknowledge the limitations of this study to properly contextualize the findings. The experimental investigation was conducted on laboratory-scale specimens (50 mm × 50 mm × 100 mm) with a specific mix proportion (slurry concentration of 64%, cement-to-sand ratio of 1:4) and tailings from a single source. Therefore, when disseminating these findings, consideration should be given to the size effect and the impact of variations in composition.
Regarding sample size and heterogeneity, CTB is a heterogeneous material. The smaller sample sizes employed herein may not fully capture the large-scale heterogeneity present in full-scale backfill structures (e.g., coarse-grained distribution, local voids). Whilst the selected dimensions are suitable for true triaxial testing and effective for investigating fundamental mechanisms under controlled stress paths, absolute strength values and specific transition stresses (such as the critical σ2 of 700 kPa) may be subject to scale effects in larger-volume specimens.
Regarding mixing ratios and tailings variability, the conclusions of this study are derived from a single mix design. Variations in key mixing parameters alter the mechanical properties of backfill materials. These include cement content, tailings particle size distribution, and mineral composition.
Therefore, the quantitative results can be directly applied to CTBs with similar compositions and loading conditions. The identified qualitative trends and underlying mechanisms also hold significant fundamental importance. For instance, the nonlinear strengthening effect of σ2 on strength, the transition from tensile to tensile-shear failure modes, and the brittle-to-ductile transition associated with acoustic emission behavior. These findings provide a crucial theoretical framework and validated modeling approaches that can be adapted and calibrated for different mix designs and scales in future research and engineering assessments.
4. Conclusions
In this paper, CTB was prepared and subjected to true triaxial unloading under different initial intermediate principal stress conditions. The objectives were to investigate the effect of σ2 level and unloading path backfill strength, deformation characteristics, failure mode, and AE features. A damage variable was introduced to establish and validate a damage constitutive model describing CTB damage evolution under different intermediate principal stress unloading paths. The main conclusions are as follows:
- (1)
- Under unloading conditions, σ2 is the key factor enhancing the CTB’s load-bearing capacity and deformability. The peak strain and peak stress increase nonlinearly with σ2, resulting from the combined effects of the strengthening and damage mechanisms. The increment in unloading strength first rises and then decreases with σ2, with 700 kPa identified as the critical intermediate principal stress.
- (2)
- The intermediate principal stress σ2 is the key factor governing the pre-peak deformation capacity and post-peak failure behavior of CTB. As σ2 increases, the peak strain exhibits nonlinear growth, the post-peak stress drop slows, and the material transitions from brittle to ductile behavior. The instantaneous reduction in axial stress at the unloading point strongly depends on the initial stress state. Under conventional triaxial isotropic conditions (σ2 = σ3), unloading induces severe stress redistribution, causing an abrupt drop in axial stress. In contrast, under true triaxial anisotropic conditions (σ2 > σ3), the stress adjustment occurs more gradually, and the axial stress drop is significantly reduced.
- (3)
- The CTB failure mode is closely related to the magnitude of σ2 and the unloading path. When σ2 = σ3, tensile cracks dominate, while at σ2 > σ3, failure is characterized by a combination of tensile and shear cracks. Regarding crack distribution, cracks primarily occur in the σ1-σ3 plane. As σ2 increases, cracks in the σ1-σ2 plane diminish, resulting in more localized and directional failure.
- (4)
- AE ringing count of CTB under different σ2 unloading paths exhibits three distinct stages: quiescent, rising, and active. The cumulative ring count shows a stepwise growth pattern. As the σ2 level increases, AE events occur earlier and at higher frequencies, and the cumulative ringing count transitions from a regular stepwise platform to an inclined stepwise pattern. This reflects that greater σ2 accelerates crack initiation and development, advancing the transition from brittle to ductile failure.
- (5)
- By introducing the damage factor D, a damage constitutive model for CTB under a true triaxial unloading path with different σ2 levels was established. Model validation against laboratory data shows excellent agreement with theoretical curves, confirming the model’s reliability and applicability.
- (6)
- This study distinguishes itself from existing granular micromechanics approaches (e.g., Poorsolhjouy et al. [30], which focused on thermo-mechanical simulation and micro-scale force evolution under loading paths) by providing direct experimental evidence and a macroscopic damage constitutive model for the failure behavior of CTB under true triaxial unloading conditions. Theoretically, the established model, which incorporates the intermediate principal stress effect through a damage variable, offers a practical and validated tool for predicting the nonlinear strength and damage evolution of backfill, bridging a gap between micromechanical theories and engineering-scale material behavior. Practically, the findings and the model provide a crucial basis for assessing the stability of backfill structures in deep mining, where excavation-induced unloading is a dominant stress path, thereby guiding safer and more efficient backfill design.
Building on this work, future studies should investigate the behavior of CTB under more complex stress paths that mimic sequential excavation, and explore the coupling effects of environmental factors such as pore water pressure and temperature. Furthermore, integrating multi-scale experimental techniques with the constitutive model would provide deeper insights into the damage mechanisms and enhance its applicability for engineering design.
Author Contributions
Conceptualization, J.L.; methodology, J.L.; writing—original draft preparation, Q.L.; writing—review and editing and supervision, Y.K.; funding acquisition, W.S. All authors have read and agreed to the published version of the manuscript.
Funding
This work was financially supported by the China’s National Key Research and Development Program of China (with a grant number of 2022YFC2905003).
Data Availability Statement
Data are contained within the article.
Conflicts of Interest
Qiang Li and Yunpeng Kou are employees of Shandong Gold Group Co., Ltd. The paper reflects the views of the scientists and not the company.
References
- Kaiser, P.K.; Yazici, S.; Maloney, S. Mining-induced stress change and consequences of stress path on excavation stability—A case study. Int. J. Rock Mech. Min. Sci. 2001, 38, 167–180. [Google Scholar] [CrossRef]
- Xu, Y.; Li, Z.; Chen, Y.; Jia, M.; Zhang, M.; Li, R. Synergetic mining of geothermal energy in deep mines: An innovative method for heat hazard control. Appl. Therm. Eng. 2022, 210, 118398. [Google Scholar] [CrossRef]
- Jiang, M.; Cao, S.; Yilmaz, E. Exploring microstructure and mechanical features of coupled cementitious tail-sand concrete by partial replacement of tungsten tailings. Process Saf. Environ. Prot. 2024, 190, 863–875. [Google Scholar] [CrossRef]
- Deng, H.; Xiao, Y. Experimentation of Heat-Insulating Materials for Surrounding Rocks in Deep Mines and Simulation Study of Temperature Reduction. Minerals 2024, 14, 938. [Google Scholar] [CrossRef]
- Cai, M.; Brown, E.T. Challenges in the Mining and Utilization of Deep Mineral Resources. Engineering 2017, 3, 432–433. [Google Scholar] [CrossRef]
- Hou, Z.; Xiao, F.; Liu, G.; Bashkov, O.V.; Lyu, L. Mechanical Properties and Acoustic Emission Characteristics of Unloading Instability of Sandstone under High Stress. Minerals 2022, 12, 722. [Google Scholar] [CrossRef]
- Wang, J.; Fu, J.; Song, W.; Zhang, Y.; Wang, Y. Mechanical behavior, acoustic emission properties and damage evolution of cemented paste backfill considering structural feature. Constr. Build. Mater. 2020, 261, 119958. [Google Scholar] [CrossRef]
- Qi, C.; Fourie, A. Cemented paste backfill for mineral tailings management: Review and future perspectives. Miner. Eng. 2019, 144, 106025. [Google Scholar] [CrossRef]
- Lu, G.; Fall, M.; Cui, L. A multiphysics-viscoplastic cap model for simulating blast response of cemented tailings backfill. J. Rock Mech. Geotech. Eng. 2017, 9, 551–564. [Google Scholar] [CrossRef]
- Qi, W.; Zhang, J.; Zhou, N.; Wu, Z.; Zhang, J. Mechanism by which backfill body reduces amount of energy released in deep coal mining. Shock. Vib. 2019, 2019, 8253269. [Google Scholar] [CrossRef]
- Tan, Y.; Yang, J.; Deng, Y.; Kou, Y.; Li, Y.; Song, W. Research on the Long-Term Mechanical Behavior and Constitutive Model of Cemented Tailings Backfill Under Dynamic Triaxial Loading. Minerals 2025, 15, 276. [Google Scholar] [CrossRef]
- Haimson, B.; Chang, C. A new true triaxial cell for testing mechanical properties of rock, and its use to determine rock strength and deformability of Westerly granite. Int. J. Rock Mech. Min. Sci. 2000, 37, 285–296. [Google Scholar] [CrossRef]
- Li, X.; Feng, F.; Li, D.; Du, K.; Ranjith, P.G.; Rostami, J. Failure Characteristics of Granite Influenced by Sample Height-to-Width Ratios and Intermediate Principal Stress Under True-Triaxial Unloading Conditions. Rock Mech. Rock Eng. 2018, 51, 1321–1345. [Google Scholar] [CrossRef]
- Singh, M.; Raj, A.; Singh, B. Modified Mohr–Coulomb criterion for non-linear triaxial and polyaxial strength of intact rocks. Int. J. Rock Mech. Min. Sci. 2011, 48, 546–555. [Google Scholar] [CrossRef]
- Feng, X.-T.; Zhang, X.; Kong, R.; Wang, G. A Novel Mogi Type True Triaxial Testing Apparatus and Its Use to Obtain Complete Stress–Strain Curves of Hard Rocks. Rock Mech. Rock Eng. 2016, 49, 1649–1662. [Google Scholar] [CrossRef]
- Li, K.; Du, G.; Han, D.; Yin, Z.; Li, J.; Lin, H. Mechanical and acoustic emission characteristics of anisotropic rock subjected to tiered cyclic intermediate principal stress. Eng. Geol. 2025, 358, 108403. [Google Scholar] [CrossRef]
- Alam, M.F.; Balaji, V.; Tucci, F.; Krishnaswamy, H.; Chakkingal, U. A critical evaluation of shear specimen geometry for accurate stress triaxiality control. Eng. Fract. Mech. 2025, 328, 111562. [Google Scholar] [CrossRef]
- Zhang, H.; Ma, Q.; Yang, Z.J.; Huang, K.; Ma, D.; Yao, Z.; Wang, Z.; Liu, F. Stress-Strain Behavior and Strength Criterion of Frozen Silty Clay under Varying Intermediate Principal Stresses. Cold Reg. Sci. Technol. 2025, 240, 104653. [Google Scholar] [CrossRef]
- Lee, H.; Haimson, B.C. True triaxial strength, deformability, and brittle failure of granodiorite from the San Andreas Fault Observatory at Depth. Int. J. Rock Mech. Min. Sci. 2011, 48, 1199–1207. [Google Scholar] [CrossRef]
- Feng, X.-T.; Gao, Y.; Zhang, X.; Wang, Z.; Zhang, Y.; Han, Q. Evolution of the mechanical and strength parameters of hard rocks in the true triaxial cyclic loading and unloading tests. Int. J. Rock Mech. Min. Sci. 2020, 131, 104349. [Google Scholar] [CrossRef]
- Zhou, Y.; Xiao, J.; Deng, Z.; Yang, H.; Mei, J.; Huang, J. Experimental and modelling investigation of stress-strain behavior of basalt fiber-reinforced coral aggregate concrete under uniaxial and triaxial compression. Constr. Build. Mater. 2025, 496, 143856. [Google Scholar] [CrossRef]
- Wang, B.; He, B.-G.; Shang, J.; Zhu, Z.; Yu, H.; Lei, X. Failure mechanism of deep TBM tunnels subjected to dynamic disturbance under true triaxial unloading stress path. Int. J. Rock Mech. Min. Sci. 2025, 191, 106128. [Google Scholar] [CrossRef]
- Gao, L.; Zhao, H.; Liu, C. Study on the influence of true triaxial principal stress loading and unloading on gas permeability characteristics of coal seams containing gangue. Results Eng. 2025, 27, 105667. [Google Scholar] [CrossRef]
- Cheng, G.; Liu, X.; Chen, J.; Zhang, N.; Li, Y. True triaxial test study on triggering mechanisms of structure-type rockbursts using low-strength and high-brittleness materials under unloading and dynamic disturbance. Eng. Fail. Anal. 2025, 182, 110062. [Google Scholar] [CrossRef]
- Que, X.; Zhu, S.; Zhu, Z.; Zhang, J.; Niu, Z. Numerical modeling of columnar jointed basalt with a dual irregular joint network and its unloading response under true triaxial conditions. Comput. Geotech. 2025, 189, 107660. [Google Scholar] [CrossRef]
- Mogi, K. Effect of the intermediate principal stress on rock failure. J. Geophys. Res. 1967, 72, 5117–5131. [Google Scholar] [CrossRef]
- Feng, F.; Chen, S.; Wang, Y.; Huang, W.; Han, Z. Cracking mechanism and strength criteria evaluation of granite affected by intermediate principal stresses subjected to unloading stress state. Int. J. Rock Mech. Min. Sci. 2021, 143, 104783. [Google Scholar] [CrossRef]
- Feng, F.; Xie, Z.; Chen, S.; Li, D.; Peng, S.; Zhang, T. True triaxial unloading test on the mechanical behaviors of sandstone: Effects of the intermediate principal stress and structural plane. J. Rock Mech. Geotech. Eng. 2025, 17, 2208–2226. [Google Scholar] [CrossRef]
- Liu, C.; Zhao, G.; Xu, W.; Meng, X.; Liu, Z.; Cheng, X.; Lin, G. Experimental study on failure characteristics of single-sided unloading rock under different intermediate principal stress conditions. Int. J. Min. Sci. Technol. 2023, 33, 275–287. [Google Scholar] [CrossRef]
- Poorsolhjouy, P.; Misra, A. Effect of intermediate principal stress and loading-path on failure of cementitious materials using granular micromechanics. Int. J. Solids Struct. 2017, 108, 139–152. [Google Scholar] [CrossRef]
- Feng, F.; Chen, S.; Han, Z.; Golsanami, N.; Liang, P.; Xie, Z. Influence of moisture content and intermediate principal stress on cracking behavior of sandstone subjected to true triaxial unloading conditions. Eng. Fract. Mech. 2023, 284, 109265. [Google Scholar] [CrossRef]
- Scrivener, K.L.; Juilland, P.; Monteiro, P.J.M. Advances in understanding hydration of Portland cement. Cem. Concr. Res. 2015, 78, 38–56. [Google Scholar] [CrossRef]
- Li, X.F.; Li, J.J.; Kou, Y.P.; Song, W.D. Analysis of true triaxial mechanical behavior and energy dissipation of backfill under different unloading rates. Chin. J. Eng. 2025, 47, 1387–1397. [Google Scholar] [CrossRef]
- Zhang, Y.; Chen, G.; Wang, Z.; Liu, D. Fracture Evolution Analysis of Rock Bridges in Hard Rock with Nonparallel Joints in True Triaxial Stress States. Rock Mech. Rock Eng. 2023, 56, 997–1023. [Google Scholar] [CrossRef]
- You, M. True-triaxial strength criteria for rock. Int. J. Rock Mech. Min. Sci. 2009, 46, 115–127. [Google Scholar] [CrossRef]
- Mehranpour, M.H.; Kulatilake, P.H.S.W. Comparison of six major intact rock failure criteria using a particle flow approach under true-triaxial stress condition. Geomechancie Geophys. Geo-Energy Geo-Resour. 2016, 2, 203–229. [Google Scholar] [CrossRef]
- Yu, X.; Kemeny, J.; Tan, Y.; Song, W.; Huang, K. Mechanical properties and fracturing of rock-backfill composite specimens under triaxial compression. Constr. Build. Mater. 2021, 304, 124577. [Google Scholar] [CrossRef]
- Liu, Q.; Liu, D.; Tian, Y.; Liu, X. Numerical simulation of stress-strain behaviour of cemented paste backfill in triaxial compression. Eng. Geol. 2017, 231, 165–175. [Google Scholar] [CrossRef]
- Shi, Y.; Xu, F.; Song, X.; Wang, G.; Zuo, Y.; Li, X.; Ji, J. Rock damage evolution in the production process of the enhanced geothermal systems considering thermal-hydrological-mechanical and damage (THM-D). Energy 2023, 285, 129421. [Google Scholar] [CrossRef]
- Zhang, C.; Wang, J.; Song, W.; Fu, J. Pore structure, mechanical behavior and damage evolution of cemented paste backfill. J. Mater. Res. Technol. 2022, 17, 2864–2874. [Google Scholar] [CrossRef]
- Zhao, L. Numerical investigation on the mechanical behaviour of combined backfill-rock structure with KCC model. Constr. Build. Mater. 2021, 283, 122782. [Google Scholar] [CrossRef]
Disclaimer/Publisher’s Note: The statements, opinions and data contained in all publications are solely those of the individual author(s) and contributor(s) and not of MDPI and/or the editor(s). MDPI and/or the editor(s) disclaim responsibility for any injury to people or property resulting from any ideas, methods, instructions or products referred to in the content. |
© 2025 by the authors. Licensee MDPI, Basel, Switzerland. This article is an open access article distributed under the terms and conditions of the Creative Commons Attribution (CC BY) license (https://creativecommons.org/licenses/by/4.0/).