Article

Indentation Size Effects and the Mechanical Properties of Barite Rocks

by
Hassan Abubakar Adamu
1,2,*,
David Oluwasegun Afolayan
3,4,*,
Olumide Samuel Oluwaseun Ogunmodimu
5,
Tabiri Kwayie Asumadu
6,
Seun Isaiah Olajuyi
1,
Nelson Y. Dzade
5 and
Winston O. Soboyejo
7
1
Department of Material Science and Engineering, African University of Science and Technology, Abuja 900107, Nigeria
2
Advanced Manufacturing Technology Development Institute AMTDI Jalingo, National Agency for Science and Engineering Infrastructure NASENI, Abuja 900106, Nigeria
3
Department of Civil, Environmental and Architectural Engineering, Worcester Polytechnic Institute (WPI), Worcester, MA 01609, USA
4
Department of Mechanical Engineering & DAF Materials and Mineral Research Group, African University of Science and Technology, Abuja 900107, Nigeria
5
John and Willie Leone Family Department of Energy and Mineral Engineering, The Pennsylvania State University, University Park, PA 16802, USA
6
Department of Materials Engineering, Sunyani Technical University, Sunyani P.O. Box 206, Ghana
7
Office of the President, State University of New York (SUNY) Polytechnic Institute, Utica, NY 13502, USA
*
Authors to whom correspondence should be addressed.
Minerals 2025, 15(11), 1226; https://doi.org/10.3390/min15111226 (registering DOI)
Submission received: 7 July 2025 / Revised: 18 October 2025 / Accepted: 10 November 2025 / Published: 20 November 2025

Abstract

This paper uses a combination of nanoindentation experiments and mechanism-based models to determine the dislocation densities and plasticity length scales associated with the nanoindentation of barite rock materials. These include estimates of the plasticity length scale, geometrically necessary dislocation densities (GNDs) and statistically stored dislocation densities (SSDs) that are shown to have major implications for the plastic deformation of geomaterials such as barite rocks. The statistical variations associated with the nanoindentation of barite rocks are also measured along with local variations in surface composition that are also elucidated via energy dispersive X-ray spectroscopy (EDS) during Scanning Electron Microscopy (SEM). The indentation size effects are shown to be greater than the statistical variations due to local differences in surface composition. The effects of local variations in surface composition are also discussed before relating the measured hardness values to the underlying dislocation densities (GNDs and SSDs) and plasticity length scale parameters using strain gradient plasticity theories. The presence of hard minerals such as quartz and other silicate minerals, as confirmed by the elemental composition of the rock samples, contributed significantly to the average hardness, elastic modulus, plasticity and relatively high dislocation densities. The implications of the results are discussed for the energy-efficient drilling and blasting of rocks, constitutive modeling of barite rock deformation and the crushing of rocks during mineral processing.

1. Introduction

Barite minerals are often found in rock formations with embedded dislocation structures that were formed many years ago. Rocks are mostly considered to be brittle materials, and their indentation properties are controlled by stress–strain responses to plastic straining or softening, or the increase in confining pressure that occurs during uniaxial or triaxial cyclic loading, which shows unique features [1]. Mechanical loading of barite rocks during crushing and grinding may result in dislocations depending on the material and loading conditions [2]. There are many investigations on changes in mechanical properties during cyclic plastic deformation. The cyclic hardening of materials [3,4] and cyclic softening for the previously plastically deformed materials [5,6,7] in the low-cycle strain-controlled fatigue were observed. The cyclic hardening or softening is related to the dislocation density of the materials [8,9]. However, some dislocations are formed during the initial formation of rocks due to changes associated with natural activities. Dislocations are defects in the crystal structure of minerals, where the regular atomic arrangement is disrupted, resulting in strained and weakened bonds [10]. Dislocations in minerals have a long history: The first images of dislocations ever seen were obtained by Siedentop in 1905 on rock salt (halite) with an optical microscope, as reported by [11,12]. These dislocations and associated plastic deformation mechanisms can be related to dislocation configurations described as mesas and screw loops in earlier work on metals and alkali halides [12]. Several theories have been used to analyze and describe dislocation structures in rocks containing minerals of varying mechanical properties [11,13,14].
Local variations in mechanical properties, such as hardness at different length scales, have significantly contributed to the dislocation density at certain indentation depths [15]. The studies of dislocation densities are crucial because they are the primary mechanism for plastic deformation in crystalline structures. Although several authors have studied the dislocation structures in rocks, there have been only a limited number of studies of the roles of statistically stored and geometrically necessary dislocation structures in rocks [16,17,18]. Also, higher dislocation density encourages larger deformation, leading to shape transformation of a material [19]. However, with increasing deformation, the dislocations come into contact and get tangled with one another, giving increased resistance to further motion by work hardening of the materials. These variations are traceable to the local composition of the rocks and affect the amount of the dislocation energy stored, the energy release rate and the failure of rocks. This understanding is important for enhanced mineral liberation during the crushing and grinding of mineral-containing rocks and in the design of equipment for rock fragmentation.
Rock-containing minerals are pressure-sensitive and dilatant [20]. They also experience significant volume changes during deformation [20]. The deformation properties of rock materials can also be altered or influenced by cyclic loading conditions, such as the maximum loading stress and the stress amplitude [21], frequency [22] and the presence of defects [23,24]. Furthermore, naturally occurring rocks contain defects such as joints, fissures or pores, which are the primary sources or sites of contact-induced deformation and crack nucleation in rocks [24,25,26]. Dislocations are one-dimension (1D) defects and are the main sources of plastic deformation in rocks and minerals. They are typically introduced into rocks during crystal growth and crystallization under different environmental conditions [11,27,28].
Research has shown that the nature of the defects induced by the mechanical loading of materials depends on variations in the structure and the mechanical properties of rocks. The contact-induced deformation of rocks is also dependent on the local variations in strength and the local variations in defect sizes [29,30,31]. Hence, within this context, the plastic deformation mechanism of rocks is of great interest, especially in scenarios that require high mechanical energy to ensure significant particle size reduction and liberation of minerals in the rocks during crushing of rocks [24].
Dislocations are line defects that can extend across rock crystals and slipped separations, caused by misaligned atoms [25,32]. In rock-like materials and ores, brittle deformation (material deformation by stress) or contact deformation (material deformation initiated by contact between two different materials—the jaw and the rocks), and sedimentation caused by a chemical process, are some of the sources of dislocations. Such defects appear as open joints, discontinuous or micro-fractures, and pre-existing cracks that significantly lower the strengths of the rocks [25,26]. These defects, which may be covered with minerals, and leached afterwards by hydrothermal fluids, can lead to the formation of cemented defects (in the case of mineral veins) [25].
Similarly, defects within the rock mass can be continuous, block forming and discontinuous, or observed as small-scale and strong micro-defects in the rock outcrop or drill core. Defects can be a diagenetic and structural fissure or caused by weathering and human activities [33]. The work of Yang et al. [34] and Hirth et al. [35] on pre-existing defects showed that defect accumulation weakens local regions with high stress concentration in rocks, which can lead ultimately to the failure of rocks via plasticity and cracking at different length scales.
Within the context of plasticity length scales, it is interesting to examine the range of length scale parameters that are associated with rock materials compared to some of the information earlier reported in the literature on different materials (non-ceramics), such as metals [12], and other materials with variations in plasticity. Barite rock materials are polycrystalline solids composed of different minerals with some pores and defects [27,33,35,36]. As such, the two major types of dislocations in polycrystalline aggregates are the geometrically necessary dislocations (GNDs) and statistically stored dislocations (SSDs) [23,27]
Studies of dislocations are important for the prevention of failure in materials [23,27,35]. However, in mining and mineral processing research, where the failure of materials is mostly anticipated and desired, the understanding of dislocations in rocks is useful for the prediction of the coordinated fracture of rocks (multiple fractures of similar orientations embedded in a rock mass owing to the rock properties) for energy-efficient mineral liberation [24]. The determination of density of SSDs and GNDs in polycrystalline solids (using micro- and nano-analytical tools) is also well reported [23,27,35,37,38].
Also, the imaging of dislocation lines helps to visualize the extent to which the materials are stressed over time and gain insights into how materials deform under stress or respond to stresses. The estimation of dislocation densities has been carried out on metals and alloys using X-ray Diffraction (XRD), Transmission Electron Microscopy (TEM) and Electron Back-Scattered Diffraction (EBSD) techniques [27,37,39,40]. However, the measurement of dislocation densities at different length scales (nano) remains a major challenge [23,37,38].
Nevertheless, there have been a number of careful studies of dislocations in minerals such as halite, rock salts crystals, calcite, beryl crystals, halides, carbonate, lithium fluoride and olivine minerals [11,27,28,41,42,43,44,45,46,47]. These studies have revealed insights into plastic deformation mechanisms in rocks [11,27,28,43]. Furthermore, prior work by Barber et al. [27] and Barber et al. [28] have presented evidence of dislocation nucleation in rocks and local variations in the constitutive behavior under contact loading [27,44,45].
Most recently, however, indentation methods have been used to determine densities of geometrically necessary dislocations (GNDs) and statistically stored dislocations (SSDs) in metals and their alloys [23,48]. Studies on the variation in GNDs for large indentation depth and at different indentation size effect (ISE) zones have been used to obtain good approximations of dislocation densities of metals and their alloys [23,41,48,49]. However, dislocation studies of rocks and minerals in rocks are scarcely reported. A preliminary study by Phakey and Shafiee [18] on (001) cleavage of barite minerals crystals indicated that the crystals contain pure edge and pure screw dislocations and mixed dislocations, which are either predominantly screw or predominantly edge.
Fathers & Tanner [50] and Matthew et al. [51] analyzed the dislocations in barium titanate thin films of varying thickness, deposited on Ni substrates using polarized light imaging. The results show that crack density increases with increased strain due to strain incompatibility with the plastically deforming metallic Ni substrate [51]. Asenjo & Rojo [12] described the plasticity of barite mineral using the indentation method. The study identified dislocation generations in barite rock attributed to special deformation mechanisms previously reported in metals [12]. While these few earlier studies showed that dislocations are present in naturally occurring rock-containing barite mineral and synthetic barite crystals at larger depths, the behavior of barite rocks and the contributions of embedded dislocations in rocks containing barite and other non-barite minerals at uniaxial loading are not well understood.
Thus, in this study, we use nanoindentation methods to measure the hardness values and the dislocation densities in barite rocks with well characterized chemistries and microstructures. The size dependence of the hardness of barite rocks is studied at nanoscale indentation depth. The underlying dislocation densities are estimated using a combination of indentation theories by Ma and Clarke [52] and Nix and Gao [53]. These are used to extract the plasticity length scales, the total dislocation densities, the geometrically necessary dislocation (GND) densities, and the statistically stored dislocations (SSDs) densities. The implications of these measurements are then discussed for the plastic deformation of barite during mineral processing and the drilling of wells for oil and gas extraction. The impact of these activities is then examined and discussed to guarantee the safety of lives, the environment and responsible mineral extraction.

Theoretical Framework on Dislocation in Rocks and Minerals

Barite rock materials generally comprise approximately 45%–98% barite (BaSO4) mineral, with the remaining 5%–55% consisting of associated gangue minerals such as quartz, clay minerals, iron (Fe)- and lead (Pb)-bearing phases, as well as water-soluble salt minerals [54]. Barite rocks, like any other rocks, are subjected to stress when loaded, and the presence of defects such as dislocations affects their response to deformation and fracture. Similarly, the proportion and composition of the gangue minerals can significantly influence the physical and chemical behavior of the barite ore, the localized fracture, beneficiation processes, industrial applications and economic worth. Due to the random distribution of other minerals in addition to barite in the material, a significant variation in composition can be observed in barite rock, which makes it challenging to develop appropriate constitutive approaches to the modeling of the deformation and failure of barite rocks. Thus, in an effort to explore an alternative approach to the modeling of deformation of barite rock, this paper explores the use of mechanism-based strain gradient plasticity models [52,53] in the study of contact-induced deformation in barite rocks.
The density of geometrically necessary dislocations (GNDs or   ρ G N D s ) and statistically stored dislocations (SSDs or   ρ S S D s ) are calculated or extracted from the hardness data obtained by nanoindentation experiments. Based on the angle between the indenter and the indented surfaces, the Burgers vector β and average indentation depth h , the geometrically necessary dislocations (GNDs) are calculated using Equation (1). These are dislocations caused by indentation prior to plastic deformation.
ρ G N D s = 3   t a n 2 θ 2 × β × h
where ρ G N D s   are the densities of geometrically necessary dislocations, and θ is the angle between the indenter tip and the indented surface, which is an included angle of 142.3° [55]. β is the Burgers vector, and h is the average indentation depth on the indented surface. However, prior calculation of the geometrically necessary dislocations, the hardness data were extracted from nanoindentation experiments employed to evaluate the data corresponding to material’s hardness. The Oliver–Pharr method has been used to estimate the hardness [56,57,58,59,60,61]. This technique is embedded into commercial instrumented indentation systems and accepted by the ISO/FDIS 14577-1 standard as reported [62,63]. This method automatically derives the hardness (Hc) of the material samples using constitutive formulas as presented in the following equations.
E R = S π 2 A c
where E R is the reduced young modulus, S denotes the stiffness and A c is contact area given by A c = 24.5 h2f where h f = h m a x Ɛ P m a x S , and Ɛ is the geometric constant for a pyramidal indenter; Pmax is the indentation load and h m a x   i s the maximum depth on the indented surface [64,65].
Modifying Equation (2), we obtain
1 E R = 1 ϑ s 2 E s + 1 ϑ f 2 E i
The Young’s modulus (Ei) and Poisson’s ratio (ϑi) of the indenter are estimated at 1140 GPa and 0.07, respectively [62]. Similarly, Es and ϑs represent the Young’s modulus and Poisson’s ratio of the sample’s indented region [62]. For the barite rock, the Poisson’s ratio (ϑs) and Young’s modulus (Ei) are estimated to be 0.33 and 53.54 GPa using computational analysis (Vienna Ab initio Simulation Package) VASP Software (version 5.4.2) and 0.0729–0.1447 and 0.735 GPa using the Standard for Test Method of Engineering Rock Mass (GB/T50266-2013) [66,67] and Standards Test Method for Splitting Tensile Strength of Intact Rock Core Specimens (D3967-23) [68]. The contact hardness (Hc) is determined based on established equations [33,55].
  H c = P m a x / A c
A c = 24.5 h 2 f  
where Pmax is the indentation load measured in (N), A c is contact area measured in (nm2) and f is the force in N. It is based on the material hardness that the geometrically necessary dislocations and statistically stored dislocations (SSDs) are calculated.
The dislocations in barite rock during and after plastic deformation are the statistically stored dislocations (SSDs) as they are caused by random interactions and enlargement of dislocation lines. These dislocations can be calculated using Equation (6). Further details can be found in [23,53,69,70].
  ρ S S D s = H   μ β   2   4 γ β h    
where     ρ S S D s are the densities of statistically stored dislocations (SSDs), and β is the Burgers vector of the barite material, which is an intrinsic property. The Burgers vector for a barite system (with an orthorhombic crystal structure) was computed using the smallest lattice parameter a = 5.52 Å. Equation (7) is useful in computing Burgers vector based on a few specific core material properties—barite lattice parameters. The Burgers vector used in this study is 1.06 nm. The calculated/computed value agrees with values reported in the literature [18]. Also, the average indentation depth h and the average hardness of the barite rock obtained from indentation experiment, H, are substituted into Equation (6) to obtain the SSDs. Furthermore, the shear strain γ and the rigidity or shear modulus μ are calculated as 21.01 GPa using the Vienna Ab initio Simulation Package (VASP Software). These parameters are substituted into relevant equations to compute the densities of SSDs and GNDs, respectively [71]. As mentioned earlier, in this study, the Burgers vector, which is an intrinsic property, was computed using Equation (7), which is a function of the unit cell edge length. Based on a few fundamental data that describe the overall crystal structure, lattice translation and slip system of the barite rocks under the study, the computed value was compared with two studies [72,73] to examine the extent of deviation and compute the Burgers vector. Table 1 presents the lattice parameters of barite.
The Burgers vector for the barite rock was computed using Equation (7).
β = 11 3 a
where a is the smallest lattice translation on the crystal structure of barite or the unit cell edge length mineral (nm). The Burgers vector remains an intrinsic material property, and it is considered such in this study. As mentioned, the crystal structure of barite was studied using the computational approach analysis (Vienna Ab initio Simulation Package) VASP Software (version 5.4.2) to obtain the smallest lattice translation. In this work, a Barkovich indenter tip with a triangular radius of 20 nm and a three-sided pyramidal shape was used to perform the nanoindentation experiment.

2. Materials and Methods

2.1. Collection of Barite Rock Samples

Barite rock aggregates or stones were collected from mining sites located at Ibi Local Government of Taraba State, in Northeastern Nigeria. Prior to the collection of the barite stones, the rock mass was also blasted using explosives to obtain smaller aggregates or stones of barite rocks for ease of transportation. A representative barite rock-like material was selected at four (4) mining sites.

2.2. Sample Preparation

The barite rocks, Ibi barite rock sample 1 (IB1), Ibi barite rock sample 2 (IB2), Ibi barite rock sample 5 (IB5) and Ibi barite rock sample 6 (IB6), were manually cleaved and trimmed into a rectangular shape of [L = 60 mm (about 2.36 in), B = 39 mm (about 1.54 in) and H = by 9 mm (about 0.35 in)], using a hammer, metallographic cutter and grinding and polishing machine. The polishing were carryout using a (Buehler Eco-Met 300 Pro System, Buehler, Lake Bluff, IL, USA) with different size grit papers that were mounted on an adjustable rotating disk. These samples were polished until a marrow-like surface was achieved. The samples were then moved to the Nanoindentation Laboratory for indentation experiments. Further details on sample indentation experiments are presented in Section 2.3.

2.3. Experimental Methods

2.3.1. Grid Nanoindentation

Instrumented grid nanoindentation was used to obtain the local mechanical properties of the barite rock structures. This consists of indentations that are introduced at predetermined points on multiphase or heterogeneous materials, such as the barite rock materials that were examined in this study. This was used to obtain quantitative information on the local mechanical properties of the rock samples, which were mounted on the magnetic stage of the Hysitron Triboindenter (Hysitron Model TI 950, Minneapolis, MN, USA). The indentation experiments were carried out using procedures described in the prior work of Ojo et al. [74] and Wang et al. [75]. Indentation load–displacement data were obtained within a scan size of 70 μm × 70 μm. The loading rate was fixed at 200 μN/s to minimize the effect of strain hardening on the indented surfaces.
A total of 100 indents from each sample were measured. The Continuous Stiffness Measurement (CSM) method was used to measure and estimate the depth-dependent mechanical properties. CSM offers a continuous assessment of stiffness during loading of the barite and gives a representation of the mechanical phases present in each barite rock sample. Considering the heterogeneous nature of barite rocks, four sets of barite rock samples were tested by nanoindentation to assess the variation in mechanical properties of the barite rock samples and describe their plasticity. The nanoindenter was calibrated following the tip-to-sample calibration procedures in the transducer calibration methodology. The offset between the tip, the optics, and the tip shape was calibrated following the standard transducer 283 and Automatic Optic-Probe Tip Offset calibration techniques.

2.3.2. Hardness of Barite Rock Materials

Hardness values were extracted from the data obtained from the grid nanoindentation experiments. These were integrated into a 2D hardness map that was developed using a TriDiMap toolbox embedded in the MATLAB 2023b software package (Mathwork Inc., Natick, MA, USA). The number of phases present in the samples were also identified from the statistical distributions of hardness data and reduced elastic moduli data that resulted from the measurements. Further details on the grid indentation techniques can be found in the original papers by Ezenwafor et al. [55] and Ojo et al. [74]. It is important to note here that, although the surface topography varied across the different indentation points, methods reported in the literature were used to reduce this effect [55,74]. Statistical deconvolution techniques were also used to identify the data obtained from different phases that were indented within the indentation grids [55,74].

2.3.3. Strain Gradient Plasticity

Strain gradient plasticity describes the plastic behavior of materials under non-uniform deformation. It can be used to account for the variations in plastic deformation phenomena across multiple length scales, i.e., from the micro- to the nanoscales [71]. Although classical plasticity theory applies to homogeneous or uniform responses of materials to deformation, strain gradient plasticity incorporates the effects of spatial gradients in plastic strain for heterogeneous materials such as barite ore and other rocks’ minerals. In this study, additional terms were introduced into the constitutive equations that account for the gradient of plastic strain and the resulting non-uniform distribution of dislocations.

2.3.4. Dislocation Theory

The dislocations in barite rock samples were described based on the strain gradient plasticity of the Nix and Gao Model [53]. This model assumes that both the geometrically necessary dislocations (GNDs) and statistically stored dislocations (SSDs) coexist in a sample during plastic deformation, as shown in Taylor’s hardening equation as presented in Equation (8), where the flow stress, σ , is related to the total dislocation density, ρ T [23,53].
σ = 3 α μ β  
ρ T = σ   3 α μ β   2
Also, the total dislocation in the material can also be calculated using Equation (9) as presented below
ρ T =   ρ G N D s + ρ S S D s
where   ρ G N D s   a n d   ρ S S D s represent the geometrically necessary dislocations (GNDs) and statistically stored dislocations (SSDs). According to Taylor’s theory, the flow stress, σ , is linked to the hardness, H , as indicated in Equation (11).
H = 3 σ
Further details on GNDs can be found in the original articles by Cui et al. [23], Barber et al. [27] and Nix and Gao [53]. Equations (11) and (12) present a relationship between the hardness and the multiplicative inverse of the indentation depth and the characteristic length h* while H o , which is the intercept on the graph of H 2   v e r s u s   1 h   [23,53,71]. Equation (12) is expressed as
H 2 = H o 2 1 + h * h
Equation (12) can be modified to calculate the characteristics length where you expect the indentation sizes effect to happen in the material. Therefore,
  h * = H 2 h + H o 2   h   H o 2  
where H o 2 comes from the square of H o and h * is characteristic length, which is independent of barite rocks being indented in each experiment and the geometry of the indenter [23,49,53].

2.3.5. Material Length Scale

The length scale of barite rock describes correlation among strain gradient, deformation and the hardness of barite samples as expressed in Equation (14). This quantity is used to determine whether the strain gradient is large enough to provide significant contribution from the GNDS to the flow stress based on the indents in the micro and nano regime. Further details are available in the literature [23,53,71]. However, this parameter is expressed as
l ˆ = β μ σ o 2
where β is the Burgers vector, μ is the rigidity or shear modulus of the barite rock, σ o is the flow stress in the absence strain gradient, and l ˆ is the material length scale—the scale at which the strain gradient operates.

2.3.6. Dislocation Spacing—Ashby, Ma and Clarke Models

The dislocation spacing was obtained by taking an average of GNDs and SSDs. This average density is proportional to average shear strain, γ , to accommodate the displaced volume during plastic deformation, as shown in Equation (15), the dislocation spacing is expressed as
L = 1   ρ G N D s
where L is the dislocation spacing.

3. Results

3.1. Rock Samples and Minerals

Mineral Phases and Composition of the Barite Rock-like Materials

Table 2 presents the mineral phases in the materials that describe the mineralogical compositions of the rock-like materials. Each of these materials contain quartz (SiO2), chlorite (Mg,Fe)5(Al,Si)5 O10, albite (NaAlSi3O8) and barite (BaSO4). The local compositions of each barite rock material vary from point to point.
The figures/weight percentage (% wt.) for each phase of the barite rocks or samples (IB1, IB2, IB5 and IB6) were presented as part of the XRD results. The data were automatically computed and presented as obtained. The sum of the weight of the four mineral phases in barite rock IB2 is above 100% and that of IB1 is 0.7% less than 100%. Considering that the computation was not performed manually, it is anticipated that an error occurred during the computation for the barite rock samples’ weight percentage (% wt.). In this study, the error may be due to inaccurate peak identification (peak overlap) and matching of peaks using the ICPDS/ICDD cards and/or the presence of amorphous or poorly crystalline phases not fully accounted for in the XRD analysis of the barite rocks. Other possible sources include calibration error and inadequate sample preparation.
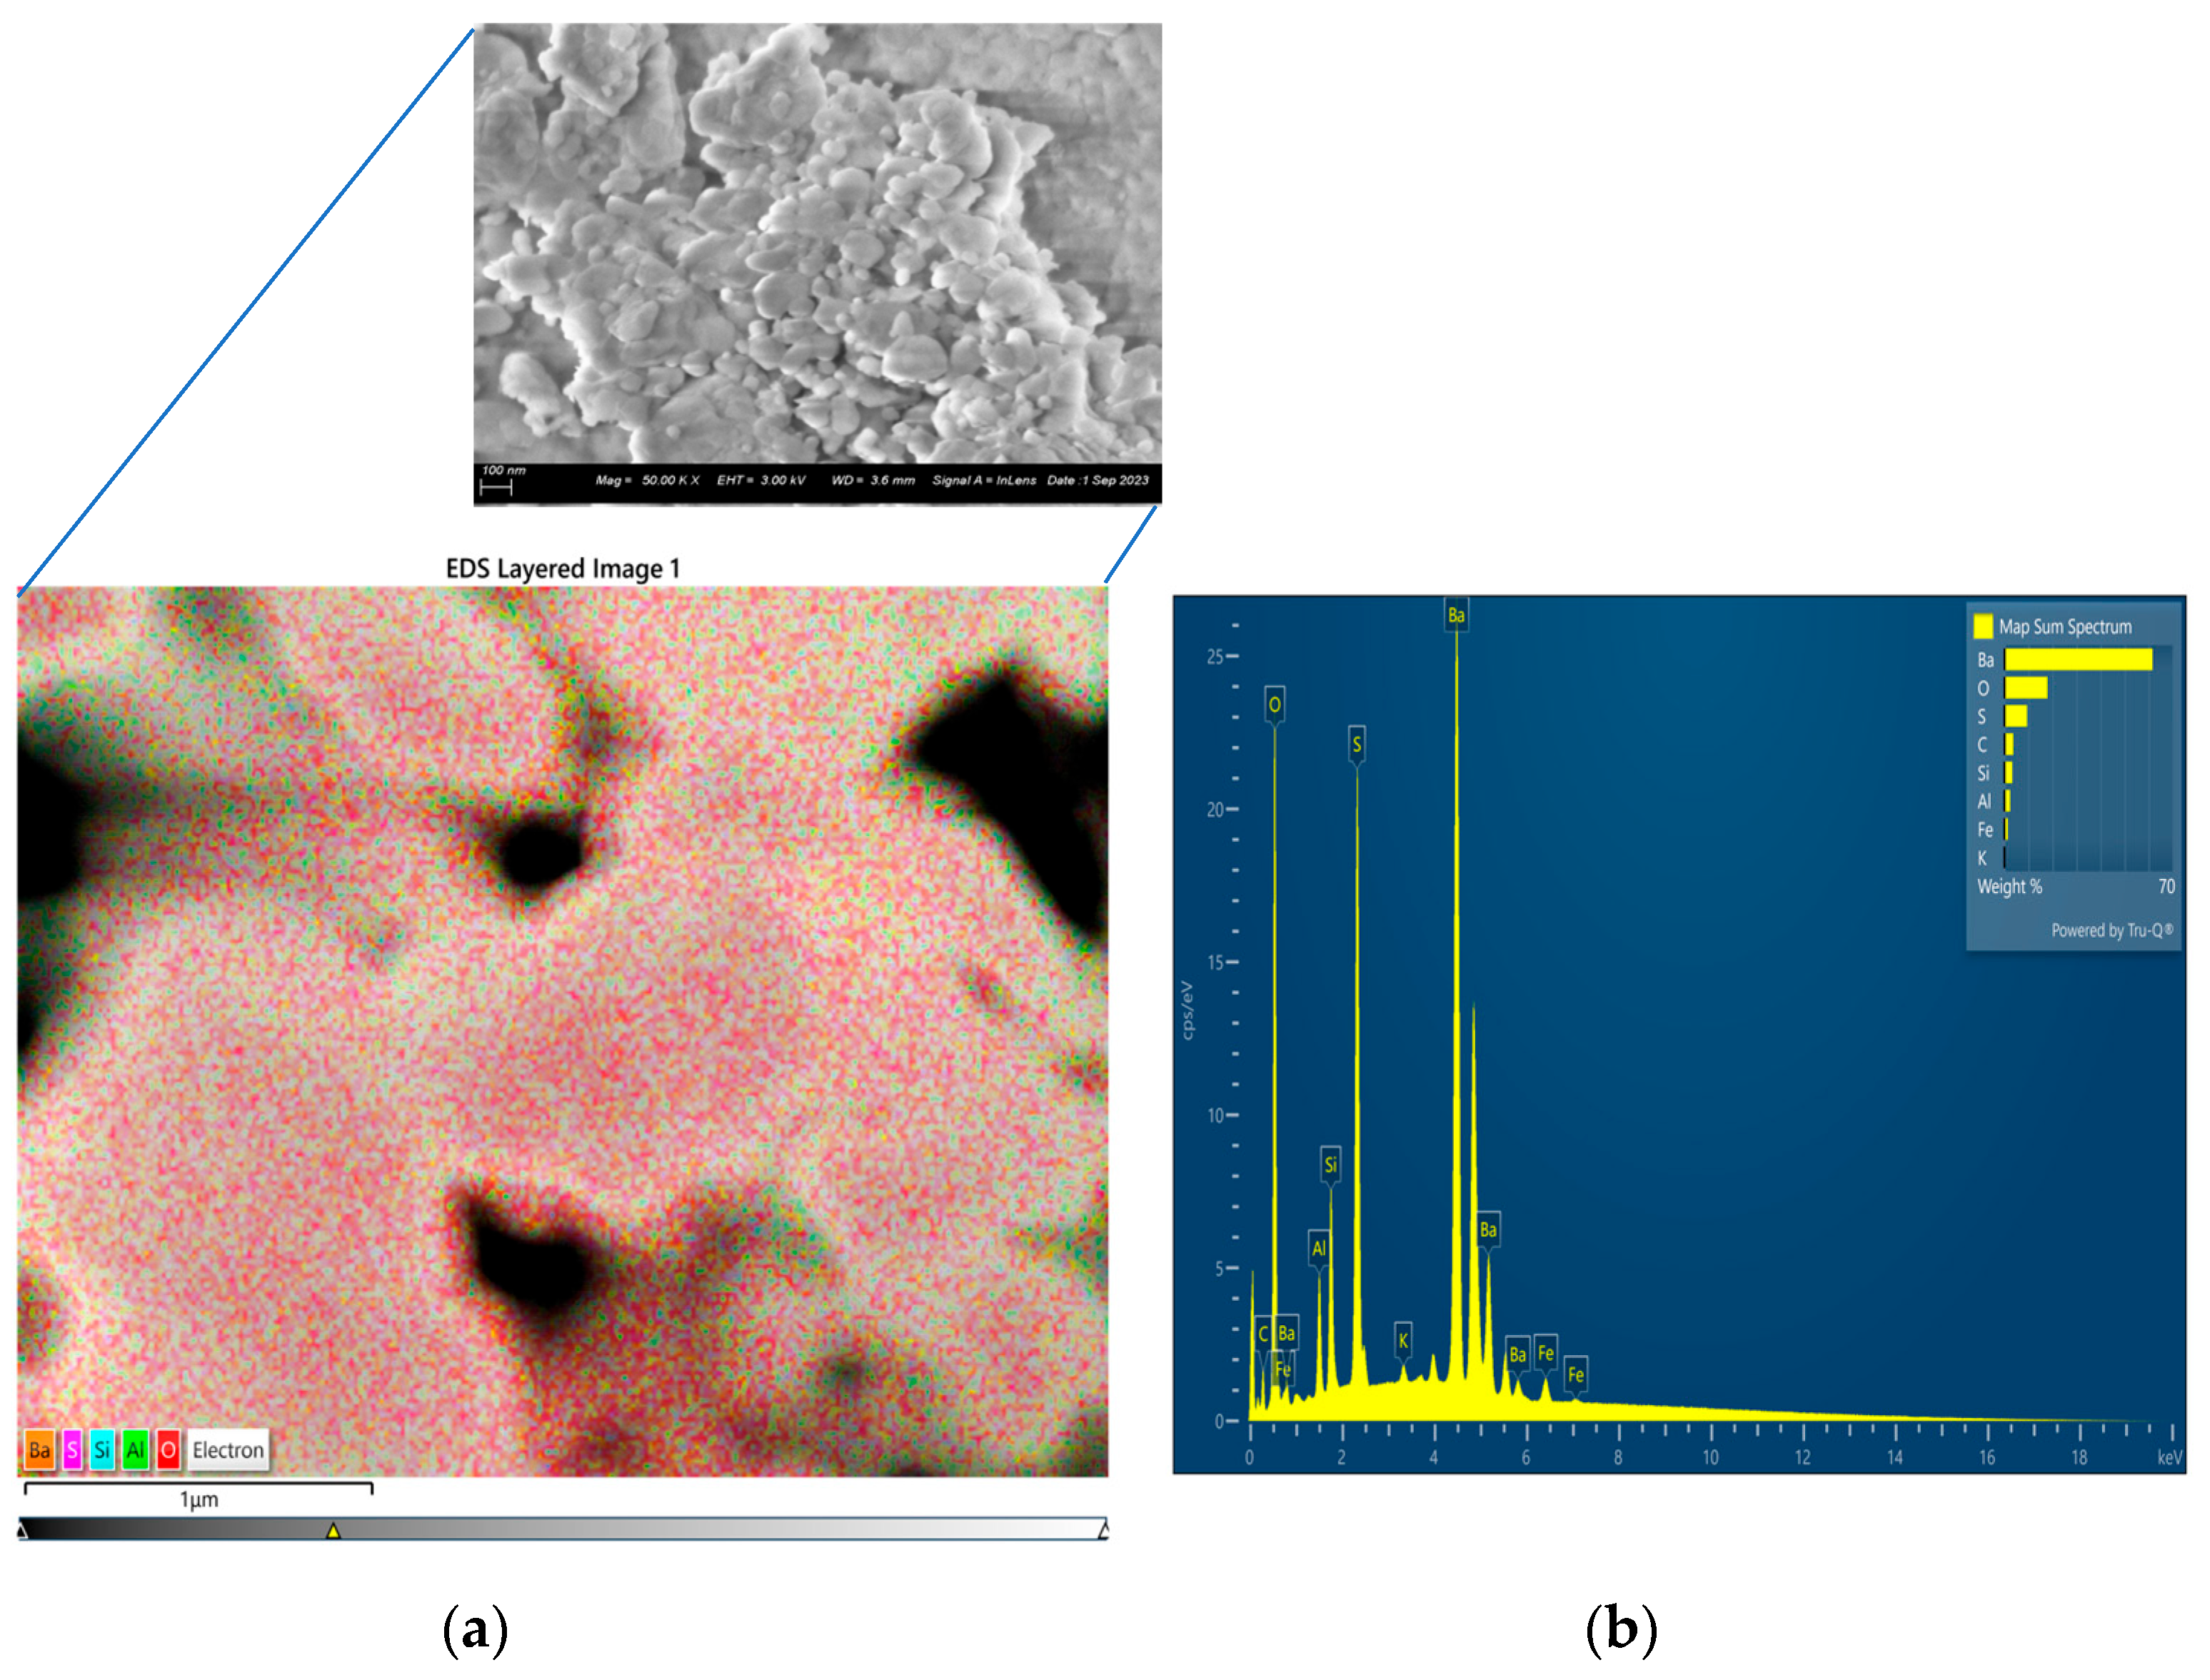
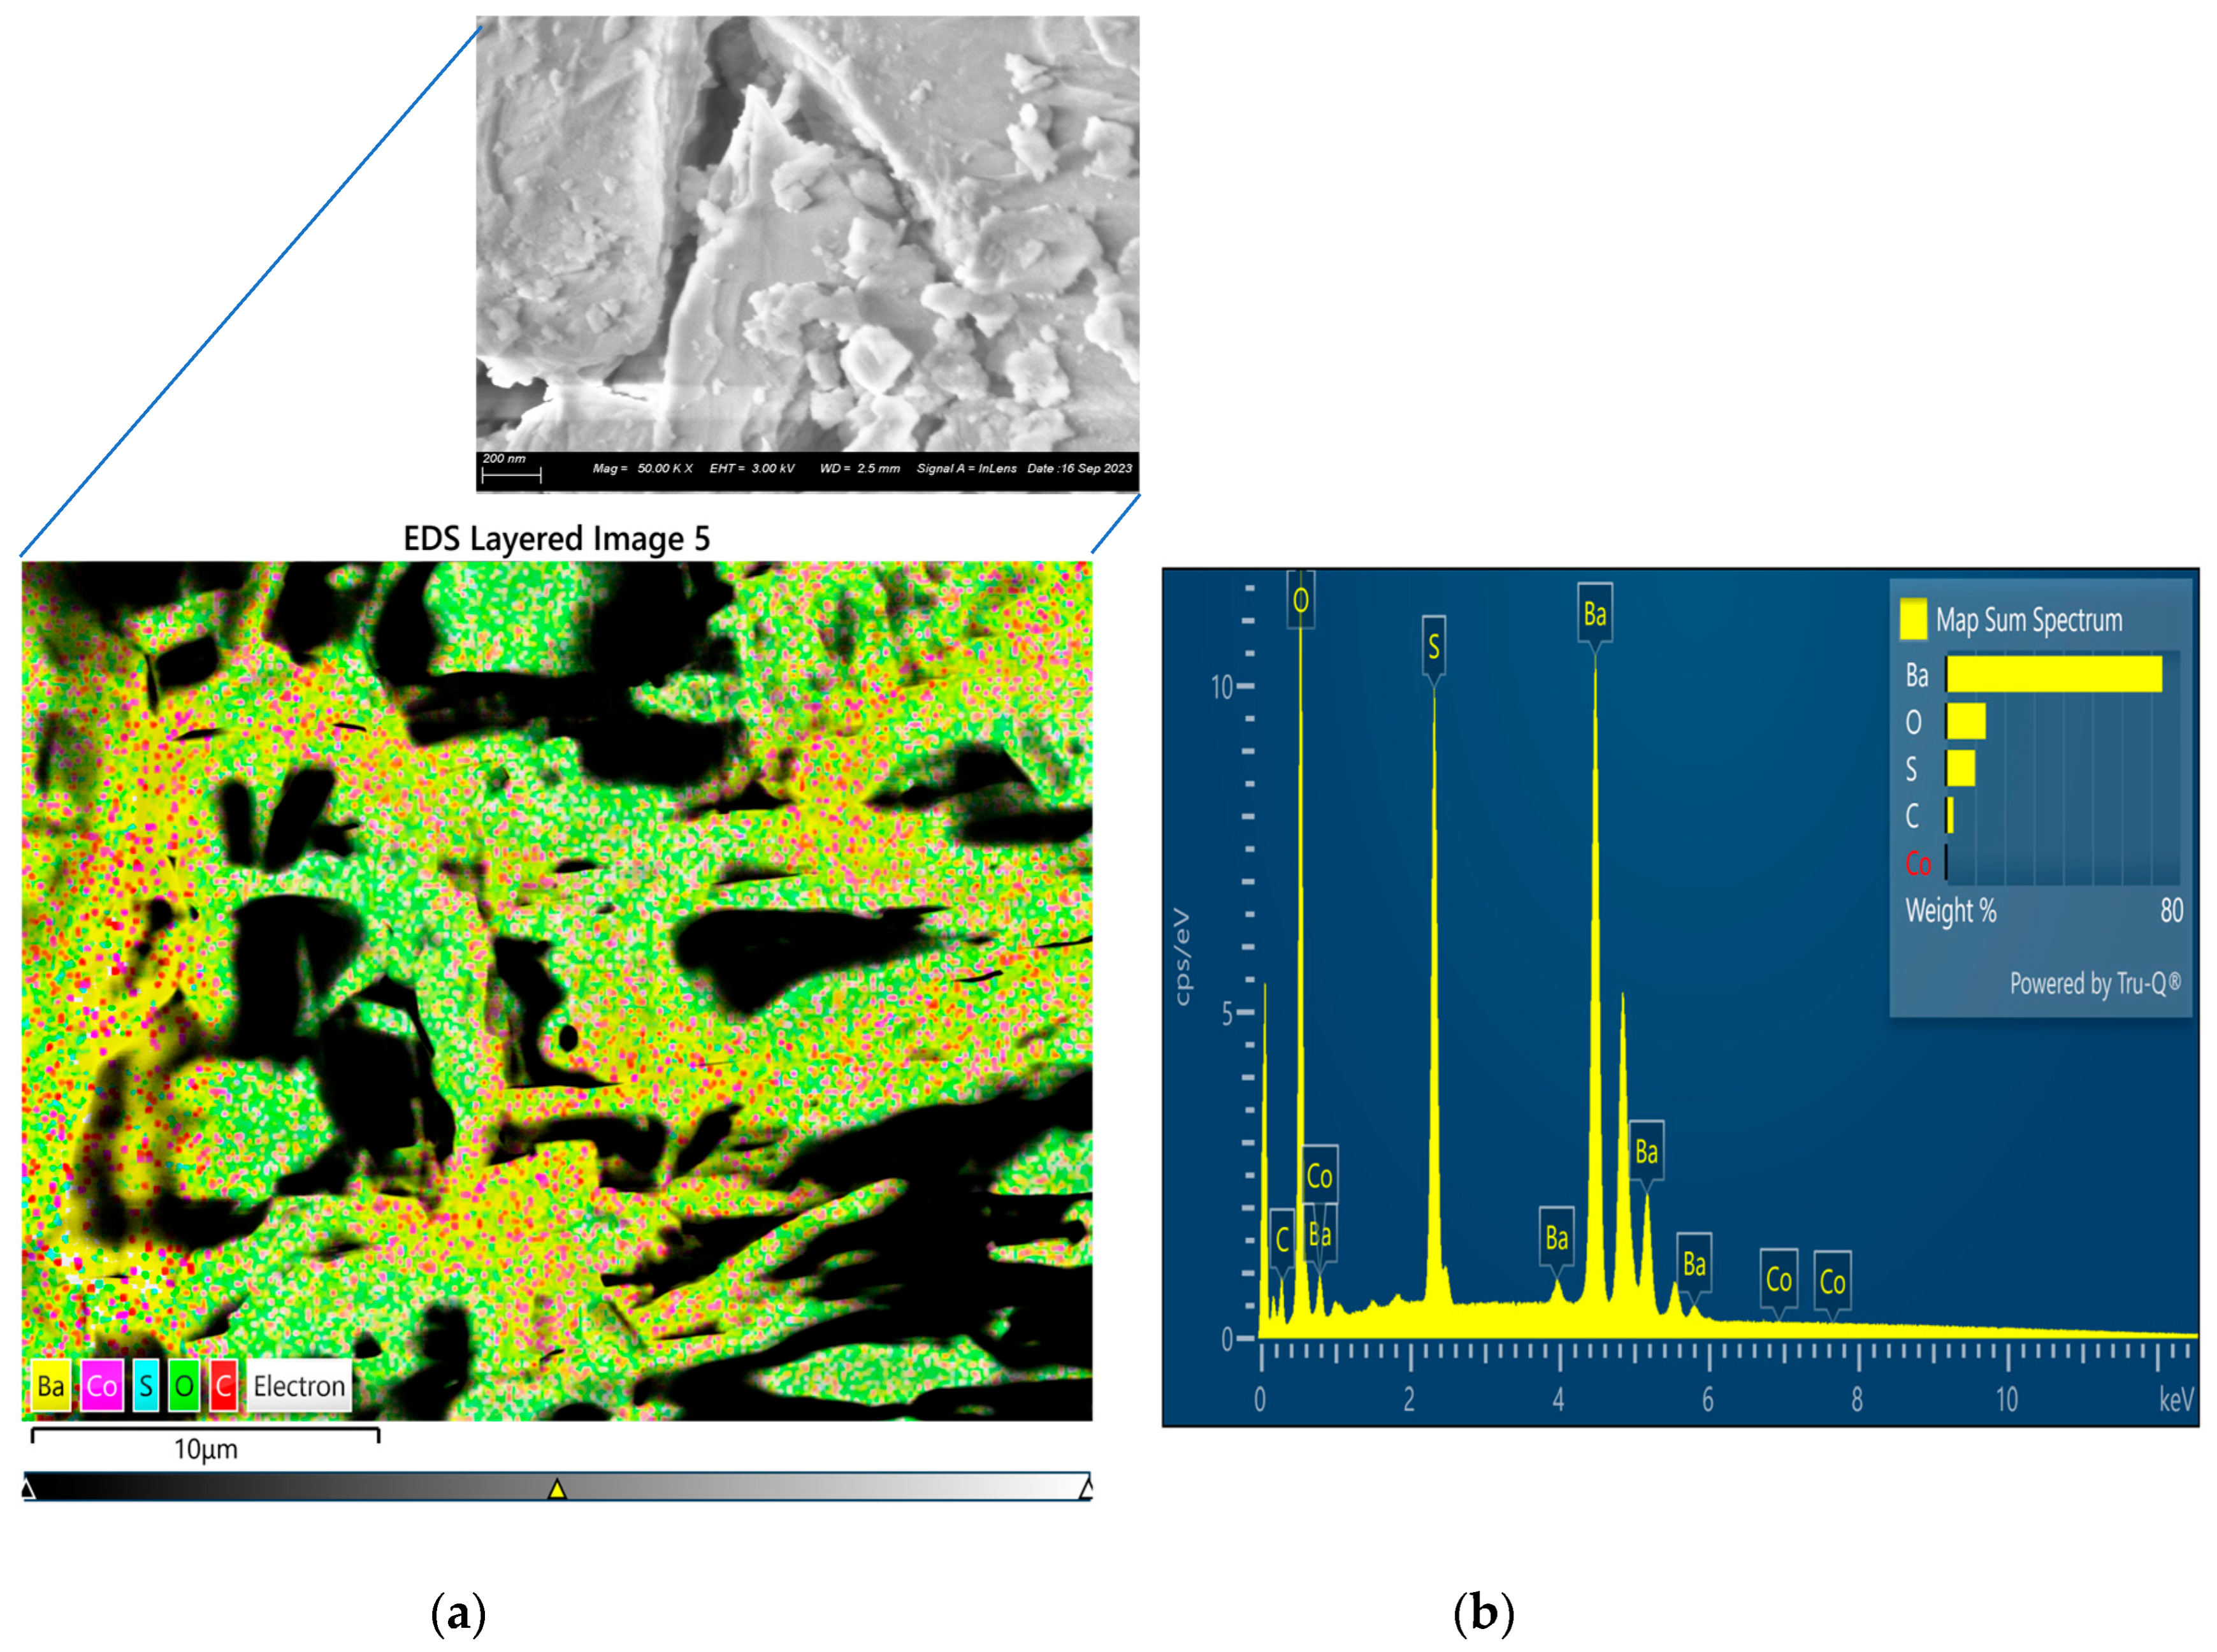
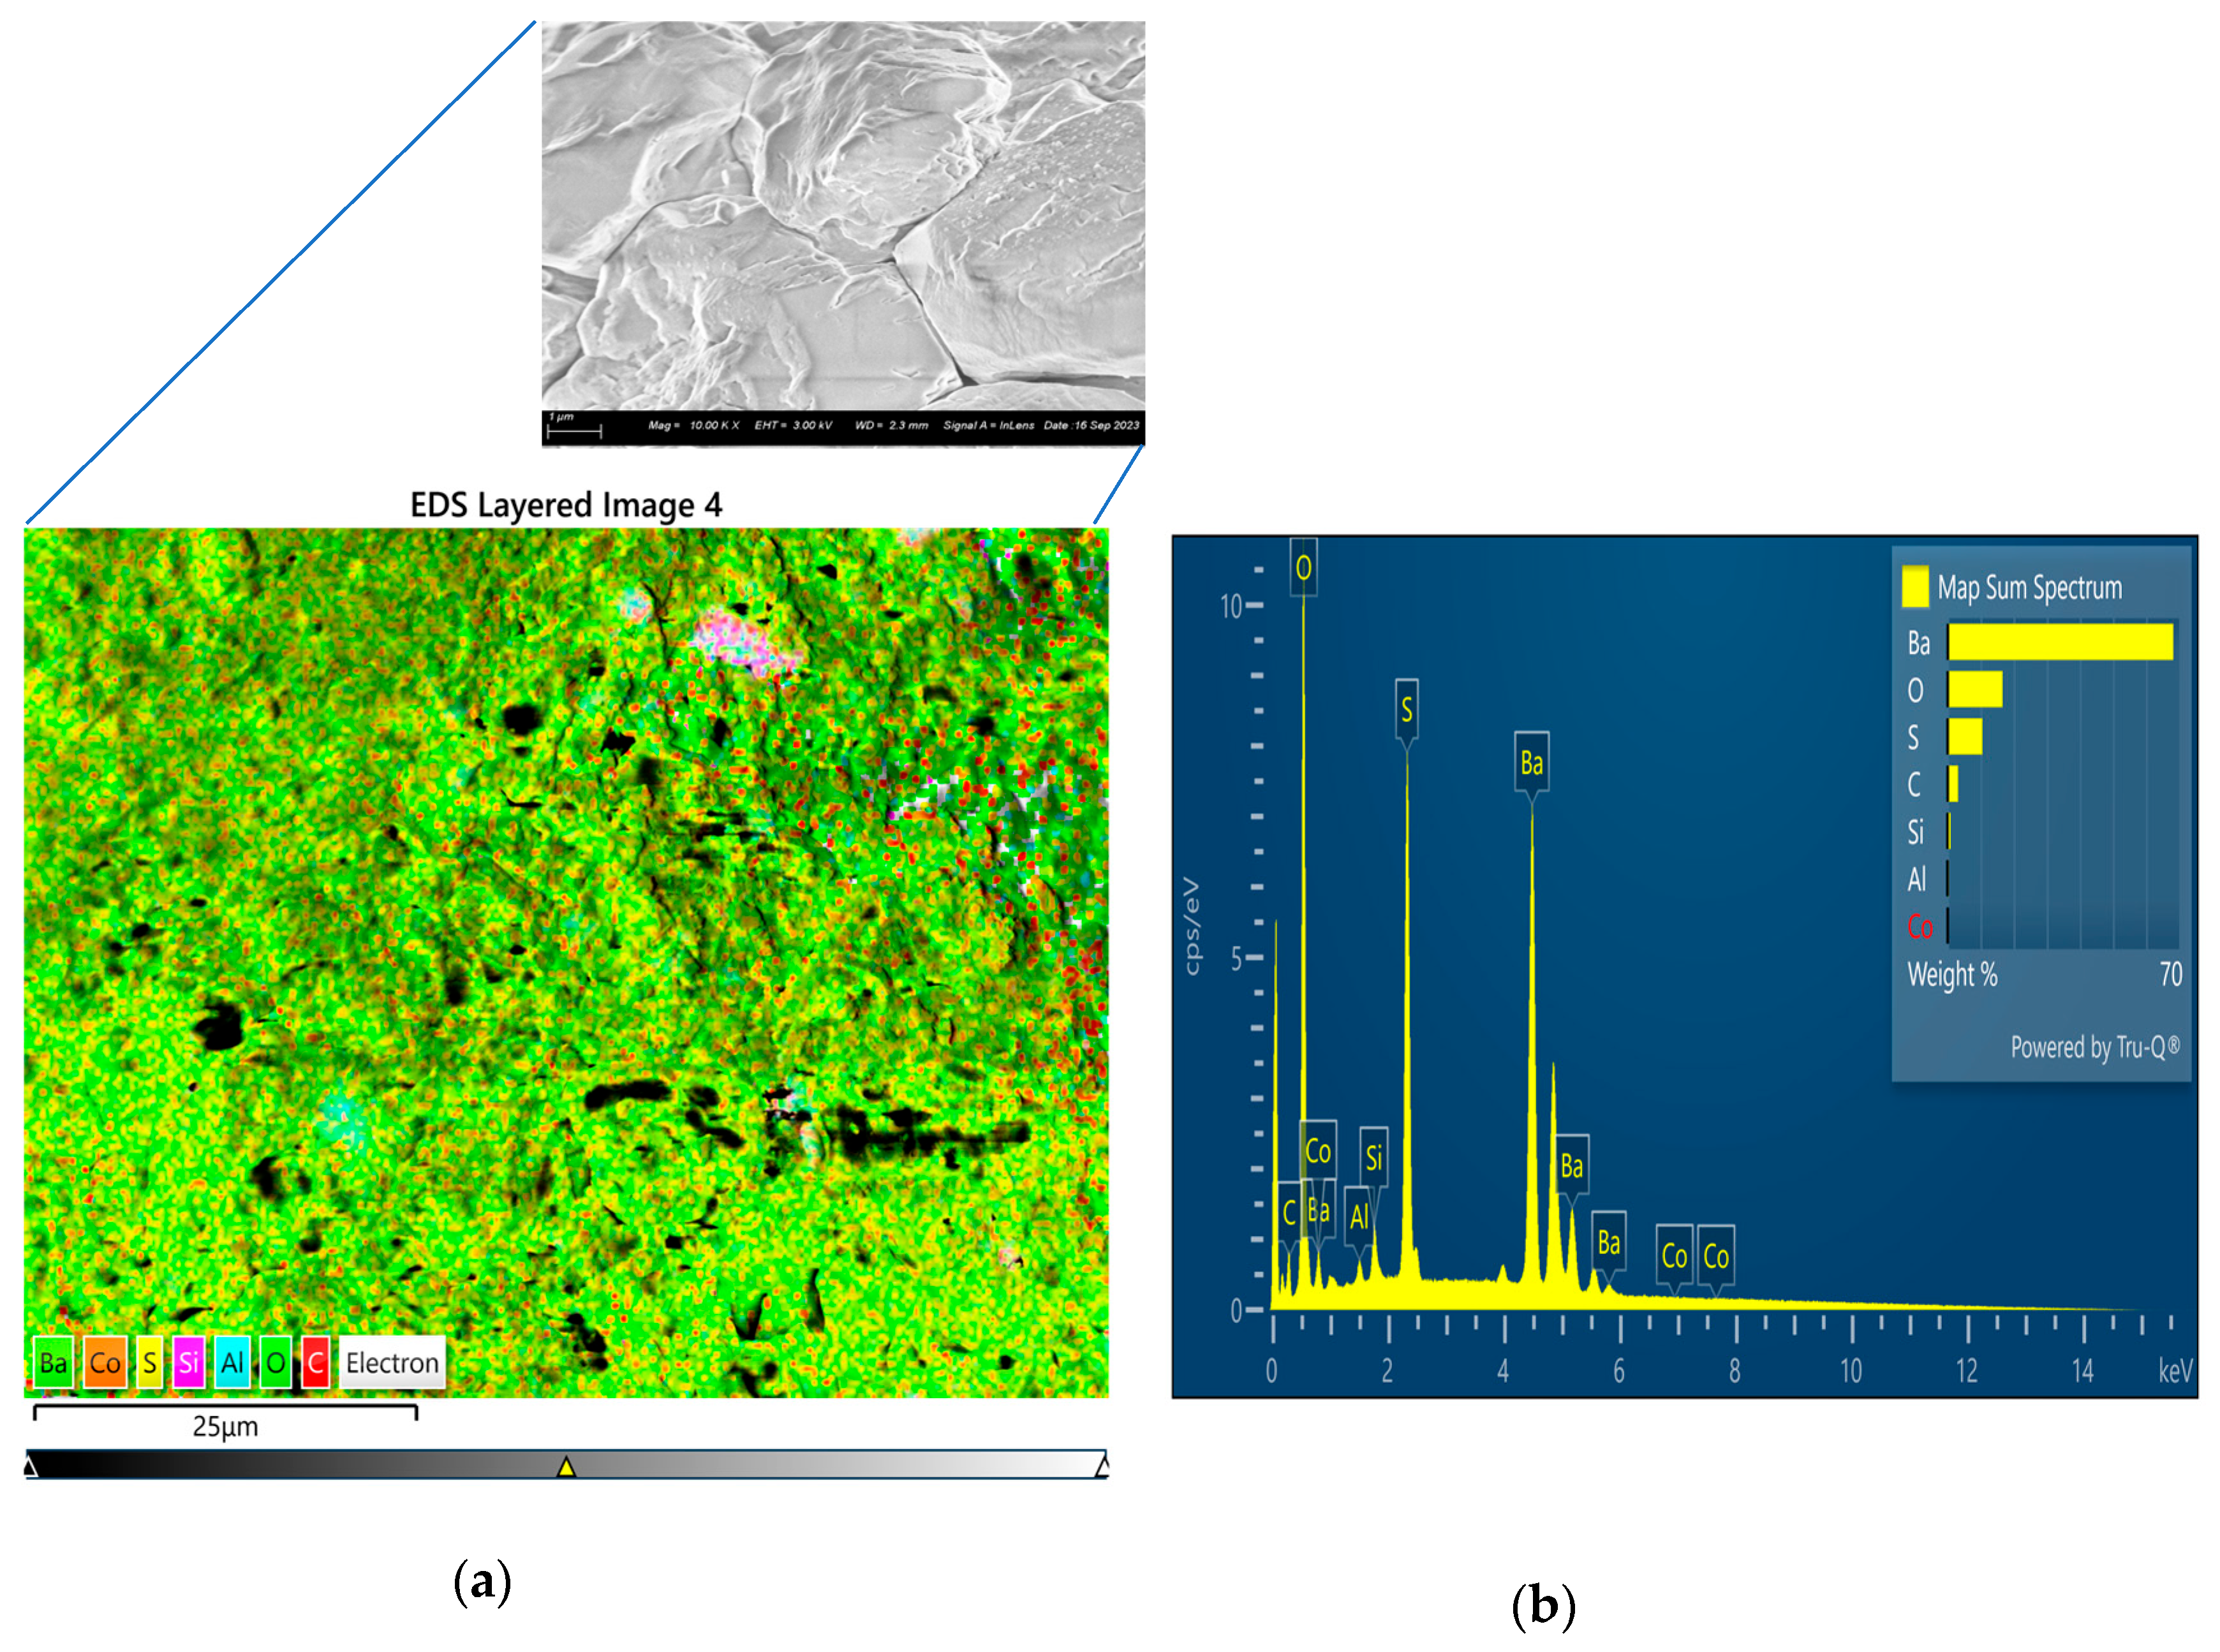
Based on Figure 1, Figure 2, Figure 3 and Figure 4 and Table 2, the side-by-side correlation of the two sets of results is presented. The XRD results in Table 2 show that the barite rock samples IB1, IB2, IB5 and IB6) has four mineral phases composed of barite (Ba, S, O), quartz (Si, O), chlorite (Mg, Fe, Al, Si, O) and albite (Na, Al, Si, O). The EDS results showed that IB1 is composed of O, Si, Al, K, C, Fe, Na, Ca, Ba, S and P, IB2 is composed of Ba, O, Si, C, Si, Al, Fe and K, IB5 is composed of Ba, O, S, C and Co while IB6 is composed of Ba, O, Si, C, Si and Al. The mineralogical/elemental compositions of each sample presented by XRD in Table 2 and EDS of SEM in Figure 1, Figure 2, Figure 3 and Figure 4 match, up to 70%–95%. The EDS results provide the elemental composition of the samples at the surface (a few depths).
In contrast, XRD offers a description of the elemental composition of the barite rock at larger depth. This indicates that the most dominant elements, such as Ba, S, Si, C, Al and O, are presented in Table 2 and Figure 1, Figure 2, Figure 3 and Figure 4. Even though the types of elements tested in each of the four images are not exactly the same. These trends are anticipated or expected because the composition of the barite rock samples would not be exactly the same for many reasons. Barite rocks, like other ores or rocks containing minerals and geomaterials, do not have exactly the same elemental compositions. Similarly, the barite rock samples are selected from different mining sites (different locations) and at different depths. It is well established in the literature that the quality and composition of barite rocks or ores vary across depths and at different locations within the barite veins. These findings earlier reported on barite confirm the quality contrast and varying composition, which is mainly responsible for the variation in the mechanical properties and rocks’ response to stress, as reported in the paper.
The figures describe the role of each element contained in the barite rock samples. The quantitative trends describe the enrichment of the barite rock-like materials. This information provides insight to the origin and formation of the materials, and the implications of the embedded dislocation structures in the materials during rock drilling, mining and comminution. Overall, the variation in composition and the presence fissures, enclosed pores, and long-narrow openings have significant impact on the rock’s response to gradual and plastic deformation at different scales.

3.2. Properties of the Barite Rock Mineral Samples

3.2.1. Hardness of the Rock Samples Based on 2D Heat Maps and Statistical Deconvolution

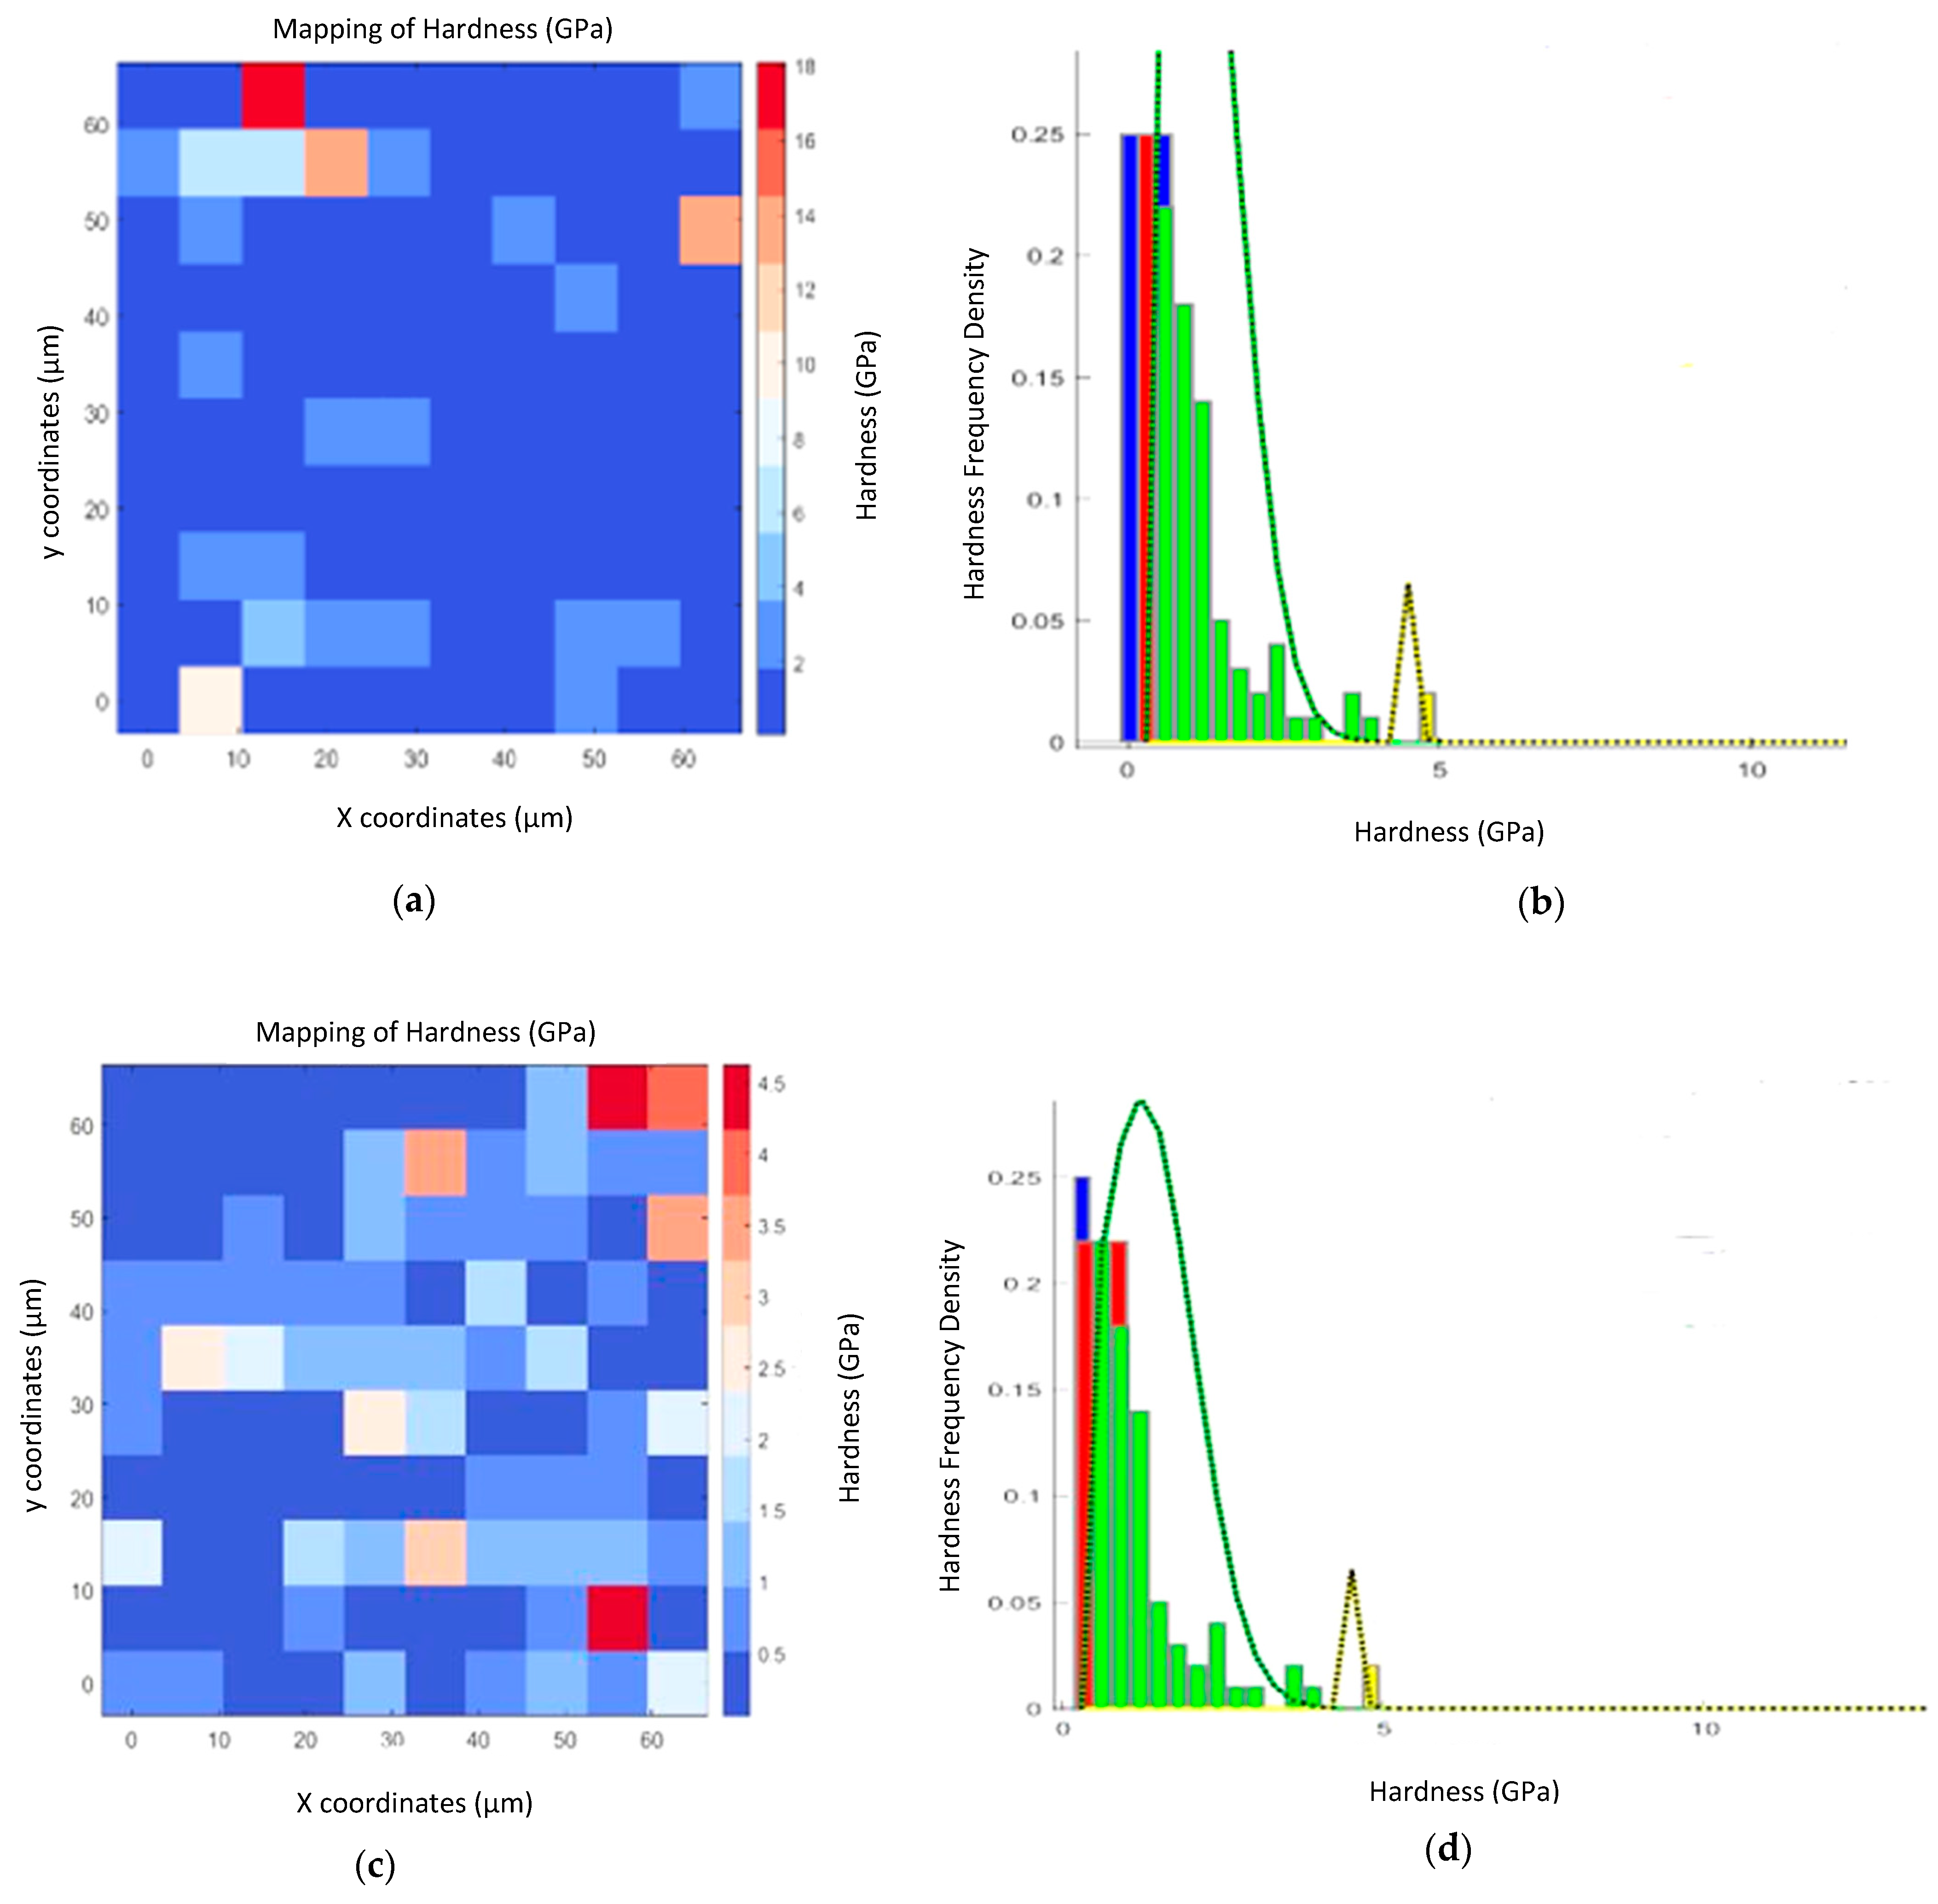
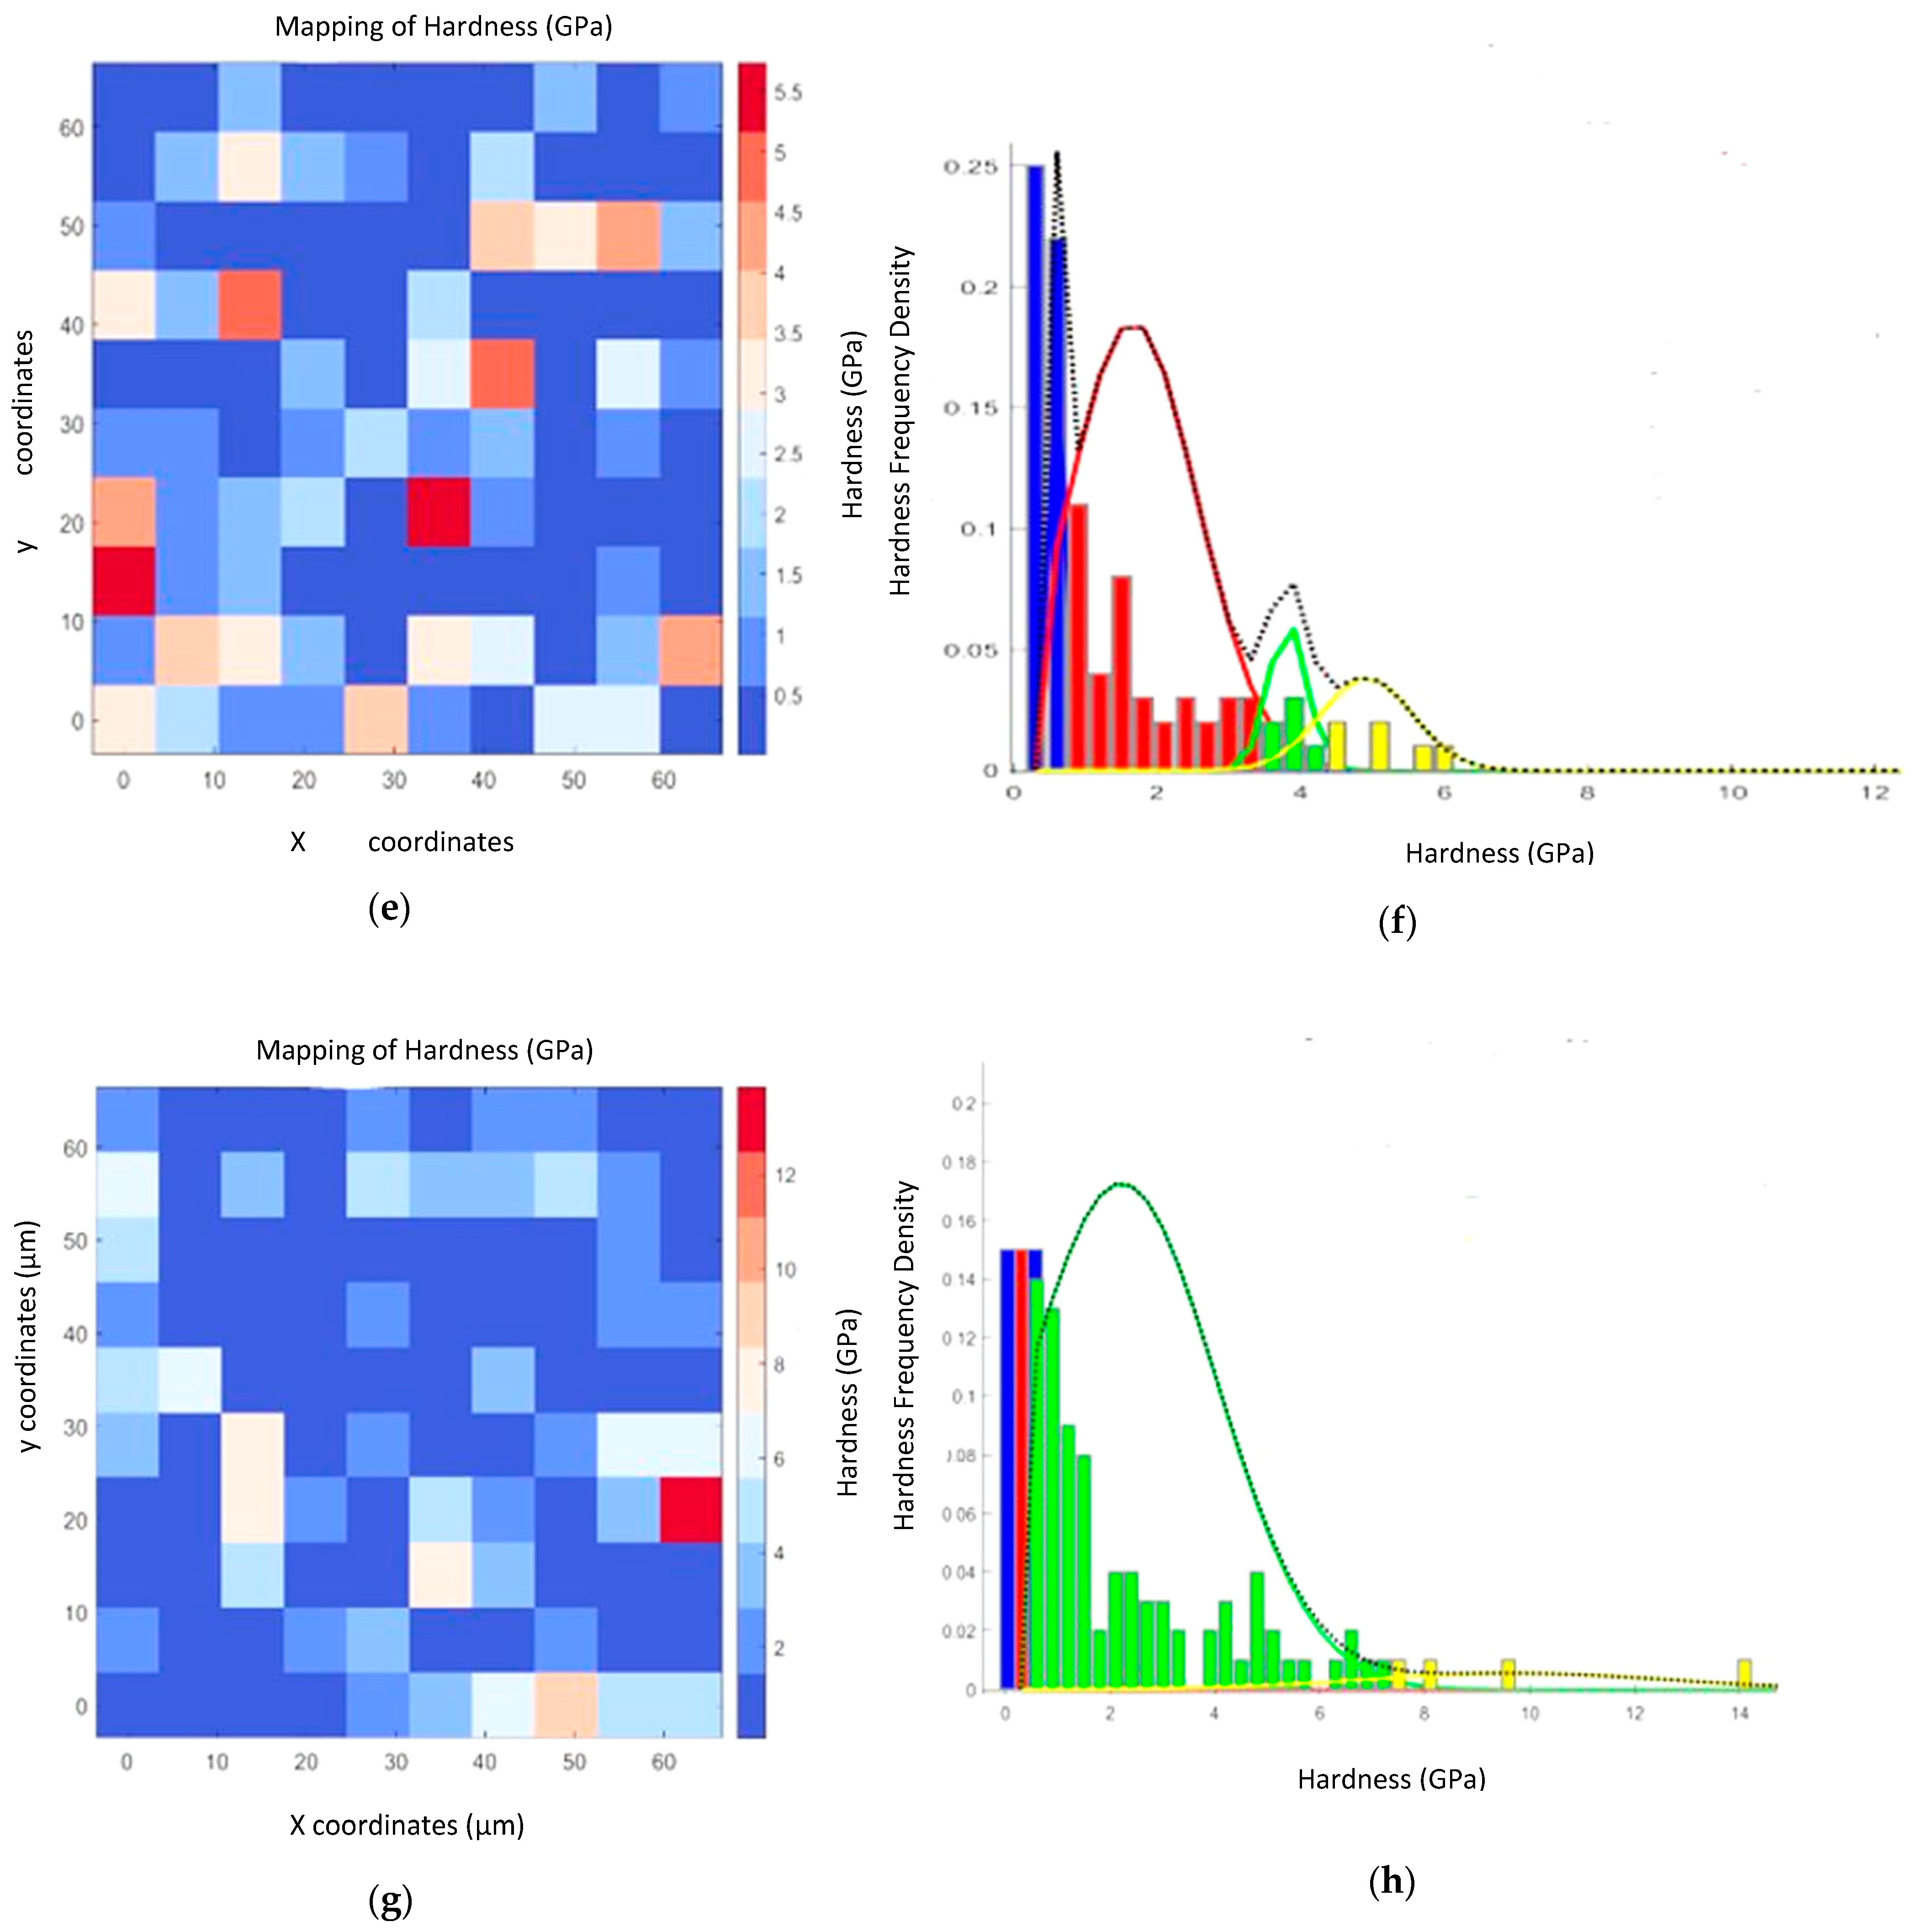
Figure 5a,c,e,g,h present 2D hardness heat maps for the barite rock materials. The corresponding statistical distributions of hardness values are presented in Figure 5b,d and 6f,h. Note that within each of the statistical distributions, distinct distributions are identified for each of the phases within the barite rock materials. Similarly, the heterogeneous nature of the rocks is consistent with the ranges of hardness values that are observed in Figure 5.
As compared to rock samples IB1, IB2 and IB5, rock sample IB6 has well-represented phases within the intermediate hardness range—two of the four phases have mineral phases with hardness values beyond 6 GPa. Similarly, the statistical representation of the mineral phases in Figure 5b,d,f,h show that more than 15% of the minerals are harder than pure barite mineral. While these variations are relatively small, they are likely to affect the deformation and cracking of the rocks. Also, the local variation in barite rocks materials is traceable to the association of oxides of different hardness [76,77,78,79,80,81,82,83].
Overall, Table 2 and Figure 5a–h describe the relationship between the statistical deconvoluted data (Figure 5b,d,f,g) and up-scaled mechanical data and the bulk rock composition based on the % weight of the minerals in the barite rock. The rock contains four major minerals, as shown in Table 2. The statistical deconvolution of the mineral in the rocks (Figure 5b,d,f,h) also alluded to the presence of these minerals. Of the four minerals, barite and quartz represent ~90%. Barite is a relatively soft mineral, while quartz mineral is extremely hard. However, there are regions of mineral association where the two minerals coexist, indicating average hardness values. While quartz occupies the highest portion based on the mineral weight percentage (%wt), it is evident in Figure 5a–h (2D hardness value map and the graphs of statistical deconvolution) that quartz mineral is sparsely distributed across the indented portion of the mineral surface. On the other hand, Figure 1a, Figure 2a, Figure 3a and Figure 4a show that barite mineral is densely distributed and locally concentrated within the rocks. Hence, the failure of barite rocks depends on the mechanical properties of a particular contact surface and the bulk mechanical properties related to the volumetric heterogeneity of the rock samples.

3.2.2. Hardness of the Barite Rock Materials at Different Indentation Depths

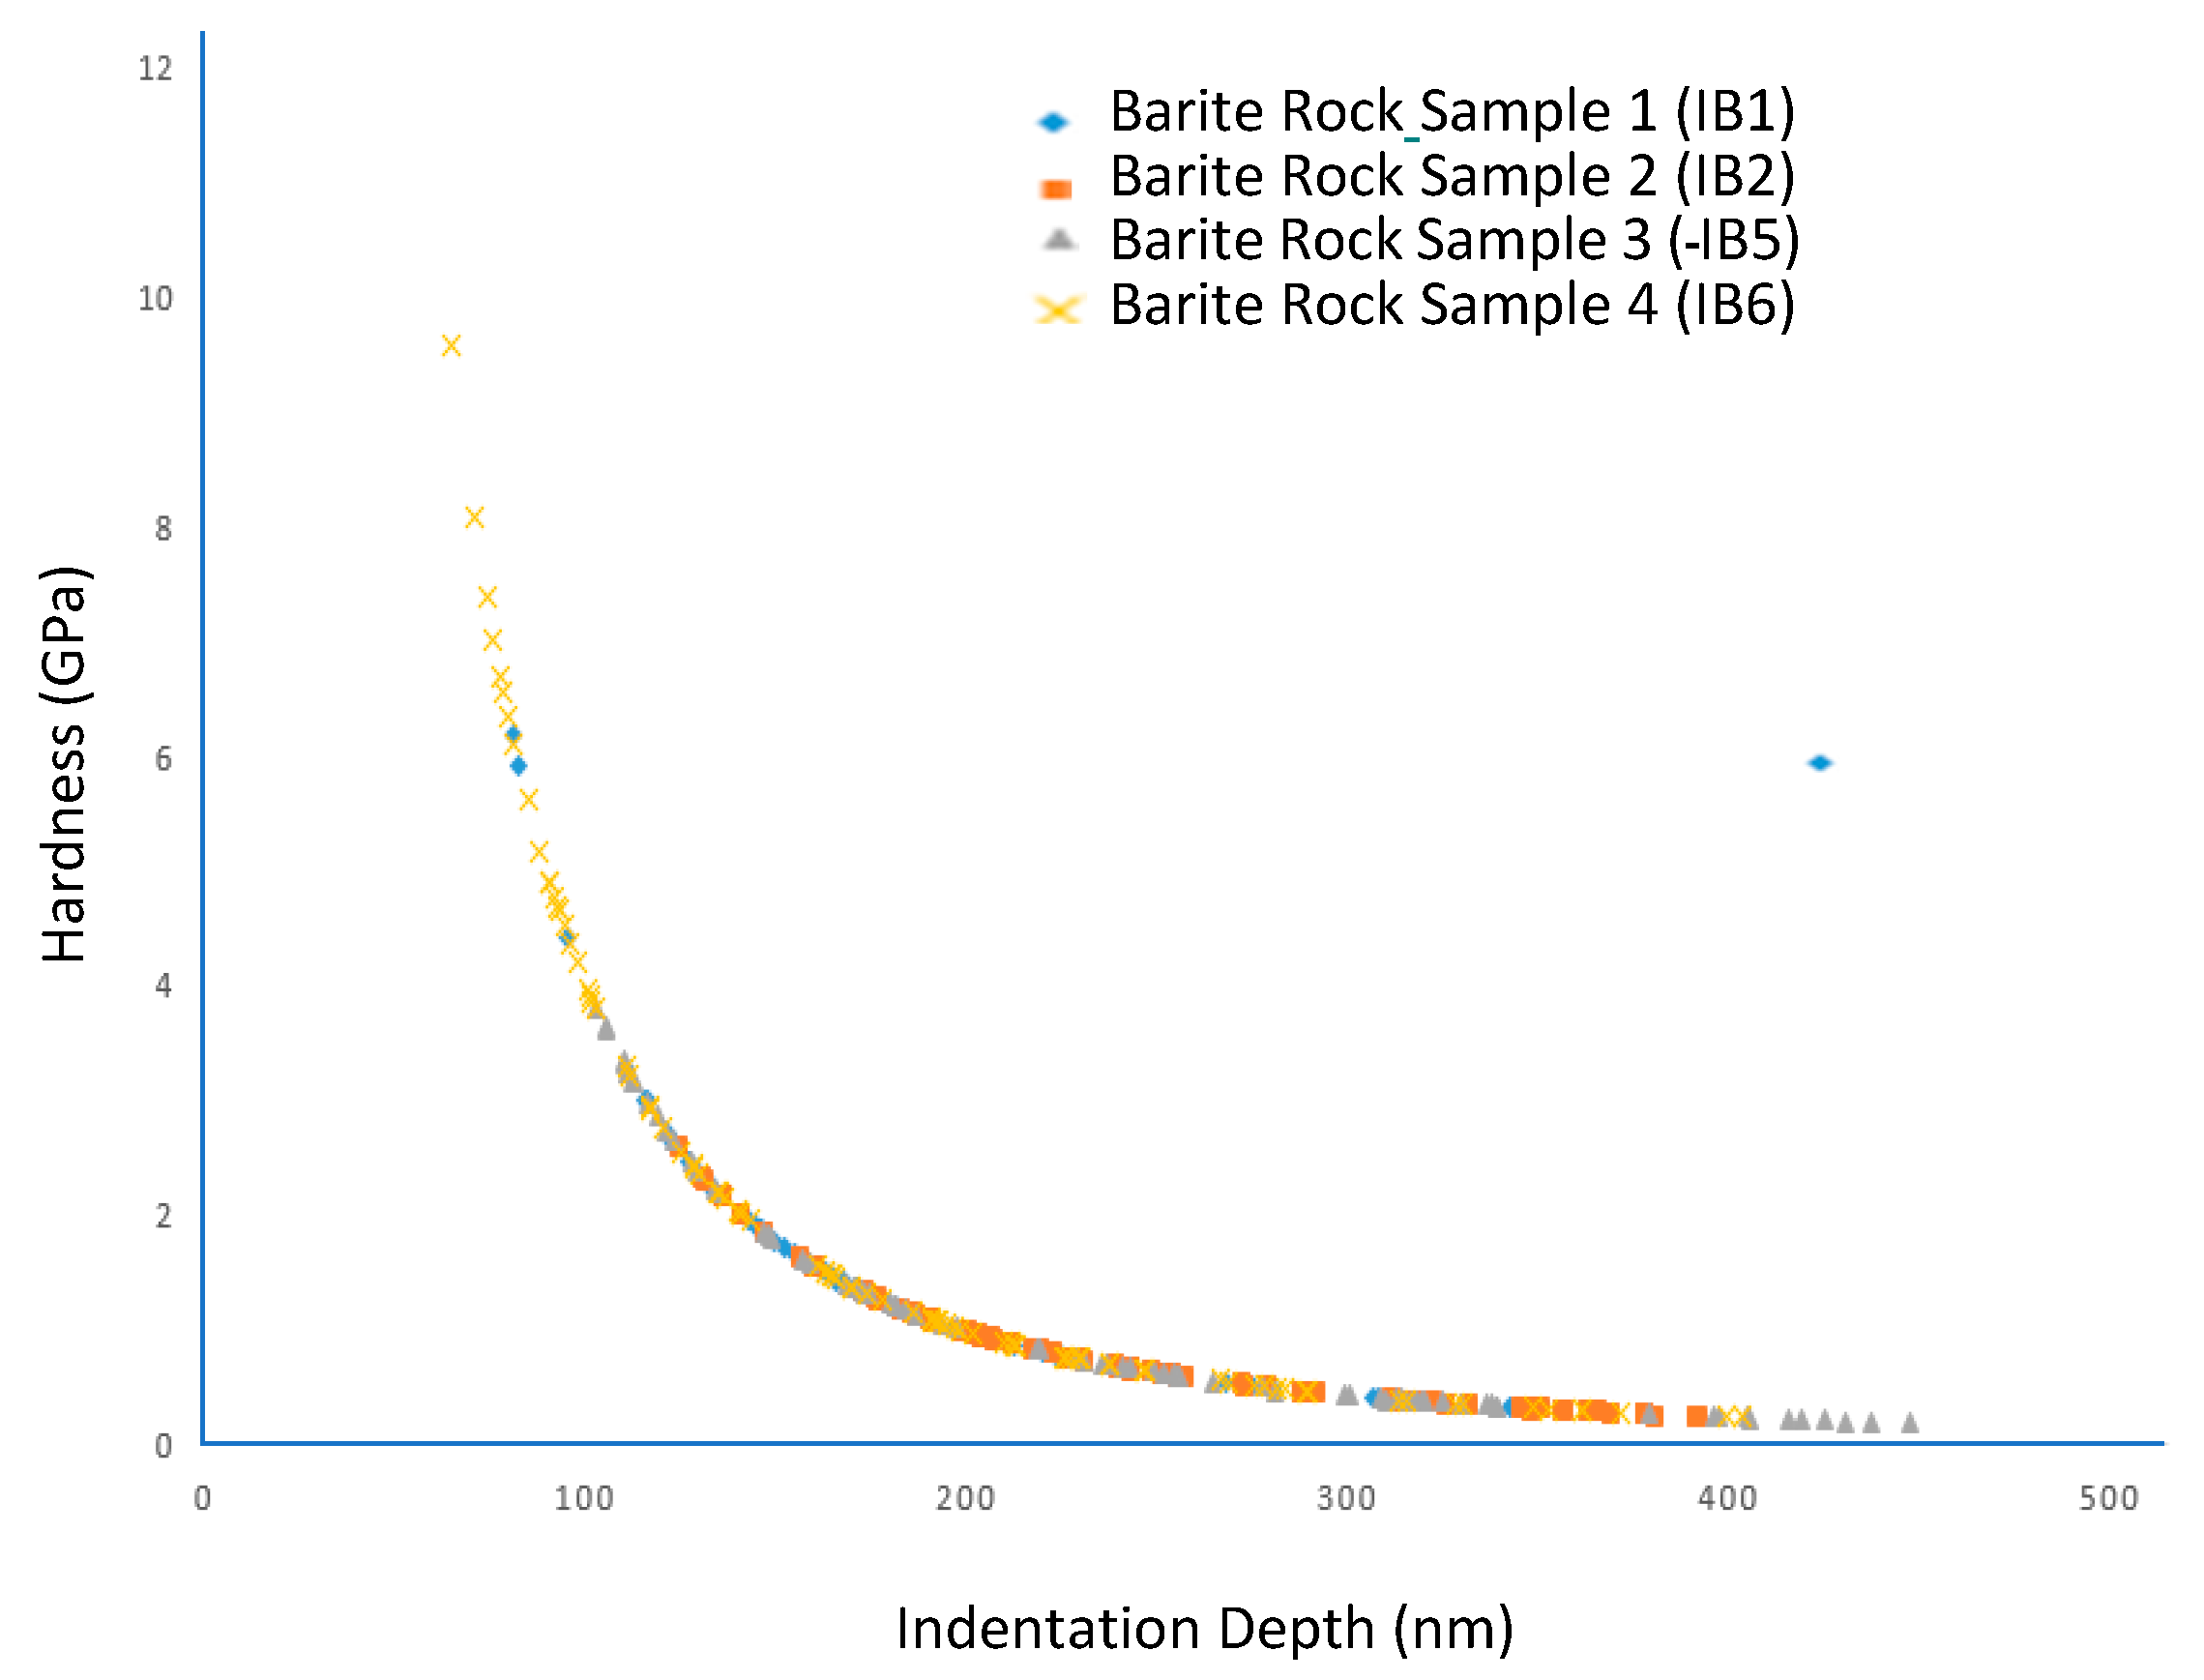
Figure 6 shows the hardness profile, indicating the indentation of size-dependent hardness values. At this point, the hardness values plateau with increasing indentation depths. The values obtained in this study are close to the hardness of pure barite rocks, which is about 1.7–2.0 GPa [54]. Additionally, the figure illustrates the barite rocks’ resistance to plastic deformation due to their morphology, microstructure, sample size, and mineralogy or elemental composition. The significant changes in hardness as the indentation depth changed were due to the amount of plastic strain gradient and geometrically necessary dislocations (GNDs).

3.2.3. Elastic Moduli (Young’s Moduli) of the Barite Rock Samples

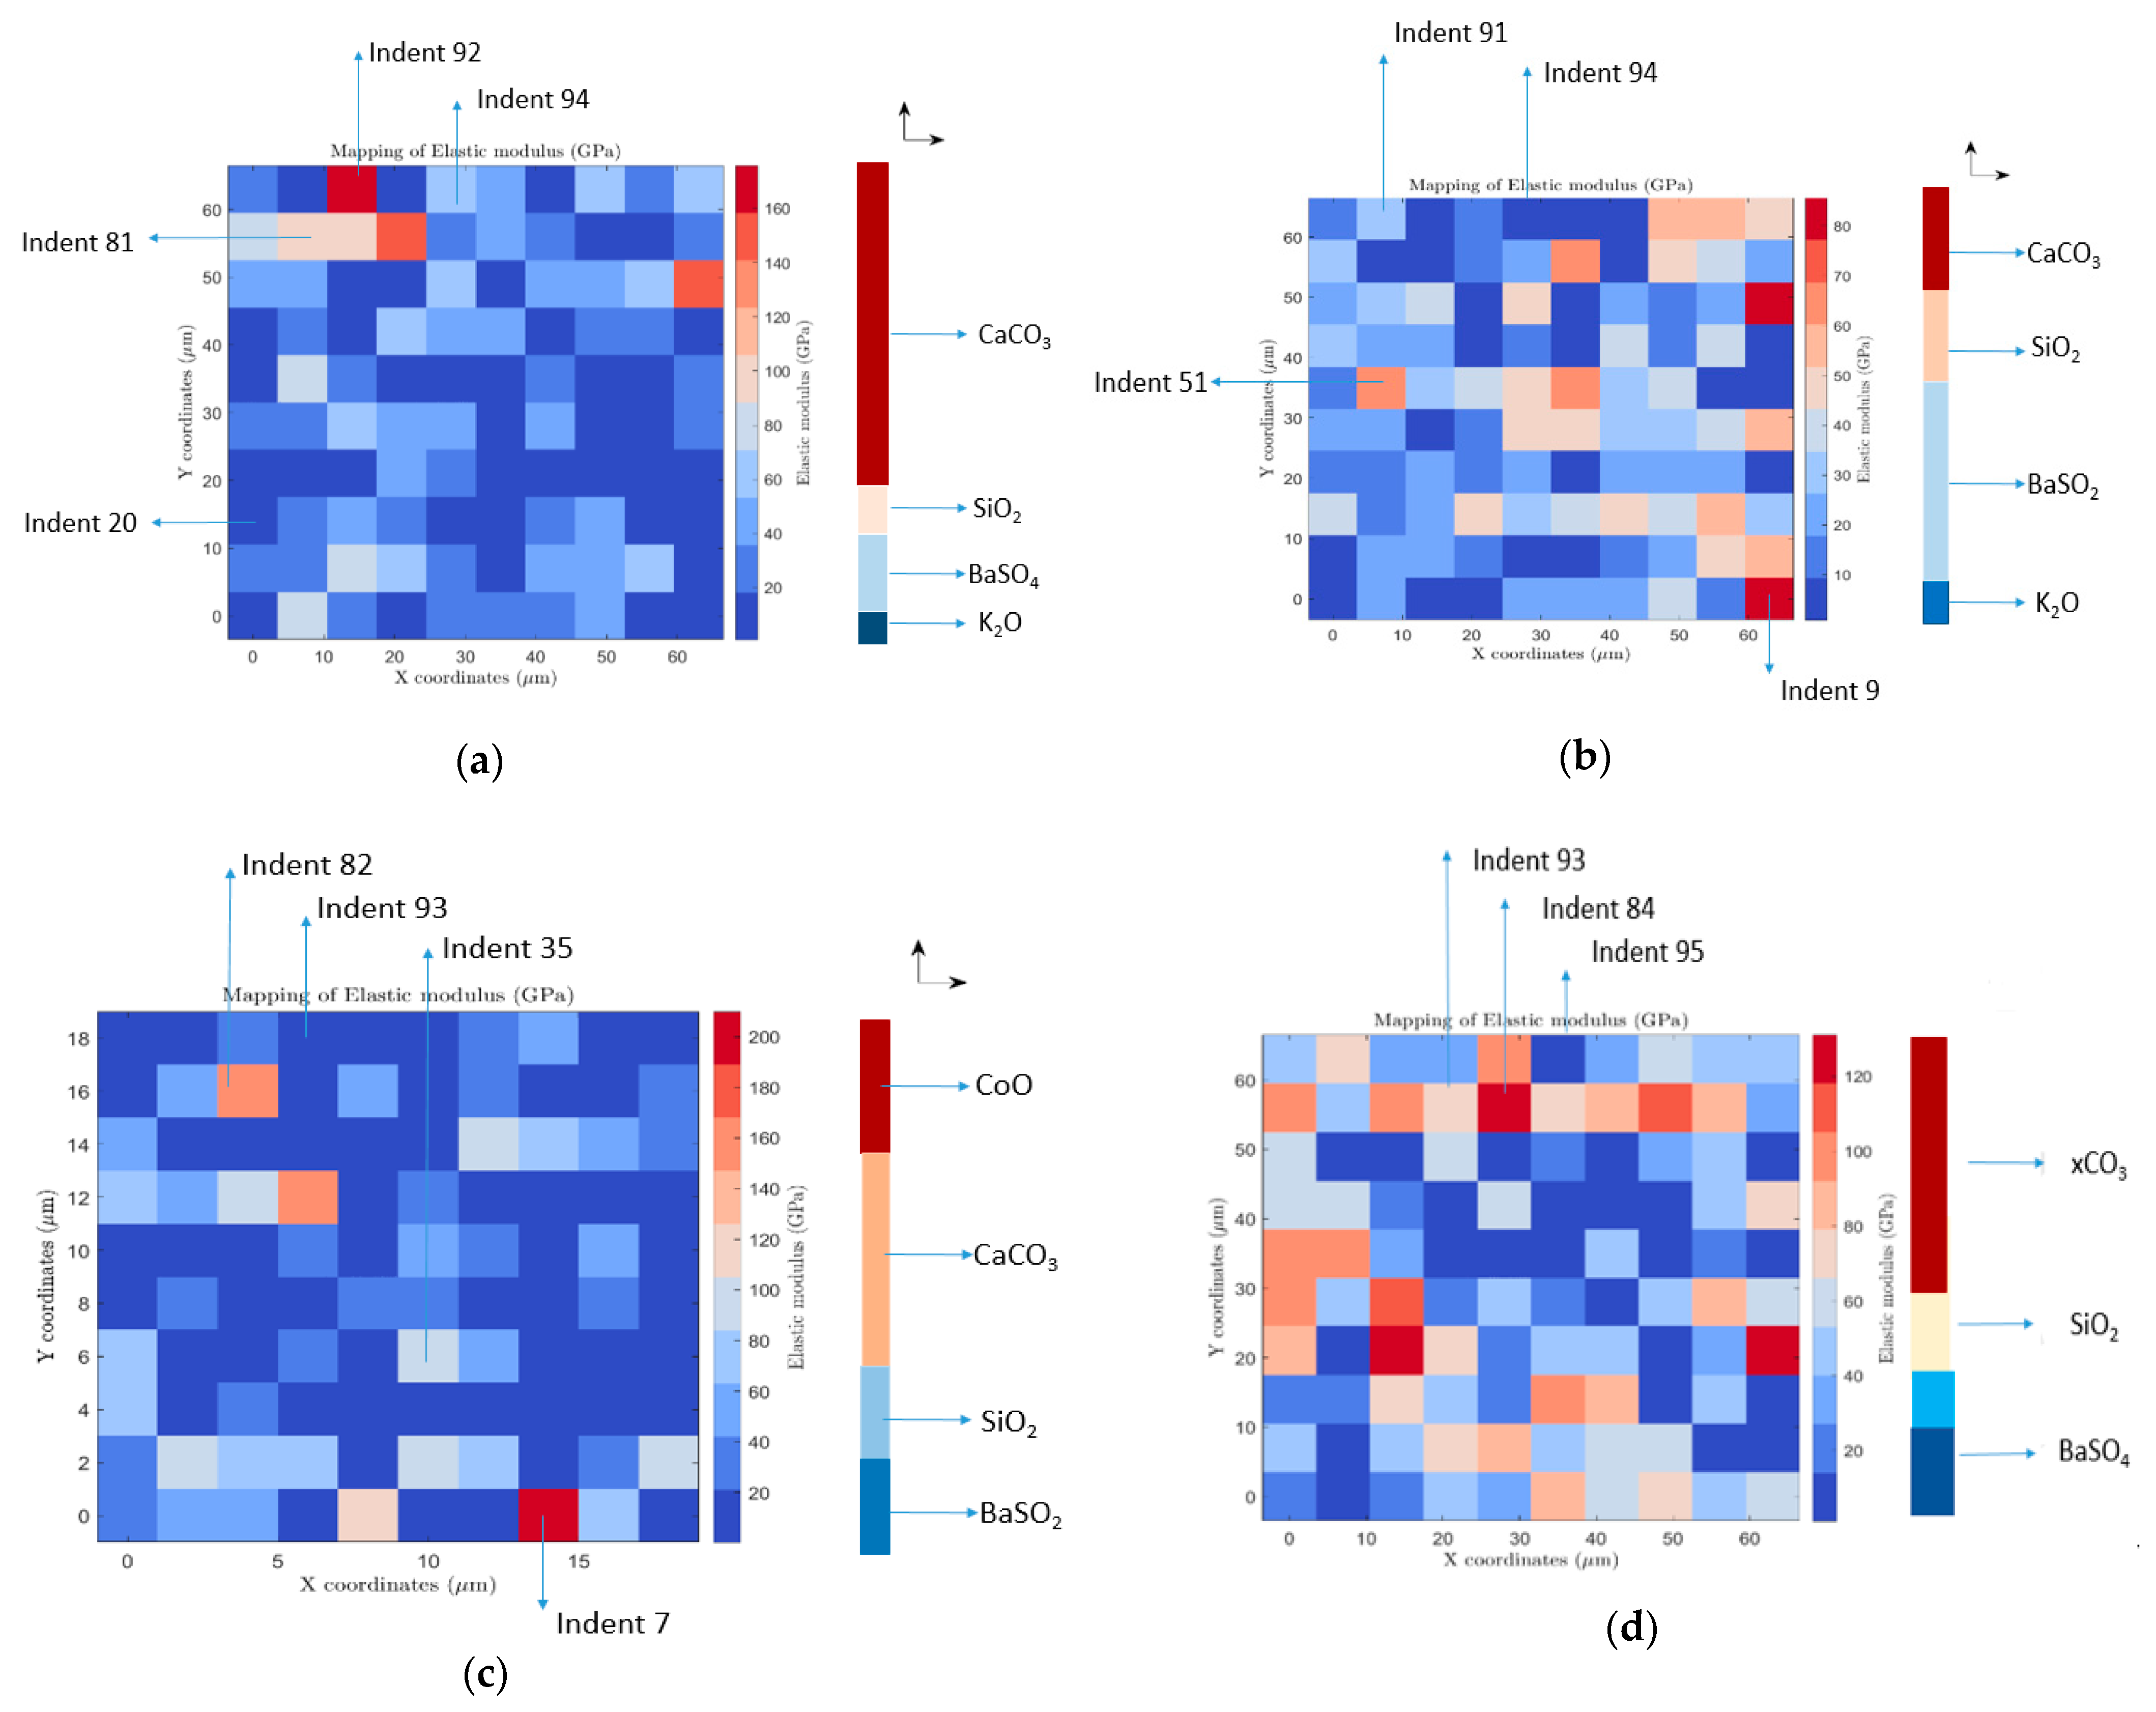
The 2D maps in Figure 7a–d describe the spatial/local variations in reduced elastic moduli (Young’s moduli) in the barite materials. Based on the maps of the 100 indented points, the rocks are heterogeneous with rock IB6 and IB2 showing the most distributed variations in points, as compared to IB1 and IB5. Similarly, the local variation in barite rock materials is traceable to the association of minerals of different elastic modulus such as BaSO4 and K2O, SiO2, CaO and CoO, minerals (Table 3 and Figure 1b, Figure 2b, Figure 3b and Figure 4b) [62,84,85,86,87,88,89]. While the four rock samples, IB1, IB2, IB5 and IB6, have similar compositions, the extent of heterogeneity of the rock samples can provide necessary guidelines in the design of experiments and the screening of ores or rock-containing minerals for comminution or rock drilling.
Table 2 provides a list of the literature on the elastic modulus of oxides present in the barite rock. This study uses these values to compute and quantify the elastic modulus variation observed in the 2D modulus map for the barite samples in Figure 7a–d. Based on the list of oxides obtained in this study and the reported elastic modulus values for each oxide, the modulus for different indent values is quantified and correlated with the range of oxides obtained by matching individual indents in Figure 7a–d. The rock samples (IB1, IB2, IB5 and IB6) are rich in oxides of varying elastic modulus, which are indications of the association of different minerals such as BaSO4., CO3, SiO2 and K2O.

3.3. Dislocation Density

Table 4 presents the total dislocation, statistically stored dislocations (SSDs) and geometrically necessary dislocation densities for barite rock samples. The values are calculated using Equations (1)–(11). The GND and SSD densities (ρG & ρS) of rock sample IB6 are the highest compared to the three other barite rock samples. Overall, all the four rock samples have higher ρGNDs than the ρSSD.
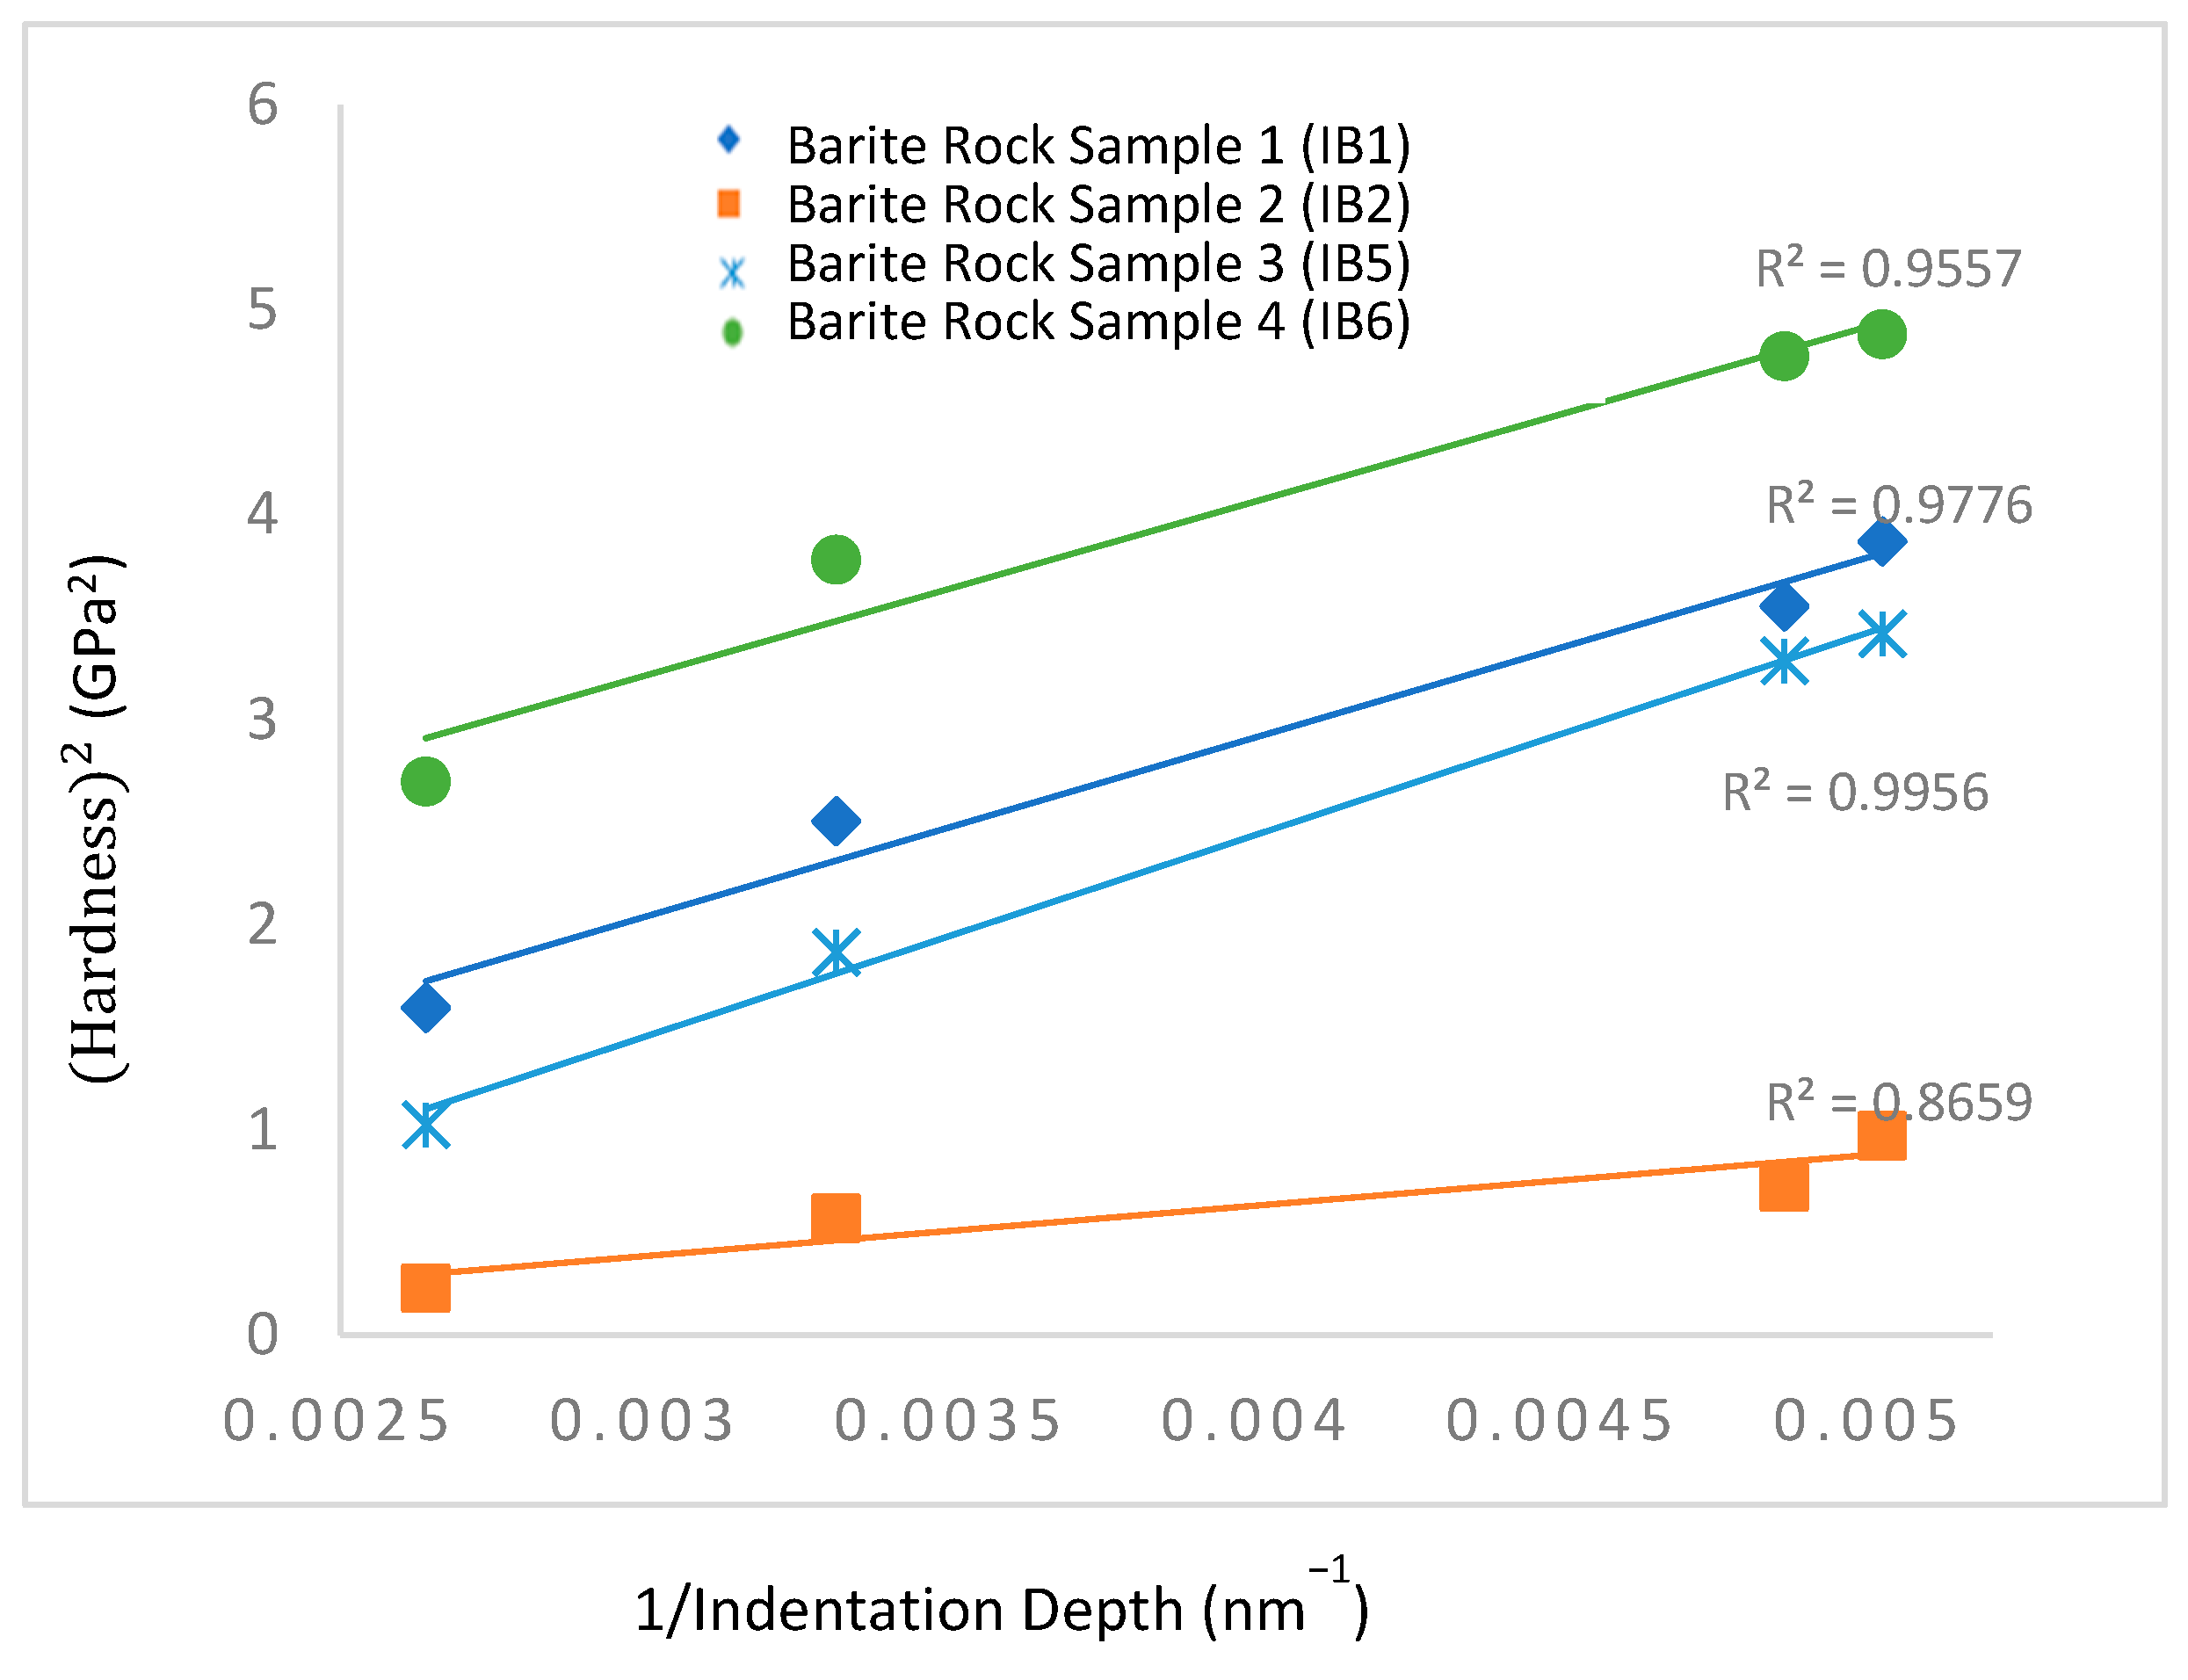
Table 5 and Figure 8 present the intercept of the graph H 2   v e r s u s 1 h and the slope is the characteristic length (h*)—the length at which the indentation size effect phenomenon happens in the material. The value of h* is associated with length scale, dislocation spacing and dislocation densities (GNDs (ρG) and SSDs (ρS)). These results describe the contribution of strain hardening at different plasticity length scales for the barite rock materials/samples. These plots, referred to as the intercept of Nix–Gao plots for each barite rock, demonstrate changes in hardness at both micro- and nano-hardness levels. Hence, the linear portion of the plots is relevant for determining the macroscopic hardness, characteristic length and the variation in each rock’s response under loading.
Similarly, the table describes the relationship between SSDs and Ho at higher characteristic length scales, obtained for the barite rock. Based on the dislocation densities of the rock materials, IB6 has a high SSD density with high hardness values. In contrast, rock samples IB2 have lower SSD densities at lower hardness values, while rock samples IB1 and IB5 have lower SSD densities at lower hardness values. However, a higher SSD density and a higher hardness value were observed in the case of IB6.
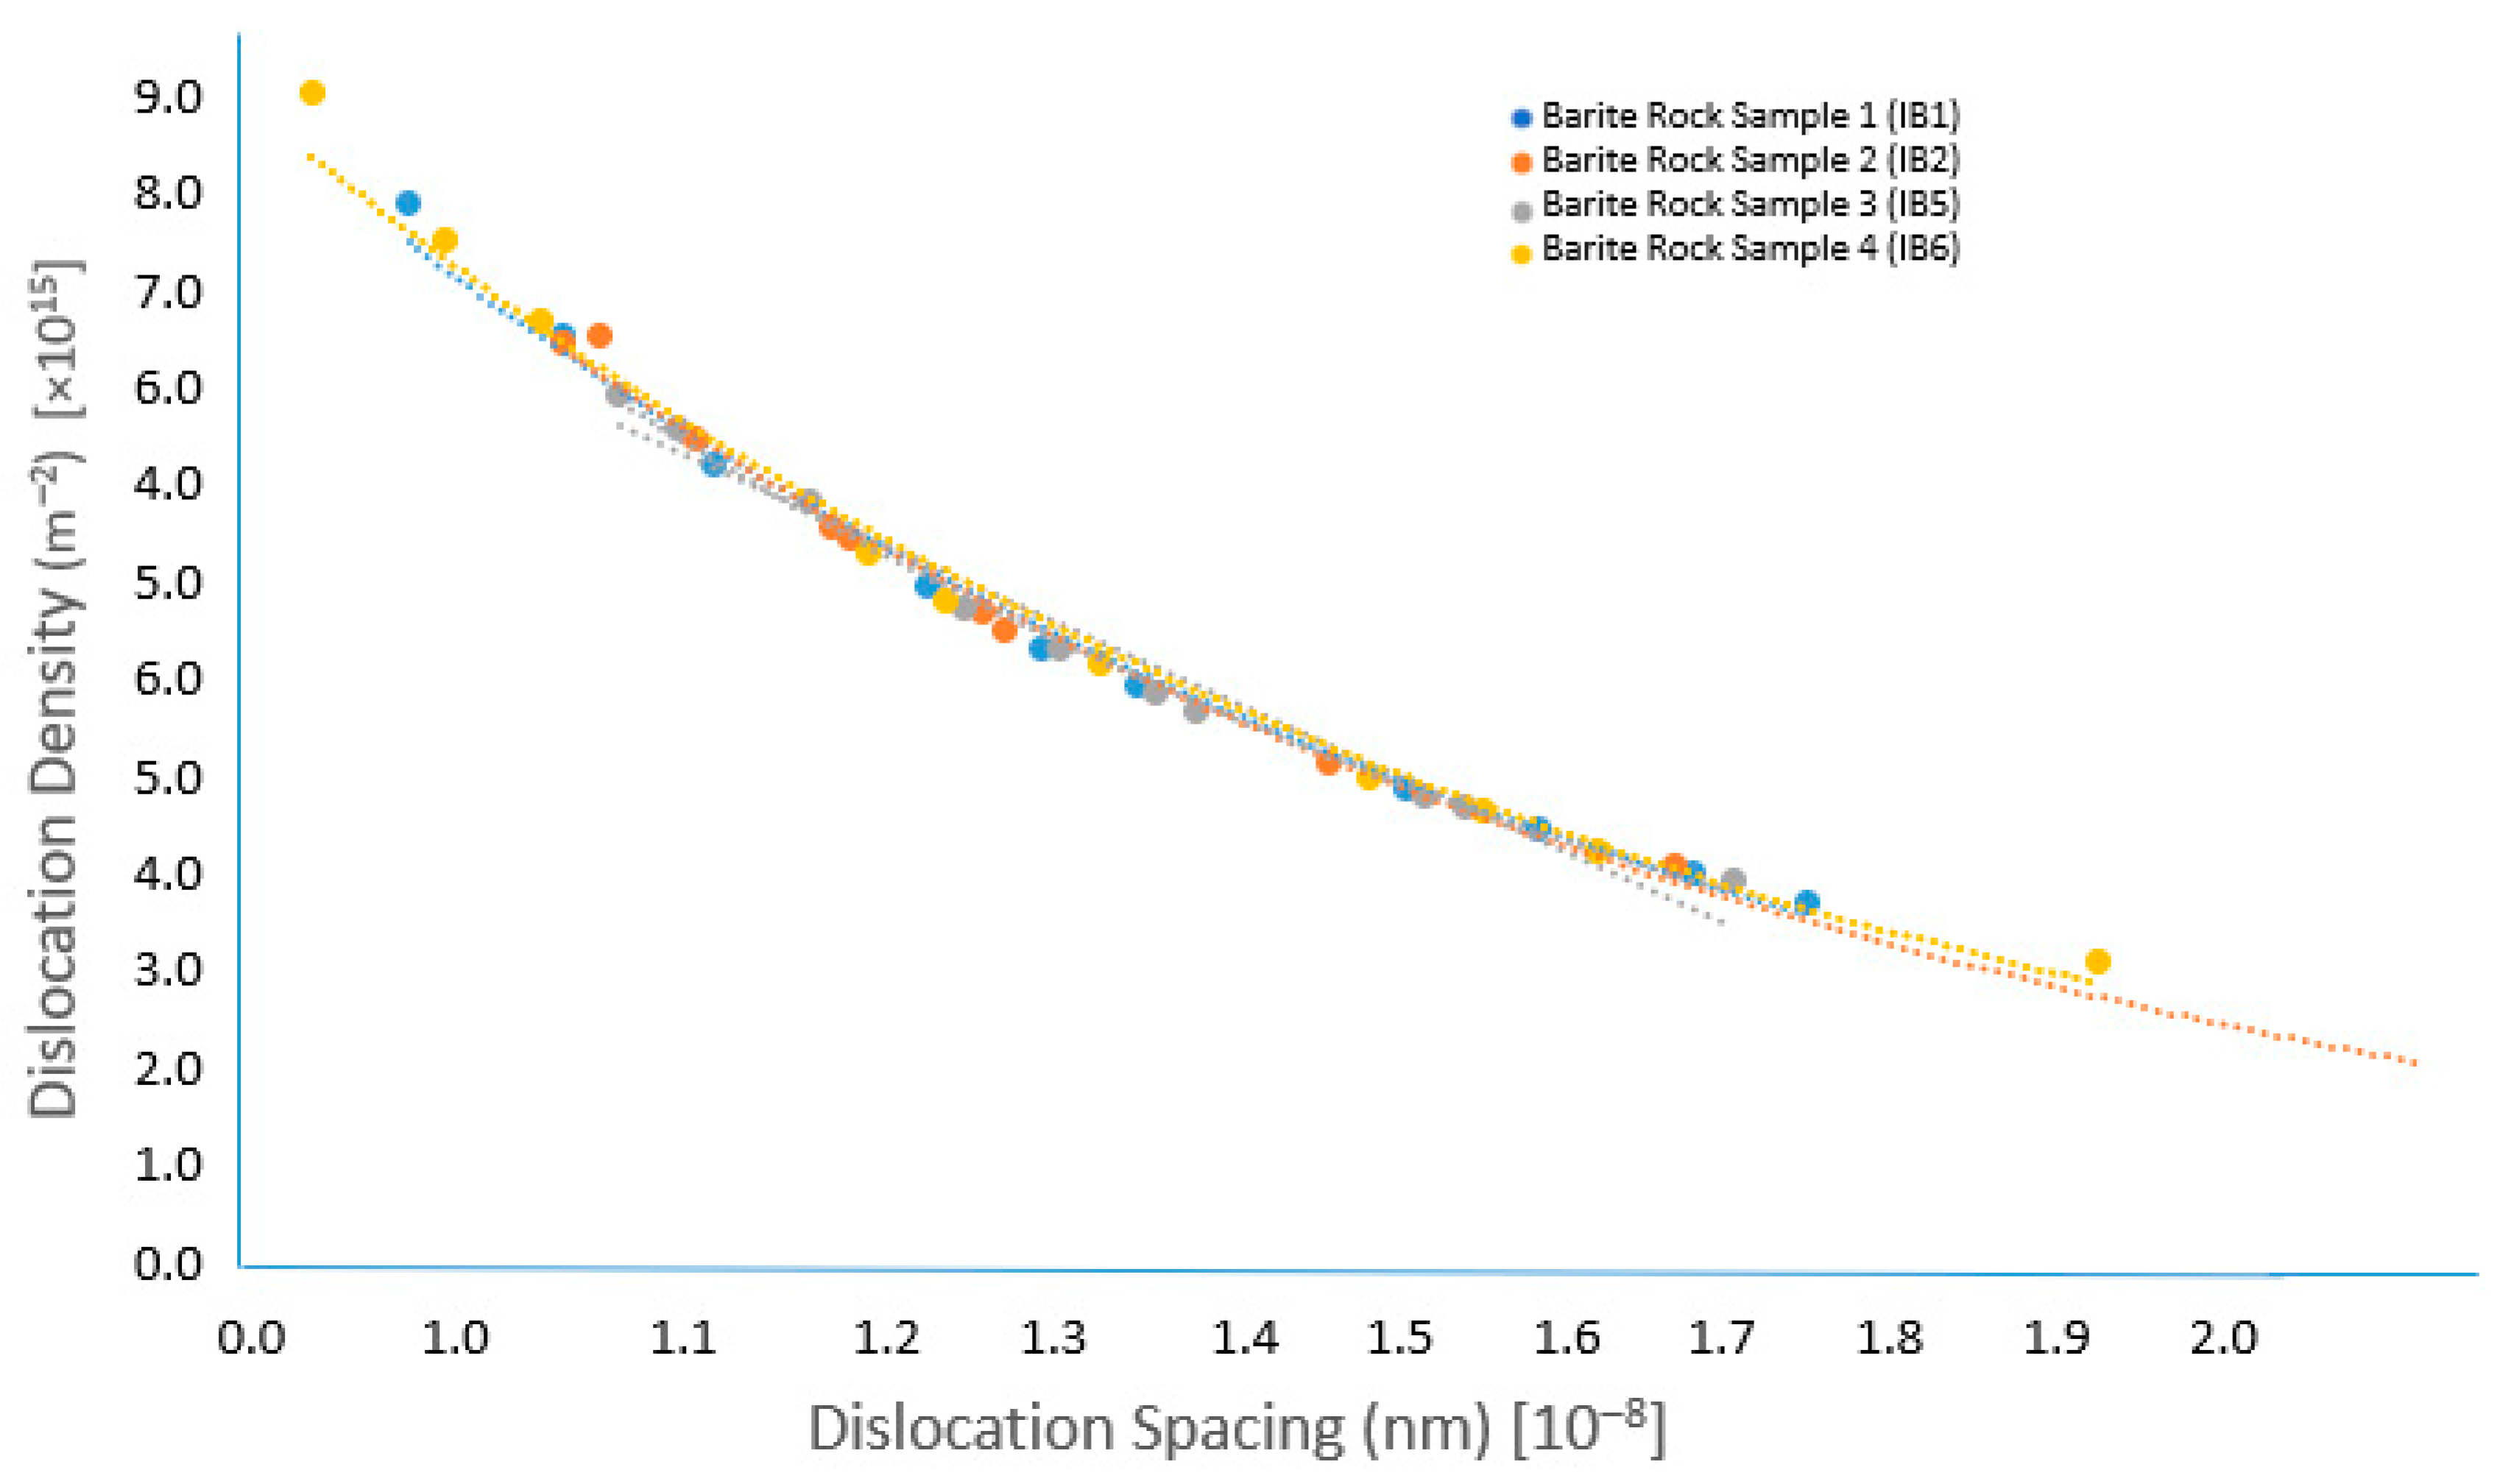
Figure 9 provides the correlations between the dislocation density ( ρ GNDs), dislocation spacing and indentation depth. These show that ρ GNDs decreases with increasing dislocation width, increasing indentation depth. Also, the density of GNDs increases with the inverse of the indentation depth. Similarly, the figure shows a parabolic relationship with indentation depth and a linear relationship with inverse indentation depth. The shape of the curve is not a concern here, as several factors other than the material’s properties determine its shape. For instance, indenter geometries affect the relationships between ρGND and indentation depth. In this study, it is observed that beyond the indenter geometries that can readily produce a parabolic relationship between ρGND and indentation depth, the surface roughness and material properties of the rock samples can contribute to high ρGND and indentation size effect at a lower depth.
Similarly, the relationship between dislocation density and dislocation spacing indicates that higher dislocation density occurs at shorter average distances between dislocations. This agrees with the theory stated by Frank’s formula, indicating the total amount of dislocation present in the crystals of each barite rock sample (plastic dislocation of barite rock samples).

4. Discussion

The variation in the hardness of barite rock materials is unique owing to the well dispersed softness and hardness in the materials. This is also very typical of several other earth-based materials such as rocks. However, the variation observed in the local hardness value from point to point is consistent for all barite rocks analyzed in this study, as shown with the statistical ranges of the measured data. This was also confirmed by the statistical deconvolution of the points and attests to the dislocation of the materials, which is an indication of the presence of the different minerals within the rock materials. Similarly, the hardness data of the earth-based materials (Figure 5, Figure 7, Figure 8 and Figure 9) are very consistent even within the context of statistical scatters. Although there are variations in the local compositions, the error ranges are insignificant and the statistical ranges in the measured data and 2D hardness plots are within the same domain.
Based on the hardness data and the EDS maps for the barite rock materials, the variation is associated with the harder minerals such as quartz sandwiched in some softer minerals like barite mineral. The presence of these features and local variations in the hardness values influence the deformation characteristics of the barite rock materials and provide some underline information on the dislocation density that explain the dislocation structures of the materials at different length scales. The knowledge of the hardness of rock samples and the variation in the hardness of the indented points of rock samples is important, relevant and useful. It helps to understand the embedded dislocation structures of the rock formation and plasticity at different scales.
Beyond the statistical variations, the semi-quantitative compositional information from the EDS through the local variation gave insight into the role of each element in the plasticity behavior of the materials. This variation also translates into significant strain and non-uniform plastic deformation or strain gradient plasticity in IB6. Similarly, as shown in Figure 5a–h, the statistical ranges are within the domain that are very consistent despite the statistical variation in the hardness at the different regimes or depths. However, the intrapores, fissures and existing microcracks observed at the samples’ surfaces are a magnitude higher than the dislocation spacing. The rate-dependent size effect model will be incorporated in future work to describe the size effect and quantify the contribution of the semi-brittle deformation features to plastic strains at different length scales. Overall, local variation in the composition of barite rock materials has an implication on the plastic deformation of the rock. The understanding of factors that are responsible for the local variation in the composition of earth-based materials is useful in the selection of operating conditions for rock blasting, efficient drilling of rocks and other applications where variation in materials’ intrinsic properties are critical for failure.
The hardness of the materials at different indentation depths confirms dislocations in barite rock samples, as discussed earlier. The hardness decreases with increasing indentation depth. However, the influence of indentation size effect faded away at depths larger than 400 nm for the four barite rock materials. Such a relationship between the hardness of rock samples and indentation depth provides a good prediction of the effect of variation in local composition on the plasticity of the barite rock materials at higher indentation depth. This understanding on the response of the barite rock materials at different combinations of strain during non-uniform plastic deformation or strain gradient provide insights on microstructural change at different plasticity levels and size. Similarly, this behavior indicates a high degree of elasticity, high hardness values, elasticity modulus and contact stiffness. Hence, the presence of hard minerals such as quartz and other silicate minerals, as confirmed by the elemental composition of the rock samples, contributed significantly to the hardness, elastic modulus and plasticity of the barite rocks.
An attempt to match the compositional information from EDS through the local variation (Figure 1b, Figure 2b, Figure 3b and Figure 4b) describes the role of a specific element and the contribution to the enrichment of the particle rock sample. This observation has some implications for the barite rock formation with enrichment in barite and other non-barite minerals. For instance, barite rock materials with significant deposits or different fractions of non-barite minerals in the rock will respond differently to deformation based on the features or the extent of the enrichments associated with the rock formation. The understanding of natural processes such as the formation and local compositions of rocks is critical in assessing the effect of local variations along the rock features. Hence, the indentation method of studying the deformation characteristics of barite rock features provided relevant information on the underline dislocation structures.
There is a strong correlation between the dislocation density of the rock samples presented in Table 4 and previous results earlier presented Figure 5a–h. High variation in the elemental composition, hardness and elastic modulus across the indented points was observed in rock samples IB6 and IB2 as compared to IB1 and IB5 (Figure 5a,c,e,g). Also, the presence of long-range fissures and pores observed by SEM surface imaging contributed to the range of length scale parameters, such as material properties and extent of heterogeneity of the rock samples, and the high dislocation density. Based on the extracted dislocation density data (Table 4), the geometrically necessary dislocations (GNDs) density varies across indentation depth. This presents the relationship between the characteristic depth (h) and density of GNDs and examines the contribution of strain hardening to geometrically necessary dislocations (GNDs) prior to the plastic deformation of the rock samples.
The contribution of strain hardening to GNDs is significant at shorter indentation depth for IB6, IB1 and IB5 while the indenter needs to penetrate the rock sample deeper into IB2 to ensure significant strain hardening contributes to GNDs density. A similar trend was observed with the hardness profile of the barite rocks. This indicates that dislocations are restricted and stored at shorter indentation depth in IB6, IB1 and IB5 due to the hardness of the rock samples (high hardness number). Similarly, the GNDs are significant to accommodate permanent deformation by the indenter, and the nucleation and movement of these GNDs contributed to higher hardness of the barite rock materials. This information is very consistent within the context of statistical scatters and describes the plasticity of the barite rock materials at different scales.
Equally, strain hardening in rock samples that are softer than IB6, IB1 and IB5 also contribute to GNDs density after a continuous loading of the samples and at varying indentation depth or plasticity length scale. It is evident that harder and stronger rocks undergo strain hardening at shorter indentation depth than softer rock samples. However, strain hardening contribution to GNDs was delayed in IB2 until the rocks are stressed significantly or beyond the rock’s yield stress. While it is theoretically difficult to separate GNDs from SSDs and assess direct contributions to the deformation of earth-based materials, the information on the underline dislocation density of the barite rock materials at different length scales describes the dislocation structures that control the plasticity levels and the size effect at different characteristic length scales. Similarly, the strain hardening effect at different length scales describes the plasticity behavior of barite rock materials at different loading conditions.

4.1. Dislocations and Mining Activities with Consequences on Water Contaminations

As mentioned earlier, dislocation is inherent in barite rocks due to pre-existing cracks or defects resulting from extreme environmental conditions, mining activities, and other disruptive processes. Dislocations are typically line defects in rocks, and the propagation of these defects leads to their deformation and failure. Dislocation sites are points of incipient failure and weathering, resulting in erosion of minerals present in the rock. In this study, specific attention is given to the plasticity of barite rocks at different indentation depths or length scales. Results have shown that the variation in the mechanical properties of rocks, such as hardness and elastic modulus as well as the plastic–elastic properties of rocks, is influenced by the elemental composition of the rock, and this has an impact on the crushing and grinding of rocks. This variation, coupled with the elemental mapping of the rock affects the outcome of the crushing and grinding process. Similarly, hard rocks are difficult to crush, while soft minerals are ground to a fine powder quickly. The dislocation in rocks and variation in mechanical response will lead to the formation of a large volume of fines; considering that regions of soft minerals are reduced to fines, the application of the knowledge gained from the study is important in controlling the volume of fines during the crushing and grinding of barite rocks.
The dispersion of fines or mineral dust during the comminution (crushing and grinding) of rocks poses a serious environmental challenge and is a major contributor to mining-aided environmental pollution. Whenever mineral dust is released into the environment, it enters the waterways and soils, where it accumulates. Mineral dusts are typically composed of several metals and non-metals. In this study, previous work by the authors has demonstrated that barite ores or rocks are composed of both heavy non-metals, such as barite, and metals. Barite rocks also contain heavy metals such as lead, cadmium, copper, zinc and iron. These metals are toxic and carcinogenic. The transportation of these metals in air and as sediments in water contaminates both water and air, and they are easily accumulated in the human body at levels exceeding global allowable limits and environmental and health standards. These challenges are not unique to Nigeria; globally, issues related to soil erosion, sediment movement and deposition in rivers, lakes and estuaries have persisted through geological ages [95]. In Africa, the consequences of soil erosion are estimated to result in a 2%–40% decrease in productivity, with an average of 8.2% across the continent [96].
Furthermore, approximately 19% of reservoir storage volumes in Africa are reported to be silted [97]. Soil erosion of rock sediments and dispersion of mineral dust emerges as a significant non-point pollution source in numerous watersheds, impacting water resources by conveying fertilizers, pesticides and herbicides downstream [98]. Addressing these environmental ramifications requires a holistic approach that integrates sustainable mining practices and environmental conservation measures to mitigate the adverse effects of mining activities on ecosystems and water resources. The rapid expansion of the barite mining industry in Nigeria has given rise to significant environmental concerns, including water pollution and contamination. This issue, stemming from mining activities, poses significant threats to both the physical landscape and local ecosystems. The overarching objective of this study, apart from examining the plasticity length scale, is to provide a nuanced understanding of heavy metal water contamination and its environmental impact resulting from barite mining in Nigeria. This methodological approach ensures a rigorous examination and analysis of the intricate interplay between barite mining, water quality contamination, and their environmental repercussions.
The exploitation of mineral resources involves a sequential progression through exploration, mining and processing stages before realizing their economic value. Unfortunately, each of these stages is invariably accompanied by different forms of environmental damage and hazards [54]. The inadequate management of mining waste, including tailings and overburden, can exacerbate pollution concerns by destabilizing soil structures and disrupting natural drainage patterns. The erosion process transports sediments laden with contaminants into water bodies, leading to sedimentation, compromised water quality and disruption of aquatic ecosystems. Furthermore, the presence of specific ions and chemical species, as revealed in the rocks, can affect the interfacial properties of barite in the presence of non-barite minerals. For instance, the presence of cations such as calcium (Ca), aluminum (Al), magnesium (Mg), lead (Pb), copper (Cu) and iron (Fe) in the barite rock or surrounding medium can lead to surface reactions, altering the surface chemistry and reactivity of both barite and non-barite minerals. These interactions can impact the overall stability and reactivity of mineral particles, influencing processes such as flocculation, sedimentation and flotation in mineral processing operations. Understanding these interactions is vital for designing effective remediation strategies, as they influence the adsorption, desorption, and mobility of contaminants in the presence of mineral phases. Therefore, the interfacial properties and interactions of barite mineral with non-barite minerals are multifaceted, involving surface charge, chemical reactivity and have significant implications for various industrial and environmental processes for which in this work, we have identified the variation in local composition directly align with the surface composition observed from the EDS results in Figure 1b, Figure 2b, Figure 3b and Figure 4b, revealing the presence of these trace elements.

4.2. Regulations and Environmental Management in Nigerian Barite Mining

The significance of mining activities to the Nigerian economy is unmistakably evident, as the country primarily focuses on the exploration, exploitation and exportation of natural resources, with relatively less emphasis on processing them. Previous studies have recommended a significant shift in policies to regulate and manage environmental contamination efficiently. Similarly, the Minerals and Mining Act, No. 34 of 1999, did not adequately address environmental considerations in the context of petroleum exploration in Nigeria [99]. The subsequent Nigerian Minerals and Mining Act of 2007, which replaced the 1999 Act, currently serves as the legislative framework for mining activities in the country. This Act defines minerals broadly, encompassing solid, liquid, or gaseous substances resulting from geological activities found in or on the Earth’s crust. Examples of such minerals include rocks, coal, coal bed gases, bituminous shale, tar sand and mineral water, excluding petroleum resources and water resources without minerals (Nigerian Minerals and Mining Act No. 20, 2007). However, this policy shift must be accompanied by an evidence-based, fundamental study and characterization of rocks containing minerals and their impact on the environment over a period.
Leading mines prioritize a sustainable, low-impact water use profile as part of their commitment to responsible resource management. Adopting a comprehensive approach to barite mining that places a premium on sustainable practices and environmental stewardship. This will enable us to model an efficient processing flowsheet to improve separation, liberation, and recovery, as well as mitigate the impact of hazards associated with heavy metals present in the mining ecosystem. This will prevent the unnecessary accumulation of tailings and effluents that may block the mining ecosystem and increase risks associated with mining and erosion. Additionally, future studies will quantify toxicity index rates, evaluate the long-term impacts of heavy metals in mineral dust and sediments on aquatic ecosystems, and assess the efficiency of strategies employed for pollution mitigation. This collective effort aims to ensure responsible and environmentally conscious barite mining practices [100].

5. Conclusions

This paper presents the results of an experimental and analytical study of indentation size effects and the mechanical properties of barite rocks. It also identified some traces elements in the barite rocks, which are considered detrimental for consumption or inhalation during barite processing. Availability of these elements can course water contamination in the ecosystem. Salient conclusions arising from this study are summarized below.
  • The hardness and Young’s moduli values obtained from the barite rocks exhibit spatial variations that are consistent with the presence of multiple phases (barite, quartz, non-barite phases). The statistical deconvolution of the measured hardness and reduced elastic moduli data suggest that the dominant phase in the rocks is barite.
  • The indentation size effects obtained from the current study are well described by [53] theory. A combination of [52,53] theory also provided estimates of the densities of geometrically necessary dislocations and statistically stored dislocation densities that are consistent with the trends in the measured hardness data.
  • The relatively high dislocation densities obtained in this study suggest that significant plastic deformation is associated with the contact of rocks during the grinding and drilling processes associated with mineral processing and oil/gas extraction. This suggests that strain gradient plasticity models may provide useful tools for the constitutive modeling of barite rock deformation at the nano- and microscales.
  • The plasticity length scale parameters obtained from strain gradient plasticity theories provide key insights into the size scales in which the strain gradients are significant. However, the magnitudes of the underlying dislocation densities are perhaps even more important than the plasticity length scales, since they provide estimates of the underlying dislocation strengthening.
  • The local variations in the composition of the rock features contributed to the shift in the behavior of rock samples under stress at different indentation depths. Hence, the plasticity or contact deformation and dislocation motion in the barite rock materials are directly impacted by the local variations.
  • The heterogeneity of barite rocks is affected by the presence of barite, quartz and other non-barite minerals. However, these represent about 15 vol.% of the total volume. Thus, the behavior of the rocks is dominated by the presence barite.
  • The statistically deconvoluted mechanical properties of the barite rock have major implications for the design of comminution and drilling tools that are used in mineral processing and oil and gas extraction. They should, therefore, be considered in the design of mineral processing and oil/gas processing conditions.
  • The relationship between hardness of the rock samples and indentation depth provides a good prediction of the effect of local variation in the elemental composition and mineralogy of the rock samples on the plasticity of typical earth-based materials. Hence, the variations observed in some of the rock samples have significant implications for plastic deformation in rock samples.
  • The studies identified that traces of non-barite materials, especially cations in barite rocks, are detrimental to human health. While the quantity of the metals was not measured, dusts and sediments rich in heavy metals can initiate chronic diseases in humans and animals over a short or extended period. The findings highlight the implications of the variation in the mechanical response of rocks and the potential environmental risk associated with dislocation sites rich in heavy metals when exposed to water and air, due to the elastic–plastic properties of barite rocks. There is an urgent need for an in-depth materials characterization of barite rocks to ensure a thorough understanding of the implications of their unique properties, thereby facilitating a sustainable approach to barite mining, comminution, and the recovery of heavy metals from air and water. The outlined research provides a roadmap for responsible mining practices and the failure of rock masses during crushing and grinding.

Author Contributions

H.A.A.—Conceptualization, methodology, data curation, formal analysis, investigation, writing—original draft, and visualization. D.O.A.—Conceptualization, methodology, data curation, formal analysis, investigation, writing—original draft, writing—reviews and editing, visualization, resource, project administration, supervision and funding. O.S.O.O.—Conceptualization, validation, resource, writing—reviews and editing, and supervision. N.Y.D.—Writing—reviews and editing, and supervision. T.K.A.—Formal analysis, investigation and data curation. S.I.O.—Writing—reviews and editing. W.O.S.—Formal analysis, resource, writing—reviews and editing, and supervision. All authors have read and agreed to the published version of the manuscript.

Funding

The research was funded by the Regional Scholarship and Innovation Fund (Rsif-PASET) through the Junior Investigative Research Award (RSIF/AUST/JIRA 005 Grant) awarded to Dr. David Oluwasegun Afolayan (Principal Investigator) at the African University of Science and Technology (AUST), Abuja, Federal Capital Territory, Nigeria. Appreciation is also extended to the SUNY Polytechnic Institute (SUNY Poly) for the support of W.O.S., H.A.A., T.K.A. and D.O.A., and the Pennsylvania State University for supporting O.S.O.O., N.Y.D. and D.O.A.

Data Availability Statement

The original contributions presented in this study are included in the article. Further inquiries can be directed to the corresponding author.

Acknowledgments

Appreciation is extended to the SUNY Polytechnic Institute (SUNY Poly) for the support of W.O.S., H.A.A., T.K.A. and D.O.A., and Pennsylvania State University for supporting O.S.O., N.Y.D. and D.O.A. The authors are also grateful to Vitalis Anye, the Ag. HoD of Materials and Metallurgy Engineering Department and Ag. Dean, School of Engineering, AUST for assisting with the nanoindentation of the rock samples. We appreciate the kind gesture and resource support of the AUST Barite Group.

Conflicts of Interest

The authors declare no conflicts of interest.

Abbreviations

The following abbreviations are used in this manuscript:
IB1Ibi barite sample 1
IB2Ibi barite sample 2
IB5Ibi barite sample 3
IB6Ibi barite sample 4

References

  1. Davarpanah, S.M.; Sharghi, M.; Narimani, S.; Török, Á.; Vásárhelyi, B. Brittle-ductile transition stress of different rock types and its relationship with uniaxial compressive strength and Hoek–Brown material constant (mi). Sci. Rep. 2023, 13, 1186. [Google Scholar] [CrossRef]
  2. Guo, Y.; Yang, C.; Wang, L.; Feng, X. Effects of Cyclic Loading on the Mechanical Properties of Mature Bedding Shale. Adv. Civ. Eng. 2018, 3, 85973. [Google Scholar] [CrossRef]
  3. Yu, D.K.; An, Y.; Chen, X. Revealing the cyclic hardening mechanism of an austenitic stainless steel by real-time in situ neutron, diffraction. Scr. Mater. 2014, 89, 45–48. [Google Scholar] [CrossRef]
  4. Mughrabi, H. The cyclic hardening and saturation behavior of copper singe crystals. Mater. Sci. Eng. 1978, 33, 207–223. [Google Scholar] [CrossRef]
  5. Hong, S.G.; Yoon, S.; Lee, S.B. The effect of temperature on low-cycle fatigue behavior of prior cold worked 316L stainless steel. Int. J. Fatigue 2003, 25, 1293–1300. [Google Scholar] [CrossRef]
  6. Hong, S.G.; Lee, S.B. The tensile and low-cycle fatigue behavior of cold worked 316L stainless steel: Influence of dynamic strain aging. Int. J. Fatigue 2004, 26, 899–910. [Google Scholar] [CrossRef]
  7. Pham, M.S.; Holdsworth, S.R.; Janssens, K.G.F.; Mazza, E. Cyclic plastic deformation response of AISI 316L at room temperature: Mechanical behavior, microstructural evolution, physically-based evoluationary constitutive modelling. Int. J. Plast. 2013, 47, 143–164. [Google Scholar] [CrossRef]
  8. Stephens, R.I.; Fatemi, A.; Stephens, R.R.; Fuchs, H.O. Metal Fatigue in Engineering, 2nd ed.; John Wiley, Sons, Inc.: New York, NY, USA, 2001. [Google Scholar]
  9. Galindo-Nava, E.I.; Sietsma, J.; Rivera-Díaz-del-Castillo, P.E.J. Dislocation annihilation in plastic deformation: II. Kocks-Meching analysis. Acta Mater. 2012, 60, 2615–2624. [Google Scholar] [CrossRef]
  10. Soboyejo, W. 6 Introduction to Dislocation Mechanics. In Mechanical Properties of Engineered Materials; Marcel Dekker: New York, NY, USA, 2003; ISBN 0-8247-8900-8. [Google Scholar]
  11. Barber, D.J.; Wenk, H.-R.; Gomez-Barreiro, J.; Rybacki, E.; Dresen, G. Basal slip and texture development in calcite: New results from torsion experiments. Phys. Chem. Miner. 2007, 34, 73–84. [Google Scholar] [CrossRef]
  12. Asenjo, A.; Rojo, J.M. Dislocation generation and motion at the incipient stages of surface plasticity in barite. Philos. Mag. 2007, 87, 3959–3966. [Google Scholar] [CrossRef]
  13. Verberne, R.; Reddy, S.M.; Saxey, D.W.; Fougerouse, D.; Rickard, W.D.A.; Quadir, Z.; Evans, N.J.; Clark, C. Dislocations in minerals: Fast-diffusion pathways or trace-element traps? Earth Planet. Sci. Lett. 2022, 584, 117517. [Google Scholar] [CrossRef]
  14. Walker, A.M.; Carrez, P.; Cordier, P. Atomic-scale models of dislocation cores in minerals: Progress and prospects. Mineral. Mag. 2010, 74, 381–413. [Google Scholar] [CrossRef]
  15. Li, X.; Luo, X.; Li, P.; Huang, Y.; Yang, J.; Zhou, Q. Size effect and indenter shape dependence of indentation and scratching behavior for laser melting deposited Ti-6Al-4V alloy. Mater. Sci. Technol. 2025, 41, 443–456. [Google Scholar] [CrossRef]
  16. Grgic, D.; Al Sahyouni, F.; Golfier, F.; Moumni, M.; Schoumacker, L. Evolution of gas permeability of rock salt under different loading conditions and implications on the underground hydrogen storage in salt caverns. Rock Mech. Rock Eng. 2022, 55, 691–714. [Google Scholar] [CrossRef]
  17. Grgic, D.; Amitrano, D. Creep of a porous rock and associated acoustic emission under different hydrous conditions. J. Geophys. Res. Solid Earth 2009, 114, B10201. [Google Scholar] [CrossRef]
  18. Phakey, P.P.; Aly, A.M. Direct observation of dislocations in natural barite (BaSO4). Philos. Mag. 1970, 22, 1217–1225. [Google Scholar] [CrossRef]
  19. Sakhaei, A.H.; Shafiee, M. Microscale investigation of phase transformation and plasticity in multi-crystalline shape memory alloy using discrete dislocation–transformation method. Contin. Mech. Thermodyn. 2023, 35, 279–297. [Google Scholar] [CrossRef]
  20. Ord, A. Deformation of rock: A pressure-sensitive, dilatant material. Pure Appl. Geophys. 1991, 137, 337–366. [Google Scholar] [CrossRef]
  21. Fuenkajorn, K.; Phueakphum, D. Effects of cyclic loading on mechanical properties of Maha Sarakham salt. Eng. Geol. 2010, 112, 43–52. [Google Scholar] [CrossRef]
  22. Zhou, Y.; Sheng, Q.; Li, N.; Fu, X. Numerical investigation of the deformation properties of rock materials subjected to cyclic compression by the finite element method. Soil Dyn. Earthq. Eng. 2019, 126, 105795. [Google Scholar] [CrossRef]
  23. Cui, L.; Yu, C.-H.; Jiang, S.; Sun, X.; Peng, R.L.; Lundgren, J.-E.; Moverare, J. A new approach for determining GND and SSD densities based on indentation size effect: An application to additive-manufactured Hastelloy X. J. Mater. Sci. Technol. 2022, 96, 295–307. [Google Scholar] [CrossRef]
  24. Parapari, P.S. Efficient Mineral Liberation–Multidimensional Investigation of Mechanical Stress and Ore Texture. Ph.D. Thesis, Luleå University of Technology, Luleå, Sweden, 2021. [Google Scholar]
  25. Jakubec, J. Role of defects in rock mass classification. In Ground Support 2013: Proceedings of the Seventh International Symposium on Ground Support in Mining and Underground Construction, Perth, Australia, 13–15 May 2013; Australian Centre for Geomechanics: Crawley, Australia, 2013; pp. 337–344. [Google Scholar]
  26. Yu, M.; Wang, Z.; Ma, D.; Ge, J.; Wang, Y.; Xie, H.; Wu, G.; Meng, Y. Fracture characteristics and process zone evolution in sandstone under freeze-thaw cycles. Res. Cold Arid. Reg. 2025, 17, 217–228. [Google Scholar] [CrossRef]
  27. Barber, D.J.; Wenk, H.-R.; Hirth, G.; Kohlstedt, D.L. Dislocations in minerals. Dislocations Solids 2010, 16, 171–232. [Google Scholar]
  28. Barber, D.J.; Wenk, H.-R. Slip and dislocation behaviour in dolomite. Eur. J. Mineral. 2001, 13, 221–243. [Google Scholar] [CrossRef]
  29. Hoek, E.; Martin, C.D. Fracture initiation and propagation in intact rock–a review. J. Rock Mech. Geotech. Eng. 2014, 6, 287–300. [Google Scholar] [CrossRef]
  30. Lei, R.; Zhang, Z.; Ge, Z.; Berto, F.; Wang, G.; Zhou, L. Deformation localization and cracking processes of sandstone containing two flaws of different geometric arrangements. Fatigue Fract. Eng. Mater. Struct. 2020, 43, 1959–1977. [Google Scholar] [CrossRef]
  31. Liu, S.; Li, X.; Wang, D.; Wu, M.; Yin, G.; Li, M. Mechanical and acoustic emission characteristics of coal at temperature impact. Nat. Resour. Res. 2020, 29, 1755–1772. [Google Scholar] [CrossRef]
  32. Freund, F.T. Peroxy Defects in Rock-forming Minerals in the Earth’s Crust and their Role in Resolving some of the Longest-Lasting Paradoxes across the Geosciences. AGU Fall Meet. Abstr. 2014, 2014, S51B-4458. [Google Scholar]
  33. Zhao, F.; Shi, Z.; Yu, S.; Zheng, H. A review of fracture mechanic behaviors of rocks containing various defects. Undergr. Space 2023, 12, 102–115. [Google Scholar] [CrossRef]
  34. Yang, W.; Wei, B.; Xu, Y. Study on the crack growth law and mechanism of the rock mass with defect combination. Geotech. Geol. Eng. 2021, 39, 1319–1327. [Google Scholar] [CrossRef]
  35. Hirth, J.P.; Hirth, G.; Wang, J. Disclinations and disconnections in minerals and metals. Proc. Natl. Acad. Sci. USA 2020, 117, 196–204. [Google Scholar] [CrossRef]
  36. Ashby, M.F. The deformation of plastically non-homogeneous materials. Philos. Mag. A J. Theor. Exp. Appl. Phys. 1970, 21, 399–424. [Google Scholar] [CrossRef]
  37. Muransky, O.; Balogh, L.; Tran, M.; Hamelin, C.J.; Park, J.-S.; Daymond, M.R. On the measurement of dislocations and dislocation substructures using EBSD and HRSD techniques. Acta Mater. 2019, 175, 297–313. [Google Scholar] [CrossRef]
  38. Zhu, C.; Harrington, T.; Gray, G.T., III; Vecchio, K.S. Dislocation-type evolution in quasi-statically compressed polycrystalline nickel. Acta Mater. 2018, 155, 104–116. [Google Scholar] [CrossRef]
  39. Birosca, S.; Liu, G.; Ding, R.; Jiang, J.; Simm, T.; Deen, C.; Whittaker, M. The dislocation behaviour and GND development in a nickel based superalloy during creep. Int. J. Plast. 2019, 118, 252–268. [Google Scholar] [CrossRef]
  40. Cui, L.; Jiang, S.; Xu, J.; Peng, R.L.; Mousavian, R.T.; Moverare, J. Revealing relationships between microstructure and hardening nature of additively manufactured 316L stainless steel. Mater. Des. 2021, 198, 109385. [Google Scholar] [CrossRef]
  41. Graça, S.; Colaço, R.; Carvalho, P.A.; Vilar, R. Determination of dislocation density from hardness measurements in metals. Mater. Lett. 2008, 62, 3812–3814. [Google Scholar] [CrossRef]
  42. Kearney, C.; Zhao, Z.; Bruet, B.J.F.; Radovitzky, R.; Boyce, M.C.; Ortiz, C. Nanoscale anisotropic plastic deformation in single crystal aragonite. Phys. Rev. Lett. 2006, 96, 255505. [Google Scholar] [CrossRef] [PubMed]
  43. Leroux, H. Microstructural shock signatures of major minerals in meteorites. Eur. J. Mineral. 2001, 13, 253–272. [Google Scholar] [CrossRef]
  44. Monteiro, P.J.M.; Shomglin, K.; Wenk, H.R.; Hasparyk, N.P. Effect of aggregate deformation on alkali-silica reaction. Mater. J. 2001, 98, 179–183. [Google Scholar]
  45. Nyilas, K.; Couvy, H.; Cordier, P.; Ungár, T. The dislocation structure and crystallite-size in forsterite (olivine) deformed at 14008C by 11 GPa. Z. Fur Krist. Suppl. 2006, 2006, 135–140. [Google Scholar] [CrossRef] [PubMed]
  46. Wenk, H.-R.; Monteiro, P.J.M.; Shomglin, K. Relationship between aggregate microstructure and mortar expansion. A case study of deformed granitic rocks from the Santa Rosa mylonite zone. J. Mater. Sci. 2008, 43, 1278–1285. [Google Scholar] [CrossRef]
  47. Wenk, H.-R.; Bulakh, A. Minerals: Their Constitution and Origin; Cambridge University Press: Cambridge, UK, 2016. [Google Scholar]
  48. Durst, K.; Backes, B.; Franke, O.; Göken, M. Indentation size effect in metallic materials: Modeling strength from pop-in to macroscopic hardness using geometrically necessary dislocations. Acta Mater. 2006, 54, 2547–2555. [Google Scholar] [CrossRef]
  49. De Guzman, M.S.; Neubauer, G.; Flinn, P.; Nix, W.D. The role of indentation depth on the measured hardness of materials. MRS Online Proc. Libr. 1993, 308, 613. [Google Scholar] [CrossRef]
  50. Tanner, B.K.; Fathers, D.J. Contrast of crystal defects under polarized light. Philos. Mag. A J. Theor. Exp. Appl. Phys. 1974, 29, 1081–1094. [Google Scholar] [CrossRef]
  51. Mathews, N.G.; Saxena, A.K.; Venkataramani, N.; Dehm, G.; Jaya, B.N. Multiscale characterization of damage tolerance in barium titanate thin films. J. Appl. Phys. 2022, 132, 045302. [Google Scholar] [CrossRef]
  52. Ma, Q.; Clarke, D.R. Size dependent hardness of silver single crystals. J. Mater. Res. 1995, 10, 853–863. [Google Scholar] [CrossRef]
  53. Nix, W.D.; Gao, H. Indentation size effects in crystalline materials: A law for strain gradient plasticity. J. Mech. Phys. Solids 1998, 46, 411–425. [Google Scholar] [CrossRef]
  54. Afolayan, D.O. Characterisation and Processing of Baryte Ores for Oil Drilling Applications. AUST Repos. 2021, 1–184. Available online: https://repository.aust.edu.ng/xmlui/handle/123456789/5032 (accessed on 9 November 2025).
  55. Ezenwafor, T.; Anye, V.; Madukwe, J.; Amin, S.; Obayemi, J.; Odusanya, O.; Soboyejo, W. Nanoindentation study of the viscoelastic properties of human triple negative breast cancer tissues: Implications for mechanical biomarkers. Acta Biomater. 2023, 158, 374–392. [Google Scholar] [CrossRef] [PubMed]
  56. Oliver, W.C.; Pharr, G.M. Improved technique for determining hardness and elastic modulus using load and displacement sensing indentation experiments. J. Mater. Res. 1992, 7, 1564–1583. [Google Scholar] [CrossRef]
  57. Jamal, M.; Morgan, M.N. Materials characterization part I: Contact area of the Berkovich indenter for nanoindentation tests. Int. J. Adv. Manuf. Technol. 2017, 92, 361–370. [Google Scholar] [CrossRef]
  58. Yan, W.; Pun, C.L.; Simon, G.P. Conditions of applying Oliver–Pharr method to the nanoindentation of particles in composites. Compos. Sci. Technol. 2012, 72, 1147–1152. [Google Scholar] [CrossRef]
  59. Oliver, W.C.; Pharr, G.M. Measurement of hardness and elastic modulus by instrumented indentation: Advances in understanding and refinements to methodology. J. Mater. Res. 2004, 19, 3–20. [Google Scholar] [CrossRef]
  60. Dhanal, S.V.; Ingale, S. Investigation of nanomechanical properties of Ni-Mn based Heusler alloys using nanoindentation technique. J. Phys. Conf. Ser. 2023, 2604, 012007. [Google Scholar] [CrossRef]
  61. Constantinides, G.; Chandran, K.S.R.; Ulm, F.J.; Van Vliet, K.J. Grid indentation analysis of composite microstructure and mechanics: Principles and validation. Mater. Sci. Eng. A 2006, 430, 189–202. [Google Scholar] [CrossRef]
  62. Adamu, H.A.; Olajuyi, S.I.; Bello, A.; Onwualu, P.A.; Ogunmodimu, O.S.O.; Afolayan, D.O. Mechanical Loading of Barite Rocks: A Nanoscale Perspective. Minerals 2025, 15, 779. [Google Scholar] [CrossRef]
  63. ISO/FDIS 14577-1; Metallic Materials—Instrumented Indentation Test for Hardness and Material Parameter, Part 1: Test Method. ISO—International Organization for Standardization: Geneve, Switzerland, 2002.
  64. Shen, L.; Wang, L.; Liu, T.; He, C. Nanoindentation and Morphological Studies of Epoxy Nanocomposites. Macromol. Mater. Eng. 2006, 291, 1358–1366. [Google Scholar] [CrossRef]
  65. Ngasoh, O.F.; Anye, V.C.; Ojo, E.B.; Stanislas, T.T.; Bello, A.; Agyei-Tuffour, B.; Orisekeh, K.; Oyewole, O.K.; Rahbar, N.; Soboyejo, W.O. Mechanical Properties of Epoxy/Clay Composite Coatings on an X65 Steel Substrate. Cogent Eng. 2021, 8, 1944015. [Google Scholar] [CrossRef]
  66. Cui, Z.; Dai, F.; Liu, Y.; Zhang, B.; Wei, M.; Zhang, Q. Dynamic fracture properties and criterion of cyclic freeze-thaw treated granite subjected to mixed-mode loading. J. Rock Mech. Geotech. Eng. 2024, 16, 4971–4989. [Google Scholar] [CrossRef]
  67. GB/T50266-2013; Standard for Test Methods of Engineering Rock Mass. China Planning Press: Beijing, China, 2013. (In Chinese)
  68. D3967-23; Standard Test Method for Splitting Tensile Strength of Intact Rock Core Specimens with Flat Loading Platens. ASTM International: West Conshohocken, PA, USA, 2023.
  69. Manika, I.; Maniks, J. Size effects in micro-and nanoscale indentation. Acta Mater. 2006, 54, 2049–2056. [Google Scholar] [CrossRef]
  70. Milman, Y.V.; Golubenko, A.A.; Dub, S.N. Indentation size effect in nanohardness. Acta Mater. 2011, 59, 7480–7487. [Google Scholar] [CrossRef]
  71. Asumadu, T.K.; Mensah-Darkwa, K.; Gikunoo, E.; Klenam, D.E.P.; Vandadi, M.; Rahbar, N.; Kwofie, S.; Soboyejo, W.O. Strain gradient plasticity phenomenon in surface treated plain carbon steel. Mater. Sci. Eng. A 2023, 871, 144806. [Google Scholar] [CrossRef]
  72. Hill, R.J. A Further Refinement of the Barite Structure. Can. Mineral. 1977, 15, 522–526. [Google Scholar]
  73. Paulsen, C.; Galéa-Clolus, V.; Pöttgen, R. Crystal structure of barite from Mine du Pradet (France). Z. Krist. Cryst. Struct. 2023, 238, 611–613. [Google Scholar] [CrossRef]
  74. Ojo, E.B.; Bello, K.O.; Ngasoh, O.F.; Stanislas, T.T.; Mustapha, K.; Savastano, H., Jr.; Soboyejo, W. Mechanical performance of fiber-reinforced alkali activated un-calcined earth-based composites. Constr. Build. Mater. 2020, 247, 118588. [Google Scholar] [CrossRef]
  75. Wang, J.; Liu, Y.; Yang, C.; Jiang, W.; Li, Y.; Xiong, Y. Modeling the viscoelastic behavior of quartz and clay minerals in shale by nanoindentation creep tests. Geofluids 2022, 2022, 2860077. [Google Scholar] [CrossRef]
  76. Afolayan, D.O.; Adetunji, A.R.; Onwualu, A.P.; Ogolo, O.; Amankwah, R.K. Characterization of barite reserves in Nigeria for use as weighting agent in drilling fluid. J. Pet. Explor. Prod. Technol. 2021, 11, 2157–2178. [Google Scholar] [CrossRef]
  77. Ebunu, A.I.; Bayode, B.L.; Olubambi, P.A.; Adetunji, A.R.; Onwualu, A.P. Characterization of barite ores from selected locations in Nigeria for drilling fluid formulation. Sci. Afr. 2021, 14, e01057. [Google Scholar] [CrossRef]
  78. Ebunu, A.I.; Olanrewaju, Y.A.; Ogolo, O.; Adetunji, A.R.; Onwualu, A.P. Barite as an industrial mineral in Nigeria: Occurrence, utilization, challenges and future prospects. Heliyon 2021, 7, e07365. [Google Scholar] [CrossRef] [PubMed] [PubMed Central]
  79. Ehirim, C.N.; Ebeniro, J.O.; Ofoegbu, C.O. Baryte mineral exploration in parts of the lower Benue Trough, Nigeria. Int. J. Phys. Sci. 2016, 11, 279–286. [Google Scholar] [CrossRef]
  80. Eseimokumoh, I.B.; Eniye, O. Characterization of Barite (A Case Study of Biase and Yakurr Local Government Areas, Cross River State, Nigeria). Int. Res. J. Mod. Eng. Technol. Sci. 2022, 4, 4324–4335. [Google Scholar]
  81. de Macedo, G.N.B.M.; Sawamura, S.; Wondraczek, L. Lateral hardness and the scratch resistance of glasses in the Na2O-CaO-SiO2 system. J. Non-Cryst. Solids 2018, 492, 94–101. [Google Scholar] [CrossRef]
  82. Whitney, D.L.; Broz, M.; Cook, R.F. Hardness, toughness, and modulus of some common metamorphic. Am. Miner. 2007, 92, 281–288. [Google Scholar] [CrossRef]
  83. Bond, T.; Badmos, A.; Ahmed, R.A.; Obayemi, J.D.; Salifu, A.; Rahbar, N.; Soboyejo, W.O. Indentation size effects in aluminum and titanium alloys. Mater. Sci. Eng. A 2022, 839, 142542. [Google Scholar] [CrossRef]
  84. de Paula, O.B. Elastic Properties of Carbonates: Measurements and Modelling. Ph.D. Thesis, Curtin University, Perth, Australia, 2011. [Google Scholar]
  85. Briševac, Z.; Pollak, D.; Maričić, A.; Vlahek, A. Modulus of elasticity for grain-supported carbonates—Determination and estimation for preliminary engineering purposes. Appl. Sci. 2021, 11, 6148. [Google Scholar] [CrossRef]
  86. Guder, V.; Senturk Dalgic, S. Thermodynamic Properties of Potassium Oxide (K2O) Nanoparticles by Molecular Dynamics Simulations. Acta Phys. Pol. A 2017, 131, 490–494. [Google Scholar] [CrossRef]
  87. Kudělka, R.; Václavek, L.; Tomáštík, J.; Malecová, S.; Čtvrtlík, R. Laser-induced surface acoustic waves for thin film characterization. Acta Polytech. CTU Proc. 2020, 27, 57–61. [Google Scholar] [CrossRef]
  88. Ouglova, A.; Berthaud, Y.; François, M.; Foct, F. Mechanical properties of an iron oxide formed by corrosion in reinforced concrete structures. Corros. Sci. 2006, 48, 3988–4000. [Google Scholar] [CrossRef]
  89. Patel, H.S.; Dabhi, V.A.; Vora, A.M. First principles investigation of electronic and elastic properties of strontium oxide and strontium peroxide phases: Insights into structural stability and phase transitions. Phys. Scr. 2023, 98, 125930. [Google Scholar] [CrossRef]
  90. Azo Materials. 2025. Available online: https://www.azom.com/article.aspx?ArticleID=1114 (accessed on 1 August 2025).
  91. Saif, M.T.A.; Zhang, S.; Haque, A.; Hsia, K.J. Effect of native Al2O3 on the elastic response of nanoscale Al films. Acta Mater. 2002, 50, 2779–2786. [Google Scholar] [CrossRef]
  92. Noinonmueng, T.; Phacheerak, K. Structural and Mechanical Properties of Cubic Na2O: First-Principles Calculations. Res. J. Rajamangala Univ. Technol. Thanyaburi 2020, 19, 17–24. [Google Scholar] [CrossRef]
  93. Korth Kristalle Company. Magnesium Oxide. 2025. Available online: https://www.korth.de/en/materials/detail/Magnesium%20Oxide (accessed on 1 August 2025).
  94. Dragoo, A.L.; Spain, I.L. The elastic moduli and their pressure and temperature derivatives for calcium oxide. J. Phys. Chem. Solids 1977, 38, 705–710. [Google Scholar] [CrossRef]
  95. Zhou, Q.; Wang, S.; Liu, J.; Hu, X.; Liu, Y.; He, Y.; He, X.; Wu, X. Geological evolution of offshore pollution and its long-term potential impacts on marine ecosystems. Geosci. Front. 2022, 13, 101427. [Google Scholar] [CrossRef]
  96. Wuepper, D.; Borrelli, P.; Finger, R. Countries and the Global Rate of Soil Erosion. Nat. Sustain. 2020, 3, 51–55. [Google Scholar] [CrossRef]
  97. Andersson, L. Soil Loss Estimation Based on the USLE/GIS Approach Through Small Catchments—A Minor Field Study in Tunisia. Master’s Thesis, Lund University, Lund, Sweden, 2010. [Google Scholar]
  98. Eswaran, H.; Lal, R.; Reich, P. Land Degradation: An Overview. In Response to Land Degradation; CRC Press: Boca Raton, FL, USA, 2019; pp. 20–35. [Google Scholar]
  99. Emetumah, F.; Okoye, A. Role of Government in Ensuring Safety Consciousness during Mineral Mining Activities in Nigeria. Eur. Sci. J. 2018, 14, 165–184. [Google Scholar] [CrossRef]
  100. Afolayan, D.O.; Onwualu, A.P.; Eggleston, C.M.; Adetunji, A.R.; Tao, M.; Amankwah, R.K. Safe Mining Assessment of Artisanal Barite Mining Activities in Nigeria. Mining 2021, 1, 224–240. [Google Scholar] [CrossRef]
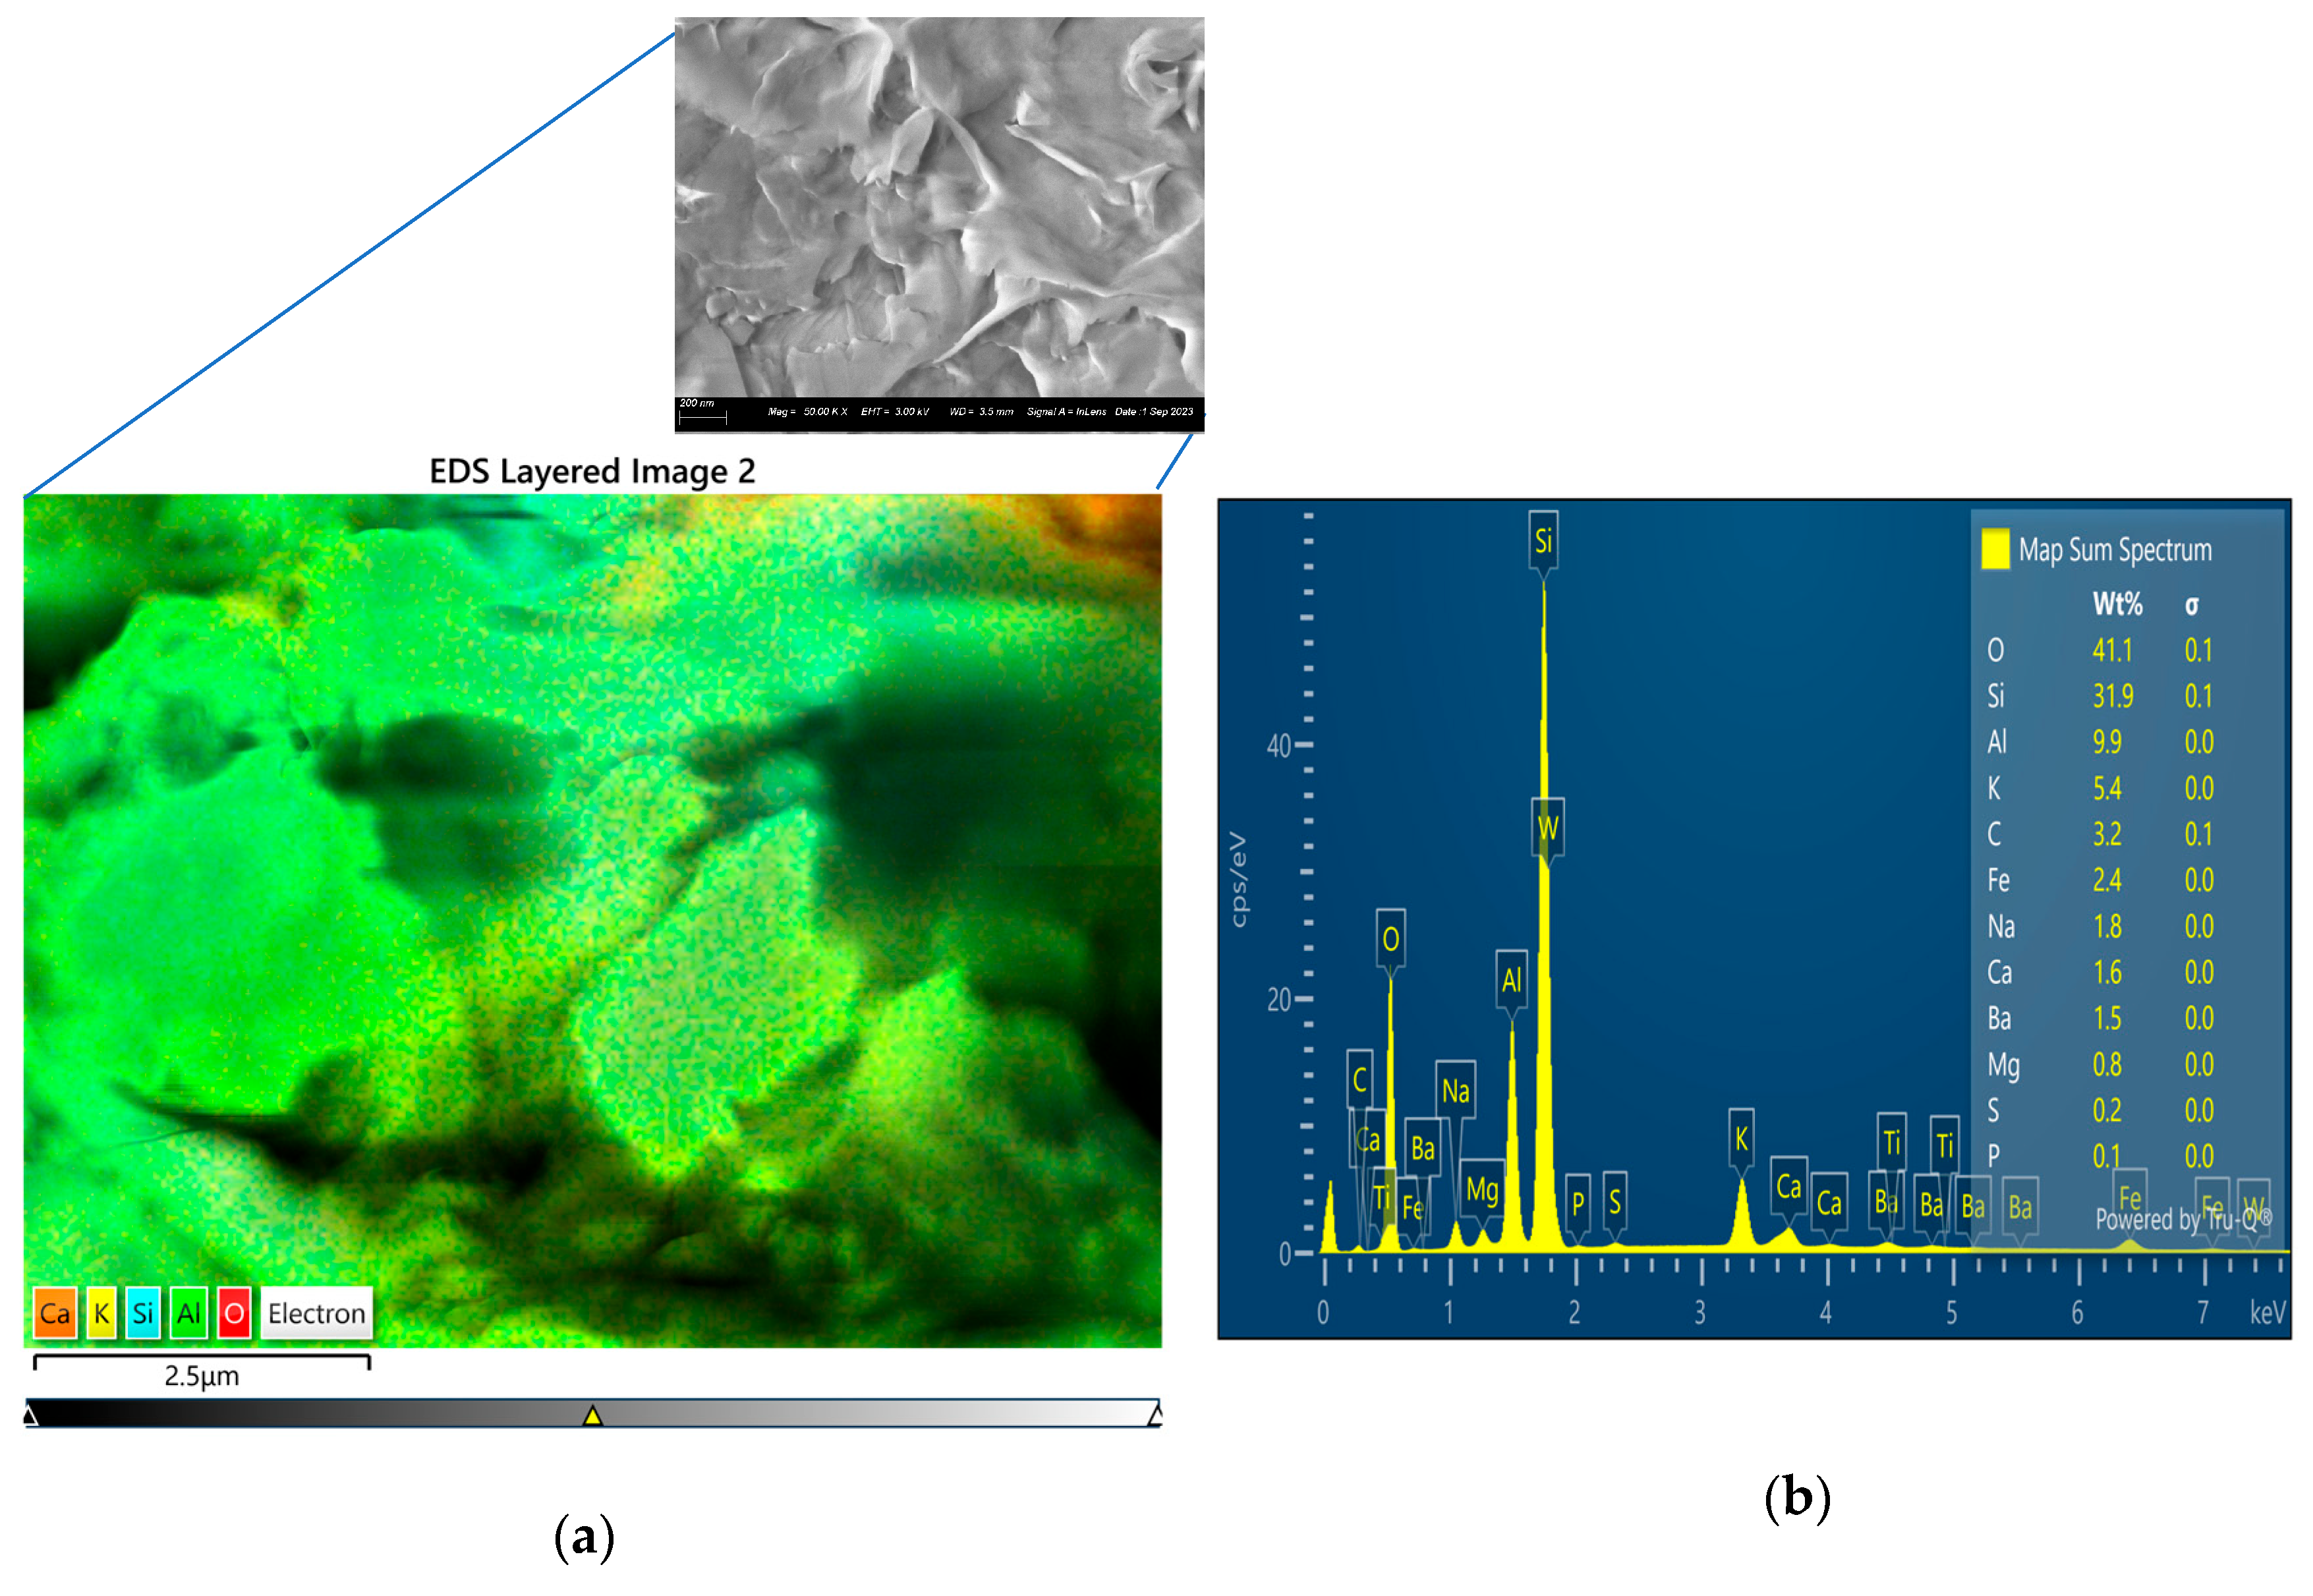
Figure 1. SEM images and EDS elemental mapping of barite rock materials, (a) SEM-EDS elemental mapping of sample IB1. These are the barite rock surfaces at nanoscale (200 nm) and the elemental mapping (SEM-elemental mapping) of rock surfaces at 25 microns. (b) are the results of the EDS analyses of barite rock sample IB1 which present the semi-quantitative compositional information from electron dispersive spectroscopy (EDS). The figures show the EDS peaks indicating the energies of each element.
Minerals 15 01226 g001
Figure 2. SEM images and EDS elemental mapping of barite rock materials (a) SEM-EDS elemental mapping of sample IB2. These are the barite rock surfaces at nanoscale (200 nm) and the elemental mapping (SEM-elemental mapping) of rock surfaces at 25 microns. (b) are the results of the EDS analyses of barite rock sample IB2 which present the semi-quantitative compositional information from electron dispersive spectroscopy (EDS). The figures show the EDS peaks indicating the energies of each element.
Minerals 15 01226 g002
Figure 3. SEM images and EDS elemental mapping of barite rock material (a) SEM-EDS elemental mapping of sample IB5.These are the barite rock surfaces at nanoscale (200 nm) and the elemental mapping (SEM-elemental mapping) of rock surfaces at 25 microns. (b) are the results of the EDS analyses of barite rock sample IB5 which present the semi-quantitative compositional information from electron dispersive spectroscopy (EDS). The figures show the EDS peaks indicating the energies of each element.
Minerals 15 01226 g003
Figure 4. SEM images and EDS elemental mapping of barite rock materials (a) SEM-EDS elemental mapping of sample IB6. These are the barite rock surfaces at nanoscale (200 nm) and the elemental mapping (SEM-elemental mapping) of rock surfaces at 25 microns. (b) are the results of the EDS analyses of barite rock sample IB6 which present the semi-quantitative compositional information from electron dispersive spectroscopy (EDS). The figures show the EDS peaks indicating the energies of each element.
Minerals 15 01226 g004
Figure 5. (ah): Figures showing the variation in hardness and statistical deconvolution of the barite rock materials. (a,b) represent the 2D hardness map and statistical analysis of the mineral phases’ presence in barite rock IB1. The x and y coordinates indicate the locations of the indents, as well as the hardness values of the barite rock samples. (c,d) represent the 2D hardness map and statistical analysis of the mineral phases’ presence in barite rock IB2. (e,f) represent the 2D hardness map and statistical analysis of the mineral phases’ present in barite rock IB5, and (g,h) show the 2D hardness map and statistical analysis of the mineral phases’ present in barite rock IB6. The y-axis represents the hardness frequency density, indicating the most and least common hardness values and the variation in the rocks’ hardness across the indented points.
Minerals 15 01226 g005aMinerals 15 01226 g005b
Figure 6. A figure showing the hardness values at various indentation depth obtained for the barite rock samples.
Minerals 15 01226 g006
Figure 7. (ad) Spatial variations in elastic moduli of 100 indented points on each barite rock sample: (a) barite rock sample 1 (IB1), (b) barite rock sample 2 (IB2), (c) barite rock sample 3 (IB5) and (d) barite rock sample 4 (IB6).
Minerals 15 01226 g007
Figure 8. Plots of hardness squared (H2) versus the inverse of the indentation depth (h−1): for barite rock sample 1 (IB1), barite rock sample 2 (IB2); barite rock sample 3 (IB5) and barite rock sample 4 (IB6).
Minerals 15 01226 g008
Figure 9. Dependence of geometrically necessary dislocation density ( ρ GNDs) on dislocation spacing.
Minerals 15 01226 g009
Table 1. Lattice parameters of barite.
Serial/N0Lattice Parameters of BaSO4
a (Å)b (Å)c (Å)Volume (Å3)A = β = γ = (°)
This study5.527.228.94356.390
Hill [72]5.467.168.88326.0
Paulsen et al. [73]5.457.168.88346.6
Table 2. Mineral phases in the barite rock samples showing the minerals present in constitutive compositions of each barite stone/rock sample.
S/NRock SamplesMineral Phases (wt%)
1.IB1Barite (BaSO4)—33.0%Quartz (SiO2)—56.0%Chlorite
(Mg,Fe)5(Al,Si)5 O10—7.0%
Albite (NaAlSi3O8)—3.3%
2.IB2Quartz (SiO2)—64.0%Barite (BaSO4)—22.0%Chlorite
(Mg,Fe)5(Al,Si)5 O10—0.2%
Albite (NaAlSi3O8)—14.0%
3.IB5Barite (BaSO4)—37.0%Quartz (SiO2)—58.0%Albite (NaAlSi3O8)—1.0%Chlorite
(Mg,Fe)5(Al,Si)5 O10—4.0%
4.IB6Barite (BaSO4)—38.0%Quartz (SiO2)—42.0%Chlorite
(Mg,Fe)5(Al,Si)5 O10—3.0%
Albite (NaAlSi3O8)—17.0%
Table 3. Oxides of the elements present in the four barite rock samples, and the modulus ranges of the oxides as reported in the literature. The oxides are combined into specific compounds based on the minerals phases indicated in the mineralogical composition (XRD results in Table 2).
S/NOxides Obtained from EDX MappingModulus (GPa)Author
1BaSO436–47[62]
2SiO266.3–74.8[90]
3Al2O3Up to 370 [91]
4CO356–144
38.38 to 93.26
[84,85]
5K2O22–70[86]
6Fe2O3214–350[88]
7Na2O75–93[92]
8MgO248[93]
9CaO226[94]
Table 4. Summary of the geometrically necessary dislocations (GNDs) density, ( ρ G N D s ) or (ρG), statistically stored dislocations (SSDs) density (SSDs), ( ρ S S D s ) or (ρs) and the total dislocation density, ρT, of the barite rock materials.
S/NSampleρG [m−2]ρS [m−2]ρT [m−2]
1IB14.47 × 10157.68 × 10145.24 × 1015
2IB23.35 × 1015−1.90 × 10151.45 × 1015
3IB52.89 × 10152.07 × 10154.96 × 1015
4IB64.56 × 10156.21 × 10151.08 × 1016
Table 5. Hardness values associated with SSDs (Ho) at different characteristics depth (h*), length scale and dislocation spacing for the GNDs (ρG) and SSDs (ρS).
SampleHo (GPa)h* (nm)Length Scale [nm]ρS Spacing-L [m]ρG Spacing-L [m]
IB12.296.78783.61 × 10−81.50 × 10⁻⁸
IB21.749.61359−2.29 × 10−81.73 × 10−8
IB53.271.14092.20 × 10−81.86 × 10⁻⁸
IB66.126.51141.27 × 10−81.48 × 10⁻⁸
Disclaimer/Publisher’s Note: The statements, opinions and data contained in all publications are solely those of the individual author(s) and contributor(s) and not of MDPI and/or the editor(s). MDPI and/or the editor(s) disclaim responsibility for any injury to people or property resulting from any ideas, methods, instructions or products referred to in the content.