Article

DFT-D Investigation of Dithiocarbamate, Thionocarbamate, Mercaptobenzothiazole, and S-Triazine Collector Adsorptions on Pentlandite (Fe5Ni4S8) Mineral Surface

Materials Modelling Centre, University of Limpopo, Private Bag x1106, Sovenga 0727, South Africa
*
Author to whom correspondence should be addressed.
Minerals 2025, 15(11), 1222; https://doi.org/10.3390/min15111222
Submission received: 15 October 2025 / Revised: 11 November 2025 / Accepted: 15 November 2025 / Published: 20 November 2025

Abstract

With the increasing demand for nickel, relentless efforts have been made to find alternative and highly selective collectors for recovering pentlandite. This study employed density functional theory (DFT) with dispersion correction to examine the interactions of iron-rich pentlandite (Fe5Ni4S8) mineral surface with various collectors: S-allyl-N-diethyl-dithiocarbamate (ADEDTC), O-isopropyl-N-diethyl-thionocarbamate (IPDETC), sodium mercaptobenzothiazole (SMBT), and sodium-2,6-dithio-4-butylamino-1,3,5-triazine (SDTBAT). The plane surface of (311) proved to be the most stable surface with a surface energy of 1.48 J.m−2, aligning well with the experimental X-ray diffraction (XRD) results and morphology. Adsorption simulations were performed on both Ni and Fe atoms of the plane surface of (311). ADEDTC exhibited the most exothermic adsorption energy of −460.58 kJ.mol−1, compared to SMBT (−249.59 kJ.mol−1), IPDETC (−161.01 kJ.mol−1), and SDTBAT (−352.48 kJ.mol−1). The adsorption strengths followed the order ADEDTC > SMBT > SDTBAT > IPDETC. Importantly, these collectors showed a preferential adsorption on the Ni atoms over Fe atoms, indicating selectivity towards Ni sites on the pentlandite mineral surface. These findings suggested that ADEDTC was the most effective collector for flotation applications involving pentlandite. As such, ADEDTC could potentially replace commonly used collectors or be used as a co-collector in the recovery of pentlandite minerals.

Graphical Abstract

1. Introduction

The growing demand for nickel, tighter environmental rules on sulphur emissions, competition from nickel oxide ores as the main source, and the limited selectivity of xanthate collectors all present major challenges in pentlandite flotation [1]. Additionally, exploration of these minerals remains limited, leaving their crystal structures and properties relevant to computational recovery poorly understood. Past research has studied the flotation of both natural and synthetic pentlandite (Fe,Ni)9S8 for nickel beneficiation through experimental approaches, providing valuable insights into the mineral’s surface reactions [2]. Pentlandite mineral is composed of about 22% Ni, 42% Fe, and 36% S [3], and naturally contains some cobalt in its composition [4]. As such, pentlandite is the main source of nickel and a significant carrier of platinum group elements (PGEs). The PGEs are usually found in some quantities within pentlandite grains. Pentlandite is found in various locations worldwide, mainly within the lower margins of mineralised ultramafic layered intrusions [5]. South Africa is one of the major sources of pentlandite with high Ni content (about ~30%) in the Merensky reef of the Bushveld complex [5]. Nickel extraction is widespread and vital for many industrial applications, such as making stainless steel, coins, and rechargeable batteries. This has driven up the demand for nickel [6,7].
To ensure the sustainability of the nickel sulphide processing industry, processes must be improved with efficient collectors in order to cut costs. Traditionally, pentlandite and nickel ore flotation have relied on collectors such as xanthates, dithiophosphates, and dithiocarbamates, although their effectiveness is somewhat limited [3,8,9]. While these collectors have long been used in the flotation processes, the challenge persists in finding an optimal collector that offers both strong flotation ability and high selectivity. These current collectors are preferred for flotation of sulphide ores because of their high electron affinity for sulphide minerals and their role as sulphur donors [7]. Thionocarbamates (TC) represents another class of thiol collectors used specifically to recover chalcopyrite during flotation, differentiating it from pyrite and galena [10,11,12]. Heterocyclic collectors such as sodium 2-mercaptobenzothiazole (SMBT) have been studied and have the advantage of operating at neutral pH and show excellent selectivity [13]. Studies have indicated that heterocyclic compounds can form hydrophobic complexes with various metals, including iron, copper, cobalt, and nickel [14]. As such, a recent study explored modifying MBT, MBO, and mercaptobenzimidazole (MBI) by introducing a trithiocarbonate (TTC) to improve flotation of pyrite, noting that the derivatives enhanced pyrite flotation under weak acidic (pH = 6) conditions [15]. The s-triazine compounds, a class of nitrogen-containing heterocycles with the formula C3H3N3, are also possible collectors that have gained traction in recent research [16,17]. It was found that comparing s-triazine such as sodium dithio-butyl-amino-triazine (SDTBAT) to xanthate and dithiocarbamate with butyl chains revealed that s-triazine exhibited superior flotation and adsorption properties for pyrite [16]. Similarly, a recent density functional theory (DFT) study on the cooperite (101) surface indicated that s-triazine had stronger adsorption than xanthate and dithiocarbamate [17].
Research on computational and experimental approaches for pentlandite separation remains limited. Earlier experimental studies into pentlandite flotation provided valuable insights into its surface reactivity [3,8,9]. For Fe-enriched pentlandite, the xanthates collectors are known to bind more strongly than hydroxide anions, while in Ni-enriched pentlandite, hydroxide anions bind more strongly than xanthates [18]. Ikotun et al. examined three collectors, potassium amyl xanthate (PAX), sodium isobutyl xanthate (SIBX), and sodium ethyl xanthate (SEX), to optimise recovery of nickel and pentlandite. It was found that SEX was the most effective, yielding higher recoveries than PAX and SIBX [19]. The DFT methods were also used to study the interaction of thiol collectors, sodium ethyl xanthate (SEX), sodium isobutyl xanthate (SIBX), and diethyl dithiophosphate (DEDTP) with the nickel-rich pentlandite (Fe4Ni5S8) (110) surface to predict flotation performance. The results showed that DEDTP had the strongest adsorption [20]. A study also compared the effects of using potassium amyl xanthate (PAX), isopropyl ethyl thionocarbamate (IPETC), sodium isobutyl xanthate (SIBX), and their mixtures in the froth flotation of a pentlandite ore. It was observed that the highest cumulative nickel grades were obtained with PAX, SIBX, and their mixture, while the highest cumulative nickel recoveries were obtained with IPETC and its mixtures with PAX and SIBX [19]. Another recent study on sodium butyl xanthate (NaBX) and N-propyl-N-allyl-o-isobutyl thiocarbamate (NAOITC) combined collectors showed that the NAOITC collector has great potential to enhance the recovery rate of pentlandite and nickel in industrial beneficiation [21]. There is a clear gap for improving the recovery of pentlandite minerals. Thus, it is essential to develop highly selective and efficient collectors as alternatives or supplements to xanthate, dithiocarbamate, and dithiophosphate to enhance the floatability of pentlandite. Moreover, heterocyclic compounds, thionocarbamates, and s-triazine collectors have demonstrated selectivity and strong flotation performance for sulphides like chalcopyrite and pyrite. However, their applications in pentlandite flotation are limited.
This study employed computational methods to investigate the tetragonal iron-rich pentlandite (Fe5Ni4S8), starting from surface orientations and terminations to identify the most stable surface. The adsorptions of collectors, namely sodium mercaptobenzothiazole (SMBT), novel triazine, namely sodium 2,6-dithio-4-butylamino-1,3,5-triazine (SDTBAT), thionocarbamate O-isopropyl-N-diethyl-thionocarbamate (IPDETC), and S-allyl-N-diethyl-dithiocarbamate (ADEDTC) collectors will be performed on the most stable surface. The electronic properties will also be examined to describe the bonding chemistry.

2. Materials and Methods

2.1. Computational Methods

The geometry optimisation calculations were performed by employing the density functional theory (DFT). The generalised gradient approximation along with the Perdew–Burke–Ernzerhof (GGA-PBE) functional [22] and the project-augmented-wave (PAW) pseudopotential were adopted within the Vienna Ab-initio Simulation Package (VASP) code [23]. The Grimme [24] dispersion correction method with Becke–Johnson (BJ) damping (D3) was adopted. The plane-wave basis set with a cut-off energy of 400 eV was adopted, which demonstrated convergence to within 0.2 meV.atom−1. The electron configurations considered were Fe-[Ar]3d74s1, Ni-[Ar]3d10, S-[Ne]3s23p4, H-1S2, C-[He]2S22p3, N-[He]2S22p3, O-[He]2S22p4, and Na-[Ne]3S1. The computational optimisations were carried out using the conjugate-gradient algorithm and were considered converged when the force on each ion was less than 0.02 eV/Å. The self-consistent convergence tolerance was set to 1.0 × 10⁻⁶ eV/atom. To enhance the convergence of the Brillouin-zone integrations, partial occupancies were determined using the Methfessel–Paxton smearing method, with a smearing width of 0.2 eV applied to all calculations. The k-points grid of 8 × 8 × 6 for bulk and 4 × 4 × 1 for surface structures was generated using the Monkhorst–Pack scheme [25]. However, for surface adsorptions, the k-points of 1 × 1 × 1 were utilised to reduce the computational costs of these intensive adsorption calculations.
Prior to surface adsorptions, the collectors were optimised using PAW pseudopotentials, with the same cut-off energy and other parameters as those used for the surface system and k-point parameters set to the gamma point (1 × 1 × 1) inside a cubic cell of 40 Å using the VASP code. The collector molecules’ HOMO and LUMO energies and their isosurfaces were obtained from optimisation with DMol3 code [26]. The DMol3 calculations were performed using GGA-PBE and adopted dispersion correction by the Tkatchenko and Scheffler (TS) approach to account for the long-range interactions [27]. The convergence tolerances for energy, force, and displacement were 2.0 × 10⁻⁵ Ha, 0.004 Ha/Å, and 0.005 Å, respectively. The double numerical plus polarisation (DNP) basis set with a 4.4 basis file was set using DFT semi-core pseudopotentials. The VESTA software, version 3.4.0 [28] was utilised to visualise the charge density difference between the surface–collector system and the clean surface plus the collector molecule.

Energy Calculations

The surface energy (J.m−2) was computed using Equation (1) [29,30]:
E s u r f a c e = E s l a b n s l a b E b u l k 2 A ,
where E(slab) is the energy of the cell containing the surface slab, E(bulk) is the total energy per atom of the bulk, n(slab) is the number of atoms in the slab, A is the surface area obtained from the surface A and B cell vectors, and the factor ½ accounts for the top and bottom surfaces. This formula is used in order to account for the number of atoms in the surface and normalise it to the bulk.
The adsorption energies (Eads.) for organic collectors (ligands) on the surface were defined as the mean adsorption energy or energy per molecule on the surface. The strength of the adsorbate collector’s waterless (311) surface adsorptions was calculated based on Equation (2) [11]:
E a d s . = [ E s y s t e m E s u r f a c e + E a d s o r b a t e ] ,
In this case, clean surface slab energy is given by Esurface, the energy of the isolated adsorbate is represented by Eadsorbate, and the energy of the adsorbed surface slab (pentlandite surface + collector) by Esystem.

3. Results

3.1. Pentlandite (Fe5Ni4S8) Bulk and Surface Models

The bulk Fe-rich pentlandite (Fe5Ni4S8) was reported as the most stable compound based on cluster expansion [31]. As shown in Figure 1, the structure of Fe5Ni4S8 was tetragonal, possessing a P4_2/nmc space group. The structural lattice properties were a = b = 7.020 Å and c = 9.930 Å. It was noted that a and b lattice takes the value of the primitive structure of Fe5Ni4S8 [31]. It was reported that in the conversion of the primitive structure to conventional structure, the lattice is multiplied by 2 , which gave a = b = 7.020 × 2 = 9.930   Å . This suggested that the generated structure could be cubic. The lattice parameters of 9.930 Å agreed with the previously reported values of 9.991 Å [32] and 9.977 Å [29]. The electronic density of states for pentlandite (Fe5Ni4S8) were previously reported [31].
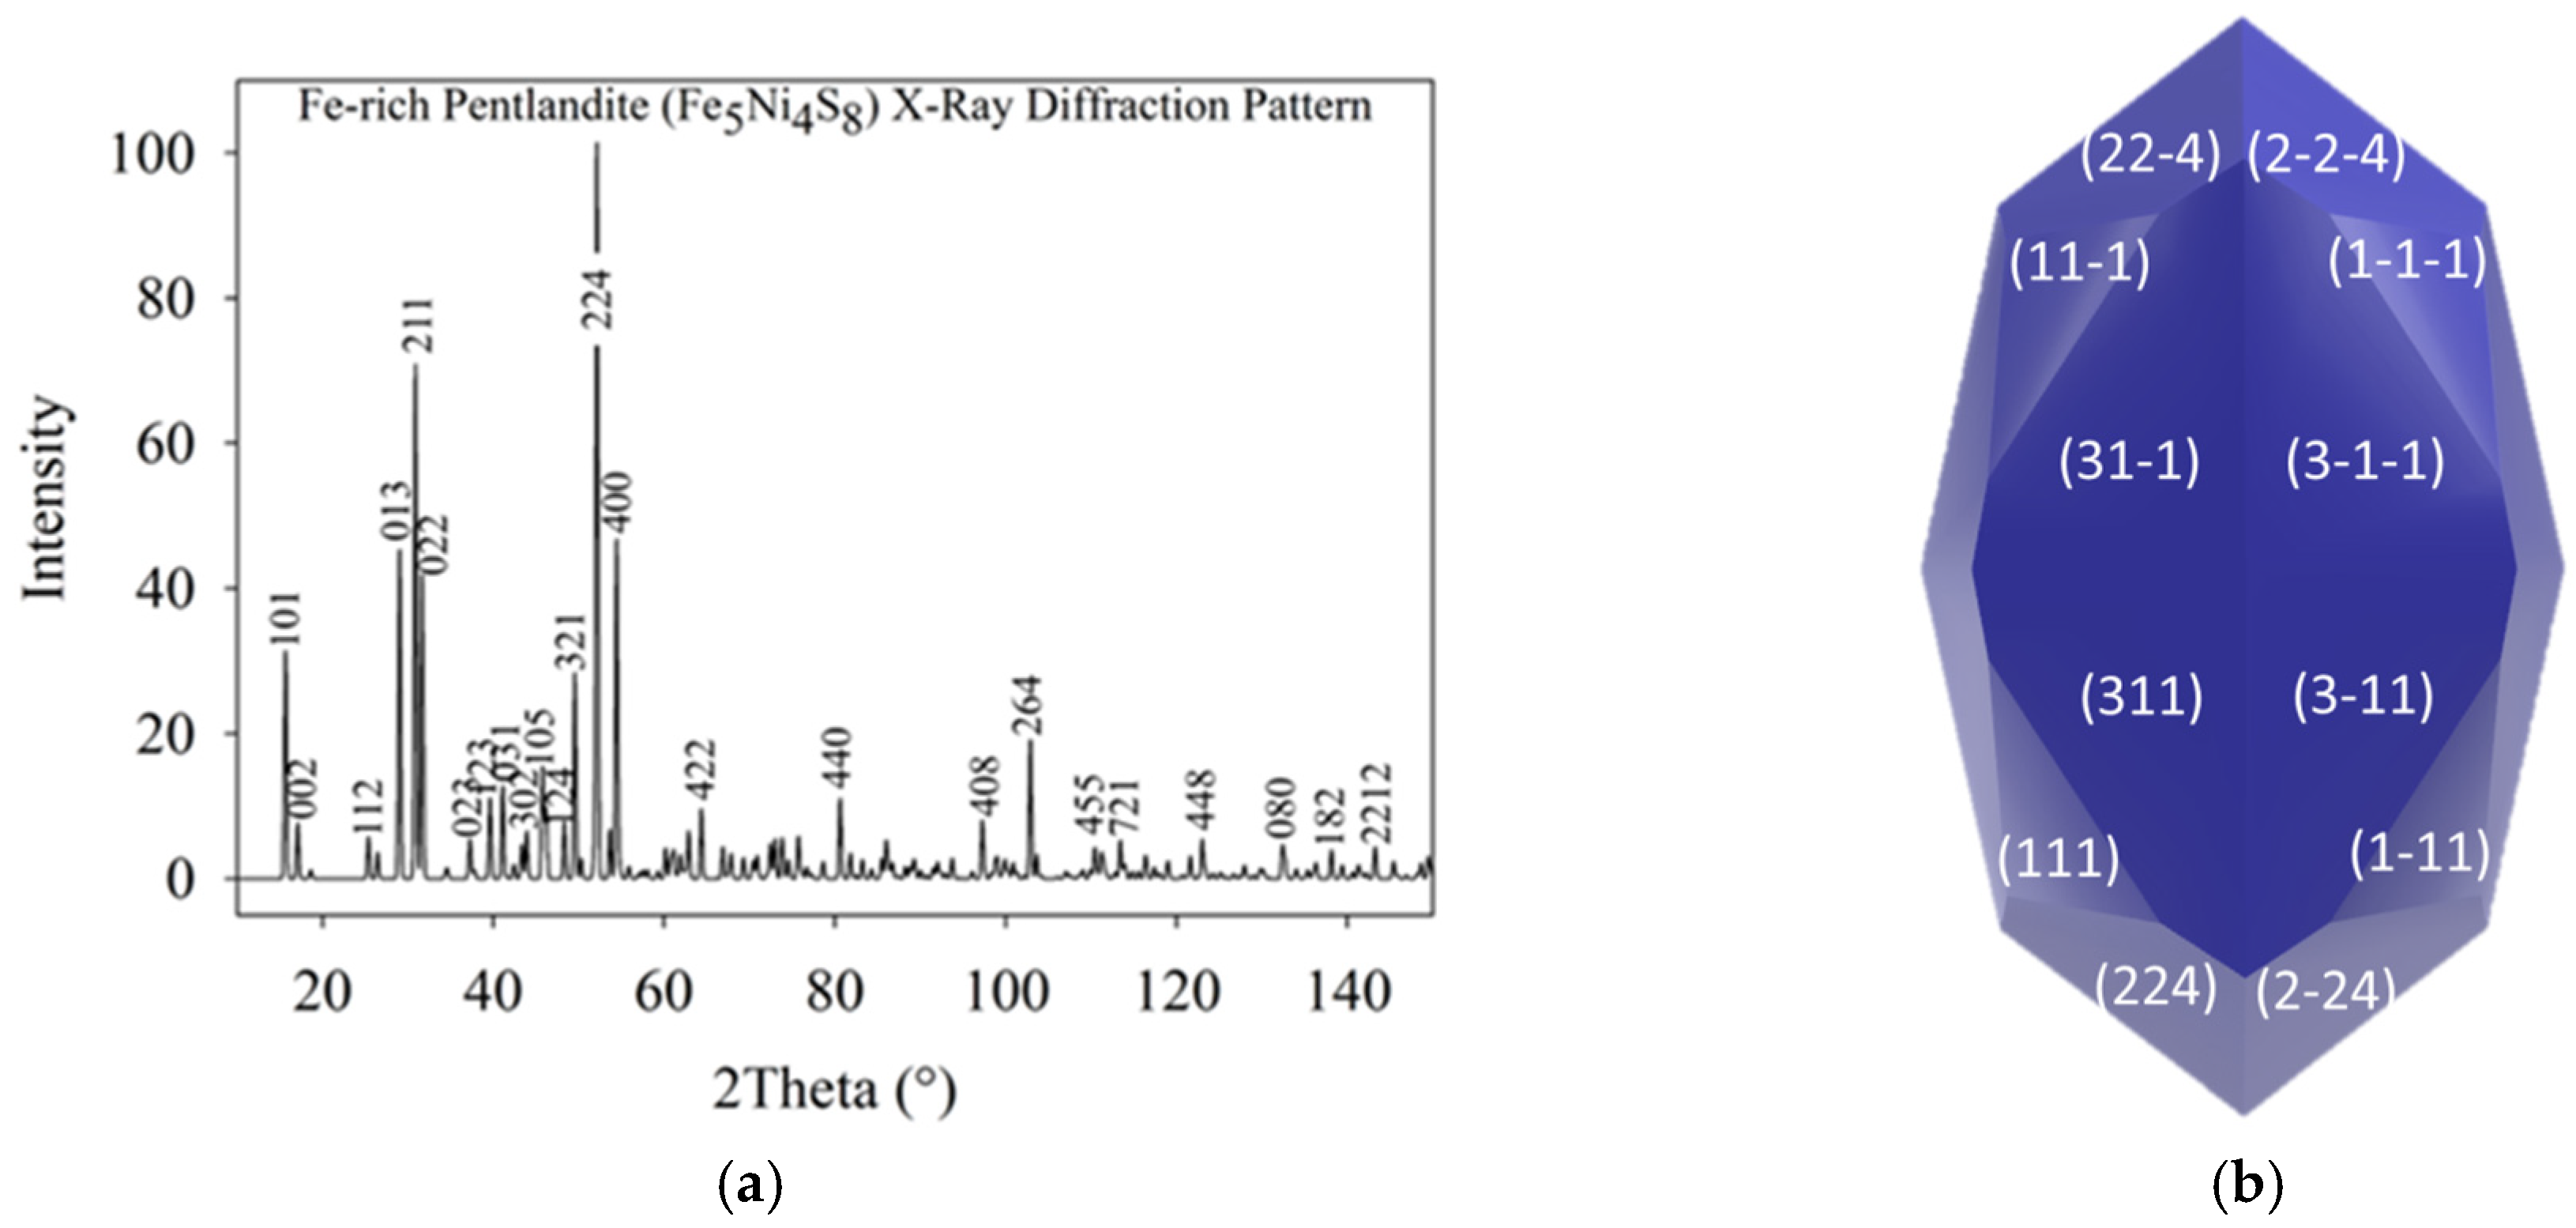
The Fe5Ni4S8 structure was analysed using computational X-ray diffraction (XRD) to determine its structural composition, as illustrated in Figure 2a. The XRD pattern was simulated using MedeA software, version 3.9 with copper as the radiation source, revealing that the (224) and (211) planes exhibited higher intensities. This computational XRD data was then compared to experimental XRD results of a similar compound [33]. Experimentally, the (111), (311), (511), and (440) planes of Fe5Ni4S8 were reported as having the highest peak intensities, with the (311) and (440) planes reaching 100% intensity [33].
Due to the tetragonal nature of the generated Fe5Ni4S8 structure, the computational XRD results displayed different plane indices compared to experimental findings. This information will be utilised in subsequent surface studies, where the plane surfaces (111), (311), (224), and (211) will be selected for further investigation to determine the most stable surface of the tetragonal Fe5Ni4S8. These surfaces were cleaved from the relaxed bulk structure, and to prevent the adsorbates from interacting with the upper repeating slab model, the vacuum elevation was set to 30.0 Å for all surface models. Their surface energies were calculated as 1.62 J.m−2 (plane surface of 111), 1.84 J.m−2 (plane surface of 211), 1.84 J.m−2 (plane surface of 224), and 1.48 J.m−2 (plane surface of 311). These were used to construct the surface crystal morphology as shown in Figure 2b, which clearly showed that the plane surface of (311) appears in a large plane on the morphology. The plane surface (211) energy ratio to the plane surface of (311) was ESurf-(211)/ESurf-(311) = 1.242 < 2 . Although the ratio is less than   2 , the plane surface of (211) was not expressed in the morphology due to competition with the plane surface of (311) (see Figure 2b).
It has been reported that the plane surface of (111) for (Fe,Ni)9S8 was the most stable [34]. However, in this study it has been demonstrated that the plane surface of (311) was found to be the most stable surface and dominant on the surface morphology since it had the lowest surface energy of 1.48 J.m−2, followed by the plane surface of (111) and then the plane surfaces of (211) and (224), as shown in Table 1. This was in good agreement with the reported experimental XRD [33], which showed that the plane surface of the (311) plane had the highest intensity; therefore, it was the most dominant surface.
As shown in Figure 3, the plane surface of (2 × 1) (311) displayed a drastic relaxation where the Fe and Ni atoms relaxed inwards, resulting in a sulphur-terminated surface. Table 2 shows the displacement of the metal atoms relaxation. Clearly the top Fe1, Fe2, Fe3, Ni1, and Ni2 atoms on the surface of the (311) plane relaxed inwards by −0.0410 Å, −0.0851 Å, −0.0535 Å, −0.0133 Å, and −0.0417 Å, respectively (Table 2). The S1 and S2 were noted to relax inward by −0.0448 and −0.0328, whereas S3 relaxed upward by 0.0049. It was observed that the Fe1 atoms relaxed and formed a new bond with the S atom within the surface, while the Fe2 atoms formed new bonds with three S atoms within the surface after relaxation. Furthermore, Ni2 atoms formed new bonds with four S atoms after relaxation. At the bottom of the surface, it was noted that there was also dramatic relaxation, where some atoms relaxed downwards and some inwards to the surface.

Density of States of Fe5Ni4S8 of the Plane Surface of (311)

The computed density of states (DOS) for the Fe5Ni4S8 plane surface of (311) is presented in Figure 4. The total density of states (TDOS) analysis indicated that the Fe5Ni4S8 plane surface of (311) exhibited metallic behaviour, as no band gap was observed at the Fermi level (EF). Additionally, the EF was positioned deep within the pseudo-gap, suggesting structural stability. A broad peak spanning from −8 eV in the VB to 2 eV in the conduction band (CB) was observed on the TDOS, which consisted of states from S, Ni, and Fe atoms.
The projected partial density of states (PDOS) revealed that the Fe atoms were the most active at EF, with dominant 3d-orbitals. The S atoms displayed minimal states at the EF, indicating low surface activity. The Ni atoms displayed a 3d-orbital broad sharp peak just below the EF. In the valence band (VB) region, contributions from the S atom s-orbital were observed between −15 eV and −11 eV. The S1 atom’s p-orbital contributed within the range of −8 eV to −3 eV, while the Ni1 atom’s 3d-orbital contributed between −3 eV and −1 eV. Additionally, the Fe atom’s 3d-orbitals were active from −1 eV to 2 eV.

3.2. Isolated Dithiocarbamate, Thionocarbamate, Mercaptobenzothiazole, and S-Triazine Molecular Geometries

The VASP (models) and DMol3 (HOMO and LUMO) optimised collector geometries are illustrated in Figure 5, while Table 3 presents the bonds and torsion parameters for their polar head groups. The selected bond lengths and bond angles for these functional groups contain polar sulphur atoms, which serve as the active sites for reactions.
The reactivity of these collectors before adsorption was characterised by their HOMO and LUMO energies. Figure 5 shows the isosurfaces for the HOMO and LUMO orbitals. It was observed that, for all collectors, the HOMO isosurface was concentrated on the sulphur (S) and nitrogen (N) atoms, indicating that electron donation would likely occur from these atoms. The LUMO isosurface was predominantly located on the sodium (Na), nitrogen (N), oxygen (O), and sulphur (S) atoms for all collectors, suggesting that these atoms can accept electrons. This implied that sulphur atoms have the ability to both donate and accept electrons. The high-density regions of the HOMO orbital can be associated with electrophilic attacks [35]. Previous research suggested that the donor and acceptor behaviour of these collectors on the mineral surface can be predicted by identifying the molecule with the highest HOMO energy and the lowest LUMO energy.
A higher HOMO energy level indicates strong ability to donate electrons, while a lower LUMO energy level indicates strong ability to accept electrons. According to this theory, the electron-donating ability (HOMO energies) decreased in the following order, SDTBAT > SMBT > ADEDTC > IPDETC, while the electron-accepting ability (LUMO energies) followed the order: SMBT > SDTBAT> ADEDTC > IPDETC. This pattern clearly showed that SDTBAT had greater capacity for donating electrons, while SMBT had the greater capacity for accepting electrons. The band gaps reflect the HOMO–LUMO gap which predicted the reactivity of the collector molecules. In this regard a molecule with a small gap would be more reactive compared to a molecule with a larger gap [36]. This was due to the easy mobility of electrons from the valence band to the conduction for a molecule with a small gap. Based on this, as shown in Table 3, SDTBAT had the smallest band gap (1.93 eV), suggesting strong reactivity, and the reactivity order decreased as follows: SDTBAT > ADEDTC > SMBT > IPDETC. Although the reactivity may be predicted from the H-L gap, adsorption of the collector molecules on the surface depends highly on the orientation and matching of the orbital for reactivity. As such, the predicted reactivity may differ from the surface adsorption energies. The calculated bond lengths and torsion angles for the ADEDTC, IPDETC, SMBT, and SDTBAT collectors are summarised in Table 4. It was observed that the double bond in ADEDTC, IPDETC, and SMBT was located at the S1 atom (C=S1). In the case of SDTBAT, the S1 and S2 atoms were single-bonded and carried a negative charge. A sodium ion (Na+) was included to neutralise this charge of the charged S atoms, in particular for SMBT and SDTBAT molecules. Among the collectors, the C=S1 bond length in IPDETC (1.658 Å) was the shortest, followed by ADEDTC (1.665 Å), indicating greater stability and lower reactivity.
In contrast, the C–S bond lengths in SDTBAT (1.725 Å and 1.723 Å) and SMBT (C–S2 = 1.770 Å) were longer, suggesting reduced stability and higher reactivity. The C–O and C–N bonds were approximately 1.35 Å in length. The torsion angles for ((S1–C=N1)–N) and ((S2–C–N1)=N) were nearly 120°, while ((S1–C–N)=S), ((N–C–O)=S1), and ((S1=C–S2)–N/=C) in ADEDTC were close to 115°. Similarly, the torsion angles for ((S1=C–N)–O) and ((S1=C–S2)–N/=C) in SMBT were around 125°.

3.3. Fe5Ni4S8 Plane Surface of (311) Collector Adsorptions

This section analyses the adsorption behaviour of ADEDTC, IPDETC, SMBT, and SDTBAT collectors on the pentlandite (Fe5Ni4S8) plane surface of (311). Note that the naming of the metal sites on the adsorbed surface figures was independent of the naming of the clean surface figures. It is important to note that the SMBT collector was adsorbed in both vertical and horizontal orientations, and the strongest orientation adsorption site was reported. The adsorption geometries, reactivity, and bonding modes of these collectors on the Fe5Ni4S8 plane surface of (311), both before and after relaxation, are illustrated in the Supporting Information, Section SI 1. The most exothermic of the various tested adsorption configurations of ADEDTC, IPDETC, SMBT, and SDTBAT on the Fe5Ni4S8 plane surface of (311) at Ni and Fe sites, after relaxation, are illustrated in Figure 6 and Figure 7. The theoretical Ni–S and Fe–S bond lengths, measured as 2.350 Å and 2.400 Å, respectively, were derived from the sum of the empirically determined covalent radii of Ni (1.350 Å), Fe (1.400 Å), and S (1.000 Å), as established by Slater [37]. These values were used as a reference for comparison with the bond lengths obtained from the adsorption analysis.
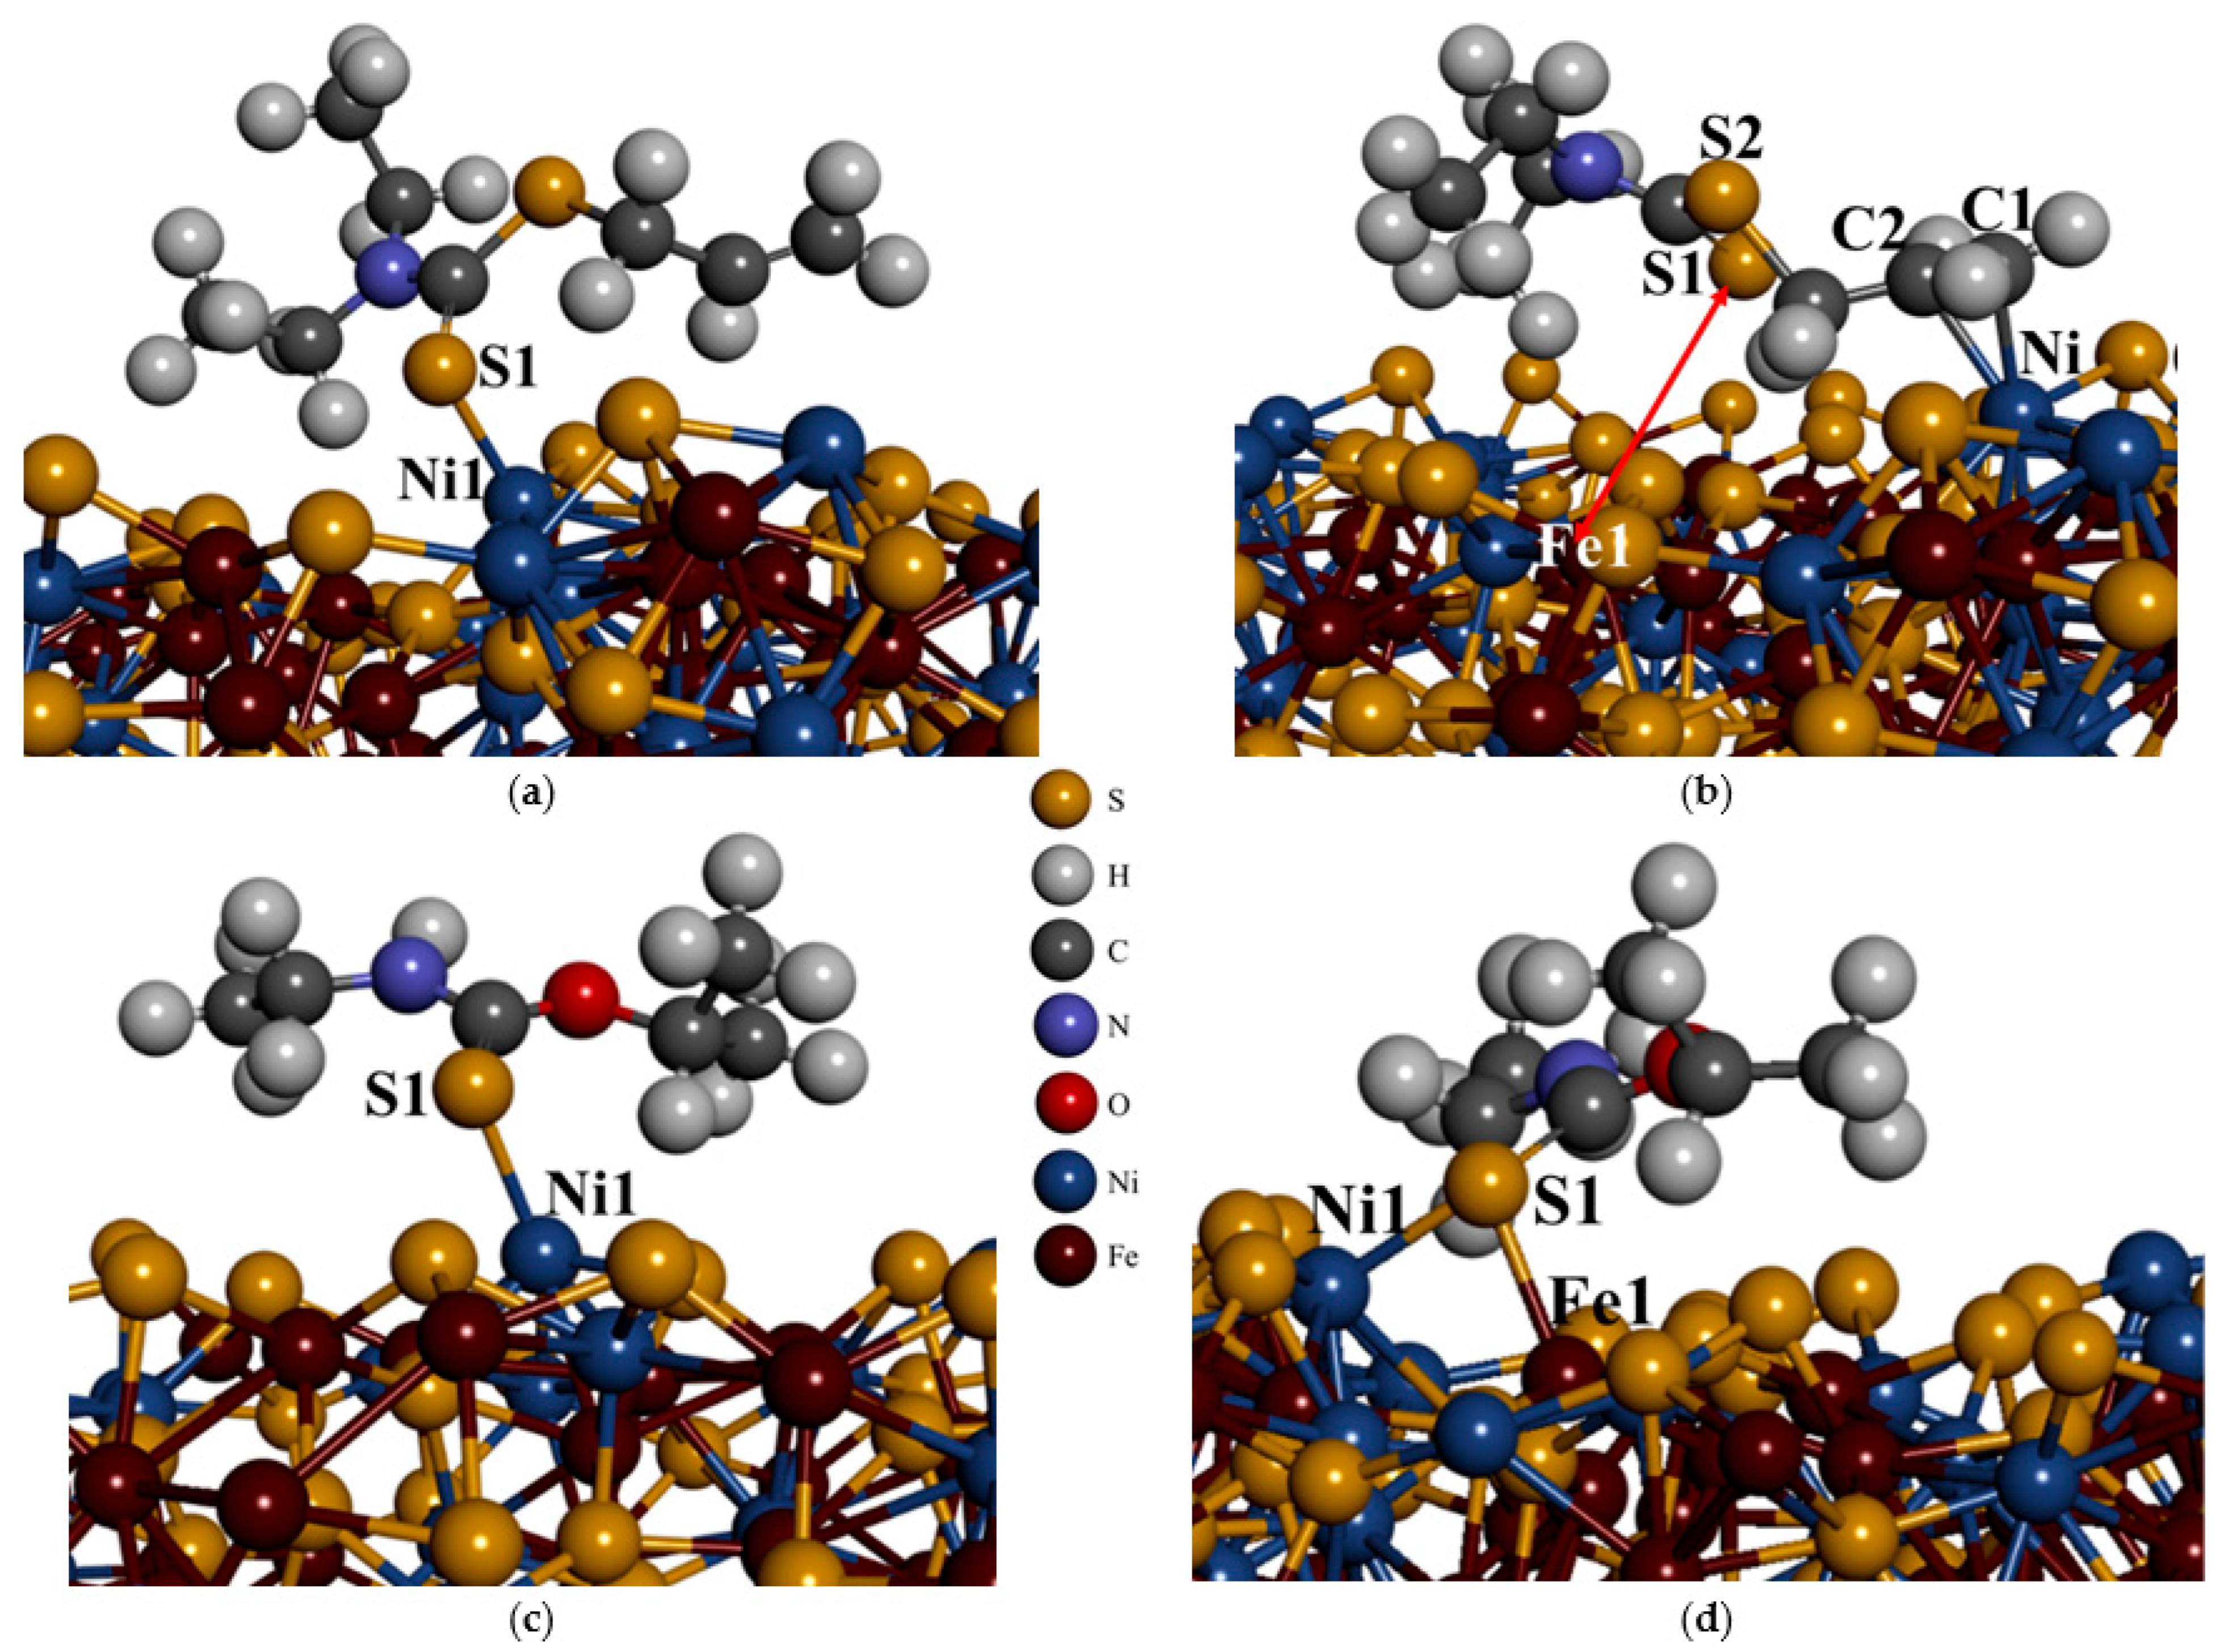
In Figure 6a,b, the most exothermic adsorption of the ADEDTC collector on both Ni and Fe sites is displayed. It was observed that for Ni site adsorption (see Figure 6a), a Ni1–S1 bond length of 2.250 Å was obtained. In the case of Fe site adsorption (Figure 6b), the ADEDTC S1 atom underwent desorption from the Fe1 atom as shown by the red arrow, resulting in an Fe1–S1 distance of 3.788 Å. Notably, the allyl chain interacted with the surface Ni atom, forming C2–Ni and C1–Ni bond lengths of 2.111 Å and 2.139 Å, respectively. In comparison with the empirically measured covalent radii (Ni–S = 2.350 Å) determined by Slater [37], the S1–Ni bond length of 2.250 Å was shorter, indicating a stronger bond. This shorter bond length suggested a strong interaction between the pentlandite mineral surface and ADEDTC collector. The adsorption and dispersion energies for the most exothermic adsorption models on Ni and Fe sites are presented in Table 5. The adsorption of ADEDTC on Ni sites resulted in adsorption and dispersion energies of Eads = −460.58 kJ.mol−1 and Edisp = −97.15 kJ.mol−1, whereas adsorption on Fe sites yielded Eads = −381.37 kJ.mol−1 and Edisp = −108.05 kJ.mol−1. The adsorption energy results clearly indicated that ADEDTC exhibited stronger exothermic adsorption on Ni sites than on Fe sites, suggesting a stronger interaction with Ni atoms on pentlandite mineral surface. This finding implies that ADEDTC collector, which has been found to be selective towards Cu on chalcopyrite [11], could be effectively used for the selective flotation of pentlandite minerals. A previous experimental study has also shown that allyl collectors such as NAOITC collector had great potential to enhance the recovery rate of pentlandite and nickel in industrial beneficiation [21]. This suggested that the ADEDTC collector’s strong adsorption predicts its potential application in the improvement of pentlandite recovery. Interestingly, the dispersion energies showed that adsorption on Fe sites were more exothermic than on Ni sites. This was attributed to the long-range interactions of the allyl-hydrocarbon chain and its bonding with the surface.
In the case of IPDETC adsorption, as shown in Figure 6c,d, the most exothermic adsorption on the Ni site for the IPDETC collector was the S1–Ni1 monodentate (see Figure 6c), which gave a bond length of 2.244 Å. The adsorption of the IPDETC collector on the Fe site, as shown in Figure 6d, resulted in mono-bridge bonding on the Fe and Ni atoms, forming bond lengths of Fe1–S1 = 2.355 Å and Ni1–S1 = 2.285 Å. Since the initial adsorption site was on Fe, the shift towards Ni to bridge indicated that the collector preferred to also bond with Ni atoms on the pentlandite surface. For both Ni and Fe site adsorption, IPDETC preferred to orientate at an angle on the surface. The IPDETC adsorption bond lengths on Ni and Fe sites were smaller than the sum of the empirically measured covalent radii (Fe–S = 2.400 Å and Ni–S = 2.350 Å) determined by Slater [37], which indicated a stronger bond. Clearly the bond length of Ni1–S1 = 2.285 Å was much stronger compared to Fe1–S1 = 2.355 Å and predicted that the IPDETC collector preferred the Ni site. These smaller bonds of the collector adsorption predicted the strong interaction of the pentlandite mineral with IPDETC collectors.
The obtained adsorption energies and dispersion energies for the most exothermic IPDETC adsorption on Ni and Fe sites are displayed in Table 5. The IPDETC adsorption on Ni sites gave adsorption and dispersion energies of Eads = −161.01 kJ.mol−1, including Edisp = −87.80 kJ.mol−1, while on Fe sites it gave Eads = −164.53 kJ.mol−1, including Edisp = −56.27 kJ.mol−1. The adsorption energies clearly showed that the IPDETC on the Fe site was more exothermic than on the Ni site, which was attributed to the bridging on the Fe and Ni atoms. This still indicated the preferential IPDETC collector interaction with Ni atoms on Fe5Ni4S8. This showed that the chalcopyrite collector, such as IPDETC [11], was predicted to be used for selective flotation of pentlandite minerals. This was also supported by the previous experimental study which showed that high cumulative nickel recoveries were obtained with IPETC and its mixtures with PAX and SIBX [19]. This suggested that the IPDETC collector with a diethyl chain is predicted to have potential ability to improve the recovery of pentlandite based on its strong adsorption on the pentlandite surface towards Ni sites. It was noted that the dispersion energies depicted that the Ni site adsorption was more exothermic than the Fe site adsorption. This was ascribed to the hydrocarbon chain’s long-range interaction with the surface, which also indicated the preferential adsorption on the Ni site.
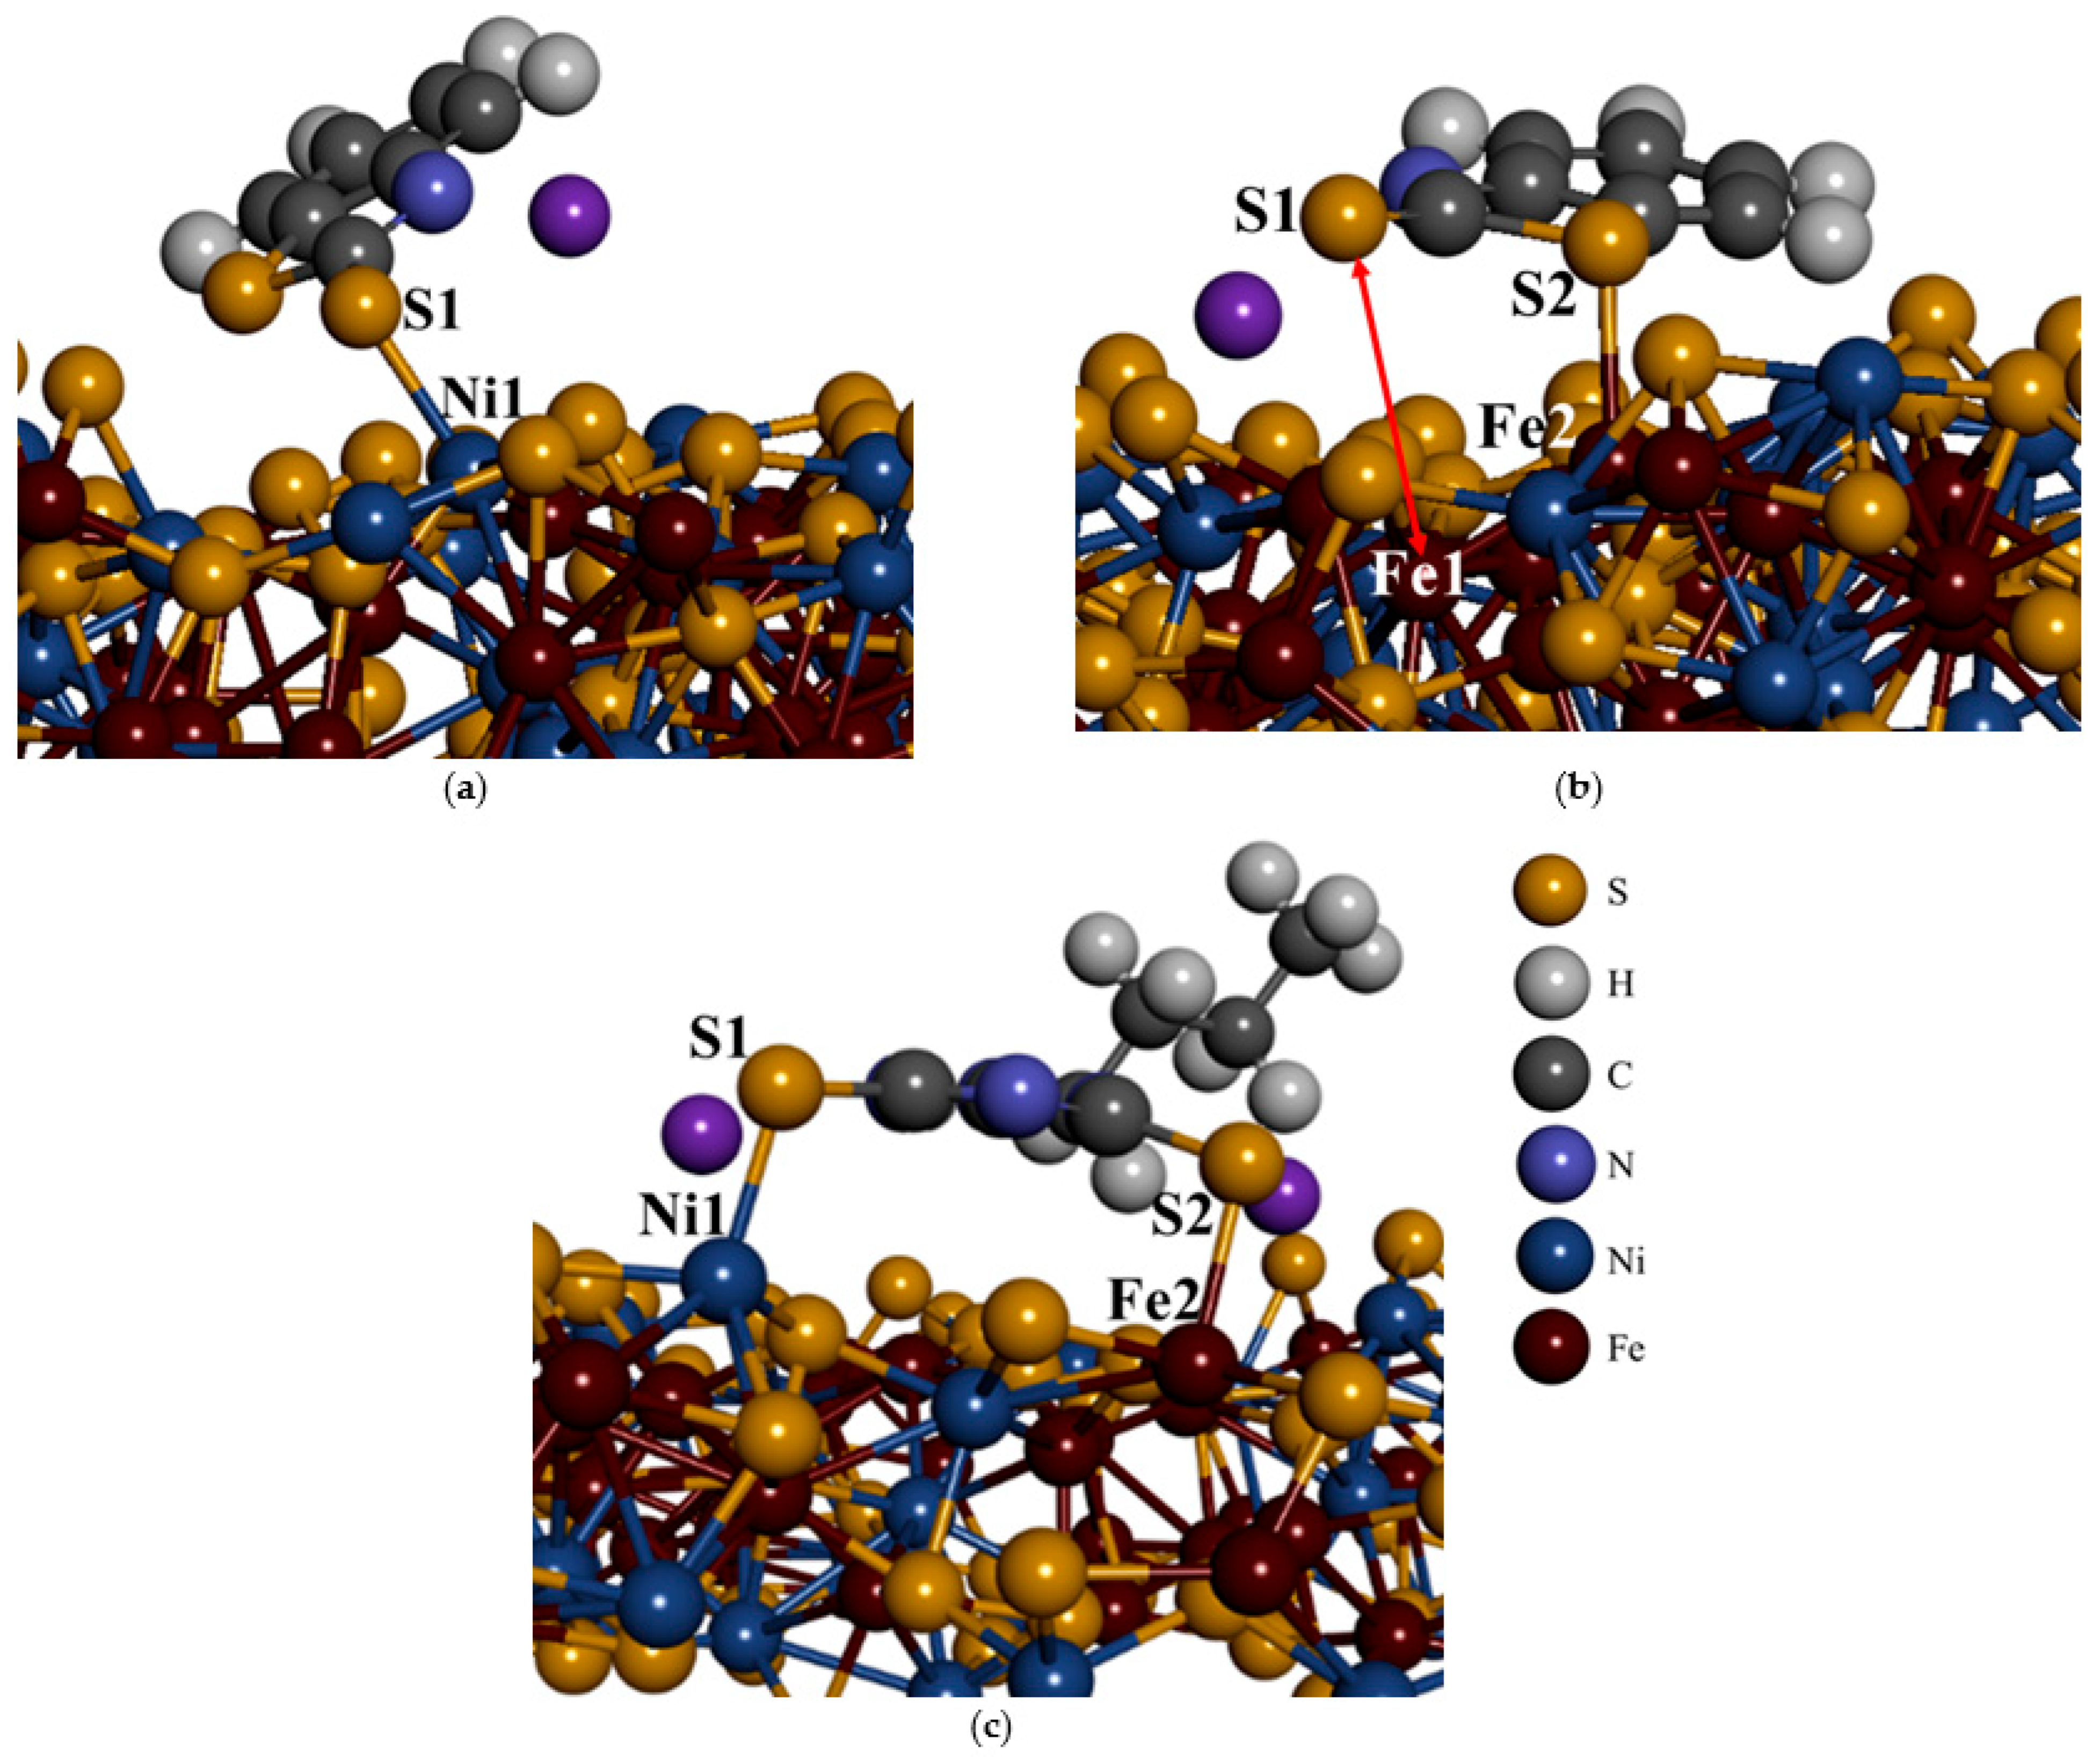
Figure 7a,b illustrates the most exothermic horizontal adsorption of SMBT on the Fe5Ni4S8 plane surface of (311). The less exothermic vertical adsorption is shown in the Supporting Information, Section SI 1. Among the configurations, the most exothermic adsorption occurred at the Ni site through a monodentate interaction between the S1 atom and Ni1 (Figure 7a), with a bond length of 2.339 Å. In contrast, when SMBT was adsorbed on the Fe site (see Figure 7b), the exocyclic S1 atom detached from the surface, resulting in an Fe1–S1 distance of 4.863 Å as reflected by the red arrow. However, the endocyclic S2 atom remained bonded, forming a monodentate bond (Fe2–S2 = 2.438 Å). In both Ni and Fe site adsorptions, SMBT adopted a flat orientation on the surface, ascribed to the horizontal orientation bonding. The bond formed with the Ni site was shorter than the empirical Ni–S covalent radius (2.350 Å), while the Fe–S bond was longer than the Fe–S covalent radius (2.400 Å), as reported by Slater [37]. This suggested a stronger interaction between SMBT and Ni atoms and a weaker interaction with Fe atoms. The shorter bond at the Ni site further indicated a more favourable interaction with the Fe5Ni4S8 surface through Ni sites.
Table 5 presents the calculated adsorption and dispersion energies for the most exothermic horizontal configurations of SMBT on Ni and Fe sites. The SMBT adsorption on the Ni site yielded an adsorption energy of Eads = −424.08 kJ.mol−1, including a dispersion component of Edisp = −109.29 kJ.mol−1. In comparison, with the Fe site, adsorption of SMBT gave lower energies: Eads = −306.99 kJ.mol−1 and Edisp = −104.69 kJ.mol−1. These results confirm that SMBT adsorption was more energetically favourable on Ni than on Fe sites, indicating a preferential Ni adsorption on pentlandite. Additionally, the greater dispersion energy at the Ni site was attributed to enhanced long-range interactions between SMBT hydrocarbon chain and the surface. Similar flat preferential adsorption of the SMBT was observed on the pyrite surface [13].
Figure 7c shows that SDTBAT adsorption onto the Fe5Ni4S8 plane surface of (311) was through bridging on both Ni and Fe atoms. The molecule adopted a flat orientation with its hydrocarbon chain positioned vertically relative to the surface. The adsorption occurred in a bidentate manner, forming bond lengths of Ni1–S1 = 2.261 Å and Fe1–S2 = 2.380 Å. These bond lengths were shorter than the empirical covalent radii for Ni–S (2.350 Å) and Fe–S (2.400 Å), as reported by Slater [37], indicating a strong interaction between SDTBAT and the Fe and Ni atoms. Notably, the Ni–S1 bond was significantly shorter, suggesting a stronger bond on the Ni site. This shorter bond also implied a strong interaction between SDTBAT and the pentlandite mineral surface. The adsorption and dispersion energies for SDTBAT on Ni and Fe sites are summarised in Table 5. The adsorption on Ni yielded adsorption energy of Eads = −352.48 kJ.mol−1, including a dispersion energy of Edisp = −183.85 kJ.mol−1. Among all tested collectors, SDTBAT showed the most negative dispersion energy, attributed to its flat adsorption orientation and the strong long-range interaction between the triazine group and hydrocarbon chain with the mineral surface. This emphasised the importance of including dispersion corrections when evaluating collector adsorption.
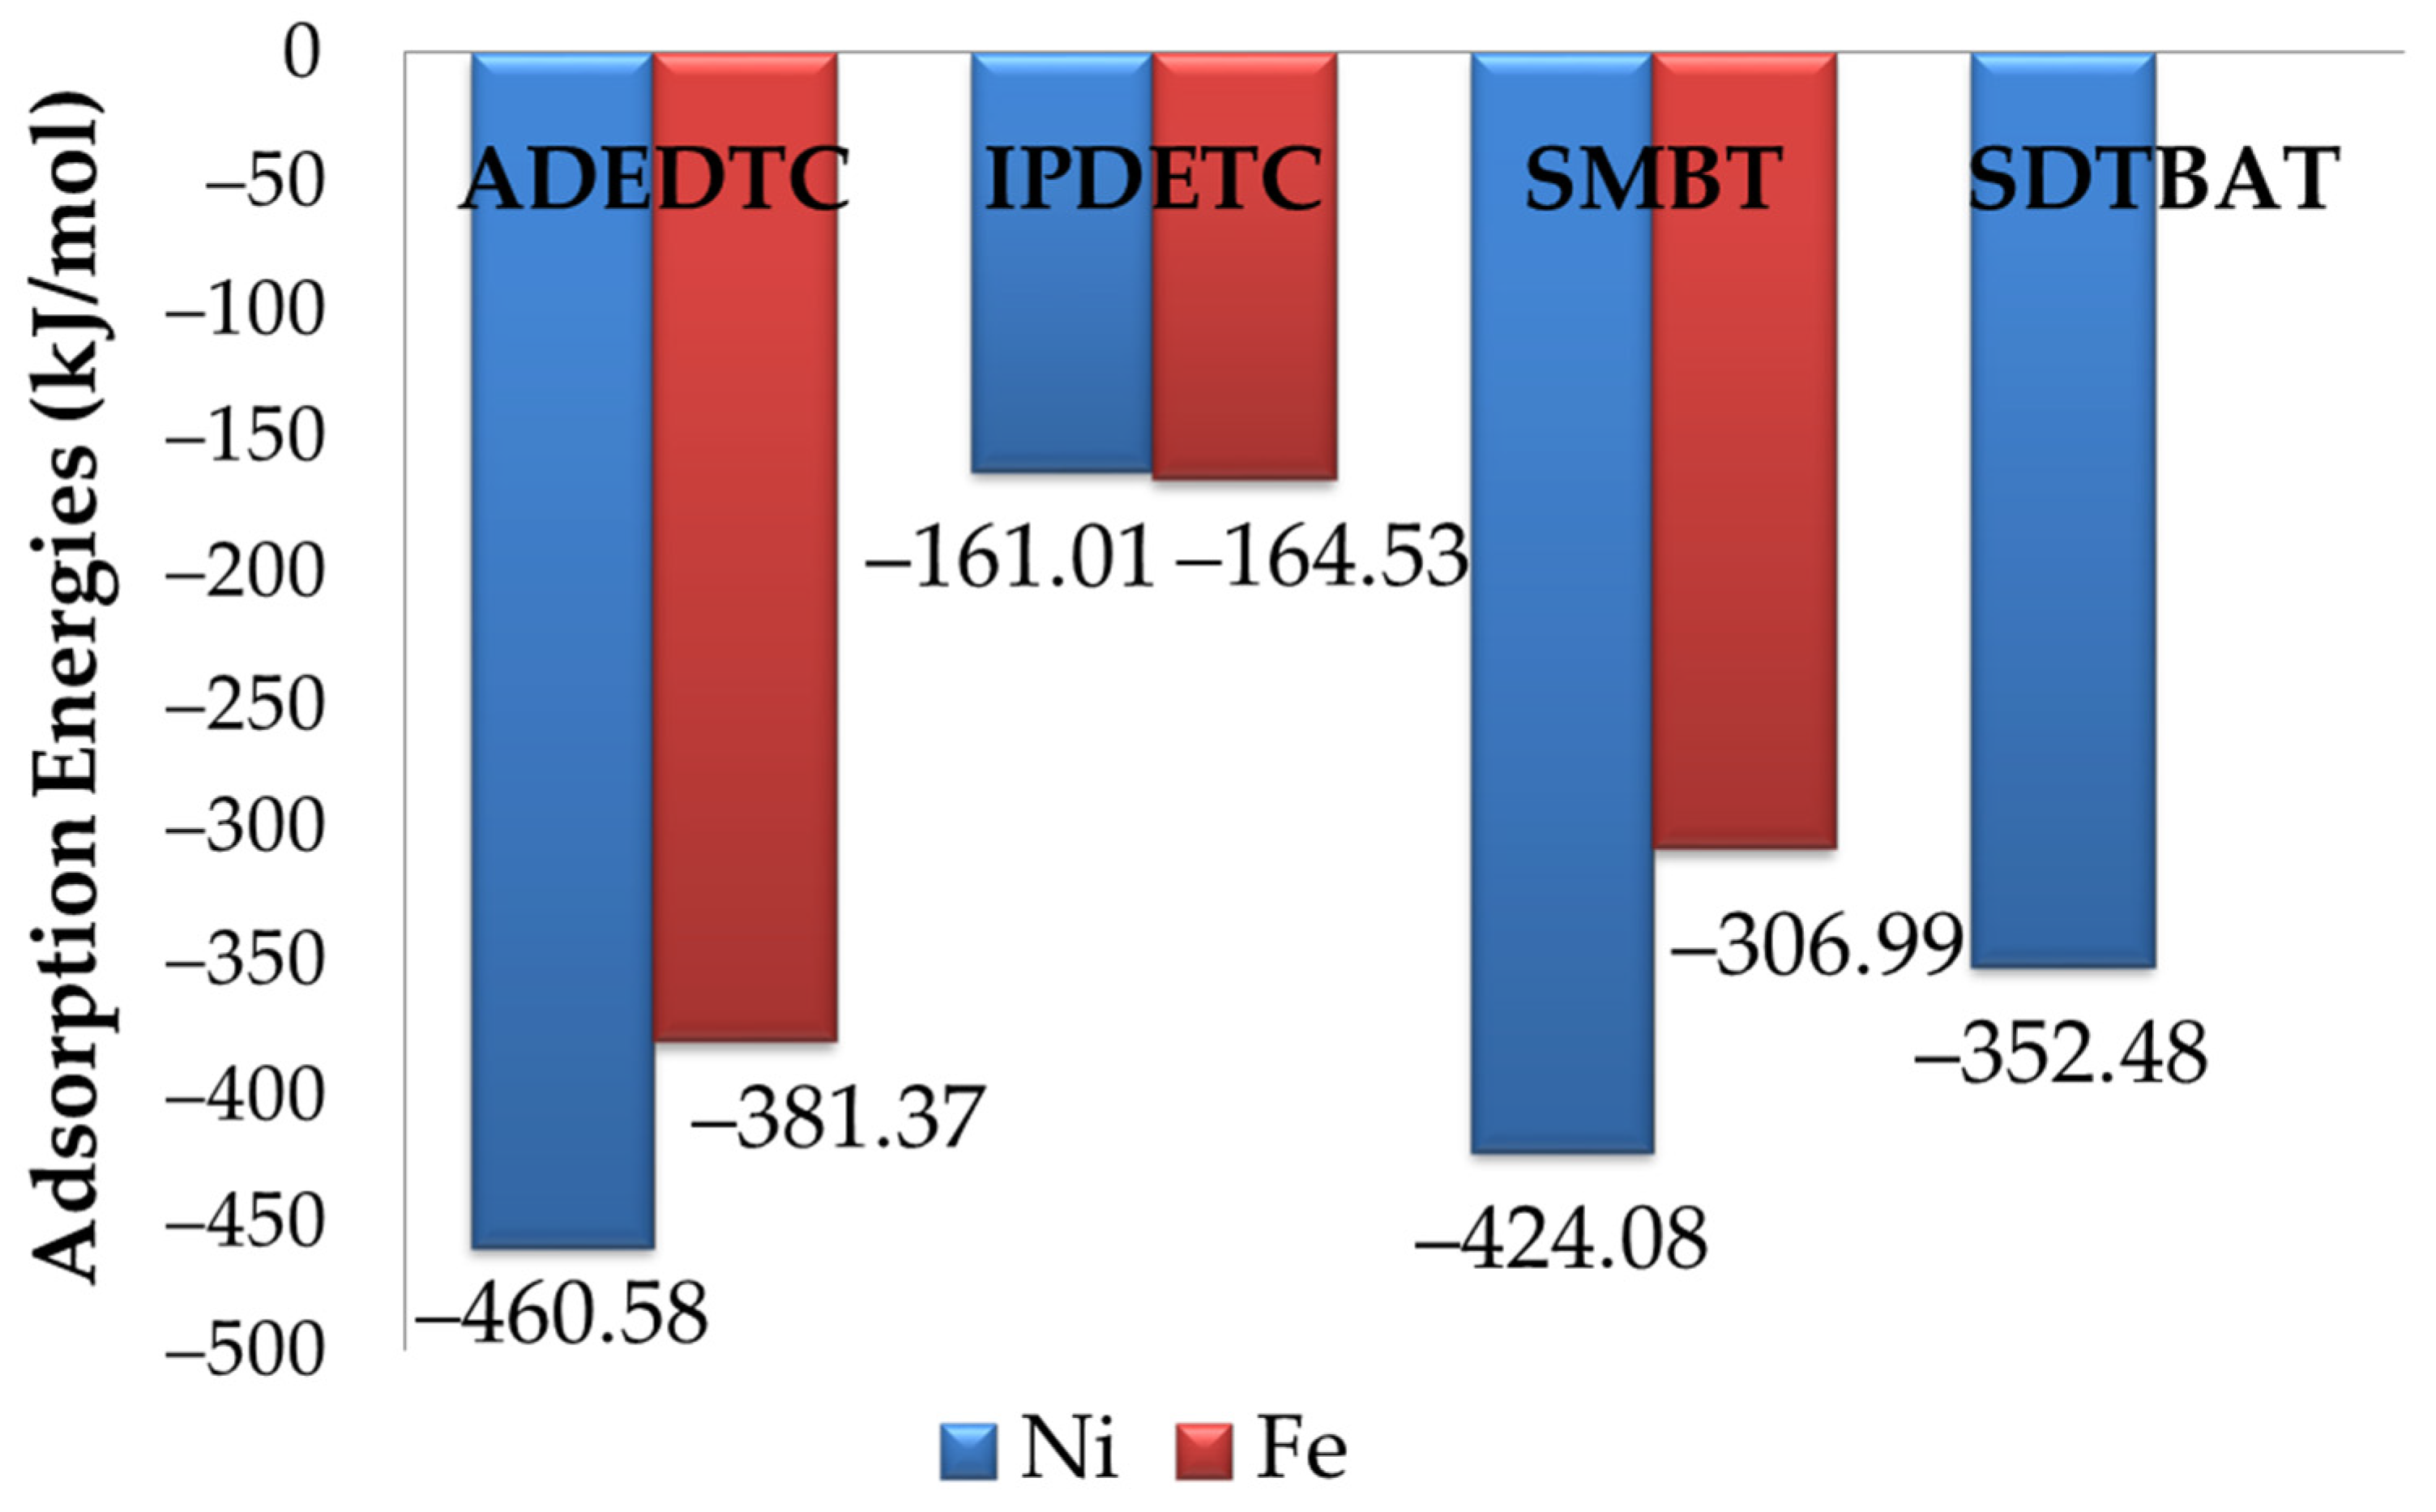
When comparing all collector adsorptions (see Figure 13), it was evident that all collectors showed a preference for Ni over Fe sites on the Fe5Ni4S8 plane surface of (311). The order of adsorption strength, based on adsorption energy was as follows: ADEDTC (−460.58 kJ.mol−1) > SMBT (−424.08 kJ.mol−1) > SDTBAT (−352.48 kJ.mol−1) > IPDETC (−164.53 kJ.mol−1). ADEDTC exhibited the most exothermic adsorption energy, clearly highlighting its strong affinity for Ni atoms and its high selectivity for pentlandite (see Figure 13). These predicted their potential as highly selective collectors for the separation of pentlandite from other sulphide minerals. The dispersion energies in descending order were as follows: SDTBAT > SMBT > ADEDTC > IPDETC. Similar trends have been observed in previous studies, where ADEDTC and IPDETC displayed a preference for Cu atoms during the separation of chalcopyrite from pyrite [11].

3.4. Electronic Properties of the Adsorbed Plane Surface of (311)

The projected density of states (PDOS) for the adsorption of ADEDTC, IPDETC, SMBT, and SDTBAT collectors on the Fe5Ni4S8 plane surface of (311) was analysed to assess changes in chemical reactivity before and after adsorption on Ni and Fe atoms. Variations in the PDOS of the collectors’ sulphur atoms and the surface Ni and Fe atoms were attributed to the hybridisation between sulphur 3p-orbitals and metal 3d-orbitals.
Figure 8 illustrates the PDOS for ADEDTC adsorption on Ni and Fe atoms. In Figure 8a, the Ni site interaction is shown, which depicts that after adsorption, the Ni 3d-orbital profile just below the Fermi level (EF) changed significantly, where a sharp peak split into two peaks, indicating orbital hybridisation with the S1 3p-orbitals. Although the sharpest peak remained unchanged, a new peak formed on the right of the sharp peak, suggesting electron transfer from S1 to Ni1. The S1 3p-orbital peaks just below EF decreased in intensity (from above 1.0 to below 0.5 electrons/eV), confirming electron donation to Ni1 3d-orbitals and indicating that ADEDTC binds to Ni via distinctive covalent bonding.
Figure 9b shows the PDOS for ADEDTC adsorbed on Fe atoms. It was noted that the Fe 3d-orbitals exhibited changes at EF, with a previously split peak below EF merging into a broader splitting peak. A rise in the peak above EF indicated electron loss, and the peak below EF decreased in intensity (from just below 2.0 to slightly above 1.5 electrons/eV), demonstrating electron depletion from Fe1 3d-orbitals. Meanwhile, the S1 3p-orbitals showed a merged peak pattern with minor changes as the S1 atom desorbed from the Fe atom. Overall, the changes suggested that Fe1 atoms transferred electrons to neighbouring surface sulphur atoms following the adsorption behaviour of desorption of the collector.
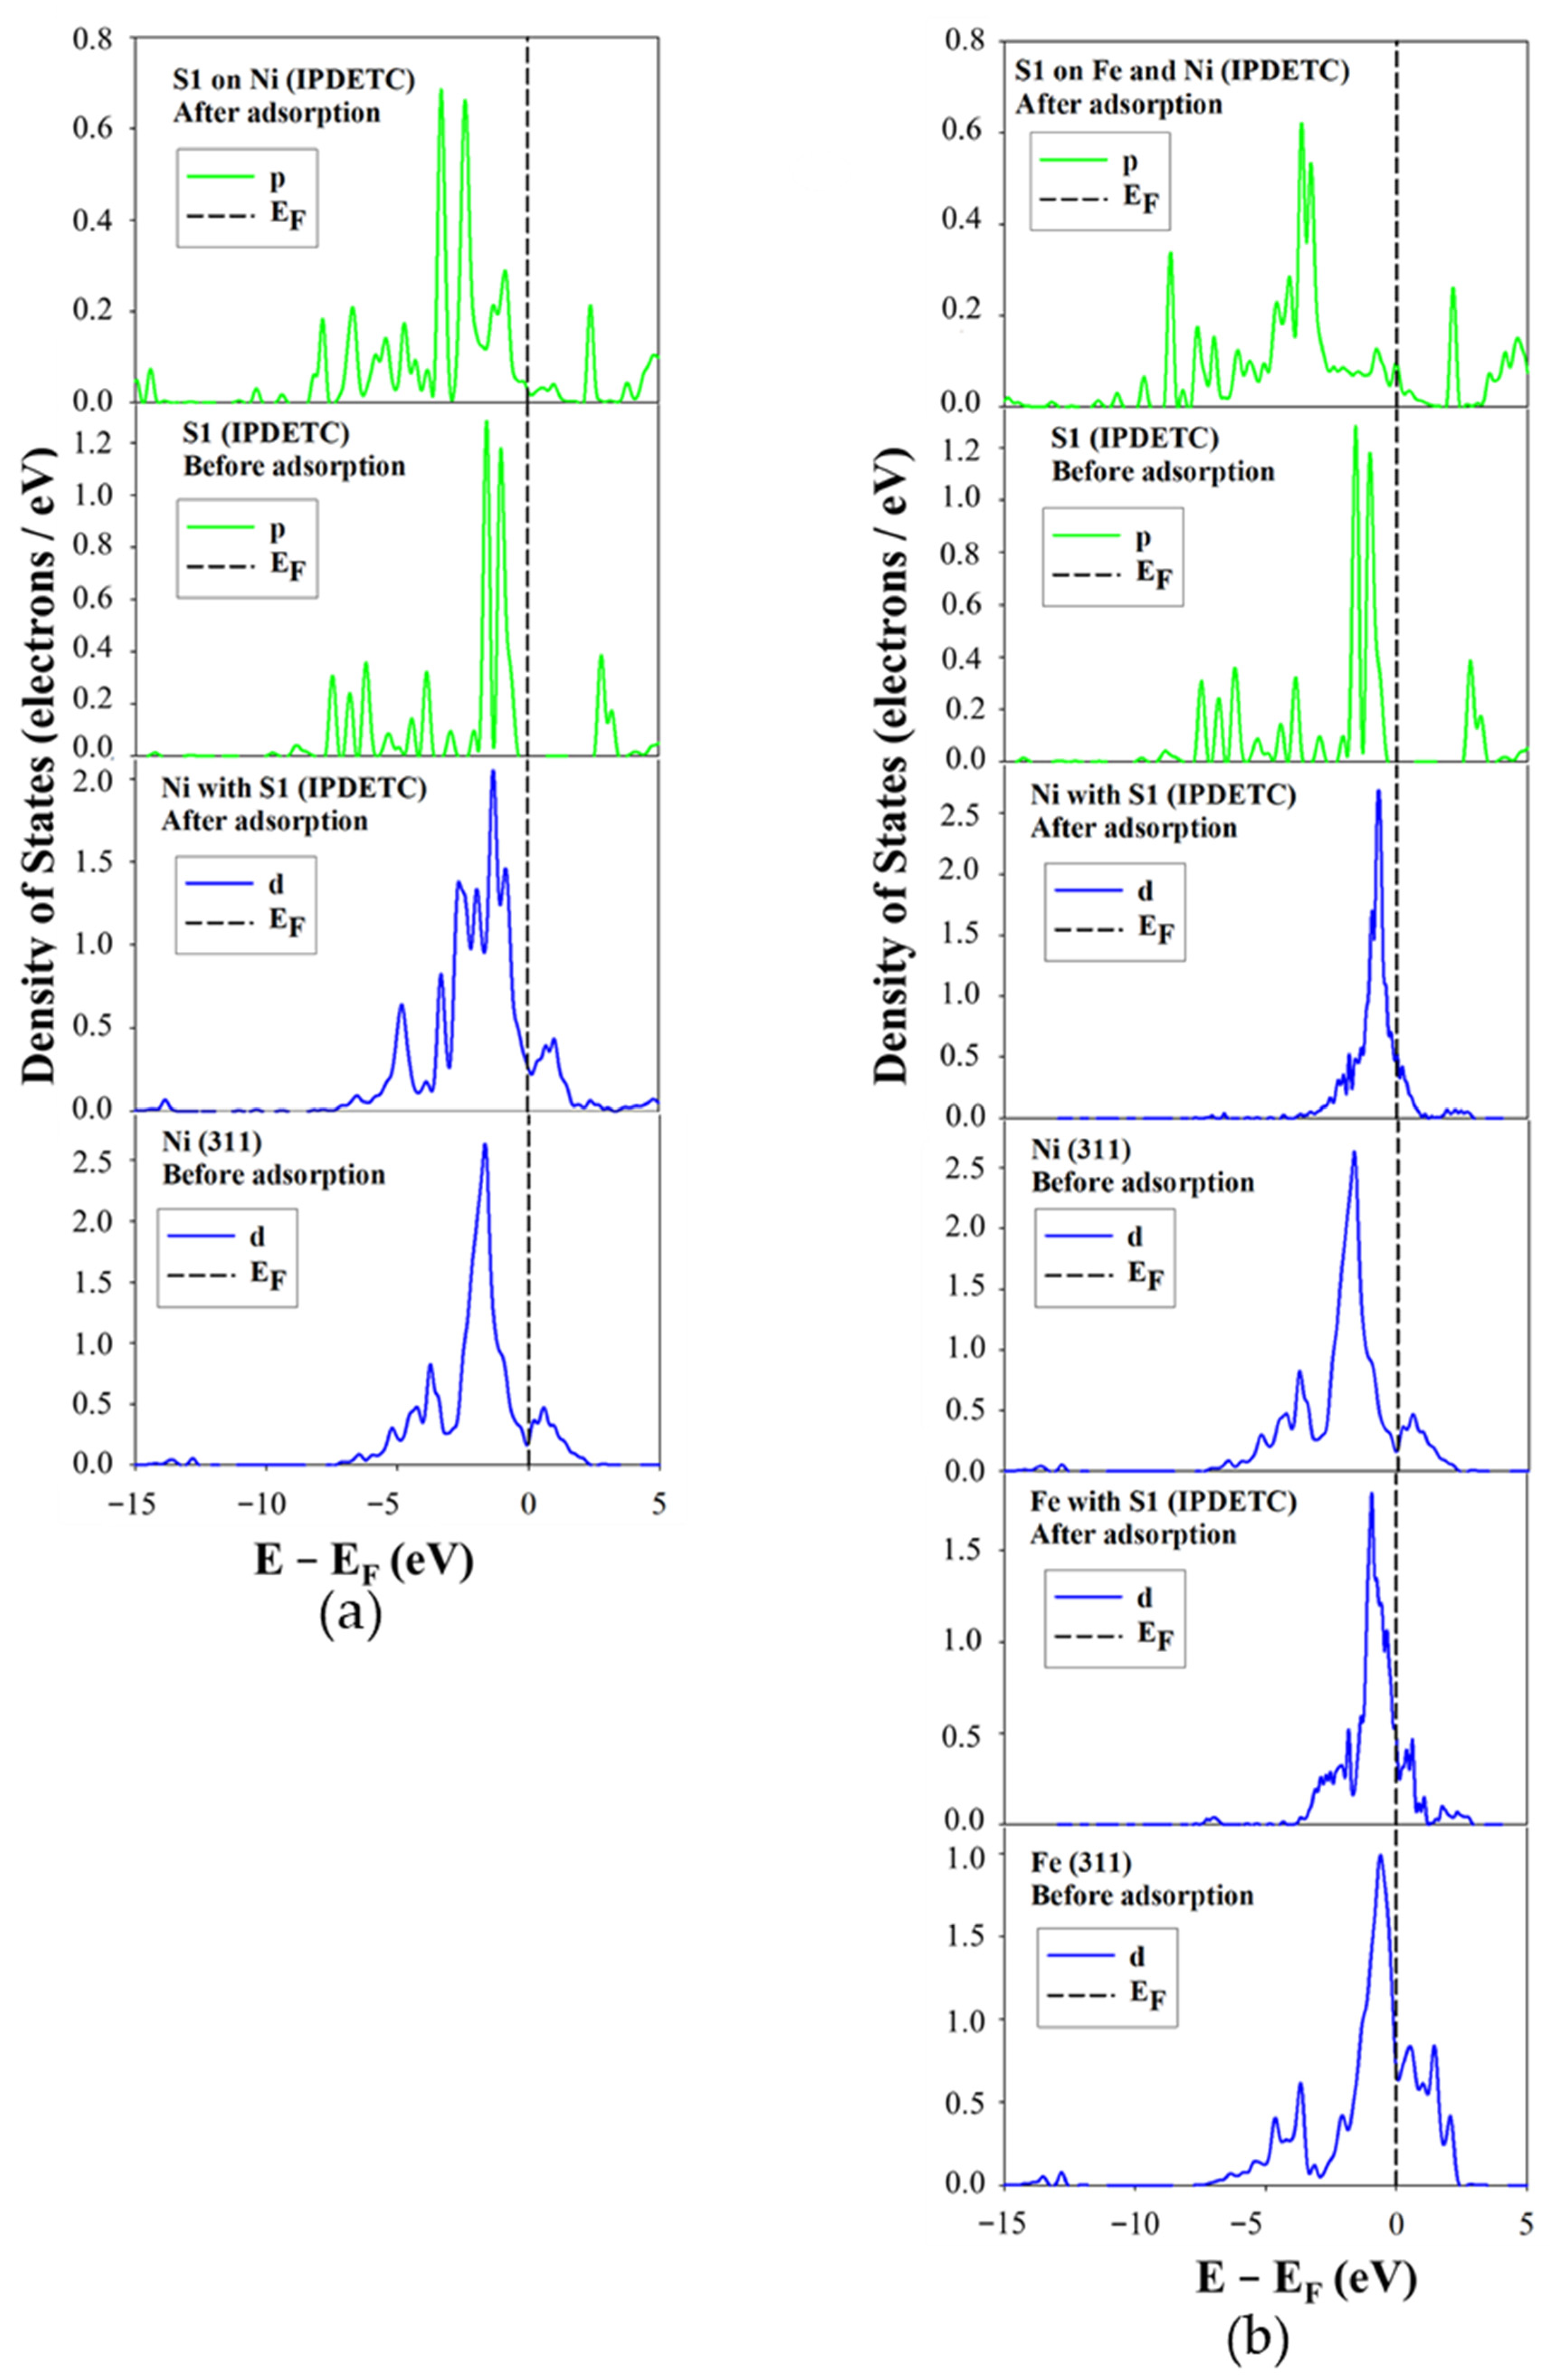
The PDOS for IPDETC adsorption is shown in Figure 9. In Figure 9a, the Ni site adsorption was examined, which indicated that after adsorption, the Ni 3d-orbitals showed a peak split into four component peaks just below EF. This was caused by interaction with S1 3p-orbitals, accompanied by a general reduction in state density. The S1 3p-orbital peaks also decreased evidently (from above 1.0 to below 0.5 electrons/eV), indicating electron transfer to the Ni atoms, again suggesting covalent bonding. Figure 9b illustrates the PDOS for IPDETC on Fe atoms. The Fe 3d-orbitals featured a sharper peak just below EF with minor side splitting. The peak above EF shifted closer to EF and decreased in intensity, suggesting electron gain by the Fe1 atom. The Ni1 atom 3d-orbital sharp peak was observed to move closer to the EF, suggesting hybridisation with the S1 3p-orbitals. At the same time, the S1 3p-orbital peaks just below EF nearly vanished, indicating electron loss. These changes imply that the Fe1 atom accepted electrons from the S1 atom of the collector, confirming a covalent interaction.
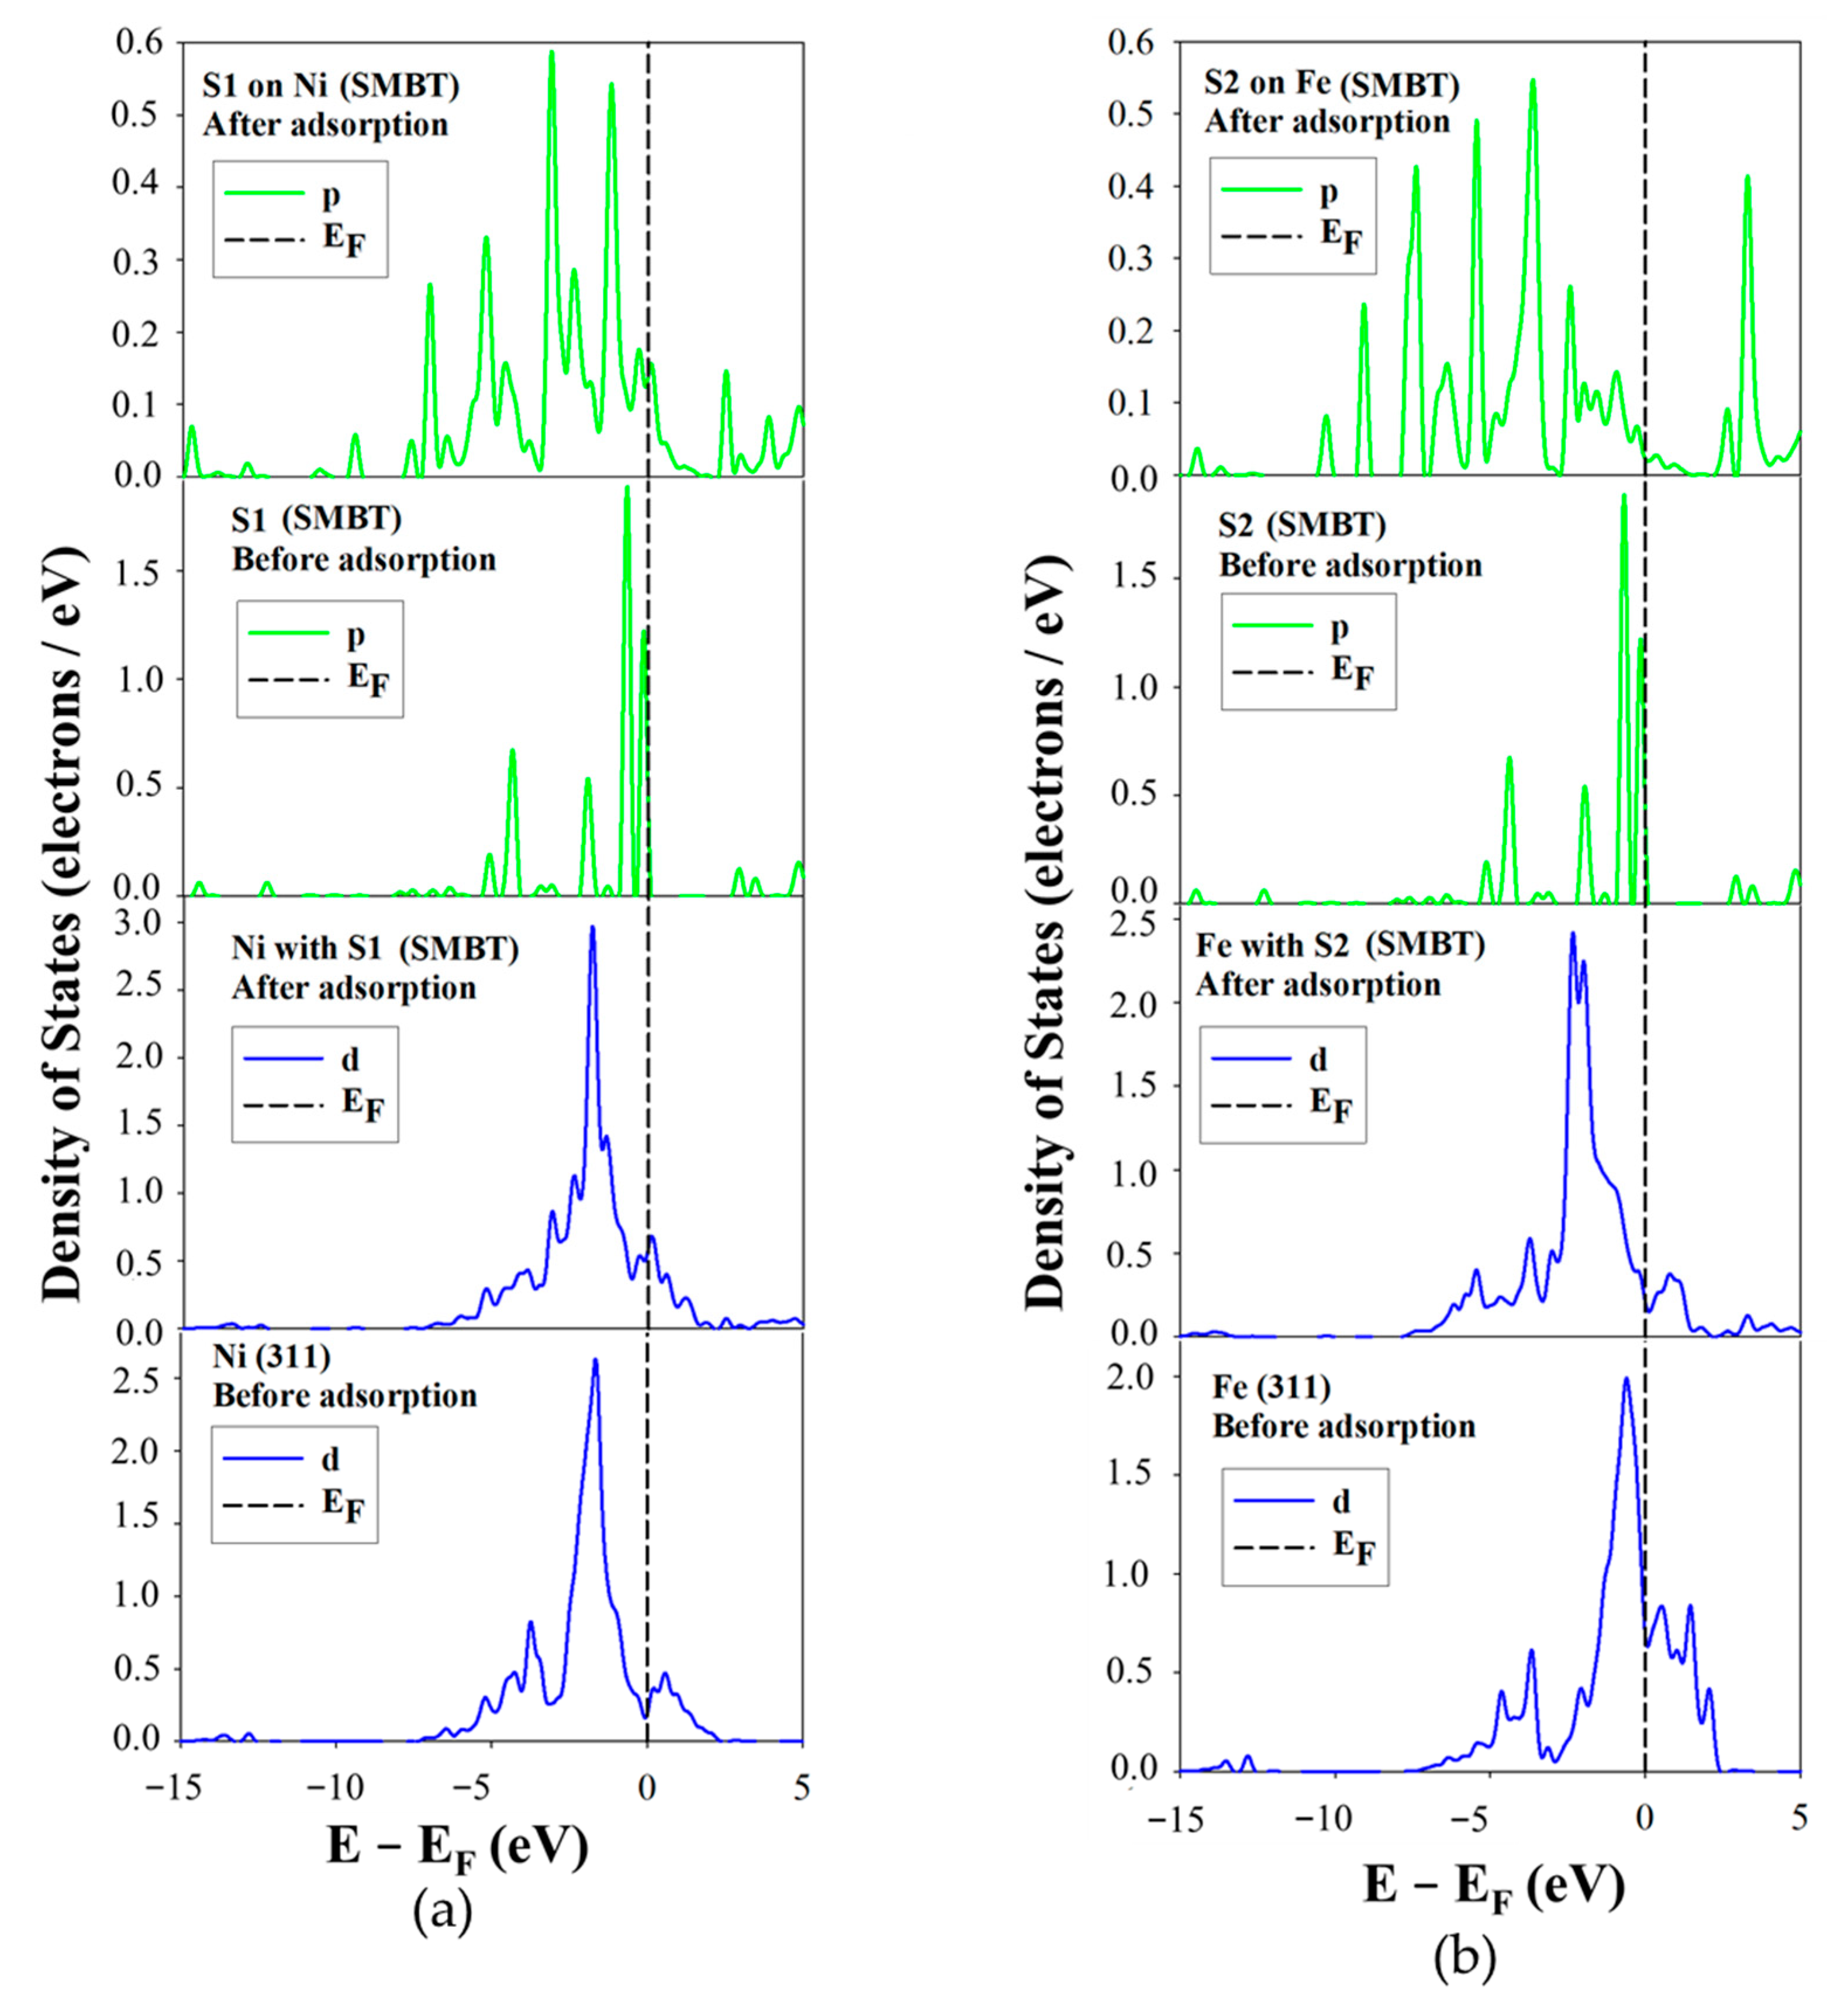
The projected density of states (PDOS) for horizontal adsorption of the SMBT collector on Ni and Fe atoms of the Fe5Ni4S8 plane surface of (311) is shown in Figure 10. It was observed that the PDOS for SMBT adsorption on the Ni site exhibited a minor splitting of the 3d-orbital peaks just below the Fermi level (EF), which led to an increase in the density of states (see Figure 10a). Notably, at the EF, the conduction band (CB) peak shifted toward the valence band (VB), with a smaller peak fully moving into the VB, suggesting electron transfer from the sulphur atoms to the Ni1 atoms. Moreover, a small peak emerged at the EF, suggesting movement of the peaks toward the VB. Additionally, the two highest peaks of the S1 3p-orbital just below EF significantly decreased in intensity after adsorption. It was noted that some states near the EF shifted toward the CB. This behaviour indicated electron donation from S1 to the Ni1 atom, pointing to covalent bonding between SMBT and the Ni1 atom.
In Figure 10b, the PDOS for horizontal adsorption of SMBT on Fe atoms is presented. The Fe1 3d-orbitals showed a reduction in state density just below EF (dropping from about 2.0 to slightly over 1.0 electrons/eV). Meanwhile, the peak just above EF increased, implying electron transfer from Fe1 to the sulphur atom. The S2 3p-orbitals also showed significant changes, with the two main peaks below EF decreasing in intensity and splitting into several smaller peaks. In addition, the conduction band peaks shifted closer to EF and showed a slight increase in state density at EF. These changes suggested that the S2 atom accepted electrons from Fe1 atom, forming a back-donation covalent bond.
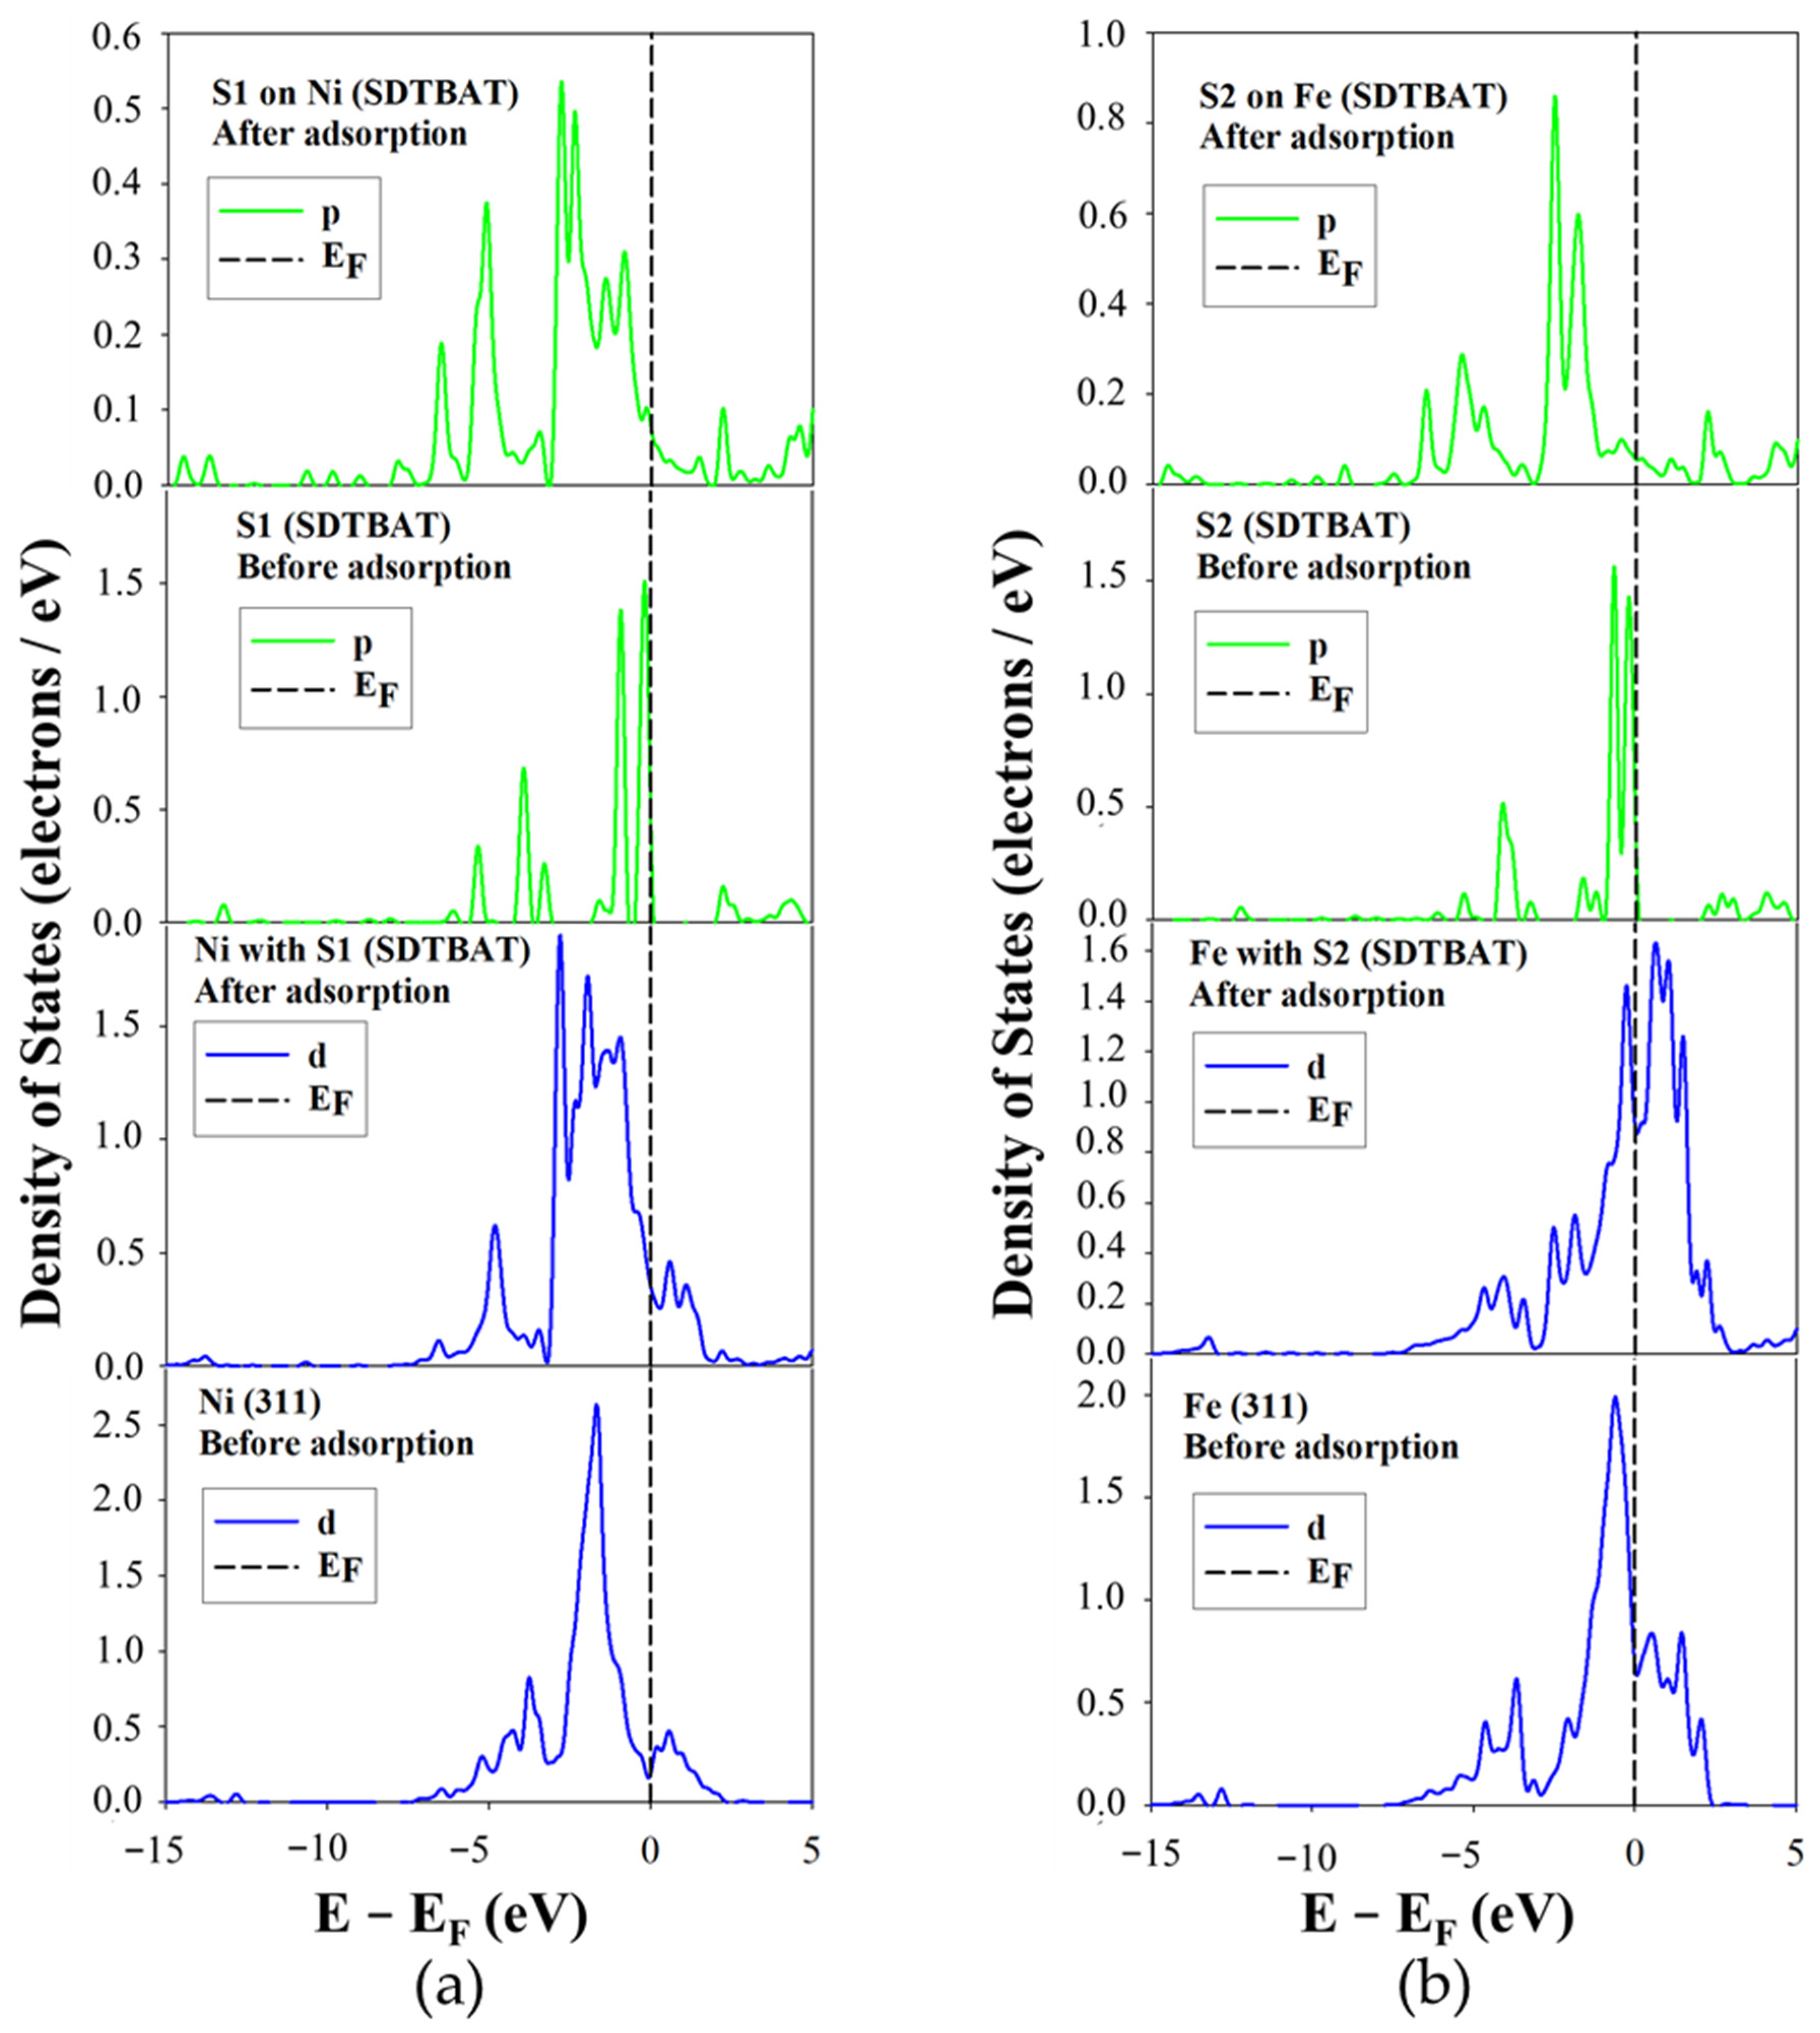
The projected density of states (PDOS) for SDTBAT collector adsorption on Ni and Fe atoms of the Fe5Ni4S8 pentlandite (311) surface is illustrated in Figure 11. Clearly the PDOS corresponding to SDTBAT adsorption on the Ni site also exhibited a broad 3d-orbital splitting peak just below the EF, resulting in a reduction in the density of states. Additionally, at EF, the states shifted toward the conduction band (CB), indicating that Ni atoms lost electrons to the sulphur atoms.
Meanwhile, the two highest peaks of the S1 3p-orbital just below EF significantly decreased in intensity, while some new states appeared at EF, suggesting that the S1 atom gained electrons from Ni atoms. This pattern indicated that SDTBAT binds to Ni atoms through a back-donation covalent mechanism. Figure 11b presents the PDOS for SDTBAT adsorption on Fe atoms. After adsorption, the sharp Fe 3d-orbital peak just below EF decreased in intensity, dropping from approximately 2.0 to below 1.5 electrons/eV. Notably, the peak just above EF increased significantly, surpassing the peak at the conduction band. This implied an electron transfer from Fe1 to the sulphur atoms. The S1 3p-orbital peaks just below EF also decreased considerably and shifted toward lower energy levels, with a noticeable increase in states at the EF. This indicated that the S1 atom accepted electrons from the Fe 3d-orbitals, confirming the formation of a back-donation covalent bond.
The charge density differences were computed to complement the density of states and clearly depicted which atoms gained or lost charges, as shown in Figure 12. It was noted that both metals (Ni and/or Fe) and the S atoms had cyan cloud colour above and beneath the atom, with purple cloud colour around the atom. The purple colour was also observed on the bond between the metal and S atoms. These indicated that the electrons were largely localised on the bond, suggesting a covalent bond formation.

4. Conclusions

This study investigated the interactions of four flotation collectors, i.e., ADEDTC, IPDETC, SMBT, and SDTBAT, with the tetragonal iron-rich pentlandite (Fe5Ni4S8) (311) surface. The simulations employed the quantum mechanical density functional theory (DFT) with Grimme’s dispersion correction method, implemented via the VASP code. The optimised bulk structure had lattice parameters of a = b = 7.020 Å, c = 9.930 Å, and angles α = β = γ = 90°, consistent with the P42/nmc space group. Several low-index surfaces, (100), (110), (111), (224), and (311), were cleaved and optimised with non-polar terminations. Among these, the (311) surface had the lowest surface energy (1.48 J.m−2), making it the most stable. The crystal morphology also depicted the dominance of the (311) surface. The total density of states (TDOS) of the (311) surface depicted a metallic behaviour since there was no band gap at the EF. Furthermore, the DOS showed characteristics of the EF aligning deep into the pseudo-gap, suggesting enhanced stability.
Prior to adsorptions, the frontier molecular orbital was analysed and revealed that SDTBAT had the highest electron-donating potential (HOMO), while SMBT exhibited the greatest electron-accepting potential (LUMO). Adsorption studies evaluated how each collector interacts with the Fe and Ni atoms on the pentlandite (311) surface, with implications for predicting their selective flotation of pentlandite. Adsorption energy calculations showed that all collectors preferred bonding with the Ni atoms rather than Fe atoms. The adsorption strength followed the order ADEDTC > SMBT > SDTBAT > IPDETC, identifying ADEDTC as the strongest adsorption and was predicted as the potential collector for pentlandite flotation (see Figure 13). Dispersion energy rankings were as follows: SDTBAT > SMBT > ADEDTC > IPDETC. This highlighted that SDTBAT had the strongest dispersion energy, which was endorsed to the role of hydrocarbon chain and the s-triazine group interactions with the surface. SMBT showed weak vertical bonding to the surface, with a stronger horizontal interaction, in particular towards the Ni atoms.
Projected density of states (PDOS) analyses supported these findings. The ADEDTC formed covalent bonds with Ni atoms, drawing electrons from S atoms, while adsorption on Fe sites led to electron loss on the Fe atom. The IPDETC interacted with both Fe and Ni; the Ni lost electrons, while Fe gained electrons; consequently, the S atoms showed electron donation to the metal surface. The SDTBAT adsorption on Ni and Fe atoms resulted in significant electron transfer to S atoms, forming strong back-donation covalent bonds.
In summary, all collectors showed a clear preferential bonding with Ni over Fe atoms. ADEDTC exhibited the strongest adsorption energy (−460.58 kJ.mol−l), making it the best predicted collector for selective flotation of pentlandite. IPDETC also demonstrated potential good performance and as such, together with ADEDTC, is predicted and recommended for use as effective selective flotation reagents for separation of pentlandite from gangue minerals.

Supplementary Materials

The following supporting information can be downloaded at: https://www.mdpi.com/article/10.3390/min15111222/s1; Table S1: Calculated adsorption energies for ADEDTC, IPDETC, SMBT, and SDTBAT on Fe5Ni4S8 surface; Figures S1–S4: The un-relaxed and relaxed ADEDTC collector adsorption on the Fe5Ni4S8 (311) surface; Figures S5–S8: The un-relaxed and relaxed IPDETC collector adsorption on the Fe5Ni4S8 (311) surface; Figures S9–S12: The un-relaxed and relaxed SMBT collector adsorption vertically on the Fe5Ni4S8 (311) surface; Figures S13–S16: The un-relaxed and relaxed SMBT collector adsorption horizontally on the Fe5Ni4S8 (311) surface; Figure S17: The un-relaxed and relaxed SDTBAT collector adsorption on the Fe5Ni4S8 (311) surface; Figures S18 and S19: The un-relaxed and relaxed STDBAT collector adsorption on the Fe5Ni4S8 (311) surface.

Author Contributions

Conceptualisation, P.P.M.; methodology, P.P.M.; software, P.E.N.; validation, N.N.Z., P.E.N. and P.P.M.; formal analysis, N.N.Z., P.E.N. and P.P.M.; investigation, N.N.Z.; resources, P.E.N.; data curation, N.N.Z.; writing—original draft preparation, N.N.Z.; supervision, P.E.N. and P.P.M.; project administration, P.P.M.; funding acquisition, P.P.M. All authors have read and agreed to the published version of the manuscript.

Funding

This research was funded by the Department of Science Technology and Innovation (DSTI) and National Research Foundation (NRF) through the Thuthuka grant (Grant No: 138259) of South Africa.

Data Availability Statement

The data presented in this study are available on request from the corresponding author. The data are not publicly available due to privacy restrictions.

Acknowledgments

The computational work was performed at the Materials Modelling Centre under the Minerals Cluster and also benefited from supercomputing resources at the Centre for High Performance Computing (CHPC) in Cape Town; their support is appreciated.

Conflicts of Interest

The authors declare no conflicts of interest. The funders had no role in the design of the study; in the collection, analyses, or interpretation of data; in the writing of the manuscript; or in the decision to publish the results.

References

  1. Cabri, L.J. Platinum-Group Elements: Mineralogy Geology and Recovery; Canadian Institute of Mining & Metallurgy: Montreal, QC, Canada, 1981; Volume 23, pp. 199–217. [Google Scholar]
  2. Haldar, S.K. Introduction. In Platinum-Nickel-Chromium Deposits; Elsevier: Amsterdam, The Netherlands, 2017; pp. 1–35. [Google Scholar]
  3. Haldar, S.K. (Ed.) Mineral Processing. In Mineral Exploration, 2nd ed.; Elsevier: Amsterdam, The Netherlands, 2018; pp. 259–290. [Google Scholar]
  4. Mishra, B. Cobalt and Nickel Production. In Encyclopedia of Materials: Science and Technology; Jürgen Buschow, K.H., Cahn, R.W., Flemings, M.C., Ilschner, B., Kramer, E.J., Mahajan, S., Veyssière, P., Eds.; Elsevier: Oxford, UK, 2001; pp. 1288–1294. [Google Scholar]
  5. Barnes, S.J.; Taranovic, V.; Schoneveld, L.E.; Mansur, E.T.; Le Vaillant, M.; Dare, S.; Staude, S.; Evans, N.J.; Blanks, D. The Occurrence and Origin of Pentlandite-Chalcopyrite-Pyrrhotite Loop Textures in Magmatic Ni-Cu Sulfide Ores. Econ. Geol. 2020, 115, 1777–1798. [Google Scholar]
  6. Junge, M.; Wirth, R.; Oberthür, T.; Melcher, F.; Schreiber, A. Mineralogical siting of platinum-group elements in pentlandite from the Bushveld Complex, South Africa. Miner. Depos. 2015, 50, 41–54. [Google Scholar] [CrossRef]
  7. Makanza, A.T.; Vermaak, M.K.G.; Davidtz, J.C. The flotation of auriferous pyrite with a mixture of collectors. Int. J. Miner. Process. 2008, 86, 85–93. [Google Scholar] [CrossRef]
  8. Amarantidis, J.; Skinner, W.M.; Prestidge, C.A.; La Vanier, L.; Grano, S. Surface analytical studies of oxidation and collector adsorption in sulfide mineral flotation. Scanning Microsc. Int. 1998, 12, 553–583. [Google Scholar]
  9. Inoue, T. Mineral Comminution and Separation Systems; University of Tokyo: Tokyo, Japan, 2009; Volume 2, pp. 1–8. [Google Scholar]
  10. Marape, G. Fundamental Electrochemical Behaviour of Pentlandite. Master’s Thesis, University of Pretoria, Pretoria, South Africa, 2010. [Google Scholar]
  11. Mkhonto, P.P.; Zhang, X.; Lu, L.; Xiong, W.; Zhu, Y.; Han, L.; Ngoepe, P.E. Adsorption mechanisms and effects of thiocarbamate collectors in the separation of chalcopyrite from pyrite minerals: DFT and experimental studies. Miner. Eng. 2022, 176, 107318. [Google Scholar] [CrossRef]
  12. Zhang, X.; Zhu, Y.; Mkhonto, P.P.; Meng, Y.; McFadzean, B.; Ngoepe, P.E.; O’Connor, C. The Flotation Separation of Chalcopyrite and Galena: Crystal, Surface, Floatability and Reagents. Sep. Purif. Rev. 2025, 54, 289–309. [Google Scholar] [CrossRef]
  13. Pawliszak, P.; Bradshaw-Hajek, B.H.; Skinner, W.; Beattie, D.A.; Krasowska, M. Frothers in flotation: A review of performance and function in the context of chemical classification. Miner. Eng. 2024, 207, 108567. [Google Scholar] [CrossRef]
  14. Manono, M.S.; Matibidi, K.; Otunniyi, I.O.; Thubakgale, C.K.; Corin, K.C.; Wiese, J.G. The Behaviour of Mixtures of Sodium Iso-Butyl Xanthate and Sodium Di-Ethyl Dithiophosphate during the Flotation of a Cu-Ni-Pt Ore in Degrading Water Quality. Minerals 2020, 10, 123. [Google Scholar] [CrossRef]
  15. Mkhonto, P.P.; Zhang, X.; McFadzean, B.; Taguta, J.; Zhu, Y.; Han, L.; Ngoepe, P.E. Incorporating pH into DFT-D+U and microflotation recovery studies on heterocyclic collector-pyrite interactions. Sep. Purif. Technol. 2024, 337, 126430. [Google Scholar] [CrossRef]
  16. Mkhonto, P.P.; Zhang, X.; Lu, L.; Xiong, W.; Zhu, Y.; Han, L.; Ngoepe, P.E. Design, synthesis and investigating the interaction of novel s-triazine collector with pyrite surface: A DFT-D3+U and experimental studies. Surf. Interfaces 2023, 38, 102820. [Google Scholar]
  17. Manyama, T.S.; Mkhonto, P.P.; Zhang, X.; Zhu, Y.; Ngoepe, P.E. A DFT-D+U study on comparative adsorption of s-triazine with xanthate and dithiocarbamate collectors on dry and hydrated cooperite (101) surface. J. Mol. Liq. 2023, 391, 123282. [Google Scholar]
  18. Waterson, C.N.; Tasker, P.A.; Farinato, R.; Nagaraj, D.R.; Shackleton, N.; Morrison, C.A. A Computational and Experimental Study on the Binding of Dithio Ligands to Sperrylite, Pentlandite, and Platinum. J. Phys. Chem. C 2016, 120, 22476–22488. [Google Scholar]
  19. Ikotun, B.D.; Adams, F.V.; Ikotun, A.G. Application of three xanthates collectors on the recovery of nickel and pentlandite in a low-grade nickel sulfide ore using optimum flotation parameters. Part. Sci. Technol. 2017, 35, 462–471. [Google Scholar]
  20. Otunniyi, I.O.; Oabile, M.; Adeleke, A.A.; Mendonidis, P. Copper activation option for a pentlandite–pyrrhotite–chalcopyrite ore flotation with nickel interest. Int. J. Ind. Chem. 2016, 7, 241–248. [Google Scholar] [CrossRef]
  21. Zhou, M.; Wang, Z.; Zhao, K.; Yao, C.; Chen, R.; Huang, X.; Safarov, S.S.; Kholov, K.I. Combined collector based on N-propyl-N-allyl-o-isobutyl thiocarbamate improving the flotation of pentlandite. Miner. Eng. 2025, 227, 109256. [Google Scholar] [CrossRef]
  22. Perdew, J.P.; Burke, K.; Ernzerhof, M. Generalized Gradient Approximation Made Simple. Phys. Rev. Lett. 1996, 77, 3865–3868. [Google Scholar] [CrossRef]
  23. Kresse, G.; Furthmüller, J. Efficient iterative schemes for ab initio total-energy calculations using a plane-wave basis set. Phys. Rev. B 1996, 54, 11169–11186. [Google Scholar] [CrossRef]
  24. Grimme, S.; Ehrlich, S.; Goerigk, L. Effect of the damping function in dispersion corrected density functional theory. J. Comput. Chem. 2011, 32, 1456–1465. [Google Scholar] [PubMed]
  25. Monkhorst, H.J.; Pack, J.D. Special points for Brillouin-zone integrations. Phys. Rev. B 1976, 13, 5188–5192. [Google Scholar] [CrossRef]
  26. Delley, B. Density Functional Theory Electronic Structure Program. J. Chem. Phys. 2000, 113, 7756–7764. [Google Scholar]
  27. Tkatchenko, A.; Scheffler, M. Accurate Molecular Van Der Waals Interactions from Ground-State Electron Density and Free-Atom Reference Data. Phys. Rev. Lett. 2009, 102, 073005. [Google Scholar] [CrossRef]
  28. Momma, K.; Izumi, F. VESTA: A three-dimensional visualization system for electronic and structural analysis. J. Appl. Crystallogr. 2008, 41, 653–658. [Google Scholar]
  29. Mkhonto, P.P.; Chauke, H.R.; Ngoepe, P.E. Ab initio studies of O2 adsorption on (110) nickel-rich pentlandite (Fe4Ni5S8) mineral surface. Minerals 2015, 5, 665–678. [Google Scholar] [CrossRef]
  30. Nemutudi, B.; Mkhonto, P.P.; Ngoepe, P.E. Oxidation behaviour of sperrylite and platarsite (100) surfaces: A DFT study. Mater. Today Commun. 2022, 32, 103868. [Google Scholar] [CrossRef]
  31. Molala, K.B.; Mkhonto, P.P.; Mehlape, M.A.; Ngoepe, P.E. A DFT and cluster expansion study of (Fe,Ni)9S8 pentlandite and unravelling doping with Mn, Co, Cu and precious metals. Mater. Chem. Phys. 2025, 331, 130146. [Google Scholar] [CrossRef]
  32. Chauke, H.R.; Nguyen-Manh, D.; Ngoepe, P.E.; Pettifor, D.G.; Fries, S.G. Electrostatic structure and stability of the pentlandites Co9S8 and (Fe, Ni)9S8. Phys. Rev. B 2002, 66, 155105. [Google Scholar] [CrossRef]
  33. Xu, J.; Ma, Y.; Wang, J.; Guo, X.; Su, L.; Ma, C.; Gong, L.; Zhu, Y.; Xuan, C. Constructing defect-rich Ni9S8/Fe5Ni4S8 heterostructure nanoparticles for efficient oxygen evolution reaction and overall water splitting. J. Phys. Mater. 2021, 4, 034006. [Google Scholar] [CrossRef]
  34. Lu, L.; Yu, S.; Tian, H. Theoretical insight into surface structures of pentlandite toward hydrogen evolution. J. Coll. Int. Sci. 2022, 607, 645–654. [Google Scholar] [CrossRef]
  35. Mishra, A.K.; Tewar, S.P. Density functional theory calculations of spectral, NLO, reactivity, NBO properties and docking study of Vincosamide N Oxide active against lung cancer cell lines H1299. SN Appl. Sci. 2020, 2, 1021. [Google Scholar] [CrossRef]
  36. Klopman, G. Chemical reactivity and the concept of charge- and frontier-controlled reactions. J. Am. Chem. Soc. 1968, 90, 223–234. [Google Scholar] [CrossRef]
  37. Slater, J.C. Atomic Radii in Crystals. J. Chem. Phys. 1964, 41, 3199–3204. [Google Scholar] [CrossRef]
Figure 1. Relaxed iron-rich Fe5Ni4S8 bulk model.
Minerals 15 01222 g001
Figure 2. (a) Computational XRD of tetragonal Fe5Ni4S8; (b) tetragonal Fe5Ni4S8 crystal morphology.
Minerals 15 01222 g002
Figure 3. (a) Fe5Ni4S8 unrelaxed plane surface of (311) model; (b) relaxed plane surface of (311) model.
Minerals 15 01222 g003
Figure 4. The density of states of Fe5Ni4S8 plane surface of (311).
Minerals 15 01222 g004
Figure 5. Relaxed molecular geometries and HOMO and LUMO isosurface models of ADEDTC, IPDETC, SMBT, and SDTBAT collectors.
Minerals 15 01222 g005
Figure 6. The relaxed final geometries for the most exothermic adsorption on Ni and Fe sites on the Fe5Ni4S8 plane surface of (311): (a) ADEDTC Ni site, (b) ADEDTC Fe site, (c) IPDETC Ni site, and (d) IPDETC Fe site adsorptions.
Minerals 15 01222 g006
Figure 7. The relaxed final geometries for the most exothermic adsorption on Ni and Fe sites on the Fe5Ni4S8 plane surface of (311): (a) SMBT horizontal on Ni site, (b) SMBT horizontal on Fe site, and (c) SDTBAT on Ni and Fe site adsorptions.
Minerals 15 01222 g007
Figure 8. Partial density of states (PDOS) of ADEDTC collector before and after adsorption on the Fe5Ni4S8 plane surface of (311): (a) Ni site adsorption and (b) Fe site adsorption.
Minerals 15 01222 g008
Figure 9. Partial density of states (PDOS) of IPEDTC collector before and after adsorption on the Fe5Ni4S8 plane surface of (311): (a) Ni site adsorption and (b) Fe site adsorption.
Minerals 15 01222 g009
Figure 10. Partial density of states (PDOS) of SMBT horizontal collector before and after adsorption on the Fe5Ni4S8 (311) surface: (a) Ni site adsorption and (b) Fe site adsorption.
Minerals 15 01222 g010
Figure 11. Partial density of states (PDOS) of STDBAT collector before and after adsorption on the Fe5Ni4S8 (311) surface: (a) Ni site adsorption and (b) Fe site adsorption.
Minerals 15 01222 g011
Figure 12. The 3D-sketch of the isosurface charge density difference of collector adsorption on pentlandite (Fe5Ni4S8) (311) surface: (a) ADEDTC, (b) IPDETC, (c) SMBT (horizontal), and (d) SDTBAT adsorptions. Cyan represents where electron density is depleted, and purple shows areas where electron density is accumulated (isosurface level = 0.05 eÅ−3). (For interpretation of the references to colour in this figure legend, the reader is referred to the web version of this article).
Minerals 15 01222 g012
Figure 13. The column graph for ADEDTC, IPDETC, SMBT, and SDTBAT collector adsorptions on Fe-rich pentlandite (311) surface.
Minerals 15 01222 g013
Table 1. The Fe5Ni4S8 number of atoms and surface energies for the plane surfaces (111), (211), (224), and (311).
SurfaceNo. of
Atoms
Surface
Area (Å)
Surface
Energy (J.m−2)
(111)68108.771.62
(211)102133.501.84
(224)102134.251.84
(311)102226.211.48
Table 2. Atomic vertical displacements (ΔdZ, Å) of the plane surfaces (111), (211), (224), and (311) of Fe5Ni4S8, obtained from the unrelaxed (dZ(U)) and relaxed (dZ(R)) Z-atomic positions.
SpeciesΔdZ
Atoms
(311) Surface
Fe1−0.041
Fe2−0.085
Fe3−0.054
Ni1−0.013
Ni2−0.042
S1−1.045
S2−0.033
S30.005
Negative and positive values show inward and upward displacement, respectively.
Table 3. Calculated HOMO and LUMO energies of the ADEDTC, IPDETC, SMBT, and SDTBAT collectors.
CollectorDMol3 (eV)Band Gaps (eV)
HOMOLUMO
ADEDTC−4.744−1.1402.57
IPDETC−4.851−0.9123.05
SMBT−4.563−1.7552.61
SDTBAT−4.203−1.5671.93
Table 4. Calculated bond lengths (R, in Å) and torsion angles (ϕ, in deg.) for ADEDTC, IPDETC, SMBT, and SDTBAT collectors.
Collectors
BondsADEDTCIPDETCSMBTSDTBAT
R(C=S1)1.6651.6581.706
R(C–S2)1.7841.7701.725
R(C–S1)1.723
R(C–O)1.361
R(C–N)1.3601.3521.3411.345
R(C=N1)1.376
ϕ((S1=C–S2)–N/=C)112.9120.9
ϕ((S1–C–N) =S)113.5112.8
ϕ((S1=C–N)–O)124.4
ϕ((N–C–O)=S1)108.7
ϕ((S1–C=N1)–N)118.1
ϕ((S2–C–N1)=N)118.8
Table 5. Calculated adsorption energies (kJ.mol−1), dispersion energies (kJ.mol−1), and bond lengths (Å) of ADEDTC, IPDETC, SMBT, and SDTBAT collectors’ adsorptions on the Fe5Ni4S8 plane surface of (311).
Fe5Ni4S8 Plane Surface of (311) Adsorptions
Collector [C]Adsorption E a d s . E d i s p . Ni1–S1Fe1–S1Fe2–S2
ADEDTCNi site−460.58−97.152.250
ADEDTCFe site−381.37−108.053.788
IPDETCNi site−161.01−87.802.244
IPDETCFe site−164.53−56.272.355
SMBTNi site−424.08−109.292.339
SMBTFe site−306.99−104.694.8632.438
SDTBATNi and Fe bridge−352.48−183.852.2612.380
Disclaimer/Publisher’s Note: The statements, opinions and data contained in all publications are solely those of the individual author(s) and contributor(s) and not of MDPI and/or the editor(s). MDPI and/or the editor(s) disclaim responsibility for any injury to people or property resulting from any ideas, methods, instructions or products referred to in the content.