Article

Depositional Environment and Sediment Dynamics of the Northern Brahmaputra–Jamuna River, Bangladesh: A Combined Geochemical, Mineralogical, Grain Morphology, and Statistical Analysis

by
Md. Golam Mostafa
1,2,
Md. Aminur Rahman
1,*,
Mark Ian Pownceby
3,*,
Aaron Torpy
3,
Md. Sha Alam
1,
Md. Nakib Hossen
1,
Hayatullah
1,
Md. Shohel Rana
1,
Md. Imam Sohel Hossain
1,
Md. Hasnain Mustak
1 and
Md. Shazzadur Rahman
1
1
Institute of Mining, Mineralogy and Metallurgy (IMMM), Bangladesh Council of Scientific and Industrial Research (BCSIR), Joypurhat 5900, Bangladesh
2
Department of Geology and Mining, University of Rajshahi, Rajshahi 6205, Bangladesh
3
CSIRO Mineral Resources, Clayton, Melbourne, VIC 3168, Australia
*
Authors to whom correspondence should be addressed.
Minerals 2025, 15(11), 1192; https://doi.org/10.3390/min15111192
Submission received: 14 October 2025 / Revised: 10 November 2025 / Accepted: 11 November 2025 / Published: 13 November 2025

Abstract

The mineralogical, geochemical, and statistical characteristics of recent fluvial deposits from the Brahmaputra–Jamuna River, Bangladesh, were examined to determine their provenance, transport dynamics, and depositional environment. Sediments were analyzed using X-ray diffraction (XRD), wavelength dispersive X-ray fluorescence (WD-XRF), field emission scanning electron microscopy (FE-SEM), and electron probe microanalysis (EPMA). Grain size analysis revealed a predominance of medium-to-fine sand (mean grain size 1.77–3.43 ϕ), with moderately well-sorted textures (sorting: 0.33–0.77 ϕ), mesokurtic to leptokurtic distributions, and skewness values ranging from −0.21 to +0.30. Mineralogical results show a high quartz content with minor feldspar, mica, zircon, rutile, and iron-bearing minerals. Geochemical data indicates high SiO2 (63.39%–70.94%) and Al2O3 (12.25%–14.20%) concentrations and calculated chemical index of alteration (CIA) values ranging from 60.90 to 66.82. The microstructural study revealed angular to sub-angular grains with conchoidal fractures and stepped microcracks, indicating brittle deformation under high-energy conditions, which is consistent with short transport distances, limited sedimentary recycling, and a derivation from mechanically weathered source rocks. Multivariate analyses (PCA and K-means clustering) of grain size parameters reveal two distinct sedimentary regimes, namely Cluster 1 as finer-grained (2.36 ϕ), poorly sorted sediments, and Cluster 2 as coarser (2.98 ϕ), well-sorted deposits. Discriminant function values (Y2: 78.82–119.12; Y3: −6.01 to −2.56; V1: 1.457–2.442; V2: 1.409–2.323) highlight shallow water, fluvial/deltaic aspects, and turbidite depositional environments. These findings advance the understanding of sedimentary dynamics within large, braided river basins and support future investigations into the sustainable management of fluvial depositional environments.

1. Introduction

The Bengal Basin is one of the largest alluvial basin and delta systems in the world. It is bordered by the Indian Shield, the Shillong Shield, and the Naga-Lusai orogenic belt [1] and is located at the confluence of the Ganges–Brahmaputra–Meghna (GBM) river system [2,3]. The GBM system in Bangladesh and India covers an area of approximately 120,000 km2 and discharges about 109 tons of sediment annually into the Bay of Bengal, through the Garo-Rajmahal Gap [4]. Collectively, the Brahmaputra–Jamuna, Ganges, and Meghna rivers constitute the principal fluvial systems of Bangladesh and are characterized by highly dynamic geomorphic processes, including seasonal inundation, bank-line migration, erosion–accretion, and the formation of alluvial islands or chars [5]. Moreover, the rapid growth of the population, along with the expansion of infrastructure and economic activities, has resulted in approximately 600,000 people living on unstable islands who are frequently exposed to fluvial hazards. Notably, the Brahmaputra–Jamuna River is one of the world’s largest braided rivers. It forms a key part of the GBM river system in Bangladesh and is characterized by high discharge and sediment load, which drive frequent and dynamic changes in channel morphology [6].
Previous research on the Bengal Basin and, in particular, the Brahmaputra–Jamuna section of the GBM river system, has focused on the mineralogy, geomorphology, sedimentology, hydrology, geochemistry, weathering, erosion, and delta evolution to investigate the heavy minerals, channel dynamics, river morphology, and paleo-weathering conditions [7,8]. In particular, Morgan and McIntire [9] and Coleman [2] examined sediment characteristics and mineralogical variations in the Bengal Basin, and Khan et al. [10] further contributed data on sediment texture and composition. Despite these contributions, however, there remains a significant knowledge gap regarding the grain size characteristics and sediment transport dynamics of recent Brahmaputra–Jamuna riverbed deposits. Indeed, comprehensive investigations encompassing grain size distribution, mineralogical composition, and sediment geochemistry within the Bengal Basin remain limited and underexplored.
This study aims to address this gap and investigates the physical, mineralogical, geochemical, and statistical characteristics of recent siliclastic fluvial deposits from the Brahmaputra–Jamuna River. The data obtained is then used to determine the provenance, transport dynamics, and depositional environment of the sediments.

2. Tectonic Setting

The Brahmaputra–Jamuna River is a trans-boundary river that originates in the Tibet region of China, flowing in an easterly direction for approximately 1100 km across the Tibetan Plateau (Figure 1a). It then enters India, passing through the Indian states of Arunachal Pradesh and Assam, before crossing into northern Bangladesh. Within Bangladesh, the river extends for approximately 220 km from the Indian border to its confluence with the Ganges River in central Bangladesh (Figure 1a). The river has undergone major avulsions every 2000–3000 years between channels east and west of the Madhupur Tract (Figure 1b), with the most recent shift from the Old Brahmaputra to the present Jamuna river, one of the youngest rivers in the world, occurring between 1780 and 1880 due to abnormal flooding and tectonic activity [11,12]. Coleman [2] suggested that the westward avulsion of the Brahmaputra River by approximately 80–100 km in the late 18th century may have been triggered by a large earthquake, as the region is seismically active. River course changes were also influenced by the Shillong earthquake in 1897 [13], and the morphodynamics of the largest sand bars in the Brahmaputra–Jamuna River were significantly influenced by the 1897 Shillong and the 1950 Assam earthquakes, which triggered extensive landslides and released approximately 50 billion cubic meters of sediment [14,15]. While tectonic influences are evident, as represented by the extensive fault systems in the northern and central parts of the basin (Figure 1c), they are not solely responsible for the river’s morphological evolution [4]. Other contributing factors include frequent monsoonal flooding events, whereby a significant amount of fine sediments is transported through the Brahmaputra and its numerous tributaries and is rapidly deposited in the Brahmaputra–Jamuna–Padma–Meghna Basin and floodplain [16,17].

3. Study Area

The Brahmaputra–Jamuna River is a major braided channel, with a discharge rate ranging from 3000 to 100,000 m3/s, a bank full discharge of approximately 48,000 m3/s, and an average annual flow of about 19,600 m3/s into the Bay of Bengal [19]. In Bangladesh, the Brahmaputra–Jamuna River flows through the districts of Kurigram, Gaibandha, Bogura, Tangail, Sirajganj, Jamalpur, Pabna, and Manikganj [20]. The Brahmaputra River maintains an average suspended sediment concentration of approximately 860 mg/L [19], and the banks of the river are primarily composed of loosely packed silt and fine sand containing less than 1% clay. The combination of a substantial fine sediment load and high-water discharge results in an estimated annual sediment deposit ranging from 590 × 106 to 792 × 106 tons. The high sediment load contributes to the formation of braided channels with numerous low-lying islands and sandbars, also known as chars [14,15,16]. These are generally composed of slightly coarser, fine-to-medium-sized sand particles, compared to the slightly finer riverbank sediments. Additionally, as a highly dynamic river system, the Brahmaputra–Jamuna experiences frequent cycles of channel formation and abandonment, resulting in substantial sediment deposition [12,20].

4. Materials and Methods

4.1. Sample Collection

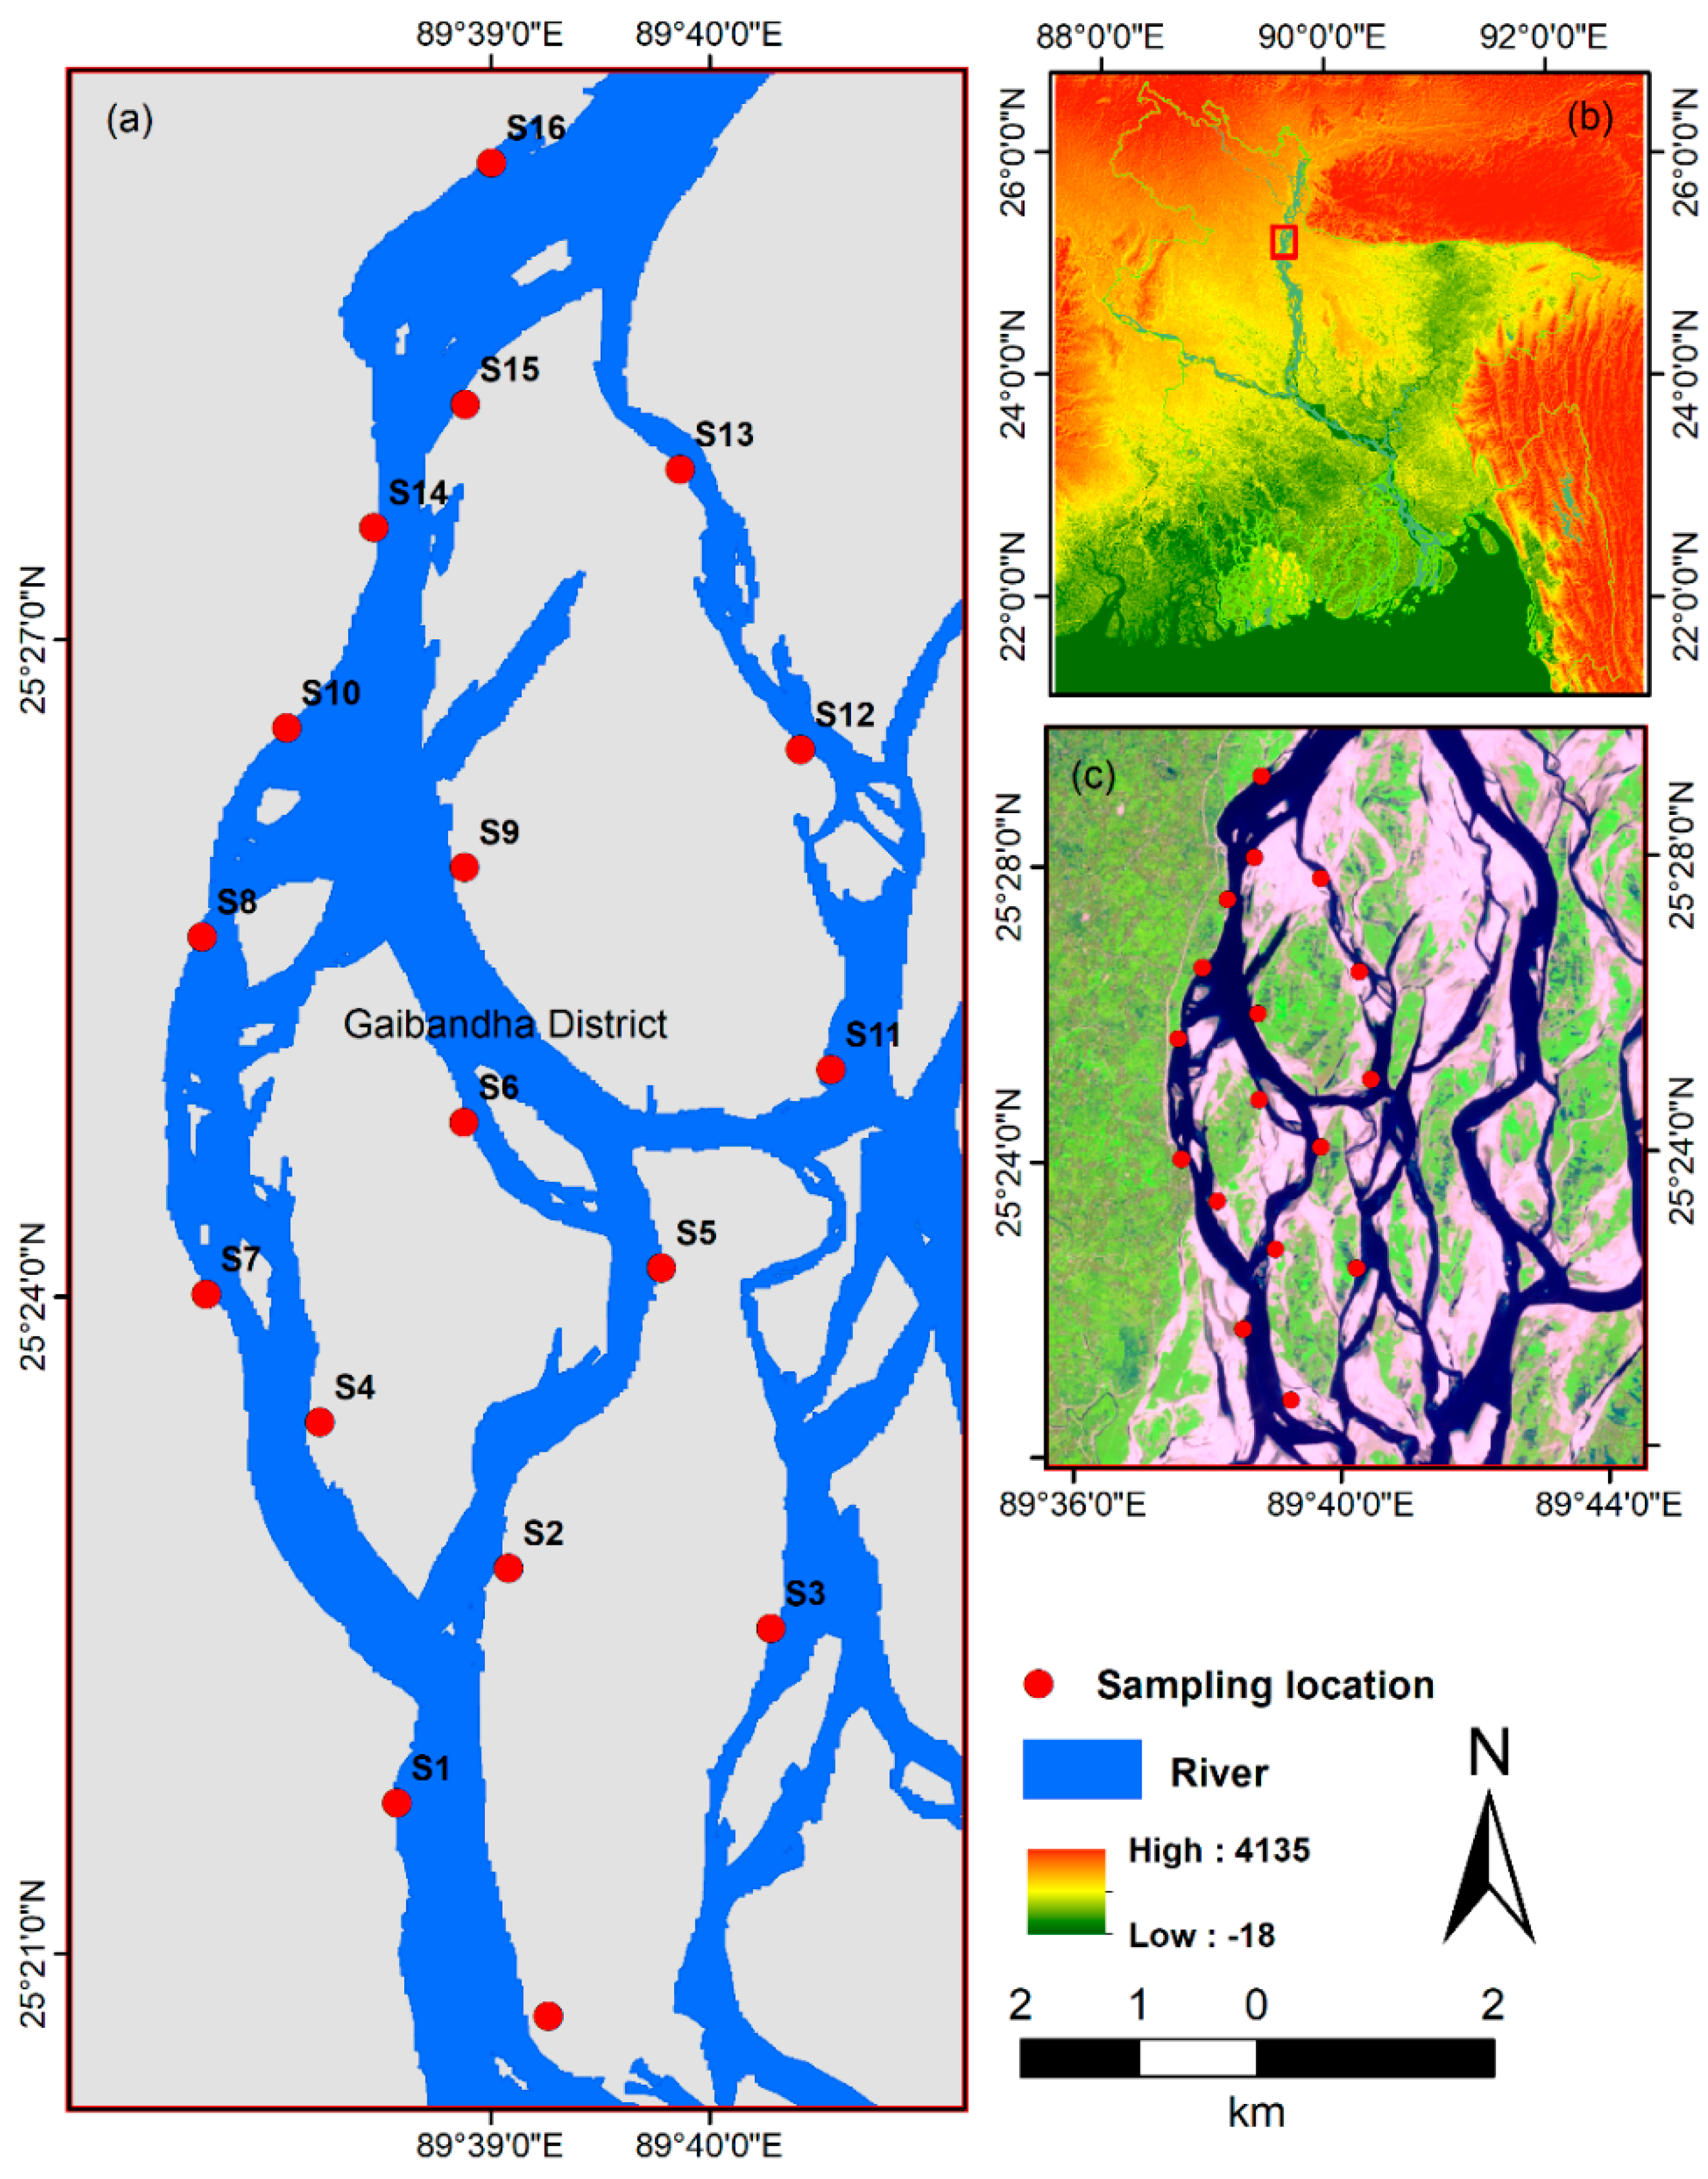
A total of 16 samples were collected from the Brahmaputra–Jamuna River, in the Gaibandha district of northern Bangladesh, in March 2025 (Figure 2). The samples were obtained from up to 1 m depth along the river banks using hand augers (5–10 cm diameter) and were sourced from areas selected to cover areas on land or on sand bars adjacent to the main river channels and tributaries within the region encompassing the following longitude: 89°39′0″ E to 89°40′0″ E; latitude: 25°21′0″ N to 25°27′0″ N. Each sample, weighing approximately 1 kg, was sealed in pre-cleaned polyethylene bags and transported to the laboratory for analysis.

4.2. Sample Preparation and Analytical Techniques

The samples were oven-dried at 105 °C for 24 h to remove moisture. A representative 100 g sub-sample was taken from every sample using the coning and quartering method, and each sub-sample was prepared for granulometric analysis by sieving for 10 min using a sieve analyzer with ASTM standard mesh sizes (1 mm, 500 µm, 250 µm, 180 µm, 125 µm, 90 µm, 63 µm, and 45 µm). The mass of each fraction was recorded to evaluate the sediment grain size distribution at each size range. The grain size distribution at each site was expressed using both frequency histograms and cumulative frequency curves. Parameters such as grain size mean, median, sorting, skewness, and kurtosis were calculated based on the methods outlined in [21]. The Udden–Wentworth grade scale was used to convert grain sizes from millimeters to phi units using the following equation: ϕ =   L o g 2 D , where D is the particle diameter in mm. Statistical parameters, descriptive analyses, and bivariate plots of the sediment data were performed using OriginPro 2024.
X-ray diffraction (XRD) analysis to determine the mineralogy of the samples was conducted using a PANalytical X’Pert Pro diffractometer with Cu-Kα radiation (λ = 1.54178 Å), operating at a step size of 0.02° and a scanning range of 2–60° 2θ. The bulk chemistry of the samples was determined using Wavelength Dispersive X-ray Fluorescence (WDXRF) spectrometry using a Rigaku ZSX Primus system (Tokyo, Japan), operating at 50 kV, 60 mA, and using a 4 kW Rh-anode X-ray tube. Field Emission Scanning Election Microscopy (FESEM) analysis was used to examine the sediment grain morphology using a Zeiss Sigma 300 FESEM (Oberkochen, Germany) instrument. The samples were prepared for the SEM analysis by scattering the material onto a carbon substrate and then by carbon coating the samples with a Quorum Q150R ES Plus model pulsed sample coater. The SEM analysis was conducted at an accelerating voltage of 20 kV, and Secondary Electron (SE) images of grains were captured at magnifications of 400×, 500×, 750×, and 1000×.
Electron Probe Microanalysis (EPMA) map data was collected using a JEOL JXA-iHP200F (Tokyo, Japan) Field Emission Gun Electron Probe Micro-Analyzer (FEG-EPMA). The instrument was equipped with five wavelength dispersive spectrometers (WDS) and one silicon drift detector energy dispersive spectrometer (SDD-EDS). Samples were analyzed using automated EPMA mapping to provide modal data (as an area% of the mapped surface) and to generate mineral phase maps that illustrate the key textural features and the distribution of phases. For the EPMA mapping, the polished grain mounts of each sample were mapped over a grid of analysis points covering 3000 × 3000 µm using a combination of wavelength dispersive (WD) and energy dispersive (ED) spectroscopic techniques. The EPMA was operated using the following conditions: an accelerating voltage of 20 keV, a beam current of ~80 nA, a step size of 2 µm, and a dwell time at each step of 30 ms. Following mapping, the element distribution data obtained were manipulated using the software package CHIMAGE [22], which incorporates an automated k-means clustering algorithm that identifies chemically distinct phases [23]. Phase identification was performed using spectrum matching against a reference library compiled from previous studies, in which elemental quantitative analyses and XRD were used to identify mineral phases in river sediments [24]. The mineral suite in this study includes groups or series with solid solutions of variable chemical composition, such as feldspars, garnets, amphiboles, pyroxenes, micas, and chlorites. For the sake of simplicity, the members of these groups were consolidated in the phase maps and mineral abundances presented herein.

5. Results and Discussion

5.1. Mineralogy of Brahmaputra–Jamuna River Sediments

The results from the XRD analysis of the samples showed that the Brahmaputra–Jamuna River sediments were composed mainly of quartz (Qz), mica (Mca), feldspar (Fsp), and had minor-to-trace amounts of amphibole (Amp), garnet (Grt), rutile (Rt), zircon (Zrn), monazite (Mnz), and iron-bearing minerals such as magnetite (Mag). Quartz was the dominant phase in all samples, showing intense reflections at 2θ values around 20.83°, 26.69°, 36.53°, 44.65°, 50.11°, 59.93°, 64.0°, 68.27°, and 75.65°, followed by feldspar, as indicated by the intense peak at 27.99°. Mica was also identified as a component in all samples, as identified by peaks at 10.51° and 17.73°. Minor peaks near 31.77° indicated the presence of magnetite, while minor amounts of rutile and zircon were indicated by reflections at approximately 39.45°, 54.85°, and 68.27° (Figure 3).
Mineral assemblages comprising quartz, feldspar, amphibole, and mica generally reflect a provenance rich in pelitic metamorphic rocks and are expected to be rich in elements such as aluminum (Al), silicon (Si), potassium (K), iron (Fe), magnesium (Mg), and water (H2O), with smaller amounts of other elements. The presence of heavy minerals, garnet, zircon, rutile, and magnetite, indicates moderate chemical alteration during transport, derived mainly from high-grade metamorphic and mafic igneous rocks [7]. The dominance of quartz, feldspars, and mica as typical siliciclastic components, along with the presence of garnet, amphibole, magnetite, zircon, and rutile, reveals information about their source rocks, prevailing weathering conditions, and contributions from mixed sedimentary sources. The mineralogical data reflects a high-energy, tectonically active fluvial system with efficient sediment mixing and grain size-controlled mineral distribution, which aligns with the present study.
Four samples were mapped in a JEOL JXA-iHP200F field emission gun electron probe micro-analyzer (FEG-EPMA) to identify the major and minor mineral phases present and to determine their abundance. EPMA mapping offered some advantages over XRD analysis in that it can indicate the presence of minor and trace phases in the samples (XRD is generally limited to identifying phases at abundance levels of >1%–2%). The drawback is, however, that the technique is time-consuming compared to XRD and, hence, only four samples were analyzed in detail by EPMA mapping. In addition, the EPMA analyzes a comparatively minuscule volume of specimen, and may, therefore, less accurately represent the bulk abundance, depending on sampling and homogeneity. A typical map was used in this study, with a sample of the order of 10 nL of specimen, based on a 3 × 3 mm map area and a depth of analysis of ~1 µm.
Modal analysis results (area %) from the EPMA mapping conducted on the four selected samples are provided in Table 1.
All samples were majority quartz and feldspars (end-member K-feldspar and albite, as well as (Na,Ca)-bearing plagioclase feldspars) in good agreement with the XRD data. Minor mineralogy (~1%–10%) included amphiboles (note that individual amphibole compositional types were not identified), micaceous phases (comprising the subgroups muscovite and biotite), various Fe-Mg-Mn-Ca garnets, epidote, various pyroxenes, and fluorapatite. A further 16 phases were identified with abundances typically <1%, as noted in the modal analysis table (Table 1):
  • The distribution and textures of major, minor, and trace phases within the samples are shown in Figure 4. Key observations include the following:
  • The dominance of quartz and feldspars in the four samples.
  • Fe-Mg aluminosilicates, such as amphiboles, epidote, micaceous phases and garnet are common, making up about 20% (combined) of the samples.
  • The samples contain, on average, up to ~2% valuable heavy minerals (HM), such as ilmenite, rutile, zircon, monazite, and xenotime. Previous work on sediments from the northern Brahmaputra–Jamuna River [8] showed that these are all potentially recoverable. Garnet (~4%–6%) is also considered a potentially valuable HM that could be recovered.
  • Grains are generally present as well-liberated, discrete particles with only rare occurrences of composite particles (see in particular sample GS-2 in Figure 4b, which has several coarse composite particles).
  • There is a visible grain size difference in the samples, with GS-2 being relatively coarse-grained compared to the other samples.
  • Grain morphologies are typically sub-angular to sub-rounded sediments, indicating that the particles are in an intermediate stage of rounding, having experienced some erosion from their original sharp edges but not yet becoming fully smooth and rounded. This implies a moderate degree of transportation.

5.2. Geochemistry of Major Elements

The Brahmaputra–Jamuna River sediments are relatively homogeneous in composition, with SiO2 contents ranging from 63.39 to 70.94 wt.% (average 67.1 wt.%). The next most abundant oxides were Al2O3 (12.25–14.20 wt.%, average 13.0 wt.%), Fe2O3T (5.49–9.87 wt.%, average 7.7 wt.%), and CaO (2.33–3.71 wt.%, average 2.12 wt.%). Other oxides, such as TiO2, K2O, MgO, and Na2O, are present in minor amounts, whereas P2O5, MnO, ZnO, and Cr2O3 are found in trace concentrations (Table 2). Consistent with the XRD mineralogical data, these geochemical signatures reflect quartz-rich sediments with lower amounts of aluminosilicates, such as feldspars (either plagioclase or K-feldspar series) and iron-bearing minerals. The concentrations of Fe2O3 (5.49–9.87 wt.%), MgO (1.20–2.27 wt.%), and TiO2 (0.55–1.20 wt.%) indicate the presence of mafic components, likely reflecting Fe- and Ti-bearing minerals such as ilmenite, magnetite/hematite, and micaceous phyllosilicates of the biotite subgroup [25] and iron-rich aluminosilicates, such as garnet, amphibole, and biotite, which have also been noted in Brahmaputra River sediments [8]. The CaO content (2.41–3.71 wt.%) suggests contributions from carbonate materials or calcic minerals, including plagioclase feldspar and andradite garnet [26].
The high SiO2 content in the Brahmaputra–Jamuna River sediments caused by a dominance of quartz along with minor-to-trace feldspar, mica, and iron-bearing minerals is consistent with similar previous results [8,27,28]. The high SiO2 content relative to other oxides such as Al2O3, CaO, MgO, Na2O, K2O, and P2O5 suggests significant chemical alteration, whereas the concentrations of Fe2O3T, TiO2, and MnO indicate some more resistant minerals (e.g., rutile, garnet) likely remain present [29].
Table 2. Major element oxide composition (wt.%) data for the 16 sediment samples from the Brahmaputra–Jamuna River.
Major OxidesGS1 GS2GS3GS4GS5 GS6GS7 GS8GS9GS10GS11GS12GS13GS14GS15GS16
SiO268.6666.5267.9667.270.8368.0867.7166.8368.1864.1163.3966.270.968.664.566.8
Al2O312.4312.2512.9312.912.4212.8812.9913.1912.8814.0914.2013.312.712.613.813.1
Fe2O37.158.637.337.805.717.137.247.947.229.199.878.235.497.119.097.89
TiO20.841.200.800.880.590.760.830.860.781.000.960.870.550.750.950.86
K2O3.613.163.843.733.903.693.833.853.844.174.043.854.103.784.023.84
MgO1.491.701.631.691.201.681.861.791.592.272.081.901.181.572.081.82
CaO3.003.712.742.872.422.952.802.712.742.412.442.702.332.872.522.73
Na2O1.821.741.741.761.931.811.751.721.751.621.531.721.721.791.631.72
P2O50.160.220.180.180.100.170.190.200.170.190.290.210.150.150.230.20
MnO0.140.200.120.140.100.120.110.130.120.120.140.130.080.120.130.13
ZnO0.010.010.010.010.010.010.010.010.010.010.020.010.010.010.010.01
Cr2O30.300.220.350.360.410.330.330.400.340.380.700.420.330.270.500.40
CaO*2.472.972.142.272.082.402.172.062.161.761.482.021.822.371.752.06
CIA61.1160.9062.6262.461.0861.9962.6563.3462.4665.1066.8263.762.561.365.263.4
DF1−8.57−3.73−9.12−8.5−9.36−10.6−17.9−19.2−15.0−14.9−29.6−12.9−10.1−18.2−11.7−21.2
DF2−6.71−11.4−8.32−7.6−6.45−5.400.142.03−1.750.2317.93−2.05−6.011.98−3.563.74
Log (Na2O/KO)−0.30−0.251.40−0.030.39−0.020.030.040.06−0.020.08−0.030.03−0.030.19−0.04
Log (Fe2O3/K2)0.30−0.761.550.050.49−0.06−0.07−0.010.010.060.140.04−0.040.010.26−0.10
Log (SiO2/Al2O)−1.020.04−0.22−0.08−0.100.040.060.040.06−0.05−0.07−0.070.070.05−0.070.07
CaO* represents calcium oxide corrected for apatite content using the formula CaO* = CaO−(10/3 × P2O5), as proposed by [30].
Pearson correlation analysis data is provided in Table 3, with the data revealing that SiO2 shows strong negative correlations with total Fe2O3T (r = −0.987), MgO (r = −0.955), ZnO (r = −0.934), P2O5 (r = −0.873), Al2O3 (r = −0.821), K2O (r = −0.16), and TiO2 (r = −0.793), respectively, while Na2O shows a strong positive correlation with SiO2 (r = 0.830) and CaO (r = 0.018). The results are consistent with the Brahmaputra–Jamuna River sediments being composed of quartz and aluminosilicates [26,27,28,31]. However, MgO, TiO2, and Fe2O3T show strong negative correlations with SiO2, indicating a decrease in unstable mineral phases with increasing sediment maturity due to hydraulic sorting [29,32]. Weak correlations of K2O with SiO2 suggest limited sodic or potassic-feldspar content, though elevated CaO may imply the presence of calcic plagioclase. According to Biswas et al. [26], high correlation coefficients among Fe2O3, TiO2, MgO, and MnO suggest that these oxides are hosted in common mafic or micaceous phyllosilicate minerals, including those from the biotite subgroup, amphibole, and garnet. Additionally, positive correlations of TiO2, Fe2O3, MgO, K2O, and Na2O with Al2O3, alongside their negative correlation with Na2O and CaO, indicate a dominance of garnet and micaceous phases and a lack of illitic clays [33] (Table 3). Moreover, strong inter-element correlations, particularly TiO2 with Fe2O3, MgO, MnO, CaO, and P2O5, point to a likely provenance from weathered and recycled alkali basaltic sources [34].
A log (Fe2O3/K2O) versus log (SiO2/Al2O3) geochemical plot, notably associated with Herron [35], is used to classify sedimentary and metasedimentary rocks based on their major oxide compositions. The bivariate discrimination diagram shown in Figure 5a reveals that most samples fall within the litharenite and greywacke fields, indicating the presence of a predominantly sandstone rock with >5% lithic fragments. Litharenites are typically immature and form under conditions of rapid uplift, intense erosion, and high rates of deposition, which are often found in major mountain systems. They are usually found in post-orogenic clastic wedge systems, which are wedge-shaped deposits of sediment formed in front of a rising mountain belt.
The SiO2 content and SiO2/Al2O3 ratio are commonly used to assess textural maturity, which reflects grain sorting, matrix content, and angularity. Higher SiO2/Al2O3 ratios indicate greater maturity [30]. These ratios, along with K2O/Al2O3, vary with sediment type, being highest in litharenites and lowest in shales, correlating with quartz content and grain size [25]. In Figure 5b, a plot of log (Na2O/K2O) versus log (SiO2/Al2O3) shows that the samples fall within the arkose field, implying a high quartz content but with a significant K-feldspar component (>25%) and a lower proportion of plagioclase, which is consistent with a felsic igneous or metamorphic source [18,27,36]. Data plotting in the arkose field is consistent with the sediments originating from a region with a high rate of geological uplift, followed by rapid erosion and deposition. This rapid process means that the K-feldspar, which is prone to chemical weathering, does not have enough time to break down into clay before it is buried.
Roser and R. J. Korsch [36] developed a discriminant function diagram that classified sediments into four provenance types: mafic, intermediate, felsic igneous, and quartzose sedimentary recycled (Figure 5c). The Brahmaputra–Jamuna River samples plot in the quartzose recycled field, indicating a mature continental source, having been subject to moderate-to-intense weathering, and likely derived from weathered granite gneiss and/or older sedimentary rocks of the southern Himalayas [27,28,37].
Roser and Korsch [36] also proposed a tectonic setting discriminant diagram using log (K2O/Na2O) versus SiO2 to differentiate tectonic settings of terrigenous sedimentary rocks. The discrimination diagram identifies three fields: oceanic island arc, active continental margin, and, lastly, passive margin. For the Brahmaputra–Jamuna samples, the sediments plot across both passive margin (PM) and active continental margin (ACM) fields, implying that the source region is influenced by both tectonic settings (Figure 5d). According to Roser and Korsch [38], passive margin sediments are largely quartz-rich sediments derived from plate interiors or stable continental areas and deposited in intracratonic basins or on passive continental margins. The fact that there is also a component of material with an active continental margin signature is consistent with the sediments being derived from the adjacent Himalayan uplift zone.
The chemical index of alteration (CIA) was calculated based on the molecular proportions of major oxides following Equation (1) [18,30,39]:
CIA = [Al2O3/(Al2O3 + CaO + Na2O + K2O)] × 100*
A higher CIA value indicates more intense chemical weathering, leading to the breakdown of unstable minerals and an enrichment in aluminum-rich clays, while a lower CIA suggests less weathering and the presence of less altered minerals. In this study, the CIA values ranged from 60.90 to 66.82, with an average of 62.93 (Table 1), indicating moderate weathering conditions.
Figure 5. Geochemical classifications of the Brahmaputra–Jamuna River sediments. (a) Log (Fe2O3/K2O) versus log (SiO2/Al2O3) [40]. (b) Log (Na2O/K2O) versus log (SiO2/Al2O3) [35]. (c) Discriminant function diagram [36]. (d) Discrimination diagram for tectonic setting [38]. Pink symbols indicate data points for the 16 sediment samples.
Minerals 15 01192 g005

5.3. Grain Size Distribution Analysis

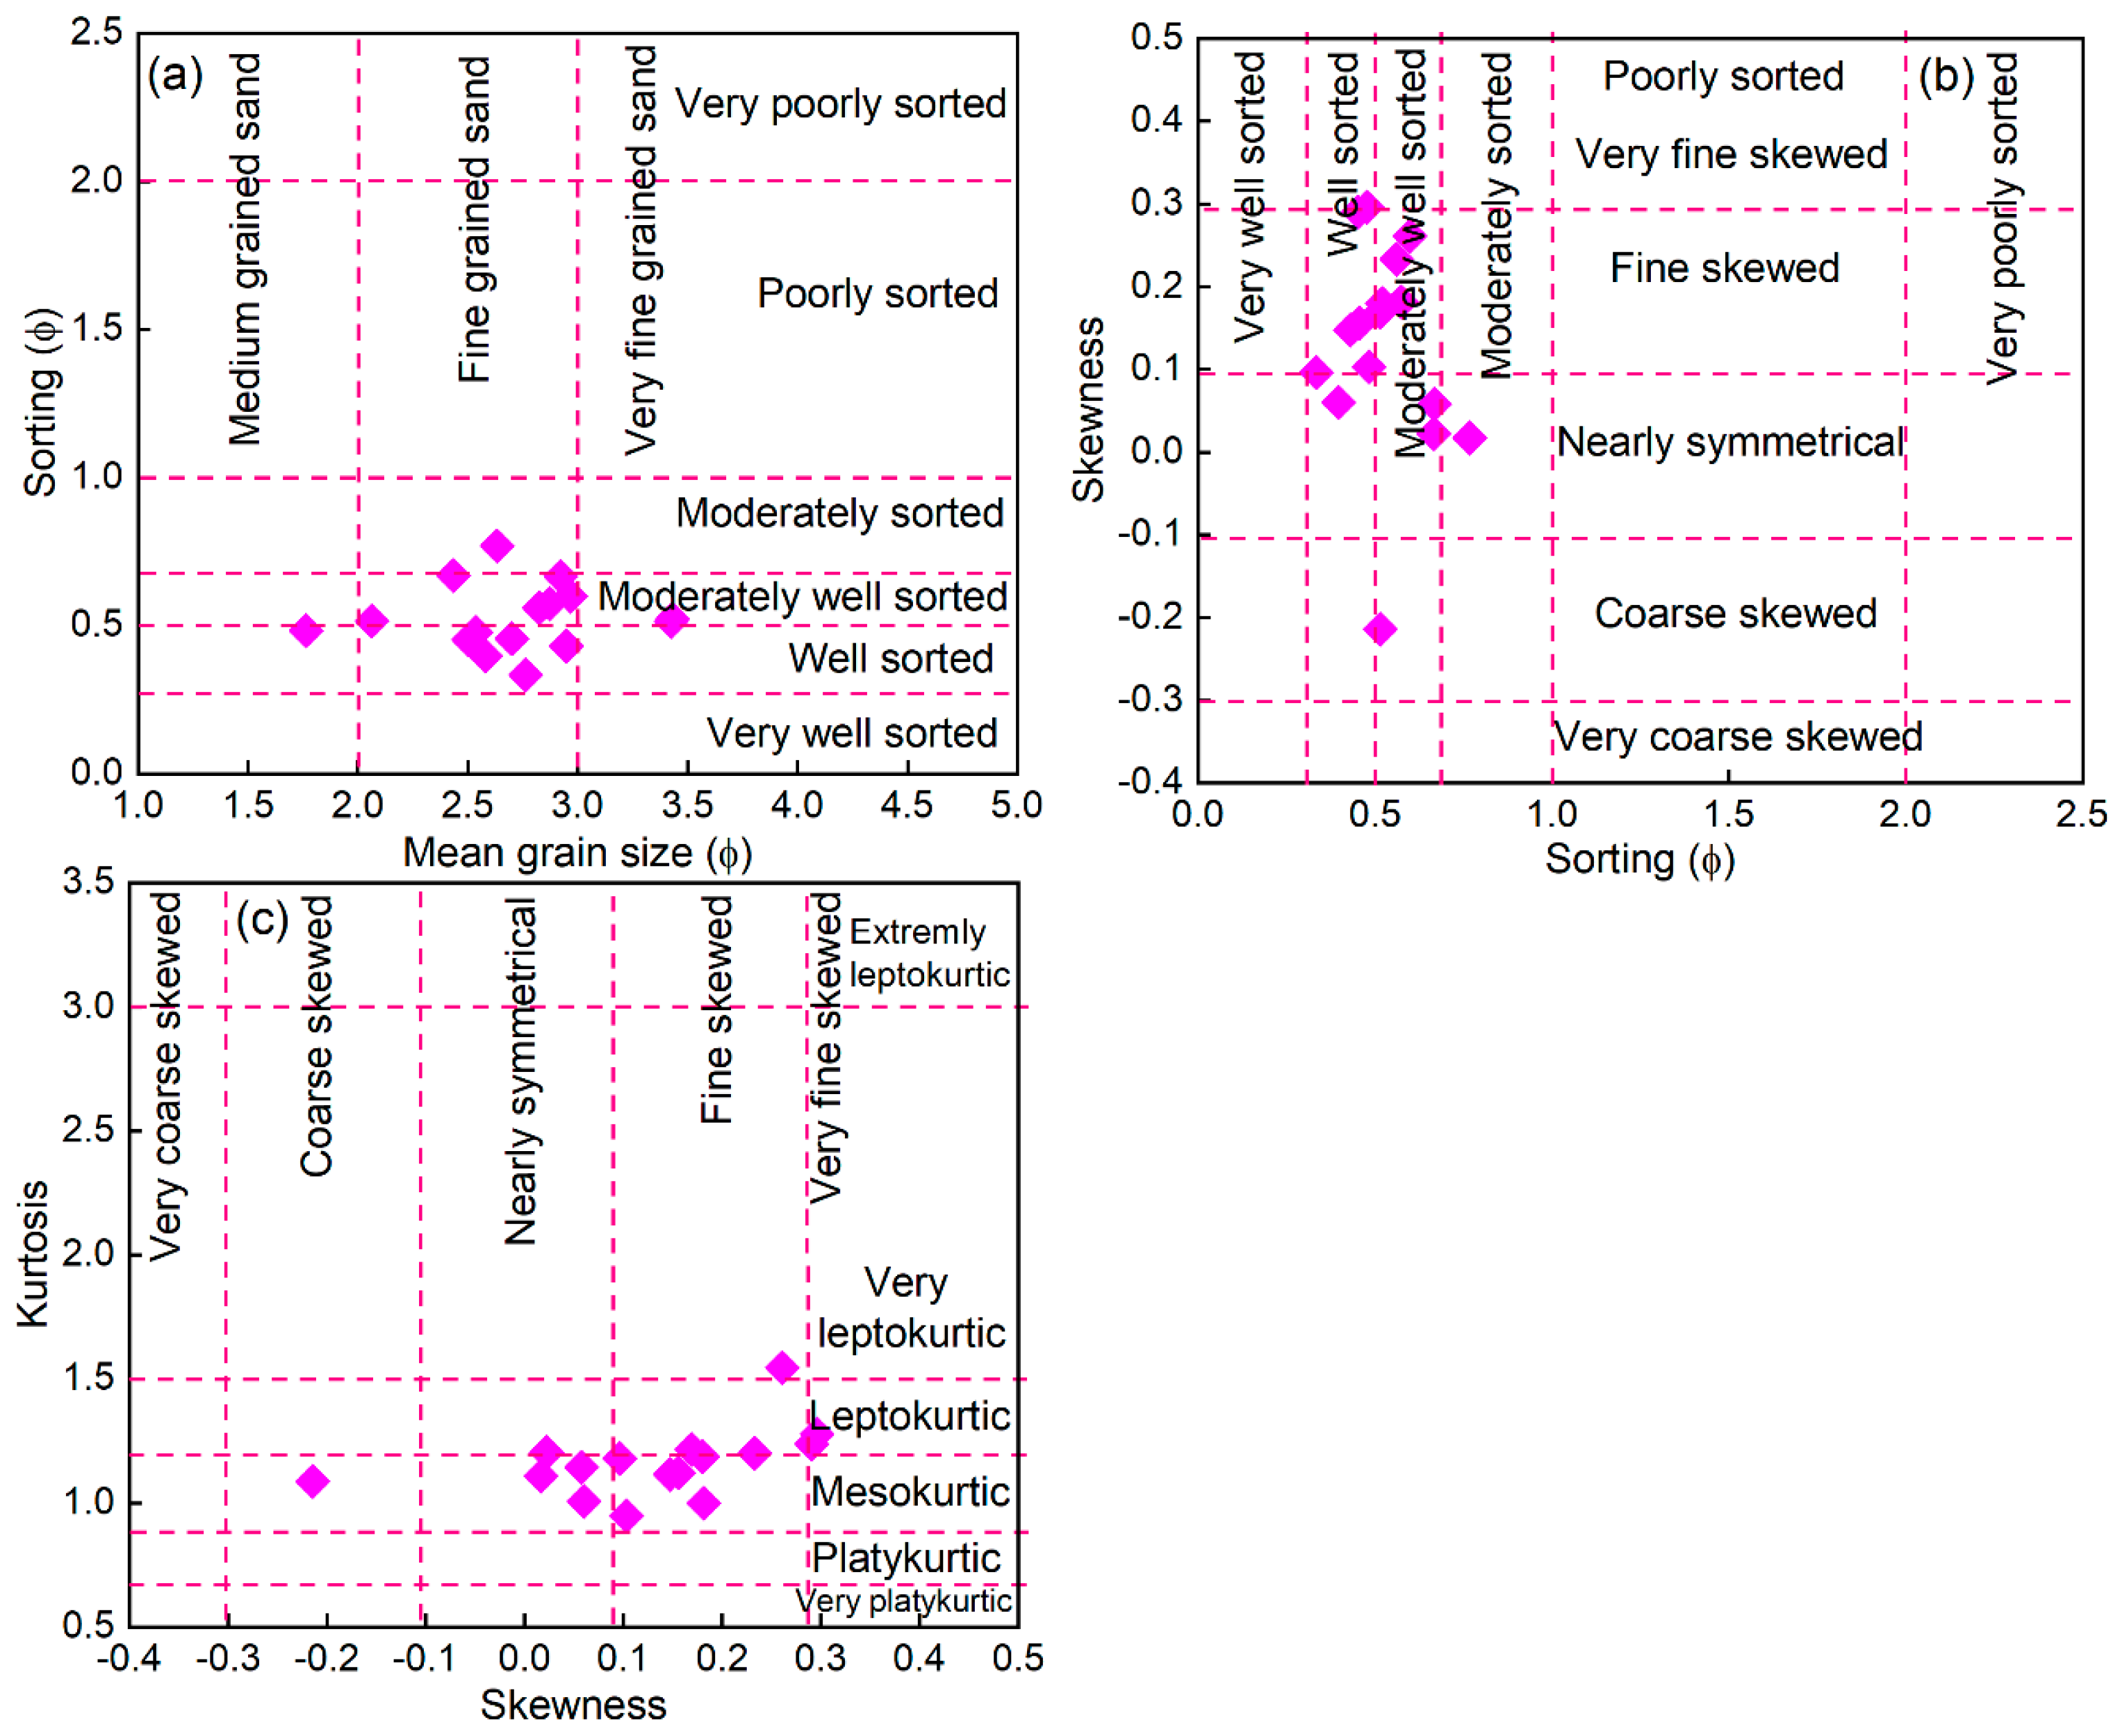
Table 4 shows the grain size parameters measured for all 16 sediment samples. The mean values range from 1.77 ϕ (GS-5), indicating a medium sand grain size to a fine-to-very fine grain size, 3.43 ϕ (GS-2), with a calculated average across all samples of 2.67 ϕ (medium-to-fine grain size). Similarly, the median values range from 1.75 to 3.38 ϕ (average of 2.66 ϕ). Skewness measures the asymmetry of the curve of the frequency distribution, where kurtosis is the measure of peakedness or flatness of samples related to normal distribution. Positively skewed sediments are often found in low-energy environments, while negatively skewed sediments can be associated with higher energy conditions that favor the transport of finer particles. Kurtosis in sediments is linked to the degree of reworking and the mixture of sediment populations, with low kurtosis indicating subequal populations. Kurtosis values range from 0.95 (GS-5) to 1.55 (GS-4) (average 1.17). Moreover, skewness ranges from −0.21 (GS-13) to 0.30 (GS-9 and GS-15) (average 0.14) and sorting values (standard deviation) vary between 0.33 (GS-14) and 0.77 ϕ (GS-7) (average 0.52 ϕ). These findings indicate the dominance of fine sand with medium sand, which could reflect a downstream fining trend and consistent unidirectional flow conditions. Additionally, the fine-skewed-to-near-symmetrical and mesokurtic-to-leptokurtic distributions (see below) are suggestive of a continuous input of finer particles during transport and variable depositional energy [41,42,43] (Figure 6).
The sediment transport and depositional processes of the sediments were interpreted using grain size parameters, including mean vs. sorting, sorting vs. skewness, sorting vs. kurtosis, and skewness vs. kurtosis (Figure 7). The sediments are predominantly fine-to-medium sand, characterized by moderately-to-well-sorted textures (Figure 7a), consistent with fluvial environments [44,45]. Sorting vs. skewness and skewness vs. kurtosis plots reveal a wide range from fine-skewed to coarse-skewed distributions, though most samples are fine-skewed and mesokurtic, indicating unidirectional flow and continuous fine particle deposition [46,47] (Figure 7b,c).
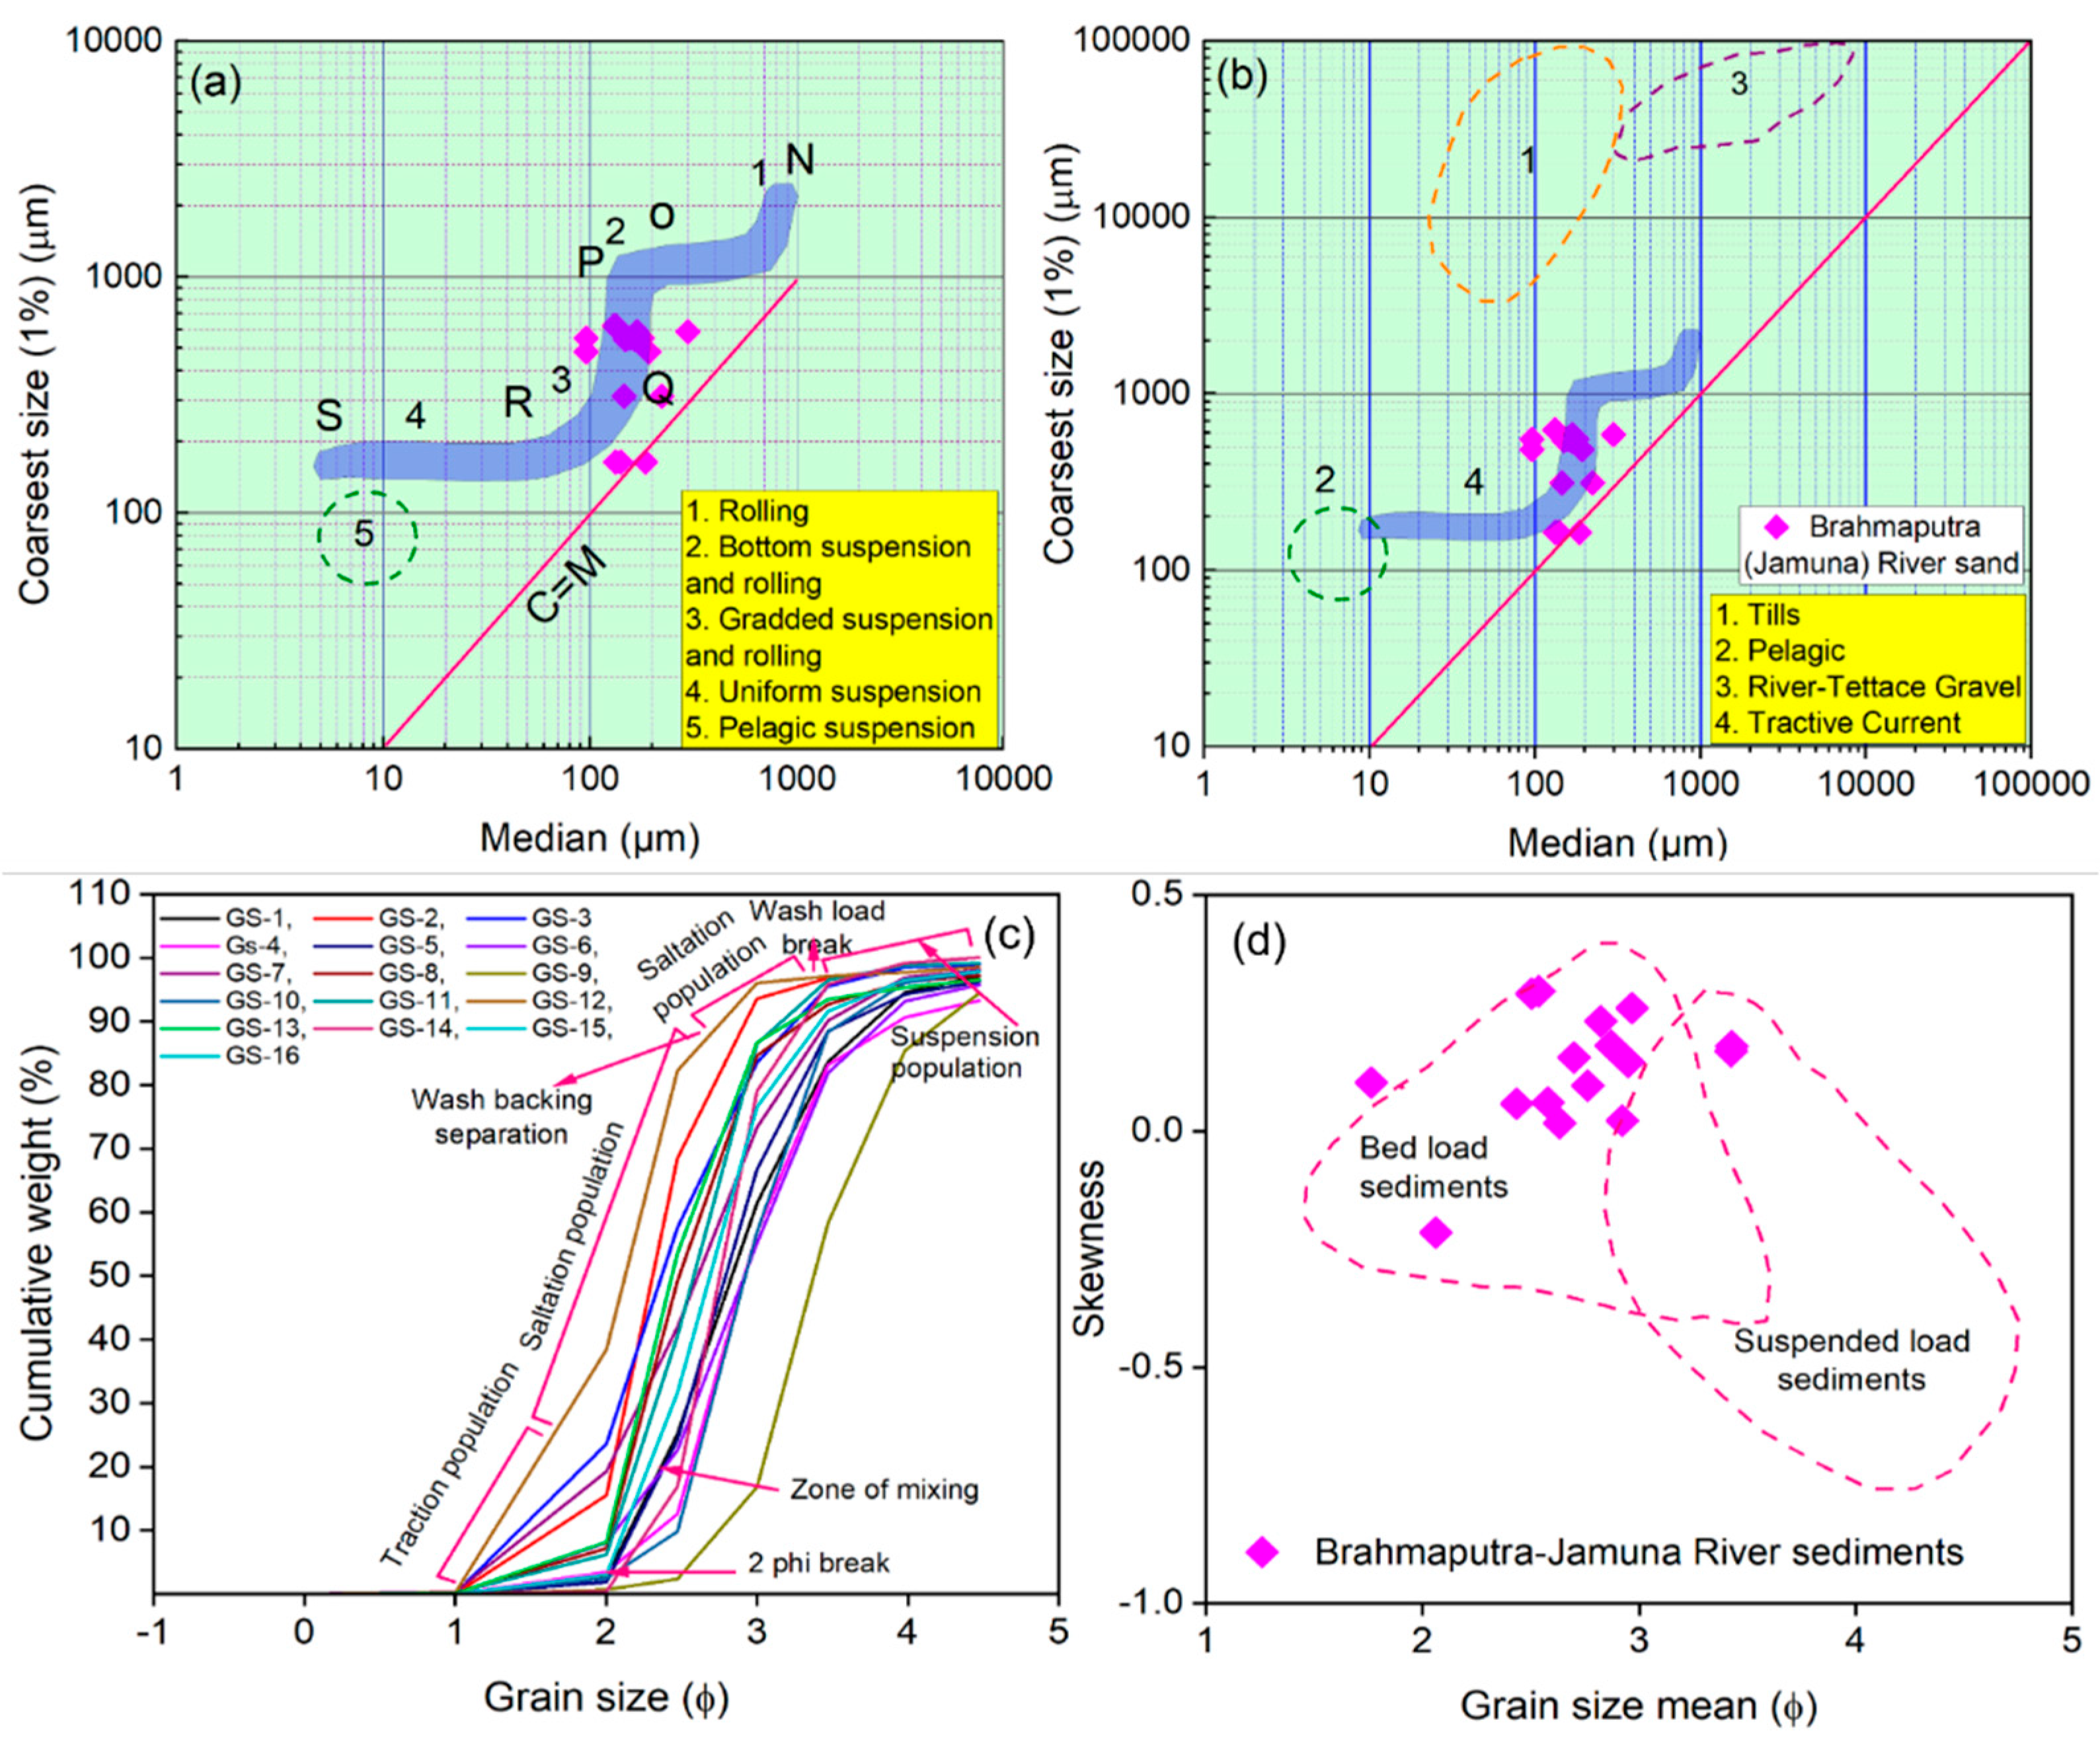
Figure 8a,b indicates that most samples were deposited through fluvial or river-dominated processes, likely influenced by the admixture of finer particles from adjacent floodplain areas characteristic of stream-driven deposition. Additionally, Figure 8c,d show that the samples cluster between river channel and over bank deposits, suggesting contributions from both active flow and fine sediment influx [49,50]. This interpretation aligns with the present study, as evidenced by the well-to-moderately well sorting and the wide range of fine skewness observed in the sediment samples, which reflect the variable hydrodynamic conditions characteristic of fluvial environments.
The CM pattern analysis (Figure 9a,b) reveals that sediment transport in the Brahmaputra–Jamuna River was predominantly facilitated by graded suspension and rolling mechanisms, indicative of high-energy conditions. In contrast, Figure 9c demonstrates a clear dominance of saltation, with subordinate contributions from suspension and traction, suggesting variability in transport dynamics. Furthermore, Figure 9d illustrates the predominance of bedload transport, accompanied by minor suspended load input. Collectively, these findings imply that sediment deposition within the Brahmaputra–Jamuna River system was primarily controlled by fluctuating hydrodynamic regimes, characterized by saltation and bedload transport as the major depositional processes [52].

5.4. PCA and Cluster Analysis

The PCA biplot (Figure 10a) demonstrates that the first two principal components together explain 74.36% of the total variance in grain size parameters, with PC1 accounting for 46.56% and PC2 for 27.79%, corresponding to eigenvalues of 1.86 and 1.11, respectively. Specifically, PC1 is primarily controlled by strong positive loadings of kurtosis (0.59), skewness (0.58), and mean grain size (0.56), while sorting exhibits a negligible contribution (0.01) (Table 5). Therefore, this axis represents a gradient from fine-grained, well-sorted, and mesokurtic to leptokurtic sediments, with low PC1 scores typically reflecting high-energy depositional environments. In contrast, PC2 is strongly influenced by sorting (0.91), with minor contributions from kurtosis (0.20) and mean grain size (0.11), thus reflecting the degree of textural uniformity [55]. Notably, high PC2 scores (GS-3, GS-7, and GS-8) are associated with poorly sorted sediments deposited under fluctuating hydrodynamic conditions. Conversely, low PC2 scores (GS-14 to GS-16) correspond to well-sorted sediments typically formed in shallow water environments [56].
Furthermore, K-means clustering, performed on the PCA-reduced dimensions (Figure 10b), identifies two statistically distinct sediment groups. Specifically, Cluster 1 (black), occupying the lower-left quadrant of the PCA space, comprises finer-grained (grain size mean: 2.36 ϕ), poorly sorted (sorting: 0.54), and less-skewed (0.09) sediments with lower kurtosis (1.11). As such, these characteristics are consistent with dynamic depositional environments. In comparison, Cluster 2 (red), situated in the upper-right PCA quadrant, includes coarser (2.98 ϕ), well-sorted (0.52), and fine-skewed (0.16) sediments with slightly higher kurtosis (1.20), indicative of deposition under more stable, high-energy conditions [55,56]. Overall, the PCA and K-means clustering analyses collectively reinforce the effectiveness of multivariate statistical techniques in supporting the interpretation of spatial and hydrodynamic variability within the Brahmaputra–Jamuna River system.

5.5. Discriminant Function Analysis

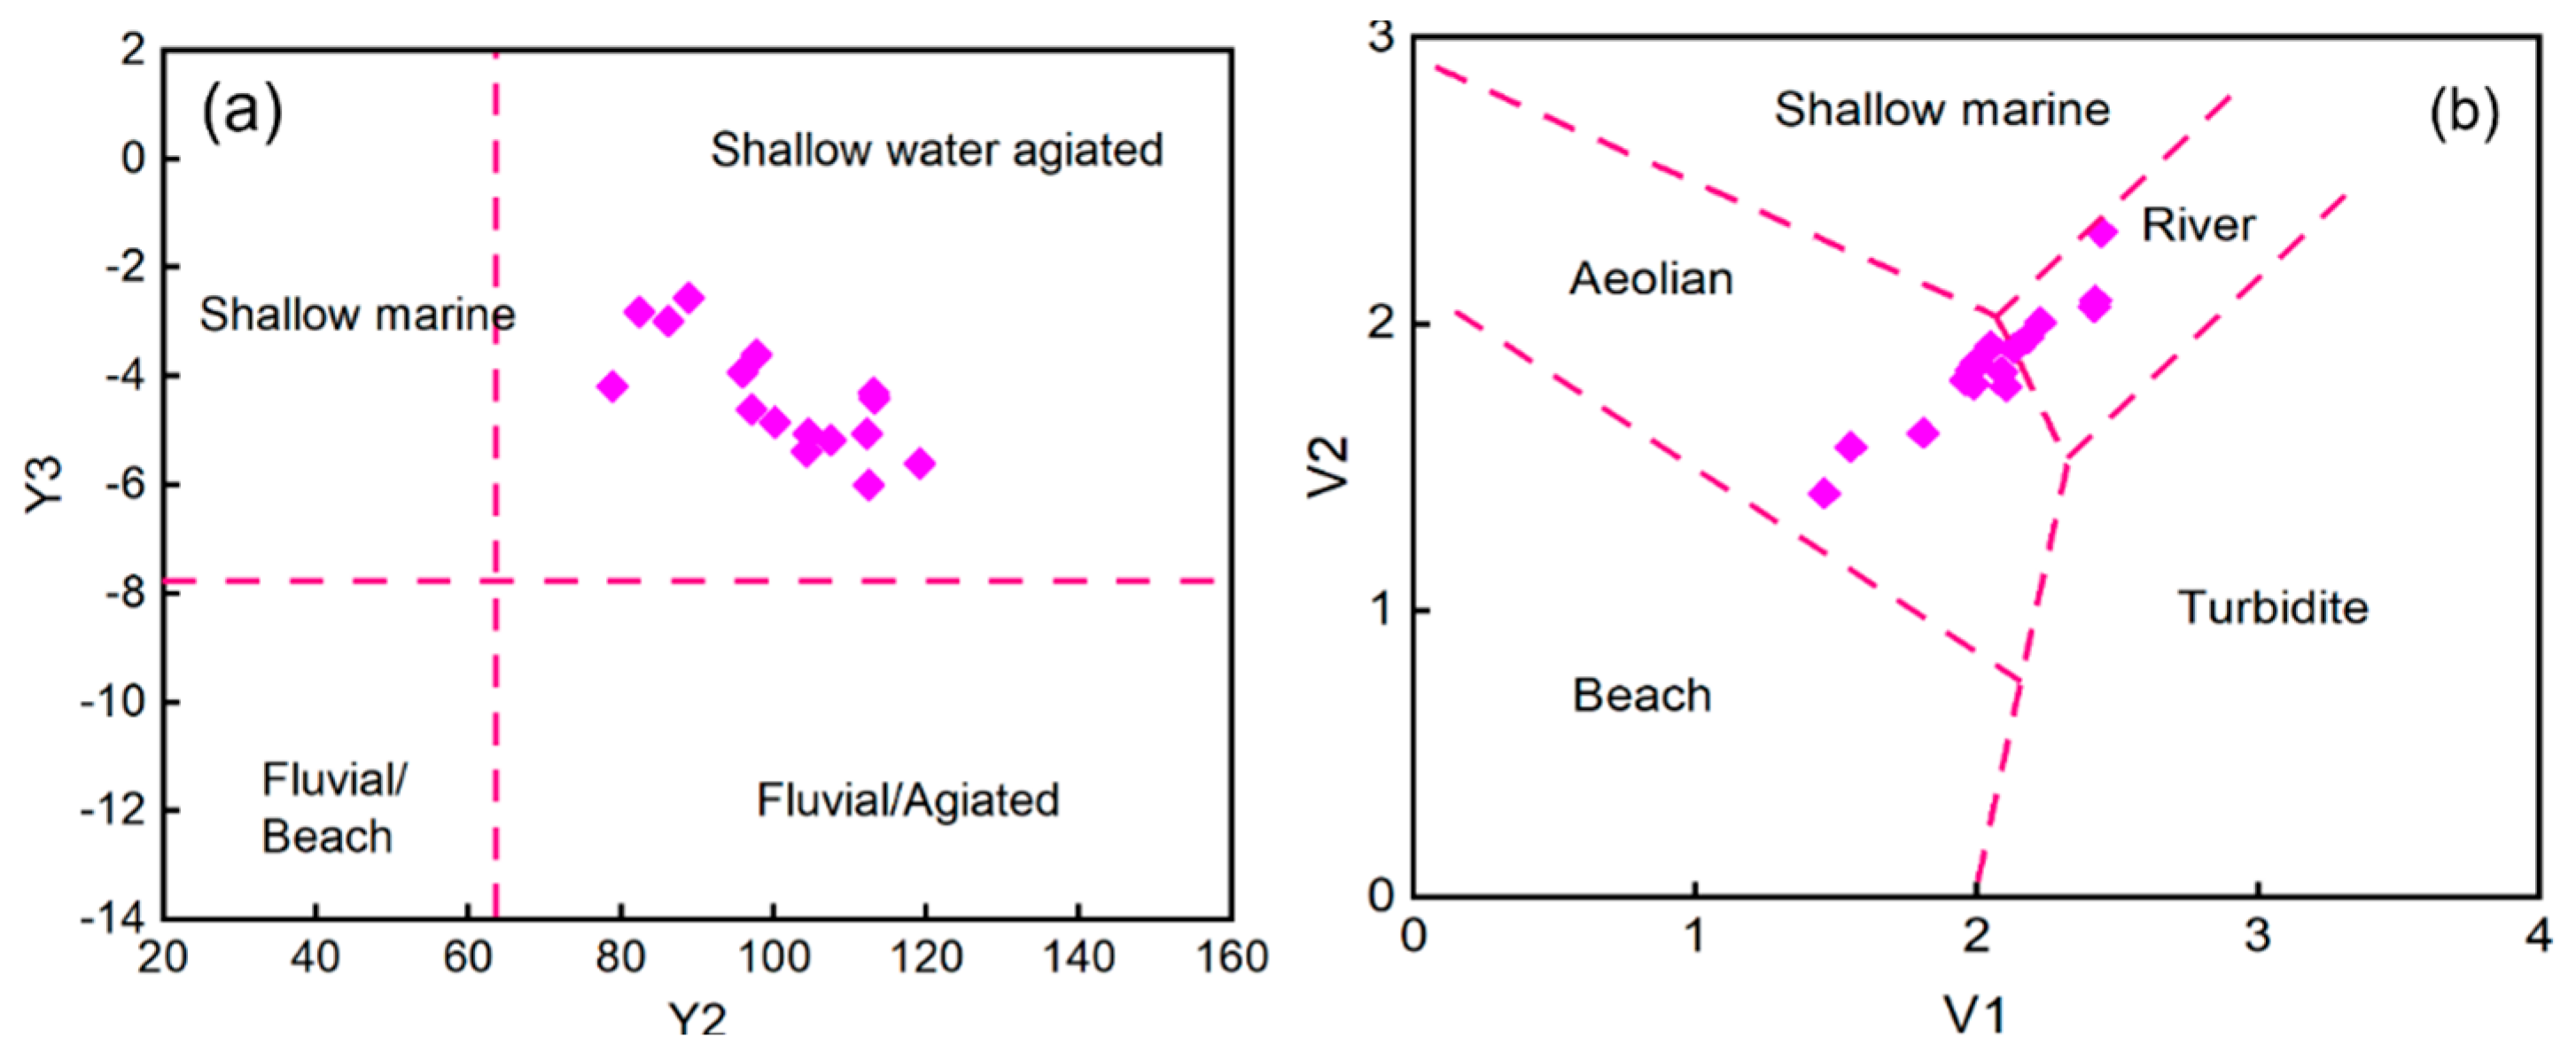
The discrimination functions Y2 and Y3 were calculated according to [57], using the following equations, incorporating the V1 and V2 discriminant functions:
Y 2 = 15.6534 M z + 65.7091 δ 2 + 18.1071 S k 1 + 18.5043 K G
Y 3 = 0.2852 M Z 8.7604 δ 2 4.8932 S k 1 + 0.0428 K G
V 1 = 0.48048 M Z + 0.6231 δ 2 + 0.40602 S k 1 + 0.44413 K G
V 2 = 0.24523 M Z + 0.45905 δ 2 + 0.15715 S k 1 + 0.89931 K G
( M Z = Grain size mean , δ = Sorting , S k 1 = Skewness and K G = Kurtosis )
The Y2 values range from 78.82 to 119.12, with an average of 100.81, all exceeding the threshold value of 63.37, and thereby indicating deposition within a shallow water environment. In contrast, the Y3 values range from −6.01 to −2.56, with an average of −4.41, which is above the reference threshold of −7.42, thus suggesting a significant fluvial or deltaic influence on sedimentation [58] (Figure 11a). Furthermore, the V1 values range from 1.457 to 2.442 (average 2.057), while the V2 values range from 1.409 to 2.323 (average 1.871), collectively pointing to riverine and turbiditic depositional settings [59] (Figure 11b). These geochemical discriminant function indices provide robust evidence supporting a dynamic sedimentary regime governed by the fluvio-deltaic processes of the Brahmaputra–Jamuna River system.

5.6. Effect of Grain Morphology

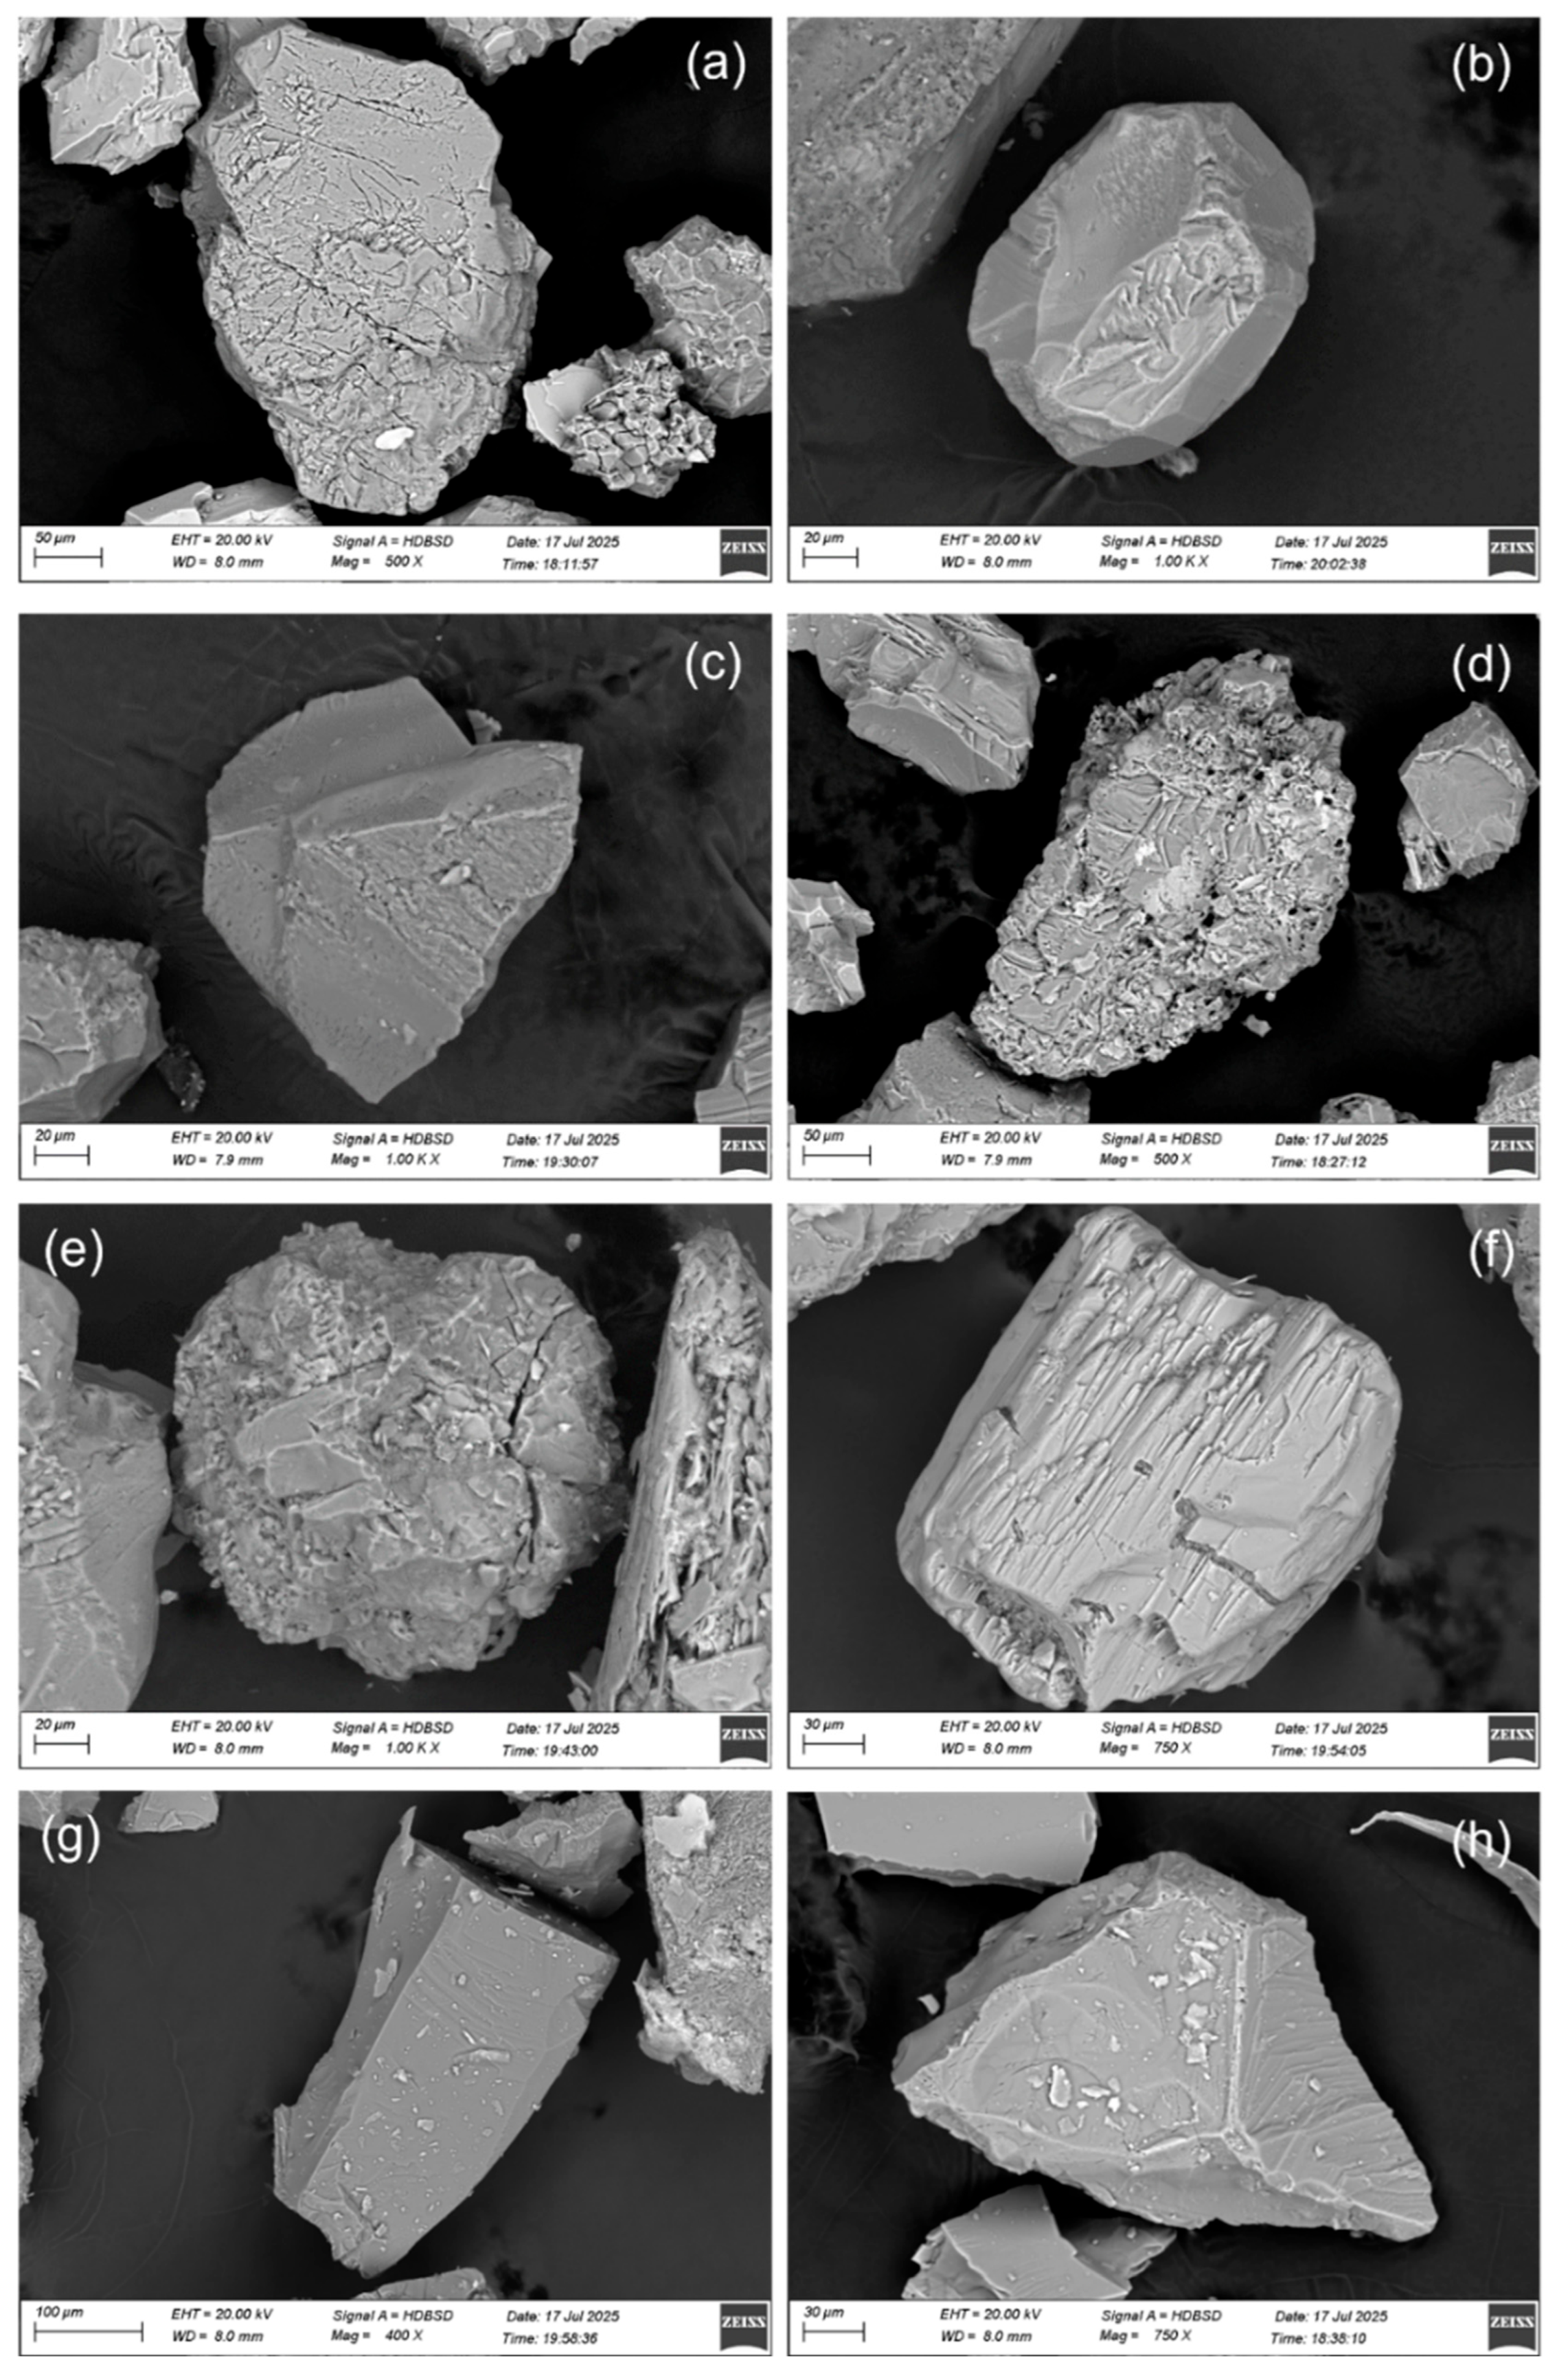
Figure 12 illustrates the scanning electron micrographs of representative sediment grains from the Brahmaputra–Jamuna River system, emphasizing their morphological features and weathering characteristics: (a) angular grain exhibiting conchoidal fractures; (b) rounded grain edge with sub-parallel microcracks; (c) sub-angular grain displaying abraded edges and pronounced V-shaped patterns; (d) highly fractured blocky grain with solution pits; (e) grain characterized by turbulent fractures; (f) sub-angular particle showing linear abrasion marks; (g) sharp angular grain with distinct fracture planes; and (h) angular grain featuring linear grooving. The angular to sub-angular morphologies have moderately abraded edges, indicating minimal transport distances and intense mechanical weathering [59,60]. Furthermore, blocky and shattered textures indicate intense mechanical disintegration during bedload transport, which is consistent with grain size analysis. Minor surface abrasion and roughness further point to chemical weathering resulting from intermittent exposure of sediment grains to subaerial or aqueous environments [61,62]. Overall, the dominance of angular, texturally immature grains reflects sediment derivation from proximal Himalayan sources, high sediment flux, and rapid depositional cycles characteristic of tectonically active fluvial systems [26,47].
According to Mishra et al. [59] and Wang and Wu [60], sediment grains are transported by fluvial processes that commonly exhibit microtextural features such as conchoidal fractures, turbulent fractures, grooves, solution pits, and V-shaped marks, resulting from combined mechanical abrasion and chemical alteration. The occurrence of sub-angular to sub-rounded grains alongside V-shaped marks and conchoidal fractures is indicative of high-energy subaqueous environments, rapid transport distances, and episodic chemical weathering [63,64]. These observations align with the present investigation of Brahmaputra–Jamuna River sediments.

6. Conclusions

This study presents an integrated geochemical, mineralogical, and multivariate statistical analysis of the Brahmaputra–Jamuna River basin, revealing a dynamic and energy-variable depositional environment influenced by fluvial and deltaic processes. Quantitative mineral phase analyses show that the sediments are dominantly composed of quartz and mica, with minor feldspar, rutile, zircon, and iron oxides, indicating moderate chemical weathering and derivation from Himalayan metamorphic sources. Geochemical data indicates moderate weathering conditions (CIA = 62.93), which is consistent with both passive and active continental margin settings. Grain size analysis reveals that the sediment is composed of fine-to-medium sand, with well-to-moderately well sorting, fine-skewed and mesokurtic-to-leptokurtic sediment distributions, suggesting rapid transport under the fluvial process. CM diagram analysis indicates sediment transport by graded suspension, saltation, and bedload mechanisms. PC1 (46.56%) and PC2 (27.79%) values highlight a fine-grained, well-sorted sediment, reflecting high-energy depositional environments. Discriminant function indices, Y2 (78.82 to 119.12), Y3 (−6.01 to −2.56), V1 (1.457 to 2.442), and V2 (1.409 to 2.323), suggest a fluvio-deltaic, shallow-water deposition with turbiditic influence. Grain morphologies, such as angular to sub-angular, conchoidal fractures, V-shaped marks, and solution pits, indicate intense mechanical weathering and high-energy fluvial transport of the sediment.
Although this study enhances understanding of sediment texture, mineral composition, and geochemical characteristics for interpreting depositional processes and paleoenvironmental conditions, future research should incorporate high-resolution remote sensing, long-term monitoring, and numerical modeling to better capture seasonal and interannual variability in sediment dynamics.

Author Contributions

Writing—review and editing, methodology, formal analysis, data curation, and conceptualization, M.G.M.; Writing—review and editing, visualization, validation, and supervision, M.A.R.; Writing—review and editing, visualization, formal analysis, data curation, and validation, M.I.P.; Formal analysis and data curation, A.T.; Writing—review and editing, formal analysis, and data curation, M.S.A.; Writing—review and editing, visualization, formal analysis, and data curation, M.N.H.; Formal analysis and data curation, H.; Writing—review and editing, M.S.R. (Md. Shohel Rana); Writing—review and editing, M.I.S.H.; Writing—review and editing and formal analysis, M.H.M.; Data curation, M.S.R. (Md. Shazzadur Rahman). All authors have read and agreed to the published version of the manuscript.

Funding

This research received no external funding.

Data Availability Statement

Data is contained within the article.

Acknowledgments

The authors gratefully acknowledge the Bangladesh Council of Scientific and Industrial Research (BCSIR) for providing research funding, laboratory facilities, and technical support essential to this study. The contributions of all co-authors are sincerely appreciated for their active involvement in conceptualization, methodology development, data acquisition, analysis, and manuscript preparation. Cameron Davidson (CSIRO is thanked for preparing the polished blocks for EPMA examination, and Nick Wilson (CSIRO) is thanked for collecting the EPMA map data.

Conflicts of Interest

The authors declare that they have no known competing financial interests or personal relationships that could have appeared to influence the work reported in this paper.

References

  1. Sengupta, S. Geological and Geophysical Studies in Western Part of Bengal Basin, India. AAPG Bull. 1966, 50, 1001–1017. [Google Scholar] [CrossRef]
  2. Coleman, J.M. Brahmaputra river: Channel processes and sedimentation. Sediment. Geol. 1969, 3, 129–239. [Google Scholar] [CrossRef]
  3. Kuehl, S.A.; Hariu, T.M.; Moore, W.S. Shelf sedimentation off the Ganges-Brahmaputra River system: Evidence for sediment bypassing to the Bengal fan. Geology 1989, 17, 1132. [Google Scholar] [CrossRef]
  4. Bandyopadhyay, S.; Das, S.; Kar, N.S. Avulsion of the Brahmaputra in Bangladesh during the 18th–19th century: A review based on cartographic and literary evidence. Geomorphology 2021, 384, 107696. [Google Scholar] [CrossRef]
  5. Paul, B.K. Flood research in Bangladesh in retrospect and prospect: A review. Geoforum 1997, 28, 121–131. [Google Scholar] [CrossRef]
  6. Thorne, C.R.; Russell, A.P.G.; Alam, M.K. Planform pattern and channel evolution of the Brahmaputra River, Bangladesh. Geol. Soc. Lond. Spec. Publ. 1993, 75, 257–276. [Google Scholar] [CrossRef]
  7. Datta, D.K.; Subramanian, V. Texture and mineralogy of sediments from the Ganges-Brahmaputra-Meghna river system in the Bengal Basin, Bangladesh and their environmental implications. Environ. Geol. 1997, 30, 181–188. [Google Scholar] [CrossRef]
  8. Rahman, A.; Das, S.C.; Pownceby, M.I.; Tardio, J.; Alam, S.; Zaman, M.N. Geochemistry of Recent Brahmaputra River Sediments: Provenance, Tectonics, Source Area Weathering and Depositional Environment. Minerals 2020, 10, 813. [Google Scholar] [CrossRef]
  9. Morgan, J.P.; McIntire, W.G. Quaternary Geology of The Bengal Basin, East Pakistan and India. Geol. Soc. Am. Bull. 1959, 70, 319. [Google Scholar] [CrossRef]
  10. Khan, H.R.; Liu, J.; Liu, S.; Seddique, A.A.; Cao, L.; Rahman, A. Clay mineral compositions in surface sediments of the Ganges-Brahmaputra-Meghna River system of Bengal Basin, Bangladesh. Mar. Geol. 2019, 412, 27–36. [Google Scholar] [CrossRef]
  11. Islam, K.; Rahman, M. Establishing morpho-dynamic baseline for flow-sediment management of a tidal river in the Ganges–Brahmaputra–Meghna Delta system through field measurement. Environ. Fluid Mech. 2024, 24, 265–286. [Google Scholar] [CrossRef]
  12. Mostafa, G.; Islam, S.U.; Mondal, D.; Adham, I.; Rana, S.; Hossain, I.S.; Rahman, A.; Biswas, P.K.; Zaman, M.N.; Uddin, R. Analysis of river dynamics and neotectonics of the Jamuna River using satellite and seismic data in Madarganj Upazila of Jamalpur District, Bangladesh. Nat. Hazards 2024, 121, 7123–7148. [Google Scholar] [CrossRef]
  13. Das, J.D.; Saraf, A.K. Technical Note: Remote sensing in the mapping of the Brahmaputra/Jamuna River channel patterns and its relation to various landforms and tectonic environment. Int. J. Remote Sens. 2007, 28, 3619–3631. [Google Scholar] [CrossRef]
  14. Goodbred, S.L.; Kuehl, S.A.; Steckler, M.S.; Sarker, M.H. Controls on facies distribution and stratigraphic preservation in the Ganges–Brahmaputra delta sequence. Sediment. Geol. 2003, 155, 301–316. [Google Scholar] [CrossRef]
  15. Sarker, M.H.; Thorne, C.R.; Aktar, M.N.; Ferdous, R. Morpho-dynamics of the Brahmaputra–Jamuna River, Bangladesh. Geomorphology 2014, 215, 45–59. [Google Scholar] [CrossRef]
  16. Sarker, M.H.; Huque, I.; Alam, M.; Koudstaal, R. Rivers, chars and char dwellers of Bangladesh. Int. J. River Basin Manag. 2003, 1, 61–80. [Google Scholar] [CrossRef]
  17. Shamsudduha, M.; Taylor, R.G.; Chandler, R.E. A generalized regression model of arsenic variations in the shallow groundwater of Bangladesh. Water Resour. Res. 2015, 51, 685–703. [Google Scholar] [CrossRef]
  18. Mostafa, M.; Rahman, M.; Biswas, P.K.; Islam, A.R.M.T.; Uddin, M.; Hayatullah; Hossen, M.; Nuruzzaman; Yousuf, A.; Mustak, H.; et al. Mineralogy and provenance of red clay soils in Barind and Madhupur clay formations, Bangladesh: Implications for tectonic setting and chemical weathering. J. Asian Earth Sci. X 2025, 14, 100200. [Google Scholar] [CrossRef]
  19. Baki, A.B.M.; Gan, T.Y. Riverbank migration and island dynamics of the braided Jamuna River of the Ganges–Brahmaputra basin using multi-temporal Landsat images. Quat. Int. 2012, 263, 148–161. [Google Scholar] [CrossRef]
  20. Rahman, R. River dynamics—A geospatial analysis of Jamuna (Brahmaputra) River in Bangladesh during 1973–2019 using Landsat satellite remote sensing data and GIS. Environ. Monit. Assess. 2022, 195, 96. [Google Scholar] [CrossRef]
  21. Folk, R.L.; Ward, W.C. Brazos River bar: A study in the significance of grain size parameters. J. Sediment. Res. 1957, 27, 3–26. [Google Scholar] [CrossRef]
  22. Harrowfield, I.R.; MacRae, C.M.; Wilson, N.C. Chemical imaging in electron microprobe. In Proceedings of the 27th Ann MAS Meeting, New York, NY, USA, 1993; Microbeam Analysis Society, 1993; pp. 547–548. Available online: https://www.researchgate.net/publication/284662498_Chemical_imaging_in_electron_microprobes (accessed on 10 November 2025).
  23. Wilson, N.C.; MacRae, C.M. An Automated Hybrid Clustering Technique Applied to Spectral Data Sets. Microsc. Microanal. 2005, 11, 434–435. [Google Scholar] [CrossRef]
  24. Torpy, A.; Wilson, N.C.; MacRae, C.M.; Pownceby, M.I.; Biswas, P.K.; Rahman, A.; Zaman, M.N. Deciphering the Complex Mineralogy of River Sand Deposits through Clustering and Quantification of Hyperspectral X-Ray Maps. Microsc. Microanal. 2020, 26, 768–792. [Google Scholar] [CrossRef] [PubMed]
  25. Armstrong-Altrin, J.S. Evaluation of two multidimensional discrimination diagrams from beach and deep-sea sediments from the Gulf of Mexico and their application to Precambrian clastic sedimentary rocks. Int. Geol. Rev. 2014, 57, 1446–1461. [Google Scholar] [CrossRef]
  26. Biswas, P.K.; Alam, M.S.; Hasan, A.M.; Ahmed, S.S.; Zaman, M.N. Geochemical signatures of recent bar deposits in the Tista river, Bangladesh: Implications to provenance, paleoweathering and tectonics. J. Nepal Geol. Soc. 2020, 60, 1–20. [Google Scholar] [CrossRef]
  27. Bhuiyan, M.A.H.; Rahman, M.J.J.; Dampare, S.B.; Suzuki, S. Provenance, tectonics and source weathering of modern fluvial sediments of the Brahmaputra–Jamuna River, Bangladesh: Inference from geochemistry. J. Geochem. Explor. 2011, 111, 113–137. [Google Scholar] [CrossRef]
  28. Rahman, M.J.J.; Suzuki, S. Geochemistry of sandstones from the Miocene Surma Group, Bengal Basin, Bangladesh: Implications for Provenance, tectonic setting and weathering. Geochem. J. 2007, 41, 415–428. [Google Scholar] [CrossRef]
  29. Singh, P. Major, trace and REE geochemistry of the Ganga River sediments: Influence of provenance and sedimentary processes. Chem. Geol. 2009, 266, 242–255. [Google Scholar] [CrossRef]
  30. McLennan, S.M.; Hemming, S.; McDaniel, D.K.; Hanson, G.N.; Johnsson, M.J.; Basu, A. Geochemical approaches to sedimentation, provenance, and tectonics. Geol. Soc. Am. Spec. Pap. 1993, 284, 21–40. [Google Scholar] [CrossRef]
  31. Singh, B.P.; Andotra, D.S.; Kumar, R. Provenance of the lower Tertiary mudrocks in the Jammu Sub-Himalayan Zone, Jammu and Kashmir State (India), NW Himalaya and its tectonic implications. Geosci. J. 2000, 4, 1–9. [Google Scholar] [CrossRef]
  32. Biswas, P.K.; Ahmed, S.S.; Pownceby, M.I.; Haque, N.; Alam, S.; Zaman, M.N.; Rahman, M.A. Heavy mineral resource potential of Tista river sands, Northern Bangladesh. Appl. Earth Sci. 2018, 127, 94–105. [Google Scholar] [CrossRef]
  33. Madukwe, H.Y. Provenance and tectonic setting of the Eocene Nanka Sandstone, Anambra Basin, Nigeria. Trans. R. Soc. S. Afr. 2019, 75, 54–63. [Google Scholar] [CrossRef]
  34. Negendank, J.F.W.; Emmermann, R.; Krawczyk, R.; Mooser, F.; Tobschall, H.; Werle, D.J. Geological and geochemical investigations on the eastern Trans-Mexican Volcanic Belt. Geofis. Int. 1985, 24, 477–575. [Google Scholar] [CrossRef]
  35. Herron, M.M. Geochemical Classification of Terrigenous Sands and Shales from Core or Log Data. J. Sediment. Res. 1988, 58, 820–829. [Google Scholar] [CrossRef]
  36. Roser, B.; Korsch, R. Provenance signatures of sandstone-mudstone suites determined using discriminant function analysis of major-element data. Chem. Geol. 1988, 67, 119–139. [Google Scholar] [CrossRef]
  37. Hossain, H.; Roser, B.; Kimura, J.-I. Petrography and whole-rock geochemistry of the Tertiary Sylhet succession, northeastern Bengal Basin, Bangladesh: Provenance and source area weathering. Sediment. Geol. 2010, 228, 171–183. [Google Scholar] [CrossRef]
  38. Roser, B.P.; Korsch, R.J. Determination of Tectonic Setting of Sandstone-Mudstone Suites Using SiO2 Content and K2O/Na2O Ratio. J. Geol. 1986, 94, 635–650. [Google Scholar] [CrossRef]
  39. Ohta, T.; Arai, H. Statistical empirical index of chemical weathering in igneous rocks: A new tool for evaluating the degree of weathering. Chem. Geol. 2007, 240, 280–297. [Google Scholar] [CrossRef]
  40. Quade, J.; Cater, J.M.; Ojha, T.P.; Adam, J.; Harrison, T.M. Late Miocene environmental change in Nepal and the northern Indian subcontinent: Stable isotopic evidence from paleosols. GSA Bull. 1995, 107, 1381–1397. [Google Scholar] [CrossRef]
  41. Folk, R.L. A Review Of Grain-Size Parameters. Sedimentology 1966, 6, 73–93. [Google Scholar] [CrossRef]
  42. Hakro, A.A.A.D.; Xiao, W.; Mastoi, A.S.; Yan, Z.; Samtio, M.S.; Rajper, R.H. Grain size analysis of the Oligocene Nari Formation sandstone in the Laki Range, southern Indus Basin, Pakistan: Implications for depositional setting. Geol. J. 2021, 56, 5440–5451. [Google Scholar] [CrossRef]
  43. Hossain, S.; Aziz, T.; Shahriar, S.; Ritu, A.A. Heavy Mineral Analysis of Jamuna River Sediments, Bangladesh. J. Geol. Soc. India 2021, 97, 470–480. [Google Scholar] [CrossRef]
  44. Bokade, V.V.; Yadav, G.D. Heteropolyacid supported on montmorillonite catalyst for dehydration of dilute bio-ethanol. Appl. Clay Sci. 2011, 53, 263–271. [Google Scholar] [CrossRef]
  45. Kanhaiya, S.; Singh, B.; Tripathi, M.; Sahu, S.; Tiwari, V. Lithofacies and particle-size characteristics of late Quaternary floodplain deposits along the middle reaches of the Ganga river, central Ganga plain, India. Geomorphology 2017, 284, 220–228. [Google Scholar] [CrossRef]
  46. Sayem, A.S.M.; Guo, Z.; Wu, H.; Zhang, C.; Yang, F.; Xiao, G.; He, Z. Sedimentary and geochemical evidence of Eocene climate change in the Xining Basin, northeastern Tibetan Plateau. Sci. China Earth Sci. 2018, 61, 1292–1305. [Google Scholar] [CrossRef]
  47. Singh, M.; Singh, I.B.; Müller, G. Sediment characteristics and transportation dynamics of the Ganga River. Geomorphology 2007, 86, 144–175. [Google Scholar] [CrossRef]
  48. Wentworth, C.K. A Scale of Grade and Class Terms for Clastic Sediments. J. Geol. 1922, 30, 377–392. [Google Scholar] [CrossRef]
  49. Greco, A.; Spencer, D.A. The interaction between channel geometry, water flow, sediment transport and deposition in braided rivers. Geol. Soc. Lond. Spec. Publ. 1993, 75, 13–71. [Google Scholar] [CrossRef]
  50. Ribeiro, M.L.; Blanckaert, K.; Roy, A.G.; Schleiss, A.J. Flow and sediment dynamics in channel confluences. J. Geophys. Res. Earth Surf. 2012, 117, 2011JF002171. [Google Scholar] [CrossRef]
  51. Stewart, J.H.B. Sedimentary Reflections of Depositional Environment in San Miguel Lagoon, Baja California, Mexico. AAPG Bull. 1958, 42, 2567–2618. [Google Scholar] [CrossRef]
  52. Rahman, A.; Biswas, P.K.; Zaman, M.N.; Miah, Y.; Hossain, T.; Huq, S.I. Characterization of the sand of Brahmaputra River of Bangladesh. Bangladesh J. Sci. Ind. Res. 2012, 47, 167–172. [Google Scholar] [CrossRef]
  53. Passega, R. Significance of CM diagrams of sediments deposited by suspensions. Sedimentology 1977, 24, 723–733. [Google Scholar] [CrossRef]
  54. Visher, G.S. Grain Size Distributions and Depositional Processes. J. Sediment. Res. 1969, 39, 1074–1106. [Google Scholar] [CrossRef]
  55. Alsharhan, A.S.; El-Sammak, A.A. Grain-Size Analysis and Characterization of Sedimentary Environments of The United Arab Emirates Coastal Area. J. Coast. Res. 2004, 202, 464–477. [Google Scholar] [CrossRef]
  56. dos Santos, C.B.; Corrêa, I.S.; Weschenfelder, J.; Stone, J.R. Grain-size parameters and diatom records as indicators of environmental changes along the southern Brazilian coastal plain. Int. J. Sediment Res. 2025, 40, 269–285. [Google Scholar] [CrossRef]
  57. Sahu, B.K. Depositional Mechanisms from the Size Analysis of Clastic Sediments. J. Sediment. Res. 1964, 34, 73–83. [Google Scholar] [CrossRef]
  58. Ghaznavi, A.A.; Quasim, M.; Ahmad, A.; Ghosh, S.K. Granulometric and facies analysis of Middle–Upper Jurassic rocks of Ler Dome, Kachchh, western India: An attempt to reconstruct the depositional environment. Geologos 2019, 25, 51–73. [Google Scholar] [CrossRef]
  59. Mishra, S.; Hota, R.N.; Nayak, B. Grain size analysis and an overview of the sedimentary processes in Chandrabhaga beach, east coast of India. Arab. J. Geosci. 2024, 17, 214. [Google Scholar] [CrossRef]
  60. Li, J.; Wang, X.; Wu, W. Quantification of SEM quartz grain identifying the depositional environment. Arab. J. Geosci. 2021, 14, 1006. [Google Scholar] [CrossRef]
  61. Mahaney, W.C.; Stewart, A.; Kalm, V. Quantification of SEM microtextures useful in sedimentary environmental discrimination. Boreas 2001, 30, 165–171. [Google Scholar] [CrossRef]
  62. Vos, K.; Vandenberghe, N.; Elsen, J. Surface textural analysis of quartz grains by scanning electron microscopy (SEM): From sample preparation to environmental interpretation. Earth-Sci. Rev. 2014, 128, 93–104. [Google Scholar] [CrossRef]
  63. Costa, P.; Andrade, C.; Mahaney, W.; da Silva, F.M.; Freire, P.; Freitas, M.; Janardo, C.; Oliveira, M.; Silva, T.; Lopes, V. Aeolian microtextures in silica spheres induced in a wind tunnel experiment: Comparison with aeolian quartz. Geomorphology 2013, 180–181, 120–129. [Google Scholar] [CrossRef]
  64. Madhavaraju, J.; Lee, Y.I.; Armstrong-Altrin, J.S.; Hussain, S.M. Microtextures on detrital quartz grains of upper Maastrichtian-Danian rocks of the Cauvery Basin, Southeastern India: Implications for provenance and depositional environments. Geosci. J. 2006, 10, 23–34. [Google Scholar] [CrossRef]
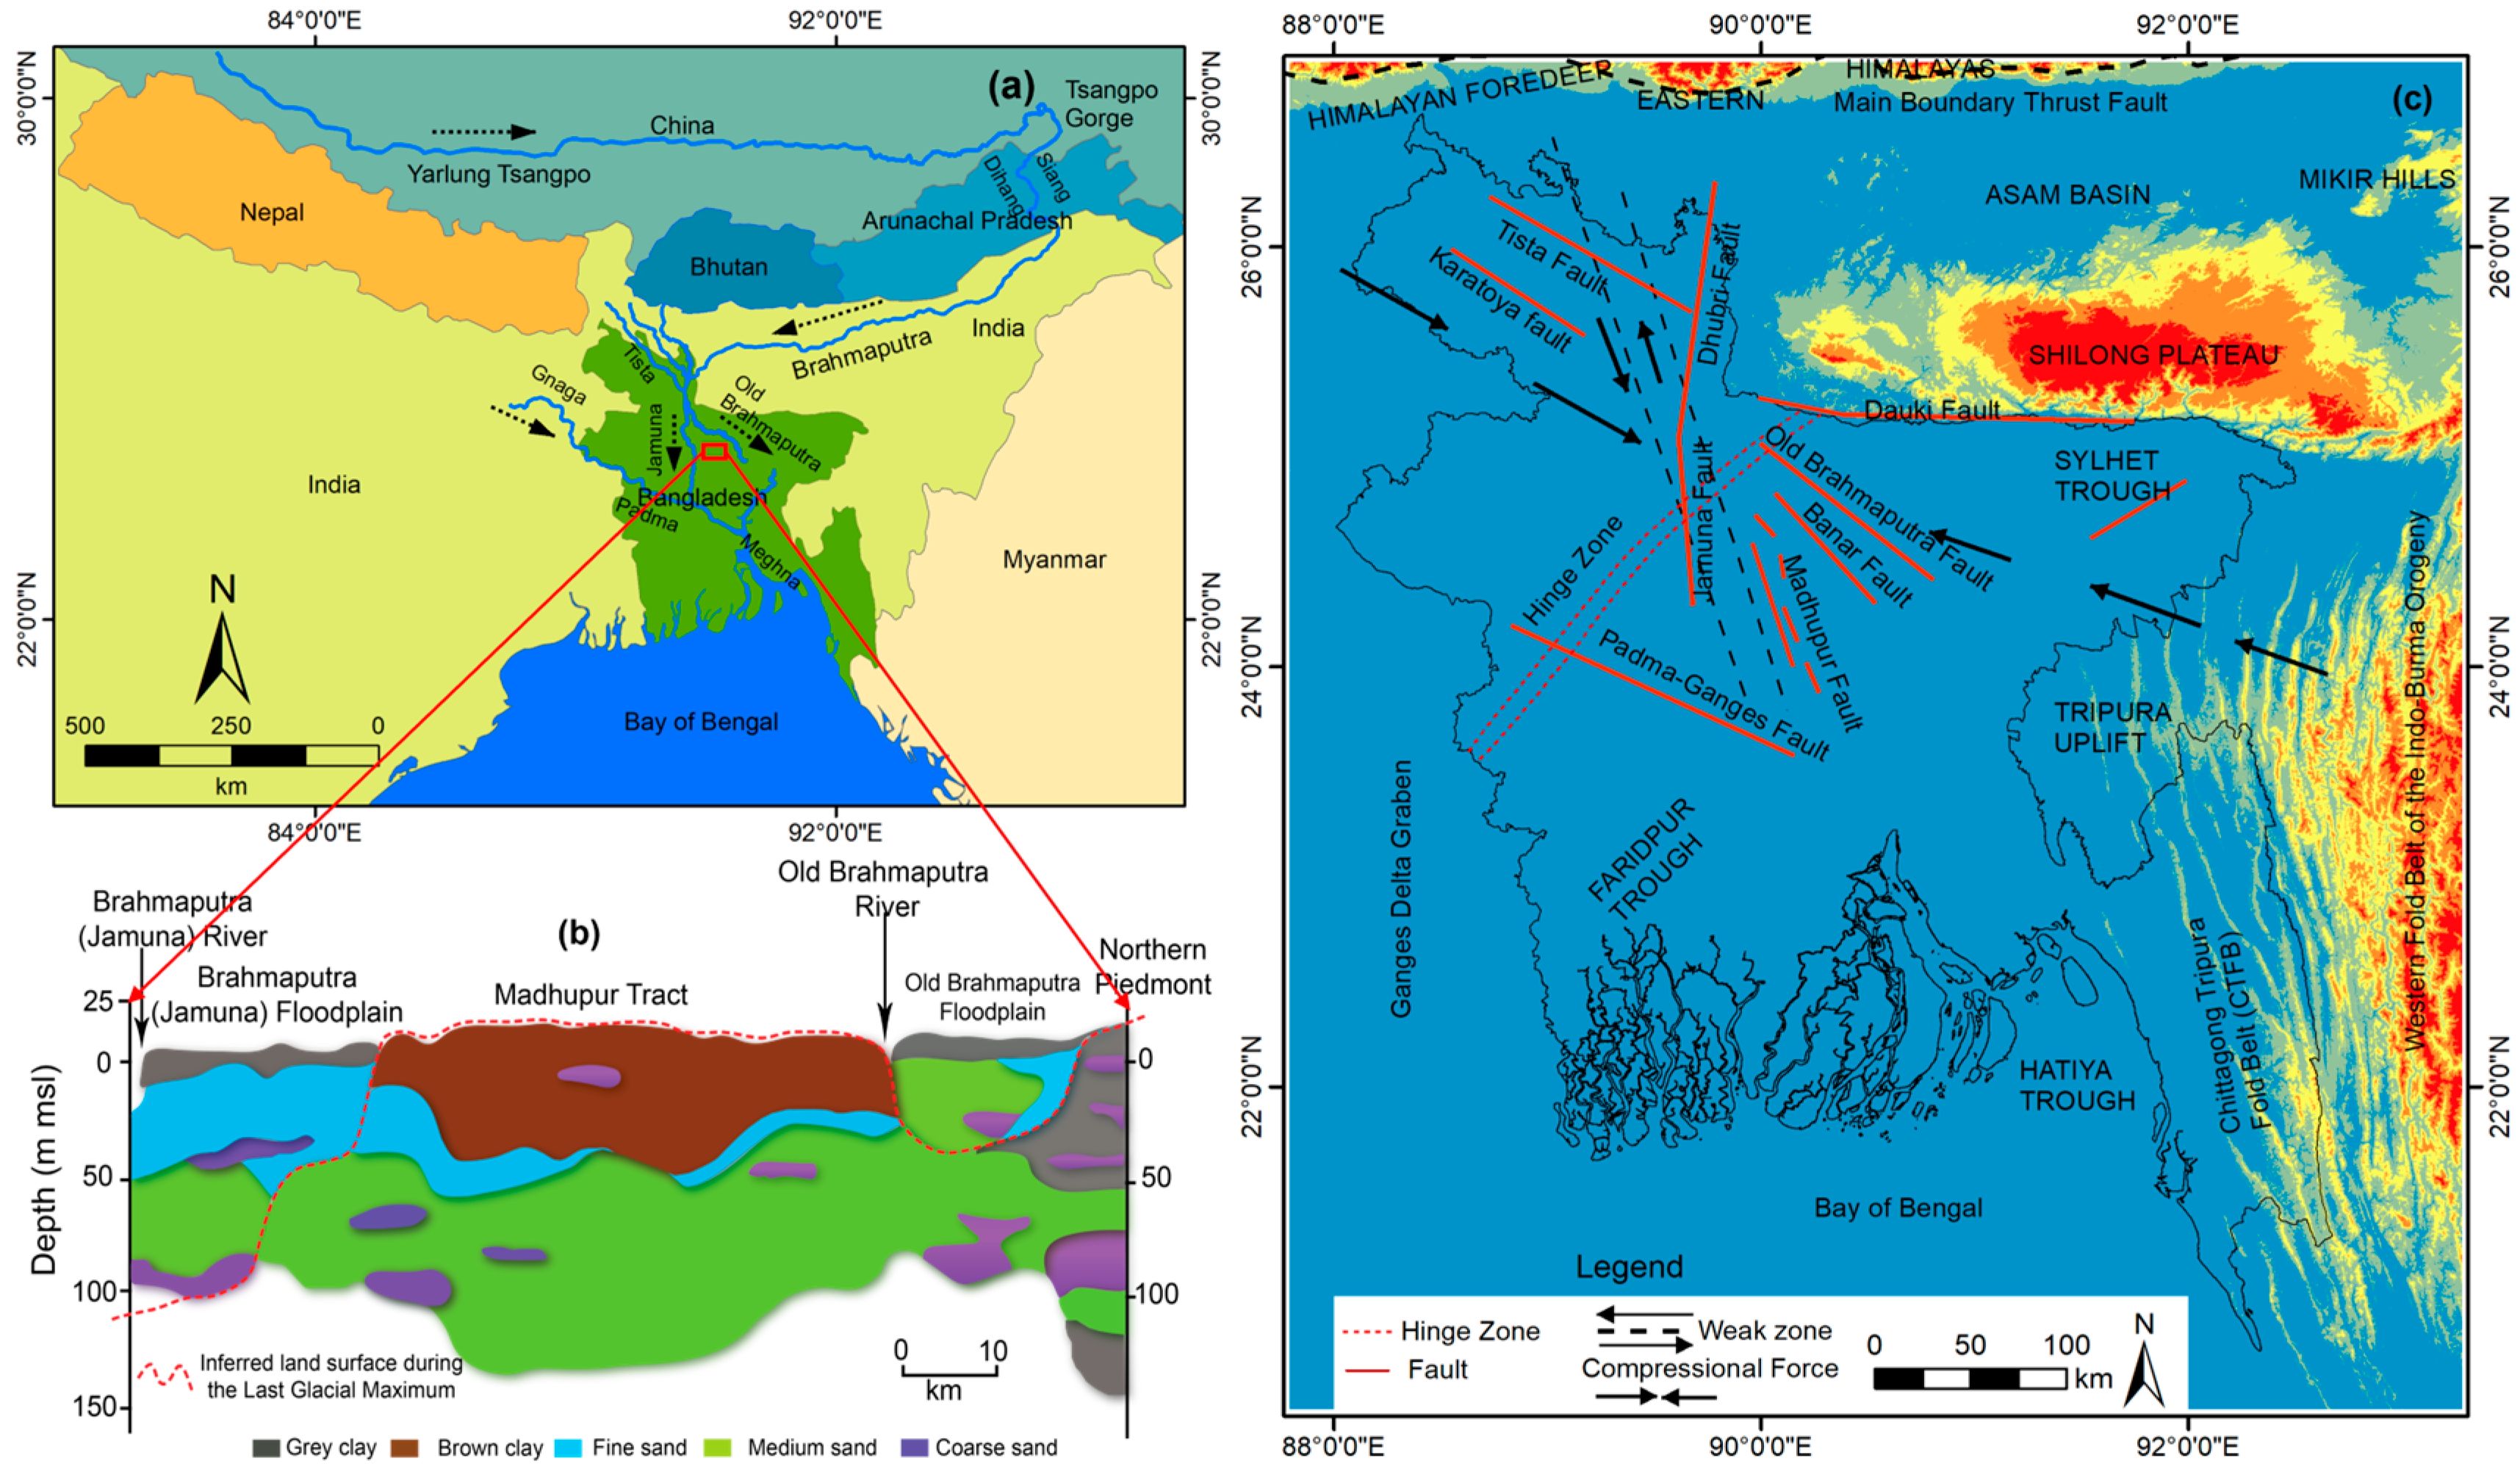
Figure 1. (a) Geographical catchment area of the Brahmaputra River. (b) Lithological cross-section of the north-central region of Bangladesh [17]. (c) Generalized tectonic framework and active fault systems of Bangladesh [12,18].
Minerals 15 01192 g001
Figure 2. (a) Location of sample sites within the study area along the Brahmaputra–Jamuna River system. (b) DEM image showing major rivers (green) within Bangladesh. (c) Sample sites overlain on a Landsat 8 image. Vegetation is shown in green, the main river sediments (largely floodplain and sandbank) are shown in pink and the main river channels shown in blue. The red square shown in (b) indicates the location of the study area.
Minerals 15 01192 g002
Figure 3. X-ray diffraction (XRD) patterns of representative sediment samples from the Brahmaputra–Jamuna River. Sample numbers refer to specific sample sites shown in Figure 2. Abbreviations used: Mca = mica; Qz = quartz; Fsp = feldspar; Rt = rutile; Grt = garnet; Zrn = zircon; Mnz = monazite; Mag = magnetite; and Amp = amphibole.
Minerals 15 01192 g003
Figure 4. EPMA map results showing the distribution and textures of major and minor phases within the following samples: (a) GS-1, (b) GS-2, (c) GS-3, and (d) GS-4. “Other” typically refers to 10–15 phases present at low abundance (<1% by area), which were identified but not displayed to maintain Figure legibility. Also, note that the label Mica refers to “micaceous phases”, including muscovite and biotite subgroups. The complete list of phases identified in the samples is provided in Table 1.
Minerals 15 01192 g004
Figure 6. Distribution of (a) mean grain size (ϕ), (b) kurtosis, (c) skewness, and (d) sorting (ϕ) of the Brahmaputra–Jamuna River sediments. In each plot the dashed line indicates the mean value of the parameter for all sediments.
Minerals 15 01192 g006
Figure 7. The interrelationships among grain size parameters: (a) mean grain size vs. sorting; (b) sorting vs. skewness; and (c) skewness vs. kurtosis [48]. Pink symbols indicate data points for the 16 sediment samples.
Minerals 15 01192 g007
Figure 8. Bivariate plots of the Brahmaputra–Jamuna River sediments: (a) median (ϕ) vs. skewness [51]; (b) grain size mean (ϕ) vs. sorting (ϕ); (c) sorting (ϕ) vs. grain size mean (ϕ); and (d) skewness vs. sorting (ϕ) [43]. Pink symbols indicate data points for the 16 sediment samples.
Minerals 15 01192 g008
Figure 9. (a,b) CM diagram of the sediments [53]. (c) Grain size mean (ϕ) vs. cumulative (wt%) diagram [54]. (d) Grain size mean (ϕ) vs. skewness [47]. Pink symbols indicate data points for the 16 sediment samples.
Minerals 15 01192 g009
Figure 10. (a) Principal component analysis (PCA) biplot of grain size parameters from sediment samples, showing the loadings of sorting, mean grain size, kurtosis, and skewness, along with sample scores; (b) K-means clustering of sediment samples based on the first two principal components (PC1 and PC2); (c) scree plot of eigenvalues indicating the relative contribution of the first four principal components and supporting the selection of PC1 and PC2 for interpretation.
Minerals 15 01192 g010
Figure 11. (a) Plot of Y2 vs. Y3; (b) multigroup multivariate discrimination function plot (V1 vs. V2) for Brahmaputra–Jamuna River sediments. Pink symbols indicate data points for the 16 sediment samples.
Minerals 15 01192 g011
Figure 12. Secondary electron (SE) images of representative sediment grains from the Brahmaputra–Jamuna River: (a) angular grain with conchoidal fractures; (b) rounded edge grain with sub-parallel microcracks; (c) sub-angular grain with abraded edges and deep V-pattern; (d) solution pits, with highly fractured blocky grain; (e) grain with turbulent fractures; (f) sub-angular particle with linear abrasion marks; (g) sharp angular grain with fracture planes; and (h) angular grain with linear grooving.
Minerals 15 01192 g012
Table 1. Modal mineralogy (area%) on samples GS-1, GS-2, GS-3, and GS-4, determined via EPMA mapping.
MineralNormalized Area (%)
Sample GS-1Sample GS-2Sample GS-3Sample GS-4
Quartz51.754.651.251.6
Feldspars20.427.424.320.6
Amphiboles6.72.03.66.1
Micaceous phases2.64.55.36.2
Garnets (Fe, Ca, Mg, Mn)5.63.85.43.9
Epidote4.41.42.63.4
Pyroxenes2.71.51.21.2
Fluorapatite0.460.662.10.52
Titanite (Al)0.770.640.471.4
Fe oxide1.10.320.530.83
Ilmenite0.770.841.101.10
Al2SiO50.830.180.590.93
Allanite-(Ce)0.320.760.17
Chlorite0.370.470.270.66
Zircon0.640.410.380.19
Mg Fe aluminosilicate 0.64
Titanomagnetite0.120.340.0840.14
Ca aluminosilicate (K-rich)0.036 0.260.20
Rutile0.0960.150.160.26
Monazite0.20 0.06<0.001
Dolomite (Fe-rich) 0.00390.0490.17
Ca Fe silicate 0.16
Xenotime (HREE)0.12
Forsterite (Fe)0.095 0.013
Table 3. Pearson correlation coefficients among major element oxides.
Oxides SiO2Al2O3Fe2O3TTiO2K2OMgOCaONa2OP2O5MnOZnOCr2O3
SiO21.00
Al2O3−0.821.00
Fe2O3T−0.990.731.00
TiO2−0.790.330.861.00
K2O−0.160.680.02−0.421.00
MgO−0.960.830.910.720.231.00
CaO0.02−0.570.110.54−0.97−0.071.00
Na2O0.83−0.85−0.79−0.53−0.41−0.760.271.00
P2O5−0.870.680.880.730.020.760.09−0.871.00
MnO−0.52−0.050.640.89−0.720.360.77−0.240.561.00
ZnO−0.930.650.960.80−0.070.850.18−0.700.880.651.00
Cr2O3−0.580.780.520.090.580.47−0.59−0.630.61−0.070.561.00
Table 4. Statistical parameters of the Brahmaputra–Jamuna River sediments.
SampleMean (ϕ)KurtosisSkewnessSorting (ϕ)Median (ϕ)Remarks
GS-12.871.000.180.572.83Fine sand, mesokurtic, moderately sorted, slightly fine-skewed.
GS-23.431.180.180.523.38Very fine sand, leptokurtic, moderately sorted, fine-skewed.
GS-32.441.140.060.672.38Fine sand, mesokurtic, poorly sorted, near symmetrical.
GS-42.971.550.260.602.91Fine sand, leptokurtic, poorly sorted, fine-skewed.
GS-51.770.950.100.481.75Medium sand, mesokurtic, moderately sorted, slightly fine-skewed.
GS-62.831.200.230.562.78Fine sand, leptokurtic, moderately sorted, fine-skewed.
GS-72.631.110.020.772.60Fine sand, mesokurtic, poorly sorted, nearly symmetrical.
GS-82.921.200.020.672.91Fine sand, leptokurtic, poorly sorted, symmetrical.
GS-92.541.280.300.482.48Fine sand, leptokurtic, moderately sorted, strongly fine-skewed.
GS-103.431.220.170.513.38Very fine sand, leptokurtic, moderately sorted, fine-skewed.
GS-112.951.110.150.432.93Fine sand, mesokurtic, well-sorted, fine-skewed.
GS-122.581.010.060.402.57Fine sand, mesokurtic, well-sorted, near symmetrical.
GS-132.061.09–0.210.522.17Medium sand, mesokurtic, moderately sorted, coarse-skewed.
GS-142.761.180.100.332.75Fine sand, leptokurtic, well-sorted, slightly fine-skewed.
GS-152.501.240.290.452.43Fine sand, leptokurtic, moderately sorted, fine-skewed.
GS-162.701.120.160.462.68Fine sand, mesokurtic, moderately sorted, fine-skewed.
Table 5. Principal component loadings and K-means cluster classification of sediment parameters.
ParametersPC1PC2Cluster 1Cluster 2
Mean grain size0.560.112.362.98
Kurtosis0.590.201.111.20
Skewness0.58−0.340.090.16
Sorting0.010.910.540.52
Eigen value1.861.11
Variance explained46.5627.79
Cumulative variance46.5674.36
Disclaimer/Publisher’s Note: The statements, opinions and data contained in all publications are solely those of the individual author(s) and contributor(s) and not of MDPI and/or the editor(s). MDPI and/or the editor(s) disclaim responsibility for any injury to people or property resulting from any ideas, methods, instructions or products referred to in the content.