Abstract
Late-Archean seawater functioned as a vast, redox-tuned colloidal system for which its kinetics were largely governed by the surface chemistry of silica–iron nanoparticles. By reproducing Archean seawater (≈0.7 M ionic strength, 25 °C) in laboratory anoxic-to-mildly oxic reactors, the ζ potential (zeta-potential(ζ)) of silica–iron nanoparticles was investigated, and we tracked how transient O2 pulses (≤9 mg L−1) regulated it. The zeta (ζ) potential was applied as the key diagnostic parameter to quantify both the sign of the ζ potential and the colloidal stability of simulated silica–iron particles in dispersion. Under strictly anoxic conditions, silica colloids (SiO2(aq)) exhibit a persistently negative ζ potential (ζ ≈ −25 mV) in the simulated seawater (pH 6.5), arising from deprotonated silanol groups (≡Si–O−). Upon the addition of Fe2+, the inner-sphere complexation of ferrous ions on SiO2 colloids partially replaces ≡Si–O− with ≡Si–O–Fe+/≡Si–O–Fe–OH sites; the net negative charge density at the outer Stern plane nevertheless increases, and the ζ potential shifts from −25 mV to −30 mV. As the simulated seawater was oxygenated, the dissolved and surface-bound Fe2+ ions were oxidized to Fe3+, causing the ζ potential to exceed −30 mV. This study demonstrates that Fe2+–silica interactions generate electrostatic destabilization, suspending micron-scale aggregates and thus modulating the solubility and speciation of SiO2 in early oceans. Also, transient micro-oxic pulses are shown to shift silica–iron colloids between metastable aggregation and dispersion by modulating their ζ potential. Subsequently, AFM and TEM were used to characterize the morphological changes in the colloidal particles from the liquid state to the dry state. Furthermore, infrared and XPS analyses were conducted on the colloidal samples. These findings provide certain reference significance for reconstructing the chemical evolution process of seawater in the Late-Archean period and for understanding the factors influencing the silicon–iron cycle of seawater in the Late-Archean era.
1. Introduction
In Archean oceans, chemical stratification sustained a Si–Fe cycle, in which ferrous iron and silica repeatedly co-precipitated, dissolved, and re-dispersed. Reaction kinetics were governed by (i) Si-ion activity, which set the saturation state and solubility of amorphous silica, and (ii) redox-mediated Fe2+/Fe3+ transitions tied to the vertical migration of the redoxcline. Quantifying the coupling between silica activity and redox variability is, therefore, essential for reconstructing the pH and redox architecture of Archean oceans.
Late-Archean seawater (~2.7–2.5 Ga) is interpreted to have behaved as a globally silica-buffered reservoir, maintaining dissolved SiO2(aq) at ≈2 mM via equilibrium with widespread chert-forming hydrothermal plumes and ambient seawater [1,2,3]. Under pCO2 > 10 PAL (present atmospheric level) [4,5], intense continental weathering discharged silica-rich river waters across broad, shallow epicontinental shelves [6]. Meanwhile, hydrothermal vents (≤350 °C) also injected silica- and Fe2+-rich fluids into the same basins [7,8]. In the absence of diatoms and sponges, the ocean accumulated silica until saturation with respect to amorphous silica was reached [1,9]. Thermodynamic modelling and experimental results indicate that Late-Archean seawater hosted dissolved silica predominantly as monomeric SiO2(aq) and polymeric silica; at the prevailing ionic strength (~0.7 M) and temperatures of 25–40 °C, their residence time exceeded 103 year [9,10].
Actually, iron might have greatly controlled both silica residence time and its partitioning among coexisting phases. Under anoxic conditions, the introduction of 0.1–1 mM Fe2+ drives its complexation with deprotonated silanol groups, yielding SiO2–Fe2+ colloids with a modest ζ potential (|zeta potential(ζ)| < 30 mV at pH 7) [11,12]. These particles aggregate within days to weeks and settle as Fe-rich chert laminae, which consist of millimeter-scale layers [13]. In anoxic Late-Archean oceans [14,15], Fe2+ oxidation was kinetically inhibited, and Si–Fe co-precipitation dominated. Experimental data demonstrate that Fe(II)-silicate gels precipitated at circum-neutral pH are metastable, and petrographic evidence indicates that they ripen to greenalite or magnetite within days to weeks during early diagenesis, sequestering Si and Fe in a coupled burial flux [16,17].
In addition, episodic biological oxidation of Fe(II) greatly altered the Si–Fe cycle. Approaching the Great Oxidation Event (GOE), transient O2 pulses—generated by oxygenic cyanobacteria, Fe-oxidizing anoxygenic phototrophs, or abiotic processes [18,19,20,21,22,23]—oxidized Fe2+ to Fe3+, causing the collapse of the colloidal electrical double layer, and drove electrostatic fragmentation [11]. In addition, suspended Fe(II)-bearing silica nanoclusters (<200 nm) were entrained into the oxic zone and oxidized, prolonging residence times and generating the rhythmic alternations preserved in banded iron formations [17,24]. After GOE, persistently elevated atmospheric pO2 (>10−5 PAL) allowed microaerophilic Fe(II)-oxidizing bacteria and later nitrate-dependent chemolithoautotrophy to oxidize iron ions (Fe2+) in water bodies in large quantities [25,26,27]. Iron was stripped from solutions and sequestered as ferrihydrite and goethite, decoupling silica from Fe cycling. Silica continued to precipitate as amorphous gels, either directly or absorbed on iron oxides in the sediments, but Fe-poor chert layers testify to an ocean with an iron inventory that had been irreversibly locked away by microbial oxidation [13,26].
Previous experimental and spectroscopic studies have significantly deepened our understanding of Fe–Si complexation mechanisms. X-ray absorption fine structure (XAFS) studies demonstrate that Fe3+ forms inner-sphere Fe–O–Si complexes that are directly incorporated into ferrihydrite-like nuclei [28,29]. Polymerized silica coats the ferrihydrite particles, resulting in a decrease in the point of zero charge [30]. It was also reported that dissolved Si hinders Fe(II) oxidation and directs heterogeneous nucleation toward Si-bearing ferrihydrite or proto-greenalite [31,32,33]. Collectively, these studies reveal that Fe–Si interactions involve specific complexation, lattice incorporation, and interfacial charge tuning that control nucleation pathways and colloid stability, which might be central to Archean Si–Fe cycling.
Although the primacy of colloidal particles in mediating Si–Fe cycles in Archean oceans, the capacity of Fe to systematically modulate the surface chemical properties of SiO2 nanoparticles—thereby controlling aggregation, adsorption, and ultimately burial fluxes—remains not understood. This study, therefore, addresses a critical knowledge gap by experimentally constraining the zeta potential and particle-size evolution of (i) pure silica, (ii) silica–ferrous oxyhydroxide complexes, and (iii) their oxidative derivatives under simulated Archaean seawater chemistry. By resolving how ζ potential and aggregation kinetics respond to incremental increases in dissolved O2, we provide baseline parameters for the reactive-transport models of Si-Fe carriers in Precambrian seawater; elucidate the nucleation pathways that led to banded iron formation deposition; and clarify subsequent diagenetic transformations of Si–Fe precipitates. Our findings could help deepen the interpretation of the co-evolutionary dynamics of silica and iron cycles, thereby refining reconstructions of early ocean chemistry and the long-term evolution of Earth’s surface environment.
2. Materials and Methods
2.1. Sample Preparation
All aqueous media were produced from deionized water (≥18.2 MΩ cm at 25 °C, prepared using an MUL9000(B)-H-30 ultrapure water system, Nanjing Zongxin Pure Water Equipment Co., Ltd., Nanjing, China). Reagent-grade Na2SiO3·9H2O (sodium metasilicate nonahydrate, reagent-grade, 98% purity, Macklin, Shanghai, China) and FeCl2·4H2O (iron(II) chloride tetrahydrate, 98% purity, Macklin, Shanghai, China) were used as sources of dissolved silica and ferrous iron, respectively. Stock solutions were prepared anoxically, filtered through 0.22 µm PTFE syringe filters, and stored in acid-washed HDPE bottles.
The silica concentrations were set as 1, 2, and 4 mM, corresponding to undersaturated, near-saturated, and supersaturated conditions with respect to amorphous silica at 25 °C and covering the possible silica concentration range in Precambrian oceans.
Three DO end-members were prepared: (i) anoxic (DO < 0.01 mg L−1); (ii) sub-oxic (DO = 3.00 ± 0.05 mg L−1); and (iii) oxic (DO = 9.00 ± 0.05 mg L−1). All manipulations were performed inside a nitrogen-filled glove box (N2 > 99.999%, residual O2 < 0.1 ppm).
To better characterize the redox state of the system, we estimated the redox potential (Eh) using thermodynamic modeling (PHREEQC), yielding values around −210 mV under anoxic conditions (pH ≈ 6.5), consistent with a strongly reducing environment favorable for Fe2+ stability. Additionally, post-experimental measurements of Fe2+ and Fe3+ concentrations confirmed the progressive oxidation of Fe2+ with increasing DO levels. We have included this result in the Supplementary Materials.
To systematically investigate the individual and combined effects of dissolved silica, ferrous iron, and molecular oxygen on the colloidal ζ potential and particle sizes, seven experimental groups were prepared (Table 1). Besides the target Si and Fe2+, all other ions were adjusted to robust Late-Archean seawater values: Mg2+ ≈ 10 mM [34]; Ca2+ ≈ 10 mM [35]; Fe2+ ≈ 1 mM [12]; SiO2(aq) ≈ 2 mM [2]; HCO3− ≈ 30 mM [36]; K+ ≈ 7 mM [37]; NH4+ ≈ 10 mM [38]; Na+ ≈ 400 mM [37]; Cl− ≈ 450 mM [37].

Table 1.
Samples of different concentrations of SiO2, Fe2+, and oxygen.
2.2. Sample Analysis
Zeta potential (ζ) and particle-size distributions were acquired on a Malvern Zetasizer Nano ZS90 (λ = 633 nm, 173° backscatter optics, Malvern, Worcestershire, UK). Disposable folded-capillary cells (DTS1070) were flushed with N2 prior to loading to maintain anoxic integrity. Each measurement consisted of three consecutive runs (12 sub-runs each) at 25.0 ± 0.1 °C; data were averaged when the phase-quality factor exceeded 0.95, and the count rate remained within 10% drift. Smoluchowski conversion (f(κa) = 1.5) was applied for ζ calculation; the viscosity and the dielectric constant of the background electrolyte were adjusted for Archaean seawater ionic strength (I ≈ 0.7 M). Aliquots of the stock solutions were diluted to final working concentrations and titrated to discrete pH values (2, 3, 4, 5, 6, 7, 8, 9, 10, 11 ± 0.1) using NaOH (sodium hydroxide, 98% purity, Aladdin, Shanghai, China) or HCl (hydrochloric acid, guaranteed reagent grade (GR), Beijing Chemical Factory, Beijing, China). All samples were prepared and added to the sample cells in the glove box; then, they were taken out for analyses. Zeta-potential measurements were performed in triplicate, and only data with a relative standard deviation below 5% were accepted.
Particle-size measurements were performed using a Malvern Zetasizer Nano ZS90 (λ = 633 nm, 173° back-scatter). Before analysis, folded capillary cells (DTS1070) were rinsed with 0.22 µm filtered, N2-degassed dispersants for 10 min to remove bubbles and residual particles. The same filtrate was used to dilute the colloids to a count rate of 150–300 kcps to avoid multiple scattering. After injection, the cell was immediately sealed, equilibrated at 25.0 ± 0.1 °C for 2 min, and measured. The instrument settings are as follows: detection angle: 173°; dispersant refractive index: 1.331; particle refractive index: 1.45 (SiO2); absorption: 0.01. Each sample was run in triplicate (12 sub-runs per run) and averaged. The intensity-weighted hydrodynamic diameter (Dh) and polydispersity index (PdI) were obtained using the “General Purpose” algorithm; only results with a PdI of <0.3 and a standard error of <5% were accepted.
The surface topography was imaged with a Bruker Dimension Icon Atomic force microscope (AFM, Bruker, Karlsruhe, Germany) operating in the PeakForce-QNM mode under an air atmosphere. Samples were drop-cast onto freshly cleaved muscovite, dried in the glove box, and imaged with SCANASYST-AIR probes (spring constant 0.4 N m−1; tip radius 2 nm).
Fourier transform infrared spectrometry (FTIR) analysis was performed using a Bruker Vertex 70 V infrared spectrometer (Bruker, Karlsruhe, Germany). The samples were prepared using the KBr pellet technique: 1 mg of the sample was finely ground and mixed with 80 mg of KBr; then, the sample was pressed into a transparent thin pellet. The spectra were recorded within a wavenumber range of 4000–400 cm−1, with a resolution of 4 cm−1 and 64 scans.
Transmission electron microscopy (TEM) analysis was performed using an FEI Talos F200S TEM (Thermo Fisher Scientific, Waltham, MA, USA). The microstructure of the samples was examined, and both TEM and high-resolution TEM (HRTEM) images were captured.
X-ray photoelectron spectroscopy (XPS) analyses were conducted using a Thermo Scientific K-Alpha XPS instrument (Thermo Fisher Scientific, Waltham, MA, USA). The instrument is equipped with an Al Kα radiation source (1486.8 eV) operating at an emission current of 3 mA and an accelerating voltage of 12 kV. The vacuum level in the analysis chamber was maintained below 1 × 10⁻⁸ mbar. To mitigate the effects of surface charging, an electron flood gun was activated during the analysis. The energy resolution was set to 0.5 eV. For each sample, XPS spectra were collected from three randomly selected regions on the surface to minimize experimental errors. The binding energy scale was calibrated using the C1s peak from adventitious carbon at 284.8 eV. Spectral processing, including background subtraction and peak fitting with a mixed Lorentzian–Gaussian function, was performed using the Thermo Advantage software (the version number has been verified as Advantage v. 5.9922).
3. Results
3.1. Ζeta Potential of Colloidal Particles Under Simulated Archaean Seawater Chemistry
3.1.1. Zeta Potential of SiO2 Colloids Under Anoxic Conditions
The ζ potential of SiO2 colloids under anoxic conditions was first investigated. Figure 1 shows the zeta-potential changes for low, intermediate, and high SiO2 concentrations, corresponding, respectively, to undersaturated, saturated, and supersaturated silica conditions simulated for Archean seawater. Under acidic conditions (pH ≤ 6) and at low particle concentrations, the absoluteζpotential is low, leading to rapid aggregation and the formation of colloidal silica gels. At higher pH (≈10), the absolute zeta potential (|ζ|) exceeds 30 mV (|ζ| ≈ 30 mV marks the onset of colloidal stability [39,40]; this DLVO-derived threshold, though established for low-ionic-strength waters, remains valid for our simulated Archean seawater [41,42]), indicating that the silica surface is sufficiently negatively charged for maintaining colloidal stability through enhanced electrostatic repulsion. At intermediate silica concentrations (2 mM), the aggregation of particles occurs across acidic, neutral, and mildly alkaline conditions, whereas at pH ≈ 10, the zeta potential stabilizes around −30 mV, limiting aggregation. At high silica concentrations, the magnitude of |ζ| stays below 30 mV across the entire pH range, so the system is persistently unstable; the least negative values occur at neutral pH, yielding marginal stability. Across all three concentrations, the point of zero charge (PZC) of quartz extracted from our data (≈1.8, Figure 1) is in excellent agreement with previously reported values (e.g., 1.5–2.0 for synthetic quartz in 0.01–0.7 M NaCl [43]). In addition, the ζ potential is negative, so cation adsorption is required for charge screening, especially under more acidic conditions (the minor fluctuations evident in the data are most likely random experimental variabilities; the differences are within the error bars and carry no systematic significance).
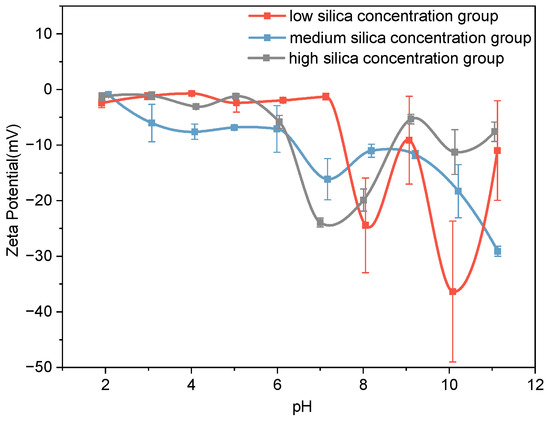
Figure 1.
Zeta potential of SiO2 particles in simulated Archean seawaters. Low-silicaconcentration group ([SiO2 aq] = 1 mM); medium-silica concentration group ([SiO2 aq] = 2 mM); high-silica concentration group ([SiO2 aq] = 4 mM).
Archean seawater is estimated to have contained ~2 mM Si—matching our “intermediate” experimental concentration—and is generally interpreted to have been weakly acidic–near-neutral (pH = 6.5) [1,2,38,44]. If there is a lack of stabilizing factors such as Fe2+, silica nanoparticles at this concentration should aggregate rapidly, potentially lowering the level of dissolved silica [9]. Sustained hydrothermal and continental inputs alone cannot fully explain this steady-state concentration [34,45]; additional mechanisms must have limited silica removal. From the above experiments, it can be seen that the surface of SiO2 colloids is negatively charged under idealized conditions, and they can readily adsorb many cations, including Mg2+, Ca2+, and Na+, in oceans. In particular, in Archean oceans, it would have strongly interacted with the unique dissolved Fe2+ ions.
3.1.2. Zeta Potential of SiO2–Fe2+ Colloidal Complexes Under Anoxic Conditions
As mentioned before, the behavior of silica gel particles in natural Archean oceans is considerably more complex. We therefore successively introduce additional geochemical variables to better approximate Archean seawater. To evaluate the effect of Fe2+ on the surface, we added Fe2+ into the silica system under anoxic conditions.
Figure 2 presents the zeta-potential of SiO2–Fe2+ suspensions. At the lowest SiO2–Fe2+ loadings (1 mM), aggregation is pronounced below pH ≈ 6, whereas above this threshold, the absolute zeta potential exceeds 30 mV, yielding electrostatically stable gels. At the intermediate concentration (2 mM), the system remains unstable in acidic media but stabilizes at neutral to alkaline pH, with a local minimum in |ζ| (~30 mV) near pH 8. High SiO2–Fe2+ concentrations remain prone to aggregation only under acidic conditions; at pH ≥ 7, zeta potentials drop below −30 mV, and at pH 10, they attain their most negative values, indicating the maximum electrostatic stability predicted by surface-charge criteria [39,40]. Across all concentrations, an isoelectric point occurs at pH 2–3; below pH 2, the ζ potential becomes positive, favoring anion adsorption, whereas between pH 4 and 10, the particles are negatively charged and preferentially bind cations.
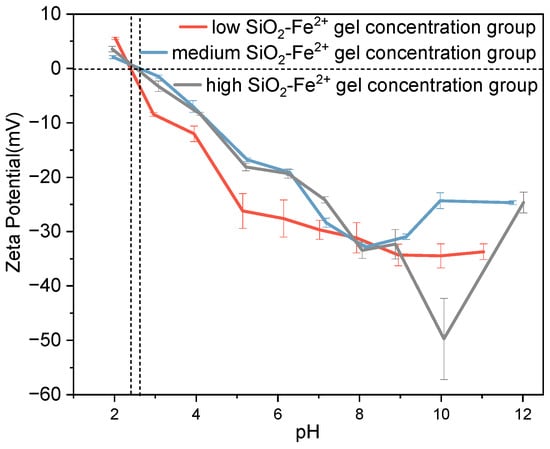
Figure 2.
Zeta potential of Fe2+ ions combined with SiO2 particles in simulated Archean seawaters. Low-SiO2-Fe2+ gel concentration group ([SiO2 aq] = 1 mM, [Fe2+] = 1 mM); medium-SiO2-Fe2+ gel concentration group ([SiO2 aq] = 2 mM, [Fe2+] = 2 mM); high-SiO2-Fe2+ gel concentration group ([SiO2 aq] = 4 mM, [Fe2+] = 4 mM).
Comparisons with the Fe-free system (Figure 1) show that Fe2+ markedly enhances colloidal stability under weakly acidic conditions (pH ≈ 6), as inferred for Archean seawaters [44]. This supports the view that Fe-rich, silica-saturated seawater maintained metastable nanogels rather than massive precipitates [3]. Given that dissolved Fe2+ was abundant (>0.1 mM) in the pre-GOE ocean [13], Fe–silica colloidal stabilization offers a viable mechanism for sustaining high dissolved-silica inventories.
Our results demonstrate that Fe2+ acts as a colloid-stabilizing agent. Even when added at millimolar and near-equimolar levels ([SiO2] ≈ [Fe2+] ≈ 2 mM), it remains surface-active without precipitating. Under experimental conditions (pH 6–7, 25 °C), the ion-activity product for Fe(OH)2, IAP = [Fe2+][OH−]2 lies ~3 orders of magnitude below the solubility product (log Ksp = −15.1) [46], precluding bulk Fe(OH)2 precipitation. Similarly, the saturation index for amorphous SiO2, SI = log(IAP/Ksp), is < 0 (log Ksp(aq-SiO2) = −2.7 at 25 °C [47]), confirming that neither Fe nor Si reaches saturation. Instead, inner-sphere Fe2+–silica complexation dominates, as indicated by zeta potential shifts and the absence of bulk Fe(OH)2 or SiO2 precipitation, which is consistent with previous spectroscopic studies [11,48].
3.1.3. Ζeta Potential of SiO2–Fe2+ Colloids as a Function of Dissolved Oxygen
To assess how the subsequent addition of O2 altered the system’s stability, we implemented controlled oxygenation in the following experiments. Figure 3 shows zeta-potential data for the intermediate-concentration SiO2–Fe2+ system under variable dissolved O2. Under low-O2 conditions, the colloid is unstable at pH < 6 (|ζ| < 30 mV), weakly stable at pH 6 and alkaline pH (~|30| mV), and maximally stabilized at neutral pH (|ζ| > 35 mV). In contrast, high-O2 levels destabilize the system in both acidic and alkaline media (|ζ| < 30 mV); only at neutral pH does the zeta potential remain below −30 mV, conferring marginal stability. At both oxygen concentrations, the system exhibits an isoelectric point at pH ≈ 2.8; at lower pH, the surface is positive (anion-adsorbing), whereas from weakly acidic to alkaline pH, the surface is negative (cation-adsorbing). An increase in oxygen concentration slightly reduced the absolute value of zeta under the same pH conditions and had little impact on the stability of the system. In order to better understand the stability of Fe ions, we have generated a pH-Eh diagram for the Fe–O–H2O system under simulated Archean seawater conditions and included it in the Supplementary Materials (Figure S1).
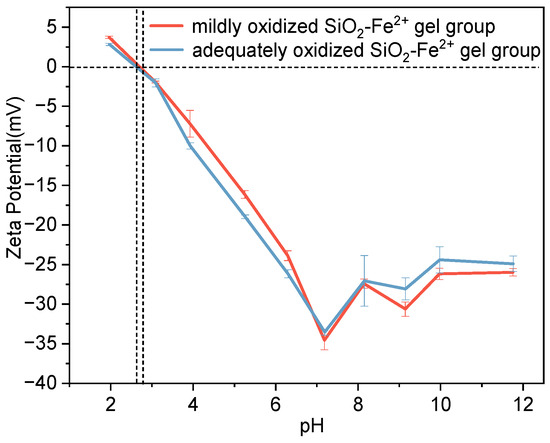
Figure 3.
Zeta potential of Fe2+ ions combined with SiO2 particles in simulated Archean seawaters under different oxygen concentrations. Mildly oxidized SiO2-Fe2+ gel group ([SiO2 aq] = 2 mM, [Fe2+] = 2 mM, DO = 3 mg L−1); adequately oxidized SiO2-Fe2+ gel group ([SiO2 aq] = 2 mM, [Fe2+] = 2 mM, DO = 9 mg L−1).
Oxygen, therefore, slightly enhances stability at neutral–alkaline pH yet weakens it under the weakly acidic (pH ≈ 6) conditions inferred for Archean oceans [44]. The oxidation of Fe2+ to Fe3+ [3,48] destabilizes Fe–silica colloids, promoting aggregation and removal. The progressive oxidation of Fe2+ during ocean oxygenation offers a mechanistic insight for the decline of dissolved Fe2+ and Fe-rich colloidal silica following the GOE [1,2].
3.1.4. Evolution of Colloidal Particle Size
Particle-size data (Figure 4) corroborate the zeta potential trends. In anoxic water (Figure 4a), the average hydrodynamic diameter rises monotonically with SiO2 concentrations, tracking the progressive destabilization of the pure silica gel. The addition of Fe2+ (Figure 4b) produced markedly larger aggregates at every equivalent concentration, consistent with charge screening and the formation of dense Si–Fe nanogels. When the medium-concentration SiO2–Fe2+ system was exposed to increasing dissolved O2 (Figure 4c), the size of aggregated silica–iron colloidal particles decreased. Importantly, particles are smaller at higher O2 levels. As the oxygen content increased, the reduction in the size of the colloidal particles indicates that, during the conversion of Fe2+ to Fe3+, the colloid network was disrupted, converting a large amount of aggregated matter into finer and more dispersed lumps.
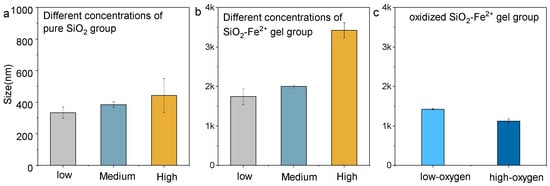
Figure 4.
Particle size of colloidal particles under dissolved, saturated, and supersaturated conditions. (a) Pure SiO2 group; (b) mixed SiO2 and Fe2+ group; (c) mixed and oxidized SiO2 and Fe2+ group (the system only contained the medium-concentration SiO2–Fe2+ gel).
These size shifts mirror the inferred evolution of SiO2–Fe2+ colloids in Archean seawater, revealing that Fe2+ initially promoted colloidal stability and large aggregate formation, whereas the progressive rise in dissolved oxygen after the GOE destabilized Si–Fe gels, driving their disaggregation and depositing them as banded iron formations [3,48].
3.2. Morphological Changes of SiO2–Fe2+ Colloidal Particles During Dehydration
After deposition in Archean oceans, the colloids would have undergone dehydration during diagenesis, transitioning from a fully hydrated to a desiccated state. We simulated this dehydration process and used TEM and AFM to characterize the morphological features of SiO2–Fe2+ colloidal particles post-dehydration. Representative micrographs are shown in Figure 5.
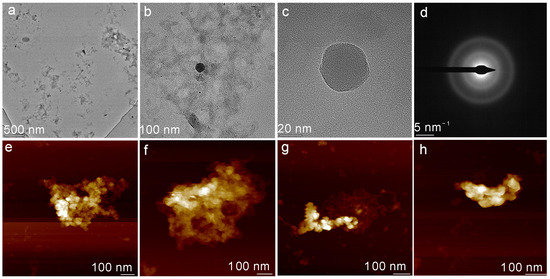
Figure 5.
Morphology of colloidal particles under different oxygen conditions. (a) The TEM image of SiO2–Fe2+ colloidal particles with a scale of 500 nm. (b,c) The magnified TEM images show scale ratios of 100 nm and 20 nm, respectively. (d) The SAED image of the spherical particles observed in (c). (e) AFM image of freshly prepared SiO2–Fe2+ colloidal particles. (f) AFM image after 1 h exposure to ambient air. (g) AFM image after 3 h exposure to ambient air. (h) AFM image after 9 h exposure to ambient air.
As the TEM images (Figure 5a–d) show, Fe2+ binds to silica nanoparticles and dehydrates, yielding amorphous SiO2–Fe2+ colloids. These aggregates appear as scattered spherical particles with diameters ranging from ~20 nm (small dots) to ~200 nm (larger globules). Exposure to the high-energy electron beam readily deforms these colloids, consistent with the transient stability of SiO2–Fe2+ aggregate gels; the beam’s energy perturbs their electronic equilibrium, triggering rapid structural reconfiguration.
To monitor the changes in SiO2–Fe2+ colloids during the interaction with oxygen and dehydration, freshly prepared suspensions were subjected to the same micro-oxic regimen as described above and then examined by AFM. Progressive oxidation at ambient conditions causes the initially compact SiO2–Fe2+ aggregates to disintegrate at their peripheries, generating smaller clusters with heights that continuously decrease. We infer that surface-bound Fe2+ is oxidized to Fe3+ at the colloid–air interface, destabilizing the SiO2–Fe2+ spheres and converting them into smaller, Fe-rich complexes. Detached Fe and Si species may subsequently reprecipitate as secondary Fe(III)–silicate or Fe-oxyhydroxide particles when encountering water.
3.3. Structural Characterization of SiO2–Fe2+ Colloidal Particles
3.3.1. FT-IR Analysis of SiO2–Fe2+ Colloids
Infrared spectroscopy provides important structural information about the ferric oxide group environment and the silicon-oxygen tetrahedron under different oxygen conditions. The infrared spectra of SiO2–Fe2+ colloidal particles at different oxygen concentrations are shown in Figure 6. They all exhibit characteristic absorption bands in the 1100–900 cm−1 range, attributed to Si-O stretching vibrations; absorption bands in the 475–430 cm−1 range, attributed to Si-O bending vibrations; and an absorption band in the 635–625 cm−1 range, attributed to Fe-O bending vibrations. With an increase in O2, the peak intensity rises only very slightly, and this minor change is difficult to discern directly in the figure. In addition, the reaction time with dissolved oxygen might be too short to induce the formation of additional crystalline phases, and the samples remain predominantly amorphous. Additionally, during the oxidation process, the Si–O stretching vibration shifts to a higher wavenumber, while the Si–O bending vibration exhibits a lower wavenumber; simultaneously, the Fe–O bending band shifts to a higher wavenumber (Figure 6). These opposing trends confirm that the Si–O network is structurally modified under oxidative conditions, most likely due to the formation of stronger Si–O–Fe3+ bonds and the associated redistribution of electron density [49]. The progressive incorporation of Fe3+ into the silica matrix is therefore directly recorded by the evolving vibrational environment of both Si and Fe.
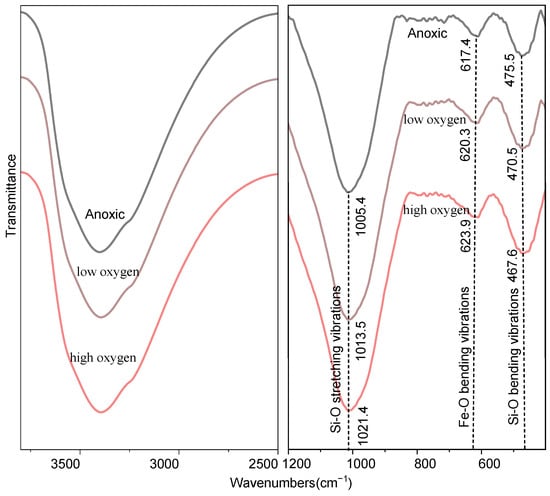
Figure 6.
Infrared analysis of colloidal particles under different oxygen conditions. The observed absorption bands are as follows: 1100–900 cm−1, Si-O stretching vibrations; 635–625 cm−1, Fe-O bending vibrations; 475–430 cm−1, Si-O bending vibrations.
3.3.2. X-Ray Photoelectron Spectroscopy (XPS) of SiO2–Fe2+ Colloidal Particles
To quantify the evolution of chemical bonding upon oxidative exposure, high-resolution Si 2p and O 1s spectra were acquired under controlled oxygen concentration and are displayed in Figure 7.
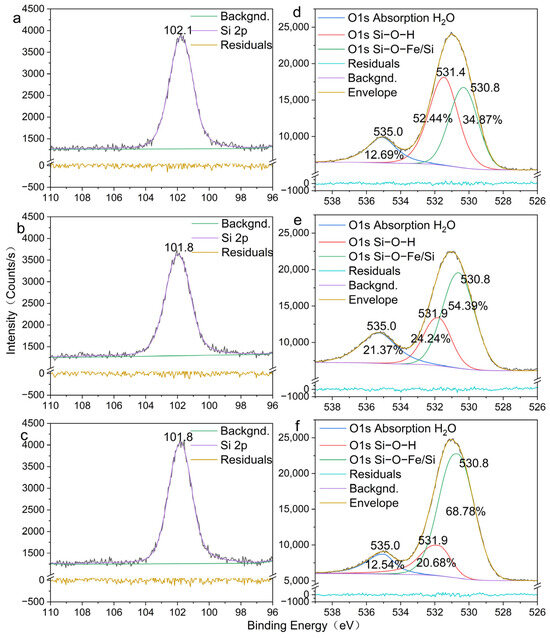
Figure 7.
Si 2p and O 1s peaks in SiO2-Fe2+ colloidal particles under different oxygen conditions. (a) Si 2p in SiO2-Fe2+ colloidal particles under anoxic conditions; (b) Si 2p in SiO2-Fe2+ colloidal particles under low-oxygen conditions; (c) Si 2p in SiO2-Fe2+ colloidal particles under high-oxygen conditions; (d) O 1s in SiO2-Fe2+ colloidal particles under anoxic conditions; (e) O 1s in SiO2-Fe2+ colloidal particles under low-oxygen conditions; (f) O 1s in SiO2-Fe2+ colloidal particles under high-oxygen conditions.
Anoxic XPS (Figure 7a) shows the Si 2p peak at 102.1 eV, consistent with Q3Si(OSi)3(O−) sites in amorphous silica [50]. Upon progressive oxidation (Figure 7b,c), the peak shifts down to 101.8 eV, a 0.3 eV decrease that signals enhanced electron donation to Si through the formation of stronger Si–O–Fe3+ bonds as surface-bound Fe2+ was oxidized. This extra electron density stiffens the tetrahedral framework and accounts for the colloid’s resistance to further structural rearrangements after Fe3+ incorporation.
The lattice O 1s component—assigned to O2− in both Si–O–Si and Si–O–Fe environments—remains fixed at 530.8 eV (Figure 7d–f), confirming that the network of the colloid particles is essentially unperturbed. Notably, the adsorbed-oxygen peak (Si-O-H) centered at ~531.4 eV under anoxia shifts to 531.8 eV upon oxidation [51], indicating increased electron density on surface-bound Fe3+, which is consistent with the morphological transition captured by AFM. Large SiO2–Fe2+ aggregation contracts and restructures into finer Fe3+-rich aggregates, establishing a new interfacial configuration that is both chemically and morphologically distinct from the precursor.
4. Conclusions
Overall, our laboratory reconstructions reveal that the ζ potential of silica–iron colloids is exquisitely sensitive to pH, Fe valences, and dissolved O2 under simulated Late-Archean seawater conditions. Our research provides significant insights into the Si cycle in ancient seawater from the Archean period. Under the prevailing anoxic and Fe-rich conditions, silica existed chiefly as micron-scale aggregation, for which its rapid settling would have efficiently exported dissolved Si to the seafloor. Intermittent oxygenation—whether driven by cyanobacterial blooms or abiotic O2 production—oxidizes surface-bound Fe2+ to Fe3+, increases the colloids’ ζ potential, fragments particles into finer clusters, and ultimately shifts them toward a more stable sedimentary state. The oxidation of Fe induced Silica deposition, altering the global silica cycle. This work identifies a previously unrecognized physicochemical mechanism governing the association of Fe2+ with silica under anoxic conditions and its subsequent destabilization and detachment upon exposure to oxygen. We emphasized the necessity of incorporating colloid surface chemistry into the model of the evolution of the early Earth’s silicon–iron cycle.
Supplementary Materials
The following supporting information can be downloaded at https://www.mdpi.com/article/10.3390/min15111123/s1. Figure S1. The pH-Eh stability diagram of the Fe-O-H2O system simulating the ancient seawater system. The Pourbaix-type diagram was constructed for the Fe–Si–H2O system at 25 °C and 1 bar, with total dissolved Fe(II) = 1 mM; Table S1. Calculated solubility table for simulated Late-Archean seawater; Table S2. Concentration of ferrous ions and ferric ions in the solution after reaction under different oxygen concentration conditions.
Author Contributions
Conceptualization: X.W., W.J. and J.Z. Methodology: W.J. and X.W. Investigation: W.J. and X.W. Formal analysis: W.J. and X.W. Visualization: W.J. and X.W. Funding acquisition: X.W. and J.Z. Project administration: X.W. and J.Z. Supervision: X.W. and J.Z. Writing—original draft: W.J., X.W. and J.Z. Writing—review and editing: W.J., X.W., J.Z., H.Y., J.F., Q.Z., Y.Y., X.L., S.L. and R.L. All authors have read and agreed to the published version of the manuscript.
Funding
This work was supported by the National Natural Science Foundation of China (Grant Nos. 42472063 and 42202037); the Director’s Fund of Guangzhou Institute of Geochemistry, CAS (Grant No. 2022SZJJt-05); and the Science and Technology Planning Project of Guangdong Province, China (Grant Nos. 2023B1212060048 and 2024B0303390002).
Data Availability Statement
The data presented in this study are available on request from the corresponding author. The data are not publicly available due to it’s not convenient to download files from shared cloud storage links across countries.
Conflicts of Interest
The authors declare that they have no competing interests.
Abbreviations
The following abbreviations are used in this manuscript:
| ζ | Zeta/zeta-potential; |
| GOE | Great Oxidation Event; |
| AFM | Atomic force microscopy; |
| FTIR | Fourier transform infrared spectrometry; |
| TEM | Transmission electron microscopy; |
| XPS | X-ray photoelectron spectroscopy; |
| XAFS | X-ray absorption fine structure. |
References
- Siever, R. The silica cycle in the precambrian. Geochim. Cosmochim. Acta 1992, 56, 3265–3272. [Google Scholar] [CrossRef]
- Maliva, R.G.; Knoll, A.H.; Simonson, B.M. Secular change in the precambrian silica cycle: Insights from chert petrology. GSA Bull. 2005, 117, 835–845. [Google Scholar] [CrossRef]
- Konhauser, K.O.; Planaysky, N.J.; Hardisty, D.S.; Robbins, L.J.; Warchola, T.J.; Haugaard, R.; Lalonde, S.V.; Partin, C.A.; Oonk, P.B.H.; Tsikos, H.; et al. Iron formations: A global record of neoarchaean to palaeoproterozoic environmental history. Earth-Sci. Rev. 2017, 172, 140–177. [Google Scholar] [CrossRef]
- Catling, D.C.; Zahnle, K.J. The archean atmosphere. Sci. Adv. 2020, 6, eaax1420. [Google Scholar] [CrossRef]
- Hessler, A.M.; Lowe, D.R.; Jones, R.L.; Bird, D.K. A lower limit for atmospheric carbon dioxide levels 3.2 billion years ago. Nature 2004, 428, 736–738. [Google Scholar] [CrossRef]
- Bekker, A.; Slack, J.F.; Planavsky, N.; Krapez, B.; Hofmann, A.; Konhauser, K.O.; Rouxel, O.J. Iron formation: The sedimentary product of a complex interplay among mantle, tectonic, oceanic, and biospheric processes. Econ. Geol. 2010, 105, 467–508. [Google Scholar] [CrossRef]
- Stein, M.; Hofmann, A.W. Mantle plumes and episodic crustal growth. Nature 1994, 372, 63–68. [Google Scholar] [CrossRef]
- Isson, T.T.; Planavsky, N.J. Reverse weathering as a long-term stabilizer of marine ph and planetary climate. Nature 2018, 560, 471–475. [Google Scholar] [CrossRef]
- Tosca, N.J.; Guggenheim, S.; Pufahl, P.K. An authigenic origin for precambrian greenalite: Implications for iron formation and the chemistry of ancient seawater. GSA Bull. 2016, 128, 511–530. [Google Scholar] [CrossRef]
- Stefurak, E.J.T.; Lowe, D.R.; Zentner, D.; Fischer, W.W. Primary silica granules-a new mode of paleoarchean sedimentation. Geology 2014, 42, 283–286. [Google Scholar] [CrossRef]
- Robbins, L.J.; Lalonde, S.V.; Planaysky, N.J.; Partin, C.A.; Reinhard, C.T.; Kendall, B.; Scott, C.; Hardisty, D.S.; Gill, B.C.; Alessi, D.S.; et al. Trace elements at the intersection of marine biological and geochemical evolution. Earth-Sci. Rev. 2016, 163, 323–348. [Google Scholar] [CrossRef]
- Tosca, N.J.; Jiang, C.Z.; Rasmussen, B.; Muhling, J. Products of the iron cycle on the early earth. Free Radic. Biol. Med. 2019, 140, 138–153. [Google Scholar] [CrossRef]
- Planavsky, N.J.; Cole, D.B.; Isson, T.T.; Reinhard, C.T.; Crockford, P.W.; Sheldon, N.D.; Lyons, T.W. A case for low atmospheric oxygen levels during earth’s middle history. Emerg. Top. Life Sci. 2018, 2, 149–159. [Google Scholar]
- Poulton, S.W.; Canfield, D.E. Ferruginous conditions: A dominant feature of the ocean through earth’s history. Elements 2011, 7, 107–112. [Google Scholar] [CrossRef]
- Scott, C.; Lyons, T.W.; Bekker, A.; Shen, Y.; Poulton, S.W.; Chu, X.; Anbar, A.D. Tracing the stepwise oxygenation of the proterozoic ocean. Nature 2008, 452, 456–459. [Google Scholar] [CrossRef]
- Rasmussen, B.; Meier, D.B.; Krapez, B.; Muhling, J.R. Iron silicate microgranules as precursor sediments to 2.5-billion-year-old banded iron formations. Geology 2013, 41, 435–438. [Google Scholar] [CrossRef]
- Johnson, J.E.; Muhling, J.R.; Cosmidis, J.; Rasmussen, B.; Templeton, A.S. Low-Fe(III) greenalite was a primary mineral from neoarchean oceans. Geophys. Res. Lett. 2018, 45, 3182–3192. [Google Scholar] [CrossRef]
- Konhauser, K.O.; Amskold, L.; Lalonde, S.V.; Posth, N.R.; Kappler, A.; Anbar, A. Decoupling photochemical Fe(II) oxidation from shallow-water bif deposition. Earth Planet. Sci. Lett. 2007, 258, 87–100. [Google Scholar] [CrossRef]
- Lalonde, S.V.; Konhauser, K.O. Benthic perspective on earth’s oldest evidence for oxygenic photosynthesis. Proc. Natl. Acad. Sci. USA 2015, 112, 995–1000. [Google Scholar] [CrossRef]
- Crowe, S.A.; Jones, C.; Katsev, S.; Magen, C.; O’Neill, A.H.; Sturm, A.; Canfield, D.E.; Haffner, G.D.; Mucci, A.; Sundby, B.; et al. Photoferrotrophs thrive in an archean ocean analogue. Proc. Natl. Acad. Sci. USA 2008, 105, 15938–15943. [Google Scholar] [CrossRef] [PubMed]
- He, H.P.; Wu, X.; Xian, H.Y.; Zhu, J.X.; Yang, Y.P.; Lv, Y.; Li, Y.L.; Konhauser, K.O. An abiotic source of archean hydrogen peroxide and oxygen that pre-dates oxygenic photosynthesis. Nat. Commun. 2021, 12, 6611. [Google Scholar] [CrossRef]
- He, H.P.; Wu, X.; Zhu, J.X.; Lin, M.; Lv, Y.; Xian, H.Y.; Yang, Y.P.; Lin, X.J.; Li, S.; Li, Y.L.; et al. A mineral-based origin of earth?S initial hydrogen peroxide and molecular oxygen. Proc. Natl. Acad. Sci. USA 2023, 120, e2221984120. [Google Scholar] [CrossRef]
- Wu, X.; Zhu, J.X.; He, H.P.; Xian, H.Y.; Yang, Y.P.; Ma, L.Y.; Liang, X.L.; Lin, X.J.; Li, S.; Konhauser, K.O.; et al. Geodynamic oxidation of archean terrestrial surfaces. Commun. Earth Environ. 2023, 4, 132. [Google Scholar] [CrossRef]
- Planavsky, N.J.; McGoldrick, P.; Scott, C.T.; Li, C.; Reinhard, C.T.; Kelly, A.E.; Chu, X.L.; Bekker, A.; Love, G.D.; Lyons, T.W. Widespread iron-rich conditions in the mid-proterozoic ocean. Nature 2011, 477, 448–451. [Google Scholar] [CrossRef]
- Paytan, A. Earth history—Sulfate clues for the early history of atmospheric oxygen. Science 2000, 288, 626–627. [Google Scholar] [CrossRef] [PubMed]
- Canfield, D.E. The early history of atmospheric oxygen: Homage to robert M. Garrels. Annu. Rev. Earth Planet. Sci. 2005, 33, 1–36. [Google Scholar] [CrossRef]
- Bekker, A.; Holland, H.D. Oxygen overshoot and recovery during the early paleoproterozoic. Earth Planet. Sci. Lett. 2012, 317, 295–304. [Google Scholar] [CrossRef]
- Pokrovski, G.S.; Schott, J.; Garges, F.; Hazemann, J.L. Iron (iii)-silica interactions in aqueous solution: Insights from x-ray absorption fine structure spectroscopy. Geochim. Cosmochim. Acta 2003, 67, 3559–3573. [Google Scholar] [CrossRef]
- Doelsch, E.; Rose, J.; Masion, A.; Bottero, J.Y.; Nahon, D.; Bertsch, P.M. Speciation and crystal chemistry of iron(iii) chloride hydrolyzed in the presence of SiO4 ligands. 1. An fek-edge exafs study. Langmuir 2000, 16, 4726–4731. [Google Scholar] [CrossRef]
- Swedlund, P.J.; Webster, J.G. Adsorption and polymerisation of silicic acid on ferrihydrite, and its effect on arsenic adsorption. Water Res. 1999, 33, 3413–3422. [Google Scholar] [CrossRef]
- Schwertmann, U.; Thalmann, H. Influence of Fe(II), Si, and pH on formation of lepidocrocite and ferrihydrite during oxidation of aqueous FeCl2 solutions. Clay Miner. 1976, 11, 189–200. [Google Scholar] [CrossRef]
- Kaegi, R.; Voegelin, A.; Folini, D.; Hug, S.J. Effect of phosphate, silicate, and ca on the morphology, structure and elemental composition of Fe(III)-precipitates formed in aerated Fe(II) and As(III) containing water. Geochim. Cosmochim. Acta 2010, 74, 5798–5816. [Google Scholar] [CrossRef]
- Mayer, T.D.; Jarrell, W.M. Formation and stability of iron(II) oxidation products under natural concentrations of dissolved silica. Water Res. 1996, 30, 1208–1214. [Google Scholar] [CrossRef]
- Halevy, I.; Bachan, A. The geologic history of seawater ph. Science 2017, 355, 1069–1071. [Google Scholar] [CrossRef] [PubMed]
- Izawa, M.R.M.; Nesbitt, H.W.; MacRae, N.D.; Hoffman, E.L. Composition and evolution of the early oceans: Evidence from the tagish lake meteorite. Earth Planet. Sci. Lett. 2010, 298, 443–449. [Google Scholar] [CrossRef]
- Blättler, C.L.; Kump, L.R.; Fischer, W.W.; Paris, G.; Kasbohm, J.J.; Higgins, J.A. Constraints on ocean carbonate chemistry and pco2 in the archaean and palaeoproterozoic. Nat. Geosci. 2017, 10, 41–45. [Google Scholar] [CrossRef]
- Riley, J.P.; Chester, R. Introduction to Marine Chemistry; Academic Press: Cambridge, MA, USA, 1971. [Google Scholar]
- Jones, C.; Nomosatryo, S.; Crowe, S.A.; Bjerrum, C.J.; Canfield, D.E. Iron oxides, divalent cations, silica, and the early earth phosphorus crisis. Geology 2015, 43, 135–138. [Google Scholar] [CrossRef]
- Pate, K.; Safier, P. 13-chemical metrology methods for cmp quality. In Advances in Chemical Mechanical Planarization (CMP), 2nd ed.; Babu, S., Ed.; Woodhead Publishing: Sawston, UK, 2022; pp. 355–383. [Google Scholar]
- Németh, Z.; Csóka, I.; Jazani, R.S.; Sipos, B.; Haspel, H.; Kozma, G.; Kónya, Z.; Dobó, D.G. Quality by design-driven zeta potential optimisation study of liposomes with charge imparting membrane additives. Pharmaceutics 2022, 14, 1798. [Google Scholar] [CrossRef]
- Saini, R.; Garg, A.; Barz, D.P.J. Streaming potential revisited: The influence of convection on the surface conductivity. Langmuir 2014, 30, 10950–10961. [Google Scholar] [CrossRef]
- Ripoll, L.; Bordes, C.; Marote, P.; Etheve, S.; Elaissari, A.; Fessi, H. Electrokinetic properties of bare or nanoparticle-functionalized textile fabrics. Colloids Surf. A-Physicochem. Eng. Asp. 2012, 397, 24–32. [Google Scholar] [CrossRef]
- Kosmulski, M. pH-dependent surface charging and points of zero charge. IV. Update and new approach. J. Colloid Interface Sci. 2009, 337, 439–448. [Google Scholar] [CrossRef]
- Stefurak, E.J.T.; Lowe, D.R.; Zentner, D.; Fischer, W.W. Sedimentology and geochemistry of archean silica granules. GSA Bull. 2015, 127, 1090–1107. [Google Scholar] [CrossRef]
- Hinz, I.L.; Nims, C.; Theuer, S.; Templeton, A.S.; Johnson, J.E. Ferric iron triggers greenalite formation in simulated archean seawater. Geology 2021, 49, 905–910. [Google Scholar] [CrossRef]
- Stumm, W.; Morgan, J.J. Aquatic Chemistry: Chemical Equilibria and Rates in Natural Waters, 3rd ed.; John Wiley & Sons: Hoboken, NJ, USA, 1996. [Google Scholar]
- Rimstidt, J.D.; Barnes, H.L. The kinetics of silica-water reactions. Geochim. Cosmochim. Acta 1980, 44, 1683–1699. [Google Scholar] [CrossRef]
- Planavsky, N.J.; Rouxel, O.J.; Bekker, A.; Lalonde, S.V.; Konhauser, K.O.; Reinhard, C.T.; Lyons, T.W. The evolution of the marine phosphate reservoir. Nature 2010, 467, 1088–1090. [Google Scholar] [CrossRef]
- Liu, H.S.; Kaya, H.; Lin, Y.T.; Ogrinc, A.; Kim, S.H. Vibrational spectroscopy analysis of silica and silicate glass networks. J. Am. Ceram. Soc. 2022, 105, 2355–2384. [Google Scholar] [CrossRef]
- Biesinger, M.C.; Lau, L.W.M.; Gerson, A.R.; Smart, R.S.C. Resolving surface chemical states in xps analysis of first row transition metals, oxides and hydroxides: Sc, ti, v, cu and zn. Appl. Surf. Sci. 2010, 257, 887–898. [Google Scholar] [CrossRef]
- Biesinger, M.C.; Payne, B.P.; Grosvenor, A.P.; Lau, L.W.M.; Gerson, A.R.; Smart, R.S. Resolving surface chemical states in xps analysis of first row transition metals, oxides and hydroxides: Cr, mn, fe, co and ni. Appl. Surf. Sci. 2011, 257, 2717–2730. [Google Scholar] [CrossRef]
Disclaimer/Publisher’s Note: The statements, opinions and data contained in all publications are solely those of the individual author(s) and contributor(s) and not of MDPI and/or the editor(s). MDPI and/or the editor(s) disclaim responsibility for any injury to people or property resulting from any ideas, methods, instructions or products referred to in the content. |
© 2025 by the authors. Licensee MDPI, Basel, Switzerland. This article is an open access article distributed under the terms and conditions of the Creative Commons Attribution (CC BY) license (https://creativecommons.org/licenses/by/4.0/).