Article

The Controlling Effect of CaCO3 Supersaturation over Zn Carbonate Assemblages: Co-Crystallization in Silica Hydrogel

by
André Jorge Pinto
1,*,
Nuria Sánchez-Pastor
1 and
Angeles Fernández-González
2
1
Department of Mineralogy and Petrology, Faculty of Geological Sciences, University Complutense of Madrid, C/José Antonio Novais, 12, 28040 Madrid, Spain
2
Department of Geology, Faculty of Geology, University of Oviedo, C/Jesús Arias de Velasco, s/n, 33009 Oviedo, Spain
*
Author to whom correspondence should be addressed.
Minerals 2024, 14(12), 1274; https://doi.org/10.3390/min14121274
Submission received: 20 November 2024 / Revised: 9 December 2024 / Accepted: 14 December 2024 / Published: 15 December 2024

Abstract

:
Weathering products of sphalerite-bearing ores play an important role in controlling the fate of Zn in the environment. In this framework, the relative stability of Zn carbonates is of special relevance for the common case of ore weathering by carbonated groundwater in the presence of calcium carbonates. We investigated the experimental (co)nucleation and growth of Zn and Ca carbonates at 25 °C in finite double diffusion silica hydrogel media with the purpose of deciphering the system’s reactive pathway and unraveling the major governing factors behind the obtained mineral assemblages. The crystallized solids were carefully extracted two months post-nucleation and studied with micro-Raman spectroscopy, micro X-ray diffraction (XRD), scanning electron microscopy, and electron microprobe (EMP) methods. The obtained results indicate that the grown Zn-bearing phases corresponded to smithsonite and/or Zn hydroxyl carbonate, while CaCO3 polymorphs aragonite and calcite were also crystallized. Moreover, the observed mineral textural relationships reflected the interplay between supersaturation with respect to CaCO3/pCO2 and the grown Zn-bearing carbonate. Experiments conducted in more supersaturated conditions with respect to CaCO3 polymorphs (higher pCO2) favored the precipitation of smithsonite, while the opposite was true for the obtained Zn hydroxyl carbonate phase. The gathered Raman, XRD, and EMP data indicate that the latter phase corresponded to a non-stoichiometric, poorly crystalline solid.

Graphical Abstract

1. Introduction

Abandoned or poorly reclaimed mining operations of sulfide ores pose a series of environmental challenges, from acid mine drainage mitigation and containment to the prevention of soil contamination by hazardous metals, such as Pb, Cd, Cu, or Zn. Regarding the specific case of Zn contamination, ref. [1] demonstrated that prolonged coal extraction activities may also lead to the anomalous accumulation of that metal in soils near both smelting facilities and tailings. Residual zinc and other metals may be mobilized in abandoned mines and made bioavailable through weathering reactions, thus entering the trophic chain [2,3]. In this framework, the formation of low-temperature weathering products, such as oxides, sulfates, and/or carbonates, is a major step in the aqueous mobilization of hazardous ore metals.
Natural Zn carbonates are mostly formed by the oxidative dissolution of sphalerite-bearing ores in the presence of aqueous carbonate ions [4,5]. Alongside smithsonite, ZnCO3, a cohort of structurally related Zn hydroxyl carbonates, may precipitate in such environments, such as parádsasvárite, ZnCO3(OH)2 [6]; brianyoungite, Zn3CO3(OH)4 [7]; and/or, more commonly, hydrozincite, Zn5(CO3)2(OH)6 [8]. The latter is also produced by photosynthetic microorganisms in the Naraucali river (SW Sardinia, Italy), which receives drainage from an abandoned lead and zinc sulfide mine [9]. The work of [5] demonstrated how hydrozincite may play an important role in controlling the environmental fate of Zn (and Pb) in the context of unmanaged closed mines, therefore underlying the relevance of defining its thermodynamic solubility in near-surface conditions. Unfortunately, the wide variety of solubility constants published for this phase ([8,10,11,12] and references therein) hampers the prediction of Zn reactive transport in carbonated waters through the application of hydrogeochemical modeling tools. Ref. [13] documented apparent solubility contrasts among hydrozincites of different origins (abiotic/geologic, biogenic, and synthetic) while stressing the systematic structural differences encountered between abiotic and biogenic samples from the Naraucali stream (SW Sardinia, Italy). Strikingly, and to the authors’ knowledge, thermodynamic solubility data regarding both parádsasvárite and brianyoungite are absent from the scientific literature. In fact, both correspond to pure end members of solid solution systems since Cu2+ may replace Zn2+ in the structure of the former and SO42− for CO32− in the latter [14], and determining their solubility is not straightforward.
The possible occurrence of co-crystallization processes or even the establishment of solid solution joints involving carbonates is frequently the limiting factor governing the natural aqueous (bio)availability of toxic metals, which has been investigated by several authors (e.g., [15,16,17], etc.). In this context, the experimental crystallization of carbonates in nano-porous media is particularly useful since it enables the controlled nucleation and growth of environmentally relevant phases, whose crystal–chemical and thermodynamic properties may therefore be assessed ([18,19]). Moreover, some solids are often moderately soluble and/or rare in nature, and this experimental approach facilitates the growth of large crystal individuals. An extensive review of crystallization in gels is presented by [20].
In the present study, we investigated the experimental (co)nucleation and growth of Zn and Ca carbonates at 25 °C in finite double diffusion media. The induced far-from-equilibrium conditions exacerbated the role of kinetic factors, such as growth rates, thus enabling the assessment of the reactive pathways followed by the system and the underlying physical–chemical constraints defining the obtained phase assemblages.

2. Experimental Methods

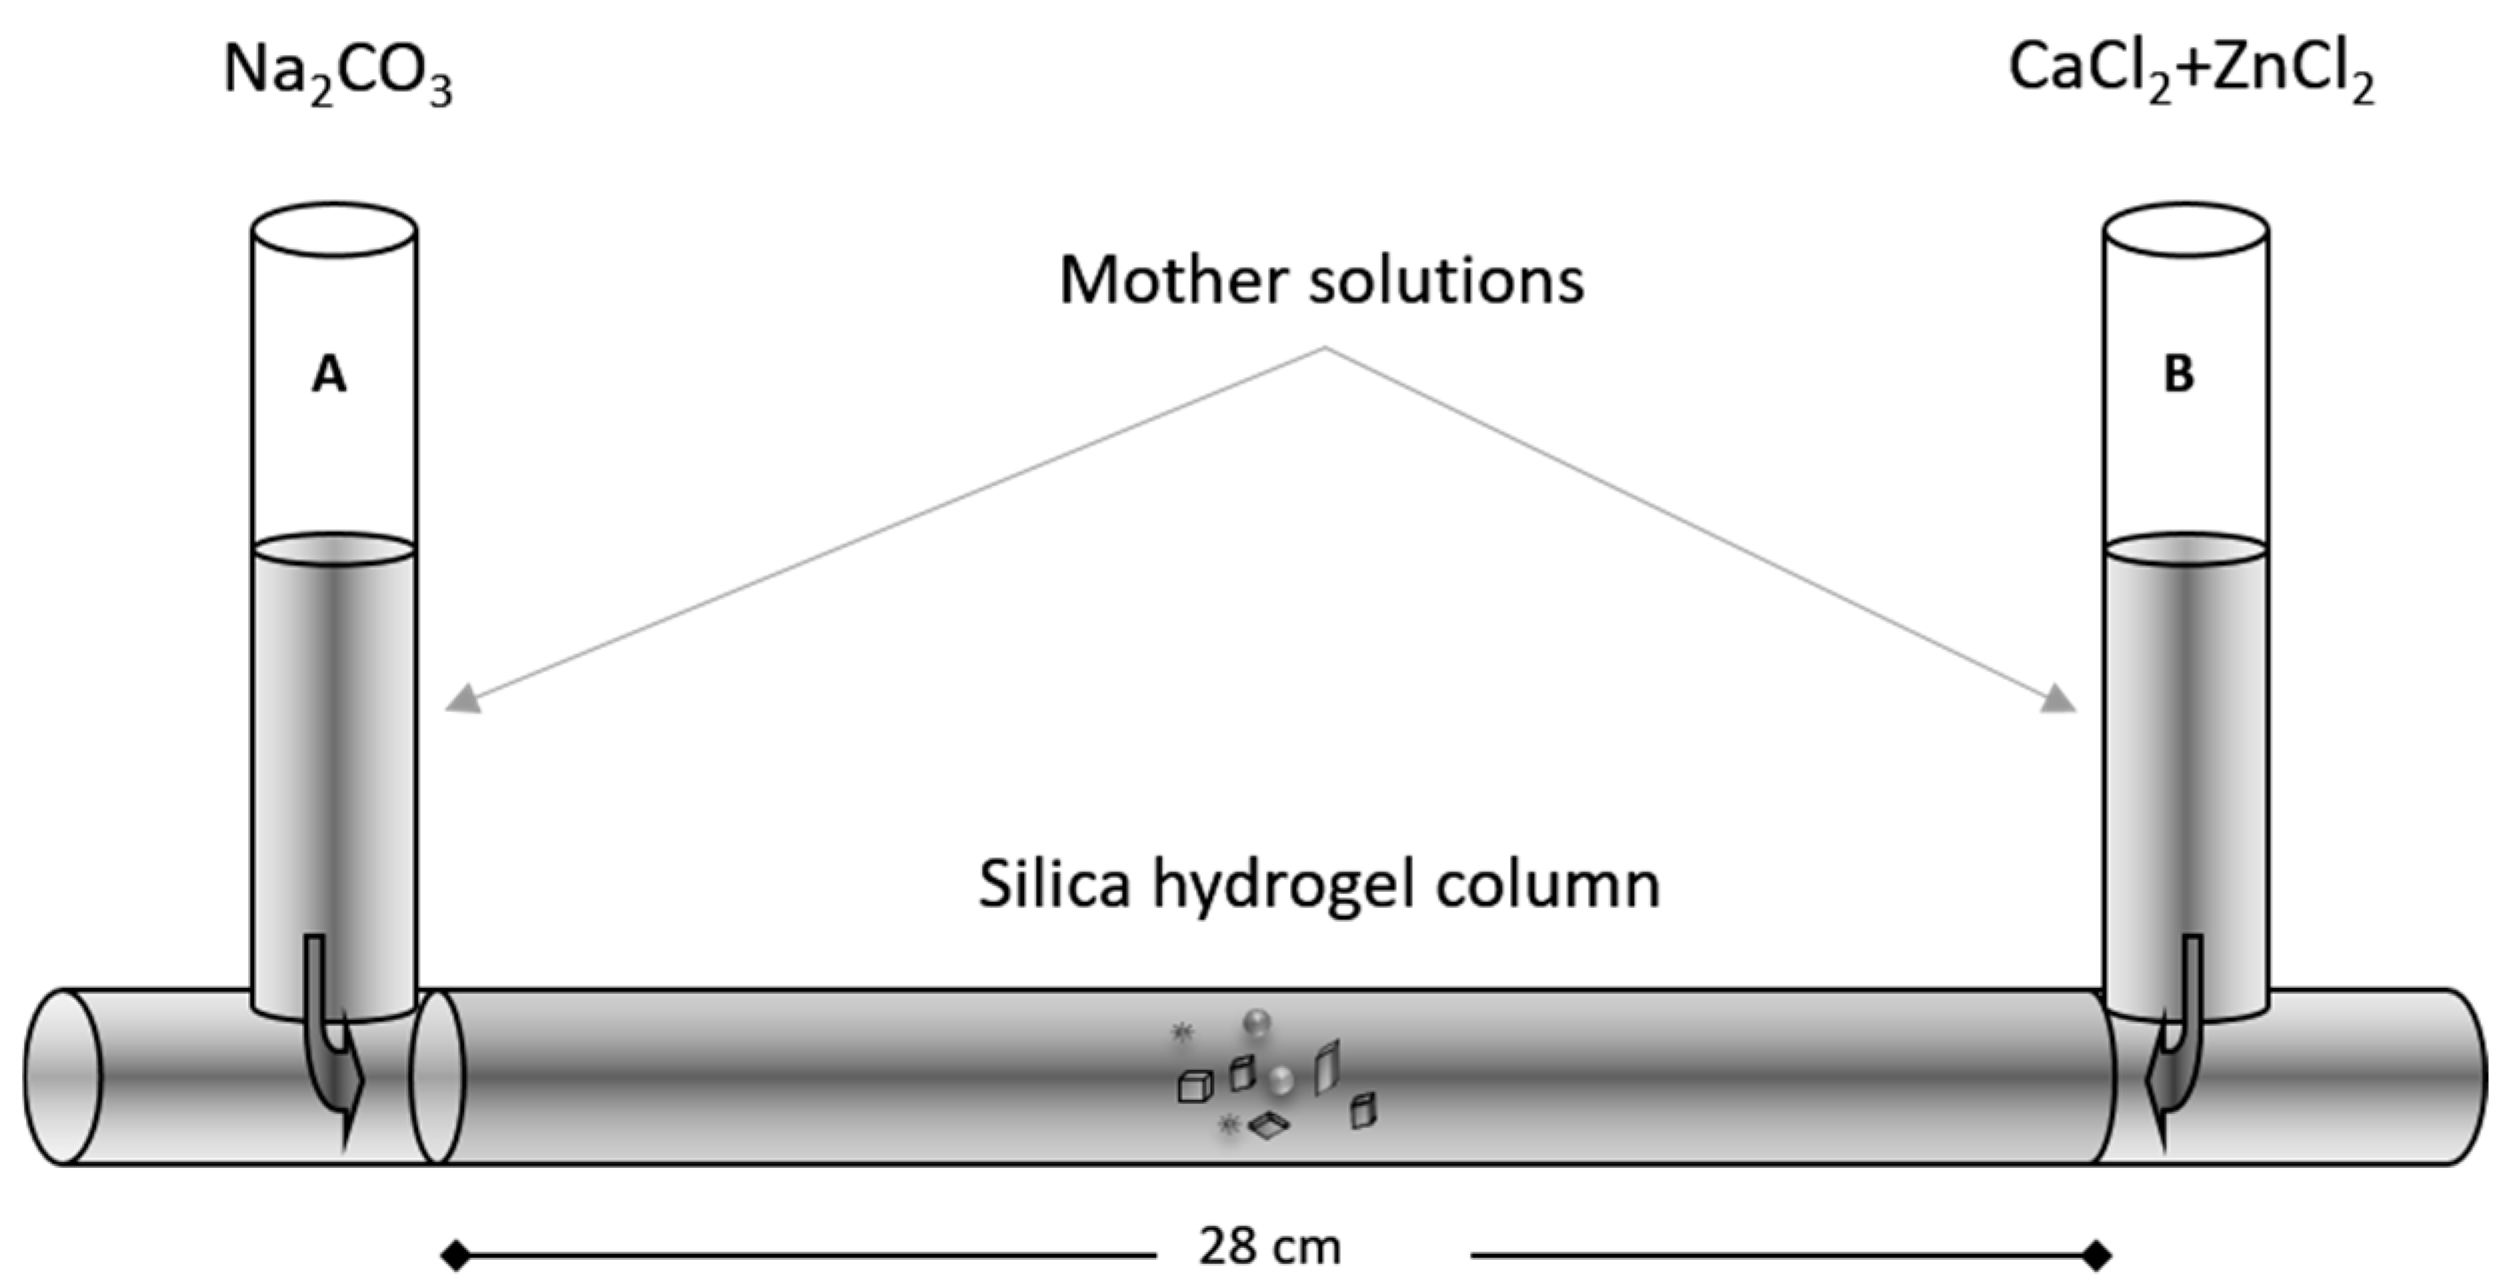
2.1. Crystal Growth Experiments

Crystallization experiments were performed using an inert silica hydrogel, which served as a medium for crystal growth in a double diffusion system. The employed experimental setup, shown in Figure 1, consisted of a U-shaped glass tube whose two vertical reservoirs were filled with the reactant aqueous solutions, while the 28 cm long horizontal column bore the silica hydrogel. The latter was prepared by acidifying a sodium silicate solution (Na2SiO3) (Merck KGaA, sp. gr.: 1.509 g/cm3; pH = 11.2) with a 1N HCl solution to pH = 5.5. The thus obtained solution was poured into the horizontal branch of the U-tube and left to polymerize. The produced silica hydrogel contained ~96.5 wt% water filling interconnecting micro-sized pores. One of the vertical branches (reservoir A) was filled with 10 cm3 of a Na2CO3 aqueous solution, while the other (reservoir B) contained 10 cm3 of an aqueous solution with different ratios of CaCl2 and ZnCl2. All experimental solutions were prepared with ultrapure water (18.3 MΩ/cm, 25 °C, MilliQ Millipore) using analytical-grade reagents.
A set of fifteen different experiments were carried out, in which different concentrations of the starting solutions were combined. The concentrations of the parent solutions in the different experiments are compiled in Table 1.
Reactants diffused from the vertical branches through the nano-porous medium and nucleation and growth eventually occurred through chemical reaction at a defined point within the gel. The gel column was monitored by means of optical microscopy (500× magnification) to find the position of the first precipitate in the gel column, therefore establishing the elapsed waiting time (tw) from the beginning of the experiments. The precipitates were observed daily, and any change was registered for a period of two months after tw. Then, the crystals were extracted from the gel by dissolving it in a 1M NaOH solution, slightly rinsing it in water, and preparing it for characterization. The experiments were conducted at 25 ± 0.1 °C.

2.2. Solid Phase Characterization

Crystals with representative morphologies were selected under a binocular stereomicroscope and studied using scanning electron microscopy with a JEOL 6610-LV microscope equipped with the Energy Dispersive Spectrometer Oxford INCA Energy 350 with an X-max50 detector (SEM-EDS). This scanning electron microscope was also used to observe and analyze polished central sections of the crystals. Moreover, detailed quantitative chemical analyses of the crystals were obtained with an electron microprobe CAMECA SX-100, equipped with five WDS spectrometers (spectrometer 1. PET, TAP, PC1, and PC3 crystals; spectrometer 2. LLIF, LPET crystals; spectrometer 3. LLIF, LPET crystals; spectrometer 4. LTAP, LPC2 crystals, spectrometer 5. LLIF, LPET crystals), an energy dispersive spectrometer (EDS), and SE, BSE, and ABS detectors. Analytical conditions involved 15 kV of beam current and 10 s of acquisition time. Calcite and ZnO commercial standards were employed for Ca and Zn calibration, respectively. The latter techniques are hosted by the University of Oviedo, Spain.
For phase determination, two structural microanalysis techniques were used in tandem: X-ray microdiffraction (for µ-XRD) and micro-Raman spectroscopy. The measurements for µ-XRD analysis were performed on the polished samples using a Panalytical X’Pert PRO diffractometer with CuKα radiation (University Complutense of Madrid, Spain). The X-ray generator worked at a power of 45 kV and 40 mA and the resolution of the instrument was determined using SiO2 standards. The patterns were collected with 0.03° of step size in the angular range of 20°–90° in 2ϴ, with a counting time of 80 s per point.
The Raman spectra were collected at room temperature using a Thermo Fisher DRX Raman spectrometer (National Museum of Natural Sciences, Madrid, Spain) equipped with a confocal microscope with a point-and-shoot Raman capability of 1 µm spatial resolution. The objective selected was 10× magnification, with a numerical aperture of 0.9, together with a laser source at 780 nm at 8–10 mW with laser mode power at 100%. The laser was always focused at a minimum depth of 5 µm below the surface of the sample. The average spectral resolution of the Raman shift ranging from 70 to 3400 cm−1 was 2–4 cm−1, i.e., grating 900 lines/mm, and a spot size of 2 μm. The system was operated under OMNIC 1.0 software selecting working conditions such as a pinhole aperture of 25 µm and bleaching time of 1–2 s, with four to seven exposures in 10–30 s. Peak deconvolution was carried out using the software package Fityk [21].

3. Results

3.1. Crystal–Chemical Features of Grown Solids

3.1.1. Experiments 1–2
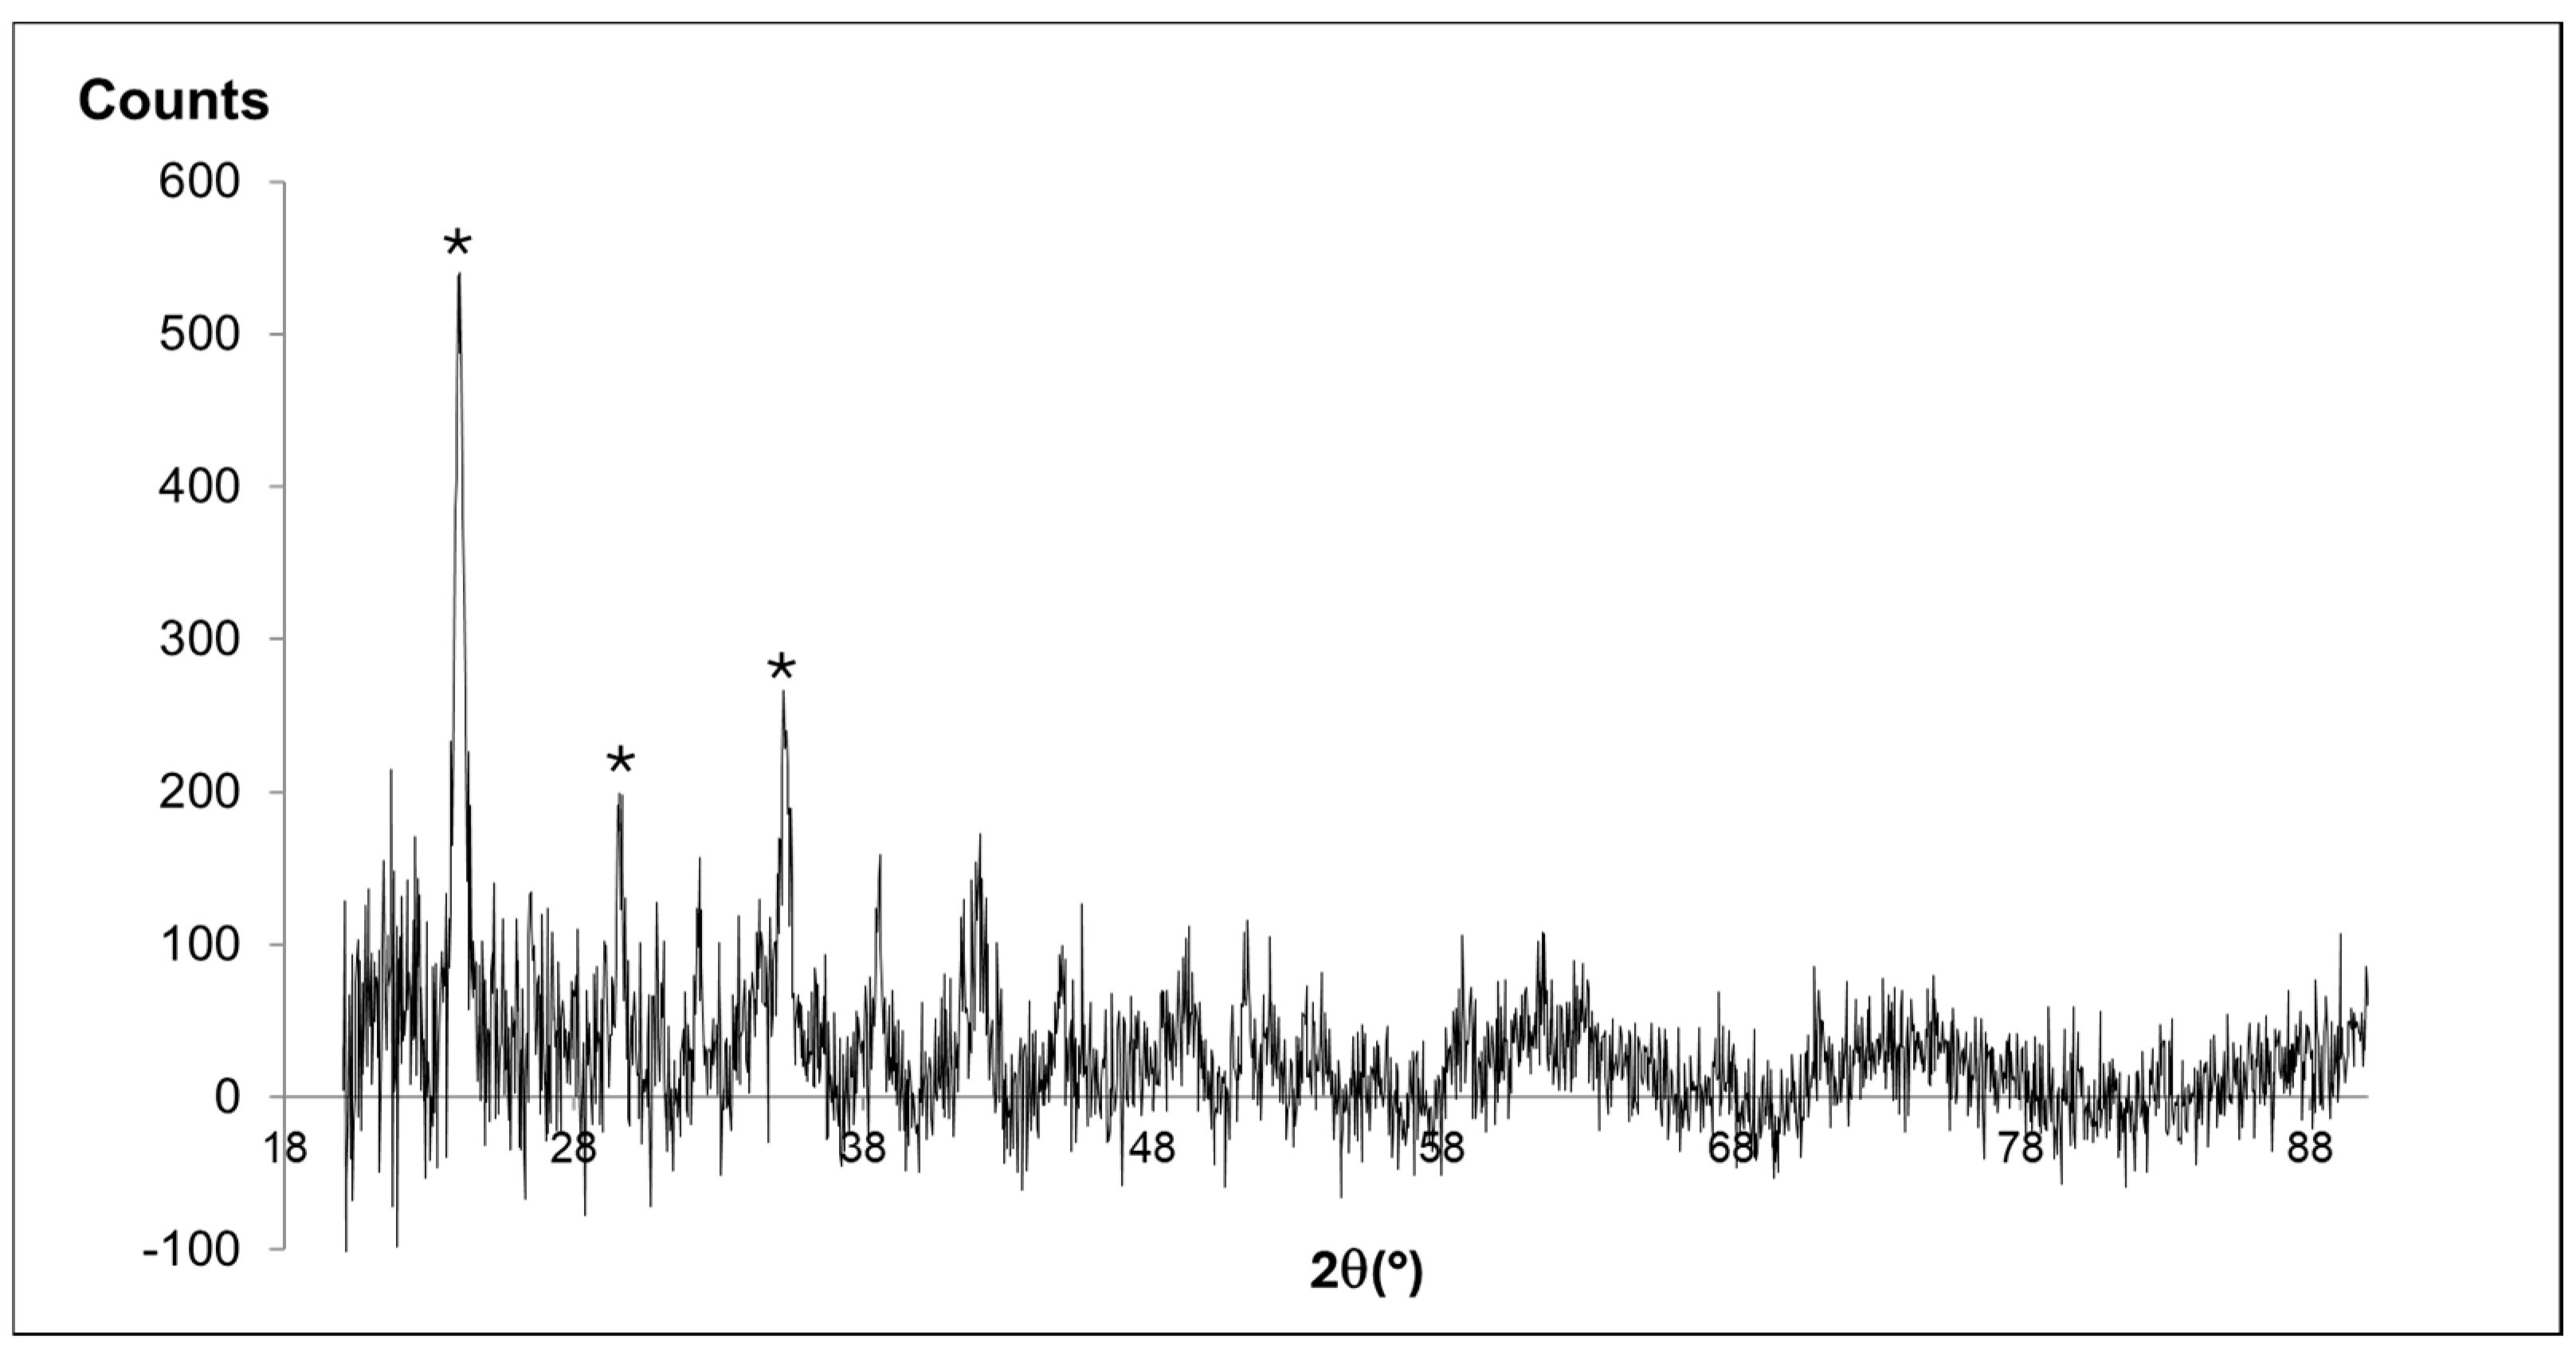
After 45 days of reaction time, the first occurrence of precipitates was detected in the hydrogel column of experiments 1 and 2 at 10.5 cm from the cation-bearing solution reservoir. The solids retrieved from the gel two months after the first nucleation was registered are depicted in the inset of Figure 2a, which corresponds to an SEM-EDS backscattered electrons (BSE) micrograph. The grown phases could be described as submillimeter-sized spherules displaying massive cores that graded outwardly to rougher and more porous morphologies. This suggested an aggregate of fine, tabular growth over the more massive core. Despite the slight contrast evidenced between the core and rim by BSE imaging, no variations were observed in the Raman spectral characteristics of each morphologically distinct zone. Such chemical heterogeneities were reflected by the content in Zn measured with EMP, the profile of which is overlapped on the inset of Figure 2a. While the much lower Zn% of the rims could easily be attributed to an analytical artifact induced by the higher porosity, at the core, a variation yielding ~66 < Zn (%) < 70 occurred, with contents decreasing inwardly from the core–rim boundary. No calcium or other cation was detected through EMP analysis.
Figure 2b displays representative Raman spectra of the solids obtained in experiments 1 and 2, focusing on the 990 < cm−1 < 1140 shift interval. The broad intense peak around ~1090 cm−1 could be attributed to the combination of ν1 (CO32−) symmetric stretching modes in the structures of parádsasvárite, Zn2CO3(OH)2 (1074 cm−1, [22]); vaterite, CaCO3 (1082 cm−1, [23]); and smithsonite, ZnCO3, (1089 cm−1, [24]). Since no calcium was detected with EMP analysis, vaterite presence could be excluded from the analysis results. Other bands at 1006 and 1042 cm−1 were in good agreement with the reference information for the ν1 (CO32−) symmetric stretching modes in the structures of parádsasvárite [22] and hydrozincite, Zn5(CO3)2(OH)6 [24], respectively. It is worth mentioning that the intense band at ~1056 cm−1 typical of brianyoungite, Zn3CO3(OH)4, [14], was absent from the obtained spectrum. Spectral analysis in the 50 < cm−1 < 450 shift range shown in Figure 2a revealed bands assigned to the Zn-O stretching vibrations in parádsasvárite at 397 cm−1 [22] and the same modes for hydrozincite, considering the broad bands at 325 and 282 cm−1 [24]. Moreover, the bands in the 50 < cm−1 < 210 shift interval could be assigned to lattice modes of Zn(OH)2 [25], though the band at 185 cm−1 was also present in parádsasvárite [22]. The doubling of ν1 bands in parádsasvárite has been linked to the occurrence of two distinct carbonate groups [22,26], though, in the present case, this feature could not be attributed to two different cations occurring in the structure, with the corresponding variations in coordination geometry.
The coexistence of vibrational modes assignable to different phases in the spectrum depicted in Figure 2 did not necessarily imply their mixed occurrence since hydrozincite and parádsasvárite share the same structural components. In fact, despite not being perfectly isostructural, these phases were both characterized by monoclinic structures, the former with space group C2/m [27] and the latter with P21/a [22], and, therefore, transitions between each type could be achieved through minor structural rearrangements of components. Therefore, the several ν1 (CO32−) symmetric stretching modes assigned to different phases could simply reflect a distortion in the carbonate anionic group induced by non-stoichiometric deviations from the ideal compositions of either hydrozincite and/or parádsasvárite. This assertion seems to be consistent with the several Zn-O bond vibrational modes observed in Figure 2a. Figure 3 displays an X-ray diffraction pattern obtained for a representative solid grown in experiments 1–2 dominated by broad, low-intensity peaks after the removal of background noise, typical of poorly crystalline phases. However, reflections consistent with the data reported by [22] for parádsasvárite occurred at d(Å)~5.1, 3.7, and 6.1. Taking into consideration the variations in Zn content measured with EMP and the discussed structural data, it is likely that the spherules formed in experiments 1 and 2 corresponded to a non-stoichiometric, low-crystallinity Zn hydroxyl-carbonate, whose structural characteristics approached those of parádasvárite/hydrozincite.

3.1.2. Experiment 3

Due to the higher Ca/Zn ratio in the starting cation-bearing aqueous solution of experiment 3, calcium carbonate polymorphs formed in the hydrogel column. Figure 4a depicts a BSE micrograph of a sub-millimeter-sized calcite crystal grown in this experiment, retrieved two months after tw = 37 days. The morphology obtained corresponded to the typical {104} rhombohedral form, displaying a hopper growth pattern characteristic of calcite formed at high supersaturation conditions. The growth mechanism behind this peculiar morphology has been extensively discussed in [28]. Figure 4a also contains an inset corresponding to a BSE micrograph of a rosette aggregate of acicular/prismatic crystals of aragonite grown in this experiment. The identity of these CaCO3 polymorphs was confirmed by Raman analysis (see Supplementary Materials), both displaying concentrations of Zn% < 0.01, i.e., below detection levels.
Figure 4b displays spherules of Zn hydroxyl carbonate, whose morphologies, Raman spectral characteristics, and Zn contents were coincident with the solids grown in experiments 1 and 2. In this image, another type of micron-sized spherules formed in experiment 3 and characterized by a layered morphology in cross-sections can be seen.
Figure 5a depicts a reflected polarized-light micrograph of one of these assemblages, showing an anhedral solid at the core, with two consecutive, concentric overgrowths. The first overgrowth was more massive than the second, which also displayed higher porosity. Figure 5b depicts representative Raman spectra of the core, focusing on the 990 < cm−1 < 1110 shift interval, revealing a similar set of bands found for the Zn hydroxyl carbonate phase formed in experiments 1 and 2. The main difference with respect to the latter concerned the presence of the ν1 (CO32−) symmetric stretching mode triplet of smithsonite at ~1094, 1084, and 1075 cm−1 [24]. The remainder of the spectra is dominated by a combination of CO32−, Zn-O, and lattice vibrational modes found for the structures of parádasvárite, hydrozincite, and Zn(OH)2. EMP analysis of this precipitate yielded ~58% Zn and ~0.6% Ca, which was also coherent with the solids obtained in experiments 1 and 2. Figure 5b reveals the Raman spectra referent to the two solid layers overgrowing the Zn hydroxyl carbonate core. Both spectra are identical, dominated by a set of bands at 198, 306, 730, and 1095 cm−1 in good agreement with the reference data regarding smithsonite [24]. However, a set of bands occurred at ~1006 and 1045 cm−1, which could be assigned to the ν1 (CO32−) symmetric stretching modes in the structures of parádsasvárite [22] and hydrozincite [24], respectively. EMP measurements revealed that the composition of the smithsonite layers yielded ~52% Zn, and some minor incorporation of OH might have occurred.

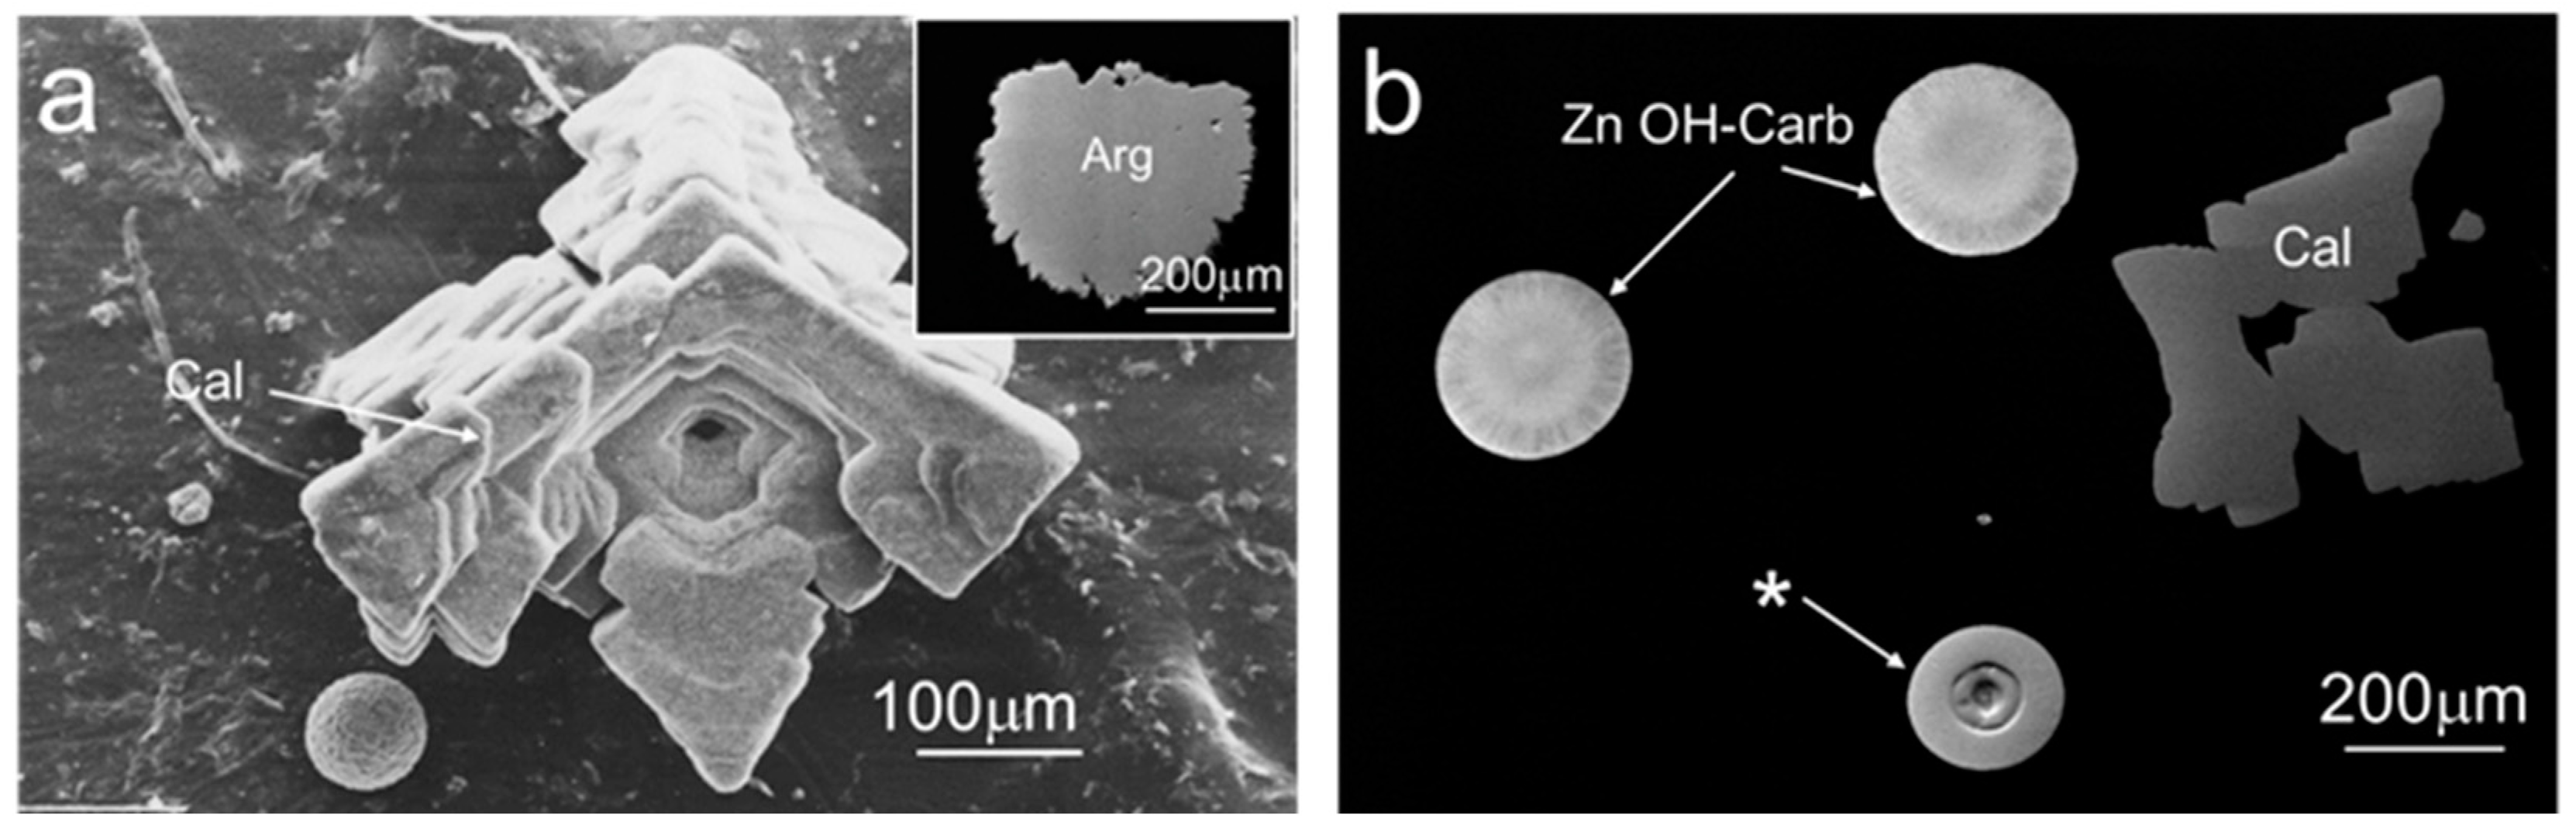
3.1.3. Experiments 4–9

The sub-millimetric solids retrieved from experiments 4 to 9 two months after tw = 37 days are displayed in Figure 6. The grown calcium carbonate polymorphs aragonite (Figure 6a) and calcite (Figure 6b) showed the same external shape as in experiment 3 and occurred alongside spherules resembling the Zn hydroxyl carbonates formed in experiments 1–3, whose composition was confirmed by the spectral and chemical characteristics as those formed in the previously described settings. The BSE micrographs in Figure 6b,c show a different phase overgrowing both aragonite and calcite, respectively, whose chemical composition included an element with higher Z.
Figure 7 illustrates the Raman spectral information acquired on a representative calcite crystal (Figure 7b) and its overgrown phase (Figure 7c). The spectrum displayed in Figure 7b reveals a set of bands in excellent agreement with the reference data regarding calcite at 158, 285, 715, and 1089 cm−1 (e.g., [29,30]), with ~36 and 0.4% of Ca and Zn, respectively. The spectrum of the overgrown phase, shown in Figure 7c, reveals a set of bands at ~160, 195, 716, 734, and 1091 cm−1 in good agreement with the reference information regarding the vibrational modes of the smithsonite structure [24]. An intense peak occurred at ~285 cm−1, which could be assigned to Zn-O vibrations in the hydrozincite lattice [24], and the very-low-intensity bands at 1006 and 1043 cm−1 correlated with the ν1 (CO32−) symmetric stretching in parádsasvárite [22] and hydrozincite, respectively. EMP measurements indicated that this smithsonite phase was characterized by ~59% Zn and 2.5% Ca. However, calcium analyte from across the phase boundary most likely interfered with the assessment since the area of analysis was near the EMP´s resolution limit.

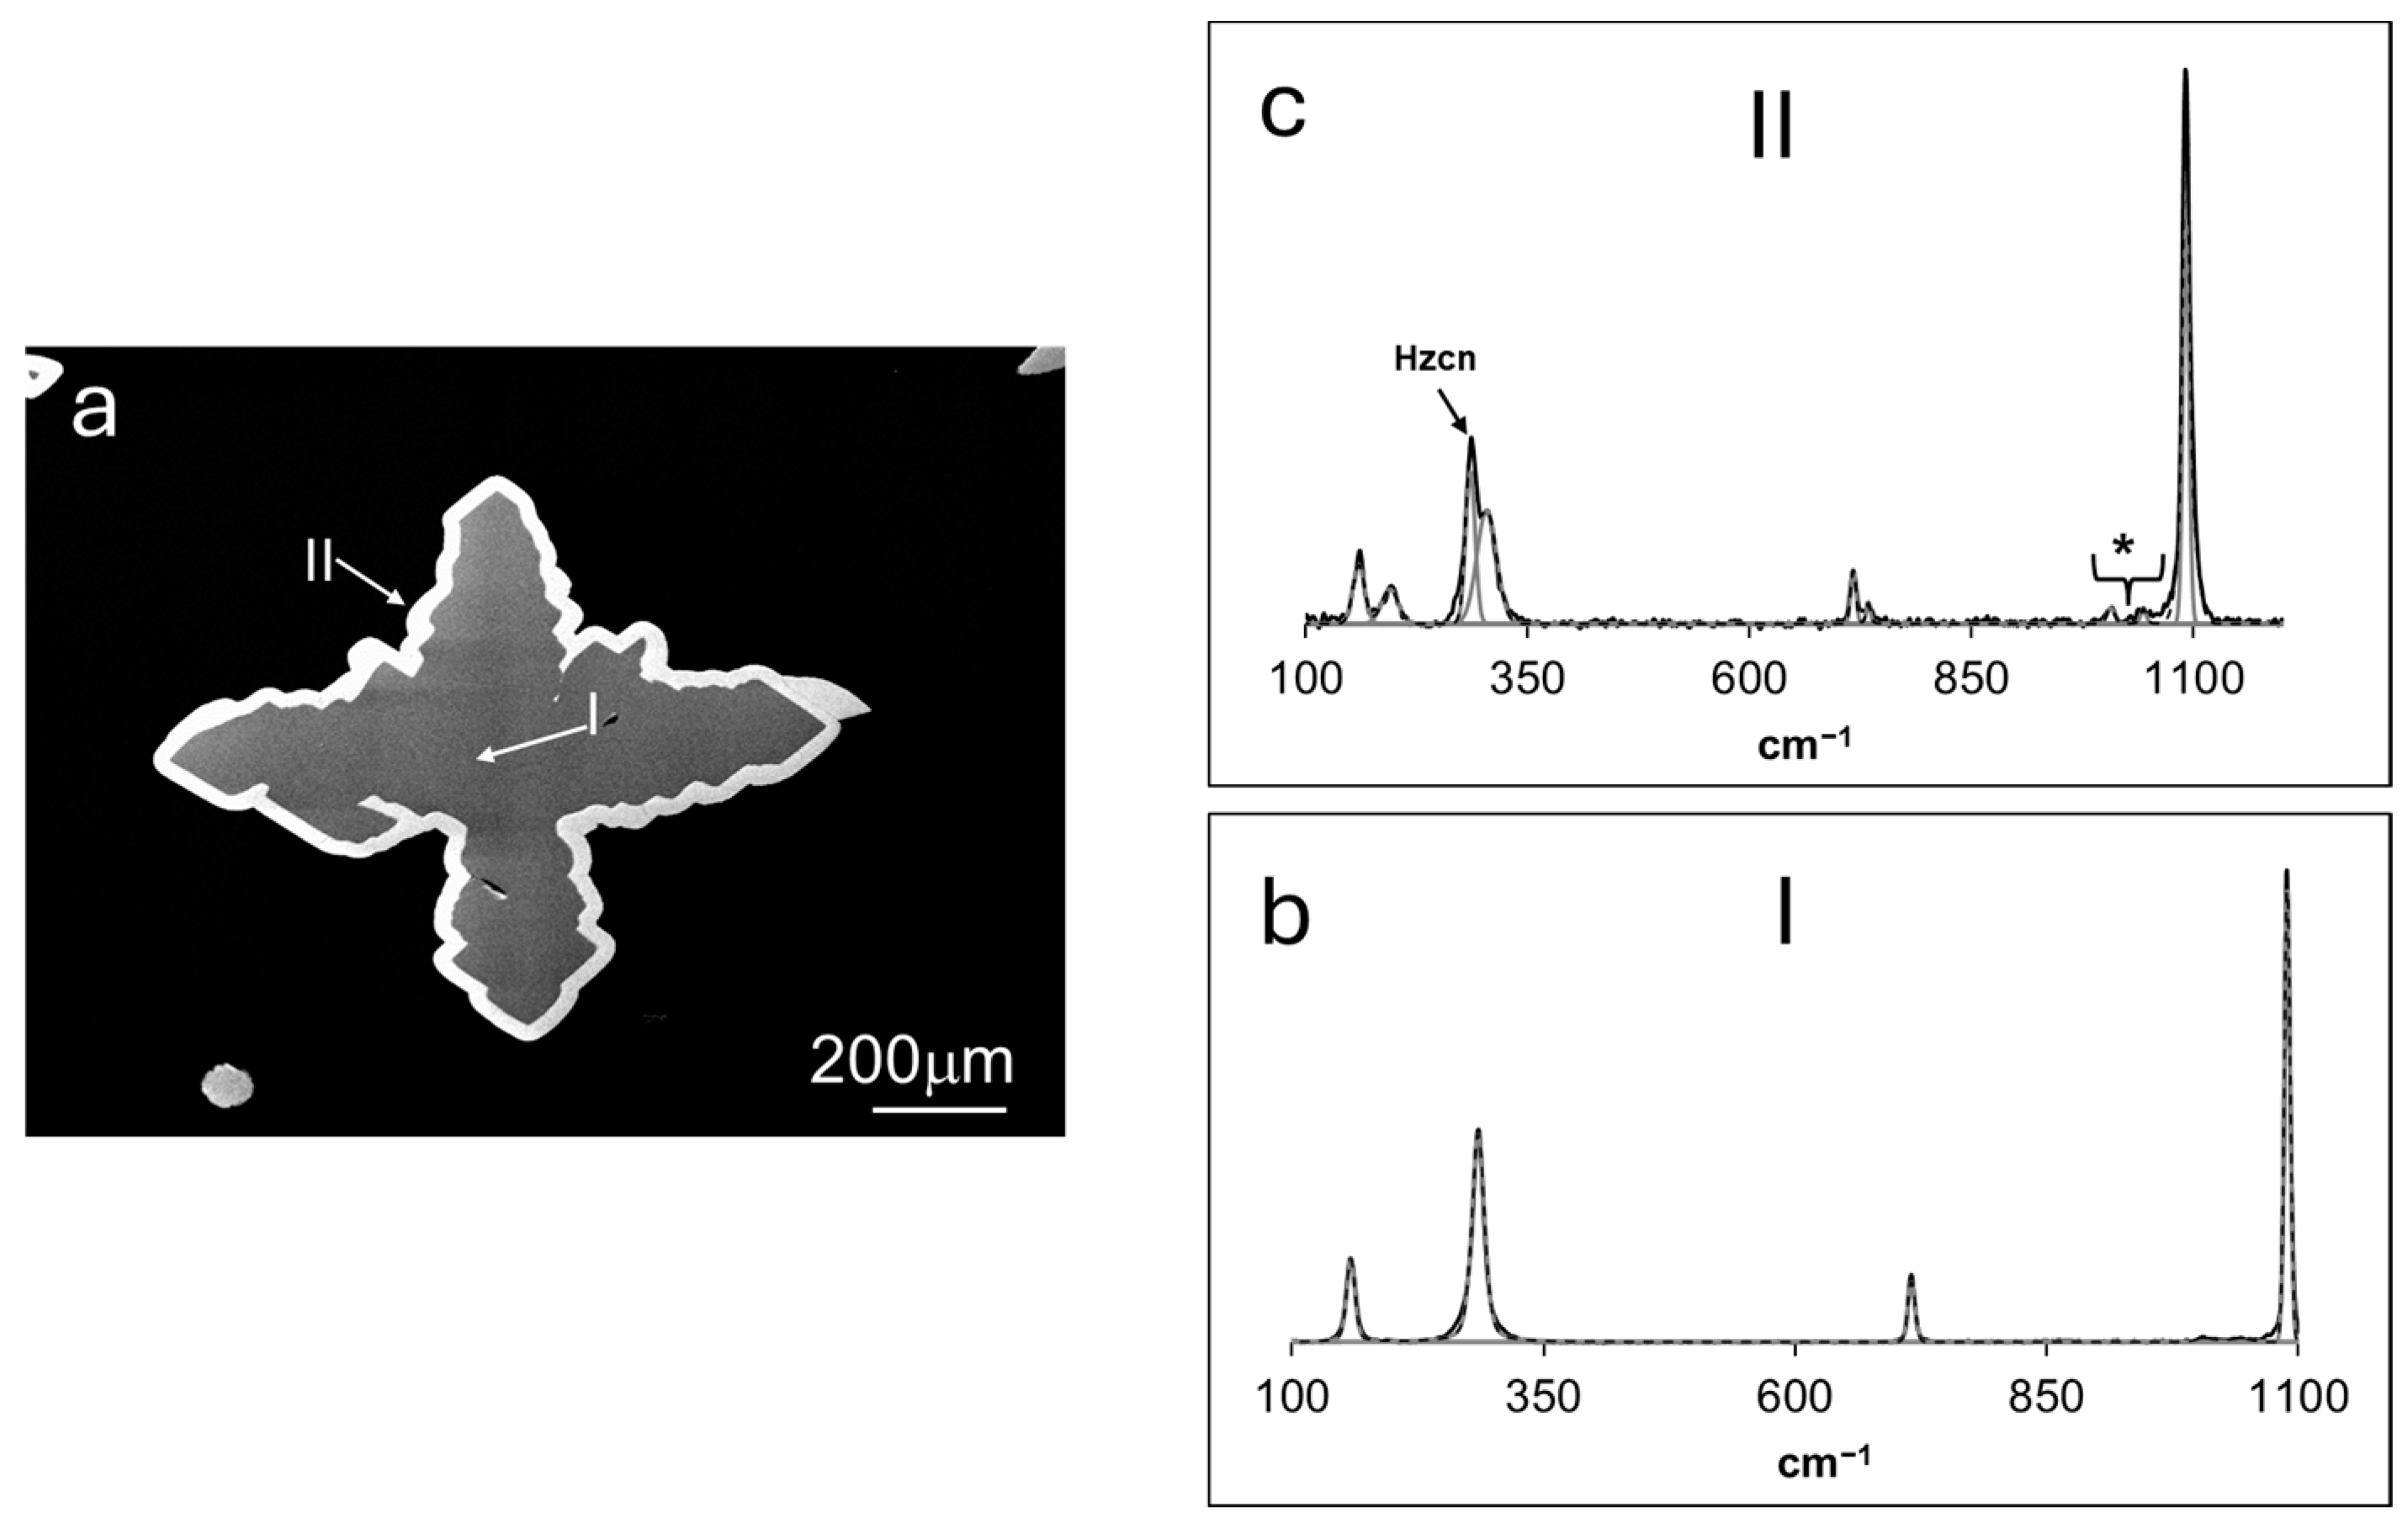
3.1.4. Experiments 10–15

Experiments 10–15 involved lower supersaturation conditions with respect to Zn carbonates, starting with Ca/Zn ≥ 1 and Na2CO3 < 0.4 M. In these experiments, only polymorphs of CaCO3 formed, overgrown by a secondary phase and in the absence of spherulitic solids. Waiting times were typically shorter in experiments with higher Na2CO3 starting concentrations (45–54 vs. 62–65 days). Figure 8a depicts a BSE micrograph of a rosette aggregate of acicular crystals, like those found for aragonite in other experiments, overgrown by a massive anhedral phase with a different composition.
The solid at the lower right corner of Figure 8a illustrates the same phase relationship, but the overgrown substrate corresponded to a single crystal of a rhombohedral calcite. Figure 8b shows the Raman spectrum of the overgrown substate, revealing a set of bands at ~157, 211, 707, and 1089 cm−1 that agreed with the reference information regarding aragonite (e.g., [30]). However, bands at ~278 and 300 cm−1 could be assigned to Zn-O vibrational modes in parádsasvárite and hydrozincite, respectively. EMP analysis revealed ~36% of Ca and 1% of Zn in the grown aragonite.
Figure 8c displays the Raman spectrum obtained for the phase overgrowing the aragonite substrate. The revealed set of bands at ~158, 285, 716, and 1088 cm−1 was typical of smithsonite [24], but the low-intensity peaks that occurred at ~1006 and 1043 cm−1 were assignable to the ν1 (CO32−) symmetric stretching mode in parádsasvárite [22] and hydrozincite, respectively. This same spectral feature was found in smithsonite overgrowing calcium carbonates, formed in experiments at higher supersaturation conditions. For comparison purposes, the smithsonite spectrum displayed in Figure 7c is shown shaded in Figure 8c. A close inspection of both Raman results reveals that smithsonite grown at lower supersaturation lacked the intense band at ~285 cm−1 assigned to hydrozincite Zn-O vibrational modes. EMP analysis revealed that this smithsonite contained ~55.6% Zn and 3.8% Ca. Once again, the obtained Ca levels could be attributed to the analyte collected from the aragonite substrate since the exposed area of the smithsonite overgrowth was near the resolution limit of EMP spot analysis.

4. Discussion

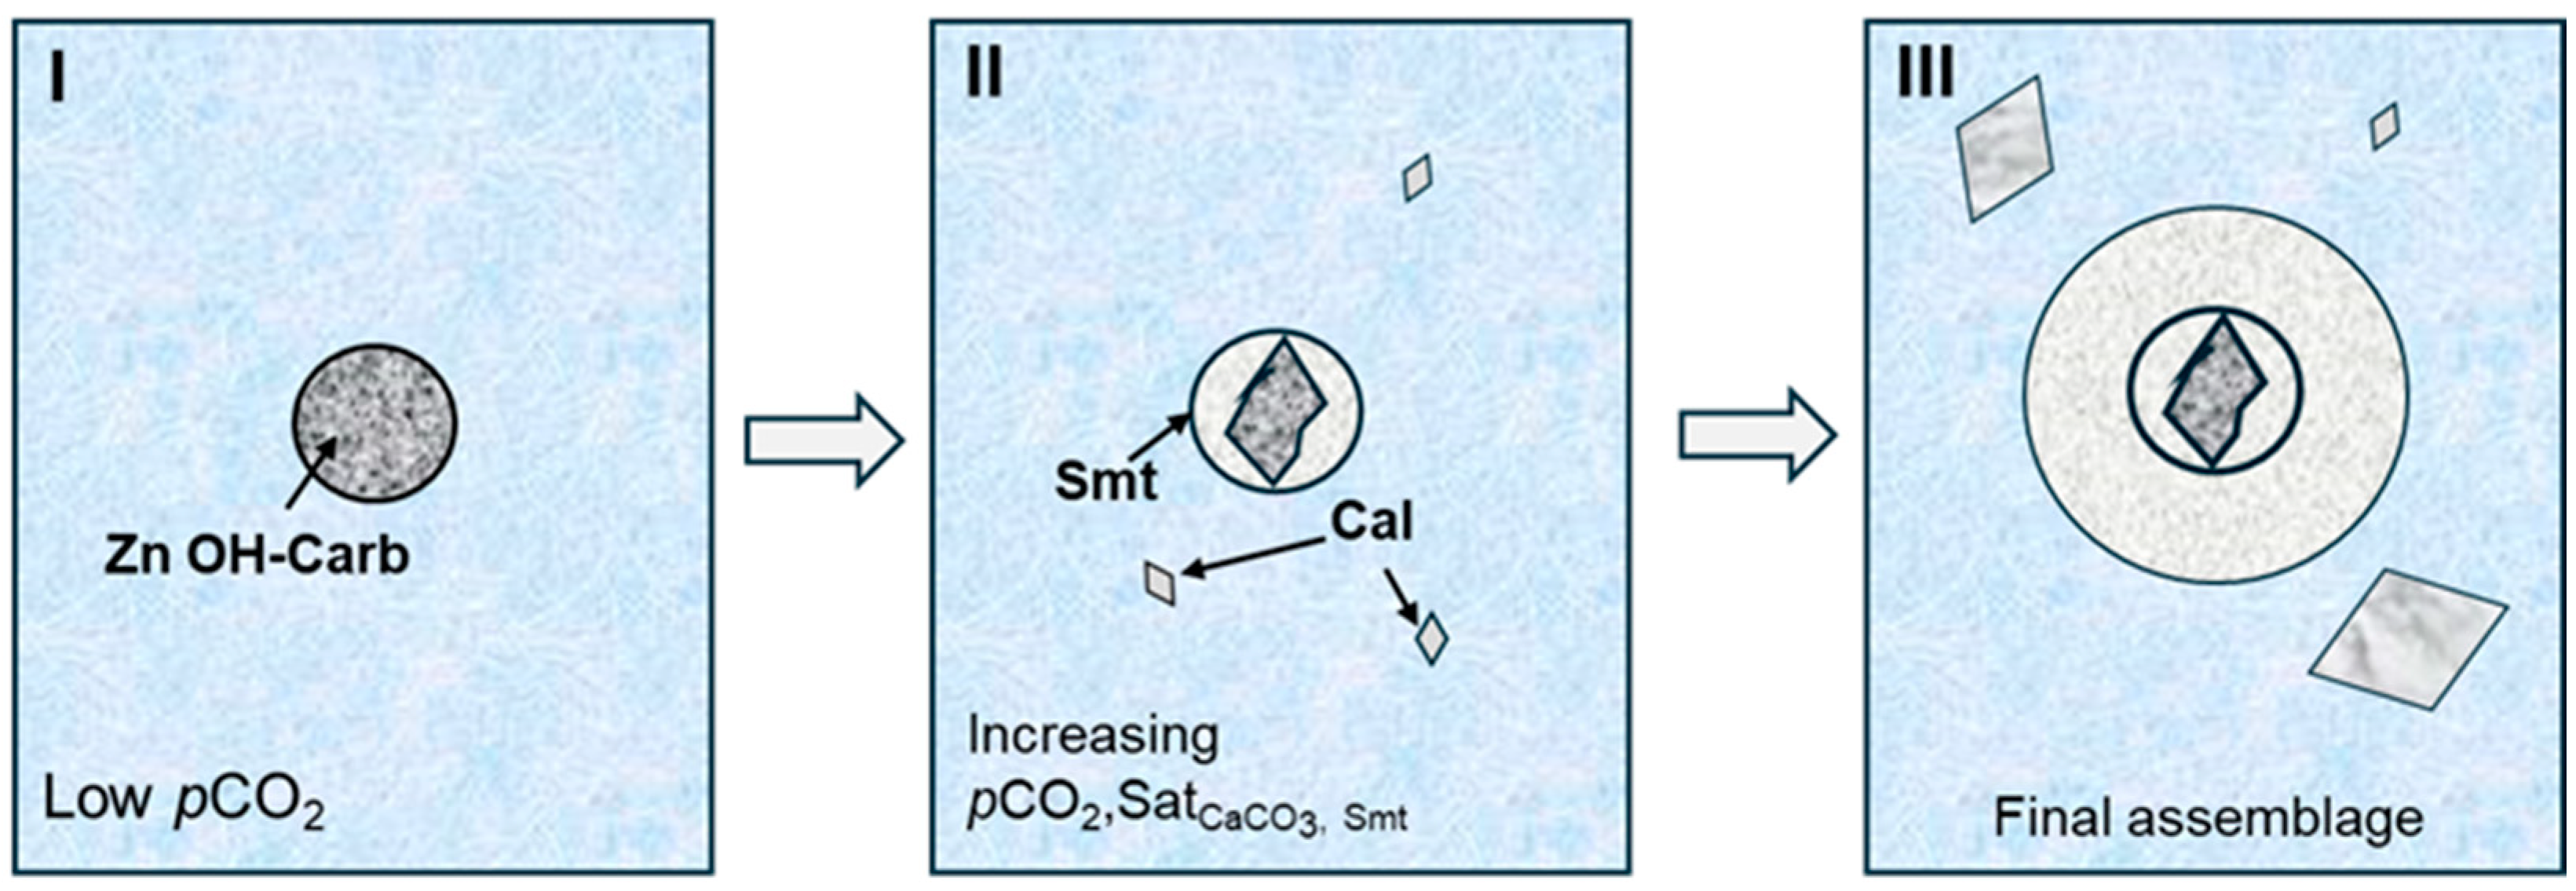
Zn Carbonate Phases: The Controlling Role of CaCO3 Saturation

The overall experimental results reveal that two types of Zn carbonate phases could form under the induced conditions while co-precipitating with Ca carbonates: smithsonite and/or Zn hydroxyl carbonate. The following reaction is illustrative of the thermodynamical equilibrium controlling the formation of each Zn phase [24]:
Zn5(CO3)2(OH)6 (s) + 3CO2 (g) ↔ 5ZnCO3 (s) + 3H2O (g)
Equation (1) reveals that pCO2 controls the relative stability of these phases, with the nucleation of smithsonite being favored at a higher partial pressure of CO2 than hydrozincite [8,31]. Regardless of the contentious nature of hydrozincite´s true solubility, the equilibria expressed by equation 1 are invoked to explain the rare occurrence of hydrozincite in nature, stemming from the narrow CO2 partial pressure conditions that enable its formation [24,31]. In the present set of experiments, Zn was diffused alongside Ca in a silica hydrogel column, and, therefore, the relative saturation with respect to calcium carbonate phases also needed to be considered. The precipitation reaction of all CaCO3 polymorphs in aqueous media may be written as
CaCO3 (s) + CO2 (g) + H2O (l) ↔ Ca 2+ (aq) + HCO3 (aq)
A close inspection of reaction 2 reveals that CaCO3 nucleation must necessarily increase pCO2, as evidenced by the degassing of natural waters underpinning the formation of stalactites and stalagmites in karstic caves. In the present experimental conditions, once aqueous solutions began to diffuse through the hydrogel column, the buffering effect of atmospheric CO2 was lost and supersaturation with respect to CaCO3 drove pCO2 levels at nucleation sites. Thus, in experiments 1–2, where no calcium carbonate phases formed, only Zn hydroxyl carbonate grew since the pCO2 threshold controlling smithsonite precipitation was not attained. As saturation with respect to CaCO3 phases was reached (experiment 3 and onwards) and pCO2 increased, the first formed Zn hydroxyl carbonate began to dissolve and smithsonite nucleation was hence enabled. The heterogeneous nucleation evidenced by the multiphase spherulitic aggregate displayed in Figure 5a is illustrative of the reactive pathway followed by the system concerning the co-precipitation of Zn and Ca carbonates. Figure 9 illustrates the sequence of mineral reactions defining the texture shown by this type of spherules obtained in experiment 3.
It is worth mentioning that experiments performed at lower supersaturation with respect to Zn carbonates (experiments 10–15) did not form Zn hydroxyl carbonate spherules two months after tw. This fact can be explained by the higher supersaturation with respect to CaCO3 carbonates attained in the gel column, which quickly inhibited the formation of hydroxyl carbonates, favoring smithsonite nucleation instead. An alternative explanation could lie in the dissolution of Zn hydroxyl carbonates in the subsequent two months to tw and prior to sample extraction. However, the latter seems unlikely since the texture displayed in Figure 5a clearly indicates that pseudo-equilibrium with respect to Zn hydroxyl carbonates may be attained in the hydrogel. In the depicted spherule, a core of the latter phase occurred, isolated from the gel media by the overgrown smithsonite, which was in true equilibria with the diffusing reactants. Furthermore, such an assemblage suggests that the growth rate of smithsonite was higher than the dissolution rate of the Zn hydroxyl carbonate under increasing pCO2.
The solubility and nature of the grown Zn hydroxyl carbonates should also be mentioned. Aside from pCO2, [13] demonstrated that the solubility of hydrozincite is strongly controlled by crystal size and the associated surface energy. Furthermore, the question remains whether hydrozincite is in fact a stoichiometric solid or if significant variations in CO32−/OH contents may occur, rendering the straightforward application of the law of Mass Action for pure phases unsuitable for estimating thermodynamic solubility in such cases. The large changes in lattice parameters among hydrozincites of different origins determined by the former authors suggest disruptions in the stacking order of tetrahedral–octahedral–tetrahedral sheets perpendicular to a0 [32], which indicates that deviations from the ideal stoichiometry of Zn2+, CO32−, and/or OH components are possible or that the structure tolerates the incorporation of extraneous impurities. The occurrence of chemical variability in natural hydrozincites with the corresponding changes in apparent solubility was recently demonstrated by [5]. Our Raman, EMP, and XRD results point towards the occurrence of variations in the stoichiometry of poorly crystalline Zn hydroxyl carbonates, with shared structural characteristics of parádsasvárite and hydrozincite.

5. Conclusions

The present experimental study intended to assess the co-nucleation and growth of Zn and Ca carbonates in nano-porous media through the diffusive transport of reagents in inert silica hydrogel, employing different starting Ca/Zn and saturation conditions. The results obtained indicate that the grown Zn-bearing phases corresponded to smithsonite and/or Zn hydroxyl carbonate, while CaCO3 polymorphs aragonite and calcite also crystallized. The phase assemblages and textural features of grown solids point towards a controlling effect of the supersaturation with respect to calcium carbonates over the crystallized Zn phases through the changes in the pCO2 in the hydrogel media. Thus, the nucleation and growth of Ca carbonates increased pCO2 in the hydrogel, favoring the formation of smithsonite, while lower saturation with respect to Ca carbonates yielded the crystallization of Zn hydroxyl carbonate. The Raman, XRD, and EMP data here presented indicate that the latter phase corresponded to a non-stoichiometric, poorly crystalline solid, whose thermodynamic solubility could not be assessed in terms of a known pure Zn hydroxyl carbonate composition, such as hydrozincite or parádsasvárite. The results gathered in the present study underline the relevance of considering thermodynamical supersaturation conditions with respect to calcium carbonate polymorphs in natural systems, especially altered Zn ores, when assessing the most stable zinc carbonate phases.

Supplementary Materials

The following supporting information can be downloaded at https://www.mdpi.com/article/10.3390/min14121274/s1, Representative Raman spectral data of experimentally produced pure CaCO3 phases (calcite and aragonite).

Author Contributions

Conceptualization, A.F.-G. and N.S.-P.; crystal growth experiments and SEM and EMP analysis, A.F.-G.; Raman and XRD analyses, N.S.-P.; data treatment, A.J.P.; writing and preparation of original draft, A.J.P.; writing—reviewing and editing, A.J.P., N.S.-P. and A.F.-G.; funding acquisition and project administration, A.F.-G. All authors have read and agreed to the published version of the manuscript.

Funding

This study was supported by the Ministry of Science and Innovation (Spain) under projects PID2021-125467NB-I00 and CI-MCI-21-PID2020-113558RB-C41.

Data Availability Statement

The raw data supporting the conclusions of this article will be made available by the authors on request.

Conflicts of Interest

The authors declare no conflicts of interest.

References

  1. Wang, D.; Zheng, L.; Ren, M.; Li, C.; Dong, X.; Wei, X.; Zhou, W.; Cui, J. Zinc in soil reflecting the intensive coal mining activities: Evidence from stable zinc isotopes analysis. Ecotoxicol. Environ. Saf. 2022, 239, 113669. [Google Scholar] [CrossRef]
  2. Marguí, E.; Queralt, I.; Carvalho, M.; Hidalgo, M. Assessment of metal availability to vegetation (Betula pendula) in Pb-Zn ore concentrate residues with different features. Environ. Pollut. 2007, 145, 179–184. [Google Scholar] [CrossRef]
  3. Beattie, R.E.; Henke, W.; Campa, M.F.; Hazen, T.C.; McAliley, L.R.; Campbell, J.H. Variation in microbial community structure correlates with heavy-metal contamination in soils decades after mining ceased. Soil Biol. Biochem. 2018, 126, 57–63. [Google Scholar] [CrossRef]
  4. Schwartz, M. Cadmium in Zinc Deposits: Economic Geology of a Polluting Element. Int. Geol. Rev. 2000, 42, 445–469. [Google Scholar] [CrossRef]
  5. Giannetta, M.G.; Soler, J.M.; Queralt, I.; Cama, J. Natural attenuation of heavy metals via secondary hydrozincite precipitation in an abandoned Pb-Zn mine. J. Geochem. Explor. 2023, 251, 107236. [Google Scholar] [CrossRef]
  6. Féher, B.; Szakáll, S.; Zajzon, N.; Miháli, J. Parádsasvárite, a new member of the malachite-rosasite group from Parádsasvárar, Mátra Mountains, Hungary. Mineral. Petrol. 2015, 109, 405–411. [Google Scholar] [CrossRef]
  7. Livingstone, A.; Champness, P.E. Brianyoungite, a new mineral related to hydrozincite, from the north of England orefield. Mineral. Mag. 1993, 57, 660–670. [Google Scholar] [CrossRef]
  8. Alwan, A.K.; Williams, P.A. Mineral formation from aqueous solutions. Part, I. The deposition of hydrozincite from natural waters. Transit. Met. Chem. 1979, 4, 128–132. [Google Scholar] [CrossRef]
  9. Podda, F.; Zuddas, P.; Minacci, A.; Pepi, M.; Baldi, F. Heavy Metal Coprecipitation with Hydrozincite [Zn5(CO3)2(OH)6] from Mine Waters Caused by Photosynthetic Microorganisms. Appl. Environ. Microbiol. 2000, 66, 5092–5098. [Google Scholar] [CrossRef]
  10. Schindler, P.; Reinert, M.; Gamsjäger, H. Loslichkeitskonstanten und freie Bildungsenthalpien von ZnCO3(s) und Zn5(OH)6(CO3)2 bei 25 °C. Helv. Chim. Acta 1969, 52, 2327–2332. [Google Scholar] [CrossRef]
  11. Zachara, J.M.; Kittrick, J.A.; Dake, L.S.; Harsh, J.B. Solubility and surface spectroscopy of zinc precipitates on calcite. Geochim. Cosmochim. Acta 1989, 53, 9–19. [Google Scholar] [CrossRef]
  12. Preis, W.; Gamsjäger, H. Solid + solute phase equilibria in aqueous solution. XIII. Thermodynamic properties of hydrozincite and predominance diagrams for (Zn2+ + H2O + CO2). J. Chem. Thermodyn. 2001, 33, 803–819. [Google Scholar] [CrossRef]
  13. Medas, D.; De Giudici, G.; Podda, F.; Meneghini, C.; Lattanzi, P. Apparent energy of hydrated biomineral surface and apparent solubility constant: An investigation of hydrozincite. Geochem. Cosmochim. Acta 2014, 140, 349–364. [Google Scholar] [CrossRef]
  14. Frost, R.L.; López, A.; Wang, L.; Scholz, R.; Sampaio, N.P. SEM, EDX and Raman and infrared spectroscopic study of brianyoungite Zn3(CO3,SO4)(OH)4 from Esperanza Mine, Laurion District, Greece. Spectrochim. Acta Part A 2015, 149, 279–284. [Google Scholar] [CrossRef]
  15. Prieto, M.; Cubillas, P.; Fernández-González, A. Uptake of dissolved Cd by biogenic and abiogenic aragonite: A comparison with sorption onto calcite. Geochim. Cosmochim. Acta 2003, 67, 3859–3869. [Google Scholar] [CrossRef]
  16. Hua, B.; Deng, B.L.; Thorton, E.C.; Yang, J.; Amonette, J.E. Incorporation of chromate into calcium carbonate structure coprecipitation. Water Air Soil Pollut. 2007, 179, 381–390. [Google Scholar] [CrossRef]
  17. Katsikopoulos, D.; Fernández-González, A.; Prieto, M. Crystallization behaviour of the (Mn, Ca)CO3 solid solution in silica gel: Nucleation, growth and zoning phenomena. Mineral. Mag. 2009, 73, 269–284. [Google Scholar] [CrossRef]
  18. Prieto, M.; Fernández-González, A.; Putnis, A.; Fernández-Díaz, L. Nucleation, growth, and zoning phenomena in crystallizing (Ba,Sr)CO3, Ba(SO4,CrO4), (Ba,Sr)SO4, and (Cd,Ca)CO3 solid solutions from aqueous solutions. Geochim. Cosmochim. Acta 1997, 61, 3383–3397. [Google Scholar] [CrossRef]
  19. Wada, N.; Yamashita, K.; Umegaki, T. Effects of silver, aluminum, and chromium ions on the polymorphic formation of calcium carbonate under conditions of double diffusion. J. Colloid Interface Sci. 1998, 201, 1–6. [Google Scholar] [CrossRef]
  20. Henisch, H.K. Crystals in Gels and Liesegang Rings; Cambridge University Press: Cambridge, UK, 1988; p. 197. [Google Scholar]
  21. Wojdyr, M. Fityk: A general-purpose peak fitting program. J. Appl. Crystallogr. 2010, 43, 1126–1128. [Google Scholar] [CrossRef]
  22. Perchiazzi, N.; Demitri, N.; Fehér, B.; Vignola, P. On the crystal chemitry of rosasite and parádsasvárite. Can. Mineral. 2017, 55, 1027–1040. [Google Scholar] [CrossRef]
  23. Whermeister, U.; Soldati, A.L.; Jacob, D.E.; Häger, T.; Hofmeister, W. Raman spectroscopy of synthetic, geological and biological vaterite: A Raman spectroscopic study. J. Raman Spectrosc. 2010, 41, 193–201. [Google Scholar] [CrossRef]
  24. Hales, M.C.; Frost, R.L. Synthesis and vibrational spectroscopic characterization of synthetic hydrozincite and smithsonite. Polyhedron 2007, 26, 4955–4962. [Google Scholar] [CrossRef]
  25. Wang, M.; Jiang, L.; Kim, E.J.; Hahn, S.H. Electronic structure and optical properties of Zn(OH)2: LDA+U calculations and intense yellow luminescence. RSC Adv. 2015, 5, 97496. [Google Scholar] [CrossRef]
  26. Frost, R.L. A Raman spectroscopic study of selected minerals of the rosasite group. J. Raman Spectrosc. 2006, 37, 910–921. [Google Scholar] [CrossRef]
  27. Ghose, S. The crystal structure of hydrozincite (Zn5(CO3)2(OH)6). Acta Crystallogr. 1964, 17, 1051. [Google Scholar] [CrossRef]
  28. Prieto, M.; García-Rui, J.M.; Amorós, J.L. Growth of calcite crystals with non-singular faces. J. Cryst. Growth 1981, 52, 864–867. [Google Scholar] [CrossRef]
  29. Sun, J.; Wu, Z.; Cheng, H.; Zhang, Z.; Frost, R.L. A Raman spectroscopic comparison of calcite and dolomite. Spectrochim. Acta Part A Mol. Biomol. Spectrosc. 2014, 117, 158–162. [Google Scholar] [CrossRef] [PubMed]
  30. Alves, J.F.; Edwards, H.G.M.; Korsakov, A.; De Oliveira, L.F.C. Revisiting the Raman spectra of calcium carbonates. Minerals 2023, 13, 1358. [Google Scholar] [CrossRef]
  31. Williams, P.A. Oxide Zone Geochemistry; Ellis Horwood Ltd.: London, UK, 1999; p. 556. [Google Scholar]
  32. Sanna, R.; De Guidici, G.; Scorciapiano, A.M.; Floris, C.; Casu, M. Investigation of the hydrozincite structure by infrared and solid-state NMR spectroscopy. Am. Mineral. 2013, 98, 1219–1226. [Google Scholar] [CrossRef]
Figure 1. Experimental setup used for crystal growth.
Minerals 14 01274 g001
Figure 2. Representative Raman spectra of solids obtained in experiments 1 and 2, relative to the shift intervals (a) 50 < cm−1 < 450 and (b) 990 < cm−1 < 1140. The inset in (a) depicts a BSE micrograph of a grown solid polished section, with the corresponding Zn% compositional profile measured with EMP. Hznc = Hydrozincite; Prds = Parádsasvárite; Vtr = Vaterite; Smt = Smithsonite.
Minerals 14 01274 g002
Figure 3. Representative micro-X-ray diffraction pattern obtained in a solid grown in experiments 1 and 2. The * marks reflections assignable to parádsasvárite [22]. Negative intensity values are an artifact of background noise removal, without which, pattern interpretation was not possible.
Minerals 14 01274 g003
Figure 4. BSE micrographs of solids grown in experiment 3. (a) Calcite (Cal) crystal displaying a hopper-like growth pattern. The inset displays a polished section of a rosette aggregate of aragonite (Arg) crystals. (b) Zn hydroxyl carbonate spherules (Zn OH-Carb), as obtained in experiments 1 and 2, calcite, and a multi-phase spherule (*) whose Raman spectral analysis revealed a core of Zn hydroxyl carbonate overgrown by layers of smithsonite.
Minerals 14 01274 g004
Figure 5. (a) Polarized reflected-light micrograph of a cross-sectioned multi-phase spherule obtained in experiment 3. The Raman spectra of each grown morphology (I, II, and III) are displayed in (b,c). Smt = smithsonite, Hznc = hydrozincite, Prds = parádsasvárite. * Bands not assigned to smithsonite, see text for explanation.
Minerals 14 01274 g005
Figure 6. BSE micrographs of representative solids grown in experiments 4–9: (a) aragonite (Arg); (b) calcite (Cal) and aragonite with an overgrowth; (c) calcite with an overgrowth; and (d) Zn hydroxyl carbonate.
Minerals 14 01274 g006
Figure 7. (a) BSE micrograph of a cross-sectioned overgrown calcite crystal, representative of those grown in experiments 4–9. The Raman spectra of each grown phase (I and II) are displayed in (b) and (c). Hznc = hydrozincite. * Bands not assigned to smithsonite, see text for explanation.
Minerals 14 01274 g007
Figure 8. (a) BSE micrograph of a cross-sectioned overgrown aragonite crystal, representative of those grown in experiments 10–15. The Raman spectra of each grown phase (I and II) are displayed in (b,c). The spectrum of smithsonite obtained in experiments at higher supersaturation with respect to Zn carbonates (Figure 7c) is displayed in (c). * Bands not assigned to aragonite or smithsonite, see text for explanation.
Minerals 14 01274 g008
Figure 9. Schematic growth sequence of the multi-phase spherule analyzed in Figure 5a. See text for explanation. Smt = smithsonite, Cal = calcite, Zn OH-Carb = zinc hydroxyl carbonate, Satphase = thermodynamic saturation with respect to the phase in subscript.
Minerals 14 01274 g009
Table 1. Initial concentrations of the parent solutions.
ExperimentParent Solutions
Reservoir AReservoir B
Na2CO3 (M)ZnCl2 (M)CaCl2 (M)
E10.50.50.1
E20.50.50.2
E30.50.50.3
E40.50.50.4
E50.50.50.5
E60.50.40.5
E70.50.30.5
E80.50.20.5
E90.50.10.5
E100.30.50.5
E110.10.50.5
E120.30.10.5
E130.10.10.5
E140.30.050.5
E150.10.050.5
Disclaimer/Publisher’s Note: The statements, opinions and data contained in all publications are solely those of the individual author(s) and contributor(s) and not of MDPI and/or the editor(s). MDPI and/or the editor(s) disclaim responsibility for any injury to people or property resulting from any ideas, methods, instructions or products referred to in the content.

