Article

Color Genesis and Compositional Features of Red-Blue Colored Gem-Quality Corundum from Malipo, China

1
School of Gemology, China University of Geosciences, Beijing 100083, China
2
Beijing Institute of Economics and Management, Beijing 100102, China
3
Department of Geology and Mountain Hazards, Karakoram International University, Gilgit 15100, Pakistan
4
Beijing Guoshoudikuang Gem Testing Co., Ltd., Beijing 100083, China
5
State Key Laboratory of Deep Earth and Mineral Exploration, Institute of Geology, Chinese Academy of Geological Sciences, Beijing 100037, China
*
Authors to whom correspondence should be addressed.
Minerals 2025, 15(11), 1099; https://doi.org/10.3390/min15111099
Submission received: 23 August 2025 / Revised: 10 October 2025 / Accepted: 11 October 2025 / Published: 22 October 2025

Abstract

The newly discovered multi-colored corundum (gem quality) alluvial deposit in Malipo, Yunnan Province, is one of the most famous sapphire deposits in China. However, the coloration mechanism and genesis of red-blue colored corundum (RBCC) remain enigmatic. In this study, conventional gemological techniques such as ultraviolet–visible (UV-vis) spectroscopy and laser ablation inductively coupled plasma mass spectrometry (LA-ICP-MS) were employed on an RBCC suite, with a view to unravel its coloration mechanism and compositional characteristics. The results show that the element pairs of Cr3+, Fe2+-Ti4+, and Fe3+-Fe3+ in principle contribute to the red coloration, while the blue color in corundum is predominantly caused by the Fe2+-Ti4+ pair, and subordinately by Cr3+ and Fe3+. Cr is likely the cause of the purple color. The Cr content in the red zone is significantly higher than that in the blue zone, while the Ti and V contents in the red zone are notably lower than in the blue zone. High Cr/Ga and (V + Cr)/Ga values of the Malipo RBCC suggest a metamorphic origin. All color zones of RBCC demonstrate stability in Ga content and an extremely low content of Mg, with minor fluctuations in Fe content, indicating that the formation process of the Malipo RBCC was influenced by magma mixing.

1. Introduction

The multi-colored gem-quality corundum is characterized by its vibrant colors and limited availability, which are factors that significantly influence its value [1]. Understanding the causes of coloration and the origins of rubies and sapphires has long been a major focus in gemological research [2]. The types and concentrations of trace elements, such as Cr, Fe, Ti, and Mn play a critical role in determining the formation of corundum gemstones, providing an essential basis for identifying the genesis of gems related to basalt or metamorphic rocks [3,4,5]. The specific causes of coloration and compositional characteristics vary depending on the origin. Furthermore, some of the methods used to identify these characteristics overlap, making further investigations necessary to refine the identification of the causes of coloration and origin of corundum.
Yunnan is one of the major gemstone-producing regions in China [6], with three major deposits located in Ailao, Gaoligong, and Maguan–Malipo Mountains. Yunnan’s history of ruby use dates back several centuries. According to Bowu Yaolan (Essential Survey of All Things of Interest) by Gu Tai, during the Yongle Reign (1403–1424) of the Ming Dynasty, a dark red ruby weighing approximately 155 g was discovered in Baojing, Yunnan (a border area), and was valued at 112 kg of silver [7], equivalent to approximately USD 340,000 today. Recently, a corundum deposit containing about 4.5 million tons was discovered in Malipo County. This deposit boasts a corundum content of over 35%, covering a mining area of approximately 120 square kilometers. The minerals are durable, the reserves are substantial, and mining is relatively easy. Initially, Malipo blue gemstones were used mainly as industrial raw materials, but over time, the production of gem-quality corundum has steadily increased [8]. Notably, in 2016, a 3.6 kg ruby–sapphire crystal from Malipo attracted significant public attention. However, the specific causes and origin of the coloration of this corundum remain unclear.
In this study, multi-colored corundum with red and blue colors as dominant hues from the Malipo mine area was investigated using various analytical techniques, including microscopy, UV fluorescent lamps, refractometers, balances, ultraviolet–visible (UV-vis) spectroscopy, and LA-ICP-MS, to determine its gemological, spectroscopic, and compositional features. This research aims to provide insights into the further development and utilization of the Malipo red-blue colored corundum (RBCC).

2. Geological Background and Samples

The RBCC crystals examined in this study were collected from the Shiguanmen-Luoshuidong corundum mining area in Malipo County, located in the Wenshan Zhuang and Miao Autonomous Prefecture of Yunnan, China. This mining area lies within the Wenshan-Funing fault belt of the Southeastern Yunnan fold belt, a component of the South China fold system [9]. The Nanwen River metamorphic core complex, a large dome-shaped complex geological structure, forms the central feature of this region, with the Nanwen River as its core. The primary stratigraphic units include the Mengdiao Group of the lower Proterozoic, Xinzhai Formation of the upper Proterozoic, and Paleozoic such as Cambrian and Devonian. The ore-bearing wall rocks are distributed around the Nanwen River metamorphic core complex. This region’s intense magmatic activity and complex metamorphism have provided favorable geological conditions for mineralisation, creating an ideal environment for the formation of multi-colored corundum deposits [10] (Figure 1).
Shiguanmen-Luoshuidong corundum deposits in Malipo County were predominantly formed during the Lower Permian period. This area contains seven corundum ore bodies, measuring 95–280 m in length, 40–210 m in width, and 9.3–42 m in thickness. These deposits exhibit disconformity with the underlying carboniferous marble and consist mainly of medium-grained mixed corundum ores, which are typically grey-red and grey black (Figure 2). Locally, the deposit is referred to as the “chloritoid, Zultanite-corundum deposit” [8].

3. Samples and Methods

3.1. Samples

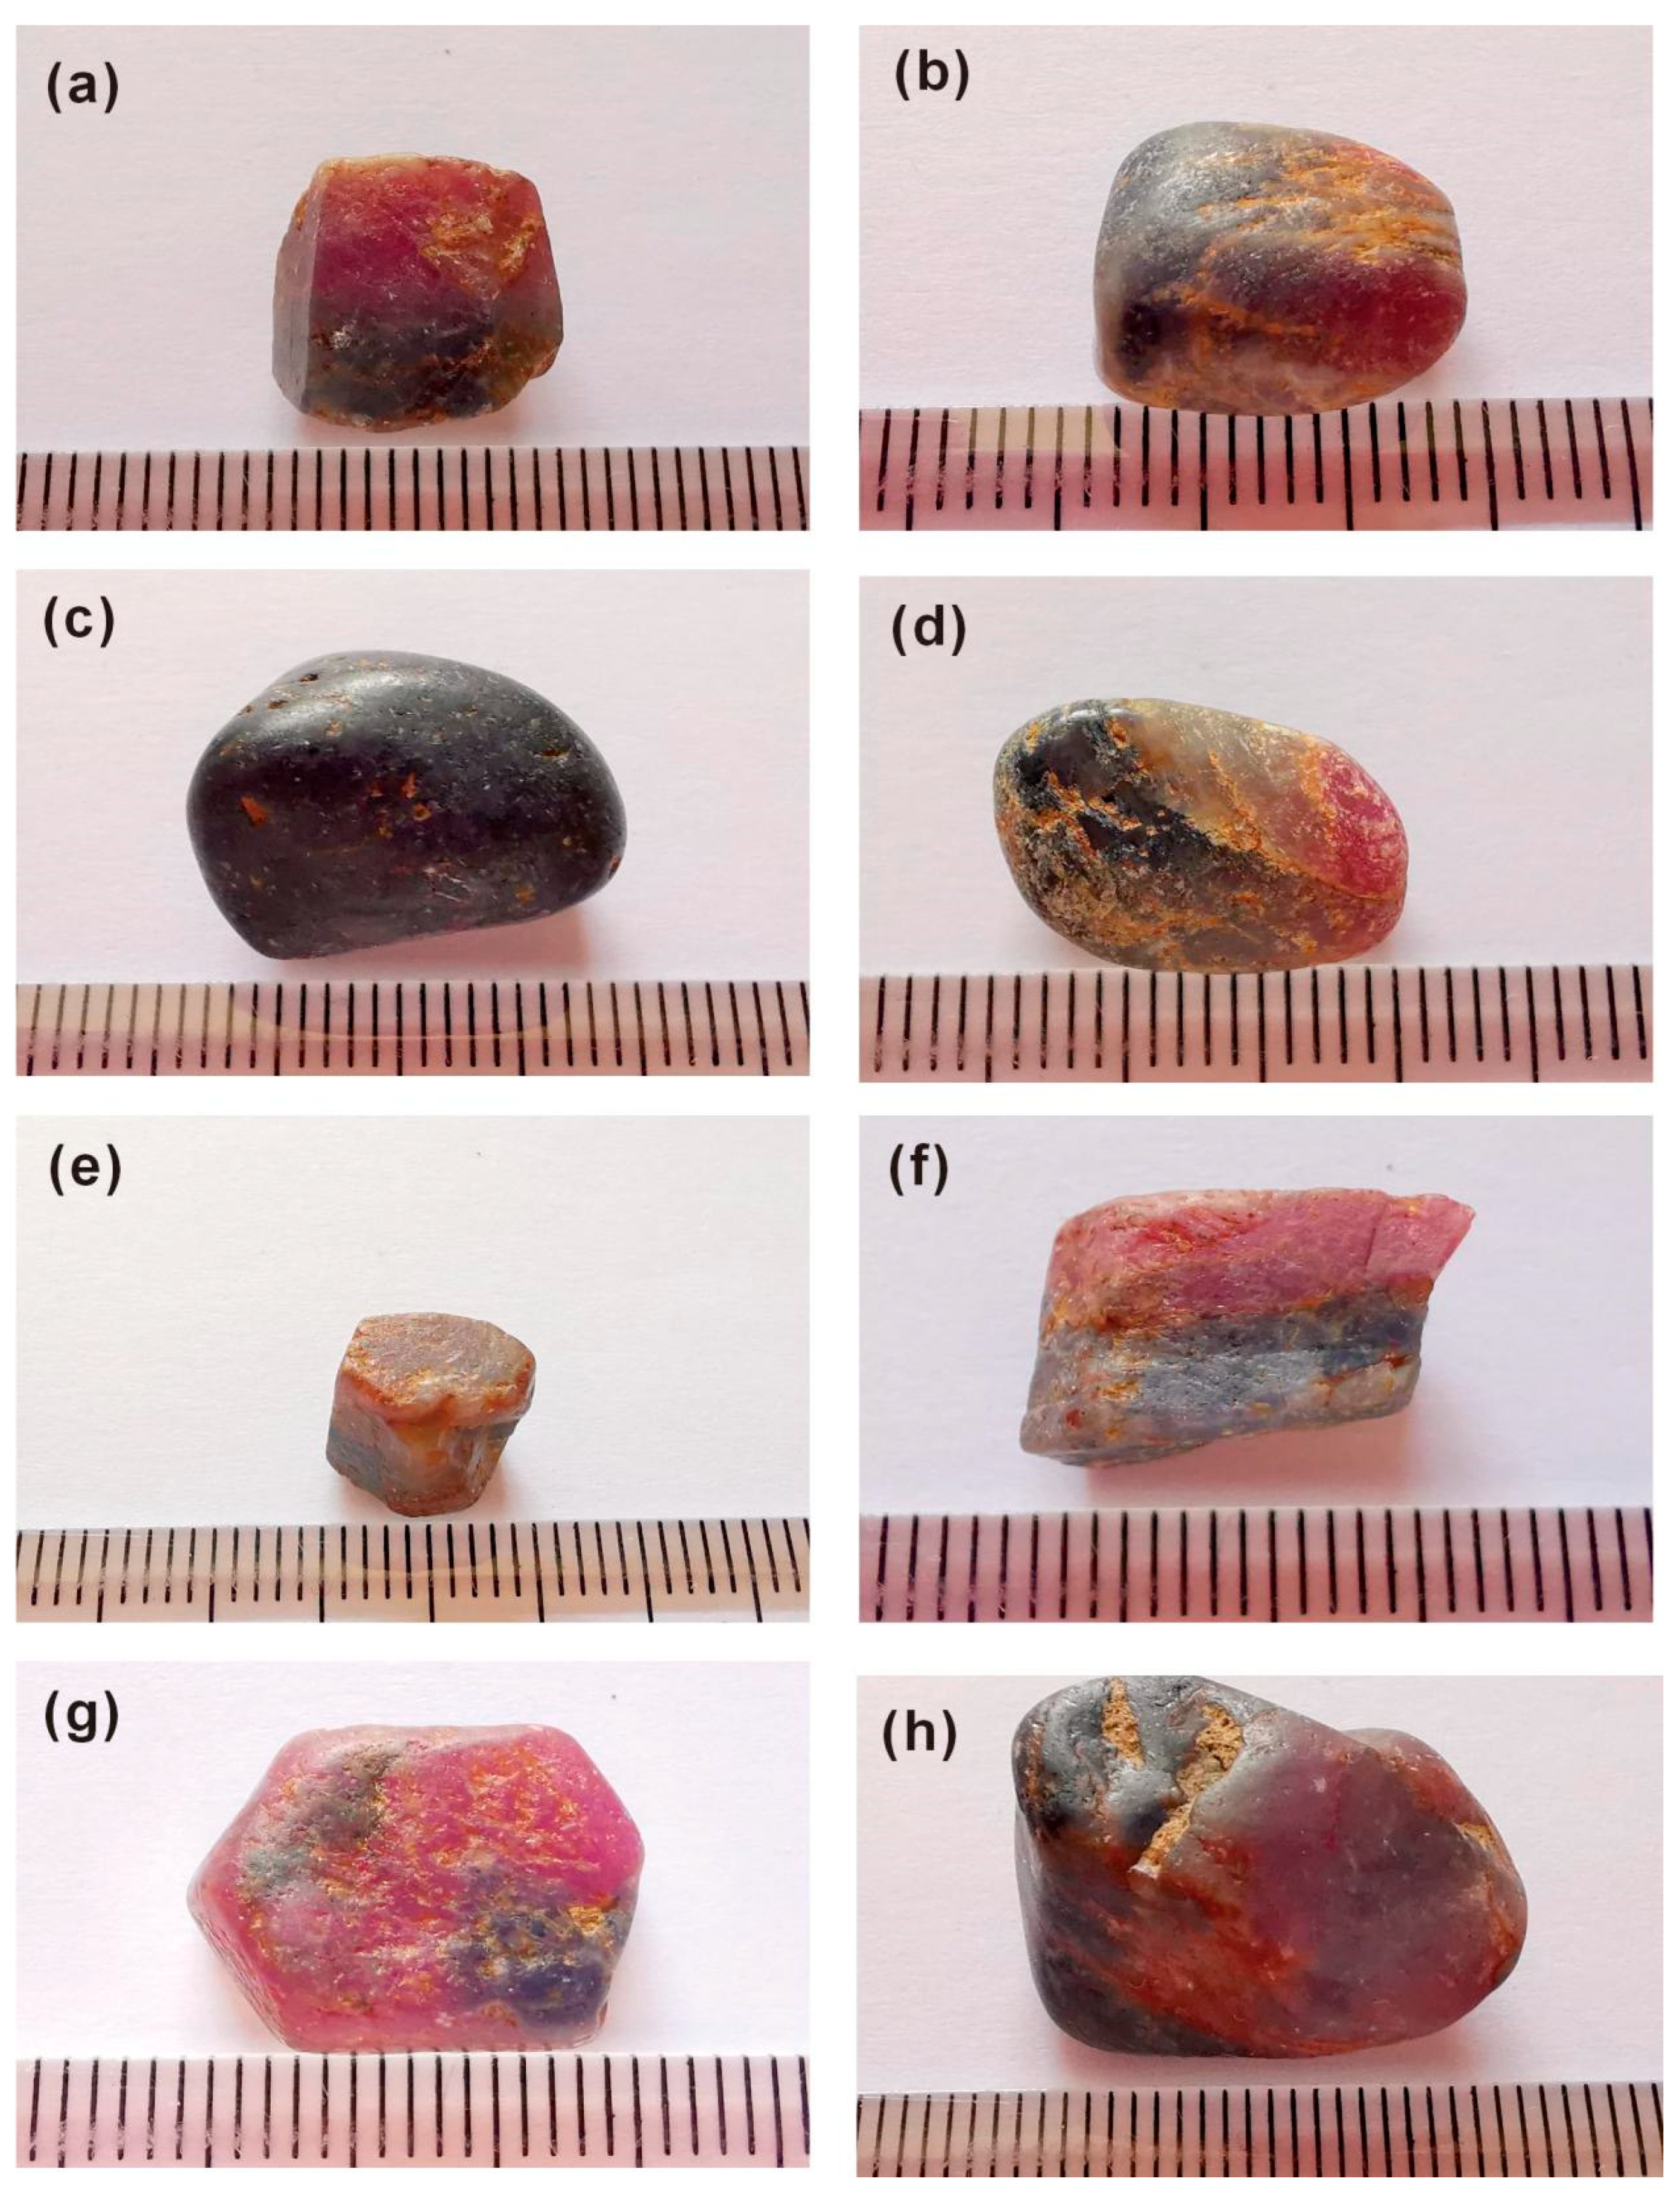
This paper investigates a total of eight RBCC samples, identified as Sap-1, Sap-2, Sap-4, Sap-5, Sap-7, Sap-9, Sap-10, Sap-12 (Figure 3). They are mostly gravel-shaped minerals with particle sizes ranging from 28 × 13 × 15 mm to 10 × 7 × 5 mm. They were cut into 1 mm thick slices with parallel slides and polished surfaces. Due to the striking contrast between red and blue, Sap-1 and Sap-5 are the main samples in the study.

3.2. Methods

Gemological characteristic tests were carried out at the Gem Laboratory of the China University of Geosciences (Beijing, China). Eight RBCC samples from Malipo deposits were tested using microscopes, ultraviolet fluorescent lamps, refractometers, and precision balances.
UV-Vis absorption spectra were obtained at the Gem Research Laboratory of China University of Geosciences (Beijing), using a UV-2000 spectrophotometer manufactured by Lab Tech in Beijing, China. The UV-Vis wavelength range was 300–800 nm, with a recording width of 2.0 and slit width of 2 nm. The room temperature during testing was 24 °C. The measurement method was T%. In this study, UV-Vis spectroscopy was applied exclusively to Sap-1 and Sap-5.
Spectroscopic measurements of trace chemical composition were conducted in the same spots using a Thermo Element XR mass spectrometer, equipped with a New Wave UP193 model laser at the National Center for Geological Analysis and Research (CAGS). The laser parameters were set as follows: laser wavelength 193 nm, beam spot size 35 μm, pulse frequency 10 Hz, output energy 100%, and pulse energy 6.0 mJ. Plasma mass spectrometry parameters were as follows: cooling gas flow (Ar) 16.21 L/min, auxiliary gas flow (Ar) 0.86 L/min, carrier gas flow (He) 0.743 L/min, sample gas flow (Ar) 0.910 L/min, and radio frequency generation power 1300 W. Other parameters included the following: resolution mode, low resolution; scan mode, E-scan; rest time, 1 ms; sampling time, 3 ms; the number of points per peak, 100; detector dead time, 14 ns; background acquisition time, 20 s; ablation time, 40 s; signal intensity (Th), 160,000 cps; and oxide yield (ThO/Th), 0.24%. Data processing was normalized using Al as the internal standard, standard sample Nist612/Nist610, and multiple external standard matrices. As a quality control measure, a standard sample was reanalyzed as an unknown substance after every 30 runs to ensure accuracy. LA–ICP–MS was applied selectively to Sap-1 and Sap-5.

4. Results

4.1. Morphological and Physical Characteristics

The RBCC suite crystals predominantly display irregular particle shapes, with only a few exhibiting hexagonal columns. The red and blue zones coexist within the same crystal, and in some cases, the three colors, i.e., red, blue and white, are present together. Within the crystal, the blue sections appear uniformly dark with a purple hue, while the red zones display an intense coloration with visible rosy-red and pink hues. The samples display colors that are irregularly distributed. Some samples exhibit two colors along the C-axis, while others show two colors on the cross-sectional surface of the corundum crystal. The crystals display a vitreous luster, with most being semi-transparent and one being non-transparent. They are further characterized by refractive index values (Ne) between 1.760 and 1.763, No = 1.770–1.772, DR = 0.009–0.010, with an average specific gravity of 3.79. Due to the presence of numerous surface cracks and cavities in Sap-1 and Sap-4, these samples were excluded from the evaluation of the average specific gravity data. Under the 10× magnifier, twinning wisps are observed alongside uneven fractures (Table 1).

4.2. UV-Vis Spectroscopic Characteristics of the RBCC Samples

The UV-Vis spectroscopic results of the samples Sap-1 and Sap-5 are shown in Figure 4. The spectroscopic characteristics of the red zone of samples Sap-1 and Sap-5 are as follows: For Sap-1, broad absorption peaks are observed at 398 nm and 555 nm, while weak broad absorption peaks appear at 656 nm and 692 nm. For Sap-5, broad absorption peaks occur at 395 nm and 551 nm, while weak absorption peaks are observed at 665 nm, 690 nm and 787 nm.
The spectroscopic characteristics of the blue zone of samples Sap-1 and Sap-5 are as follows: For Sap-1, broad absorption peaks occur at 398 nm and 558 nm, with a weak absorption peak at 670 nm. For Sap-5, wide absorption peaks are observed at 389 nm and 562 nm, with the peak at 562 nm appearing smoother, and a weak absorption peak at 669 nm.

4.3. Chemical Composition of the RBCC Samples

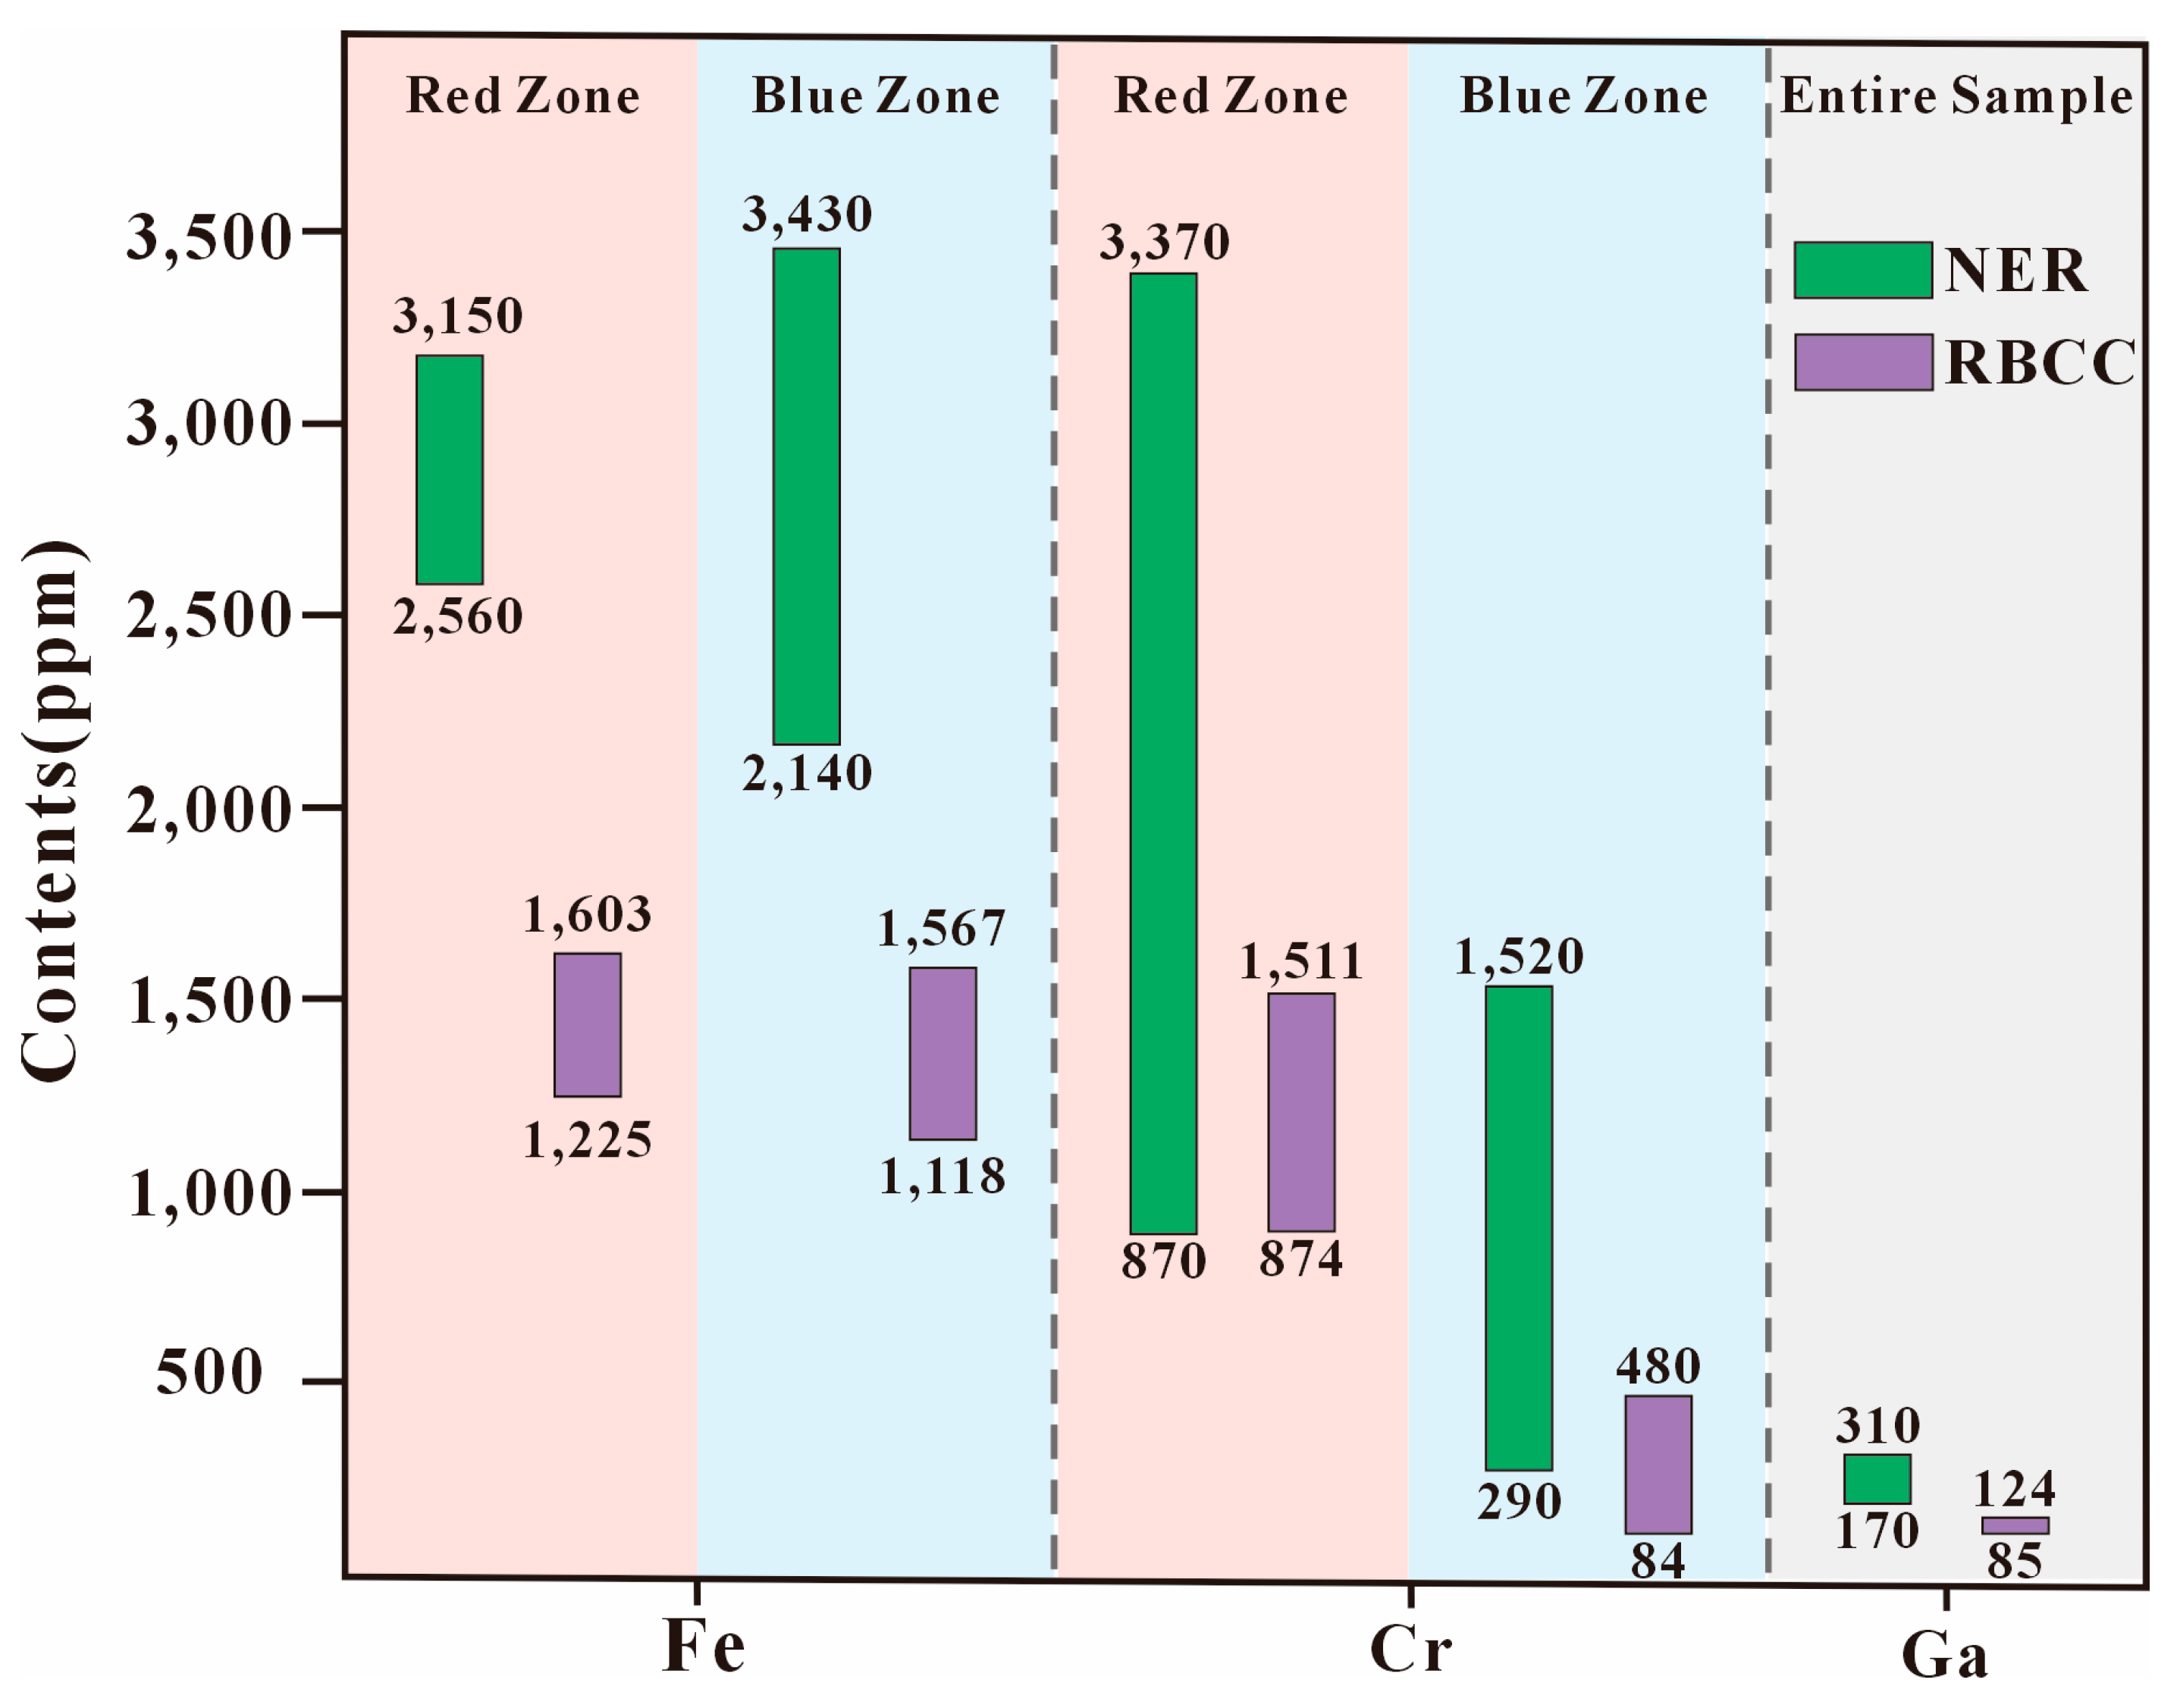
The Al content within the RBCC suite is stabilized at 52.90%. The contents of Fe, Ti, Cr, V, Ga, and Mg are presented in Table 2. By comparing the element contents between the red and blue zones (Figure 5), it is observed that the variation in Cr, Ti and V contents is quite large. Fe shows some slight differences, while Ga remains relatively stable. Notably, among all sites, Mg (15 ppm) appears at only 5–9 sites, while at other sites, the Mg content falls below the detection limit (Table 2).
For Sap-1, the Fe content in the red zone ranges from 1225 ppm to 1420 ppm, with an average of 1319 ppm. In the blue zone, the Fe content ranges from 1388 ppm to 1568 ppm, with an average of 1474 ppm (excluding Sap1−7), indicating a slightly higher Fe content in the blue zone than in the red zone for Sap-1. For Sap-5, the Fe content in the red zone ranges from 1380 ppm to 1604 ppm, with an average of 1443 ppm, while in the blue zone, it ranges from 1469 ppm to 1562 ppm, with an average of 1522 ppm. Similarly, the Fe content is slightly higher in the blue zone than in the red zone for Sap-5.
For Sap-1, the Cr content in the red zone ranges from 983 ppm to 1512 ppm, with an average of 1212 ppm. In contrast, the Cr content in the blue zone varies from 437 ppm to 481 ppm, with an average of 457 ppm. Thus, the Cr content is significantly higher in the red zone than in the blue zone for Sap-1. For Sap-5, the Cr content in the red zone ranges from 874 ppm to 1417 ppm, with an average of 1110 ppm. However, in the blue zone, it varies from 84 ppm to 208 ppm, with an average of 121 ppm. Therefore, the Cr content is significantly higher in the red zone than in the blue zone for Sap-5.
Variations in V content within the red and blue zones for samples Sap-1 and Sap-5 are obvious. For Sap-1, the V content in the red zone ranges from 53 ppm to 172 ppm, with an average of 99 ppm, whereas in the blue zone, it varies from 281 ppm to 346 ppm, with an average of 306 ppm. Consequently, the V content is distinctively higher in the blue zone than in the red zone for Sap-1. For Sap-5, the V content in the red zone ranges from 56 ppm to 141 ppm, with an average of 96 ppm, while in the blue zone, it varies from 260 ppm to 297 ppm, with an average of 280 ppm. This indicates a significantly higher V content in the blue zone compared to the red zone for Sap-5.
For Sap-1, the Ga content in the red zone varies from 86 ppm to 104 ppm, with an average of 97 ppm, whereas in the blue zone, it ranges from 92 ppm to 103 ppm, with an average of 99 ppm. Thus, the Ga content in the blue zone is almost similar to that in the red zone for Sap-1. For Sap-5, the Ga content in the red zone ranges from 104 ppm to 125 ppm, with an average of 112 ppm, while in the blue zone, it ranges from 97 ppm to 114 ppm, with an average of 106 ppm. Therefore, the Ga content in the blue zone is also close to that in the red zone for Sap-5.
For Sap-1, the Ti content in the red zone ranges from 0 ppm to 2 ppm, with an average of 1 ppm, whereas in the blue zone, it ranges from 5 ppm to 22 ppm, with an average of 15 ppm. Consequently, the Ti content is notably higher in the blue zone compared to the red zone for Sap-1. For Sap-5, within the red zone, only one data point indicates a content of 3 ppm, while the data at all other points are below the detection limit. In the blue zone, the Ti content varies from 0 ppm to 21 ppm, with an average of 7 ppm. Hence, the Ti content is higher in the blue zone than in the red zone for Sap-5.

5. Discussion

5.1. Coloration Mechanism of the Red-Blue Colored Corundum

When the Al element in the corundum is replaced by trace elements such as Fe, Mg, Ti, Cr and B, impurity levels are introduced into the energy band. This triggers electronic transitions, during which energy within the visible light spectrum is absorbed, resulting in the generation of color [11,12]. Therefore, trace-element ions such as Cr3+, Fe3+, Fe2+ + Ti4+ = Fe3+ + Ti3+ play crucial roles in the coloration mechanism of corundum [13,14].
In this study, the causes of color in the RBCC suite are discussed based on the spectroscopic characteristics of the red and blue zones of the RBCC suite Sap-1 and Sap-5.

5.1.1. Color Genesis in Red Region

The spectra in the red zones of Sap-1 and Sap-5 exhibited spectroscopic characteristics of Cr and Fe, with similar absorption peaks at 398 nm and 395 nm, 555 nm and 551 nm, 656 nm and 665 nm, and 692 nm and 690 nm. Among these, the 555 nm and 551 nm absorption peaks are broad, while the 656 nm and 665 nm, and 690 nm and 692 nm absorption peaks are weak. For Sap-5, a weak absorption peak occurs at 787 nm.
The absorption peaks at 398 nm and 395 nm arise from the combined effects of Cr3+ and the Fe3+-Fe3+ ion pair [15,16,17]. Trace elemental analysis reveals that the Cr and Fe contents in the red zone of Sap-1 are 1212 ppm and 1318 ppm, whereas in Sap-5, they are 1110 ppm and 1443 ppm, respectively. Notably, the intensity of the 398 nm peak in Sap-1 is higher than that at the 395 nm peak in Sap-5, which aligns with the trend of Cr content in both specimens but contradicts the trend of Fe content. Thus, it is inferred that the 398 nm and 395 nm absorption peaks in the red zones of Sap-1 and Sap-5 are due to the Cr3+ and Fe3+-Fe3+ ion pair. The Fe3+-Fe3+ ion pair plays a secondary role.
The broad absorption bands at 555 nm and 551 nm in the red regions are significantly affected by d-electron transitions in Cr [18,19,20]. Fe2+ + Ti4+ = Fe3+ + Ti3+ also impacts the position and width of the absorption peaks at 560 nm [15,16,21,22,23]. Trace elemental analysis indicates that the Ti content in the red zones of Sap-1 and Sap-5 is extremely low, and it was even below the detection limit at most of the measured points. Simultaneously, the average Fe content of the Sap-1 sample was 1318 ppm, which is lower than that of the Sap-5 at 1443 ppm, yet the absorption intensity at 555 nm in the Sap-1 was higher than that at 551 nm in the Sap-5. Therefore, Fe2+-Ti4+ charge transfer is not the primary cause of this absorption band. Moreover, the Cr content is the highest in the red zones of both samples, averaging 1212 ppm in Sap-1 and 1110 ppm in Sap-5. The absorption intensity of the Sap-1 sample at 555 nm is higher than that at 551 nm of Sap-5. Consequently, Cr is the primary color-causing element for the 555 nm and 551 nm absorption peaks, while Fe2+-Ti4+ pairs play a secondary role.
The 660 nm and 690 nm absorption peaks correspond to the emission spectra of d-d electron transitions in Cr3+ [2,19,23,24,25]. Consequently, the absorption peaks at 656 nm and 692 nm observed in Sap-1, as well as the 665 nm and 690 nm absorption peaks in Sap-5, are attributed to Cr3+. However, the 787 nm absorption peak appears in only one sample and has an extremely weak intensity, making precise identification difficult. Nonetheless, considering that Fe2+-Fe3+ charge transfer induces absorption at 765 nm [26], it is hypothesized that the 787 nm absorption may be related to this charge transfer process.
The hand specimen of Sap-1 exhibits a higher intensity of red color compared to Sap-5. There was a higher Cr content in Sap-1 (1212 ppm) compared to Sap-5 (1110 ppm), and there was a lower Fe content in Sap-1 (1318 ppm) compared to Sap-5 (1443 ppm). The Ti content is similar in both samples. The red intensity follows the same trend as the Cr content, but the opposite trend of the Fe content. This further substantiates that the Cr content is a decisive factor for color density in the red zone of the RBCC suite. Overall, the primary color-causing element in the red zones of Sap-1 and Sap-5 is Cr3+, while Fe3+-Fe3+ and Fe2+-Ti4+ pairs make secondary contributions. The characteristics of distinct absorbance peaks in the red zones of Sap-1 and Sap-5 are detailed in Table 3.

5.1.2. Color Genesis in Blue Region

The 398 nm and 670 nm absorption peaks in the Sap-1 sample and the 669 nm absorption peak in Sap-5 sample originate from Cr3+ (457 ppm) [15]. Notably, the Fe3+ (1403 ppm) in the Sap-1 sample broadens the 398 nm absorption peak, extending its coverage to the 388 nm region [17]. In the Sap-5 sample, the 389 nm absorption peak is attributed to Fe3+ (1522 ppm) [17].
Previous research has indicated that electronic transitions of Cr3+ in the crystal field result in absorption peaks near 549 nm and within the 555 nm range [12,16,20,24,25,27,28,29]. Charge transfer between Fe2+ and Ti4+ can generate absorption peaks at 558 nm, 560 nm, 570 nm, and 580 nm [28,30,31]. The Fe2+-Ti4+ pair is a strong chromophore in corundum. Only about one-tenth of the amount, compared to Cr3+, is needed to produce strong coloration [32]. Therefore, despite the content of Ti in Sap-1 and Sap-5 being only 15 ppm and 7 ppm, respectively, it is still considered that the primary cause of the 558 nm and 562 nm absorption bands is still the Fe2+-Ti4+ ion pair, with Cr3+ playing a reinforcing role.
In Sap-5, the blue hues darken from the center to the edge (points 6–10), as the contents of Fe and Ti increase (Ti: 0 ppm to 21 ppm; Fe: 1469 ppm to 1562 ppm) and the Cr content decreases (208 ppm to 84 ppm). The increase in Fe and Ti contents is in direct proportion to the gradual deepening of the blue hue. This also supports the conclusion that Fe2+–Ti4+ pairs are the main contributors to the blue color.
Given the above, Fe2+-Ti4+ pairs are the primary color-causing elements in the blue zones of Sap-1 and Sap-5. Secondary contributors include Cr3+ and Fe3+. The purple hue in the blue zone of the Sap-1 hand specimen is more pronounced than in Sap-5, likely due to the higher Cr content (457 ppm in Sap-1 versus 121 ppm in Sap-5), while other elements remain similar. This indicates that Cr significantly affects the intensity of the purple hue in the blue zone of the RBCC suite. The details of distinct absorbance peaks in the blue zones of Sap-1 and Sap-5 are detailed in Table 4.

5.2. Genesis of Red-Blue Colored Corundum from the Malipo Alluvial Deposit

The RBCC suite examined in this study was obtained from an alluvial placer. However, the placer is located near the metamorphic deposit of mixed corundum on the western side of Malipo, where the wall rock is gneiss and the sapphires occur in druse-like distributions, exhibiting characteristics consistent with metamorphic sapphires.
In analyzing the formation of corundum, various classification methods have been proposed, including corundum morphology [33], geological context of deposits [34], lithology of host rocks [35], genetic processes responsible for corundum formation [36,37], genetic type of deposits [38], types of deposits and the nature of the corundum host rocks [39,40,41], and oxygen isotopic composition of corundum [42,43]. A common approach in current mineralogical research involves using trace element types and contents in corundum to infer its origin and understand the geological processes involved in its formation [44,45].
In previous studies, the trace elements of rubies and sapphires from the world’s renowned mining regions have exhibited distinct characteristics. For example, Burmese rubies are characterized by low Fe, high V and high Ga contents. In contrast, Mozambique rubies have high Fe, low V and low Ga contents. Research on trace elements in sapphires from different regions reveals that the metamorphic rock-related sapphires in Sutara placer in the Russian Far East have more than 200 ppm Cr and low Ga contents [46]. Studies on bi-color corundum show that the Fe contents in sapphires from Penglai, Hainan, are higher than those from other Asian sapphires, but lower than those from Changle, Shandong, and overlap with African sapphires of basaltic origin [47]. In the New England region, bi-color corundum, featuring both red and blue hues, is common. These sapphires are typically characterized by high concentrations of Ga and Si [48].
The Cr/Ga and Fe/Ti ratios are particularly useful for effectively distinguishing metamorphic rock-related gem-quality corundum from those related to basalt [49]. All data from the RBCC suite are plotted within the metamorphic rock field, indicating that the RBCC suite shows a metamorphic origin (Figure 6a). Excluding Ti contents below the detection limit, the highest Fe/Ti ratio was 1004.57. The lowest Cr/Ga ratio was 0.84, and the highest Cr/Ga ratio observed was 15.31. The red and blue dots are clearly divided, with the Cr/Ga and Fe/Ti ratios of the red dots being higher than those of the blue dots. The red dots were mainly sampled from the red area of the Malipo red-blue sapphires, while the blue dots were primarily sampled from the blue area. Therefore, in the Malipo red-blue sapphires, the red area exhibited characteristics of higher Cr/Ga and Fe/Ti ratios compared to the blue area. Thus, Cr, Ga, Fe, and Ti were also significant indicators of color zoning in Malipo red-blue sapphires.
Projections using (V + Cr)/Ga versus Fe/Ti ratios were employed to analyze RBCC suite genesis (Figure 6b). All the spots fell into the metamorphic field, which shows that the RBCC suite has a metamorphic origin. The red and blue dots are clearly divided into distinct zones (Figure 6b). Notably, the locations of the red dots exhibit higher ratios of (Cr + V)/Ga and Fe/Ti. The red dot samples were primarily collected from the red zone of Malipo red-blue sapphire, while the blue dot samples were mainly obtained from its blue zone. Consequently, both the (V + Cr)/Ga and Fe/Ti ratios in the red zone of Malipo red-blue sapphire exhibit significantly elevated values. Therefore, in addition to Cr, Ga, Fe, and Ti, V also serves as a crucial indicator of the color zoning in the RBCC suite.
In Figure 7, the red and blue dots are, respectively, in two regions, showing that the Ga content in the blue region of RBCC suite is significantly higher than that in the red region, and the Cr content in the red region is significantly higher than that in the blue region.
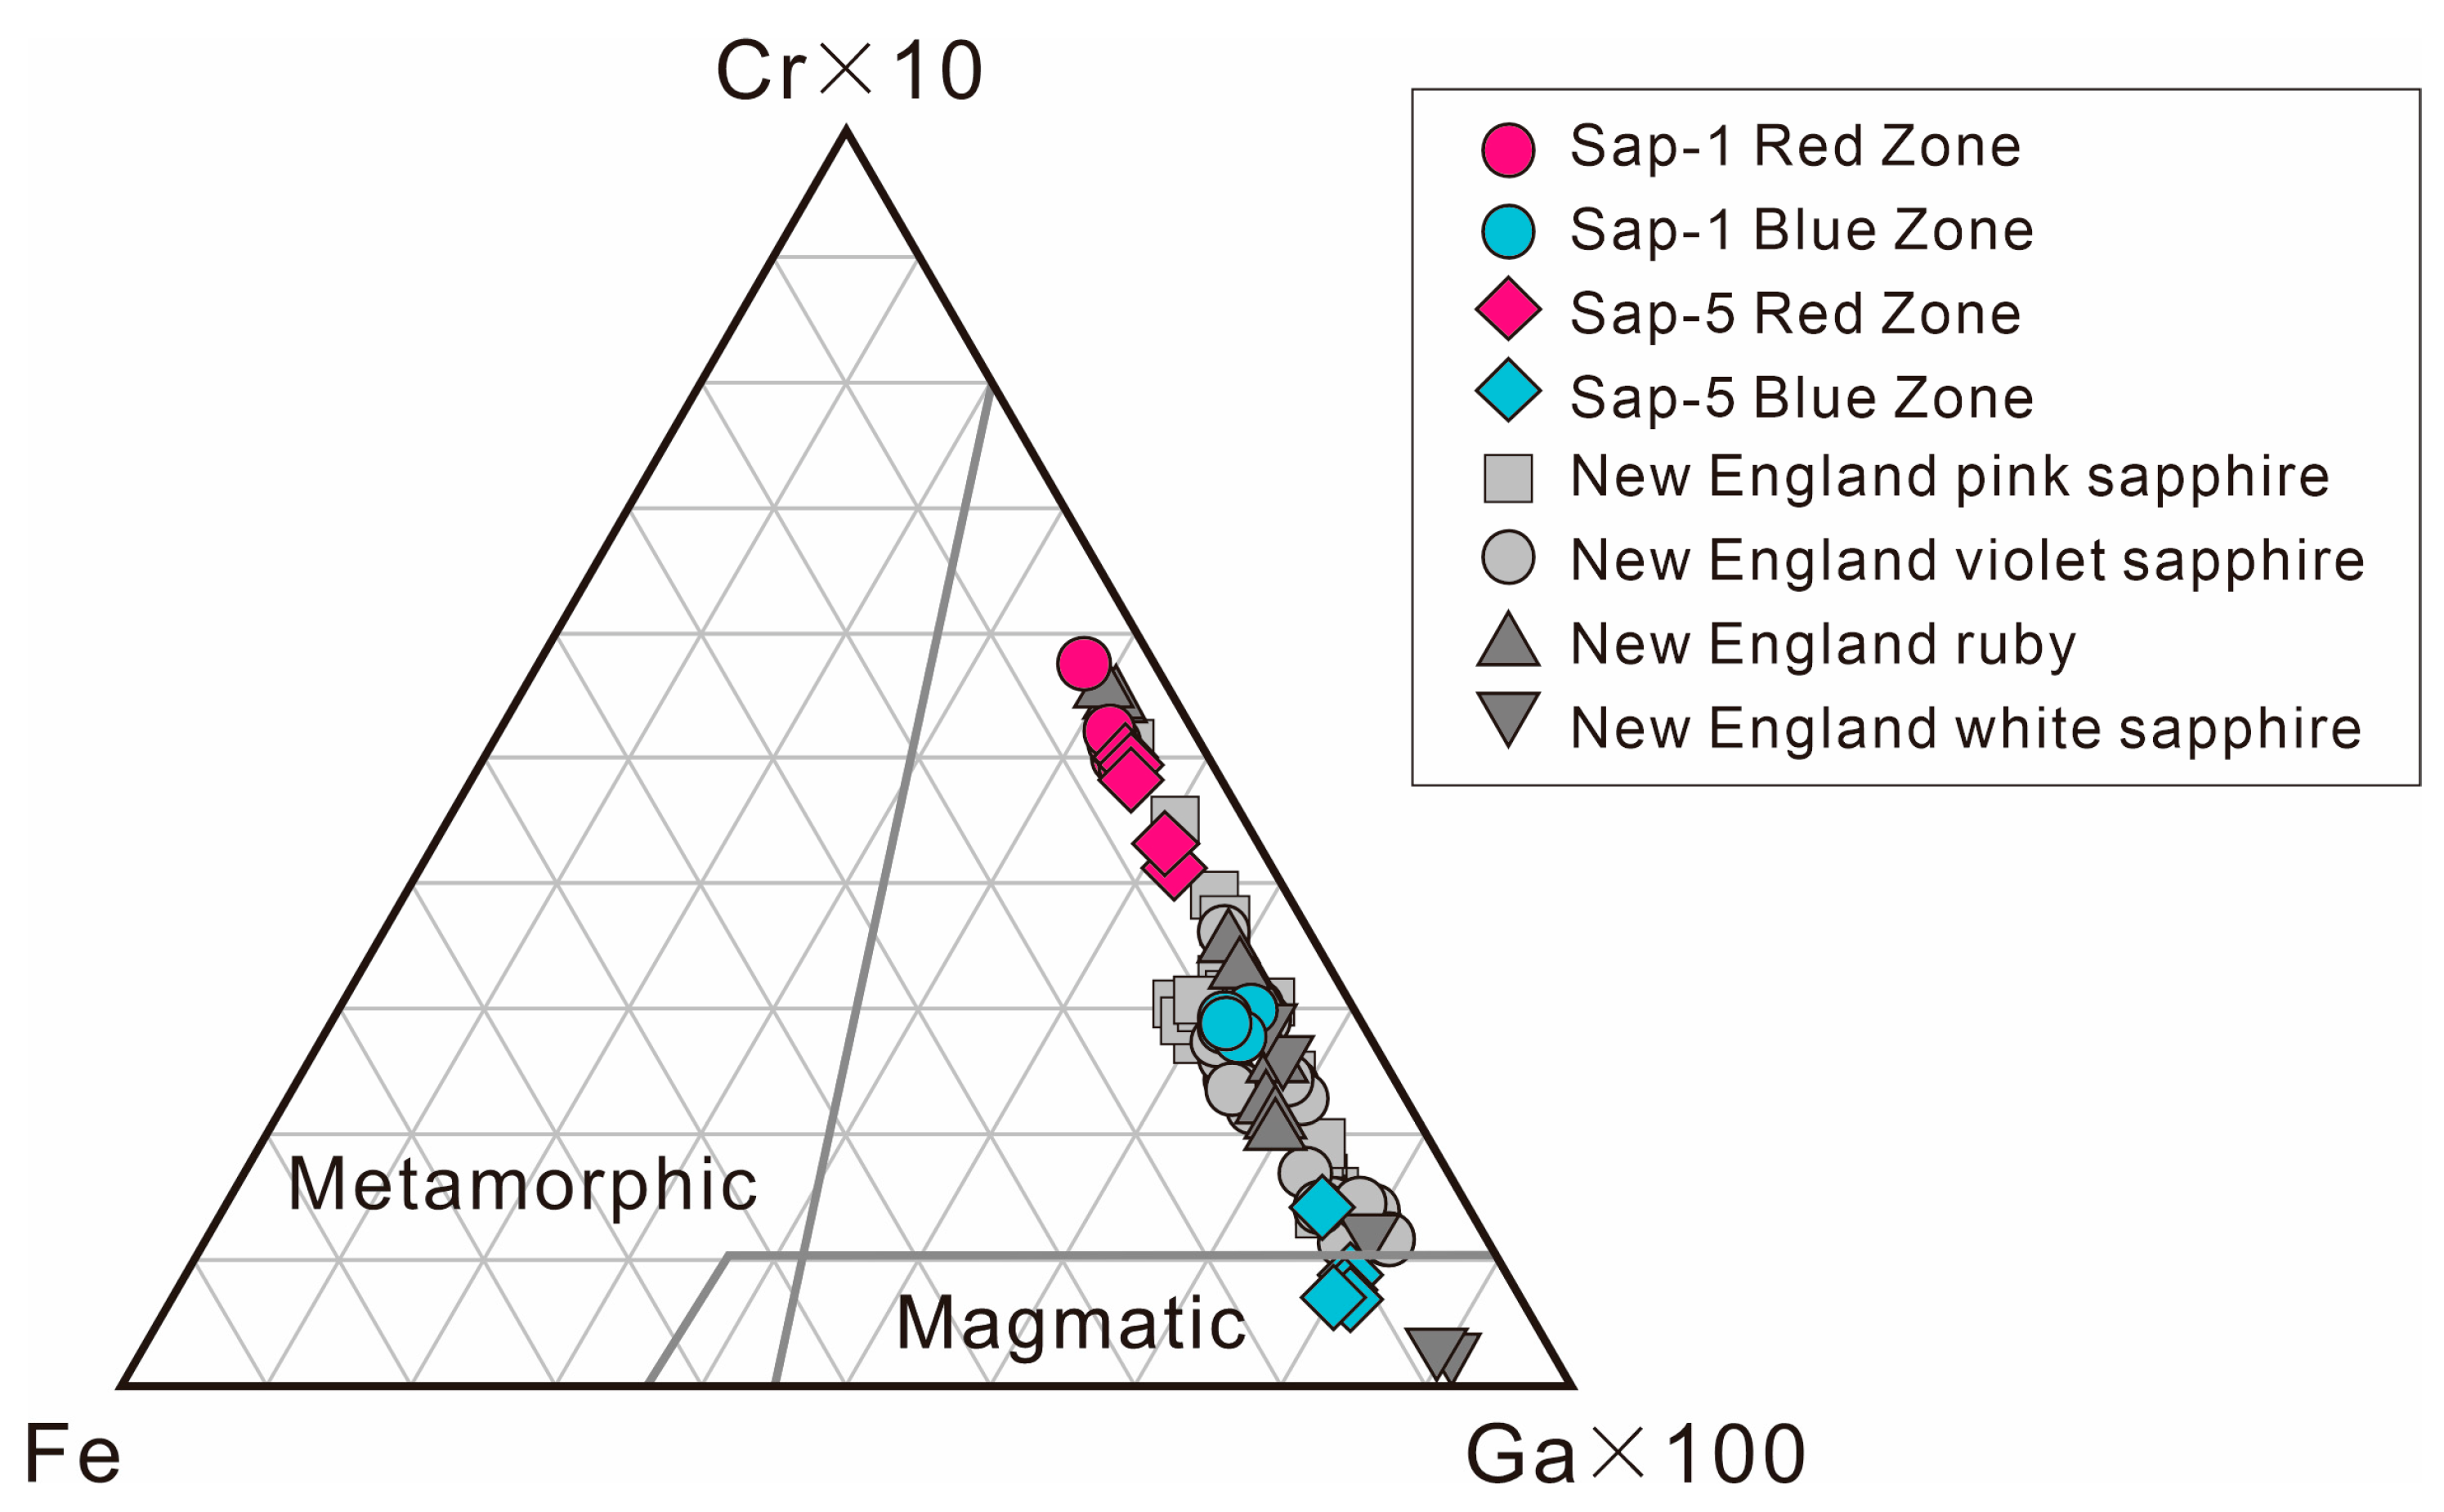
The ionic radius of Ga3+ is similar to that of Al3+ and Fe3+; all three ions share a +3 valence state, and their outermost electrons are distributed similarly. Gallium exhibits strong oxyphilic affinity, and its geochemical behavior under oxidizing conditions is comparable to that of Fe and particularly resembles Al. The Ga content plays a guiding role in the genesis of corundum gemstones. Typically, the Ga content in basaltic corundum exceeds 100 ppm, while in metamorphic corundum, it is below 100 ppm. For the RBCC suite, the average Ga content is 104 ppm, with a maximum of 125 ppm and a minimum of 86 ppm. These values place the Ga content at the boundary between metamorphic and basaltic origins. When plotted on the Fe–Cr × 10–Ga × 100 diagram (Figure 7), only four sites (Sap5−7, Sap5−8, Sap5−9, Sap5−10) of the Sap-5 blue zone align with the magmatic rock region, while the remaining sites show a tendency towards the genesis of metamorphic rocks. Given the region’s pronounced magmatic activity, the RBCC suite is of metamorphic origin, influenced by magma mixing and mingling, which has affected the color zoning of the RBCC suite.

5.3. Comparison of Zoning in RBCC from Malipo and New England Ruby-Violet Sapphires

The overlap rate between RBCC and New England ruby-sapphires in the Fe–Cr × 10–Ga × 100 diagram is high. A comparison of maximum and minimum Fe, Cr and Ga contents in RBCC samples with New England ruby-violet sapphires (NER) is illustrated in Figure 8. Overall, the Fe content (both maximum and minimum) in RBCC samples is about half that of NER samples in the same zone. For Cr, the lowest Cr content in the RBCC red zone closely matches that of NER samples, while the highest Cr content is half that of the latter. In the blue zone, there is a more significant difference in Cr content, with RBCC samples containing only one-third of the Cr content found in NER samples. For Ga, due to the consistent Ga content in the red and blue regions of RBCC samples, no red-blue region distinction is made when comparing with NER samples. Maximum and minimum Ga contents in RBCC samples are approximately half that of NER samples in the same zone.

6. Conclusions

Through systematic tests on RBCC samples, including gemological testing, LA-ICP-MS, and ultraviolet-visible spectroscopy, the characteristics of multi-colored corundum from Malipo, Yunnan, China, along with the color genesis and the compositional features, were investigated. The following conclusions were drawn:
  • Multi-colored corundum gems from Malipo, Yunnan, China are typically red, colorless or purplish-blue, with irregular color distributions. They exhibit a refractive index between 1.760 and 1.763 (Ne), 1.770–1.772 (No), and DR = 0.009–0.010. The average specific gravity is 3.79. These sapphires often display twinning wisps and uneven fractures.
  • The red regions of the multi-colored corundum are primarily caused by Cr3+, while Fe2+-Ti4+ ion pair and Fe3+-Fe3+ ion pair contribute partially to the genesis of color. Cr3+ is a decisive factor determining the intensity of red coloration. The blue zones are mainly caused by Fe2+-Ti4+ ion transitions, while the ions Cr3+ and Fe3+ play a secondary role. Cr is also responsible for imparting a purple hue to the blue zone.
  • The chemical composition of the multi-colored corundum from Malipo, Yunnan, China, generally aligns with the characteristics of metamorphic genesis, with an influence from magma mixing and mingling. The RBCC suite comprises ruby (up to 1512 ppm Cr, 172 ppm V, 3 ppm Ti, and 1604 ppm Fe) and sapphire (up to 481 ppm Cr, 346 ppm V, 22 ppm Ti, and 1568 ppm Fe). The Cr content in the red zone is significantly higher than that in the blue zone, whereas the Ti and V content in the blue zone is notably higher than in the red zone. All color zones demonstrate stability in Ga (up to 125 ppm), with minor fluctuations in Fe. The Mg content is extremely low, with only one detection point indicating its presence.

Author Contributions

Conceptualization, H.W., X.-Y.Y., F.L. and G.-Y.W.; methodology, H.W., X.-Y.Y.; software, H.W., G.-Y.W. and F.L.; validation, H.W., X.-Y.Y., F.L. and Y.-X.X.; resources, X.-Y.Y.; data curation, H.W., X.-Y.Y., F.L. and Y.-X.X.; writing—original draft preparation, H.W., X.-Y.Y. and F.L.; writing—review and editing, H.W., X.-Y.Y., F.L., M.A., L.M. and Y.-X.X.; supervision, X.-Y.Y. and F.L.; project administration, X.-Y.Y. and F.L.; funding acquisition, X.-Y.Y. and F.L. All authors have read and agreed to the published version of the manuscript.

Funding

This research was jointly supported by the National Science Foundation of China (42472094) and the Geological Survey (DD20240204901, DD20242124, DD20240075, DD20221630).

Data Availability Statement

The original contributions presented in this study are included in the article. Further inquiries can be directed to the corresponding authors.

Acknowledgments

This work was supported by the 2022 Beijing Vocational Education Reform Project “Research and Practice on the Hierarchical and Categorized Training of High-Quality Intangible Cultural Heritage Talents under the Apprenticeship System of Chinese Characteristics” by the Beijing Municipal Education Commission (DG2022001). We are very grateful to Meili Wang, Gaichao Wu and Wang Zheng for their assistance with the experimental testing of this paper in the project. We also thank Ye Yuan and Chenglu Li for their help and valuable comments.

Conflicts of Interest

Author Ying-Xin Xu was employed by the company Beijing Guoshoudikuang Gem Testing Co., Ltd. The remaining authors declare that the research was conducted in the absence of any commercial or financial relationships that could be construed as a potential conflict of interest.

References

  1. Che, S.; Ren, L. The color origin of gem diaspore: Correlation to corundum. Gems Gemol. 2018, 54, 326–327. [Google Scholar]
  2. Dubinsky, E.V.; Stone-Sundberg, J.; Emmett, J.L. A quantitative description of the causes of color in corundum. Gems Gemol. 2020, 56, 1–27. [Google Scholar] [CrossRef]
  3. Sutherland, F.L.; Schwarz, D.; Jobbins, E.A.; Coenraads, R.R.; Webb, G. Distinctive gem corundum suites from discrete basalt fields: A comparative study of Barrington, Australia, and West Pailin, Cambodia, Gemfields. Gemmology 1998, 26, 65–85. [Google Scholar] [CrossRef]
  4. McMillan, N.J.; McManus, C.E. Application of Multivariate Analysis to the Problem of the Provenance of Gem Stones (Ruby, Sapphire, Emerald, Diamond). In Laser Induced Breakdown Spectroscopy (LIBS): Concepts, Instrumentation, Data Analysis and Applications; John Wiley & Sons, Ltd.: Hoboken, NJ, USA, 2023; Volume 1, pp. 287–303. [Google Scholar]
  5. Wang, H.; Yu, X.Y.; Liu, F.; Alam, M.; Wu, G.C. Color genesis and compositional characteristics of color-change sapphire from Fuping, China. Crystals 2022, 12, 463. [Google Scholar] [CrossRef]
  6. Yu, X.Y.; Long, Z.Y.; Zhang, Y.; Qin, L.J.; Zhang, C.; Xie, Z.R.; Wu, Y.R.; Yan, Y.; Wu, M.K.; Wan, J.X. Overview of Gemstone Resources in China. Crystals 2021, 11, 1189. [Google Scholar] [CrossRef]
  7. Chen, J.X. Records of Gemstones in Yunnan in Ancient Books. Yunnan Metall. 1985, 5, 57. [Google Scholar]
  8. Liu, C.L. Type of Genesis of Bauxite in China. Sci. China (Ser. B Chem. Biol. Agric. Sci. Med. Sci. Earth Sci.) 1987, 5, 535–544. [Google Scholar]
  9. Sun, K.X. The geological characteristics of gem metallogenesis in Yunnan. Yunnan Geol. 1996, 15, 81–90. [Google Scholar]
  10. Bo, G.N.; Zhao, J.F. Minerogenetic law and minerogenetic area division of gem-jade in Wenshan area, Yunnan. Yunnan Geol. 2015, 34, 352–358. [Google Scholar]
  11. Bristow, J.K.; Tiana, D.; Parker, S.C.; Walsh, A. Defect chemistry of Ti and Fe impurities and aggregates in Al2O3. J. Mater. Chem. A 2014, 2, 6198–6208. [Google Scholar] [CrossRef]
  12. Emmett, J.L.; Stone-Sundberg, J.; Guan, Y.; Sun, Z. The Role of Silicon in the Color of Gem Corundum. Gems Gemol. 2017, 53, 42–47. [Google Scholar] [CrossRef]
  13. Ji, J.H. A Study of Colour-assuming Mechanism and Modifying Test of Su-Lu Sapphire. Jiangsu Geol. 1999, 23, 162–166. [Google Scholar]
  14. Gagan, C.; Shi, G.H. Gem News International. Gems Gemol. 2024, 60, 400–429. [Google Scholar]
  15. Yu, X.Y.; Sun, H.N.; Wang, H. Gemological Properties and Coloration of Metamorphic Type Ruby from Gansu, China. Natl. Gemstone Test. Cent. Gems Jewel. Trade Assoc. China 2009, 4, 79–85. [Google Scholar]
  16. Hughes, R.W.; Manorotkul, W.; Hughes, E.B. Ruby & Sapphire: A Gemologist’s Guide; RWH Publishing: Boulder, CO, USA, 2017. [Google Scholar]
  17. Nikolskaya, L.V.; Terekhova, V.M.; Samoilovich, M.I. On the origin of natural sapphire color. Phys. Chem. Miner. 1978, 3, 213–224. [Google Scholar] [CrossRef]
  18. Guo, K.P.; Zhou, Z.Y.; Zhong, Q.; Lai, M.; Wang, H.; Li, Y.B.; Qiao, X.; Nong, P.Z. Comparative study on elemental content and UV-Vis spectroscopy characteristics of Ruby from Myanmar and Mozambique. Acta Petrol. Mineral. 2018, 37, 1002–1010. [Google Scholar]
  19. Guo, Q.R.; Li, P.Y.; Wang, M.Y.; Zhao, S.Y.; Yang, S.C.; Shi, G.H. Color Mechanism Analysis and Origin Comparison of Pink-Purple Sapphires from Vietnam and Madagascar. Crystals 2025, 15, 229. [Google Scholar] [CrossRef]
  20. Li, E.Q.; Zhang, Y.F.; Xu, B. Gemological and Chemical Composition Characteristics of Basalt-Hosted Rubies from Thailand. Geoscience 2023, 37, 486–499. [Google Scholar]
  21. Wang, Y.Y.; Yang, L.Y.; Li, M.; Yang, P.T.; Shen, A.H.; Wang, C.W. Spectral Characteristics and Color Origin of Unstable Yellow Sapphire. Spectrosc. Spectr. Anal. 2021, 41, 2611–2617. [Google Scholar]
  22. Soonthorntantikul, W.; Vertriest, W.; Raynaud-Flattot, V.L.; Sangsawong, S.; Atikarnsakul, U.; Khowpong, C.; Weeramonkhonlert, V.; Pardieu, V. An in depth gemological study of blue sapphires from the Baw Mar mine (Mogok, Myanmar). Gemmol. Inst. Am. Rep. 2017, 2, 87. [Google Scholar]
  23. Liu, Y.M. Classic Gemological Characteristics of Ruby and Sapphire from Muling, Heilongjiang Province, China. Doctoral Dissertation, China University of Geosciences, Wuhan, China, 2023. [Google Scholar]
  24. Fritsch, E.; Rossman, G.R. An update on color in gems. Part 2: Colors involving multiple atoms and color centers. Gems Gemol. 1988, 24, 3–15. [Google Scholar] [CrossRef]
  25. Liu, F.k.; Guo, Y.; Zhao, B.; Liu, M.Y. Chromogenic Mechanisms of Rubies with Varying Color Tones. Geoscience 2025, 39, 158–166. [Google Scholar]
  26. Chen, S.M.; Tan, H.L.; Zhang, C.; Teng, Y.J.; Zu, E.D. Study on Gemological Characteristics of Blue Sapphires from Baw-Mar Mine, Mogok, Myanmar. Crystals 2021, 11, 1275. [Google Scholar] [CrossRef]
  27. Krebs, J.J.; Maisch, W.G. Exchange effects in the optical-absorption spectrum of Fe3+ in Al2O3. Phys. Rev. B 1971, 4, 757. [Google Scholar] [CrossRef]
  28. Pluthametwisute, T.; Nasdala, L.; Chutimun, C.N.; Wildner, M.; Libowitzky, E.; Giester, G.; Zoysa, E.G.; Jakkawanvibul, C.; Suwanmanee, W.; Sripoonjan, T.; et al. Luminescence and a New Approach for Detecting Heat Treatment of Geuda Sapphire. Solid Earth 2025, 16, 81–96. [Google Scholar] [CrossRef]
  29. Zhang, P.Q. Relationship between color and chemical composition of Sapphire in Changle, Shandong province. Shandong Geol. 2000, 16, 36–43. [Google Scholar]
  30. Emmett, J.L.; Scarratt, K.; McClure, S.F.; Moses, T.; Douthit, T.R.; Hughes, C.; Novak, S.; Shigley, J.E.; Wang, W.Y.; Bordelon, O. Beryllium diffusion of ruby and sapphire. Gems Gemol. 2003, 39, 84–135. [Google Scholar] [CrossRef]
  31. Xie, Y.H. Analysis on UV-VIS Spectrumand Colouration Mechanism of Sapphire. J. Gems Gemmol. 2004, 6, 9–12. [Google Scholar]
  32. Muyal, J. Ruby & Sapphire: A Gemologist’s Guide to understanding color. In Gems & Gemology; Gemological Institute of America: Carlsbad, CA, USA, 2025; p. 124. [Google Scholar]
  33. Ozerov, K. Form of corundum crystals as dependent upon chemical composition of medium. Dolkady Akad. Nauk SSSR 1945, 47, 49–52. [Google Scholar]
  34. Hughes, R.W. Ruby and Sapphire; RWH Publishing: Boulder, CO, USA, 1997. [Google Scholar]
  35. Schwarz, D. Aus Basalten, Marmoren und Pegmatiten. Spezielle Ursachen formten in der Erdkruste edle Rubine und Saphire. In Rubin, Saphir, Korund: Schön, Hart, Selten, Kostbar; Weise, C., Ed.; ExtraLapis: München, Germany, 1998; Volume 15, pp. 5–9. [Google Scholar]
  36. Simonet, C. Géologie des Gisements de Saphir et de Rubis. L’exemple de la John Saul Mine, Mangari, Kenya. Doctoral Dissertation, University of Nantes, Nantes, France, 2000. [Google Scholar]
  37. Simonet, C.; Fritsch, E.; Lasnier, B. A classification of gem corundum deposits aimed towards gem exploration. Ore Geol. Rev. 2008, 34, 127–133. [Google Scholar] [CrossRef]
  38. Kievlenko, E.Y. Geology of Gems. Mineral. Rec. 2003, 36, 42–43. [Google Scholar]
  39. Pham, V.L.; Hoang, Q.V.; Garnier, V.; Giuliani, G.; Ohnenstetter, D. Marblehosted ruby from Vietnam. Can. Gemmol. 2004, 25, 83–95. [Google Scholar]
  40. Walton, L. Exploration Criteria for Coloured Gemstone Deposits in the Yukon; Yukon Geological Survey: Whitehorse, YT, Canada, 2004; p. 184. [Google Scholar]
  41. Giuliani, G.; Ohnenstetter, D.; Fallick, A.E.; Groat, L.; Fagan, A.J. The geology and genesis of gem corundum deposits. In The Geology of Gem Deposits; Groat, L.A., Ed.; Mineralogical Association of Canada: Québec City, QC, Canada, 2007; Chapter 2; pp. 23–78. [Google Scholar]
  42. Giuliani, G.; Fallick, A.E.; Garnier, V.; France, L.C.; Ohnenstetter, D.; Schwarz, D. Oxygen isotope composition as a tracer for the origins of rubies and sapphires. Geology 2005, 332, 249–252. [Google Scholar] [CrossRef]
  43. Giuliani, G.; Ohnenstetter, D.; Fallick, A.E.; Groat, L.; Feneyrol, J. Geographic origin of gems linked to their geographical history. InColor 2012, 19, 16–27. [Google Scholar]
  44. Sun, Z.Y.; Michael, J.; Aaron, C.P. Chemical Analysis in the Gemological Laboratory: XRF and LA-ICP-MS. Gems Gemol. 2024, 60, 149–153. [Google Scholar] [CrossRef]
  45. Baldwin, L.; Tomaschek, F.; Ballhaus, C.; Gerdes, A.; Fonseca, R.; Wirth, R.; Geisler, T.; Nagel, T. Petrogenesis of alkaline basalthosted sapphire megacrysts. Petrological and geochemical investigations of in situ sapphire occurrences from the Siebengebirge Volcanic Field, Germany. Contrib. Mineral. Petrol. 2017, 172, 43. [Google Scholar] [CrossRef]
  46. Buravleva, S.Y.; Smirnov, S.Z.; Pakhomova, V.; Fedoseev, D. Sapphires from the Sutara Placer in the Russian Far East. Gems Gemol. 2016, 52, 252–264. [Google Scholar] [CrossRef]
  47. Guang, Y.W.; Xiao, Y.Y.; Liu, F. Genesis of Color Zonation and Chemical Composition of Penglai Sapphire in Hainan Province, China. Minerals 2022, 12, 832. [Google Scholar] [CrossRef]
  48. Sutherland, F.L.; Graham, I.T.; Harris, S.J.; Coldham, T.; Powell, W.; Belousova, E.A.; Martin, L. Unusual ruby-sapphire transition in alluvial megacrysts, Cenozoic basaltic gem field, New England, New South Wales, Australia. Lithos 2017, 278, 347–360. [Google Scholar] [CrossRef]
  49. Muhlmeister, S.; Fritsch, E.; Shigley, J.E.; Devouard, B.; Laurs, B.M. Separating natural and synthetic rubies on the basis of trace-element chemistry. Gems Gemol. 1998, 34, 80–101. [Google Scholar] [CrossRef]
  50. Sutherland, F.L.; Zaw, K.; Meffre, S.; Giuliani, G.; Fallick, A.E.; Graham, I.T.; Webb, G.B. Gem-corundum megacrysts from east Australian basalt fields: Trace elements, oxygen isotopes and origins. Aust. J. Earth Sci. 2009, 56, 1003–1022. [Google Scholar] [CrossRef]
  51. Abduriyim, A. Determination of the origin of blue sapphire using laser ablation inductively coupled plasma mass spectrome-try (LA-ICP-MS). J. Gemmol. 2006, 30, 23–36. [Google Scholar] [CrossRef]
  52. Guo, J.; Wang, F.; Yakoumelos, G. Sapphires from Changle in Shandong province, China. Gems Gemol. 1992, 28, 255–260. [Google Scholar] [CrossRef]
  53. Zaw, K.; Sutherland, L.; Yui, T.F.; Meffre, S.; Thu, K. Vanadium-rich ruby and sapphire within mogok gemfield, myanmar: Implications for gem color and genesis. Miner. Depos. 2015, 50, 25–39. [Google Scholar] [CrossRef]
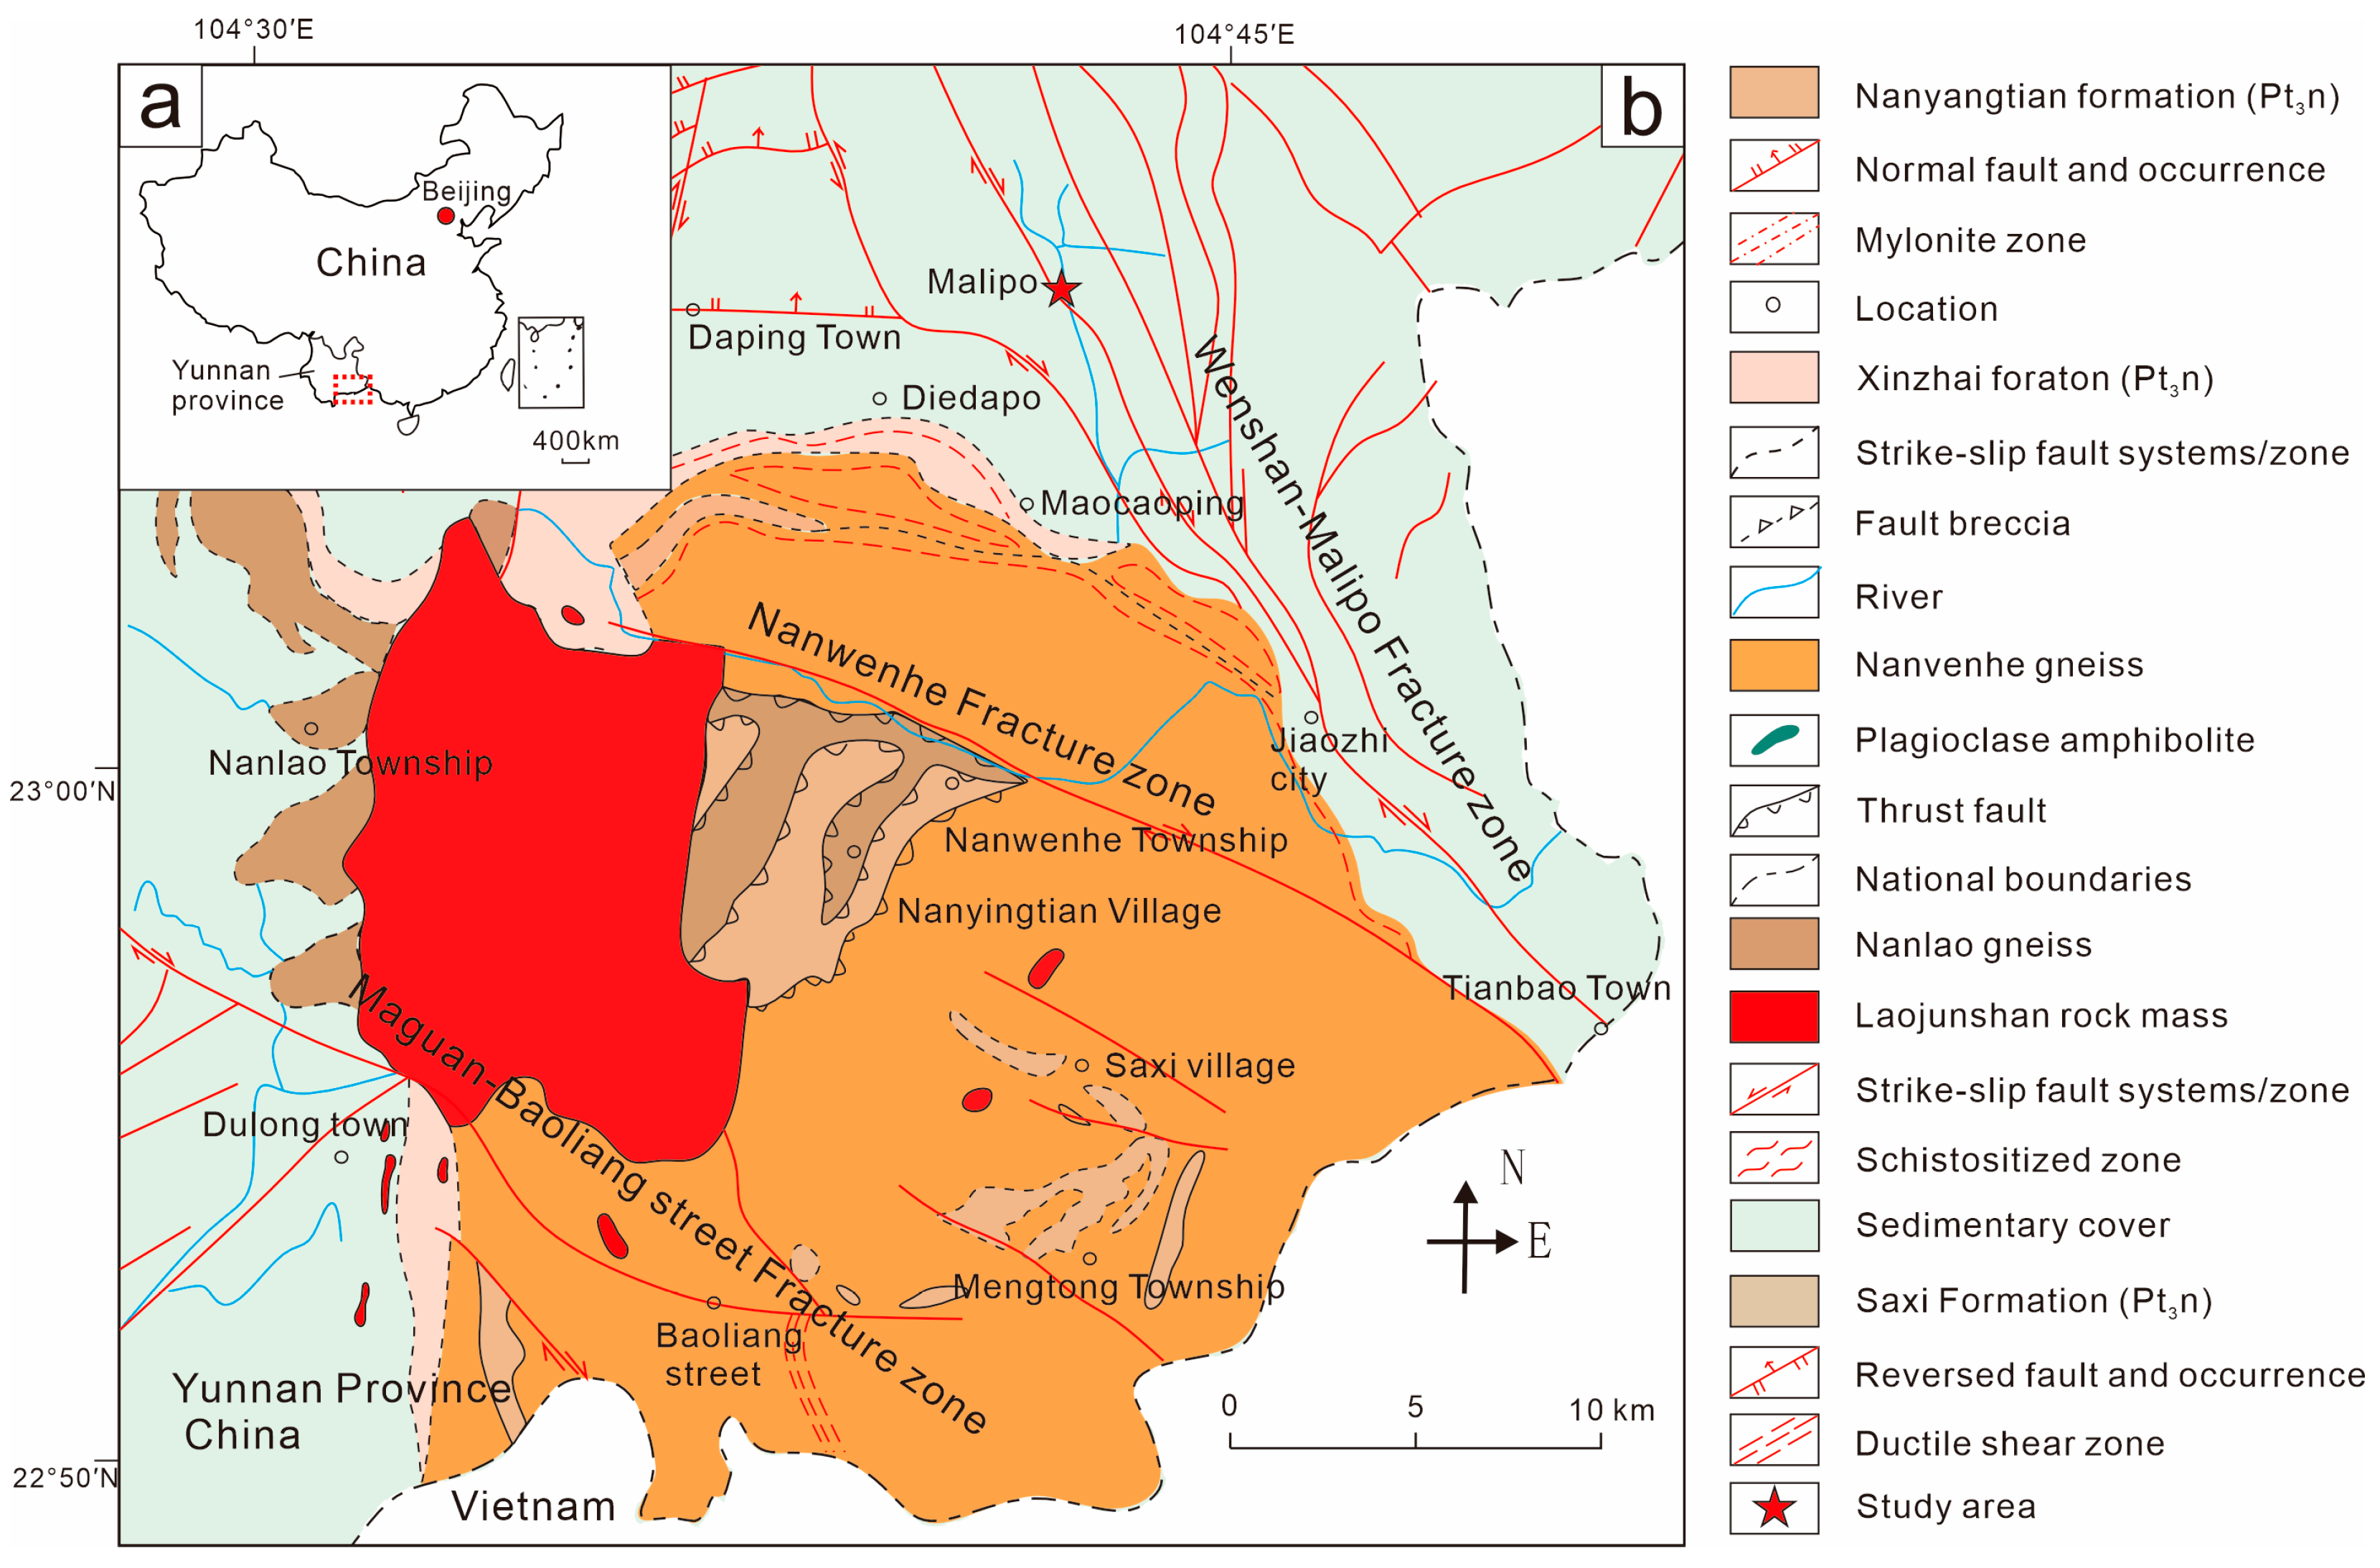
Figure 1. (a) The location of Yunnan Province in China. (b) Regional geological map of the Malipo red-blue colored corundum, Yunnan, China.
Minerals 15 01099 g001
Figure 2. Photos of red-blue colored corundum (RBCC) from the Malipo alluvial deposit. (ac) The secondary deposit conditions of Malipo RBCC, where miners are looking for multi-colored sapphires; (d) The multi-colored corundum picked up by miners from the Malipo alluvial deposit; (e,f) The multi-colored corundum-bearing conglomerates.
Minerals 15 01099 g002
Figure 3. Eight raw multi-colored corundum samples from the Malipo alluvial deposit. (a) Sap-1, (b) Sap-2, (c) Sap-4, (d) Sap-5, (e) Sap-7, (f) Sap-9, (g) Sap-10, (h) Sap-12.
Minerals 15 01099 g003
Figure 4. UV-Vis spectroscopy of the samples Sap-1 and Sap-5.
Minerals 15 01099 g004
Figure 5. Contents of main trace elements in the RBCC samples Sap-1 and Sap-5 from the Malipo alluvial deposit.
Minerals 15 01099 g005
Figure 6. Trace element content diagrams for sapphire origin identification, using RBCC suite data in Yunnan, China: (a) Cr/Ga versus Fe/Ti plot [50,51,52]; (b) (V + Cr)/Ga vs. Fe/Ti plot [53].
Minerals 15 01099 g006
Figure 7. Projection points of the RBCC suite in the Fe–Cr × 10–Ga × 100 diagram after Sutherland et al. (2009, 2017) for separating metamorphic and magmatic corundum fields [48,50].
Minerals 15 01099 g007
Figure 8. Comparison chart for the Fe, Cr and Ga elements in RBCC samples and NER samples. RBCC, red-blue colored corundum; NER, ruby-violet sapphire.
Minerals 15 01099 g008
Table 1. Gemological Characteristics of RBCC from Malipo deposit.
SampleColorLusterCharacteristics Observed Under MagnificationTransparencySpecific GravityRefractive IndicesFluorescence
Long Short
Wave Wave
Sap-1Violet-red
and violet-blue
Medium glassy lusterTwin lamellae, grayish-black country rock.Translucent3.611.760–1.770Moderate red in the local regionModerate red in the local region
Sap-2PinkMedium glassy lusterRagged fracture with fine-grained crystals.Translucent3.781.76Moderate redModerate red
Sap-4Dark blueWeak glassy lusterBrownish holes.Non-transparent3.681.77InertInert
Sap-5Pink and violet-blueMedium glassy lusterTwin lamellae, blue color zones.Translucent3.801.763–1.772Moderate red in the local regionWeak red in the local region
Sap-7Violet-blueMedium glassy lusterTwin lamellae.Translucent3.72——Moderate white-blue in the core and moderate red on the edgeModerate white-blue in the core and moderate red on the edge
Sap-9Blue and violet-redMedium glassy lustertwin lamellae.Translucent3.79——Moderate redModerate red
Sap-10Violet-redMedium glassy lusterYellowish-brown mineral disseminationTranslucent3.841.762–1.772Moderate red in the local regionWeak red in the local region
Sap-12Violet-redMedium glassy lusterTwin lamellae, yellowish-brown mineral disseminationTranslucent3.80——Moderate red in the local regionWeak red in the local region
Note: The surfaces of Sap-7, Sap-9, and Sap-12 exhibit insufficient smoothness, rendering their refractive indices unmeasurable.
Table 2. Main trace element contents (ppm) in the samples Sap-1 and Sap-5 analyzed by the LA-ICP-MS.
SampleColorSpotCrFeTiVGaMgGr/GaFe/Ti
Sap-1red1−1983 1225 2 53 86 011.48 625.02
1−21151 1320 0 54 96 012.01 ——
1−31512 1250 2 76 99 015.31 809.00
1−41291 1421 1 142 104 012.43 1004.57
1−51121 1377 0172 101 011.09 ——
blue1−6441 1499 22 289 96 04.62 67.70
1−7474 1118 7 281 99 04.77 161.62
1−8437 1388 21 285 92 04.77 66.87
1−9454 1442 5 330 103 04.41 284.66
1−10481 1568 21 346 103 04.67 73.91
Sap-5red5−11417 1604 056 125 011.33 ——
5−21219 1389 0 63 111 010.99 ——
5−31101 1415 0 94 104 010.61 ——
5−4874 1428 3 141 111 07.91 ——
5−5938 1379 0 128 110 08.54 ——
blue5−6208 1469 0 262 111 01.86 ——
5−7124 1516 4 294 114 01.09 386.63
5−899 1535 5 288 105 00.94 322.11
5−988 1527 5 297 105 150.84 287.90
5−1084 1562 21 260 97 00.87 75.26
Table 3. Main factors determining the absorbance peaks in the red region of Sap-1 and Sap-5.
Color MechanismElementsSap-1 (Red Zone)Sap-5 (Red Zone)
Crystal field theoryFe3+
Fe3+-Fe3+398 nm395 nm
Electronic transfer ReferencesFe2+-Ti4+555 nm551 nm
Cr3+398 nm, 555 nm, 656 nm, 692 nm395 nm, 551 nm, 665 nm, 690 nm
Fe2+-Fe3+ 787 nm
Table 4. Main factors determining the absorbance peaks in the blue region of the samples Sap-1 and Sap-5.
Color MechanismElementsSap-1
(Blue Zone)
Sap-5
(Blue Zone)
Crystal field theoryFe3+ 389 nm
Fe3+-Fe3+
Electronic transfer ReferencesFe2+-Ti4+558 nm562 nm
Cr3+398 nm, 558 nm, 670 nm562 nm, 669 nm
Fe2+-Fe3+
Disclaimer/Publisher’s Note: The statements, opinions and data contained in all publications are solely those of the individual author(s) and contributor(s) and not of MDPI and/or the editor(s). MDPI and/or the editor(s) disclaim responsibility for any injury to people or property resulting from any ideas, methods, instructions or products referred to in the content.