Article

From Waste to Sustainable Resource: Linking Phyllite Parent Rock Mineralogy to Suitability of Manufactured Sand for Concrete Construction

1
School of Minerals Processing and Bioengineering, Central South University, Changsha 410083, China
2
Key Laboratory of Hunan Province for Clean and Efficient Utilization of Strategic Calcium-Containing Mineral Resources, Changsha 410083, China
3
School of Civil Engineering, Central South University, Changsha 410083, China
4
College of Resources and Environmental Engineering, Jiangxi University of Science and Technology, Ganzhou 341000, China
5
BGRIMM Technology Group, 100160 Beijing, China
6
Nanjing Kunyuan Materials Co., Ltd., Nanjing 211200, China
*
Author to whom correspondence should be addressed.
Minerals 2025, 15(11), 1098; https://doi.org/10.3390/min15111098
Submission received: 10 September 2025 / Revised: 15 October 2025 / Accepted: 16 October 2025 / Published: 22 October 2025
(This article belongs to the Section Environmental Mineralogy and Biogeochemistry)

Abstract

The expansion of copper mining operations has led to the accumulation of a large amount of phyllite waste rock. Re-purposing this material into manufactured sand presents a promising solution for its large-scale consumption. In this study, phyllite waste rock from the Dexing Copper Mine was used as raw materials to prepare manufactured sand. A precise mineralogical analysis was conducted using Tescan Integrated Mineral Analyzer (TIMA) to determine the mineral composition, intergeneration and distribution relationships, particle size and shape, and elemental distribution. The performance of the resulting manufactured sand was comprehensively evaluated. Key findings showed a needle and flake particle content of 5.2%, a methylene blue (MB) value of 1.3, and a stone powder content of 9%. The physical properties, including solidity, crushing index, density, and porosity, as well as mica content, complied with the national standard GB14684-2022 (Sand for Construction). Additionally, phyllite-sand concrete exhibited a third-month expansion rate below the standard limit of 0.1%, indicating no potential risk for alkali-silica reaction. The radioactive index of the material met the standard requirements, posing no radiation hazard. However, the excessive sulfur compounds in phyllite present a risk of corrosion of the concrete structures, necessitating mitigation measures.

1. Introduction

Waste rock is composed of the surrounding rocks and interlayer rocks that are stripped during the mining process. Due to its low economic value, waste rock is often piled up in large quantities and not utilized [1]. In China, mining operations generate a substantial volume of waste rock, with annual discharge reaching approximately 4 billion tons. By the end of 2022, the cumulative stockpile had exceeded 70 billion tons [2]. The accumulation of these waste rock piles consumes considerable land resources and poses multiple environmental risks. For instance, exposure to air and water can leach heavy metals and sulfides and other hazardous substances from the waste rock, leading to soil and groundwater contamination [3,4]. Furthermore, in regions with abundant rainfall, waste rock piles are susceptible to geological hazards, including landslides and debris flows, which severely threatens both enterprise and national interests [5,6,7]. Given the large-scale extraction and generation of waste rock with limited utilization, exploring suitable methods to enhance its resource utilization is of paramount importance.
The advancement of industrialization and infrastructure development has necessitated an increased surge in demand for aggregates for construction. While natural river sand was initially the primary source of these aggregates, the rapid expansion of the construction sector has led to this unprecedented demand, with China’s building materials industry needing nearly 20 billion tons in 2018 [8]. The scarcity of natural sand and gravel resources has made it increasingly difficult to meet the supply needs for construction materials. Consequently, identifying alternative raw materials to replace traditional aggregates has become critically important. One viable alternative is manufactured sand. Manufactured sand is defined as an aggregate—with a particle size of less than 4.75 mm—produced from rocks, pebbles, mine tailings, or waste rock through processes including soil removal, mechanical crushing, shaping, screening, and grading. The final product (i.e., manufactured sand) must meet the specification criteria for gradation, particle shape, and fine content, while excluding soft or weathered particles [9]. In recent years, the use of manufactured sand as a substitute for natural river sand in concrete production has garnered significant research interest and has been widely adopted in practical applications.
The current processing flow for producing manufactured sand from copper mine waste rock primarily involves crushing and screening to generate small particles, followed by washing and other treatments [10]. Research has explored various aspects of this process. For example, Liu et al. [11] investigated the relationship between crushing equipment and properties of manufactured sand (powder content, particle size distribution, and shape parameters) using iron ore waste rock. Zhang [12] successfully improved the conventional processing method for sand from Dashihe iron ore by incorporating pre-desliming and direct crushing with fine powder screening, thereby reducing production costs. Moreover, studies have demonstrated that the properties of both manufactured sand and the resulting concrete produced are highly dependent on the parent rock characteristics. Ma et al. [13] revealed that ultra-high-performance concrete (UHPC) made with tuff-derived manufactured sand achieved a 28-day compressive strength exceeding 150 MPa. Conversely, Song et al. [14] reported that concrete made with calcareous sand (derived from limestone) exhibited higher strength, while siliceous sand led to poorer workability and reduced water-reducer compatibility. While current research provides valuable insights into the manufacturing process and the final concrete product, a comprehensive characterization of the waste rock raw materials themselves has received limited attention. This research addresses the need for comprehensive mineralogical and geochemical analysis of the parent rock source to better predict and optimize sand performance.
Granite and sandstone are the most commonly used waste rocks for producing manufactured sand. Phyllite, which is a low-grade regional metamorphic rock [15], presents a viable but understudied alternative. Due to its low strength, weak cohesion, and poor water stability, phyllite has limited use as a raw material for manufactured sand, and consequently, few studies exist on concrete incorporating phyllite aggregates. Nevertheless, phyllite waste continues to accumulate from the extensive mining of metamorphic deposits consisting of gold, silver, lead, and zinc ores. This high availability, in addition to its moderate hardness and low extraction costs, offers significant advantages for producing aggregates for low-performance concrete applications [16,17]. Therefore, a comprehensive investigation of the physicochemical properties of phyllite waste rock is necessary. By designing corresponding and suitable processing techniques, the large-scale production of manufactured sand from phyllite can be actualized. This approach could maximize resource utilization, reduce environmental footprints, and yield substantial economic benefits for the concrete industry.
This study utilized phyllite waste rock from the Dexing Copper Mine as the raw material for sand manufacturing. The mineral composition and microstructural characteristics of the raw material were first analyzed using Tescan Integrated Mineral Analyzer (TIMA) technology to reveal mineral intergrowth and distribution patterns. Based on the mechanical differences among the constituent minerals, a tailored crushing process was developed. The physical properties of manufactured sand (i.e., flakiness index, crushing value, and soundness) and chemical properties (mica content, alkali activity, and radioactivity) were systematically tested. A comprehensive evaluation was conducted according to GB/T 14684-2022 [18] standard, leading to data-driven insights for proposing process optimization and improvement.

2. Materials and Methods

2.1. Materials

The parent rock used for manufacturing sand in this study was phyllite waste rock sourced from Dexing Copper Mine. Dexing Copper Mine consists of 1.63 billion tons, the existing ore reserves consist of 1.32 billion tons, and the copper metal quantity is more than 5 million tons. The annual output of copper concentrate contains more than 150,000 tons of copper; the five waste rock yards of the copper plant mining site occupy a land area of 890.6 hectares. The sampling location for phyllite had coordinates of (573884, 3209683) according to the Beijing Geodetic Coordinate System 1954 and Yellow Sea elevation of 65 m, and the materials measured a copper content of 0.17%. The photo of a typical phyllite sample is shown in Figure 1. The apparent density of the phyllite is 2820 kg/m3, the loose packing density is 1740 kg/m3, and the porosity is 38.3%. Supported by the X-ray Fluorescence Spectrometer in the lab of Centrals South University, the chemical composition could be evaluated as follows. The primary chemical components of the phyllite were silicon dioxide (SiO2) and aluminum oxide (Al2O3), as listed in Table 1. Additionally, other minor constituents detected were potassium oxide (K2O), iron oxide (Fe2O3), calcium oxide (CaO), copper oxide (CuO), sulfur trioxide (SO3), and magnesium oxide (MgO) (Table 1). The NaOH reagent employed to assess the alkali activity of the aggregate was procured from Shanghai Maclin Biochemical Technology Co., Ltd., Shanghai, China. Ordinary Portland cement (P·O 42.5 grade) with its chemical composition provided in Table 1. The phase compositions of the raw materials (P·O 42.5 and phyllite) are shown in Figure 2.

2.2. Methods

The chemical composition of the phyllite parent rock was determined by using X-ray fluorescence spectrometer (XRF). Quantitative mineralogical analysis was performed with a TESCAN TIMA-X FEG (GM) integrated mineral analyzer, equipped with a MIRA Schottky FEG (GM) hardware and highly automated identification software. This system provides insights into the mineral dissociation particle morphology, size distribution of particles, elemental composition, and pore space characteristics.
The compressive strength of the parent rock was tested following the rock compressive strength test method specified in Section 7.11 of “Pebbles and Crushed Stone for Construction” (GB/T 14685-2022 [19]). The elasticity modulus (E) and Poisson’s ratio (v) of the parent rock were determined via uniaxial compression deformation tests described in Section 2.9 of the “Standard Test Methods for Engineering Rocks” (GB/T 50266-2013 [20]). The shear modulus (G) was subsequently calculated using Formula (1):
G   =   E 2 ( 1 + ν )
where E is the elasticity modulus, and v is the Poisson’s ratio.
The properties of the resulting phyllite manufactured sand were tested in accordance with the requirements of the relevant national standard “Sand for Construction” (GB/T 14684-2022). Following the guidelines outlined in Section 7.3 for particle grading tests, the cumulative sieve residue of the phyllite manufactured sand was measured employing 4.75 mm, 2.36 mm, 1.18 mm, 0.6 mm, 0.3 mm, and 0.15 mm sieve sizes, respectively. The needle and flake content was determined according to Section 7.15. The sample was first sieved mechanically for 10 min using a bar screen, and then manually checked.
For the methylene blue (MB) value and stone powder content tests, a 200.0 g sample of sand passing through a 2.36 mm sieve, as specified in Section 7.5, was placed into a beaker containing 500 g of distilled water. The suspension was stirred at a speed of 600 r/min using an impeller mixer for 5 min, and then continuously stirred at 400 r/min until the test ended. The stone powder content was assessed according to Section 7.4.2.
Other physical properties of the manufactured sand were evaluated following the test methods described in Sections 7.13, 7.14, 7.16, and 7.17. For the firmness and crushing index tests, the sample was screened and graded into four grades: 0.3–0.6 mm, 0.6–1.18 mm, 1.18–2.36 mm, and 2.36–4.75 mm, in accordance with the method specified in Section 7.3. The mica content, sulfides, and sulfates (SO3) in the copper mine waste rock were measured following the procedures in Sections 7.7 and 7.10, respectively.
The potential for alkali-silica reaction was evaluated utilizing the rapid mortar bar method (as specified in Section 7.19.2), a commonly employed technique for assessing this reaction. In applying this method, mortar bars of dimension 25 mm × 25 mm × 280 mm were prepared with a cement-to-sand ratio of 1:2.25 and a water-to-cement ratio of 0.47. After 24 h of curing, the specimens were demolded, and their initial lengths were measured and recorded. The specimens were then immersed in a water bath and cured at a controlled temperature of 80 ± 2 °C. After another 24 h of curing, the specimens were removed and their reference lengths were measured using a length comparator to establish a baseline, with readings taken within 15 ± 5 s.
Subsequently, the mortar bar specimens were immersed in a curing cylinder containing 1 mol/L NaOH solution and placed in the water bath. The mortar bar length measurements were taken again at 3, 7, and 14 days after establishing the baseline. After each length measurement, the specimens were returned to their original curing cylinders. This study employed a Bruker Advance III 400 MHz NMR spectrometer (Bruker, Billerica, MA, USA) to detect silicon structures via 29Si NMR, using dimethyl sulfoxide as the deuterated solvent under a relaxation time of 3 s and 2560 acquisition cycles. The effect of alkali-silica reaction (ASR) was assessed by X-ray diffraction (XRD) using a Bruker D8 Advance X-ray diffractometer (Bruker, Billerica, MA, USA) operated at 40 kV and 30 mA with CuKα radiation, scanning from 5° to 65° (2θ) at a rate of 2°/min. Microstructural and compositional changes in the mortar bars incorporating phyllite manufactured sand were further examined using a JSM-IT500LV (JEOL, Tokyo, Japan) scanning electron microscope equipped with energy-dispersive X-ray spectroscopy (EDS), at an acceleration voltage of 20 kV and a working distance of 13 mm.
Finally, the radioactivity of the manufactured sand was assessed in accordance with the national standard “Radionuclide Limit for Building Materials” (GB 6566-2010 [21]), resulting in the determination of both internal and external radiation indices.

3. Results and Discussion

3.1. Research on the Maternal Lithology of Phyllite Derived from COPPER Mines

3.1.1. Analysis of Physical and Mechanical Properties of Phyllite from Copper Mines

The physical and mechanical properties of the tested copper mine phyllite are presented in Table 2 and Table 3. The phyllite exhibits distinct anisotropy in its mechanical properties. Parallel to the foliation, the phyllite has a compressive strength of 86.9 MPa, an elastic modulus of 25.01 GPa, and a shear modulus of 10.8 GPa. In the direction perpendicular to the foliation, the corresponding values are 74.4 MPa for compressive strength, 31.21 GPa for the elastic modulus, and 12.63 GPa for the shear modulus. Compared to other common rock types used for manufactured sand (e.g., granite and sandstone), the phyllite exhibits lower mechanical strength. This characteristic is primarily influenced by its mineral composition. The phyllite primarily comprises fine-grained micaceous minerals (e.g., sericite and chlorite) and quartz. These platy minerals align parallel under directed pressure, resulting in a distinct foliation structure. The lower hardness of these platy minerals, combined with the distinct foliation structure, contributes to the reduced overall strength of phyllite [22]. In essence, rocks with lower compressive strength demonstrate reduced elastic and shear moduli.

3.1.2. Process Mineralogical Characterization of Phyllite from Copper Mines

(1)
Mineral composition characteristics
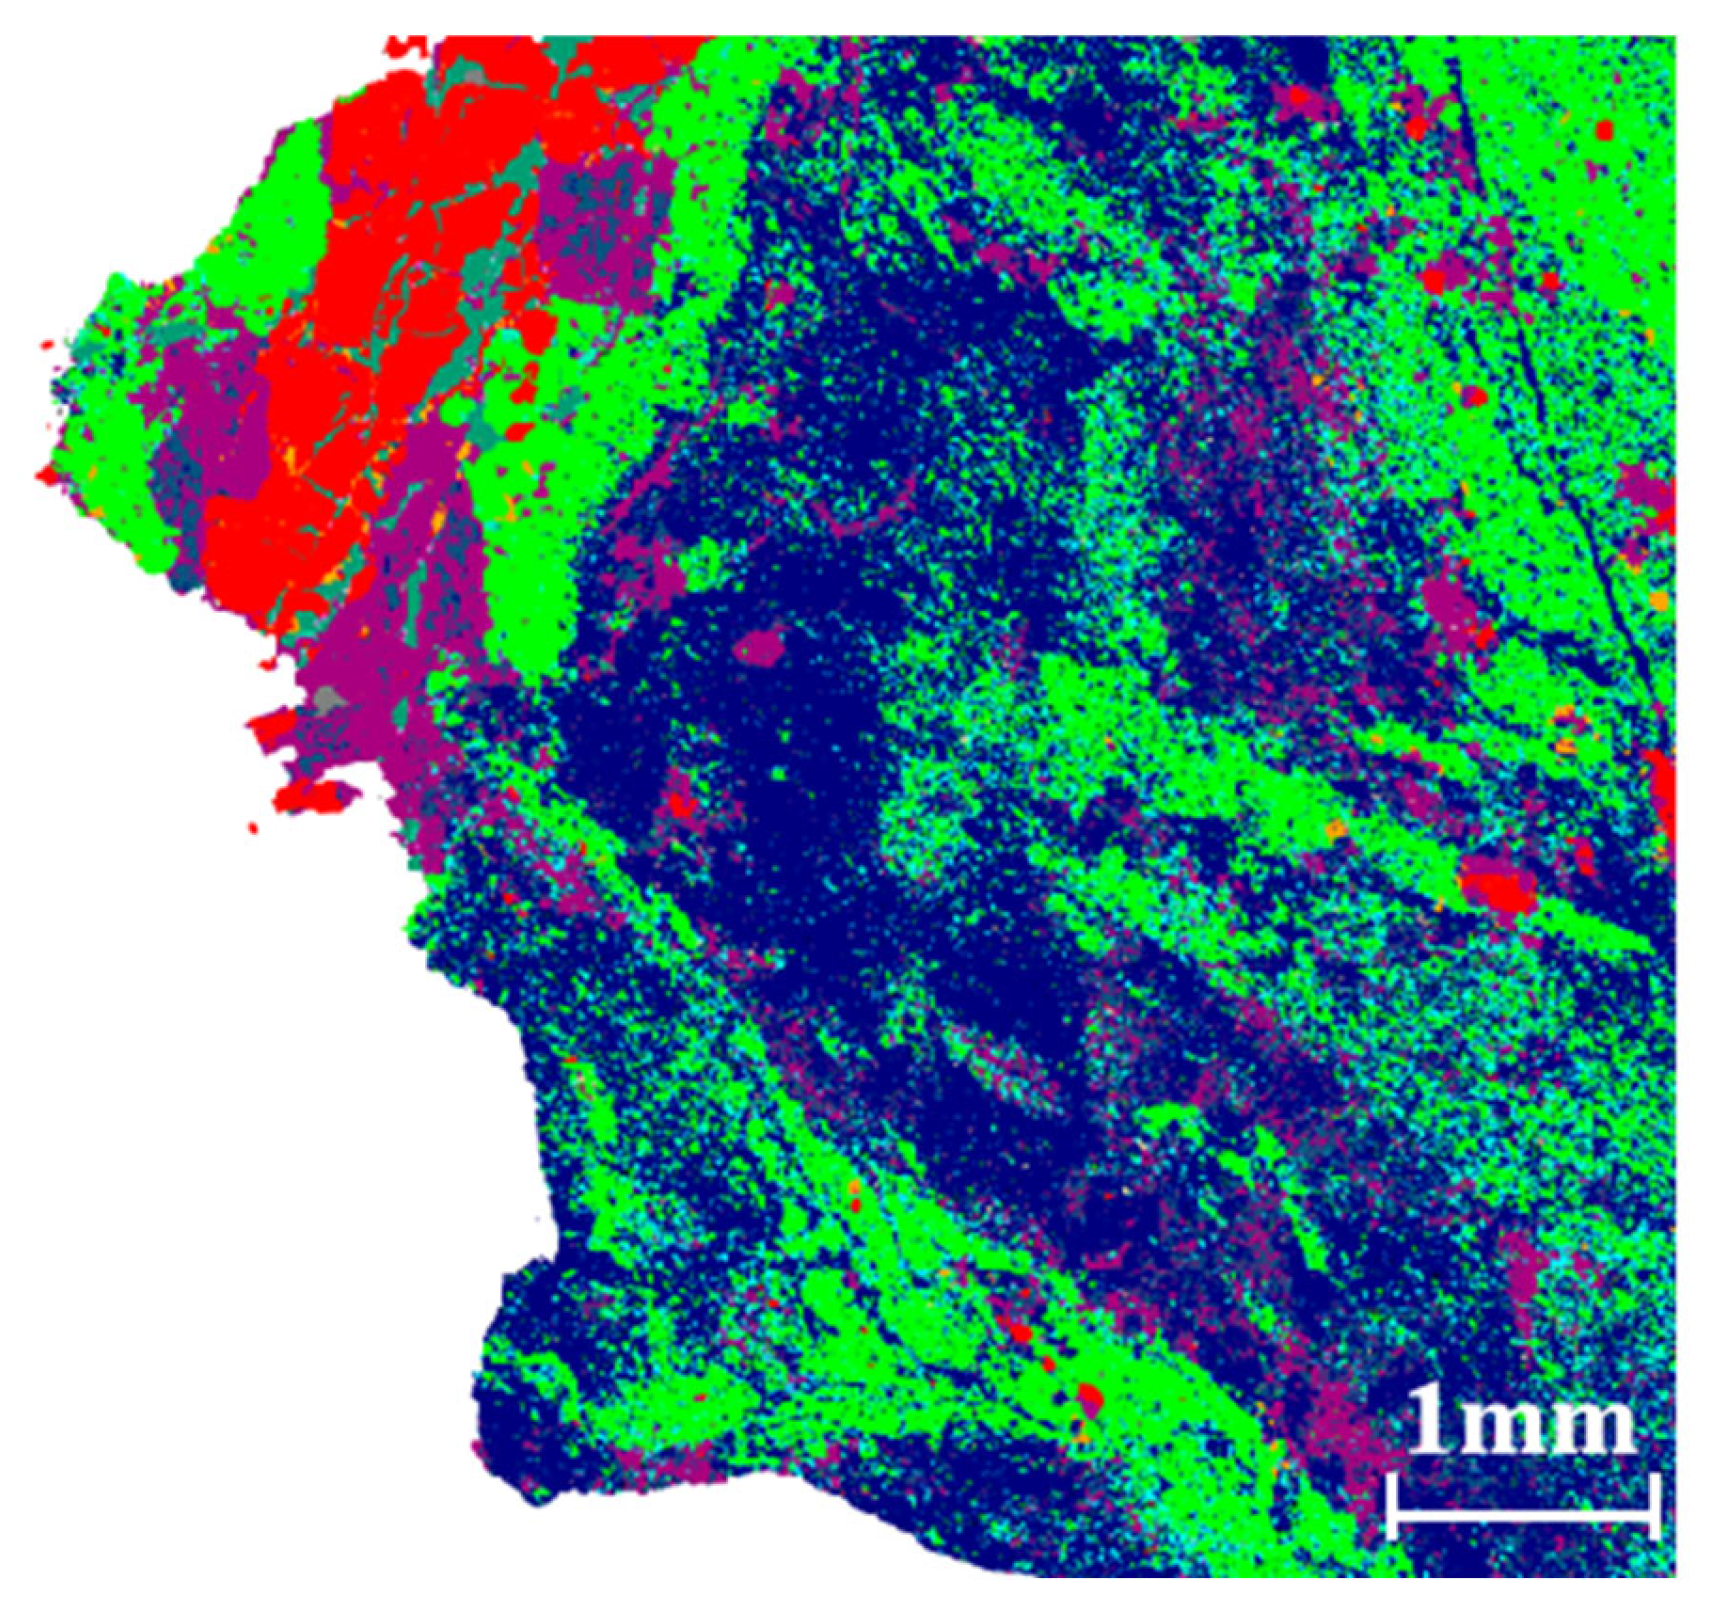
The mineral distribution within the phyllite is shown in Figure 3. The rock samples are predominantly composed of mica and quartz, with minor amounts of pyrite and chlorite as impurities. Mica is the main mineral component of argillite. As a soft mineral, it is prone to being crushed into fine sheets or silt during processing, which reduces the screening efficiency, the overall strength of manufactured sand, and its binding force with cementitious materials. The quartz in phyllite is evenly distributed in the sheet-like structure composed of plate-like minerals in the form of fine-grained matrix, and coexists with other minerals such as mica in a discontinuous striped pattern. Its high hardness helps in enhancing the fluidity, strength, and durability of the manufactured sand. Pyrite occurs in granular and vein-like formations. This mineral is prone to oxidation, which can produce acidic substances that corrode processing equipment and potentially affect the pH of manufactured sand. Moreover, chlorite found impregnated and embedded within waste rock samples has a detrimental effect on manufactured sand and concrete products [23,24].
Table 4 presents the density and hardness characteristics of various minerals found in the phyllite waste. Pyrite and monazite exhibit relatively high densities (5 g/cm3 and 4.23 g/cm3, respectively), allowing for their effective separation from the target mineral composition through gravity separation methods. As revealed, quartz, with a hardness rating of 7, can withstand significant crushing forces, while helping to maintain optimal particle shape and size distribution in the final product. This characteristic enhances the overall hardness and durability of the manufactured sand, making it suitable for applications in high-strength concrete, construction, and road building. In contrast, mica, chlorite, and calcite possess significantly lower hardness values (2.5–4.0, 2.0–3.0, and 3). This property difference enables their separation from harder minerals such as quartz during the crushing process [25]. However, the presence of softer minerals in phyllite leads to increased stone powder content and MB value in the crushed product. This increases water demand and reduces the strength of the manufactured sand, adversely affecting concrete workability. Therefore, it is essential to optimize the crushing process accordingly to mitigate these adverse effects.
(2)
Characteristics of elemental distribution
The primary chemical elements detected in the phyllite include oxygen (O), silicon (Si), aluminum (Al), potassium (K), iron (Fe), sulfur (S), magnesium (Mg), calcium (Ca), copper (Cu), and chlorine (Cl). Figure 4 illustrates the distribution of several key elements that significantly influence the rock’s properties: silicon, aluminum, calcium, sulfur, iron, and chlorine. As illustrated in this figure, red indicates high concentrations and blue denotes low concentrations. Silicon exhibits high abundance and uniform distribution throughout the phyllite. Combining this with the mineral analysis from Figure 3 confirms that silicon primarily originates from quartz. This abundance and distribution of quartz enhances the hardness, strength, and wear resistance of the manufactured sand [24]. Aluminum is predominantly present in muscovite, biotite, and chlorite. This element plays a critical role in cement hydration reactions, contributing to the resulting strength and durability properties of concrete [28]. Calcium, mainly derived from calcite, is present at relatively low levels. When available, it contributes to improving the strength and durability of the manufactured sand. However, the presence of certain undesirable elements, particularly sulfur and chlorine, can compromise the overall performance and long-term durability of the manufactured sand and the resulting concrete.
Among these elements, sulfur poses a significant risk, as it reacts with calcium in cement to form soluble calcium sulfate. This reaction leads to concrete expansion, cracking, and eventual strength loss [29]. Similarly, excessive iron can cause concrete discoloration and reduce its strength. Chlorine, a well-known corrosive agent often commonly found in marine sands, induces corrosion of steel reinforcement, severely compromising the durability and structural integrity of concrete. The contents of sulfur, iron, and chlorine in the studied phyllite are relatively low. This can be attributed to the specific mineral contents and geological history of the rock, with sulfur and iron primarily concentrated in pyrite and chalcopyrite, which constitute only a minor proportion of the phyllite. Additionally, the studied phyllite rock mass has not undergone metamorphism involving chlorine-rich fluids (e.g., seawater-derived hydrothermal solutions or brines), resulting in negligible chlorine content. To mitigate the adverse effects of harmful elements and to ensure the production of desirable manufactured sand and concrete, appropriate mineral processing methods must be implemented to remove minerals such as mica, pyrite, chalcopyrite, and chlorite.
(3)
Particle size and shape characteristics
Figure 5 shows the particle size distribution of different minerals within the phyllite waste rock. A comparative analysis reveals that quartz and muscovite are present in all grain size fractions and are relatively uniformly distributed. Other minerals exhibit distinct and highly relevant classifications. Within the phyllite waste rock, chalcopyrite accounts for 83.58% with a particle size of less than 80 µm. The particle sizes of biotite and apatite are also concentrated in the fine particle range. For example, biotite and apatite with <40 µm particle sizes account for 86.13% and 68.13%, respectively. The particle size of pyrite in phyllite is mainly distributed in the particle size range of 100 to 300 µm. Calcite minerals have a relatively large particle size, mainly distributed in the range of 100–400 µm, with 57.85% content of particles. Additionally, chlorite has varying degrees of content distribution, with a particle size of less than 40 µm and 100–200 µm accounting for 21.21% and 15.14%, respectively.
Figure 6 shows the grain shape distribution of the main minerals in the phyllite. The analysis reveals key characteristics. First, the content of millimeter-sized pure quartz particles detected in waste rocks is relatively low. Quartz is predominantly found in sizes around 100 µm containing 5%–8% aluminum/iron impurities. The quartz crystals exhibit irregular and granular shapes, with some occurring as granular and striped aggregates. Mica minerals (muscovite and biotite) in phyllite mainly exhibit flake and plate-like forms with relatively flat edges. This morphology makes it prone to crack easily along the lamellar direction during crushing, significantly increasing the needles and flake content in the crushed product. Specifically, the particle diameter of muscovite is very large, with a maximum diameter of approximately 1.4 mm. In contrast, biotite particles have a more uniform and relatively small particle size distribution, with the maximum diameter of aggregated biotite not exceeding 0.2 mm. As shown in the figure, pyrite particles display moderate shape and diameter, with a maximum diameter of approximately 0.7 mm. Similarly, the aggregated chlorite presents a needle-like form, with a maximum diameter of approximately 3.5 mm. Upon crushing, phyllite yields manufactured sand particles with pronounced angularity, attributed to the distinctive grain shape. This angularity enhances mechanical interlocking among particles, thereby contributing to higher concrete strength [30].

3.2. Research on Properties of Manufactured Sand Derived from Phyllite

3.2.1. Study on Particles and Gradation of Manufactured Sand Derived from Phyllite

Figure 7 illustrates the particle grading test results for the manufactured sand derived from the phyllite waste rock. The results demonstrate that the cumulative sieve residues for all particle size fractions fall within the upper and lower limits specified by the national standard GB/T 14684-2022 “Sand for Construction”. This indicates that the mineral composition of the copper mine waste rock and the selected crushing process are appropriate, without excessively oversized particles and over-grinding of finer sand.
As presented in Table 5, the content of needle-like and flaky particles in the phyllite manufacture sand was found to be 5.2%, which is below the 10% threshold specified by the national standard GB14684-2022 “Sand for Construction.” This suggests that phyllite has the potential for use in preparing high-strength concrete.
The MB value of phyllite is 1.3 and the stone powder content is 9%. These values comply with the standard requirements for Class III and Class II sand, respectively. The foliation structure phyllite is prone to break along its bedding plane into thin flaky particles. During the breaking process, large amount of needle-like flaky particles and rock powder are produced, increasing the stone powder content of the manufactured sand. In addition, the MB value of phyllite-derived manufactured sand is higher compared to that of sand from other parent rocks. This can be attributed to the high content of clay minerals which are interlayered within the rock’s structure. These minerals tend to generate a large amount of clay-like fine particles after crushing. A high MB value of 1.3 indicates that the manufactured sand contains a high content of reactive fines, exhibiting strong water absorption capacity. This characteristic increases the water demand of concrete mixes, weakens the interfacial bonding strength between the cement paste and aggregate, and ultimately leading to a reduction in the mechanical strength and durability of the concrete [31,32].
The test results for the physical properties of the phyllite manufactured sand are presented in Table 6. The results include solidity, crushing index, apparent density, loose packing density, and porosity index. The results indicate that all measured physical properties meet the standard requirements outlined in “Sand for Construction” making it suitable for utilization in sand manufacture. However, the relatively high content of soft minerals in the phyllite demonstrates the notable lower solidity and a higher crushing index compared to sands derived from harder parent rocks. These properties suggest that while the sand meets the minimum standards, particles may be more susceptible to breakdown under mechanical stress. Thus, strict quality control measures should be implemented in practical production. Proper washing cycles and specialized shaping processes must be regulated based on the MB value to ensure the resulting manufactured sand concrete meets performance requirements.

3.2.2. Study on the Harmful Substance Content in Phyllite-Derived Manufactured Sand

The content of harmful substances in the phyllite-derived manufactured sand is shown in Table 7. The term “harmful substances” refers to impurity components that adversely affect the performance of concrete, primarily including mica, lightweight substances (e.g., leaves, wood chips, etc.), organics, sulfides and sulfates, and chlorides. The tested manufactured sand was found to contain 1.3% mica, a value which complies with the standard limit of 2.0%. The combined sulfide and sulfate content was 0.45%. This is attributed to the presence of pyrite. Upon exposure to air and water, pyrite oxidizes, forming sulfate ions which react with cement hydration products to form ettringite and gypsum, leading to internal stress causing concrete expansion, cracking, and loss of strength. Additionally, sulfates corrode the concrete matrix, and the resulting microcracks increase porosity and permeability, thereby severely reducing long-term durability. Conversely, the chloride content in the phyllite-derived manufactured sand measured only 0.001%, which is well below the standard limits. No detectable amounts of lightweight substance or organic matter were found in the sample.

3.2.3. Study on Alkali Aggregate Reaction and Radioactive Energy of Phyllite-Derived Manufactured Sand

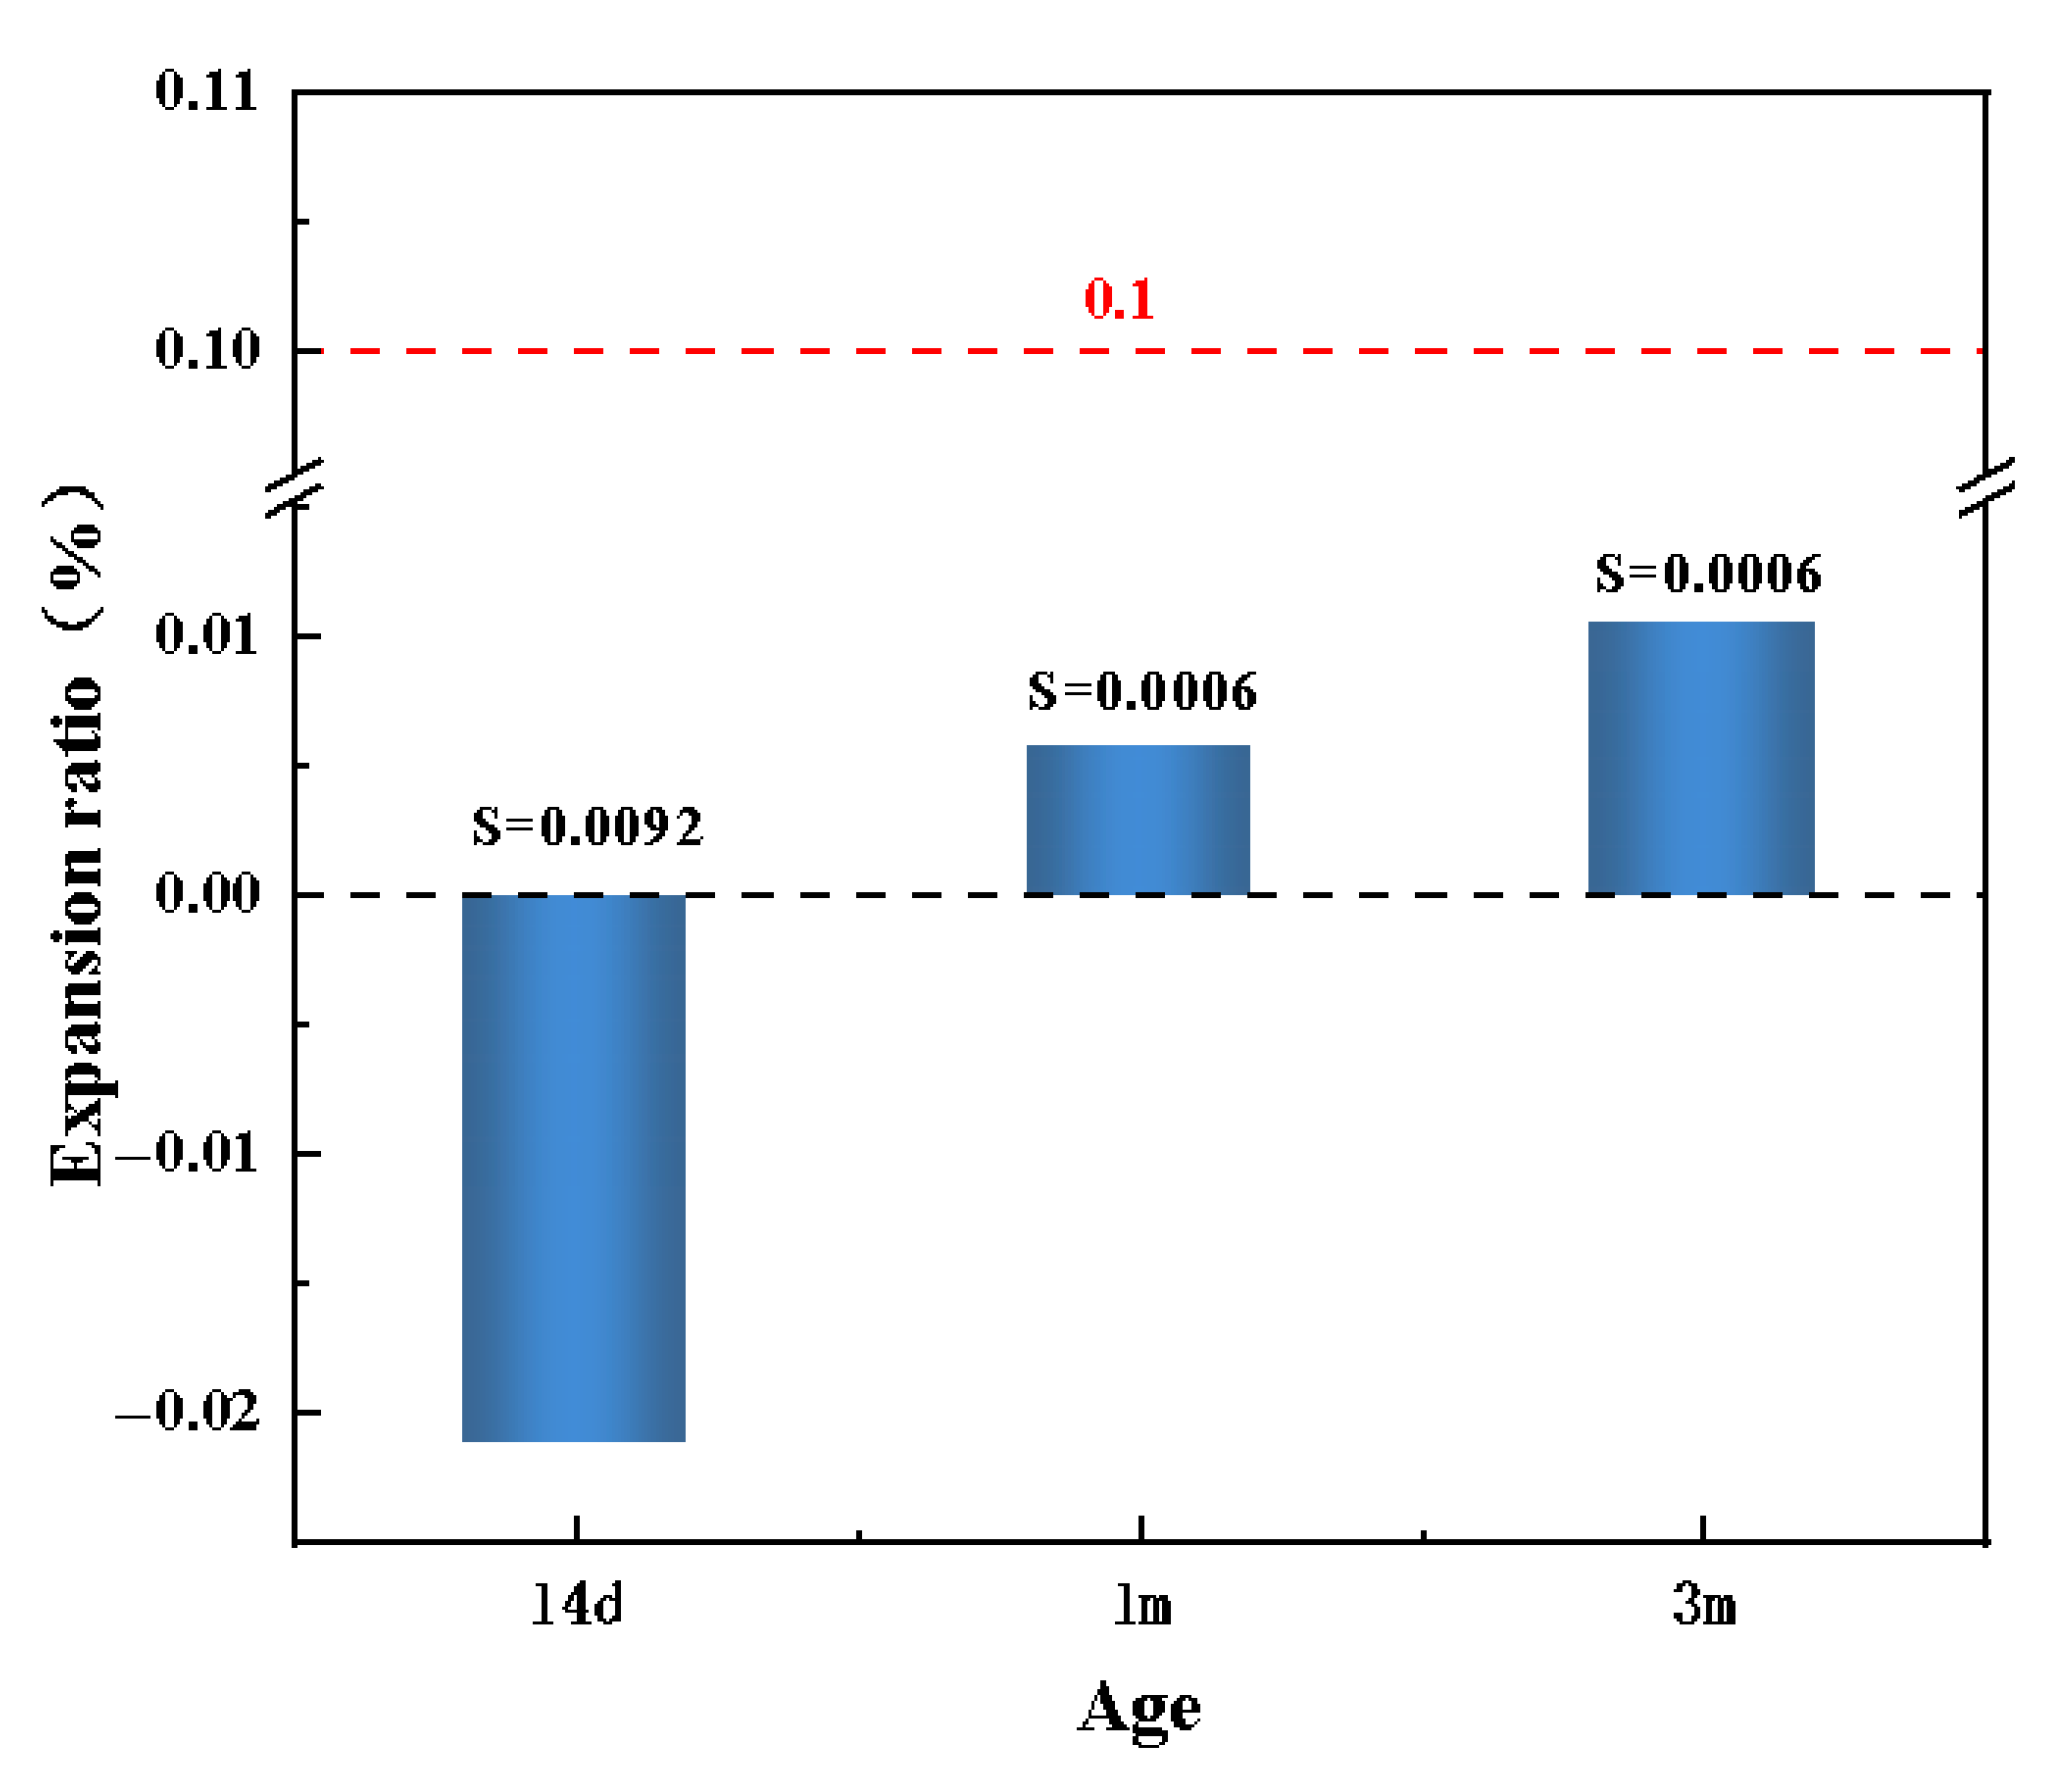
Figure 8 illustrates the results of mortar bars incorporating manufactured sand produced from phyllite waste rock under the alkali-silica reaction test. The figure shows a negative expansion (contraction) at the 14-day period. This initial contraction can be due to the autogenous and chemical shrinkage associated with rapid early-stage hydration of mortar bars. Beyond 14-day period, the expansion rate of the phyllite manufactured sand measured 0.0057% in the first month. By the third month, the expansion rate reached 0.0105%. In the figure, the symbol “S” represents the standard deviation, indicating the dispersion of expansion rate data across different ages. This value remains well below the limit of 0.1% specified in the rapid mortar bar test. These findings indicate that the phyllite-derived manufactured sand poses no risk of alkali-silica reaction, making it a suitable aggregate for concrete construction.
In silicate chemistry, the different types of SiO4 units are represented by Qn: Q0 with chemical shifts between −68 and −76 ppm denoting an isolated silica-oxygen tetrahedron; Q1 with chemical shifts between −76 and −82 ppm denoting a silica-oxygen tetrahedron that is connected to only one silica-oxygen tetrahedron; Q2 with chemical shifts between −82 and −88 ppm denoting a silica-oxygen tetrahedron that is connected to two silica-oxygen tetrahedra; the chemical shifts of Q3 between −88 and −98 ppm, denoting a silica-oxygen tetrahedron connected to three other silica-oxygen tetrahedra; and Q4 chemical shifts between −98 and −129 ppm, denoting a structure that forms a three-dimensional network with four silica-oxygen tetrahedra. Figure 9 shows the 29Si NMR spectra of the raw material of phyllite mechanism sand and the silicon phase variations of the different structures calculated from the inverse convolution. Following the denotation of silicate chemistry above, there are two peaks: Q1 (−76.1 ppm) and Q2 (−87.6 ppm) in the phyllite. The calculated intensity of Q1 and Q2 is 1.13 × 10⁹ and 4.53 × 10⁹, with Q2 exhibiting a higher intensity value. This indicates that the silicon atoms in the phyllite-manufactured sand are mainly composed of chain-like groups (Q2). Furthermore, there is relatively high Al2O3 content, suggesting that aluminum partially substitutes silicon tetrahedral sites. Since aluminum is one valence less than silicon, this substitution creates negative charge imbalance, necessitating adsorbing alkali ions and reaching equilibrium.
Specimens prepared from phyllite-manufactured sand and subjected to alkali-silica reaction testing were analyzed using XRD, and the diffraction patterns before and after the ASR are illustrated in Figure 10. The XRD analysis confirms that the phyllite specimens are primarily composed of quartz, albite, portlandite, chlorite, and muscovite, with calcite present in minor phase. The absence of any discernible amorphous broad peaks in the 2θ range of 10–30° in Figure 10, which are characteristic of ASR gelation, indicates that the alkali-silica reaction did not occur or was significantly mitigated under the current experimental conditions during the manufactured sand production process of phyllite waste rock.
SEM was employed to examine the alkali-silica reaction of phyllite-derived manufactured sand exposed to a 1 mol/L NaOH solution at 80 °C for 14 days. As shown in Figure 11 (two different areas are respectively labeled as (I) and (II)), the images reveal that the phyllite aggregates remain intact and show no clear signs of dissolution and surface erosion. All analytical points exhibit elevated calcium, moderate silicon, and low sodium contents, consistent with the composition typical of cementitious matrices or aggregate minerals. Elevated levels of alkali metals—specifically sodium and potassium—serve as a characteristic signature of alkali-silica reaction (ASR) gel formation. However, pronounced sodium/potassium peaks accompanied by elevated silicon content were not detected in the dataset. It can be concluded that the characteristic morphology of ASR gel (needle-like features, honeycombs, or expansive cracks) is entirely absent.
The radioactive energy test was conducted on phyllite-derived manufactured sand and the results are presented in Table 8. The internal and external exposure indexes are 0.15% and 0.47%, respectively. These values are below the maximum standard limit of 1.0%, indicating no significant radioactive risk.

4. Conclusions

(1)
The phyllite waste rock is predominantly composed of mica and quartz, with minor amounts of pyrite and chlorite. This composition enables its use in producing medium-grade manufactured sand. The acicular and flaky particle content of phyllite was measured at 5.2%, which falls below the 10% limit specified by the national standard. The MB value of 1.3 and the stone powder content of 9% meet the requirements for Class III and Class II, respectively.
(2)
Key physical properties (solidity, crushing index, apparent density, loose packing density, and porosity index) of the phyllite manufactured sand comply with the national standard GB14684-2022, exhibiting favorable mechanical characteristics for use in construction.
(3)
Concrete prepared with the phyllite manufactured sand exhibited an expansion rate below 0.1% after three months of ASR test, indicating no detectable alkali-silica reaction risk. Moreover, the radioactive energy indicators of the material are within the defined limits, indicating no radiation hazard.
(4)
To prepare high-quality manufactured sand from phyllite waste rock on an industrial scale, the combined beneficiation process should be optimized to remove flaky and low-strength and sulfide-containing minerals. Moreover, the long-term performance of concrete prepared with phyllite manufactured sand is recommended to fully mitigate any potential risk for corrosion, and validate its long-term durability properties.

Author Contributions

Conceptualization, Q.Z.; Methodology, Y.L. and Y.T.; Validation, Q.Y.; Investigation, X.T. and M.W.; Resources, W.S. and Q.Z.; Data curation, Z.L.; Writing—original draft, Y.W. and A.Y. All authors have read and agreed to the published version of the manuscript.

Funding

This work is financially supported by the National Key Research and Development Program of China (2023YFC3904201) and the Science and Technology Innovation Program of Hunan Province (2023RC3053).

Data Availability Statement

The original contributions presented in the study are included in the article and further inquiries can be directed to the corresponding author.

Conflicts of Interest

Qingchao Zhao is employees of BGRIMM Technology Group. Mingyuan Wang is employees of Nanjing Kunyuan Materials Co., Ltd. The paper reflects the views of the scientists and not the company.

References

  1. Vriens, B.; Plante, B.; Seigneur, N.; Jamieson, H. Mine Waste Rock: Insights for Sustainable Hydrogeochemical Management. Minerals 2020, 10, 728. [Google Scholar] [CrossRef]
  2. Zhang, X.; Song, S.; Liu, F.; Liu, J.; Wu, R. Review on the Present Situation of Preparing Sand Aggregate from Mine Waste Rock. Fly Ash Compr. Util. 2023, 37, 55–63. [Google Scholar] [CrossRef]
  3. Wu, J.; Jing, H.; Yin, Q.; Yu, L.; Meng, B.; Li, S. Strength prediction model considering material, ultrasonic and stress of cemented waste rock backfill for recycling gangue. J. Clean. Prod. 2020, 276, 123189. [Google Scholar] [CrossRef]
  4. Zdravković, A.; Cvetković, V.; Šarić, K.; Pačevski, A.; Rosić, A.; Erić, S. Waste rocks and medieval slag as sources of environmental pollution in the area of the Pb-Zn Mine Rudnik (Serbia). J. Geochem. Explor. 2020, 218, 106629. [Google Scholar] [CrossRef]
  5. Wang, H.; Sun, G.; Sui, T. Landslide mechanism of waste rock dump on a soft gently dipping foundation: A case study in China. Environ. Earth Sci. 2021, 80, 200. [Google Scholar] [CrossRef]
  6. Cao, Y.; Zhu, X.; Liu, B.; Nan, Y. A Qualitative Study of the Critical Conditions for the Initiation of Mine Waste Debris Flows. Water 2020, 12, 1536. [Google Scholar] [CrossRef]
  7. Shao, L. Geological disaster prevention and control and resource protection in mineral resource exploitation region. Int. J. Low-Carbon Technol. 2019, 14, 142–146. [Google Scholar] [CrossRef]
  8. Zhuang, S.; Aurora, T.; Chen, R.; Ye, C. Trends, challenges, and mitigation strategies for the use of sand and gravel resources in China. J. East China Norm. Univ. (Nat. Sci.) 2022, 2022, 137–147. [Google Scholar] [CrossRef]
  9. S.K., K.; Singh, S.K.; Chourasia, A. Alternative fine aggregates in production of sustainable concrete—A review. J. Clean. Prod. 2020, 268, 122089. [Google Scholar] [CrossRef]
  10. Yao, H.; Cai, L.; Liu, W.; Qin, W.; Jiao, F.; Yang, C. Current Status and Development of Comprehensive Utilization of Waste Rock in Metal Mines in China. Chin. J. Nonferrous Met. 2021, 31, 1649–1660. [Google Scholar] [CrossRef]
  11. Liu, W.; Chen, M.; Mao, Y.; Zhang, H.; Shen, Y.; Liu, W. Influence of Crushing Method on the Performance Parameters of Iron Ore Waste Rock Preparation of Manufactured Sand. China Min. Mag. 2023, 32, 118–127. [Google Scholar] [CrossRef]
  12. Zhang, F. Experimental Research on Resource Utilization of Iron Tailings Waste Rock. Gansu Metall. 2021, 43, 8–10,13. [Google Scholar] [CrossRef]
  13. Ma, R.; Zhang, L.; Chen, Z.; Miao, C.; Zhang, C.; Fan, T.; Zhang, J.; Qian, X. Utilization of solid waste from tunnel excavation as manufactured sand with different lithology and pre-washing process for preparation of eco-friendly ultra-high performance concretes: Properties and microstructural analysis. J. Build. Eng. 2024, 82, 108252. [Google Scholar] [CrossRef]
  14. Song, S.; Cheng, C.; Yang, N. Influence of manufactured sand lithology on mortar and concrete performance. Concrete 2019, 9, 67–70. [Google Scholar] [CrossRef]
  15. Li, P.; Zhou, S.; Zhang, J.; Pan, A.; Chai, S.; Gong, Y.; Hu, J. Effects of high temperature on pore structure and mechanical properties of phyllite. Case Stud. Therm. Eng. 2025, 73, 106504. [Google Scholar] [CrossRef]
  16. Adom-Asamoah, M.; Afrifa, R.O. A study of concrete properties using phyllite as coarse aggregates. Mater. Des. 2010, 31, 4561–4566. [Google Scholar] [CrossRef]
  17. Zhao, Y.; Li, Y.; Wang, C.; Xue, K.; Chen, G.; Liu, P. Road performance of ordinary Portland cement improvement of strongly weathered phyllite filler. Constr. Build. Mater. 2022, 350, 128801. [Google Scholar] [CrossRef]
  18. GB/T 14684-2022; Sand for Construction. Standards Press of China: Beijing, China, 2022.
  19. GB/T 14685-2022; Pebbles and Crushed Stone for Construction. Standards Press of China: Beijing, China, 2022.
  20. GB/T 50266-2013; Standard Test Methods for Engineering Rocks. China Planning Press: Beijing, China, 2013.
  21. GB 6566-2010; Radionuclide Limit for Building Materials. Standards Press of China: Beijing, China, 2010.
  22. Ansari, T.; Kainthola, A.; Singh, K.H.; Singh, T.N.; Sazid, M. Geotechnical and micro-structural characteristics of phyllite derived soil; implications for slope stability, Lesser Himalaya, Uttarakhand, India. Catena 2021, 196, 104906. [Google Scholar] [CrossRef]
  23. Faesal, A.; Aminuddin, M.I.K.A.; Ubaidillah, A.S. Host rock petrology, hydrothermal alteration characteristics & ore mineralogy of porphyry copper-gold deposit, Brambang, Lombok, West Nusa Tenggara Indonesia. Mater. Today Proc. 2022, 66, 3071–3076. [Google Scholar] [CrossRef]
  24. Chaparro, M.A.E.; Gnanasaravanan, S.; Rajkumar, P. Trace and major minerals of (natural and manufactured) sand: The importance of manufactured sand for construction purposes and the preservation of rivers. Innov. Infrastruct. Solut. 2021, 6, 52. [Google Scholar] [CrossRef]
  25. Tuzingila, R.M.; Kong, L.; Koy Kasongo, R. A review on experimental techniques and their applications in the effects of mineral content on geomechanical properties of reservoir shale rock. Rock Mech. Bull. 2024, 3, 100110. [Google Scholar] [CrossRef]
  26. Fanrdon, J. World Encyclopedia of Minerals and Gemstones: Exploration and Identification; China Machine Press: Beijing, China, 2014; ISBN 9787111482178. [Google Scholar]
  27. Chen, C. Mineral and Rock Atlas; Phoenix Science Press: Nanjing, China, 2017; ISBN 9787553765747. [Google Scholar]
  28. Yao, L.; Shuo, Z.; Jun, L. Analysis of the synergistic effect of particle size of compound mineral admixtures on the hydration properties and porosity of Portland cement under low-temperature conditions. Mater. Today Commun. 2022, 33, 104372. [Google Scholar] [CrossRef]
  29. Guo, W.; Zhou, M.; Liu, Y.; Chen, L.; Chen, X. Research on expansion characteristics of circulating fluidized bed boiler bottom slag as concrete fine aggregate. J. Build. Eng. 2025, 101, 111953. [Google Scholar] [CrossRef]
  30. Pillai, A.G.; Gali, M.L. Engineering benefits of replacing natural sand with manufactured sand in landfill construction. Sci. Rep. 2023, 13, 6444. [Google Scholar] [CrossRef] [PubMed]
  31. Zhou, M.; Liu, Z.; Chen, X. Frost Durability and Strength of Concrete Prepared with Crushed Sand of Different Characteristics. Adv. Mater. Sci. Eng. 2016, 2016, 2580542. [Google Scholar] [CrossRef]
  32. Zhou, H.; Ge, C.; Chen, Y.; Song, X. Study on performance and fractal characteristics of high-strength manufactured sand concrete with different MB values. Front. Earth Sci. 2023, 11, 1140038. [Google Scholar] [CrossRef]
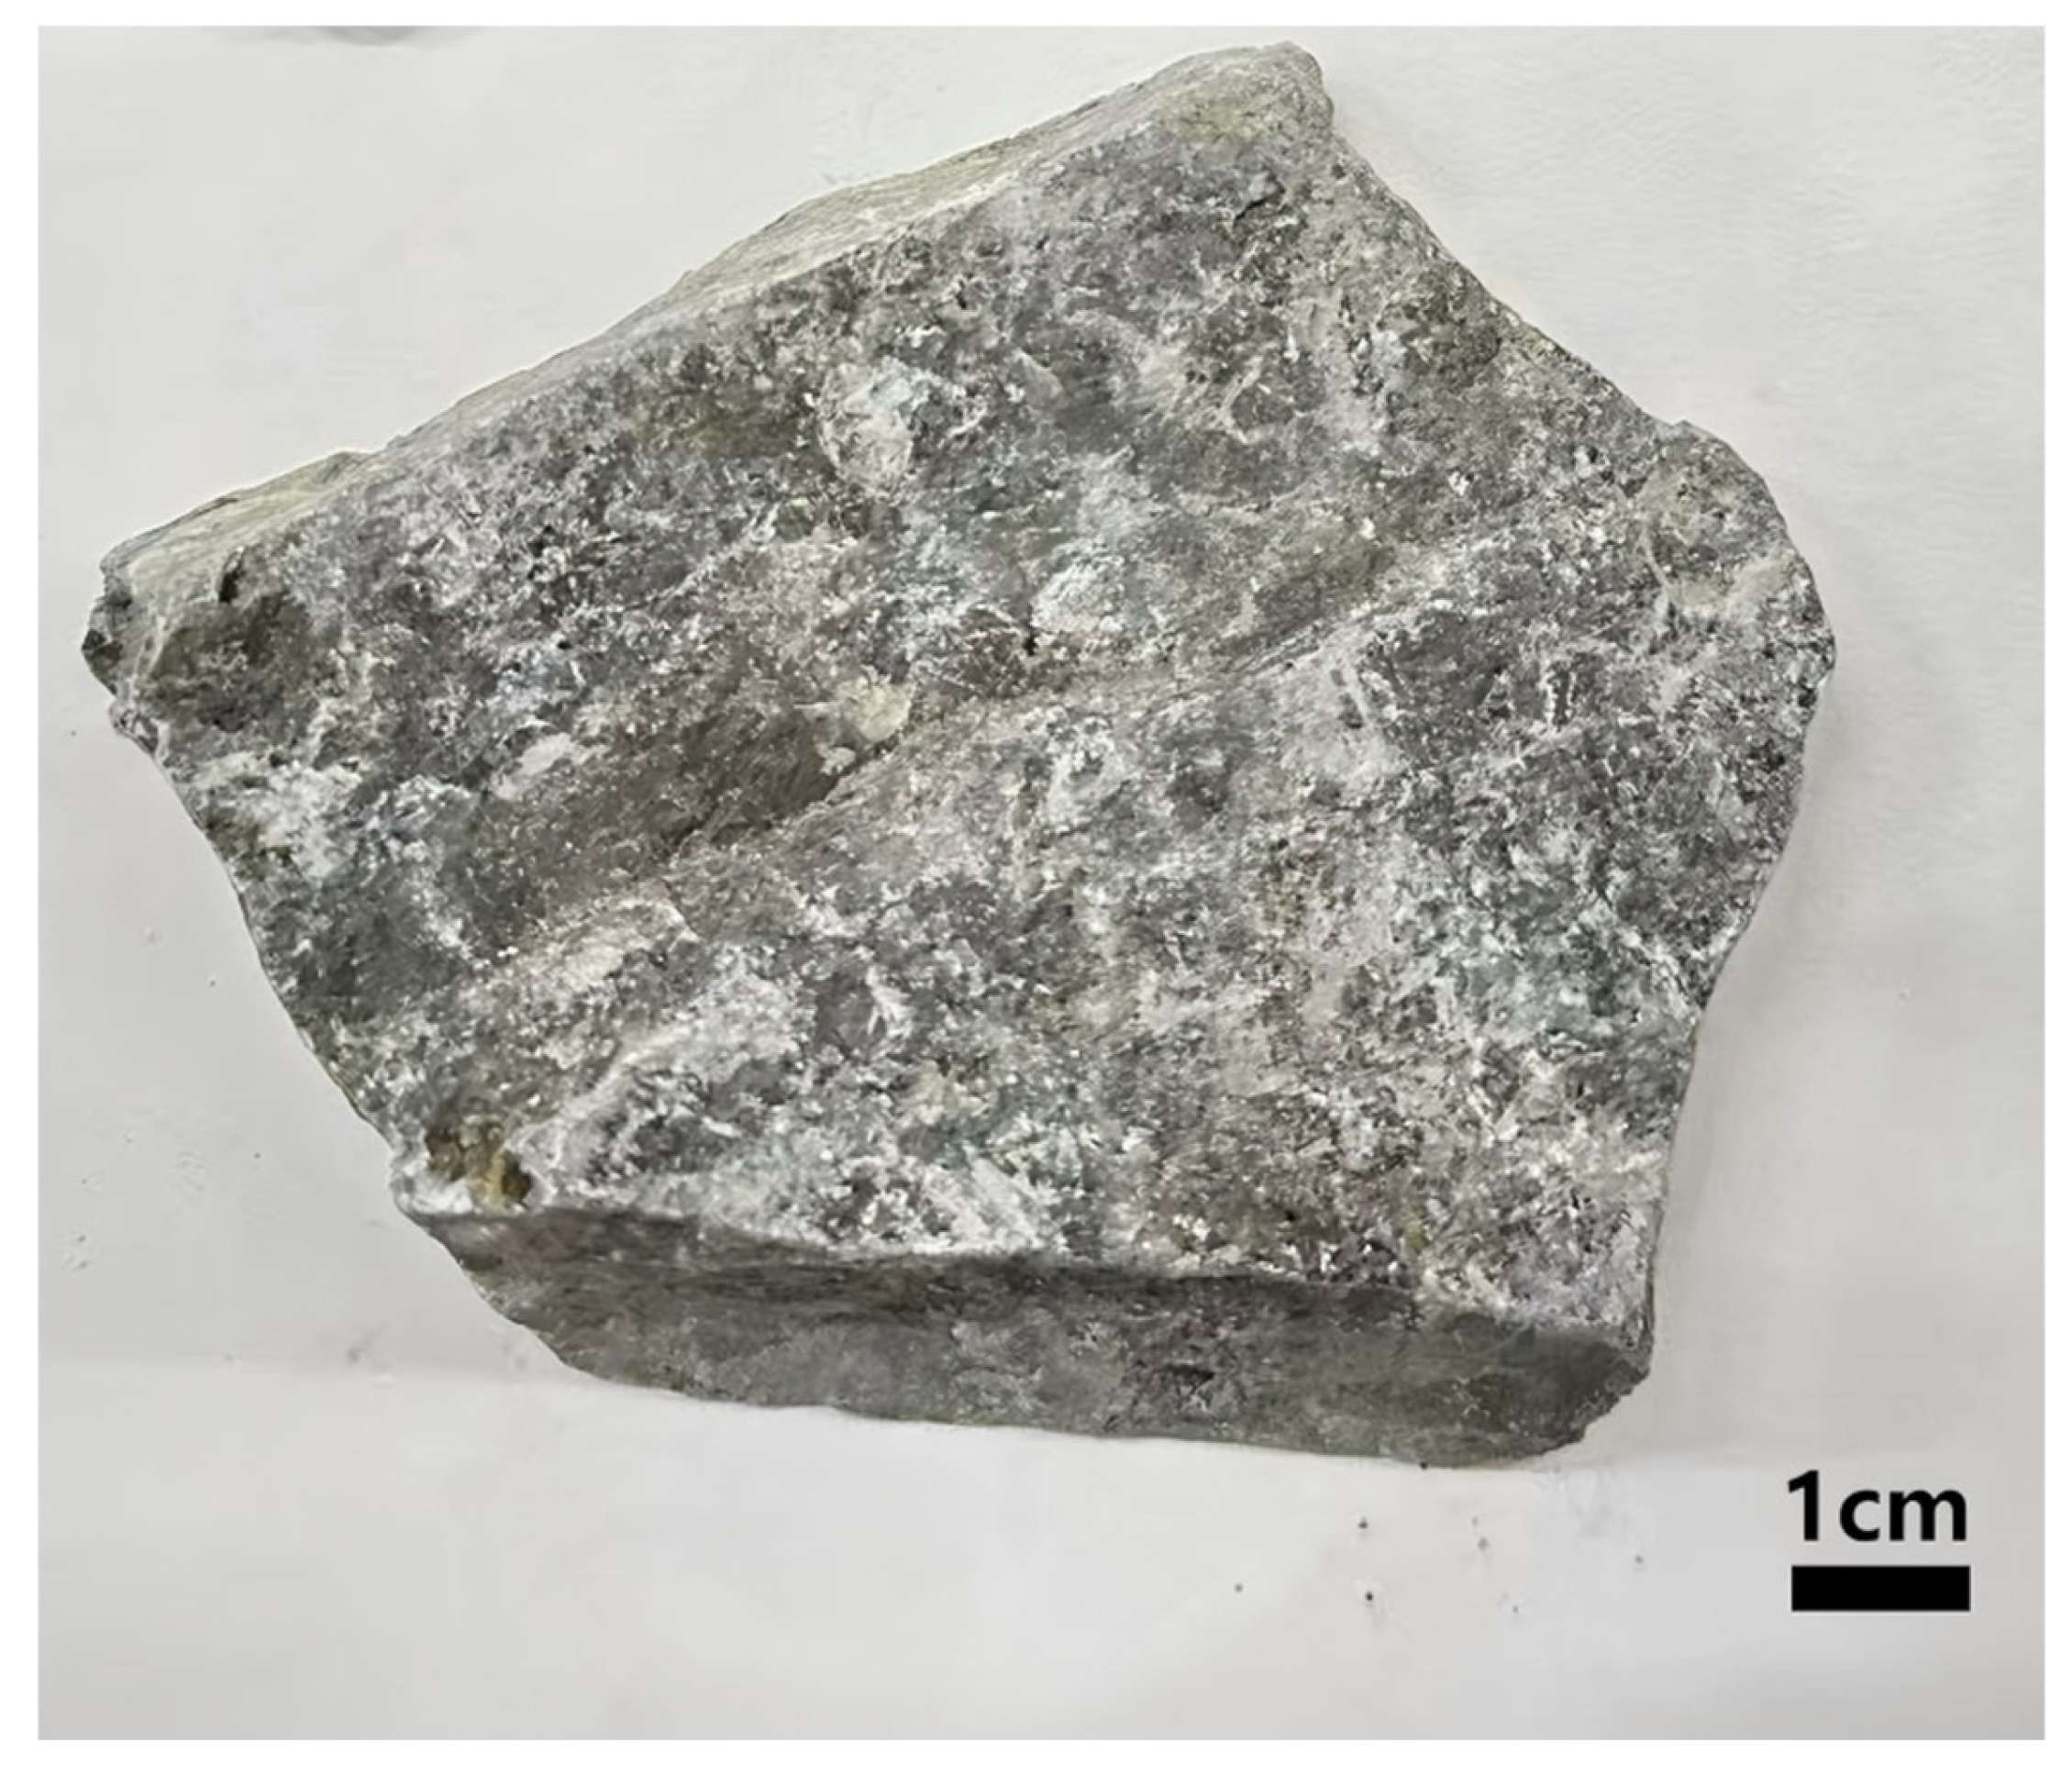
Figure 1. Photo of a typical phyllite sample.
Minerals 15 01098 g001
Figure 2. Phase composition of the raw materials. (a) P·O 42.5; (b) phyllite.
Minerals 15 01098 g002
Figure 3. Distribution relationship of some minerals in phyllite Minerals 15 01098 i001 muscovite (1%–2% Fe) Minerals 15 01098 i002 quartz Minerals 15 01098 i003 quartz (or 5%–8% Al/Fe) Minerals 15 01098 i004 chlorite Minerals 15 01098 i005 biotite Minerals 15 01098 i006 pyrite Minerals 15 01098 i007 calcite (or 1% Si/Al/Fe/Mn/Ti) Minerals 15 01098 i008 unidentified phase Minerals 15 01098 i009 mica + rutile Minerals 15 01098 i010 apatite Minerals 15 01098 i011 calcite (2%–5% Si/Al) Minerals 15 01098 i012 chalcopyrite Minerals 15 01098 i013 ferrodolomite Minerals 15 01098 i014 apatite (8%Si/2%Al) Minerals 15 01098 i015 monazite Minerals 15 01098 i016 Holes.
Minerals 15 01098 g003
Figure 4. Distribution diagram of some elements in phyllite of copper mines. (The colored scale represents the relative content of the element. From the blue on the left to the red on the right, the local corresponding element content increases from low to high).
Minerals 15 01098 g004
Figure 5. Particle size distribution of different minerals in phyllite of copper mines.
Minerals 15 01098 g005
Figure 6. Grain shape distribution of major minerals in phyllite: (a) quartz, (b) quartz (containing 5%–8% Al/Fe), (c) muscovite, (d) biotite, (e) pyrite, (f) chlorite.
Minerals 15 01098 g006
Figure 7. Manufactured sand grading curve of phyllite in copper mine.
Minerals 15 01098 g007
Figure 8. Test results of mortar bars incorporating manufactured sand produced from phyllite waste rock under the alkali-silica reaction test.
Minerals 15 01098 g008
Figure 9. 29Si NMR spectra of the mortar bars incorporating phyllite manufactured sand.
Minerals 15 01098 g009
Figure 10. XRD patterns of the mortar bars incorporating phyllite manufactured sand, before and after the 14-day alkali-silica reaction test in 1 mol/L NaOH at 80 °C.
Minerals 15 01098 g010
Figure 11. SEM and EDS sample images of the mortar bars incorporating phyllite manufactured sand after the 14-day alkali-silica reaction test in 1 mol/L NaOH at 80 °C: (a) spot1, (b) spot2, (c) spot3, (d) spot4.
Minerals 15 01098 g011aMinerals 15 01098 g011b
Table 1. Chemical composition of the raw materials (wt.%).
TypeCaOSiO2Al2O3MgOSFe2O3K2OOthers
Phyllite3.8156.7120.394.951.123.945.563.52
P·O 42.561.2919.494.163.171.222.990.786.90
Table 2. Physical and mechanical properties of phyllite waste from copper mines (parallel).
Parallel to FoliationStrength (MPa)Elasticity Modulus (GPa)Shear Modulus (GPa)Poisson Ratio
Sample183.842.9817.470.23
Sample283.521.29.060.17
Sample393.428.8212.530.15
Average86.925.0110.80.16
Standard deviation5.6315.3882.4540.042
Table 3. Physical and mechanical properties of phyllite waste from copper mines (Perpendicular).
Perpendicular to FoliationStrength (MPa)Elasticity Modulus (GPa)Shear Modulus (GPa)Poisson Ratio
Sample171.632.2813.340.21
Sample277.431.2512.60.24
Sample374.530.1111.950.26
Average74.431.2112.630.24
Standard deviation2.7510.8060.6950.042
Table 4. Density and hardness properties of different minerals, adapted from [26,27].
NumberMineralsDensity (g/cm3)Hardness (Mohs)
1Muscovite2.77–2.882.5–4.0
2Quartz2.657
3Chlorite2.6–3.32.0–3.0
4Biotite2.7–3.42.5–3.0
5Pyrite56.0–6.5
6Rutile4.236.0–6.5
7Apatite3.1–3.25
8Chalcopyrite4.3–4.43.5–4.0
9Ferrodolomite2.973.5–4.0
10Monazite4.9–5.35–5.5
11Calcite2.713
Table 5. Content indexes of manufactured sand prepared from phyllite.
ItemStandard LimitMeasured Value
Acicular and flaky particle contentClass I < 10%5.20%
MB valueClass I < 0.5
Class II < 1.0
Class III ≤ 1.4
1.30
Stone powderClass I < 5%
Class II < 10%
9.0%
Table 6. Technical indexes of physical properties of phyllite-manufactured sand.
ItemStandard LimitMeasured Value
Solidity (%)<101.3
Crushing index (%)<3025.3
Apparent density (kg/m3)>25002820
Loose packing density (kg/m3)>14001740
Porosity (%)≤4438.3
Table 7. Material indexes of manufactured sand prepared from phyllite waste rock.
ItemStandard LimitContent
Mica≤2.0%1.30%
Light substance≤1.0%/
Organic matterup to standard/
Sulfides and sulfates≤0.5%0.45%
Chloride≤0.02%0.00%
Table 8. Test results for the radioactive energy of phyllite manufactured sand.
Radioactive Energy TestValue (%)Standard Limit (%)
Internal exposure index0.15IRa ≤ 1.0
External exposure index0.47Ir ≤ 1.0
Disclaimer/Publisher’s Note: The statements, opinions and data contained in all publications are solely those of the individual author(s) and contributor(s) and not of MDPI and/or the editor(s). MDPI and/or the editor(s) disclaim responsibility for any injury to people or property resulting from any ideas, methods, instructions or products referred to in the content.