Article

Research on the Mechanical and Microstructure Characteristics of Cemented Paste Backfill in Deep In Situ Environments

1
Xinjiang Kalatongke Mining Co. Ltd., Fuyun 836107, China
2
BGRIMM Technology Group, Beijing 100160, China
3
National Center for International Research on Green Metal Mining, Beijing 100160, China
4
North China Institute of Science and Technology, Langfang 100124, China
*
Author to whom correspondence should be addressed.
These authors contributed equally to this work.
Minerals 2025, 15(10), 1087; https://doi.org/10.3390/min15101087
Submission received: 15 September 2025 / Revised: 14 October 2025 / Accepted: 17 October 2025 / Published: 18 October 2025
(This article belongs to the Special Issue Advances in Mine Backfilling Technology and Materials, 2nd Edition)

Abstract

Backfilling mining methods control the surrounding pressure and ground subsidence by backfilling goaf and managing the ground pressure, providing a safety guarantee for mining in complex environments and serving as a key means of achieving the deep mining of metal minerals. However, in the design of backfill strength, material mix ratios are determined under indoor standard constant temperature and humidity conditions, which differ significantly from the in situ curing environment. Strength measurements obtained from field samples are notably higher than those from indoor test specimens. To address this issue, this study designed a curing device simulating the in situ thermal-hydraulic multi-field environment of the mining site and tested the strength and porosity of the backfill under different curing temperatures, curing pressures, and pore water pressures. The results indicate that curing pressure and pore water pressure significantly altered the pore structure of the specimens. Specifically, when the curing pressure increased to 750 kPa, the maximum pore diameter decreased from 3110.52 nm to approximately 2055 nm, accompanied by a continuous reduction in porosity. Pore water pressure exhibited a positive linear correlation with specimen porosity, which increased continuously as the pore water pressure rose. With increasing curing temperature, the strength of the backfilled specimens first increased and then decreased, reaching a maximum at 45 °C. As the curing pressure increased, the strength of the backfilled specimens rose, but the rate of increase gradually slowed. With increasing pore water pressure, the strength of the backfilled specimens showed a gradual decreasing trend.

1. Introduction

With the rapid development of the mining industry, China’s shallow mineral resources have become depleted, and mineral resource development has entered a deep-level stage [1,2,3]. As mining depths increase, mining activities will face increasingly complex mining environments, and safety risks will continue to rise [4]. The backfilling mining method involves backfilling the goaf with backfill material to manage the ground pressure, thereby controlling the surrounding pressure and ground subsidence, providing a safe environment for mining operations. It is a mining method adapted to deep mining [5,6,7].
The tailings-cemented backfill mining method uses backfill material cemented with tailings as aggregate to support the surrounding rock and roof, enabling production activities [8,9]. During the tailings-cemented backfill mining process, it is necessary to minimize the use of cementing materials while ensuring that the strength of the backfill material meets the design requirements, thereby balancing mine safety, production, and cost control [10]. The strength of cemented backfill is determined not only by the backfill mix ratio, but also by the curing environment [11,12]. The challenges of “three highs and one disturbance” in deep mining mean that cemented backfill is subject to the combined effects of temperature fields, seepage fields, stress fields, and other fields in the in situ environment [13]. However, the laboratory curing environment cannot simulate the in situ environment of the mine, resulting in significant differences between the two [14]. The differences between the two curing environments result in significant variations in mechanical properties between laboratory-cured backfill specimens and in situ backfill specimens under the same mix ratio [15]. Selecting mine backfill mix ratios based on indoor standard curing test results ignores the impact of curing environment differences on backfill strength, leading to an inability to obtain suitable backfill mix ratio schemes for mines, which is detrimental to the balance between mine production safety and cost.
However, existing studies on the in situ strength of tailings-cemented backfill primarily rely on laboratory standard backfill curing tests, focusing mainly on factors inherent to the backfill itself such as the materials used in the backfill slurry, sand-to-cement ratio, slurry concentration, and additives and their impact on the strength of cemented backfill [6]. There is limited research on the mechanisms by which environmental factors, such as curing pressure, curing temperature, and pore water pressure, influence the development of strength in tailings-cemented backfill. Current research primarily focuses on the effects of single- or dual-factor coupling on the strength of tailings-cemented backfill, and existing studies are predominantly qualitative analyses and descriptions, lacking research on the mechanical properties of tailings-cemented backfill under multi-factor coupling conditions [16,17]. For example, Aldhafeeri [18] investigated the effect of temperature on the mechanical properties of the backfill material, finding that increasing temperature accelerates the hydration reaction rate during the cementation process of the backfill slurry, thereby influencing the microstructure of the backfill material. Fahey [19] and Ghirian [15,20] conducted pressure-curing tests on the backfill material, respectively. The results indicated that the influence of pressure on the mechanical properties of the backfill material is primarily concentrated during the initial curing stage, and the impact of pressure on the strength of the backfill material decreases as the curing age increases. Additionally, existing backfill-curing devices are predominantly pressure-curing devices, and studies on the effect of temperature on backfill strength are generally conducted using constant-temperature curing chambers [21,22]. Test results from backfill specimens prepared using existing backfill-curing devices or standard laboratory backfill-curing molds cannot accurately reflect the in situ strength of tailings-cemented backfill.
Based on this, this study designed a curing device that simulates the in situ thermal-hydraulic multi-field environment of a mining site. Using this device, the strength development process of tailings-cemented backfill under different curing environments was monitored, and uniaxial compressive strength tests were conducted. The study analyzed the development patterns of the strength and microstructural characteristics of tailings-cemented backfill under thermal-hydraulic multi-field coupled environments.

2. Materials and Method

2.1. Materials

2.1.1. Tailings

The tailings used in this study originated from the Karatongke copper-nickel mine. Among them, the tailings were taken from the bottom of a deep cone thickener, dried at a high temperature (105 ± 3 °C), and their specific gravity was measured to be 2.919 by the hydrometer method. A total of approximately 3 g of samples was collected from the dry tailings by using the multi-point sampling method. The particle size distribution data of the tailings, measured using an LMS-30 laser particle size analyzer (Seishin Enterprise Co., Ltd., Tokyo, Japan), is shown in Figure 1. The results show that the characteristic particle sizes d10, d30, and d60 were 2.653 μm, 11.679 μm, and 50.432 μm, respectively. The calculated unevenness coefficient Cu was 19.00 and the curvature coefficient Cc was 1.02, indicating that the particle size distribution of the entire tailings in the Karatongke copper-nickel mine is wide, meeting the conditions of Cu > 3 and Cc = 1–3, suggesting that the gradation of the tailings is good and continuous. The chemical composition of the tailings measured by the XRF analyzer of model EDX8000 (Shimadzu Corporation, Kyoto, Japan) is shown in Table 1. It can be seen that the main chemical composition of the tailings was SiO, and the elements S and P, which affect the strength development, were less in content.

2.1.2. Binder and Water

Ordinary Portland cement (P.O 32.5) was selected as the cementitious material for this experiment. Additionally, local tap water was used during the sample preparation. In addition, local tap water was used to prepare the samples.

2.2. Design of In Situ Environmental Simulation Maintenance Device

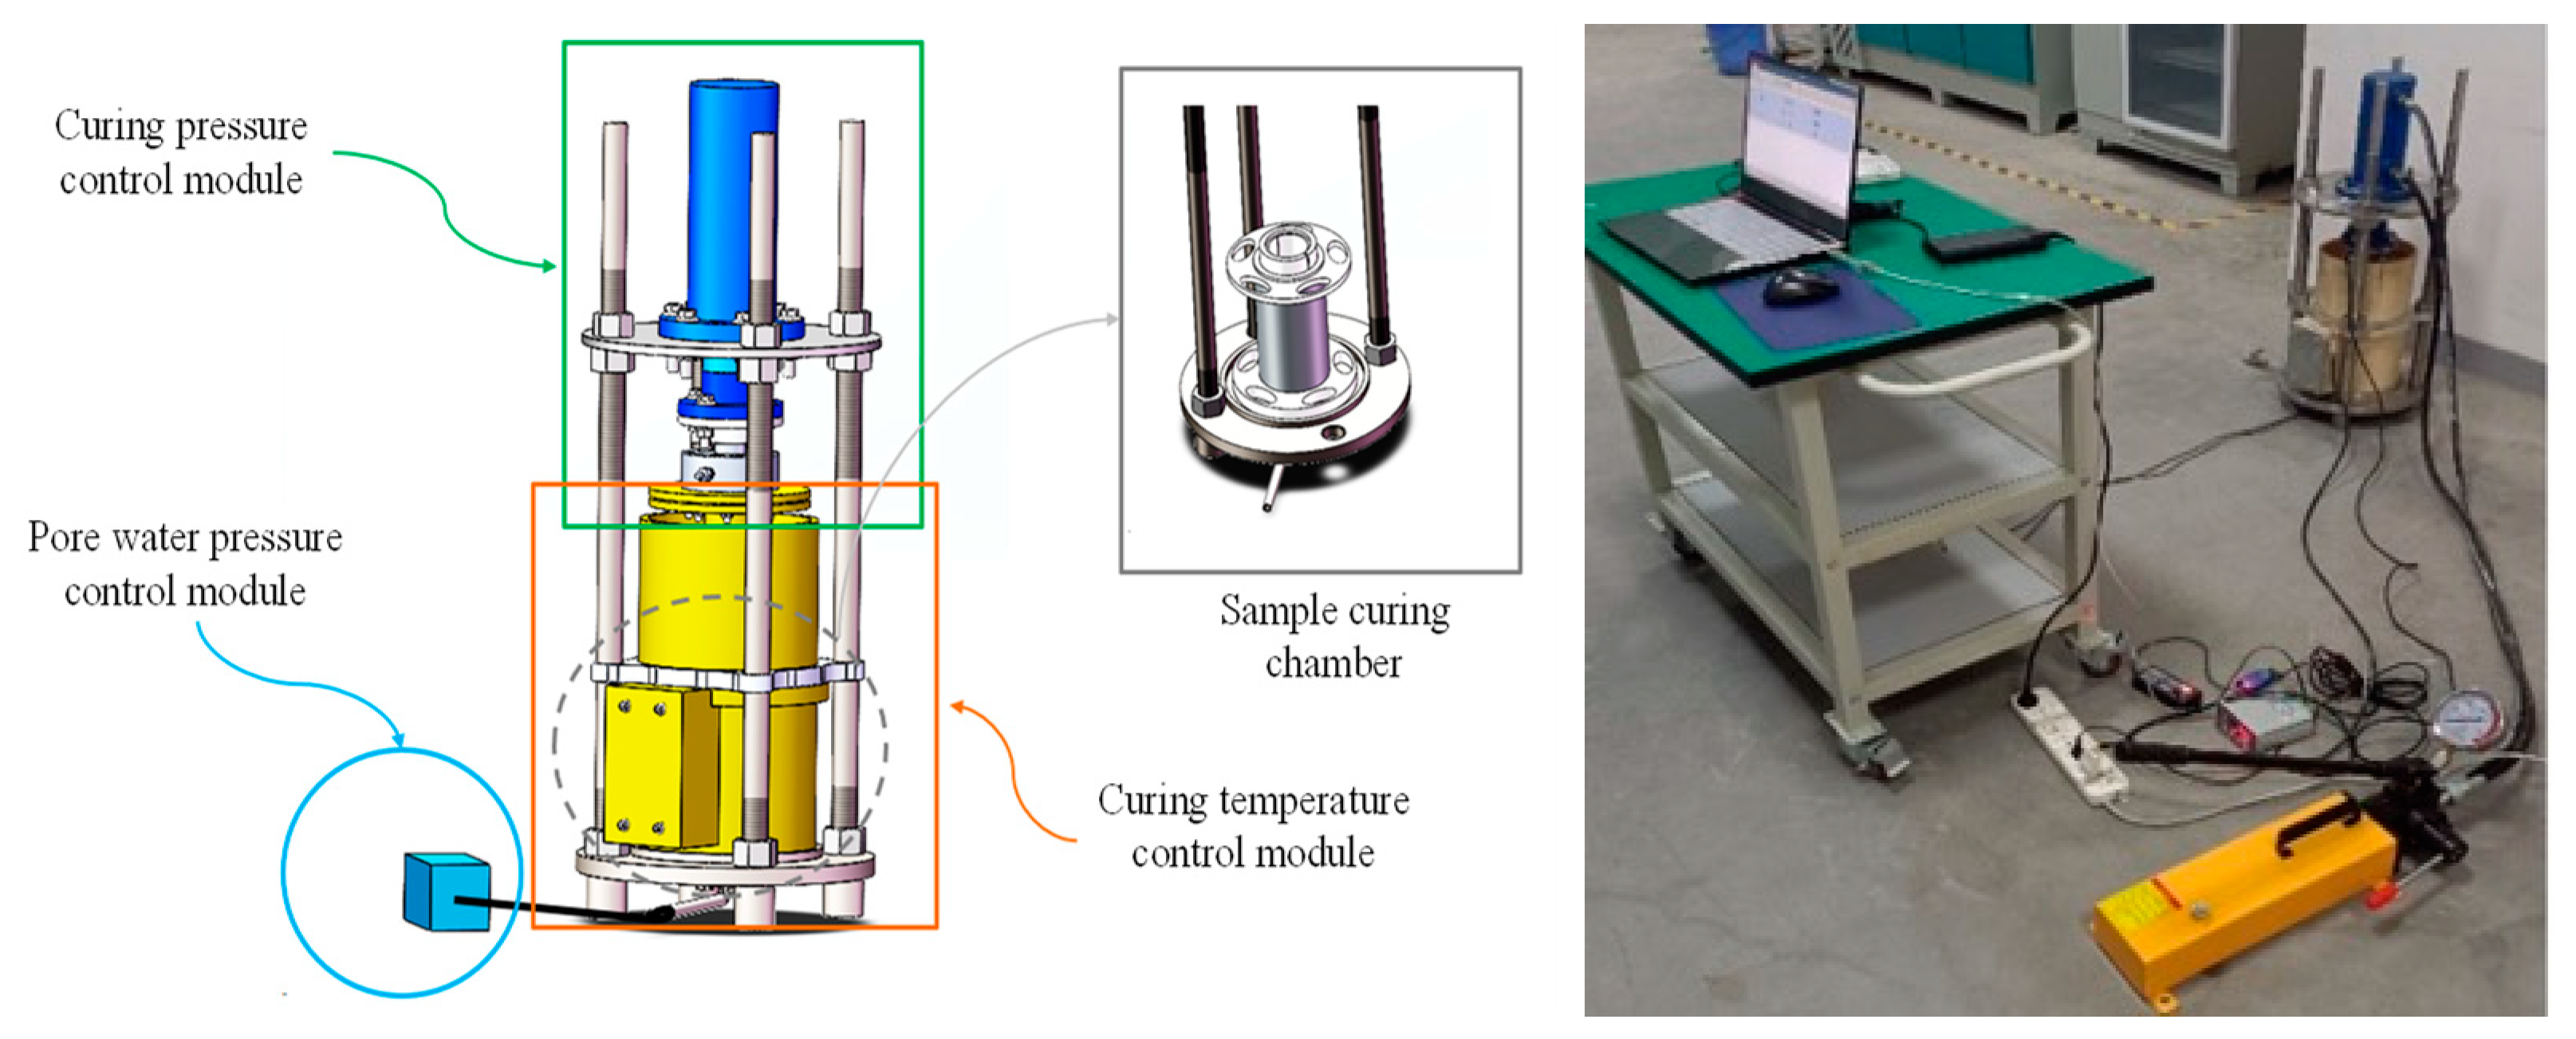
Based on the typical thermowater-mechanical-chemical multi-field environment of the deep stope, an in situ environmental curing device for the backfill body was developed, as shown in Figure 2. This test device includes a stability control module, an external stress control module, a pore water pressure control module, and a temperature control module. By adjusting the parameters of each module, the actual conditions of the in situ backfill stope can be simulated. Furthermore, a cemented backfill body that is twin to the in situ conditions of the deep stope was prepared and cured. Further physical and mechanical property tests of the corresponding backfill slurry or backfill body were carried out to grasp the in situ strength characteristics of the actual stope backfill body. This device can adjust the pressure, drainage conditions, and ambient temperature as needed to simulate the in situ environment of the stope. Based on the pressure, drainage conditions, and temperature of the actual backfill environment in the mine, after preparing the in situ environmental backfill body specimens of the stope, the mechanical properties of the backfill specimens after curing can be tested to verify whether the backfill body meets the mining strength and relevant process requirements to determine the proportion and control parameters of the backfill materials in the goaf of the stope.

2.3. Sample Preparation

The backfill samples consisted of tailings, cement, and water. Using a φ75* 150 mm mold based on the curing chamber dimensions, samples were prepared with a cement-to-tailings mass ratio of 1:3 and a concentration of 69%. The variation in pore water pressure within the backfill body in the actual stope was attributed to factors such as the self-weight of the slurry, evaporation of internal water under high-temperature conditions, and underground seepage. However, due to the small size of the twin specimens, the change in pore water pressure during the test was not significant. Therefore, additional pore water pressure needs to be applied to carry out the test. In the in situ backfill body monitoring conducted by Matthew Helinski [8], the maximum pore water pressure of the in situ backfill body was measured to be 100 kPa. Therefore, including a pore water pressure of 0, a total of four pore water pressure parameters were designed. If the maximum value is 100 kPa, the difference between each parameter is approximately 30 kPa. In the exploration test, it was found that this difference had an insufficient influence on the strength of the cemented backfill body. Therefore, to ensure the test effect and increase the gap between the test parameters, the maximum pore water pressure was set at 150 kPa. Four pore water pressures were applied in the experiment, namely 0 kPa, 50 kPa, 100 kPa, and 150 kPa, in sequence. Among them, the influence of a pore water pressure of 100 kPa on the mechanical properties of the tailings-cemented backfill was mainly studied. Please refer to Table 2 for details.

2.4. Testing Procedures

2.4.1. UCS Tests

Unconfined compressive strength (UCS) is an important index for evaluating backfill quality. In this study, the failure load of the backfill sample was tested using the WEW-600D (Shidai Xinke Testing Instrument Co., Ltd., Jinan, China) screen display tester. The normal load of the tester was 100 kN, and the accuracy was ±1%. The UCS of the backfill sample was calculated according to Equation (1), where fm,cu is the compressive strength of mortar specimen, the calculated value is accurate to 0.1 MPa, Nu is the specimen breaking load, and A is the specimen bearing area.
f m , c u = N u A
The arithmetic mean of the three specimens was taken as the UCS value of the group of specimens. However, the difference between the test results of the three samples should not exceed 15%. Otherwise, the test results will be invalid.

2.4.2. Mercury Intrusion Porosimetry (MIP)

The mercury compression method, also known as the mercury porosity method, measures the pore volume and pore size of the sample by pressing mercury into the sample to occupy the pores of the sample. The mercury intrusion method is suitable for measuring pores with diameters ranging from 3 nm to 800 μm. It is fast, convenient, and highly accurate. By using the mercury intrusion method for measurement, the pore size, pore volume, and pore size distribution characteristics of the tailings-cemented backfill body specimens can be obtained. The experiment adopted the AutoPore IV 9510 automatic mercury porosimeter (Micromeritics Instrument Corporation, Norcross, GA, USA) to test the porosity of the samples. The pressure variation of the equipment was 0 to 413 MPa, and the testing range of the pore size was over 3 nm.

3. MIP Test Results and Analysis

3.1. Effect of Curing Temperature on Pore Structure

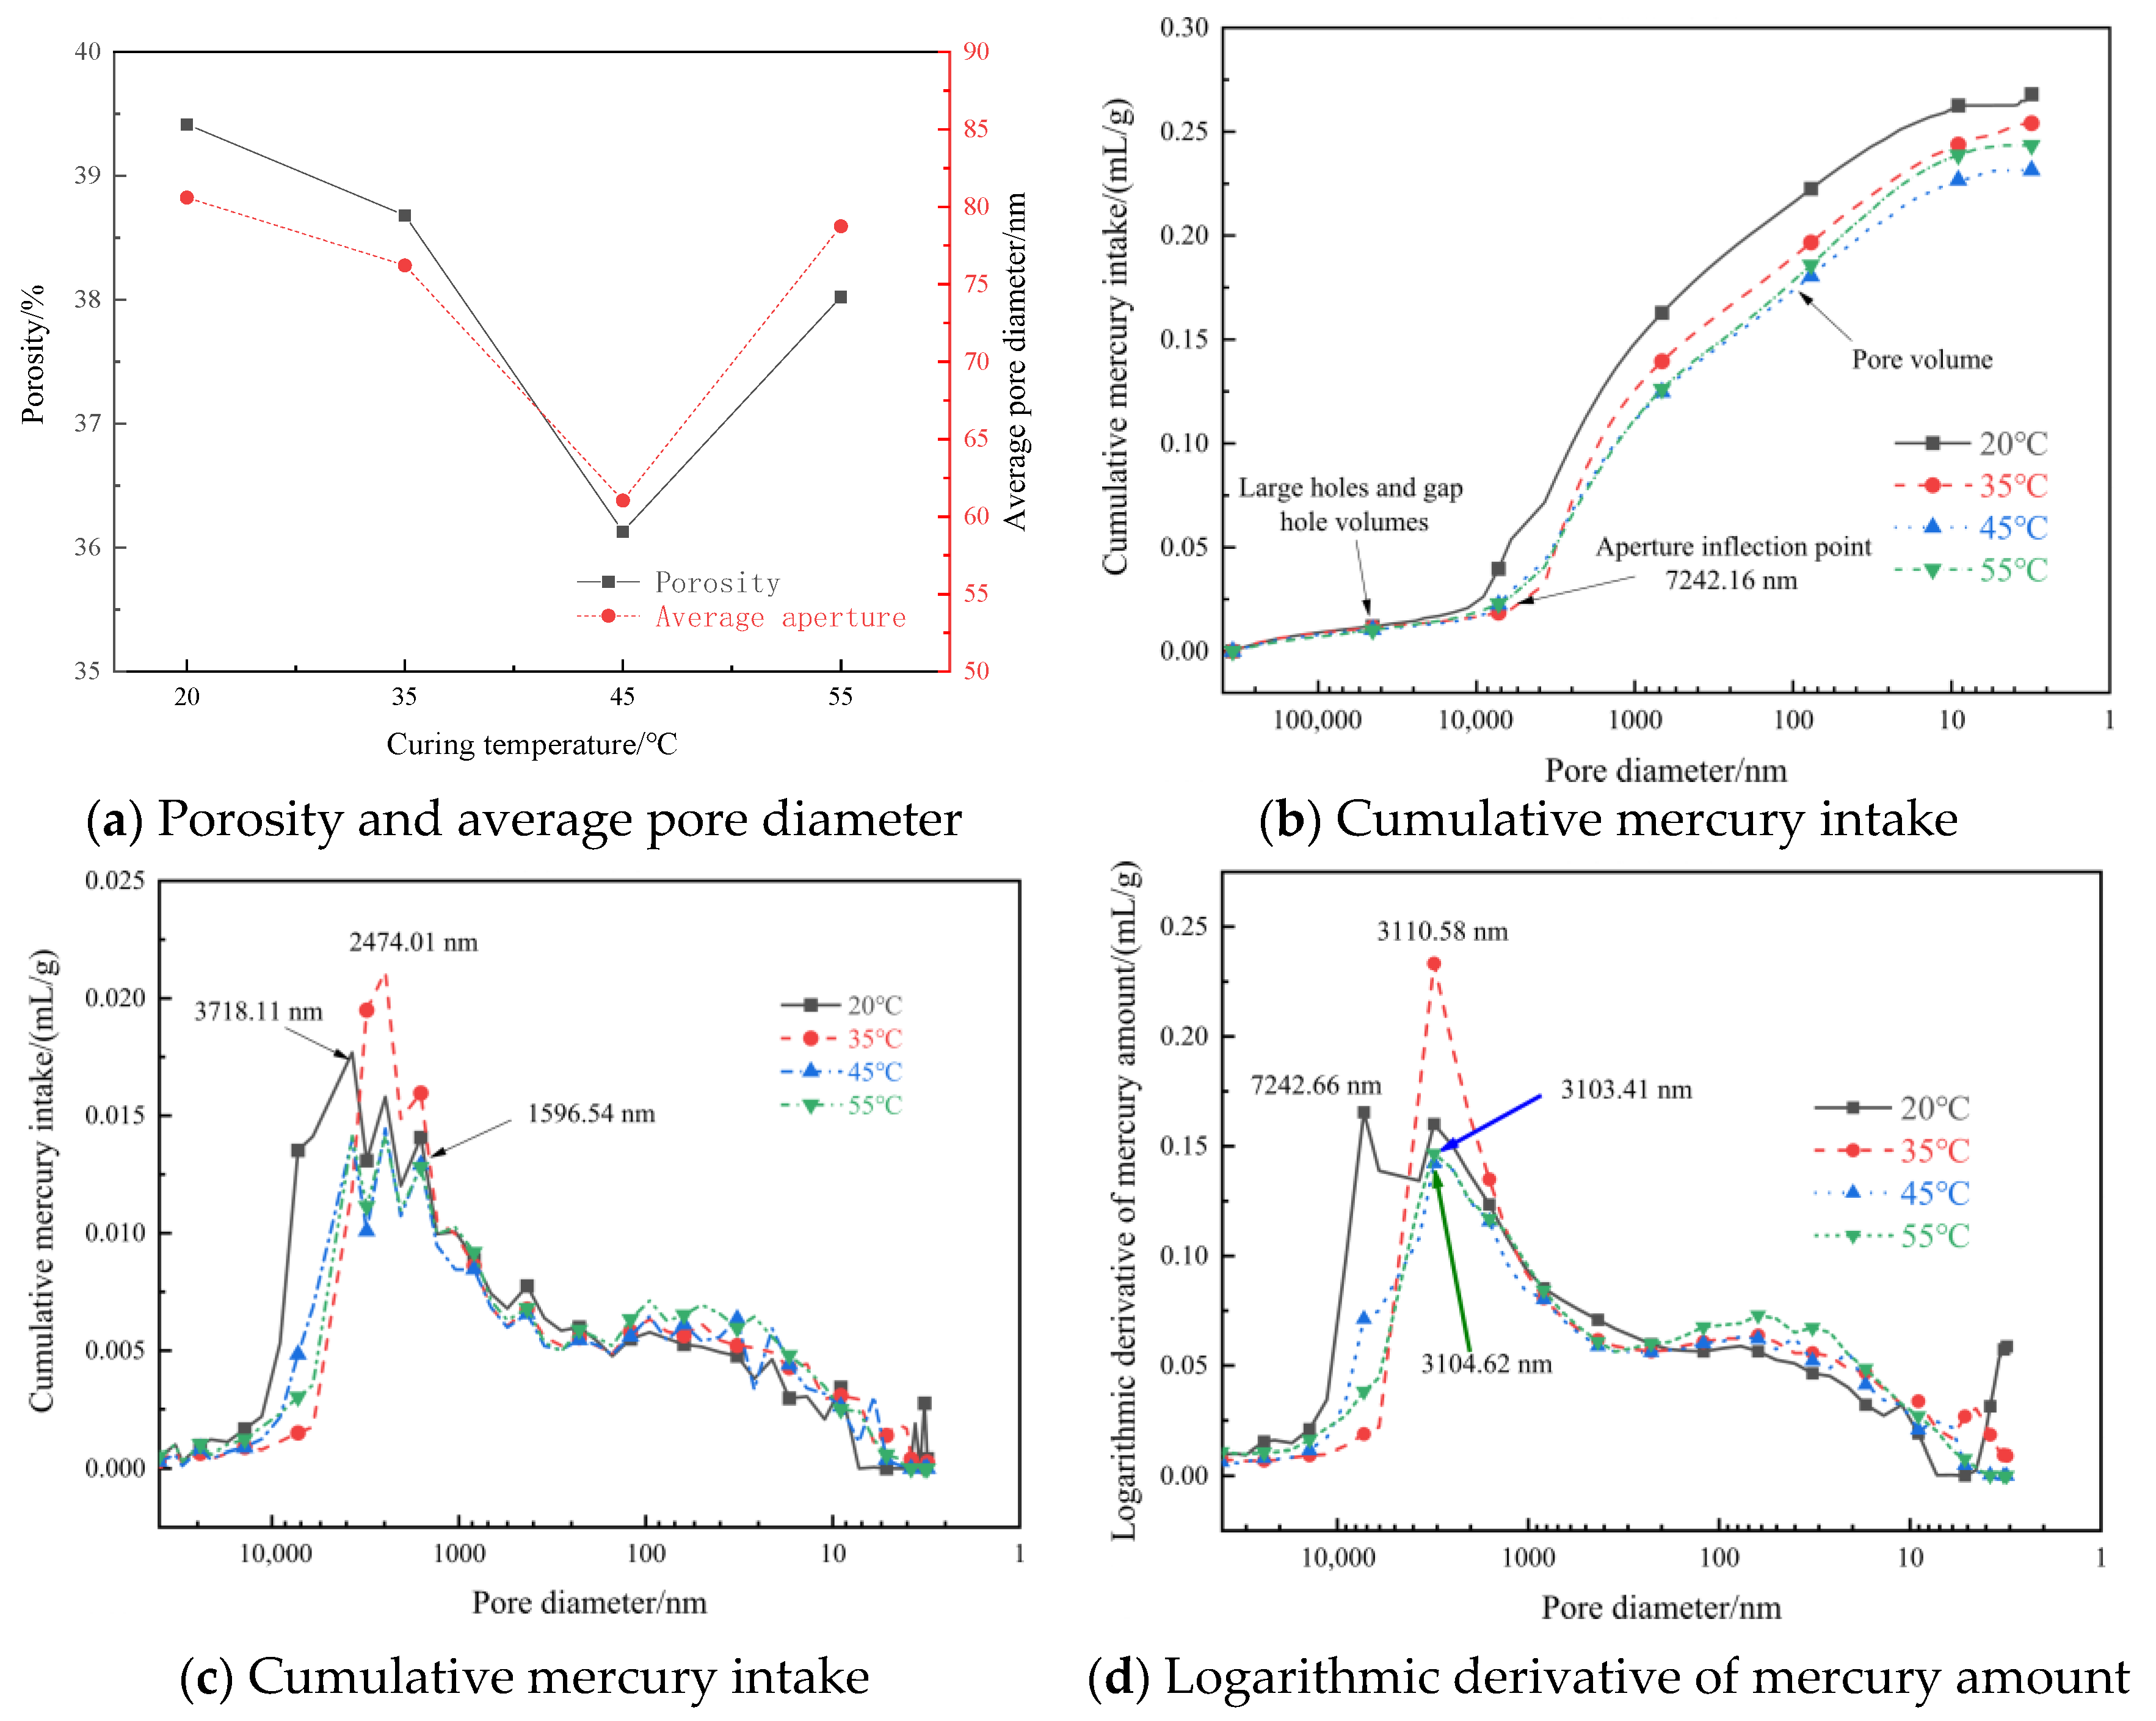
According to Figure 3a, it was observed that as the curing temperature increased, the porosity of the specimen initially decreased and then increased. When the curing temperature was 45 °C, the porosity of the specimen was the lowest, indicating that at this curing temperature, the hydration reaction inside the specimen is complete, and a large amount of hydration reaction products fills the gaps between particles, such as tailings, thereby reducing the porosity of the filled specimen [23]. In contrast, when the curing temperature was 55 °C, the thermal expansion effect caused the internal pores of the backfill specimen to expand, increasing the specimen’s porosity.
The average pore diameter of the specimens followed the same trend as the porosity. As the porosity of the specimens increased, the corresponding average pore diameter within the specimens also increased. The average pore diameter of the specimens was calculated using Equation (2).
D = 4 V S × 10 3
where D represents the average aperture of the specimen, with the unit being nm; V represents the total amount of mercury pressed into the specimen, with the unit of mL/g; S represents the total hole area of the specimen, with the unit of m2/g.
In the mercury intrusion test, as the pressure gradually increases, the cumulative mercury intrusion volume rises continuously: large pores and gap pores inside the specimen are filled with mercury first, followed by small pores. Eventually, when all intrudable pores are filled, the increase in cumulative mercury intrusion volume diminishes until it stops. As shown in Figure 3b, the pore size inflection point of the specimens under different curing temperatures was consistently 7242.16 nm, indicating that the internal pore size of all specimens was distributed within the range of 0–7200 nm. In the latter half of the curve, the cumulative mercury intrusion volume was the highest for specimens cured at 20 °C, followed by those at 35 °C, and the lowest for those at 45 °C and 55 °C. When the pore size was less than 100 nm, the cumulative mercury intrusion volume of specimens cured at 45 °C became smaller than that at 55 °C. This reveals that specimens cured at 20 °C and 35 °C had more pores across all pore size ranges than those at 45 °C and 55 °C; specimens cured at 55 °C and 45 °C had nearly the same number of pores in the 100–7200 nm range, with the only difference being that specimens cured at 55 °C had more pores smaller than 100 nm.
The plot of incremental mercury intrusion vs. pore size reflects the specimen’s pore size distribution. As shown in Figure 3c, pores sized 1600–3720 nm accounted for the highest proportion across all specimens: those cured at 35 °C had a significantly higher proportion of such pores than the others, followed by 20 °C, while the 45 °C and 55 °C specimens showed nearly the same proportion in this range. The peak of the logarithmic differential mercury intrusion vs. pore size curve indicates the specimen’s most abundant pore size. As in Figure 3d, the 20 °C specimens had the most pores around 7240 nm, while the 35 °C, 45 °C, and 55 °C specimens had nearly identical maximum abundant pore sizes (around 3100 nm). In summary, the specimen’s overall porosity first decreased then increased with rising curing temperature. Curing temperature significantly affects the internal pores by regulating the backfill slurry’s hydration degree, which in turn alters the pore structure and ultimately impacts the mechanical properties of tailings-cemented backfill.

3.2. Effect of Curing Pressure on Pore Structure

Under the action of curing pressure, the internal pores of the backfill specimen will be compacted, as shown in Figure 4a. With the increase in curing pressure, the internal porosity of the specimen continuously decreased. When the curing pressure was 250 kPa, the pressure was relatively low, and a large number of pores inside the specimen were compressed but not compacted. Therefore, compared with the specimens that were not pressure-cured, although the porosity of the specimens with a curing pressure of 250 kPa decreased less, the average pore diameter decreased significantly.
As shown in Figure 4b, during pressure curing, the curve of cumulative mercury intake varying with pore size showed a significant difference in the latter half of the pore size inflection point at different curing pressures. The greater the curing pressure, the smaller the cumulative mercury intake corresponding to the same pore size. This indicates that the curing pressure had an impact on the pores of all diameters of the specimens. In contrast, raising the curing temperature from 45 °C to 55 °C mainly affected the tiny pores with a diameter of less than 100 nm.
Figure 4c indicates that in the unpressure-cured specimens, the proportion of pores with diameters ranging from 21,320 nm to 40,266 nm was the largest, while in the pressure-cured specimens, the proportion of pores with diameters ranging from 11,330 nm to 21,320 nm was the largest. The internal pore diameter of the specimens without pressure curing was significantly larger than that of the specimens under pressure curing, while the difference in pore size distribution among the specimens under pressure curing was not obvious.
The maximum allowable pore size of the specimen without pressure curing was 3110.52 nm, while that of the specimen with a curing pressure of 250 kPa was 2473.51 nm. There was a significant difference in the maximum allowable pore size between the two specimens. In contrast, the maximum pore size of the specimen with a curing pressure of 500 kPa was 2054.14 nm, and that of the specimen with a curing pressure of 750 kPa was 2056.12 nm. The two are basically the same. This indicates that when the curing pressure is relatively small, increasing the curing pressure has a significant impact on the maximum diameter of the specimen. When the curing pressure is relatively large, further increasing the curing pressure has almost no effect on the maximum diameter of the specimen.
In conclusion, increasing the curing pressure will compact the backfill body specimens, thereby reducing the internal porosity and voids of the specimens, which can greatly improve the mechanical properties of the tailings-cemented backfill body specimens. Meanwhile, the curing pressure will reduce the number of pores of all diameters inside the specimen, change the pore size distribution inside the specimen, and cause the pore size with the largest proportion to decrease. Furthermore, within a certain range, by increasing the curing pressure, the maximum pore size of the specimen can be significantly reduced.

3.3. Effect of Pore Water Pressure on Pore Structure

Applying pore water pressure to the cemented-backfill body first reduces the slurry concentration of the cemented-backfill body, inhibiting the hydration reaction. Second, it increases the pore diameter of the existing pores inside the backfill body or generates new pores, thereby damaging the strength of the cemented backfill body. As shown in Figure 5a, there was a positive linear correlation between the pore water pressure and the porosity of the specimen. With the increase in pore water pressure, the porosity of the corresponding specimen also increased. It should be noted that when the pore water pressure increased from 0 kPa to 50 kPa, the increase in the average pore diameter of the corresponding specimen was greater than that when the pore water pressure increased from 50 kPa to 150 kPa. Therefore, when the average pore diameter of the specimen is expanded to a certain value, the influence of pore water pressure on the average pore diameter will decrease.
As shown in Figure 5b, the inflection point of the specimen pore diameter was the same under different pore water pressures, which was 3122 nm. After the pore size inflection point, the cumulative mercury intake under the same pore size was directly proportional to the pore water pressure. The greater the pore water pressure, the greater the cumulative mercury intake, and this trend existed for all pore sizes during the mercury pressure intake stage in the pore capacity. This indicates that under the action of pore water pressure, all pore diameters of the specimen had been increased. Furthermore, when the pore water pressure was 0 kPa, the cumulative mercury intake increase curve of the specimens was basically a straight line. In contrast, the cumulative mercury intake increase curves of the three groups of specimens with pore water pressure were arc-shaped. This indicates that the pore water pressure had a relatively obvious influence on the number of pores with diameters ranging from 10 nm to 1000 nm.
The internal pore size distribution of the specimens under different pore water pressures was analyzed. As shown in Figure 5c, the pore size with the highest internal pore proportion of the specimens under different pore water pressures increased with the increase in pore water pressure. When the pore water pressure was 150 kPa, the maximum specific pore size of the specimen was 3123 nm. The maximum specific pore size of the specimens with a pore water pressure of 100 kPa and 50 kPa was 2472 nm. However, the proportion of the maximum pore size of the specimens with a pore water pressure of 100 kPa was higher than that of the specimens with a pore water pressure of 50 kPa. When the pore water pressure was 0 kPa, the maximum specific pore size was 1596 nm, and the proportion of the maximum specific pore size was significantly smaller than that of the other three groups of specimens. In addition, for specimens with a pore water pressure of 0, the pore distribution was not concentrated, and three relatively high segments of pore size distribution appeared at apertures of 1000 nm–1500 nm, 30–100 nm, and below 10 nm. This indicates that under the action of pore water pressure, a large number of tiny pores with a diameter of less than 100 nm inside the specimen expand, and the pore diameter becomes larger. As a result, compared with the specimen without pore water pressure, the proportion of tiny pores inside the specimen is reduced.
It can be seen from Figure 5d that the maximum pore size of the specimens increased with the increase in pore water pressure. Among them, the maximum pore size of the specimens with curing pressures of 100 kPa and 150 kPa was 3120 nm. The maximum pore size of the specimen with a pore water pressure of 50 kPa was 2470 nm, while that of the specimen without pore water pressure was 2050 nm. There as a significant difference between them.
Based on the above analysis, it can be concluded that the porosity of the specimen is directly proportional to the pore water pressure it experiences during curing. The greater the pore water pressure, the greater the porosity of the specimen. Pore water pressure expands the original tiny pores of the specimen, alters the pore size distribution of the specimen, reduces the proportion of tiny pores in the specimen, and increases the proportion of large pores.

4. Strength Test Results and Analysis

4.1. Effect of Curing Temperature on Strength

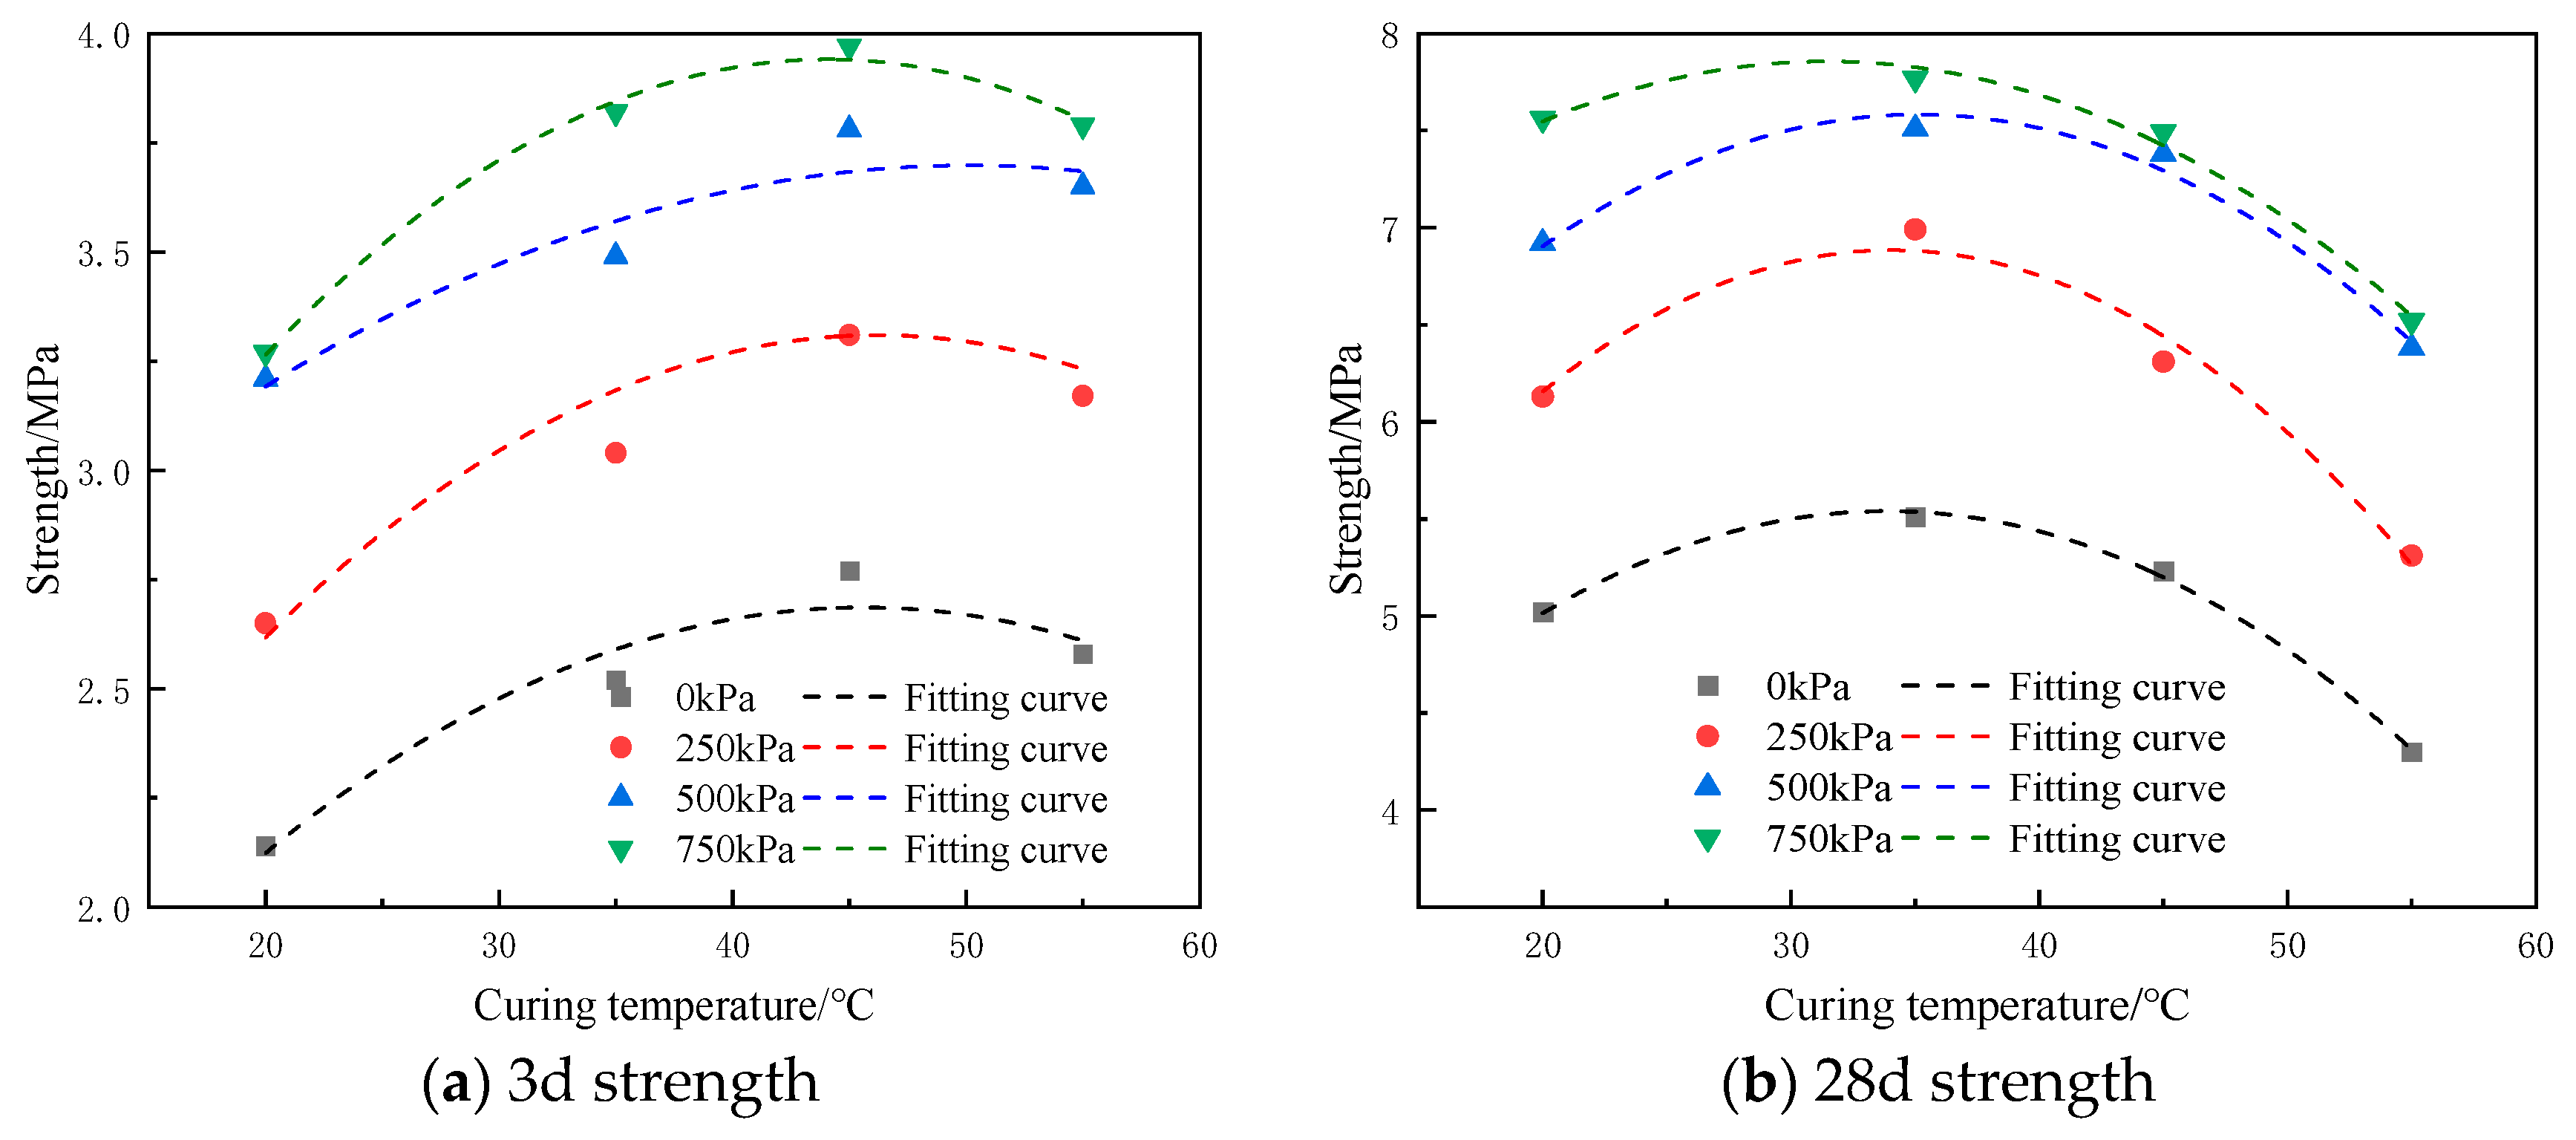
Figure 6 shows the variation in the uniaxial compressive strength of tailings-cemented backfill specimens with different curing pressures at curing ages of 3 d and 28 d as a function of curing temperature. Under the same curing pressure and without the application of pore water pressure, the uniaxial compressive strength of specimens in each curing pressure group showed a trend of first increasing and then decreasing with increasing curing temperature, which was similar to Chen’s results [23,24].
The aforementioned patterns were clearly evident under different curing pressures, indicating that the logic underlying the effect of curing temperature on long-term strength is universally applicable. From a mechanistic perspective, within the appropriate curing temperature range, cement hydration continues to progress, with hydration products continuously backfill and bonding to reinforce the internal structure of the specimen, thereby promoting strength development [25]. However, at excessively high temperatures, the thermal environment disrupts the stable formation of hydration products, promoting the initiation and expansion of microcracks, weakening structural integrity, and leading to a decline in strength [26]. A secondary fitting was performed on the relationship between curing temperature and the long-term strength of the specimens, with the fitting results shown in Figure 6 and Table 3. It can be observed that although the temperatures corresponding to the strength peaks of different curing pressure groups varied, they all followed a trend of first increasing and then decreasing, highlighting the complexity and regularity of the influence of curing temperature on the long-term strength of tailings-cementation backfill. This provides a reference basis for the scientific selection of temperature parameters in the strength regulation of long-term mine backfill under multiple pressure conditions, and also indicates the continuity of the temperature–strength interaction mechanism under long-term strength conditions.

4.2. Effect of Curing Pressure on Strength

When tailings-cemented filling slurry is cemented in the in situ environment of the mine, it will be subjected to the pressure from the overburden rock layer and the gravity of the filling body itself, thereby affecting the strength of the filling body. Moreover, this influence primarily occurs during the early stage and decreases with increasing curing age. Generally speaking, the pressure effect will cause the strength of the tailings-cemented filling body sample with the same proportion to be significantly higher than that of the laboratory standard-curing sample [27].
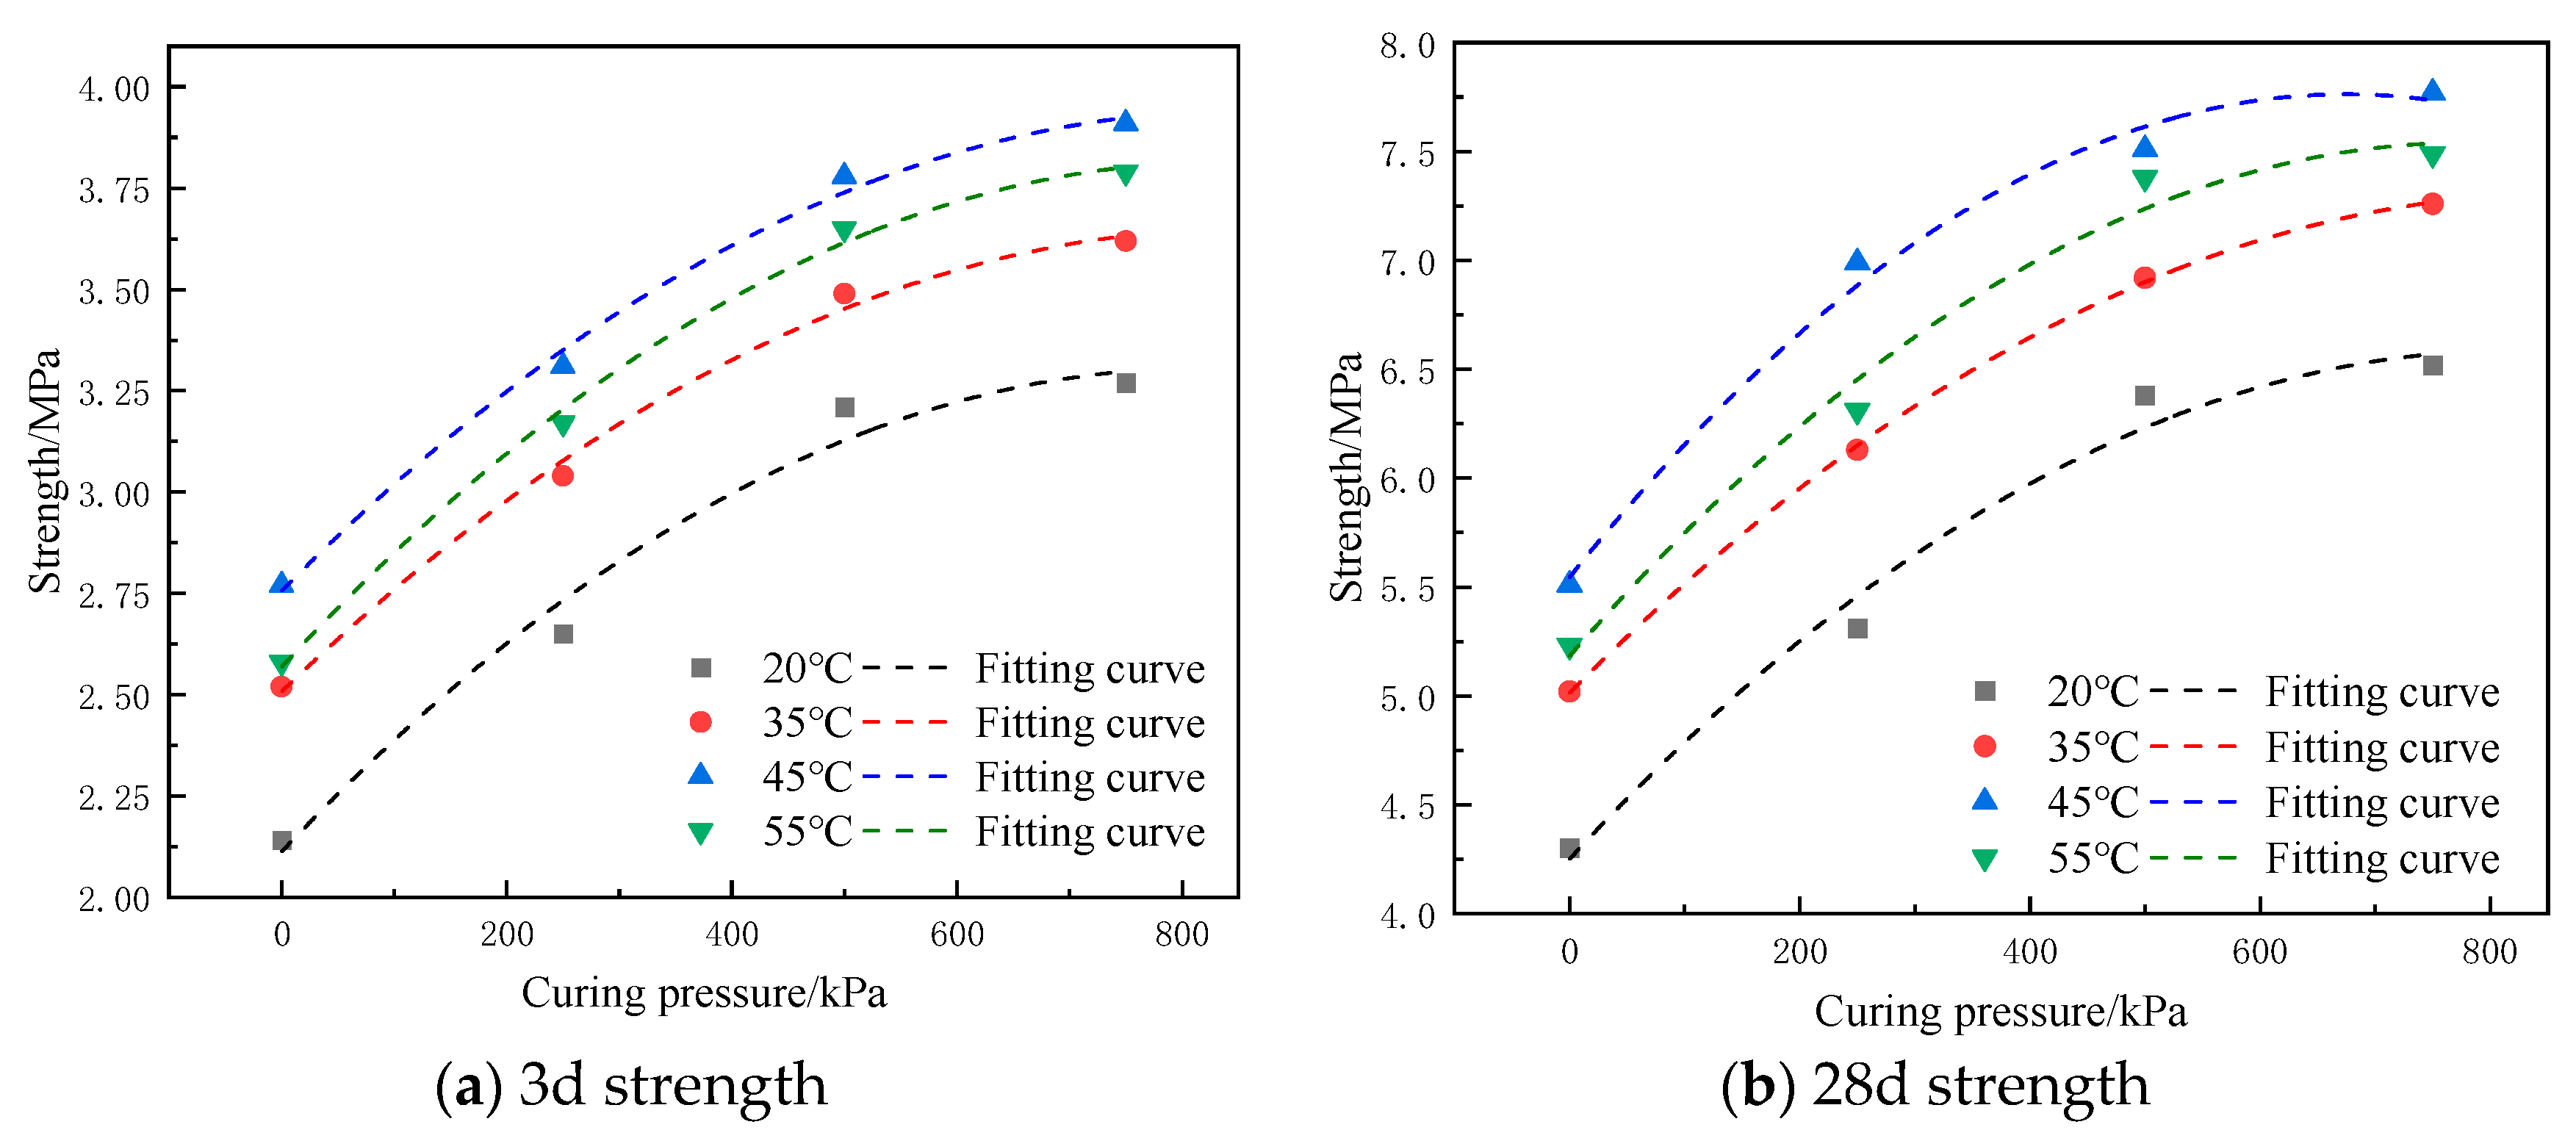
As shown in Figure 7a, the uniaxial compressive strength of the tailings-cemented backfill increased with increasing curing pressure. However, when the early uniaxial compressive strength of the specimen reached approximately 2.5 MPa, further increases in curing pressure had a limited effect on improving the specimen’s uniaxial compressive strength. As the curing pressure increased, the proportion of each pore size within the backfill material decreased, resulting in a reduction in overall porosity. However, the pore size distribution of specimens cured at 500 kPa and 750 kPa was essentially the same. Furthermore, the most common pore size of specimens cured at 500 kPa and 750 kPa was nearly identical, both around 2055 nm. This indicates that when the curing pressure is 500 kPa, the curing pressure’s effect on pore closure in the specimens is essentially maximized. Further increases in curing pressure did not significantly alter the pore size distribution, resulting in only limited increases in the uniaxial compressive strength of the backfill.
Figure 7b shows the changes in uniaxial compressive strength at 28 days of curing age under different curing pressures. The long-term uniaxial compressive strength of tailings-cemented fill material remained positively correlated with the curing pressure applied to the specimens. Similar to the changes observed during the initial curing stage, as the curing pressure increased, the long-term uniaxial compressive strength of the tailings-cemented fill material continued to increase.
However, as the curing pressure further increased, the rate of increase in uniaxial compressive strength slowed down until it eventually stabilized. Unlike the changes observed during the initial curing stage, the curing temperature had a noticeable impact on the strength of the specimens during long-term curing. For the two groups of specimens with curing temperatures of 35 °C and 55 °C, their uniaxial compressive strengths were essentially the same at curing pressures of 500 kPa and 750 kPa. Since the trend of long-term strength variation with curing pressure was similar to that in the initial stage, a quadratic regression fit was still used to model the relationship between curing pressure and long-term strength. The fitting results are shown in Figure 7 and Table 4. Due to the influence of curing temperature, the correlation coefficient of the fitting results between curing pressure and long-term strength was significantly lower than that of the initial strength fitting coefficient.

4.3. Effect of Pore Water Pressure on Strength

During the consolidation of tailings-based cemented backfill slurry, phenomena such as settlement and bleeding may occur. Meanwhile, compared with laboratory-standard-cured backfill bodies, in situ backfill bodies are of much larger dimensions. This means that during the slurry consolidation stage, significant seepage may occur within the in situ backfill body, leading to changes in pore water pressure. Additionally, in the in situ mining environment, the backfill may also be subject to changes in pore water pressure caused by environmental factors such as groundwater and high humidity.
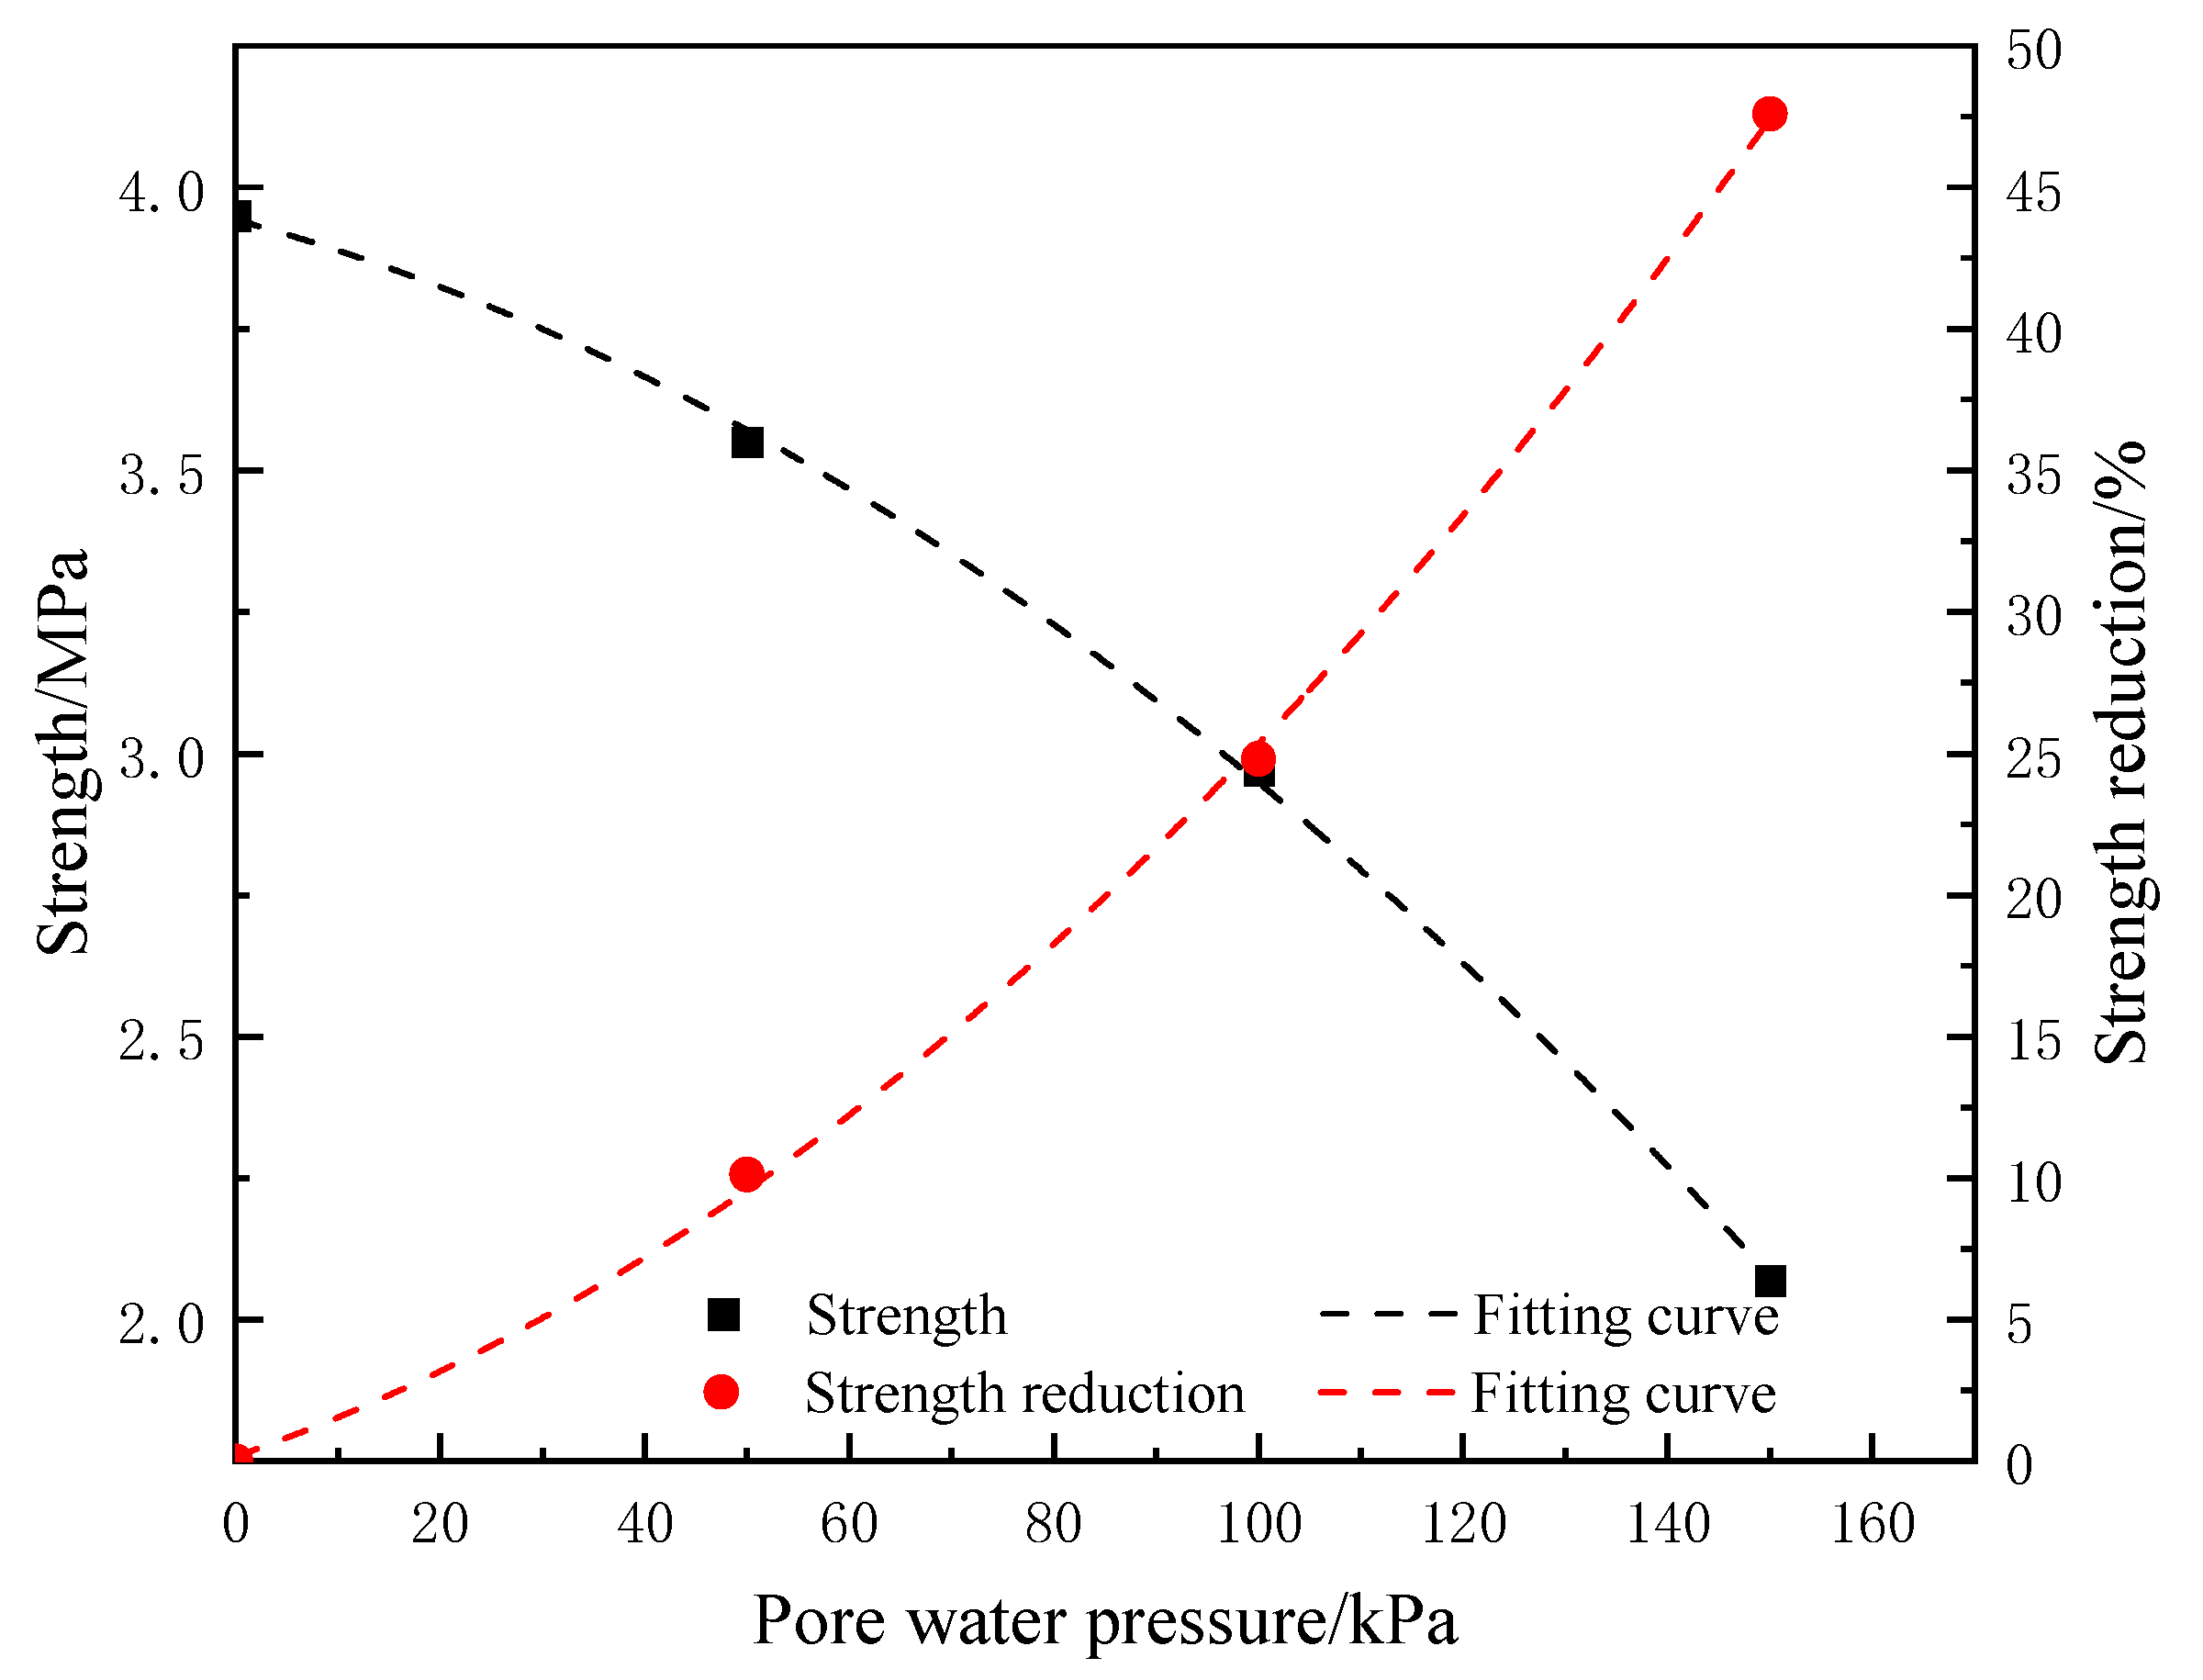
As shown in Figure 8, compared with specimens without pore water pressure, pore water pressure caused significant damage to the tailings-cemented backfill specimens, resulting in a significant reduction in strength. The higher the pore water pressure, the lower the uniaxial compressive strength of the specimens, and the greater the reduction in strength. When there was no pore water pressure, the strength was 3.95 MPa; when the pore water pressure reached 150 kPa, the strength decreased to approximately 2.07 MPa. Meanwhile, the strength reduction continued to increase, reaching approximately 30% when the pore water pressure reached 150 kPa. A fitting analysis was conducted on the relationship between pore water pressure, uniaxial compressive strength, and strength reduction of the specimens. The fitting results are shown in Figure 8 and Table 5. The second fitting yielded correlation coefficients of 0.9896 and 0.9928, respectively, indicating good fitting results. This suggests that as the pore water pressure increases, it causes more significant damage to the early strength of the specimen, resulting in lower uniaxial compressive strength and greater strength reduction. The fitting relationship precisely quantifies this influence mechanism, clearly demonstrating the negative correlation between pore water pressure and the early strength of the specimen.
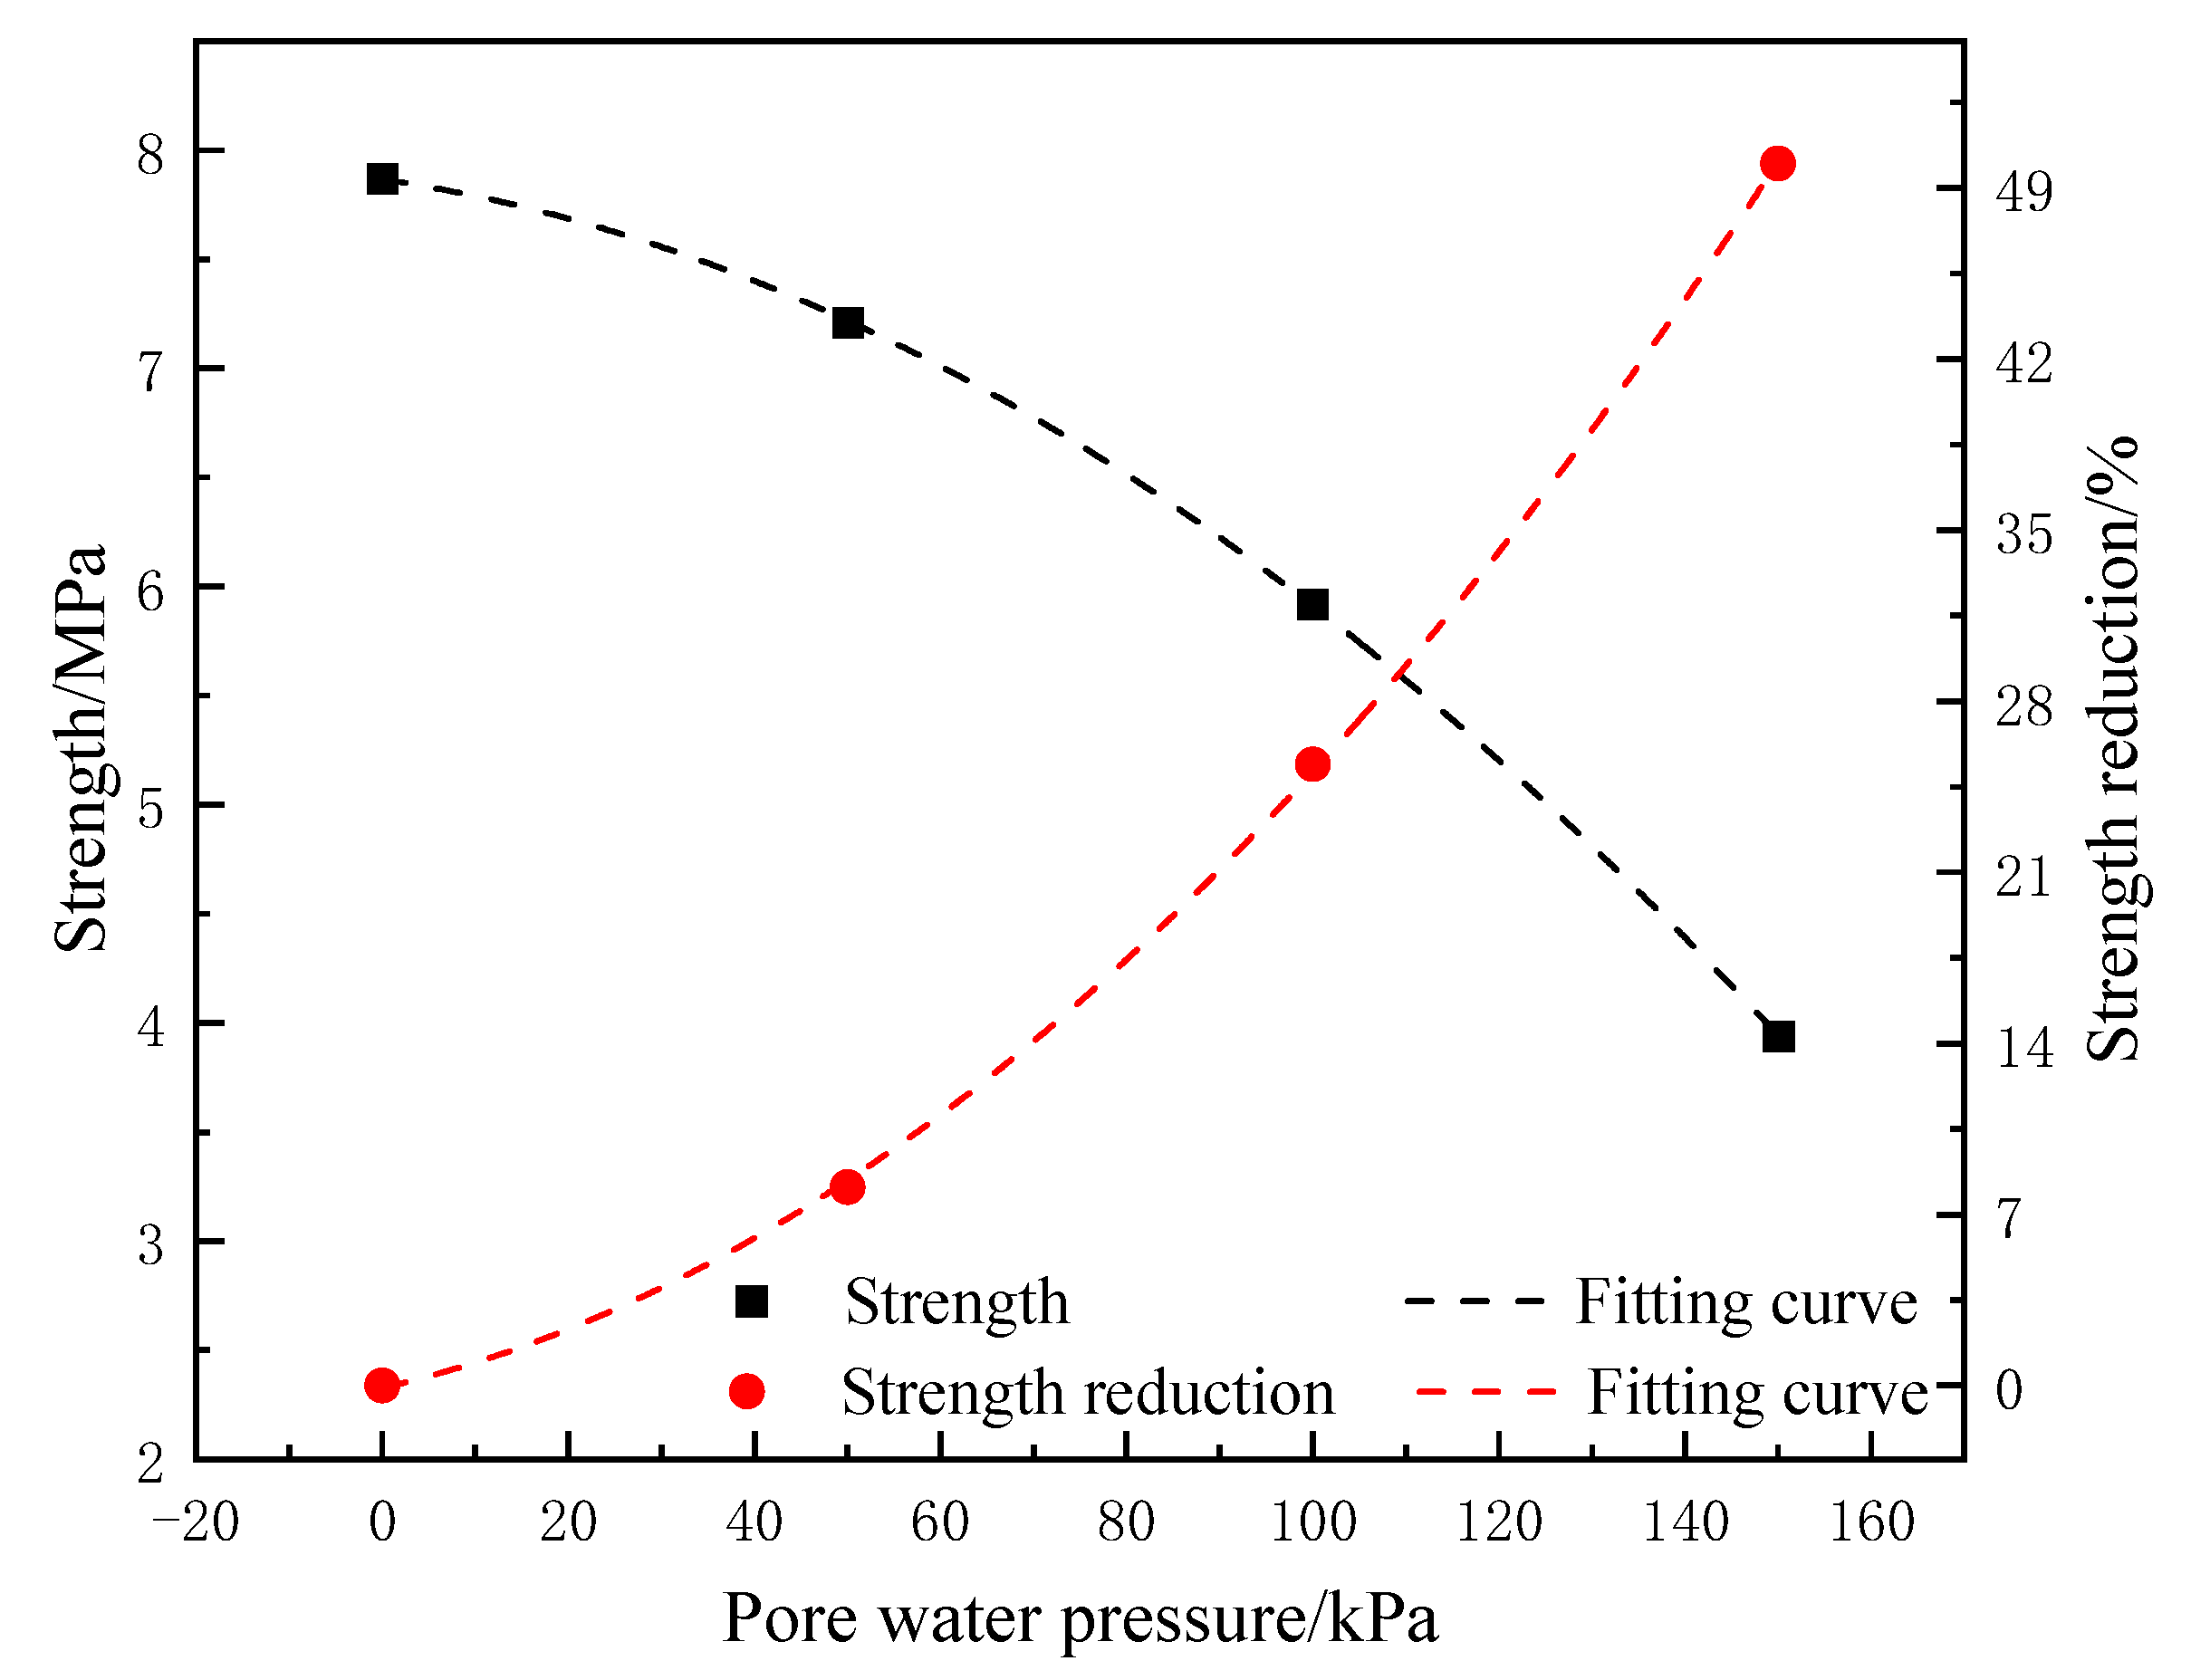
As shown in Figure 9, compared with specimens without pore water pressure, pore water pressure caused significant damage to the tailings-cemented backfill specimens, resulting in a significant reduction in their strength. Furthermore, the greater the pore water pressure, the lower the uniaxial compressive strength of the specimens, and the greater the reduction in specimen strength. A regression analysis was conducted between pore water pressure and the specimen’s uniaxial compressive strength and strength reduction. The results are shown in Table 6 and Figure 9. As shown in Table 6 and Figure 9, the uniaxial compressive strength was 7.87 MPa when there was no pore water pressure, and it decreased to 3.94 MPa when the pore water pressure reached 150 kPa; the strength reduction increased to approximately 30%. A second-order fitting was performed on the relationship between pore water pressure and uniaxial compressive strength as well as strength reduction. The correlation coefficients were 0.9892 and 0.9981, respectively, indicating a high degree of fitting accuracy. This indicates that as the pore water pressure increases, the damage to the specimen becomes more significant, resulting in lower uniaxial compressive strength and greater strength reduction. The fitting relationship effectively quantifies this pattern, clearly demonstrating the significant negative correlation between pore water pressure and long-term specimen strength as well as the significant positive correlation with strength reduction.
A comprehensive analysis of the experimental results suggests that the mechanism by which pore water pressure affects the sample strength can be explained in three aspects. First, pore water pressure directly reduces the effective stress between particles. According to the principle of effective stress, the total stress within the sample is composed of the effective stress borne by the particle skeleton and pore water pressure [28]. When pore water pressure increases, the effective stress decreases accordingly, leading to a significant reduction in friction and interlocking forces between particles, akin to inserting a “lubricant” between particles, causing the sample’s ability to resist external loads to rapidly decline in the short-term.
Second, pore water pressure promotes the degradation of the pore structure within the sample. Under pressure, pore water flows along weak areas, eroding fine particles and enlarging existing pores, or even inducing new microcracks. When the pressure reaches a certain level, the dynamic water pressure of the flow further exacerbates stress concentration at the crack tips, causing microcracks to continuously expand and connect, disrupting the sample’s integrity and further amplifying strength loss.
Finally, prolonged and sustained pore water pressure can trigger synergistic degradation through chemical and physical processes [29]. On the one hand, pore water may react with the cementing material, dissolving cementing agents such as calcium aluminate and hydrated calcium silicate, thereby weakening the bonding strength between particles. On the other hand, periodic pressure fluctuations can cause pore water to repeatedly penetrate and retract, leading to fatigue damage within the sample and ultimately resulting in a sustained decline in long-term strength.

5. Conclusions

This study took the mechanical properties of tailings-cemented backfill as the research object, designed a curing device that simulated the multi-field environment of heat, water, and force in the in situ stope, and used this device to monitor the strength development process of the tailings-cemented backfill body under different curing environments and conducted uniaxial compressive strength tests. The specific conclusions are as follows:
(1) Appropriate curing temperatures promote cement hydration reactions, accelerate the formation of hydration products, and reduce specimen porosity. Specifically, when the curing temperature increases from 20 °C to 45 °C, the porosity of the filled body reaches its minimum value, with the corresponding 28-day uniaxial compressive strength rising from 4.2 MPa to 6.8 MPa. Beyond 45 °C, thermal expansion induced by high temperatures disrupts the internal structure of the specimens, causing porosity to rebound and strength to decline significantly. At 55 °C, the compressive strength drops to 5.1 MPa.
(2) Curing pressure closes internal pores within specimens, accelerates pore water expulsion, and alters the water–cement ratio. This promotes cement hydration, reduces specimen porosity, and significantly enhances the uniaxial compressive strength of the grout. As the curing pressure increased from 0 kPa to 750 kPa, the maximum pore size of the slurry decreased from 310.52 nm to approximately 2055 nm. Correspondingly, the 28-day uniaxial compressive strength of the fill material continuously increased to 6.8 MPa with rising curing pressure. However, the growth trend gradually slowed after the curing pressure exceeded 500 kPa, indicating that its optimization effect on fill material performance approached saturation.
(3) Pore water pressure enlarges micro-voids within specimens, reduces slurry concentration, and inhibits cement hydration, thereby increasing porosity and weakening uniaxial compressive strength. The 28-day uniaxial compressive strength of the grout decreased continuously with rising pore water pressure to 3.94 MPa, representing a total reduction of approximately 42%. Furthermore, the study revealed that the strength decline trend correlates with the curing pressure and curing temperature.

Author Contributions

Conceptualization, Y.C. and Z.Y.; methodology, Y.C.; validation, G.W. and L.G.; investigation, L.G.; writing—original draft preparation, Z.Y. and Y.Z. (Yunwei Zhang); writing—review and editing, Y.Z. (Yue Zhao); project administration, C.J. All authors have read and agreed to the published version of the manuscript.

Funding

This research was funded by the Deep Earth Probe and Mineral Resources Exploration—National Science and Technology Major Project (Grant No. 2024ZD1003705).

Data Availability Statement

The raw data supporting the conclusions of this article will be made available by the authors on request.

Conflicts of Interest

Authors Zepeng Yan, Lijie Guo, Chong Jia were employed by the company BGRIMM Technology Group. Yin Chen and Yunwei Zhang were employed by the Xinjiang Kalatongke Mining Co., Ltd. The remaining author declares that the research was conducted in the absence of any commercial or financial relationships that could be construed as a potential conflict of interest.

References

  1. Dong, Q.; Cao, L. The hole-filling method and the multiscale computation for the wave equations in perforated domains. Comput. Math. Appl. 2015, 70, 1743–1756. [Google Scholar] [CrossRef]
  2. Hollinderbaeumer, E.W.; Kraemer, U. Waste disposal and backfilling technology in the German hard coal mining industry. Bulk Solids Handl. 1994, 14, 795–798. [Google Scholar]
  3. Guo, L.; Liu, G.; Ma, Q.; Chen, X. Research progress on mining with backfill technology of underground metalliferous mine. J. China Coal Soc. 2022, 47, 4182–4200. [Google Scholar] [CrossRef]
  4. Xie, H.; Gao, F.; Ju, Y.; Gao, M.; Zhang, R.; Gao, Y.; Liu, J.; Xie, L. Quantitative definition and investigation of deep mining. J. China Coal Soc. 2015, 40, 1–10. [Google Scholar] [CrossRef]
  5. Ayhan, K.; Erol, Y.; Bayram, E. Evaluation of paste backfill mixtures consisting of sulphide-rich mill tailings and varying cement contents. Cem. Concr. Res. 2004, 34, 1817–1822. [Google Scholar] [CrossRef]
  6. Lin, F.; Meyer, C. Hydration kinetics modeling of Portland cement considering the effects of curing temperature and applied pressure. Cem. Concr. Res. 2009, 39, 255–265. [Google Scholar] [CrossRef]
  7. Wu, D.; Zhang, Y.; Liu, Y. Mechanical performance and ultrasonic properties of cemented gangue backfill with admixture of fly ash. Ultrasonics 2016, 64, 89–96. [Google Scholar] [CrossRef]
  8. Helinski, M.; Fahey, M.; Fourie, A. Behavior of Cemented Paste Backfill in Two Mine Stopes: Measurements and Modeling. J. Geotech. Geoenviron. Eng. 2010, 137, 171–182. [Google Scholar] [CrossRef]
  9. Qiao, P.; Cheng, W.; Zhang, L.; Yao, W.; Wang, X.; Wang, H. Modern Mining Concepts and Filling Technique. Nonferrous Met. Sci. Eng. 2011, 2, 7–14. [Google Scholar] [CrossRef]
  10. Belem, T.; Benzaazoua, M. Design and Application of Underground Mine Paste Backfill Technology. Geotech. Geol. Eng. 2008, 26, 147–174. [Google Scholar] [CrossRef]
  11. Le Roux, K.; Bawden, W.F.; Grabinsky, M.F. Field properties of cemented paste backfill at the Golden Giant mine. Min. Technol. 2013, 114, 65–80. [Google Scholar] [CrossRef]
  12. Yilmaz, E. One-Dimensional Consolidation Parameters Of Cemented Paste Backfills/Parametry Jednowymiarowej Konsolidacji Podsadzki W Postaci Cementowej Pasty. Gospod. Surowcami Miner. Miner. Resour. Manag. 2012, 28, 29–45. [Google Scholar] [CrossRef]
  13. Tang, G.; Guo, L.; Liu, G.; Yang, X. Experimental study on tensile strength of cemented tailings backfill and influencing factors. China Min. Mag. 2022, 31, 124–131. [Google Scholar]
  14. Zhou, K.; Liu, W.; Zhou, Y.; LIn, Y.; Xue, K. Mechanical properties and damage-softening constitutive model of backfill with different osmotic pressures. Rock Soil Mech. 2019, 40, 3724–3732. [Google Scholar] [CrossRef]
  15. Ghirian, A.; Fall, M. Coupled thermo-hydro-mechanical-chemical behaviour of cemented paste backfill in column experiments. Part I: Physical, hydraulic and thermal processes and characteristics. Eng. Geol. 2013, 164, 195–207. [Google Scholar] [CrossRef]
  16. Cheng, H.; Wu, S.; Zhang, X.; Li, J. A Novel Prediction Model of Strength of Paste Backfill Prepared from Waste-Unclassified Tailings. Adv. Mater. Sci. Eng. 2019, 2019, 3574190. [Google Scholar] [CrossRef]
  17. Xu, W.; Wan, C.; Tian, X. Coupling effect of temperature and fracture on the strength and crack propagation mode of backfill mass. J. Min. Saf. Eng. 2018, 35, 612–619. [Google Scholar] [CrossRef]
  18. Pouramini, Z.; Pokharel, M.; Fall, M.; Aldhafeeri, Z. Temperature dependence of the reactivity of cemented paste backfill. Appl. Geochem. J. Int. Assoc. Geochem. Cosmochem. 2016, 72, 10–19. [Google Scholar]
  19. Fahey, M.; Helinski, M.; Fourie, A. Development of Specimen Curing Procedures that Account for the Influence of Effective Stress During Curing on the Strength of Cemented Mine Backfill. Geotech. Geol. Eng. 2011, 29, 709–723. [Google Scholar] [CrossRef]
  20. Ghirian, A.; Fall, M. Coupled thermo-hydro-mechanical–chemical behaviour of cemented paste backfill in column experiments: Part II: Mechanical, chemical and microstructural processes and characteristics. Eng. Geol. 2014, 170, 11–23. [Google Scholar] [CrossRef]
  21. Cui, L.; Fall, M. Mechanical and thermal properties of cemented tailings materials at early ages: Influence of initial temperature, curing stress and drainage conditions. Constr. Build. Mater. 2016, 125, 553–563. [Google Scholar] [CrossRef]
  22. Qi, C.; Fourie, A.; Chen, Q.; Zhang, Q. A strength prediction model using artificial intelligence for recycling waste tailings as cemented paste backfill. J. Clean. Prod. 2018, 183, 566–578. [Google Scholar] [CrossRef]
  23. Chen, S.; Yilmaz, E.; Xiang, Z.-G.; Wang, Y. Curing conditions effect on pore structure, compressive strength and elastic modulus of cementitious tailings backfills. Powder Technol. 2023, 422, 118458. [Google Scholar] [CrossRef]
  24. Chen, S. Research on the Mechanical Characteristics and its Responsemechanism of Cemented Paste Backfill Under the Effect of Stress and Temperature. Ph.D. Thesis, University of Science and Technology Beijing, Beijing, China, 2020. [Google Scholar]
  25. He, X.; Wei, L.; Yang, K.; Wen, Z.; Zhang, L.; Hou, Y. Effects of curing temperature and age on the mechanical properties and damage law of coal-based solid waste cemented backfill. Case Stud. Constr. Mater. 2025, 23, e04937. [Google Scholar] [CrossRef]
  26. Wang, W.; Zhu, W.; Chen, Z. Effects of curing temperature on mechanical properties and damage evolution of rod-milled sand cemented paste backfill. Results Eng. 2025, 28, 107268. [Google Scholar] [CrossRef]
  27. Yilmaz, E.; Benzaazoua, M.; Belem, T.; Bussière, B. Effect of curing under pressure on compressive strength development of cemented paste backfill. Miner. Eng. 2012, 22, 772–785. [Google Scholar] [CrossRef]
  28. Ke, Y.; Zeng, J.; Hu, K.; Shen, Y.; Yu, S.; Ma, Y. Triaxial mechanical properties and evolution mechanism of fully cemented unclassified tailings backfill under seepage pressure. Nonferrous Met. Sci. Eng. 2024, 15, 422–431. [Google Scholar] [CrossRef]
  29. Shen, Y. Study on the Mechanical Properties and Macro and Microdamage Laws of Paste Backfill Under Seepage. Master’s Thesis, Jiangxi University of Science and Technology, Ganzhou, China, 2024. [Google Scholar]
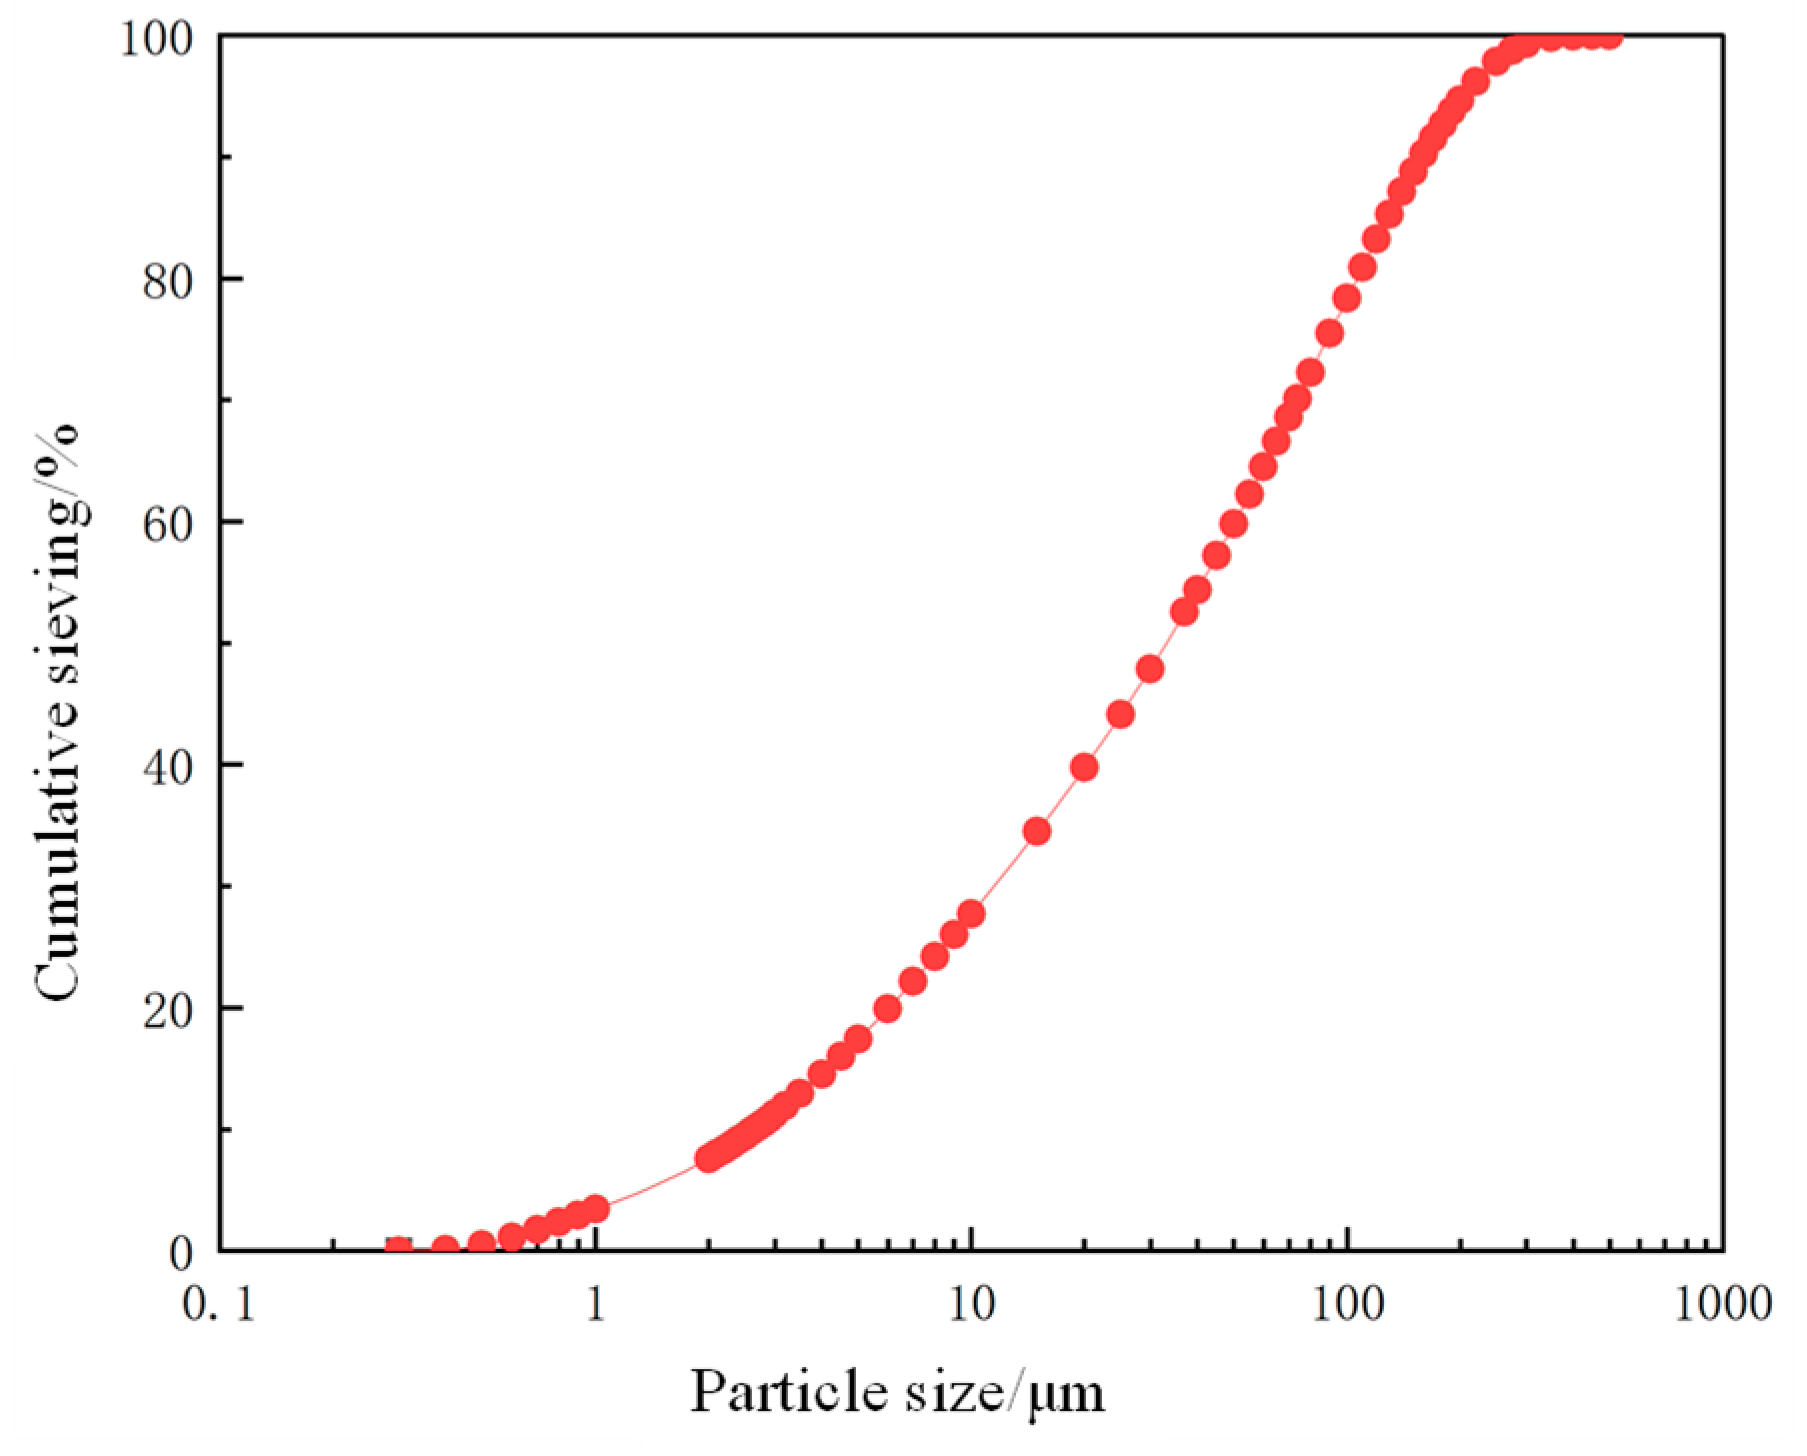
Figure 1. The particle size distribution curve of the backfill aggregate.
Minerals 15 01087 g001
Figure 2. The test device for simulating the in situ curing environment of cemented backfill bodies.
Minerals 15 01087 g002
Figure 3. MIP test results at different curing temperatures(curing pore water pressure 50 kPa, curing pressure 750 kPa).
Minerals 15 01087 g003
Figure 4. MIP test results at different curing pressures (curing temperature 45 °C, curing pore water pressure 50 kPa).
Minerals 15 01087 g004
Figure 5. MIP test results at different pore water pressures (curing temperature 45 °C, curing pressure 750 kPa).
Minerals 15 01087 g005
Figure 6. Strength test results at different curing temperatures(curing pore water pressure 50 kPa).
Minerals 15 01087 g006
Figure 7. Strength test results at different curing pressures(curing pore water pressure 50 kPa).
Minerals 15 01087 g007
Figure 8. Effect of pore water pressure on early strength (curing temperature 45 °C, curing pressure 750 kPa).
Minerals 15 01087 g008
Figure 9. Effect of pore water pressures on long-term strength (curing temperature 45 °C, curing pressure 750 kPa).
Minerals 15 01087 g009
Table 1. The chemical composition of the backfill aggregate.
AggregateChemical Composition (%)
SiO2CaOMgOAl2O3Fe2O3SO3K2OOther
Tailings76.222.201.500.9312.091.53.371.34
Cement28.3648.282.5011.872.884.151.070.88
Table 2. Influencing factors and levels.
Curing Temperature/°CPore Water Pressure/kPaCuring Pressure/kPa
20500, 250, 500, 750
35500, 250, 500, 750
45500, 250, 500, 750
55500, 250, 500, 750
450, 50, 100, 150750
Table 3. The relationship between strength test data and curing pressure.
Curing Pressure/kPaFitting TypeFitting ResultCorrelation Coefficient/R2
3 d0Quadratic y = 0.901 + 0.0783 x 8.592 × 10 4 x 2 0.991
250Quadratic y = 1.156 + 0.093 x 0.001 x 2 0.914
500Quadratic y = 1.295 + 0.056 x 5.58 × 10 4 x 2 0.925
750Quadratic y = 1.641 + 0.103 x 0.0012 x 2 0.947
28 d0Quadratic y = 2.395 + 0.1858 x 0.0028 x 2 0.997
250Quadratic y = 2.602 + 0.251 x 0.0036 x 2 0.986
500Quadratic y = 3.92 + 0.208 x 0.003 x 2 0.992
750Quadratic y = 5.52 + 0.1487 x 0.0024 x 2 0.991
Table 4. The relationship between the strength test data and curing temperature.
Curing AgeCuring Temperature/°CFitting TypeFitting ResultCorrelation Coefficient/R2
3 d20Quadratic y = 2.113 + 0.00293 x 1.8 × 10 6 x 2 0.985
35Quadratic y = 2.508 + 0.00267 x 1.56 × 10 6 x 2 0.997
45Quadratic y = 2.757 + 0.0028 x 1.64 × 10 6 x 2 0.994
55Quadratic y = 2.569 + 0.00299 x 1.8 × 10 6 x 2 0.997
28 d20Quadratic y = 4.251 + 0.0057 x 3.48 × 10 6 x 2 0.984
35Quadratic y = 5.014 + 0.00531 x 3.08 × 10 6 x 2 0.999
45Quadratic y = 5.545 + 0.0066 x 4.88 × 10 6 x 2 0.992
55Quadratic y = 5.183 + 0.00605 x 3.88 × 10 6 x 2 0.988
Table 5. The relationship between early strength test data and pore water pressure.
Fitting ObjectFitting TypeFitting ResultCorrelation Coefficient/R2
StrengthQuadratic y = 3.943 + 0.005 x 5 × 10 5 x 2 0.9896
Strength reductionQuadratic y = 0.1772 + 0.1251 x 0.00127 x 2 0.9928
Table 6. The relationship between long-term strength test data and pore water pressure.
Fitting ObjectFitting TypeFitting ResultCorrelation Coefficient/R2
StrengthQuadratic y = 7.867 0.0064 x 1.32 × 10 4 x 2 0.9892
Strength reductionQuadratic y = 0.0875 x + 0.00165 × 10 4 x 2 0.096 0.9981
Disclaimer/Publisher’s Note: The statements, opinions and data contained in all publications are solely those of the individual author(s) and contributor(s) and not of MDPI and/or the editor(s). MDPI and/or the editor(s) disclaim responsibility for any injury to people or property resulting from any ideas, methods, instructions or products referred to in the content.