Article

Geology-Topography Constrained Super-Resolution of Geochemical Maps via Enhanced U-Net

1
College of Geoexploration Science and Technology, Jilin University, Changchun 130026, China
2
Geoscience Big Data Analysis and Application Technology Innovation Center, Ministry of Natural Resources, Changchun 130026, China
3
Jilin Branch of China National Geological Exploration Center of Building Materials Industry, Changchun 130033, China
4
Shenyang Center of China Geological Survey, Northeast Geological S&T Innovation Center of China Geological Survey, Shenyang 110000, China
5
Key Laboratory of Black Soil Evolution and Ecological Effect, Ministry of Natural Resources, Shenyang 110000, China
*
Author to whom correspondence should be addressed.
Minerals 2025, 15(10), 1088; https://doi.org/10.3390/min15101088
Submission received: 14 September 2025 / Revised: 8 October 2025 / Accepted: 16 October 2025 / Published: 19 October 2025
(This article belongs to the Special Issue Selected Papers from the 7th National Youth Geological Congress)

Abstract

Geochemical maps are essential visualization tools for studying the distribution patterns of elements on the Earth’s surface. They provide critical insights into geological structure, mineralization processes, and environmental evolution. Traditional interpolation methods often fail to adequately reconstruct high-frequency details in geochemical maps with low sampling density. This study proposes a super-resolution (SR) reconstruction method for geochemical maps based on an enhanced U-Net architecture, validated in the Gouli area of Qinghai Province. By integrating residual blocks, multi-scale neural networks, and constraints from topographic features (elevation, slope, aspect) and geological map embeddings, our method enhances the resolution of stream sediment geochemical maps from 1:50,000 to 1:25,000 scale. Experimental results demonstrate that the proposed method outperforms SRCNN, VDSR, and standard U-Net models in both peak signal-to-noise ratio (PSNR) and structural similarity index (SSIM). Specifically, with all constraints incorporated, the method achieves maximum and mean PSNR values of 38.486 and 25.334, respectively, and maximum and mean SSIM values of 0.968 and 0.817. The reconstructed high-resolution (HR) geochemical maps exhibit superior detail clarity and maintain strong spatial correlation with the original HR data. Studies have shown that this method can effectively learn multi-scale geochemical patterns and detect subtle anomalies missed in low-resolution (LR) maps. Moreover, the reconstructed HR geochemical maps exhibit better alignment with the Ag, Cu, and Pb anomalies in known mineralization zones (Maixiulongwa and Sanchakou areas), thereby providing strong support for precise mineral exploration.

Graphical Abstract

1. Introduction

As essential visualization tools for analyzing element distribution patterns on the Earth’s surface, geochemical maps provide critical insights into geological structures, mineralization processes, and environmental evolution [1]. At multiple spatial scales (from local to global), these maps reveal distinct geochemical signatures, where element frequency and spatial distribution serve as reliable indicators for geochemical anomaly detection [2]. However, the resolution of geochemical maps is influenced by various factors, including sampling methods and density. Traditional manual sampling methods are often limited by cost and labor constraints, resulting in sparse sampling points that struggle to capture the subtle heterogeneity of element distributions [3]. Although studies by Wang, Smith, Reimann, and others have demonstrated that low-density sampling can reveal reproducible geochemical patterns across diverse regions (e.g., China, Europe, North America) [4,5,6], the challenge of reconstructing high-resolution (HR) geochemical anomalies from low-density data and effectively integrating multi-source information remains a central focus of current research.
Stream sediment geochemistry is influenced by topography, drainage systems, valley morphology, and various geogenic factors [7,8], resulting in complex spatial patterns of elemental composition. The geological setting and mineralization processes control element speciation and spatial distribution in stream sediments [9,10]. This results in significant variations in geochemical signals with sampling density, posing challenges for geological interpretation, mineral exploration targeting, and environmental assessment. Currently, significant advances have been achieved in geochemical data information extraction. Researchers including Cheng, Shokouh Saljoughi, and Zuo have developed multiple approaches, including multifractal filtering, wavelet multiscale decomposition, and machine learning, to characterize scale invariance and multifractal properties of geochemical fields [11,12,13,14,15]. Additionally, machine learning methods such as Empirical Mode Decomposition (EMD), Least Squares Support Vector Machines (LSSVM), Support Vector Machines (SVM), and K-Nearest Neighbors (KNN) have been applied to classification and prediction tasks in exploration geochemistry [16,17,18].
In recent years, advancements in computational power have enabled data-driven artificial intelligence (AI) to transform geoscientific research. Deep learning (DL) methods, which establish nonlinear mappings through hierarchical feature extraction, have demonstrated remarkable success in fields such as natural language processing and image analysis [19,20], and have also been validated for applications in geochemistry [21,22]. Notable uses include CNN-based frameworks for gold prospectivity assessment and DNN-derived element concentration-to-mineralization probability mappings [23,24,25]. These advancements underscore the significant potential of the data-driven paradigm for uncovering hidden geochemical patterns and cross-scale relationships.
Traditional interpolation methods can improve data resolution to some extent. However, these methods rely on simplified mathematical models and typically fail to reconstruct high-frequency details, resulting in limited resolution enhancement. Super-resolution reconstruction (SR) technology has emerged as a critical breakthrough for enhancing data resolution. As a key technique in computer vision and image processing, SR generates HR output from low-resolution (LR) input and has been widely applied in fields including medical imaging, remote sensing, video surveillance, and Earth sciences [26,27,28]. SR algorithms are primarily categorized into interpolation-based, reconstruction-based, and learning-based methods [29,30]. Among these, learning-based methods, particularly those utilizing deep network architectures, show significant advantages in minimizing information loss and recovering fine details [31].
The Super-Resolution Convolutional Neural Network (SRCNN) [32] pioneered the application of CNNs to SR, performing tasks such as feature extraction, nonlinear mapping, and image reconstruction. The Very Deep Super-Resolution (VDSR) architecture introduced residual learning into deeper networks, significantly enhancing reconstruction performance [33,34,35]. The Residual Channel Attention Network (RCAN) [36] incorporates a channel attention mechanism, which allows for better SR performance and more effective high-frequency feature extraction. The U-Net architecture [26,37], a symmetric encoder–decoder convolutional neural network that often incorporates residual design concepts, has proven to be widely applicable across numerous domains and offers a viable technical pathway for the SR reconstruction of geochemical maps. Existing research has made progress in multi-scale information extraction and the application of AI technologies. However, leveraging DL to reconstruct HR anomalies from low-density sampling data—effectively integrating auxiliary information such as topography and geology to enhance model generalizability—remains an area requiring in-depth exploration. This is particularly true given the multi-source, multi-scale, and cross-scale correlated nature of geochemical data.
This study selected the Gouli area in Qinghai Province as the case study. Using stream sediment geochemical data (10 elements: As, Sb, Bi, Au, Ag, Cu, Pb, Zn, Sn, Mo) at 1:50,000 and 1:25,000 scales, we propose a multi-scale U-Net network integrated with residual blocks to reconstruct HR geochemical maps. We incorporated topographic features (elevation, slope, aspect) and vectorized geological maps as constraints. Using the residual maps of HR and LR as supervision signals, we enhanced the resolution of the LR data.

2. Geological Settings

The study area lies within the Qinghai–Tibet Alpine Steppe Subzone, with its geotectonic setting situated in the eastern East Kunlun orogenic belt [38], covering an area of 2566 km2. From north to south, it comprises three tectonic units: the Eastern Kunlun Magmatic Belt, Central Kunlun Mélange Belt, and Eastern Kunlun Southern Slope Accretionary Complex Belt. The area exhibits well-developed fault systems and frequent magmatic activity. The interaction between fault systems and intrusive rocks generates discontinuous outcrops, characteristic of orogenic belt architecture (Figure 1). Stratigraphic units (oldest to youngest) include the Jinshuikou rock group, Xiaomiao Formation, Haraguole Formation, Haoteluowa Formation, Hongshuichuan Formation, Elashan Formation, and Quaternary deposits. The Jinshuikou Group occurs in the southern part of the study area, consisting mainly of gneiss and plagioclase amphibolite. Lithologically, the Xiaomiao Formation of the Changcheng System features metagranulite, schist, and marble. The sedimentary rocks in the study area are predominantly of Paleozoic and Mesozoic ages, including the Halaguole Formation, Haoteluowa Formation, Hongshuichuan Formation, and Elashan Formation. These primarily consist of clastic assemblages (siltstone, sandstone, conglomerate), with subordinate limestone and slate. Early Paleozoic-Mesozoic magmatic rocks are widespread. The intrusive rocks are predominantly Caledonian, Variscan, Indosinian, and Yanshanian-aged intermediate-acid rocks, predominantly granodiorite and syenogranite, with lesser tonalite and quartz diorite. All intrusions emplaced in Late Paleozoic or older strata show fault-controlled distributions.
Multiple types of mineral deposits, including Au, Ag, Cu, Co, and Ni, have been identified in the Gouli area. Among these, gold deposits exhibit the widest distribution and have been the most extensively studied. Geochemical anomalies are primarily distributed in geological settings with tectonic activity and multi-stage intrusive rock emplacement in this study area. The concentrations of Au, Ag, Cu, Pb, Zn, Mo, and W are significantly higher compared to East Kunlun’s background values, suggesting strong prospecting potential. Across all rock types of the Jinshuikou Group, Au concentrations are 2–3 times higher than the average crustal abundance. The high Au abundance in granites contributed fluids and partial material sources for gold mineralization [39,40]. The area hosts the Gololongwa and Walega gold deposits, along with the Bahanmulu copper mineralization site and the Xiangrideharasen iron mineralization site.
Topographically, the elevation of the study area ranges from 3206 to 5007 m, with the primary river being the Chahan Wusu River—an endorheic system that flows northwest into the Qaidam Basin. Originating from alpine glaciers and Donggi Cona Lake (a high-altitude water body), this river exhibits significant seasonal variation in discharge: high flow occurs in summer and autumn, while low flow is observed in spring and winter. Climatically, the region features a temperate desert-steppe climate, characterized by a mean annual temperature below 5 °C and annual precipitation ranging from 50 to 200 mm. Except for the small-scale mining activities of the Guoluolongwa Gold Mine in recent years, there are no other operated mines, smelters, or other industrial facilities in the area. Human activities are limited to sporadic seasonal nomadism by herders (mainly yak grazing), with no large-scale agricultural reclamation, engineering construction, or other anthropogenic disturbances. Geochemical anomalies are mainly driven by natural geological processes.

3. Methods

3.1. Sampling, Sample Preparation and Analysis Methods

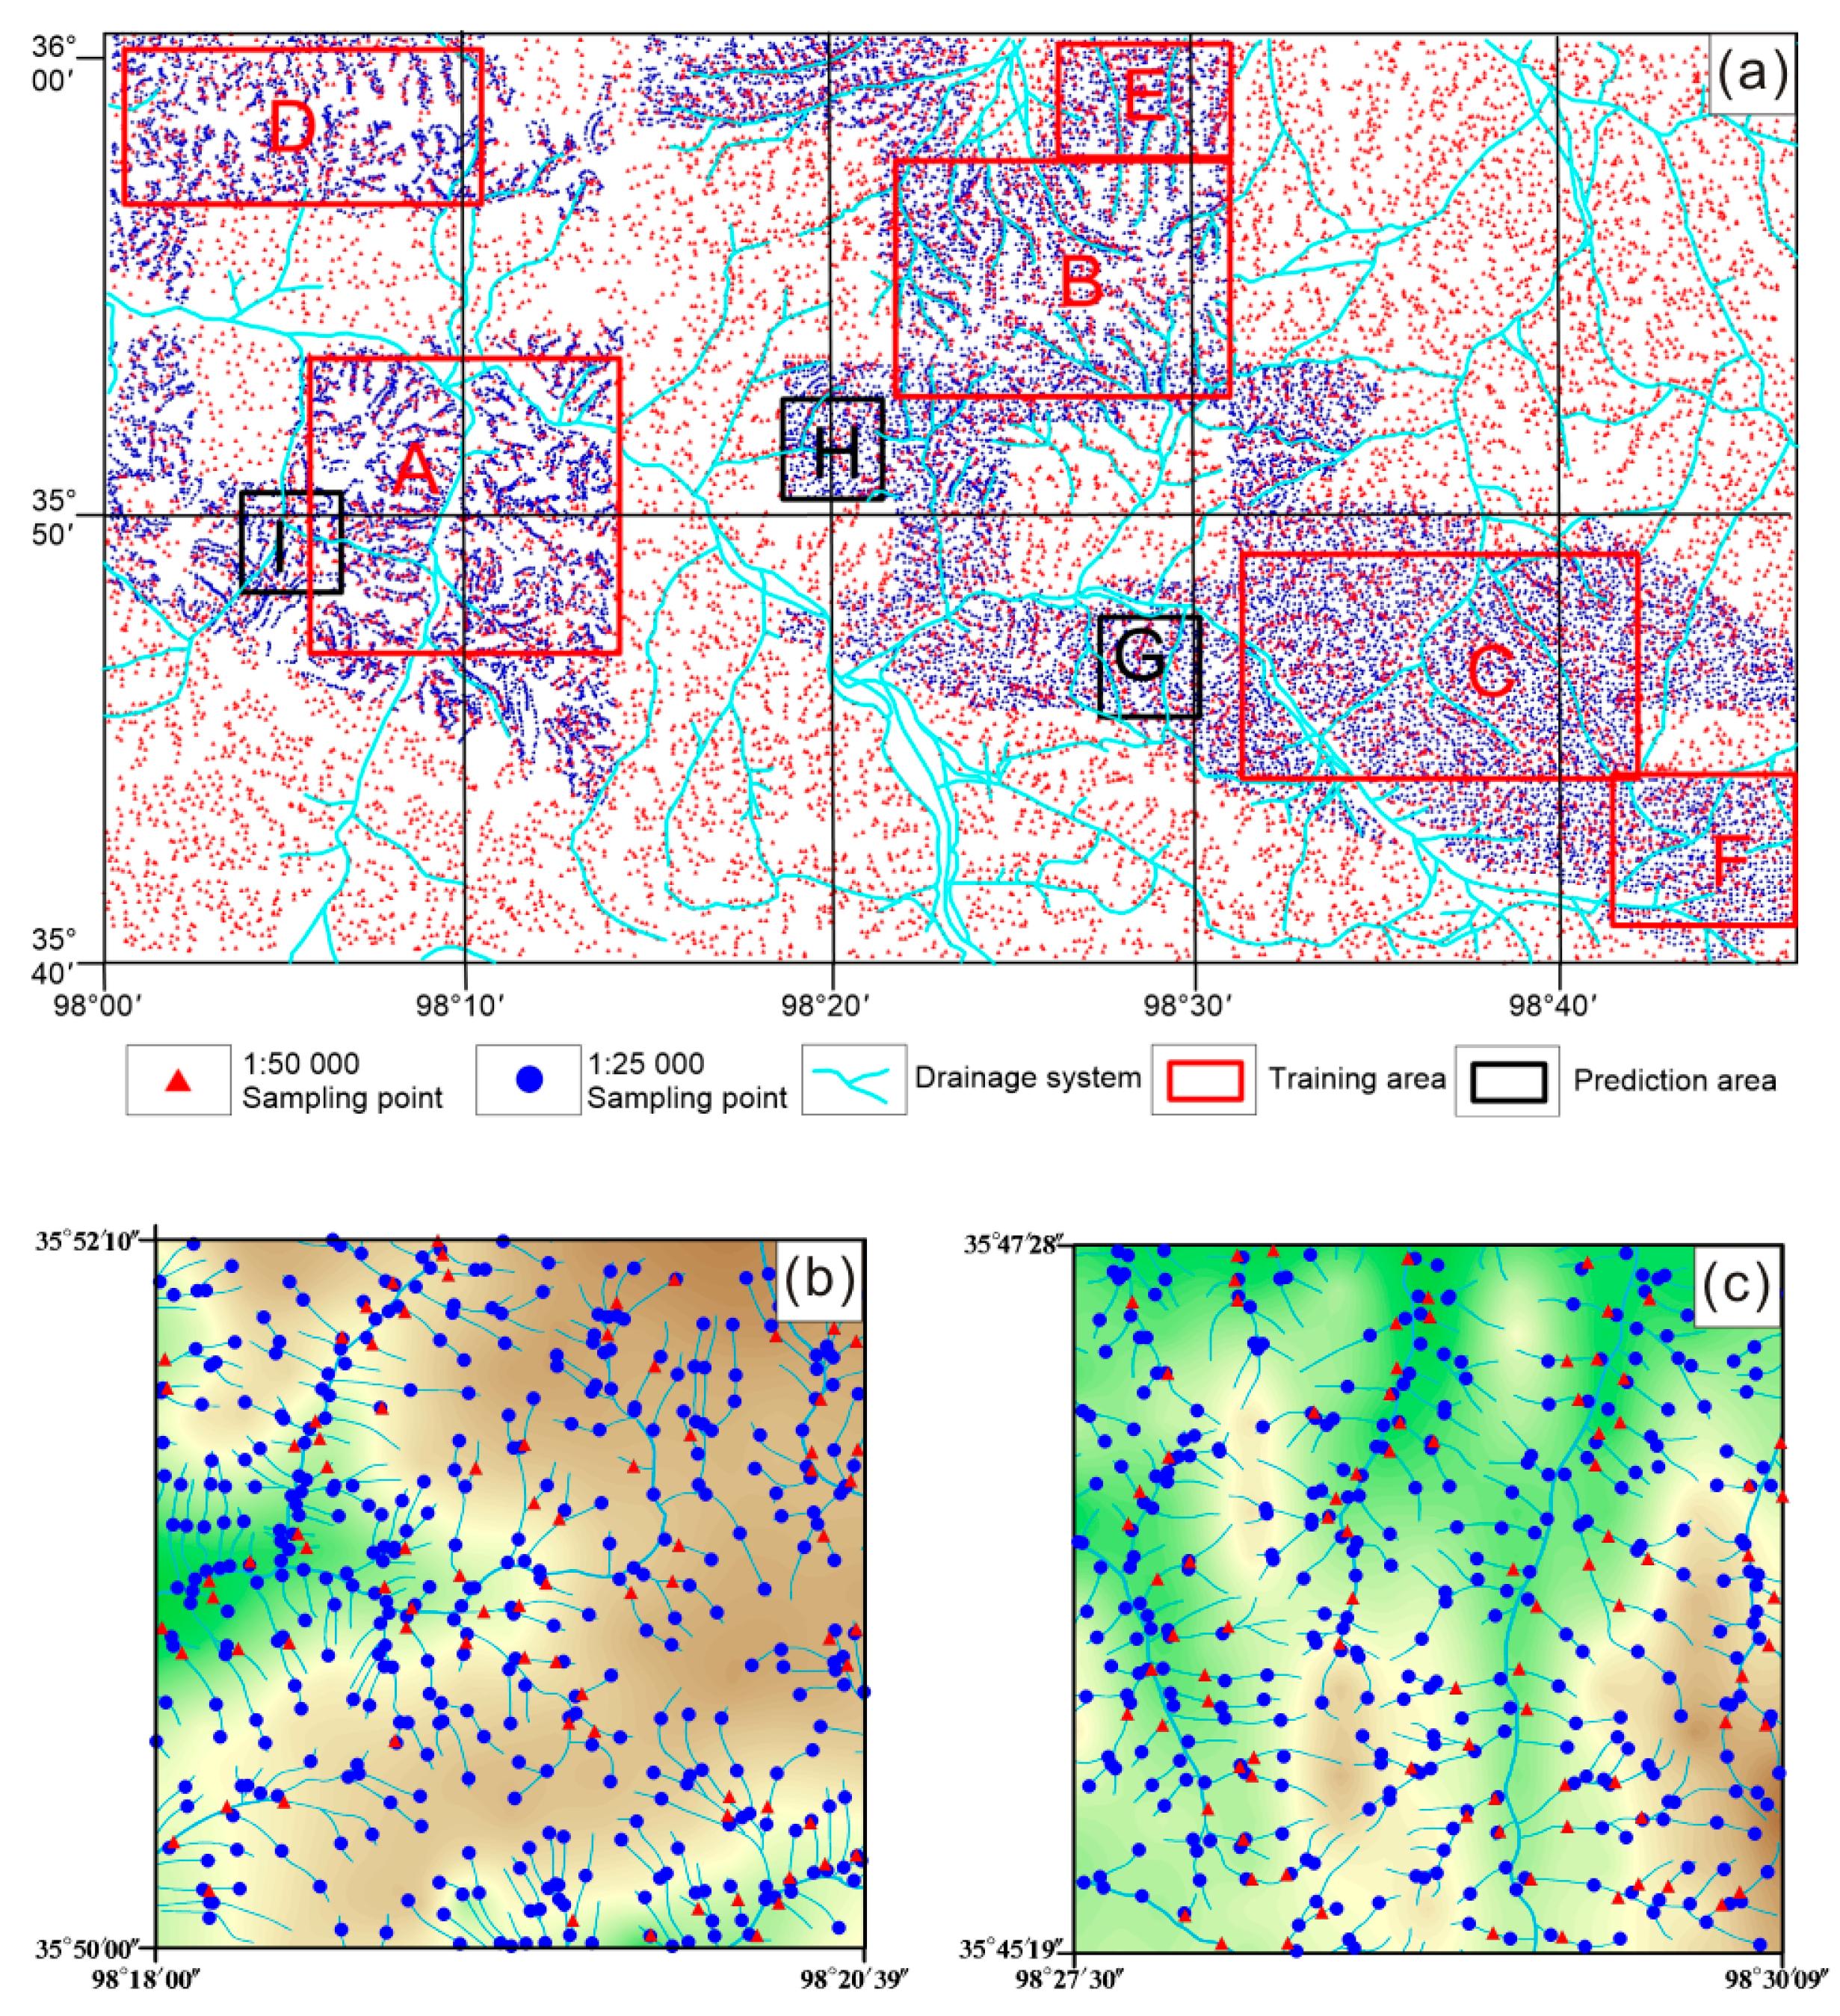
In the Gouli area, regional geochemical mapping at a 1:50,000 scale and detailed geochemical surveying at a 1:25,000 scale have been conducted (Figure 2). As shown in Figure 2, the sampling area of the 1:50,000 geochemical mapping is larger than that of the 1:25,000 geochemical mapping. The overlapping region shared by both surveys is designated as the “core area” in this study, while the full extent covered by the 1:50,000 survey is termed the “entire area”. Labeling water systems on a full regional-scale map would result in overlapping lines and cluttered information, reducing the readability of the map. Therefore, two representative sub-areas were magnified (Figure 2b,c) to illustrate sample distribution clearly. These insets show the locations of sampling sites for both surveys alongside the corresponding drainage patterns, thereby clarifying the sampling strategy. The insets clearly show that all sampling sites are located along the banks or within the riverbeds of water systems, adhering to standard protocols for stream sediment sampling.
For the 1:25,000 scale geochemical mapping, water systems and minor gullies longer than 100 m were delineated on 1:25,000 scale topographic maps. The basic principle for arranging sampling sites is to place most samples in small tributaries 100–200 m long that are distinguishable on 1:25,000 topographic maps, with a few samples placed in higher-order water systems formed by the confluence of small tributaries, to achieve relative uniformity in sample distribution. The sampling density for the 1:25,000 survey was 16–24 samples/km2, resulting in a total of 22,542 samples collected over an area of approximately 1213 km2. The 1:50,000 survey followed the same site placement methodology but at a lower density of 4–8 samples/km2, yielding 12,734 samples across a larger area of 2566 km2.
Both scales of geochemical mapping use stream sediment samples. These comprised surficial bedload sediments from main river channels and nearshore shallow sediments from tributaries and gullies, collected from a depth of 0–15 cm. Sampling prioritized hydraulically active zones conducive to heavy mineral concentration, such as active flow lines, sandbar fronts, and the inner bends of river channels. Medium to coarse sand fractions were targeted as the sampling medium to best represent the upstream catchment area while avoiding contamination by aeolian sand and loess. At each site, a single composite sample was created by multi-point collection within a 10–25 m reach upstream and downstream. Following field collection, samples were air-dried, sieved to isolate the –2000 to +250 μm grain-size fraction, and stored in sample bags. The minimum post-sieving sample weight was 180 g for the 1:50,000 survey and 160 g for the 1:25,000 survey.
This study selected ten elements (As, Sb, Bi, Au, Ag, Cu, Pb, Zn, Sn, and Mo) for analysis based on both research objectives and regional geological characteristics. The study area is situated at the confluence of the East Kunlun and Ela Mountain metallogenic belts, where known mineral deposits are predominantly base metals (Cu, Pb, Zn) and precious metals (Au, Ag). The selected elements represent typical ore-forming or associated indicator elements in this region, effectively capturing the relationship between mineralization anomalies and geochemical fields. This multi-element approach facilitates the identification of geochemical anomaly patterns and provides fundamental data for mineral prospectivity mapping.
Geochemical sample analysis was conducted by the Rock and Mineral Testing Center of Qinghai Province. Prior to analysis, the laboratory optimized methodological procedures and validated accuracy, precision, and method detection limit (MDL). Repeated measurements of certified reference materials (CRMs, GBW07301–GBW07312) were performed to ensure methodological reliability.
A rigorous quality assurance and quality control (QA/QC) protocol was implemented throughout the analytical process to ensure data quality. Samples were pretreated by drying, sterilizing, and grinding to 75 μm. Au was determined by graphite furnace atomic absorption spectrometry (GF-AAS). Ag, Cu, Pb, Zn, Sb, Bi, and Mo were analyzed using inductively coupled plasma mass spectrometry (ICP-MS). Sn was measured by emission spectrometry (ES), and As was determined via atomic fluorescence spectrometry (AFS).
One CRM was inserted per 50 samples. Recovery rates for all elements ranged from 90% to 110%, indicating satisfactory accuracy. Approximately 5% of samples were randomly selected for duplicate analysis. The relative deviation for most elements was less than 25%, demonstrating acceptable precision. Blanks were prepared and analyzed with each batch. All target elements in blanks were below the MDL, confirming negligible contamination.
As the collected geochemical data represent non-Euclidean spatial distributions, interpolation was required to generate gridded data for SR. Kriging interpolation was performed using Surfer11 software, employing circular domain search with an 8-unit-cell radius. The unit cell of data is 0.125 km × 0.125 km, and the total number of unit cells was 161,865 (297 × 545).

3.2. Constraints and Multiple Data Fusion

3.2.1. Topographic Features

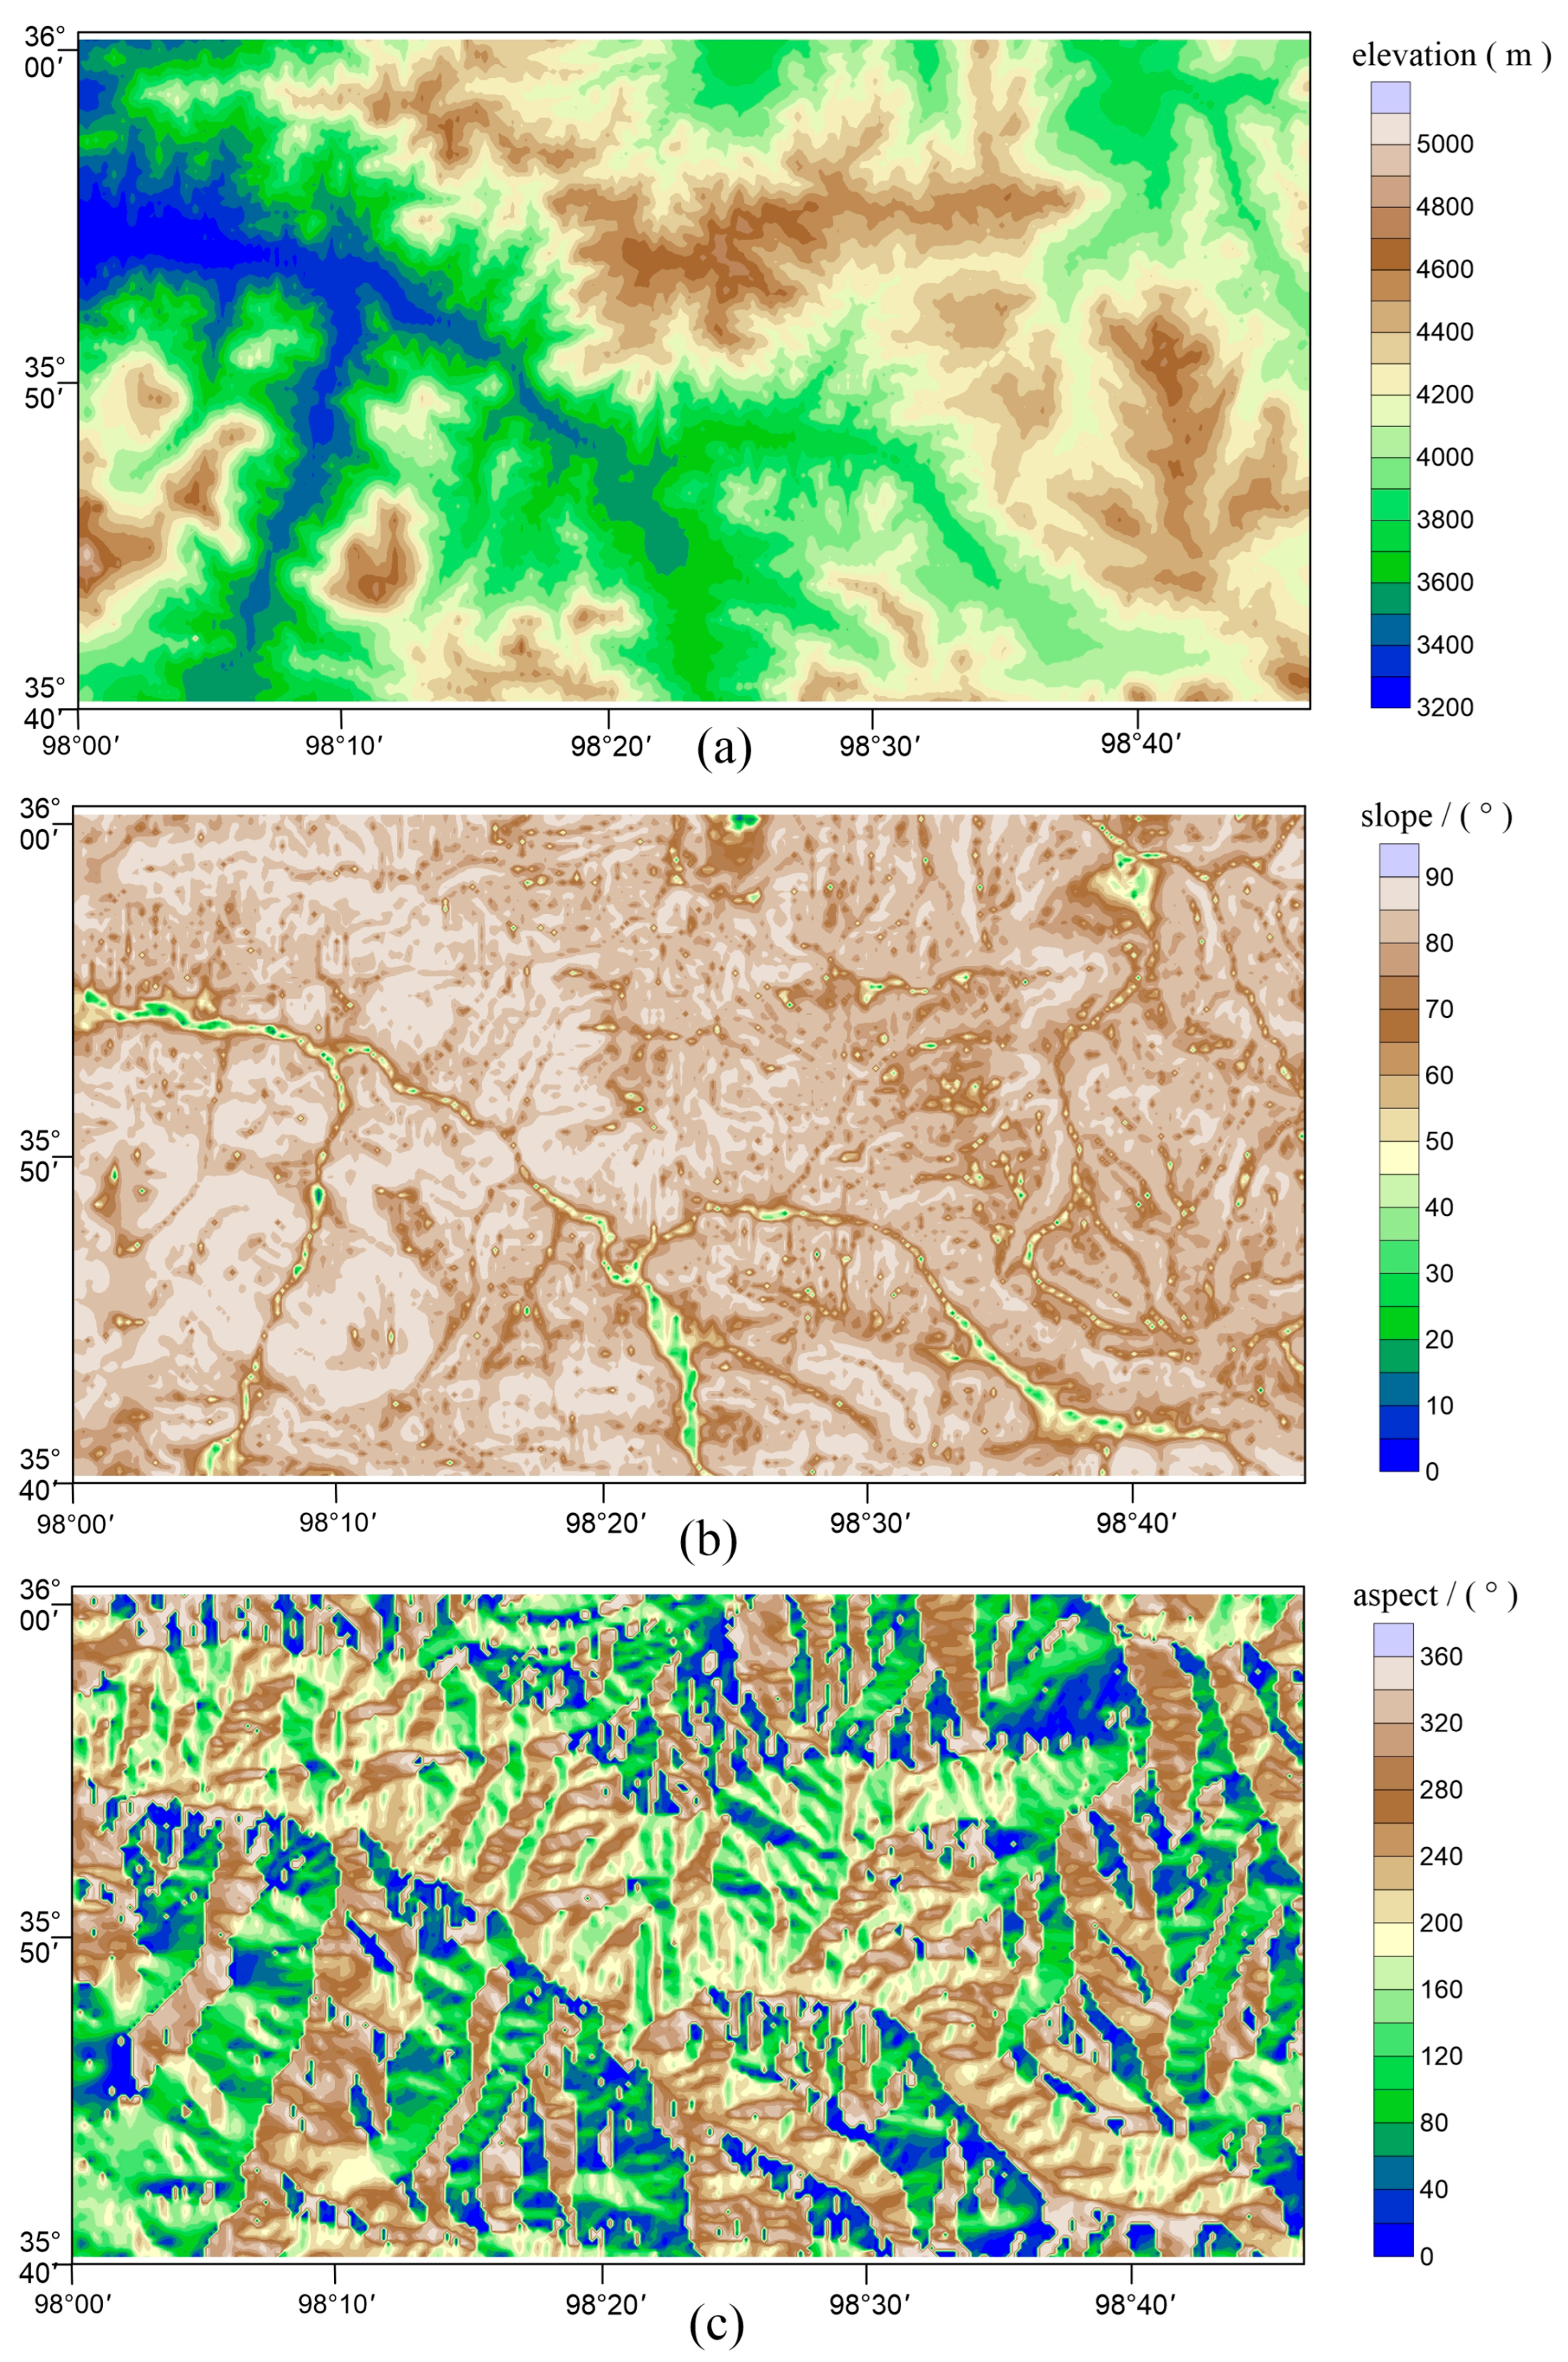
Geological systems exhibit high complexity, where topographic factors influence element flow and accumulation in sediments. Therefore, incorporating topographic factors is essential for SR. Three topographic features—elevation, slope, and aspect (Figure 3)—were derived from a 1:50,000-scale digital elevation model (DEM) of the study area. These features were subsequently integrated into the training model. Slope, defined as the tangent of the slope angle, quantifies surface steepness. Aspect refers to the slope’s azimuthal orientation, indicating the downhill direction of the terrain. Rather than treating sites as isolated points, the calculation of slope and aspect takes into account spatial dependencies by incorporating both sampling sites and their neighboring areas.

3.2.2. Geological Map Embedding

Stream sediments constitute integrated weathering products derived from bedrock across drainage basins, formed through combined physical erosion and chemical dissolution processes [8]. Bedrock lithology represents the primary control of stream sediment composition. However, this relationship is mediated by complex transport dynamics that preclude simple linear correlations. To capture these geological controls, we utilize geological maps that systematically document bedrock distributions [41]. Through vector embedding techniques, these geological qualitative representations are converted into numerical representations that can be used for computer analysis. The resulting vectorized geological constraints provide a robust framework for (1) investigating element distribution patterns across distinct geologic units and (2) significantly enhancing the spatial resolution of geochemical maps through advanced SR algorithms.
The geological map semantic vectorization process comprises five key steps, designed to transform geological maps into a suitable format for subsequent analysis. (1) Geological map gridding: The geological map was divided into unit cells of 0.125 × 0.125 km2, and the total number of unit cells was 161,865 (297 × 545). This grid scheme enables accurate alignment with geochemical maps. (2) Geological annotation: Thirteen different lithological types were identified by classifying each cell based on the underlying geological unit (see Figure 1). (3) Text corpus development: Geological reports and literature were compiled into a specialized corpus. Geological term embeddings were generated using Word2Vec’s Skip-gram architecture [42], configured with the following parameters: five-dimensional vectors, a minimum term frequency threshold of one, a context window size of five words, and five training iterations. Each geological entity was mapped to a 5D vector space using this method, which successfully encoded the semantic relationships between terms for further analysis. (4) Geological map embedding: Integrating the trained word vectors of geological entities with spatial unit divisions. We generated vectorized representations for each unit cell. (5) Data integration: Vectorized geological maps were spatially correlated with geochemical and topographic maps to constrain SR.

3.3. Data Division

To ensure model robustness and generalization capability, the dataset was partitioned and augmented based on spatial distribution and geological homogeneity, as detailed below:

3.3.1. Spatial Partitioning

Based on lithological units and geochemical anomaly distributions, the study area was divided into six subregions (labeled A-F in Figure 2). This partitioning strategy ensures each subregion contains representative lithological types (e.g., Jinshuikou Group, Triassic granite) while mitigating bias introduced by heterogeneous geological complexity.

3.3.2. Sample Generation

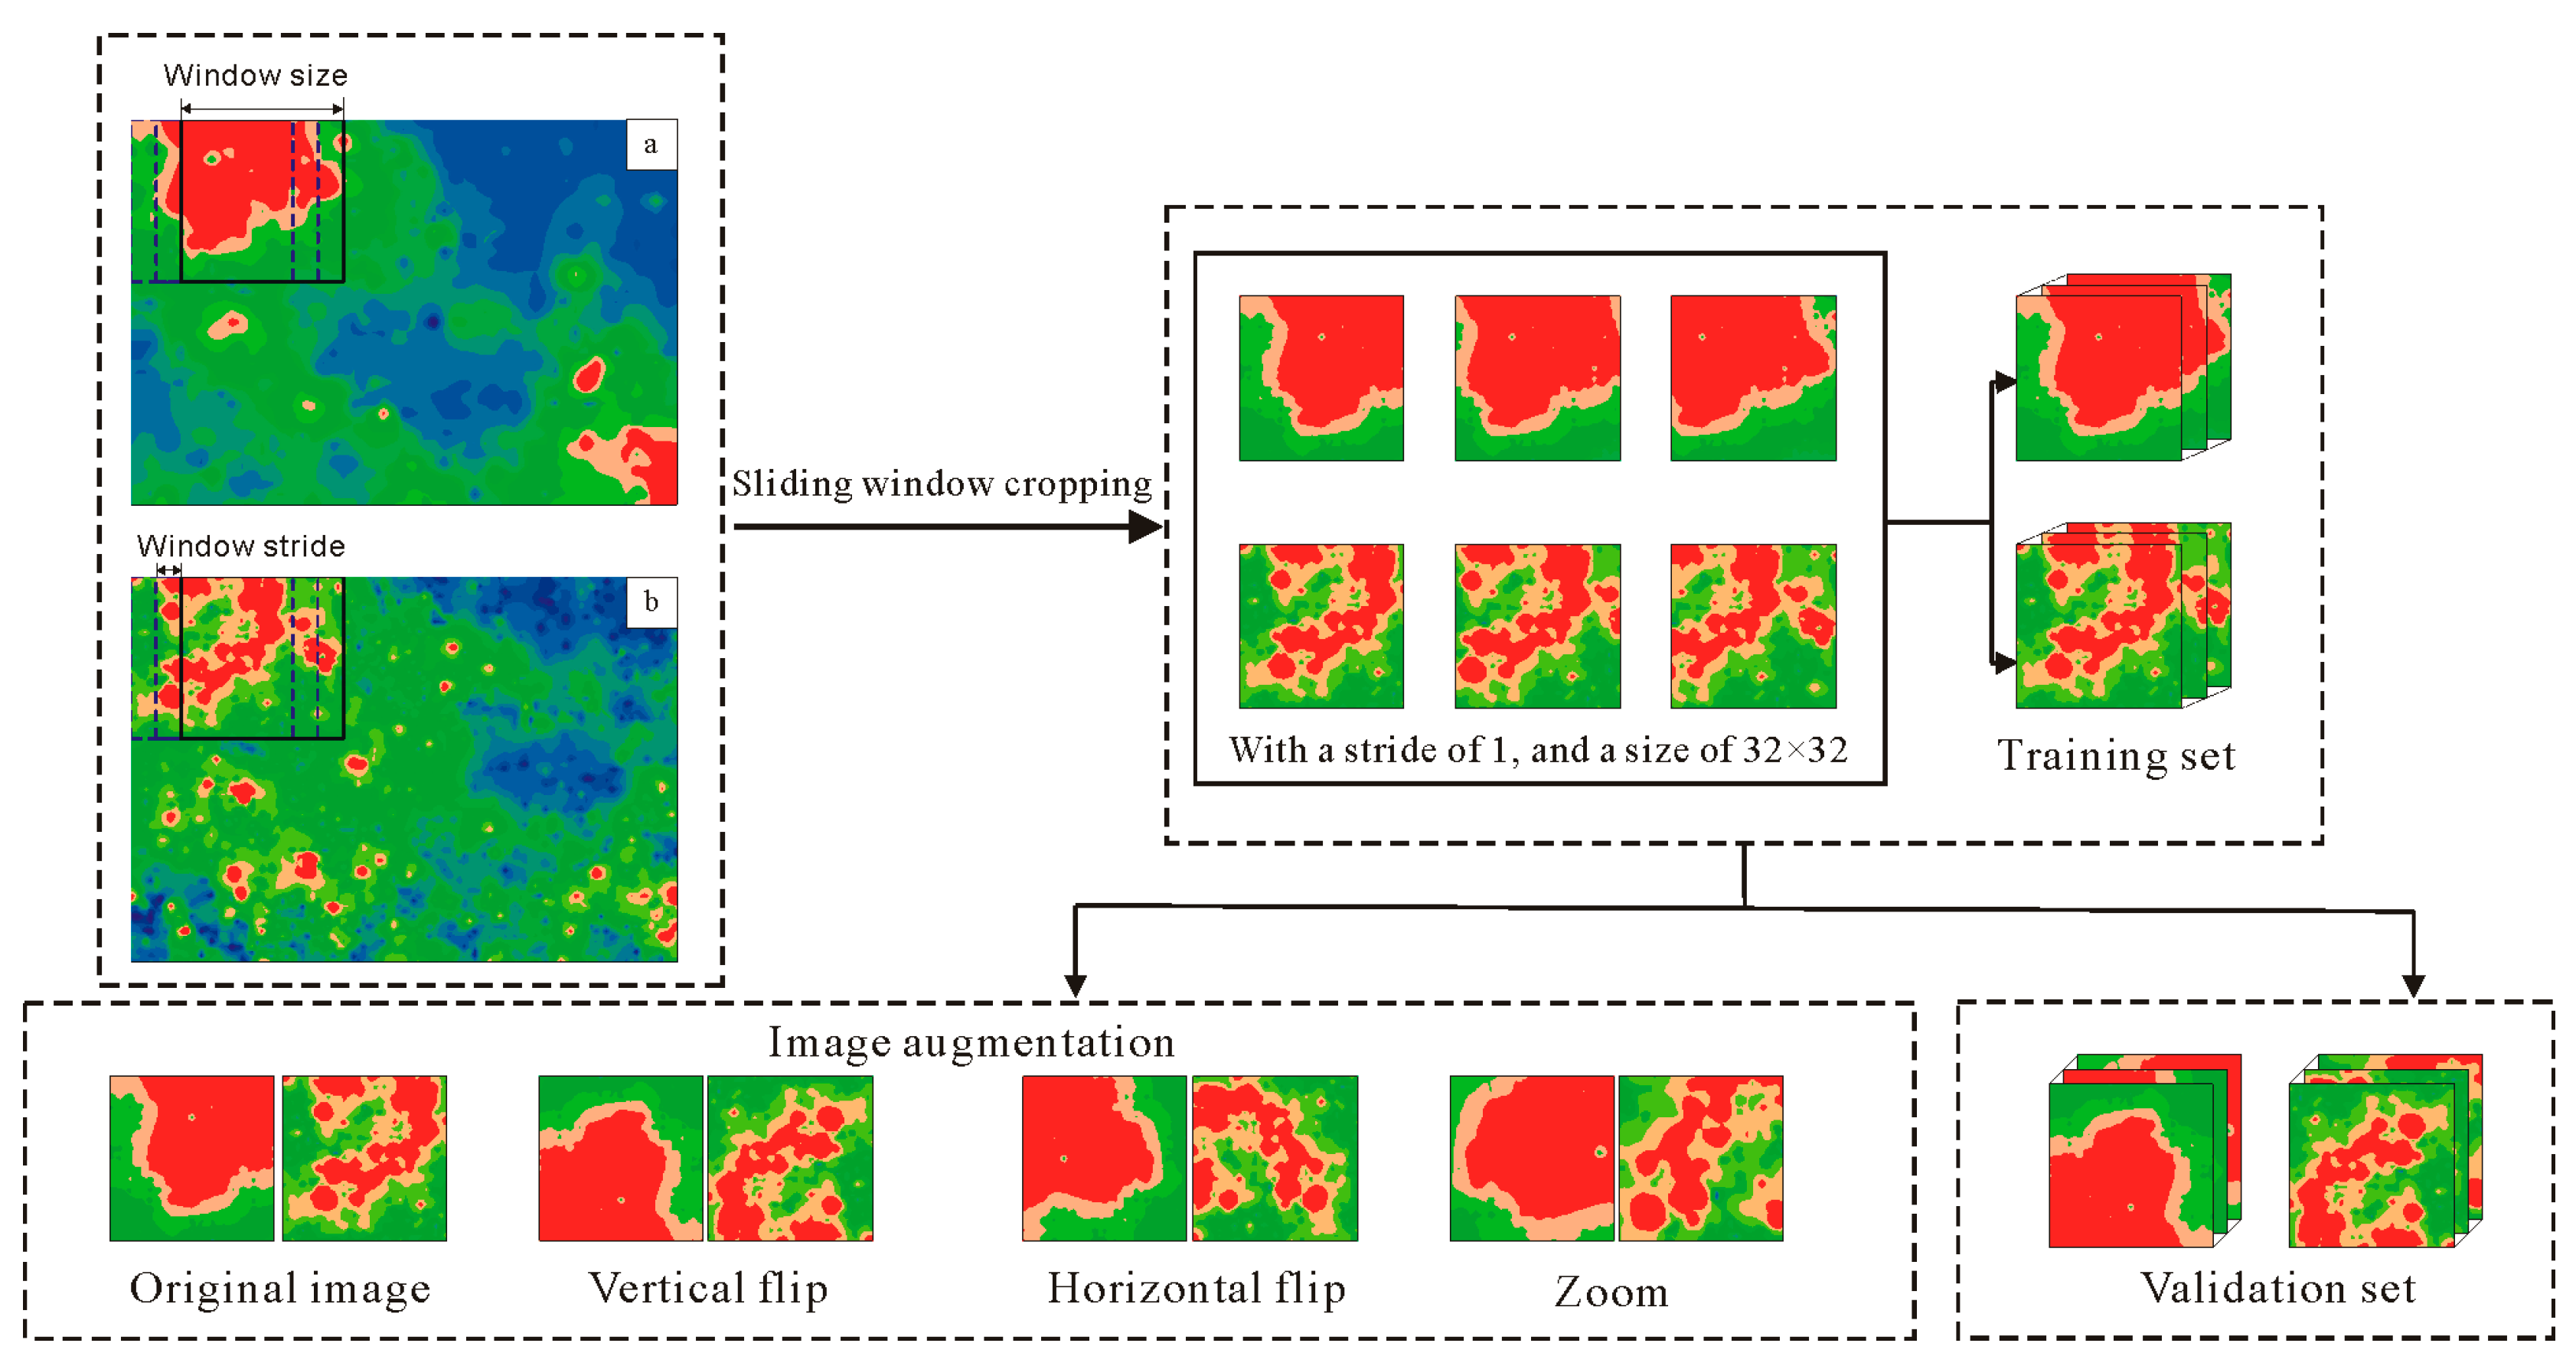
Samples were generated using a sliding window method on preprocessed gridded data (0.125 km × 0.125 km cell size). A window size of 32 × 32 pixels was adopted to match the input dimensions of the enhanced U-Net model, with a stride of 1 pixel to maximize spatial information utilization. Training and testing sets were randomly split in a 4:1 ratio.
Each sample pair consists of:
  • Input layer: 18 channels comprising ten 1:50,000-scale geochemical maps (As, Sb, Bi, Au, Ag, Cu, Pb, Zn, Sn, Mo), three topographic features (elevation, slope, aspect), and five vectorized geological map embeddings.
  • Output layer: Residual maps representing differences between 1:25,000 and 1:50,000 geochemical maps for all ten elements.

3.3.3. Data Augmentation

The following augmentation strategies were applied to the training set to reduce overfitting and enhance generalization (Figure 4). Random horizontal and vertical flipping (50% probability) was employed to eliminate directional bias in spatial patterns. Random scaling (80%–120% of original size) was applied to simulate variations in sampling density and spatial resolution.

3.4. Multi-Level U-Net

By adding more layers to the U-Net architecture and adding residual connections to improve network performance, we created a multi-level U-Net variant. For feature normalization, batch normalization (BN) was applied before the initial convolutional layer. The residual blocks, neural architecture, activation function, loss function, and evaluation metrics are described in detail in this section.

3.4.1. Network Structure

The U-Net architecture mainly comprises an encoder module, a decoder module, and skip-connection components [26]. Contextual information and hierarchical features are extracted by the encoder. The image is reconstructed to its original dimensions using the decoder. Skip connections integrate multi-scale feature representations by bridging corresponding encoder and decoder layers. For the geochemical map SR, we propose a multi-level U-Net with a dual-branch architecture (Figure 5), enhancing feature representation across scales. While deeper networks theoretically enhance representational capacity, practical training often encounters gradient vanishing and degradation issues that impair model performance. Residual blocks address gradient vanishing and network degradation issues in deep neural network training. Residual blocks use skip connections to lessen these problems [43].
The main branch of the multi-level U-net comprises four key components. (1) The encoder consists of four downsampling modules, each of which has two convolutions and a ReLU layer after them (Figure 6a). A convolution is applied in the skip connection to align channel dimensions as network depth increases. The four encoding stages employ 64, 128, 256, and 512 channels, respectively. (2) The bottleneck module bridges the encoder and decoder (Figure 6b). It includes two convolutions (each with ReLU) and a deconvolution. A deconvolution is integrated into the skip connection. (3) The decoder includes four upsampling modules, mirroring the encoder. Each upsampling module contains two convolutions (each with ReLU) and one deconvolution, as shown in Figure 6c. A convolution is applied to the skip connection. (4) A convolution adjusts channel dimensions before the final output. The final regression layer reconstructs the geochemical maps. This architecture preserves encoder-extracted features while progressively upsampling spatial information, achieving effective multi-scale feature fusion.
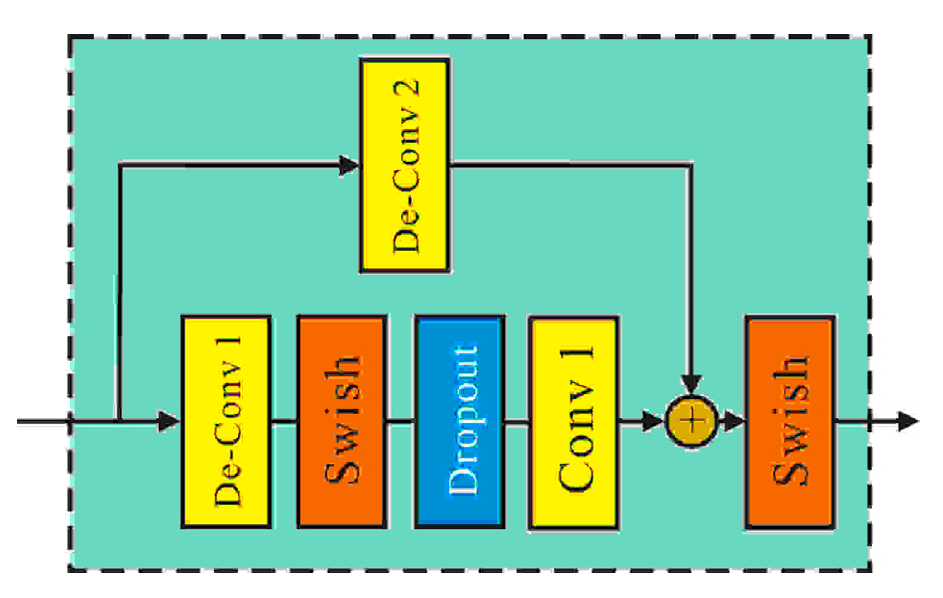
A separate branching section is introduced outside the main network and consists of two upsampling modules, each containing a deconvolution, a dropout layer, a convolution, and two Swish layers (Figure 7). To maximize performance, a deconvolution is incorporated into the skip connection of every module. Skip connections link the branch modules to corresponding layers in the first two downsampling modules of the main network (see Figure 5). This configuration yields a two-level U-Net architecture. The design improves model learning capabilities and enables richer feature representation by adding more upsampling, downsampling, and skip connections. Table 1 lists each step’s parameters and output size.

3.4.2. Activation Function

Activation functions introduce nonlinear mappings between inputs and outputs, allowing networks to learn complex representations. The ReLU, employed in both standard U-Net architectures and most variants, effectively mitigates the vanishing gradient problem. Compared to ReLU and other activation functions, Swish is a nonlinear, smooth, and non-saturating activation function that can improve the performance of some models [44]. We use Swish in the branch network. The formula of Swish is:
f ( x ) = x 1 + e x
Here, x denotes the neuron outputs from the preceding layer, while f(x) represents the activation function’s output.

3.4.3. Loss Function

The neural network optimizes its weight parameters under the direction of the loss function. Common loss functions include BCELoss, DiceLoss, and IoULoss [45,46]. For regression tasks with continuous outputs, we use the L2 loss function to optimize performance, which is defined as follows:
l o s s = 1 n i = 1 n ( x i y i ) 2
where n is the number of samples, xi is the input, and yi is the output. For the regression task, network training involves minimizing the loss function.

3.4.4. Evaluation Metrics

There are currently no established evaluation metrics for determining the SR of geochemical maps. In this paper, two objective evaluation metrics, Peak Signal-to-Noise Ratio (PSNR) and Structural Similarity index (SSIM), are employed to analyze the reconstruction effect [47,48]. PSNR is defined by the maximum possible pixel value (L) and the mean squared error (MSE) between the original and reconstructed images. For original and reconstructed images, PSNR is computed as:
P S N R = 10 · l g L 2 M S E
Superior reconstruction quality is indicated by higher PSNR values, which show fewer pixel-level differences between the original and reconstructed images. The SSIM quantifies image similarity by comparing luminance, contrast, and structural features. First proposed by the Laboratory for Image and Video Engineering at the University of Texas at Austin. SSIM evaluates perceptual image quality. The formula is presented below:
C l ( U , V ) = 2 μ U μ V + C 1 μ U 2 + μ V 2 + C 1
C c ( U , V ) = 2 μ U μ V + C 2 μ U 2 + μ V 2 + C 2
C s ( U , V ) = σ U V + C 3 σ U σ V + C 3
S S I M ( U , V ) = C l U , V × C c U , V × C s U , V
Here, Cl, Cc, and Cs represent the luminance, contrast, and structural comparisons, respectively. μU and μV denote the mean pixel intensities of the compared images. σU and σV indicate their standard deviations. σUV measures the covariance between them. C1, C2, and C3 are all constants. SSIM quantifies structural similarity, with values bounded in [0, 1]. Values nearer to 1 indicate superior reconstruction fidelity.

3.5. Workflow

(1) Logarithmic transformation is applied to LR geochemical data to mitigate uneven distribution and approximate a normal distribution. (2) The log-transformed data are interpolated to generate geochemical maps. These maps, along with elevation, slope, aspect, and embedded geologic maps of matching spatial resolution, serve as the model’s input layers. (3) The residual geochemical maps (Rij) are computed as the difference between the HR geochemical maps (Hij) and the LR geochemical maps (Lij). These residuals serve as the model output, enabling the learning of fine-scale information across different resolutions. The calculation follows:
Rij = HijLij (i = 1, 2, …, m; j = 1, 2, …, n)
The geochemical map is represented as an m × n matrix, where m denotes the number of rows and n the number of columns. (4) Min-max normalization is applied to the input layers to standardize the data range and eliminate scale discrepancies. (5) The input and output layers are cropped to regions A–F (Figure 2). A sliding window approach is adopted, with a window size of 32 × 32 pixels and a stride of 1. The dataset is then randomly divided into training and test sets at a 4:1 ratio. (6) The training set is used to train the model, and the test set is used to assess its performance. To enhance model robustness, data augmentation was employed, including random horizontal/vertical flipping and scaling of samples from regions A to F. (7) The trained model predicts the entire study area, generating a residual geochemical map. (8) The residual geochemical map is combined with the LR map via inverse transformation to reconstruct HR geochemical maps.

4. Results and Discussion

4.1. Two Density Geochemical Mapping Datasets

The statistical results of lithological unit samples from multi-scale datasets (Core Area at 1:25,000; Core Area at 1:50,000; Entire Area at 1:50,000) are presented in Table 2. These results reveal key characteristics of sample distribution in the study area and provide critical support for regional background value calculation and geochemical data interpretation. The results indicate that Triassic granodiorite and the Paleoproterozoic Jinshuikou Group represent the dominant lithological units across all datasets. These two lithologies are widely exposed throughout the study area with sufficient sample collection, adequately representing the overall characteristics of the regional geological background. In contrast, Permian quartz diorite and Carboniferous Haotelowa Formation are significantly underrepresented, resulting in high dispersion of geochemical data and consequently less reliable background values.
The mean concentrations of ten elements (As, Sb, Bi, Au, Ag, Cu, Pb, Zn, Sn, and Mo) in stream sediments from Gouli area served as local abundance values, which were compared with regional background values from Qinghai Province and the East Kunlun region (Table 3). The results demonstrate that at the 1:25,000 mapping scale, seven elements (Bi, Ag, Cu, Pb, Zn, Sn, and Mo) exhibit abundances exceeding the background values of Qinghai Province. At the 1:50,000 scale, only three elements (Ag, Pb, and Mo) show abundances higher than the background values of both Qinghai Province and the East Kunlun region. Within the core mapping area, element abundances obtained at the 1:25,000 scale are higher than those at the 1:50,000 scale for all elements except Sb and Au. This indicates that in the core mapping area, elements including Bi, Ag, Cu, Pb, Zn, Sn, and Mo are characterized by elevated background levels, with abundances significantly higher than the provincial average. Consequently, the study area, particularly the core area, exhibits greater potential for element enrichment and mineralization.
Analysis of the data in Table 3 reveals significant differences in Ag background values among stream sediments collected at different sampling densities. The observed differences can be attributed to two primary factors. First, the distribution of high-background geological bodies in the core area. Within the core area of the 1:25,000 scale geochemical mapping, the Jinshuikou Group, Triassic granodiorite, and Xiaomiao Formation are widely exposed. These lithological units exhibit significantly higher Ag background concentrations in stream sediments compared to the regional average. The concentrated distribution of these high-background lithological units directly elevates the overall Ag content in the 1:25,000 mapping area.
Second, differences in sampling density and spatial coverage. The 1:25,000 scale geochemical survey employed a sampling density four times greater than the 1:50,000 scale survey, with focused coverage on the high-background core area. In contrast, the 1:50,000 scale survey covered a broader area, including extensive low-background Ag regions such as non-mineralized sedimentary rock areas. The inclusion of low-background samples dilutes the overall Ag content, and the differential sampling strategies between the two scales further amplify the concentration disparities among sampling areas.
Analysis of Figure 8 reveals that element concentrations across the core geochemical mapping area exhibit statistically significant differences between the two scales, resulting from the combined effects of inherent spatial heterogeneity of elements and variations in sampling scale. These differences result from the combined effects of inherent spatial distribution characteristics of elements and sampling scale variations. The 1:25,000-scale mapping reveals broader concentration ranges, exhibiting lower minima and higher maxima. This reflects natural geochemical heterogeneity: increased sampling density enhances data dispersion and better resolves spatial variations. This principle underlies high-density sampling strategies for mineralized zone detection. Geochemical element distributions, controlled by mineralization and alteration processes, exhibit substantial spatial heterogeneity. Large-scale sampling (1:25,000) captures more localized high values, whereas medium-scale sampling (1:50,000) better reflects regional background conditions, resulting in significant differences between their mean values. The significant differences in element concentrations between scales, confirmed by ANOVA [49], directly demonstrate how spatial resolution determines anomaly detection capability, rather than indicating data quality issues or random errors.
Additionally, the original dataset exhibits substantial variance along with the presence of outliers. These outliers can adversely affect DL models by introducing bias during training, thereby reducing both their ability to learn normal data patterns and their predictive accuracy on new data. Therefore, we applied logarithmic transformation to the raw data during the model input phase. This transformation mitigates the influence of outliers to some extent (Figure 8b). This approach enables the model to focus more effectively on fundamental data patterns and general trends during training, facilitating the development of more robust models that better capture underlying data relationships.

4.2. Geochemical Patterns from Different Sampling Densities

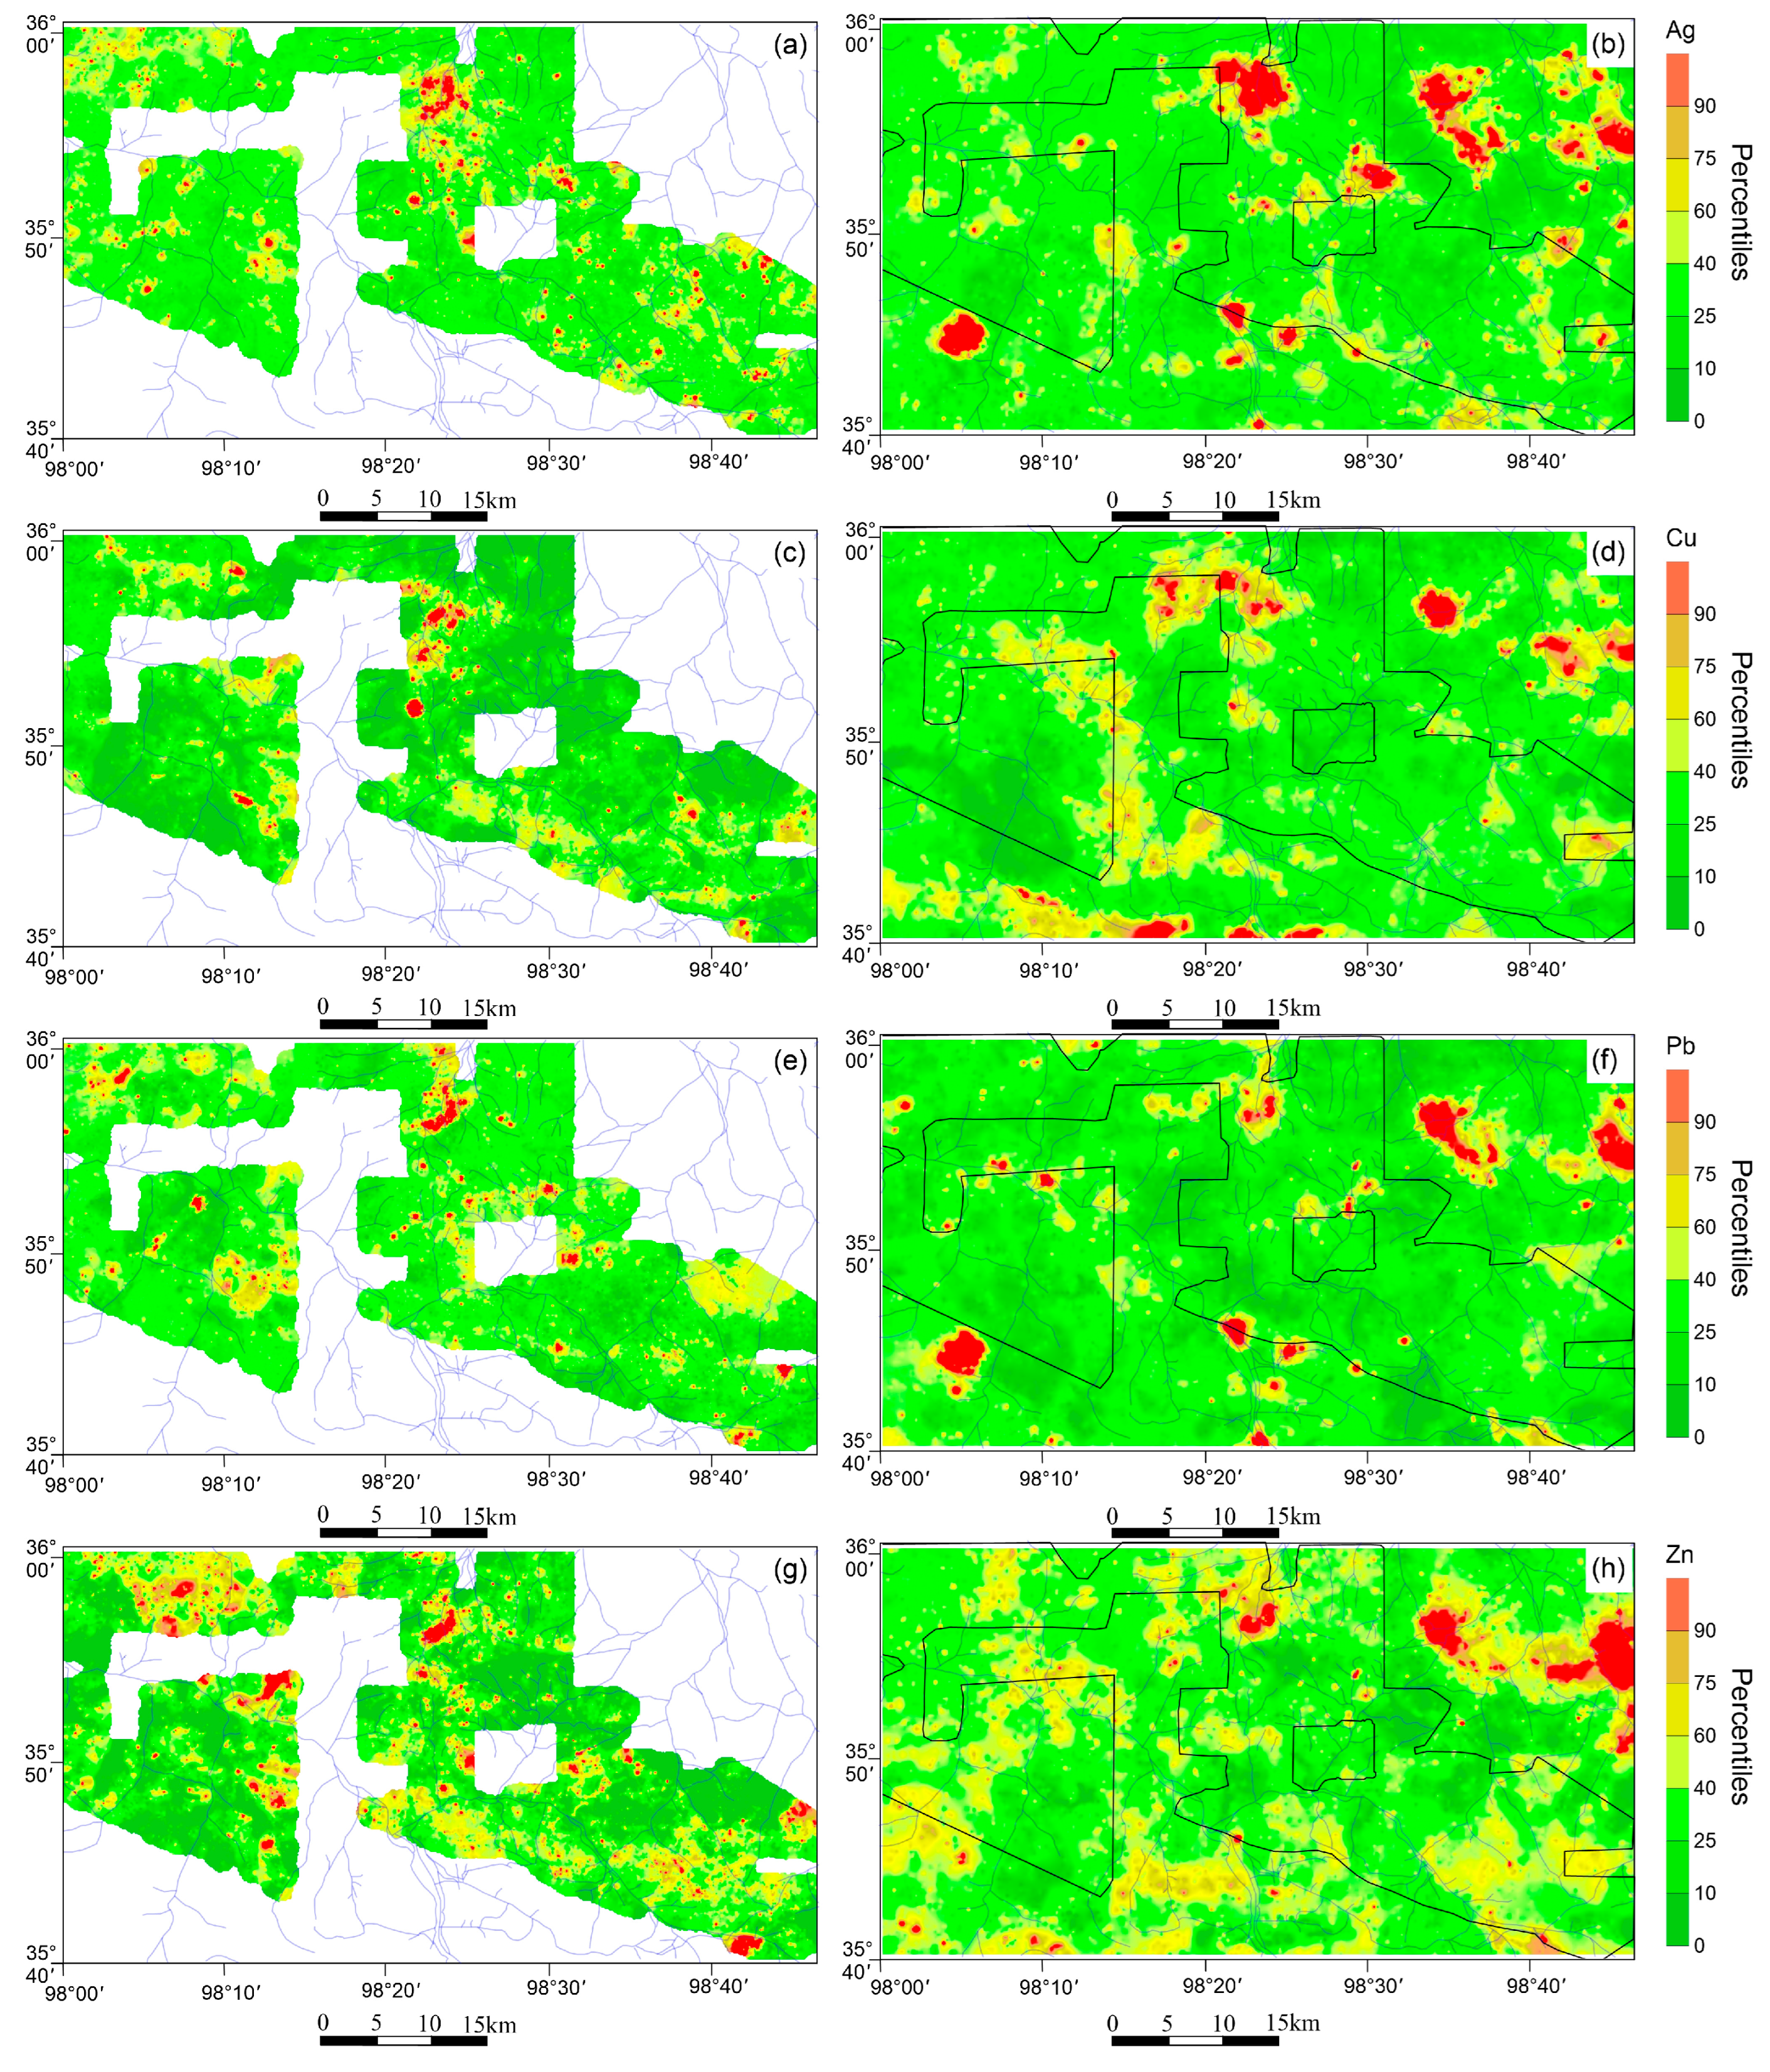
Our study generated geochemical maps for ten elements at varying sampling densities. Figure 9 presents geochemical maps for Ag, Cu, Zn, and Ni. These maps show similar geochemical patterns across sampling densities, which is consistent with earlier research conducted in a variety of landscapes, such as plains, hills, savannas, and the Gobi Desert [50,51,52].
As observed in Figure 9, low-density mapping yields stable and traceable geochemical patterns, while high-density mapping resolves geochemical anomalies with greater refinement and richer details. Therefore, using high-density geochemical maps as constraints to enhance the resolution of low-density maps provides a rapid and cost-effective approach, which can guide subsequent mineral exploration and reduce exploration risks.

4.3. Geological Map Embedding Results

Following the semantic vectorization workflow described in the Methods section, geological information was successfully transformed into quantitative representations. The vector encoding results of geological terms (Table 4) provide a semantic foundation for subsequent spatial unit vectorization, while the resulting vectorized representation of grid cells (Figure 10) visually demonstrates the spatial distribution patterns of geological features.
During the geological term embedding phase, the 5-dimensional vectors generated by the Word2Vec model not only facilitate numerical representation of geological entities but also precisely encode semantic relationships between terms through vector spatial relations. Based on vector data from Table 4, the cosine similarity [53] between Triassic granite and Triassic granodiorite—both acidic intrusive rocks—reaches 0.92, which aligns closely with their shared geological origin as products of magmatic intrusion. Meanwhile, the vector similarity of 0.89 between Triassic granodiorite and Carboniferous granodiorite—similar in lithology but from different periods—accurately reflects their genetic relationship through consanguineous magmatism despite temporal separation.
Further analysis reveals a vector similarity of 0.98 between the Paleoproterozoic Jinshuikou Group and Carboniferous Halagole Formation, reflecting their spatial superposition relationship as regional metamorphic basement and overlying sedimentary strata. While a similarity of 0.97 between Silurian granodiorite and Ordovician tonalite suggests continuity of Early Paleozoic magmatic activity. This effective semantic encoding establishes a reliable foundational vector library for subsequent quantification of geological characteristics in grid units, enabling effective correlation analysis of geological entities from different periods and origins through numerical vectors.

4.4. Experiments

This approach improved sample diversity and generated a final dataset containing 376,541 sample pairs. The optimal hyperparameters used in the experiment are shown in Table 5.
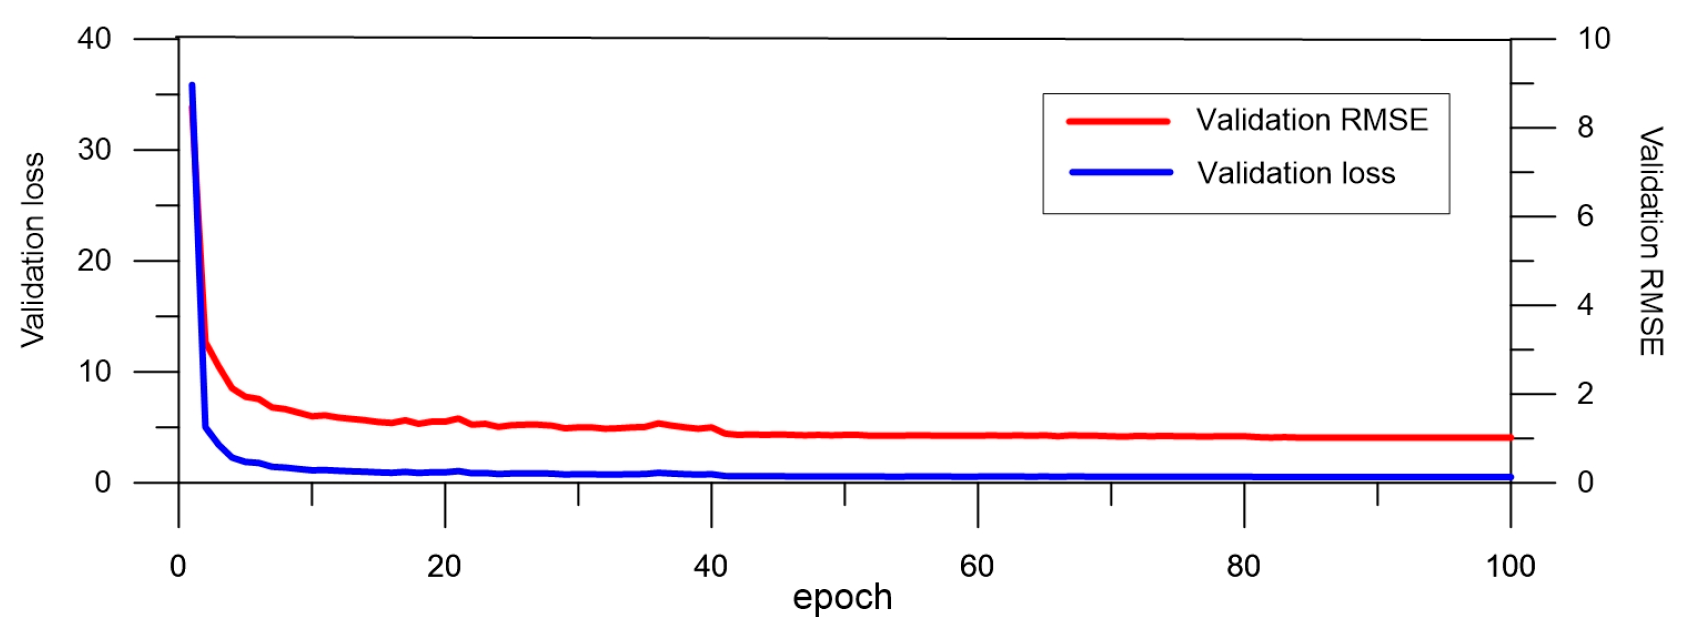
After training, the loss function and root mean squared error (RMSE) of the proposed method on the test set are shown in Figure 11. As the iteration count increases, both the loss and RMSE values on the test set exhibit a decreasing trend before eventually converging.
To evaluate the SR performance, we compared our method with SRCNN, VDSR, and U-Net [26,32,54]. Quantitative comparison was performed using both mean and peak values of PSNR and SSIM metrics in the area of the study region covered by both scales. As shown in Table 6, our method achieves the highest PSNR and SSIM scores. The residual blocks optimize feature propagation, while residual-supervised learning employs residual geochemical maps as training targets to enhance high-frequency detail learning. All of these components work together to preserve network trainability while increasing reconstruction accuracy. Compared to other methods, our network demonstrates superior multi-scale feature extraction from geochemical maps, with accuracy improving proportionally with additional constraints.
Cross plots comparing HR images with our model’s reconstructed SR images, along with their R2 values, are shown in Figure 12. These plots reveal a strong correlation between the HR and SR images in these regions (R2 > 0.8).

4.5. Geochemical Map Reconstruction

The trained model was applied to reconstruct HR geochemical maps across the entire study area. As shown in Figure 13, Figure 14, Figure 15 and Figure 16 for Ag, Cu, Pb, and Zn, the reconstructed HR maps exhibit superior detail resolution compared to their LR counterparts, demonstrating the applicability of SR for geochemical mapping in the Gouli area, Qinghai Province.
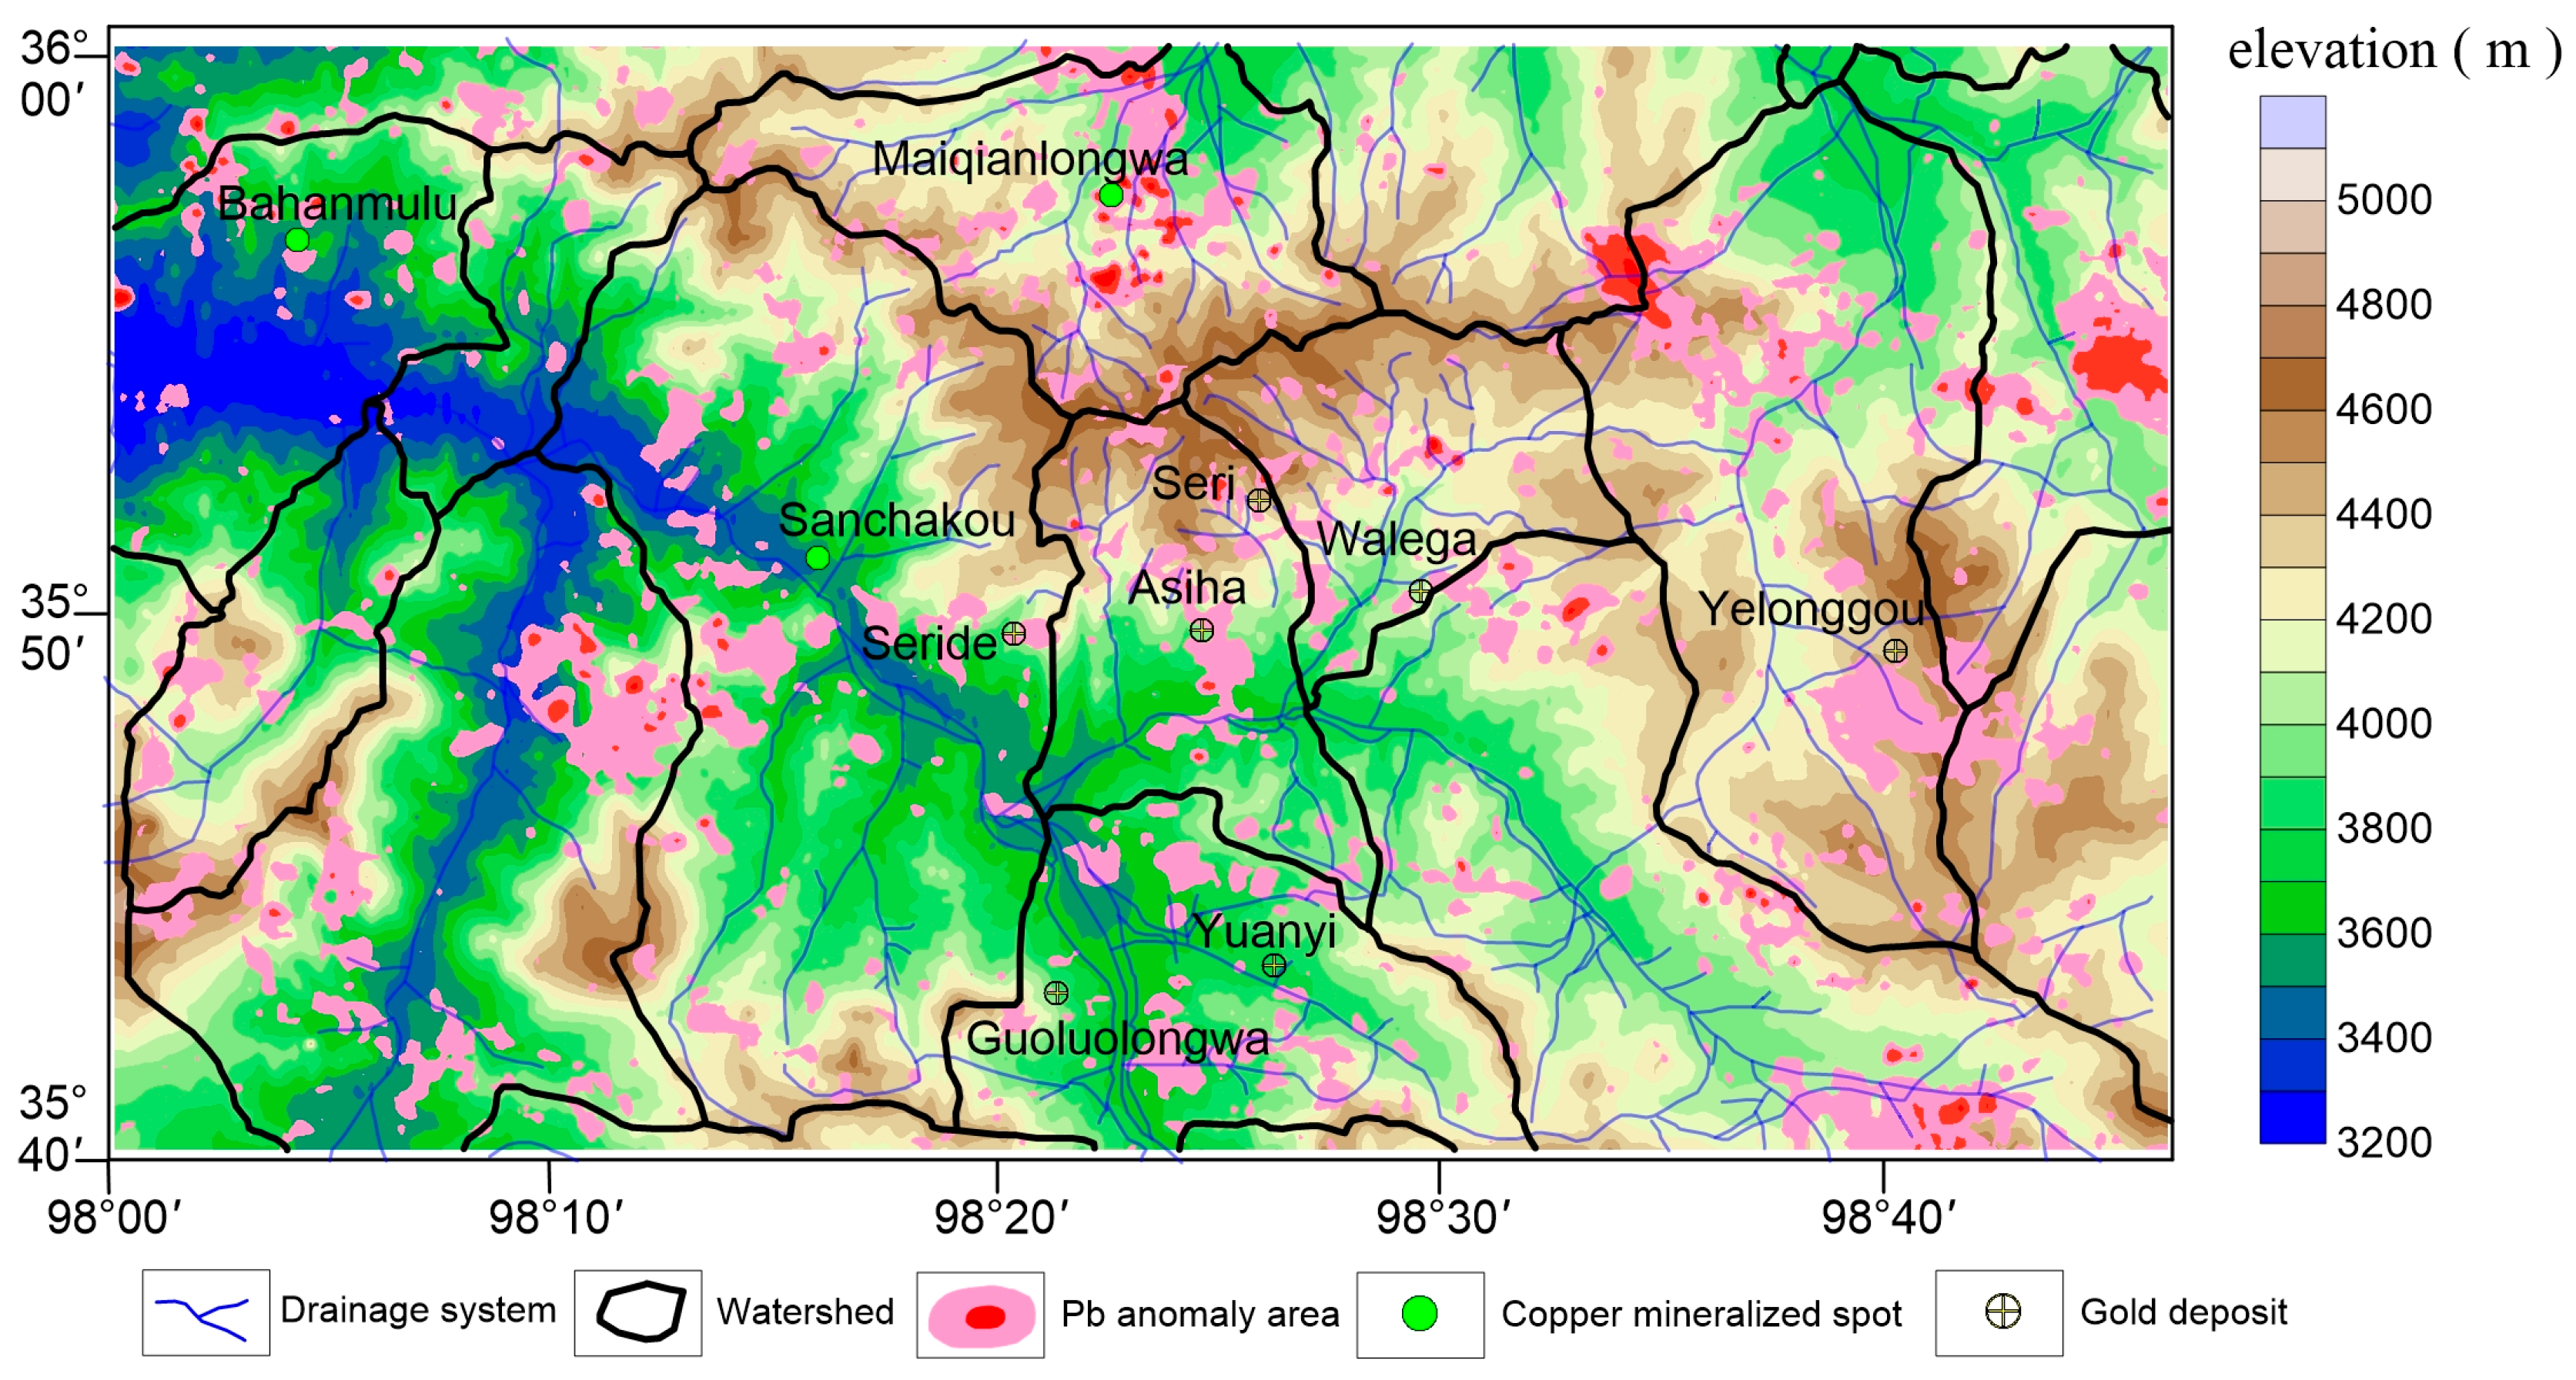
To further validate the migration patterns of elements in stream sediments and enhance the interpretation of anomalous structures in the reconstructed HR maps, Pb geochemical anomalies were extracted from the HR Pb map using the Universal Kriging method [22]. Figure 17 integrates three key data layers to elucidate the distribution details and dominant patterns of Pb: (1) Locations of known copper mineralization spots and gold deposits, revealing the spatial correlation between Pb anomalies and mineralized bodies; (2) The main drainage systems and elevation data, visualizing the hydrological transport pathways of Pb-rich sediments; (3) Delineated catchment basins based on elevation data, clarifying the intra-basin migration patterns of elements.
This multi-layered analysis reveals several geologically significant patterns. First, concentrated Pb anomaly clusters are identified around known mineralization sites (e.g., the Maituolongwa copper spot, and Asiha, Seri, Yelonggou, and Walega gold deposits), confirming a non-random Pb distribution and its spatial consistency with mineralization. Second, Pb anomalies adjacent to these known sites exhibit a clear downhill migration trend from high mountains to low-altitude valleys, reflecting the hydrological transport of Pb-rich sediments within the catchment systems. Third, although the number of known mineralization sites in the study area is limited—particularly for Pb-Zn deposit types, which are most directly associated with Pb anomalies—the geochemical pattern maps nonetheless demonstrate significant value for identifying high-potential mineralization areas based on these anomalies. This is especially critical in regions with low geological survey intensity.
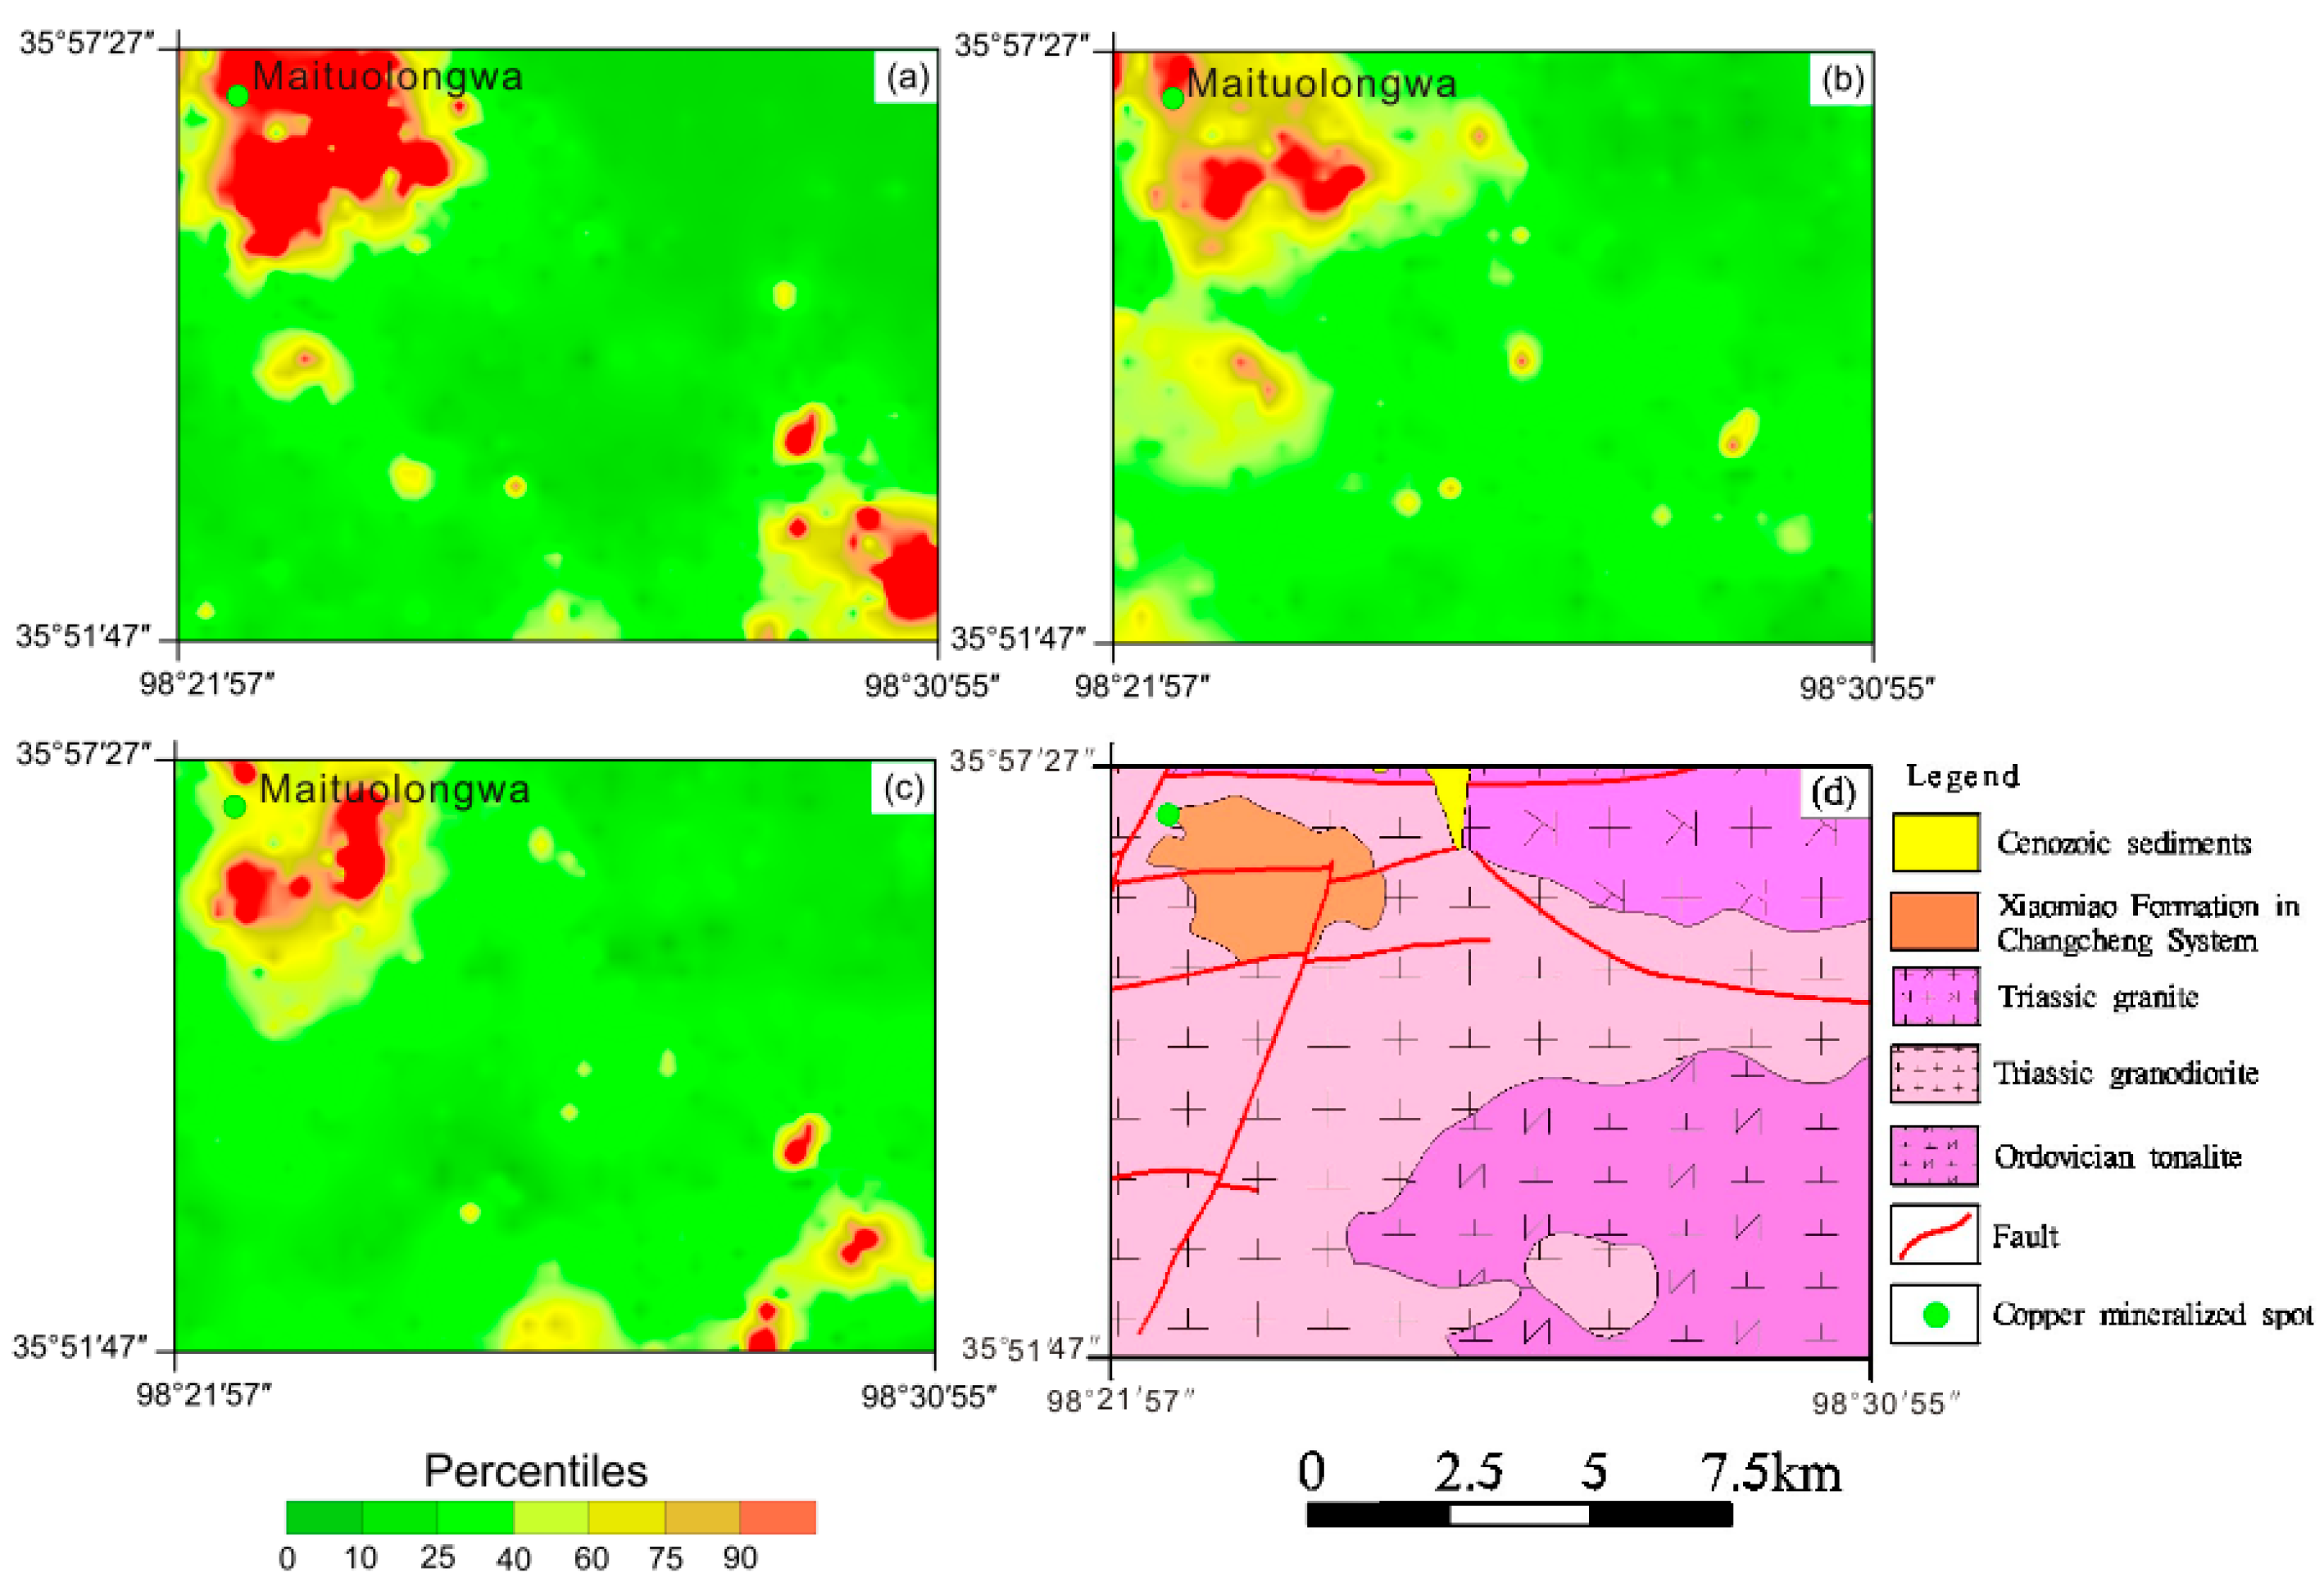
Two areas (Maituolongwa and Sanchakou) in Figure 16 were selected for detailed analysis. By comparing pre- and post-reconstruction geochemical maps, we elucidate the relationship between element distribution patterns and bedrock background values. In the Maituolongwa area, the exposed strata primarily consist of the Xiaomiao Formation of the Changcheng System. Intrusive rocks include Late Ordovician tonalite, Late Triassic granodiorite, and granite (Figure 18). These intrusive rocks show intrusive contact relationships with the Xiaomiao Formation. Brittle fault structures are well-developed in the area, predominantly trending east–west and northeast. The area shows good spatial coincidence of geochemical anomalies, with multiple concentration centers characterized by Ag-Cu-Pb elemental associations. Skarn-type mineralization represents the most promising exploration target in this area. Field investigation revealed a skarn zone at the Maituolongwa mineralization site in the northwestern study area, occurring at the contact between Late Triassic granodiorite and the Xiaomiao Formation. This skarn zone contains metallic minerals including chalcopyrite, sphalerite, and galena, serving as a key exploration indicator for the region.
A comparison of geochemical anomaly patterns for Ag, Cu, and Pb elements before and after reconstruction is presented in Figure 18 and Figure 19. The figures reveal that Ag geochemical anomalies delineated by different sampling densities exhibit similar morphology and variation trends, with their concentration centers largely coinciding. However, the reconstructed 1:25,000-scale geochemical maps resolve the anomalies observed in the 1:50,000-scale maps into multiple smaller regional anomalies. Compared to the 1:50,000-scale maps, anomalies in the 1:25,000-scale maps predominantly distribute in annular patterns along the intrusive contact between Early Permian granodiorite and the Xiaomiao Formation of the Changcheng System. Additionally, the HR 1:25,000-scale maps reveal anomalies not detected in the 1:50,000-scale mapping.
Comparative analysis of the Sanchakou copper mineralization site (Figure 20) demonstrates that despite the absence of 1:25,000-scale training data for this area, the reconstructed 1:25,000-scale geochemical map still exhibits significant advantages. The exposed lithological units in this area consist primarily of muscovite-quartz schist from the Jinshuikou Group and Triassic granodiorite. Chalcopyrite mineralization occurs mainly within the muscovite-quartz schist, with chalcopyrite being the dominant ore mineral. As shown in Figure 20, the reconstructed 1:25,000-scale geochemical map shows generally consistent patterns and variation trends with the 1:50,000-scale map. However, the former displays smaller individual anomaly areas and higher spatial correlation between concentration centers and known mineralization sites. This advantage results not only from higher sampling density but also highlights the effectiveness of integrating topographic and geological information for learning in the absence of direct training data. The reconstructed geochemical map effectively mitigate the anomaly displacement issues caused by elemental dispersion along drainage systems due to sparse sampling in 1:50,000-scale mapping. This fully demonstrates the technical superiority of the proposed reconstruction method in precisely capturing mineralization information and enhancing geochemical map resolution.
Higher sampling density in geochemical mapping results in greater data dispersion, indicating increased local heterogeneity of element distribution. This local heterogeneity enables detailed variation characterization through denser sampling, establishing a foundation for progressive mineralization tracing. These cases demonstrate that DL can extract detailed information from multi-scale geochemical maps. The reconstructed maps not only identify regional anomalies but also detect spatially dispersed, small-scale local mineralization anomalies, providing enhanced clarity in detailed anomaly characterization.

5. Conclusions

In mineral exploration, enhancing the resolution of geochemical maps and accurately extracting mineralization information remain critical challenges. To address this, we developed a DL framework based on an enhanced U-Net architecture for the Gouli area in Qinghai Province, China. By integrating residual learning and multi-scale feature extraction techniques, our method successfully achieves SR of stream sediment geochemical maps from 1:50,000 to 1:25,000 scale.
Experimental results demonstrate the superiority of our approach. The proposed method outperforms SRCNN, VDSR, and standard U-Net models in both PSNR and SSIM metrics. The reconstructed HR geochemical maps show significantly enhanced detail clarity, enabling effective detection of subtle anomalies missed in LR maps and more precise characterization of local elemental heterogeneity. For instance, in areas like Maixiulongwa and Sanchakou, the reconstructed maps show stronger correlation with known Ag, Cu, and Pb mineralization zones, providing more reliable guidance for exploration targeting.
Further analysis reveals that integrating topographic features (elevation, slope, aspect) with geological map embeddings significantly enhances model generalization, improving PSNR and SSIM by 10%–15% compared to constraint-free models while maintaining strong spatial correlation with original HR data. Both quantitative and qualitative analyses confirm that our framework can robustly reconstruct HR geochemical maps from LR inputs, offering a cost-effective approach for obtaining high-precision geochemical data. As geochemical data volumes continue to grow, the accuracy of this SR method is expected to improve further. Its application value in mineral exploration, geological structure analysis, and environmental evolution studies will become increasingly prominent, better demonstrating the advantages of big data applications in geochemistry.

Author Contributions

Conceptualization, Y.P.; Methodology, Y.P. and Y.W.; Software, Y.P.; Validation, Y.W., X.L. and T.G.; Formal analysis, S.W.; Investigation, X.Z.; Data curation, Y.W.; Writing—original draft preparation, Y.P.; Writing—review and editing, Y.P. and Y.W.; Visuali-zation, Y.P. and Y.W.; Supervision, T.G.; funding acquisition, T.G. All authors have read and agreed to the published version of the manuscript.

Funding

This research was funded by National Key Research and Development Program of China (Grant No. 2023YFC2906903), Liaoning Provincial Science and Technology Plan Project (Grant No. 2024-MSLH-486), Jilin Provincial Department of Education Scientific Research Project (Grant No. JJKH20241291KJ), China Geological Survey Project (Grant No. DD20230256), and the College Students’ Innovative Entrepreneurial Training Plan Program (Grant No. S202410183515).

Data Availability Statement

Data will be made available on request.

Acknowledgments

The authors would like to thank Lin-fu Xue and the reviewers for their valuable comments, which significantly improved the manuscript.

Conflicts of Interest

Author Xiaolong Li was employed by the company Jilin Branch of China National Geological Exploration Center of Building Materials Industry. Author Tie Gao was employed by the company Shenyang Center of China Geological Survey. The remaining authors declare that the research was conducted in the absence of any commercial or financial relationships that could be construed as a potential conflict of interest.

References

  1. Doherty, M.E.; Arndt, K.; Chang, Z.S.; Kelley, K.; Lavin, O. Stream sediment geochemistry in mineral exploration: A review of fine-fraction, clay-fraction, bulk leach gold, heavy mineral concentrate and indicator mineral chemistry. Geochem. Explor. Environ. Anal. 2023, 23, geochem2022-039. [Google Scholar] [CrossRef]
  2. Liu, B.; Cui, X.; Wang, X. The Delineation of Copper Geochemical Blocks and the Identification of Ore-Related Anomalies Using Singularity Analysis of Stream Sediment Geochemical Data in the Middle and Lower Reaches of the Yangtze River and Its Adjacent Areas, China. Minerals 2023, 13, 1397. [Google Scholar] [CrossRef]
  3. Zhao, G.X.; He, F.Q.; Dai, X.F.; Zhang, S.R.; Yu, R.G. Ultra-low density geochemical mapping in Zimbabwe. J. Geochem. Explor. 2014, 144, 552–571. [Google Scholar] [CrossRef]
  4. Liu, D.S.; Wang, X.Q.; Nie, L.S.; Liu, H.L.; Zhang, B.M.; Wang, W. Comparison of geochemical patterns from different sampling density geochemical mapping in Altay, Xinjiang Province, China. J. Geochem. Explor. 2021, 228, 106761. [Google Scholar] [CrossRef]
  5. Smith, D.B.; Reimann, C. Low-density geochemical mapping and the robustness of geochemical patterns. Geochem. Explor. Environ. Anal. 2008, 8, 219–227. [Google Scholar] [CrossRef]
  6. Reimann, C.; Ladenberger, A.; Birke, M.; de Caritat, P. Low density geochemical mapping and mineral exploration: Application of the mineral system concept. Geochem. Explor. Environ. Anal. 2016, 16, 48–61. [Google Scholar] [CrossRef]
  7. Alijagic, J.; Sajn, R. Predicting the Spatial Distributions of Elements in Former Military Operation Area Using Linear and Nonlinear Methods Across the Stavnja Valley, Bosnia and Herzegovina. Minerals 2020, 10, 120. [Google Scholar] [CrossRef]
  8. Sajn, R.; Halamic, J.; Peh, Z.; Galovic, L.; Alijagic, J. Assessment of the natural and anthropogenic sources of chemical elements in alluvial soils from the Drava River using multivariate statistical methods. J. Geochem. Explor. 2011, 110, 278–289. [Google Scholar] [CrossRef]
  9. Reimann, C.; Garrett, R.G. Geochemical background—Concept and reality. Sci. Total Environ. 2005, 350, 12–27. [Google Scholar] [CrossRef]
  10. Cheng, Q.M. Multifractality and spatial statistics. Comput. Geosci. 1999, 25, 949–961. [Google Scholar] [CrossRef]
  11. Cheng, Q.; Xia, Q.; Li, W.; Zhang, S.; Chen, Z.; Zuo, R.; Wang, W. Density/area power-law models for separating multi-scale anomalies of ore and toxic elements in stream sediments in Gejiu mineral district, Yunnan Province, China. Biogeosciences 2010, 7, 3019–3025. [Google Scholar] [CrossRef]
  12. Shokouh Saljoughi, B.; Hezarkhani, A. Identification of geochemical anomalies associated with Cu mineralization by applying spectrum-area multi-fractal and wavelet neural network methods in Shahr-e-Babak mining area, Kerman, Iran. J. Min. Environ. 2019, 10, 49–73. [Google Scholar] [CrossRef]
  13. Zuo, R.G.; Wang, J.; Xiong, Y.H.; Wang, Z.Y. The processing methods of geochemical exploration data: Past, present, and future. Appl. Geochem. 2021, 132, 105072. [Google Scholar] [CrossRef]
  14. Yaisamut, O.; Xie, S.; Charusiri, P.; Dong, J.; Wen, W. Prediction of Au-Associated Minerals in Eastern Thailand Based on Stream Sediment Geochemical Data Analysis by S-A Multifractal Model. Minerals 2023, 13, 1297. [Google Scholar] [CrossRef]
  15. He, Y.Y.; Zhou, Y.; Wen, T.; Zhang, S.; Huang, F.; Zou, X.Y.; Ma, X.G.; Zhu, Y.Q. A review of machine learning in geochemistry and cosmochemistry: Method improvements and applications. Appl. Geochem. 2022, 140, 105273. [Google Scholar] [CrossRef]
  16. Huang, J.Y.; Wu, C.F.; Minasny, B.; Roudier, P.; McBratney, A.B. Unravelling scale- and location-specific variations in soil properties using the 2-dimensional empirical mode decomposition. Geoderma 2017, 307, 139–149. [Google Scholar] [CrossRef]
  17. Yu, X.T.; Xiao, F.; Zhou, Y.Z.; Wang, Y.; Wang, K.Q. Application of hierarchical clustering, singularity mapping, and Kohonen neural network to identify Ag-Au-Pb-Zn polymetallic mineralization associated geochemical anomaly in Pangxidong district. J. Geochem. Explor. 2019, 203, 87–95. [Google Scholar] [CrossRef]
  18. He, J.X.; Chen, D.B.; Zhan, Y.; Ren, X.Y.; Li, Q.Y. A retrieval model of surface geochemistry composition based on remotely sensed data. Open Geosci. 2023, 15, 20220514. [Google Scholar] [CrossRef]
  19. Pothina, R.; Ganguli, R. Contextual Representation in NLP to Improve Success in Accident Classification of Mine Safety Narratives. Minerals 2023, 13, 770. [Google Scholar] [CrossRef]
  20. Cao, L.B. A New Age of AI: Features and Futures. IEEE Intell. Syst. 2022, 37, 25–37. [Google Scholar] [CrossRef]
  21. Sun, T.; Feng, M.; Pu, W.B.; Liu, Y.; Chen, F.; Zhang, H.W.; Huang, J.Q.; Mao, L.T.; Wang, Z.Q. Fractal-Based Multi-Criteria Feature Selection to Enhance Predictive Capability of AI-Driven Mineral Prospectivity Mapping. Fractal Fract. 2024, 8, 224. [Google Scholar] [CrossRef]
  22. Sajn, R.; Stafilov, T.; Balabanova, B.; Alijagic, J. Multi-Scale Application of Advanced ANN-MLP Model for Increasing the Large-Scale Improvement of Digital Data Visualisation Due to Anomalous Lithogenic and Anthropogenic Elements Distribution. Minerals 2022, 12, 174. [Google Scholar] [CrossRef]
  23. Pradhan, B.; Jena, R.; Talukdar, D.; Mohanty, M.; Sahu, B.K.; Raul, A.K.; Maulud, K.N.A. A New Method to Evaluate Gold Mineralisation-Potential Mapping Using Deep Learning and an Explainable Artificial Intelligence (XAI) Model. Remote Sens. 2022, 14, 4486. [Google Scholar] [CrossRef]
  24. Duan, J.L.; Liu, Y.P.; Zhu, L.X.; Ma, S.M.; Gong, Q.L.; Dolgopolova, A.; Ludwig, S.A. Delineation of Integrated Anomaly with Generative Adversarial Networks and Deep Neural Networks in the Zhaojikou Pb-Zn Ore District, Southeast China. Acta Geol. Sin. 2023, 97, 1252–1267. [Google Scholar] [CrossRef]
  25. Hoseinzade, Z.; Bazoobandi, M.H. Deep embedded clustering: Delineating multivariate geochemical anomalies in the Feizabad region. Geochemistry 2024, 84, 126208. [Google Scholar] [CrossRef]
  26. Ronneberger, O.; Fischer, P.; Brox, T. U-Net: Convolutional Networks for Biomedical Image Segmentation. In Medical Image Computing and Computer-Assisted Intervention—MICCAI 2015, 18th International Conference, Munich, Germany, 5–9 October 2015; Springer International Publishing: Cham, Switzerland, 2015; Volume 9351, pp. 234–241. [Google Scholar] [CrossRef]
  27. Han, N.; Zhou, L.; Xie, Z.M.; Zheng, J.L.; Zhang, L.X. Multi-level U-net network for image super-resolution reconstruction. Displays 2022, 73, 102192. [Google Scholar] [CrossRef]
  28. Bavandsavadkoohi, M.; Cedou, M.; Blouin, M.; Gloaguen, E.; Tirdad, S.; Giroux, B. High-resolution aeromagnetic map through Adapted-SRGAN: A case study in Québec, Canada. Comput. Geosci. 2023, 176, 105363. [Google Scholar] [CrossRef]
  29. Farsiu, S.; Robinson, D.; Elad, M.; Milanfar, P. Advances and challenges in Super-Resolution. Int. J. Imaging Syst. Technol. 2004, 14, 47–57. [Google Scholar] [CrossRef]
  30. Zhang, P.; Zhu, S.; Wang, C.T.; Zhao, Y.P.; Lam, E.Y. Neuromorphic Imaging with Super-Resolution. IEEE Trans. Circuits Syst. Video Technol. 2025, 35, 1715–1727. [Google Scholar] [CrossRef]
  31. Wang, X.Y.; Hu, Q.; Cheng, Y.S.; Ma, J.Y. Hyperspectral Image Super-Resolution Meets Deep Learning: A Survey and Perspective. IEEE/CAA J. Autom. Sin. 2023, 10, 1668–1691. [Google Scholar] [CrossRef]
  32. Dong, C.; Loy, C.C.; He, K.M.; Tang, X.O. Image Super-Resolution Using Deep Convolutional Networks. IEEE Trans. Pattern Anal. Mach. Intell. 2016, 38, 295–307. [Google Scholar] [CrossRef]
  33. Zheng, Y.Z.; Liu, P.; Qian, L.; Qin, S.Q.; Liu, X.Y.; Ma, Y.; Cheng, G.J. Recognition and Depth Estimation of Ships Based on Binocular Stereo Vision. J. Mar. Sci. Eng. 2022, 10, 1153. [Google Scholar] [CrossRef]
  34. Song, X.G.; Pang, X.C.; Zhang, L.; Lu, X.F.; Hei, X.H. Single image super-resolution with lightweight multi-scale dilated attention network. Appl. Soft Comput. 2025, 169, 112569. [Google Scholar] [CrossRef]
  35. Zhang, J.; Shao, M.H.; Yu, L.L.; Li, Y.S. Image super-resolution reconstruction based on sparse representation and deep learning. Signal Process. Image Commun. 2020, 87, 115925. [Google Scholar] [CrossRef]
  36. Zhang, Y.L.; Li, K.P.; Li, K.; Wang, L.C.; Zhong, B.N.; Fu, Y. Image Super-Resolution Using Very Deep Residual Channel Attention Networks. In Proceedings of the European Conference on Computer Vision (ECCV), Munich, Germany, 8–14 September 2018; Volume 11211, pp. 294–310. [Google Scholar] [CrossRef]
  37. Huang, F.; Li, Y.X.; Ye, X.J.; Wu, J. Infrared Image Super-Resolution Network Utilizing the Enhanced Transformer and U-Net. Sensors 2024, 24, 4686. [Google Scholar] [CrossRef]
  38. Chen, D.J.; Wei, J.H.; Wang, W.H.; Shi, W.J.; Li, H.; Zhan, X.F. Comparison of Methods for Determining the Thresholds of Geochemical Anomalies and the Prospecting Direction-A Case of Gold Deposits in the Gouli Exploration Area, Qinghai Province. Minerals 2019, 9, 368. [Google Scholar] [CrossRef]
  39. Dong, J.E.; Wang, P.; Li, H.; Zhang, H.Q.; Zhao, M.F.; Tong, H.K.; Yu, X.L.; Li, J.; Zhang, B.S. Study of the Genesis Process and Deep Prospecting Breakthrough in the Gouli Ore Concentration of the East Kunlun Metallogenic Belt Using Audio Magne-totelluric Data. Minerals 2024, 14, 930. [Google Scholar] [CrossRef]
  40. Chen, J.J.; Wei, J.H.; Fu, L.B.; Li, H.; Zhou, H.Z.; Zhao, X.; Zhan, X.F.; Tan, J. Multiple sources of the Early Mesozoic Gouli batholith, Eastern Kunlun Orogenic Belt, northern Tibetan Plateau: Linking continental crustal growth with oceanic subduction. Lithos 2017, 292, 161–178. [Google Scholar] [CrossRef]
  41. Patra, C.; Giri, D.; Nandi, S.; Das, A.K.; Alenazi, M.J.F. Phishing email detection using vector similarity search leveraging transformer-based word embedding. Comput. Electr. Eng. 2025, 124, 110403. [Google Scholar] [CrossRef]
  42. Wang, J.; Zhao, C.Q.; He, S.M.; Gu, Y.; Alfarraj, O.; Abugabah, A. LogUAD: Log Unsupervised Anomaly Detection Based on Word2Vec. Comput. Syst. Sci. Eng. 2022, 41, 1207–1222. [Google Scholar] [CrossRef]
  43. Shafiq, M.; Gu, Z.Q. Deep Residual Learning for Image Recognition: A Survey. Appl. Sci. 2022, 12, 8972. [Google Scholar] [CrossRef]
  44. Pan, T.Y.; Yang, G.Y.; Zhao, J.L.; Ding, J.Y. Smoothing Piecewise Linear Activation Functions Based on Mollified Square Root Functions. Math. Found. Comput. 2024, 7, 578–601. [Google Scholar] [CrossRef]
  45. Chahkoutahi, F.; Khashei, M.; Molaverdi, N. Loss functions in classification: An comprehensive overview and comparative study. Appl. Soft Comput. 2025, 184, 113778. [Google Scholar] [CrossRef]
  46. Xu, K.P.; Zhang, Y.Y.; Yu, W.X.; Zhang, Z.Q.; Lu, J.W.; Fan, Y.B.; He, G.; Yang, Z. Segmentation of Building Footprints with Xception and Iouloss. In Proceedings of the 2019 IEEE International Conference on Multimedia & Expo Workshops (ICMEW), Shanghai, China, 8–12 July 2019; pp. 420–425. [Google Scholar] [CrossRef]
  47. Korhonen, J.; You, J.Y. Peak Signal-to-Noise Ratio Revisited: Is Simple Beautiful? In Proceedings of the 2012 Fourth International Workshop on Quality of Multimedia Experience, Melbourne, VIC, Australia, 5–7 July 2012; pp. 37–38. [Google Scholar]
  48. Li, Y.C.; Zhang, Y.; Jia, D.Y.; Gao, S.; Zhang, M.Q. Noise Impact Analysis in Computer-Generated Holography Based on Dual Metrics Evaluation via Peak Signal-to-Noise Ratio and Structural Similarity Index Measure. Appl. Sci. 2025, 15, 6047. [Google Scholar] [CrossRef]
  49. Abdel-Latif, H.M.R.; Khalil, R.H.; Soliman, A.A.; Gewaily, M.S.; Amer, A.A.; Dawood, M.; Chaklader, M.R. Enhanced growth, antioxidant responses and resilience to induced by supplementation in Liza ramada. Aquaculture 2026, 612, 743163. [Google Scholar] [CrossRef]
  50. Xie, X.; Cheng, H. The suitability of floodplain sediment as a global sampling medium: Evidence from China. J. Geochem. Explor. 1997, 58, 51–62. [Google Scholar] [CrossRef]
  51. Cao, J.F.; Li, W.Y.; Isokov, M.; Movlanov, J.; Mirkhamdamov, M.; Ma, Z.P.; Weng, K.; Cao, K.; Meng, G.L. Distribution, enrichment characteristics and prospecting potential of lithium in Uzbekistan: Insights from 1:1 million geochemical mapping. J. Geochem. Explor. 2025, 268, 107606. [Google Scholar] [CrossRef]
  52. Birke, M.; Rauch, U.; Stummeyer, J. How robust are geochemical patterns? A comparison of low and high sample density geochemical mapping in Germany. J. Geochem. Explor. 2015, 154, 105–128. [Google Scholar] [CrossRef]
  53. Trivedi, A.; Sivanesan, S. Leveraging cosine similarity for stock trend prediction with options chain data and piecewise linear encoding. Comput. Electr. Eng. 2025, 127, 110565. [Google Scholar] [CrossRef]
  54. Kim, J.; Lee, J.K.; Lee, K.M. Accurate image super-resolution using very deep convolutional networks. In Proceedings of the IEEE Conference on Computer Vision and Pattern Recognition, Las Vegas, NV, USA, 27–30 June 2016; pp. 1646–1654. [Google Scholar] [CrossRef]
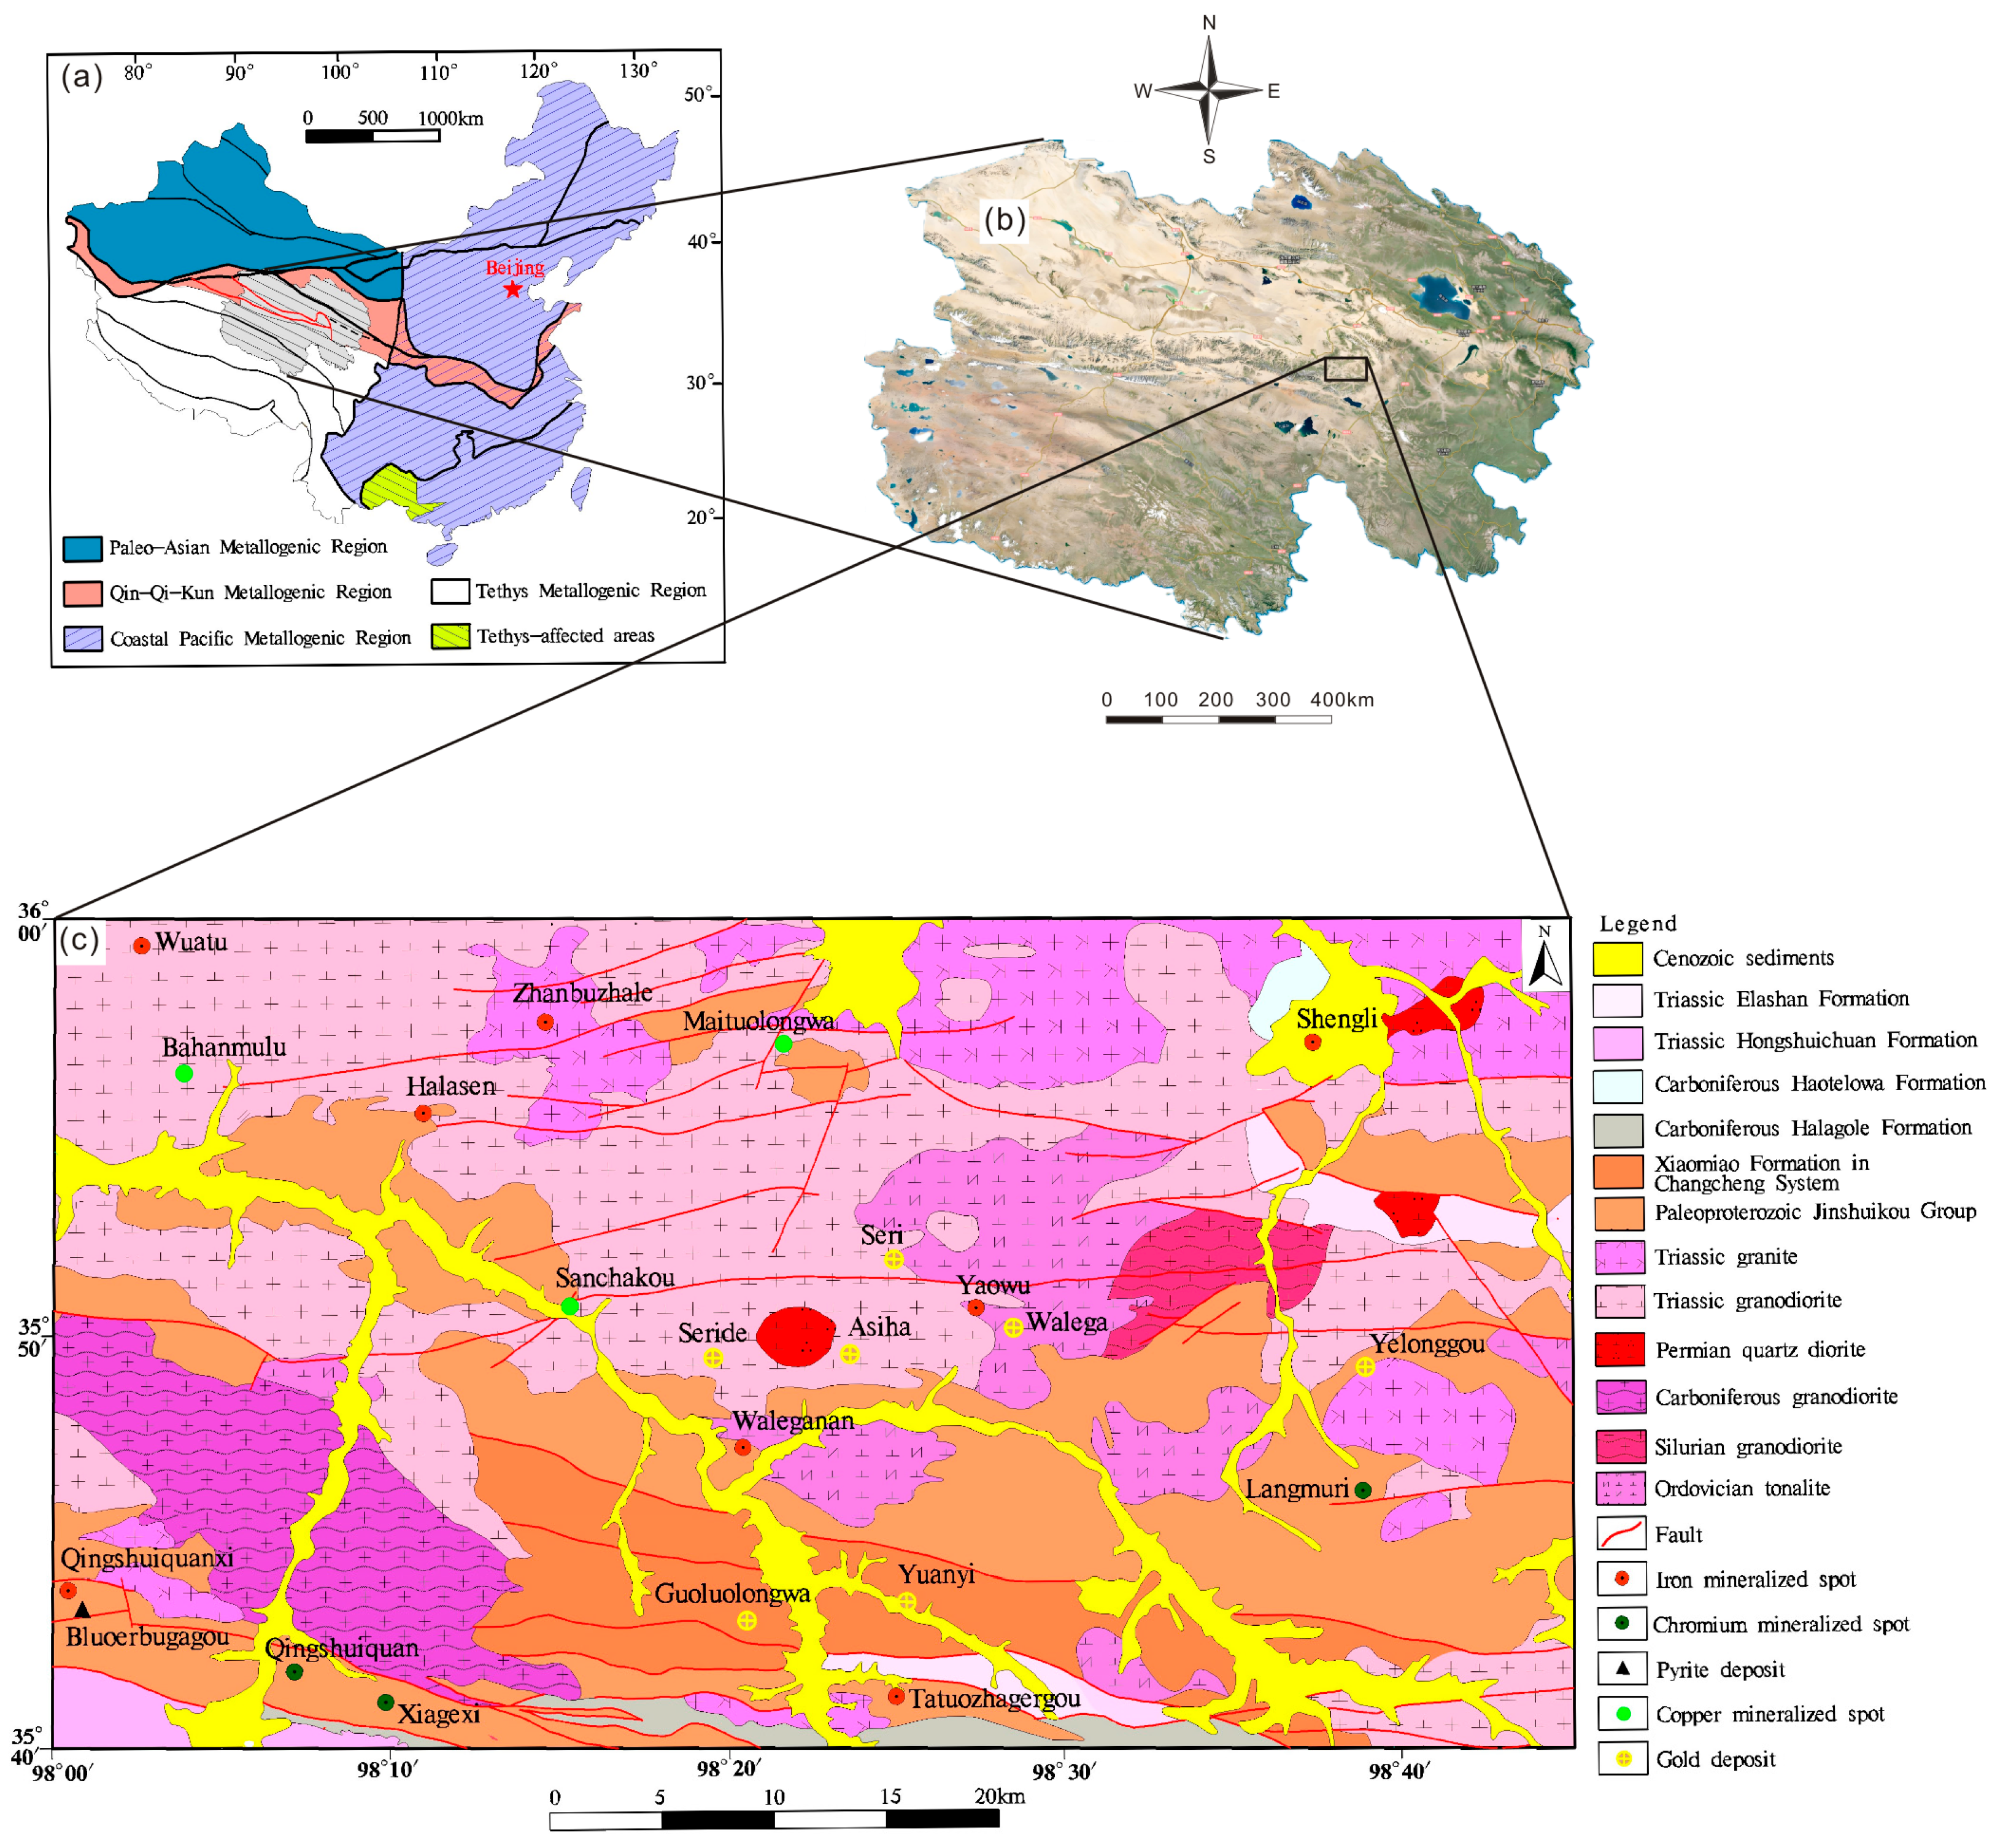
Figure 1. Geological map of the studied area. (a) The landscape zoning map of China (adapted from [38]). (b) Map of Qinghai Province showing the location of the Gouli area. (c) Regional geological map of the Gouli area.
Minerals 15 01088 g001
Figure 2. The geochemical sampling location map of the study area. (a) Sampling point distribution of the whole study area, where A–F are the model training areas and G–I are the model validation areas. (b) The sampling points in area H. (c) The sampling points in area G. In the figures, blue lines represent water systems (streams, gullies), red dots represent sampling points for 1:50,000 geochemical mapping, and blue dots represent sampling points for 1:25,000 geochemical mapping.
Minerals 15 01088 g002
Figure 3. Topographic feature extraction: (a) elevation, (b) slope, and (c) aspect.
Minerals 15 01088 g003
Figure 4. Dataset production. (a) 1:50,000 geochemical maps. (b) 1:25,000 geochemical maps.
Minerals 15 01088 g004
Figure 5. Multi-level U-net network structure.
Minerals 15 01088 g005
Figure 6. (a) Downsampling module. (b) Bridging module. (c) Upsampling module.
Minerals 15 01088 g006
Figure 7. Residual unit used in the branch network.
Minerals 15 01088 g007
Figure 8. Analysis of Variance Plot of Element Contents in Geochemical Data at Different Scales: (a) Raw data. (b) Logarithmically transformed data. Note: significance markers (* p < 0.05, ** p < 0.01, *** p < 0.001).
Minerals 15 01088 g008
Figure 9. (ah) The comparison of geochemical maps for different sampling densities. The first column shows the 1:25,000 scale geochemical maps, and the second column shows the 1:50,000 scale geochemical maps. Black boxes delineate the core area of the 1:25,000-scale geochemical mapping in each panel.
Minerals 15 01088 g009
Figure 10. Geological map embedding results.
Minerals 15 01088 g010
Figure 11. Loss function and RMSE curves for the test set.
Minerals 15 01088 g011
Figure 12. Cross-plot comparison between HR and SR images generated by the proposed method. (ac) are the images of G, H, and I in Figure 2, respectively.
Minerals 15 01088 g012
Figure 13. Ag geochemical maps. (a) SR geochemical map. (b) LR geochemical map.
Minerals 15 01088 g013
Figure 14. Cu geochemical maps. (a) SR geochemical map. (b) LR geochemical map.
Minerals 15 01088 g014
Figure 15. Pb geochemical maps. (a) SR geochemical map. (b) LR geochemical map.
Minerals 15 01088 g015
Figure 16. Zn geochemical maps. (a) SR geochemical map. (b) LR geochemical map.
Minerals 15 01088 g016
Figure 17. Pb geochemical anomalies extracted by universal kriging. Pink areas represent Pb anomalies > mean + 1σ, and red areas > mean + 2σ.
Minerals 15 01088 g017
Figure 18. Analysis map of reconstructed 1:25,000 scale geochemical anomalies in the Maituolongwa area. (a) Ag, (b) Cu, (c) Pb, (d) Geologic map.
Minerals 15 01088 g018
Figure 19. Analysis map of 1:50,000 scale geochemical anomalies in the Maituolongwa area. (a) Ag, (b) Cu, (c) Pb, (d) Geologic map.
Minerals 15 01088 g019
Figure 20. Comparison of Cu anomalies obtained with different sampling densities in the Sanchakou area. (a) 1:25,000 scale geochemical map; (b) 1:50,000 scale reconstructed geochemical map; (c) geological map.
Minerals 15 01088 g020
Table 1. The network structure of the enhanced U-net.
Unit LevelConv LayerFilterStrideOutput Size
Input Batchnorm 32 × 32 × 18
Downsampling moduleLevel 1Conv 13 × 3/64132 × 32 × 64
Conv 23 × 3/64132 × 32 × 64
Conv 31 × 1/64132 × 32 × 64
Level 2Conv 11 × 1/128216 × 16 × 128
Conv 23 × 3/128116 × 16 × 128
Conv 31 × 1/128216 × 16 × 128
Level 3Conv 11 × 1/25628 × 8 × 256
Conv 23 × 3/25618 × 8 × 256
Conv 31 × 1/25628 × 8 × 256
Level 4Conv 11 × 1/51224 × 4 × 512
Conv 23 × 3/51214 × 4 × 512
Conv 31 × 1/51224 × 4 × 512
Bottleneck moduleLevel 5Conv 11 × 1/102422 × 2 × 1024
Conv 23 × 3/102412 × 2 × 1024
De-Conv 12 × 2/51224 × 4 × 512
Conv 31 × 1/51214 × 4 × 512
Upsampling moduleLevel 6Conv 13 × 3/51214 × 4 × 512
Conv 23 × 3/51214 × 4 × 512
De-Conv 12 × 2/25628 × 8 × 256
De-Conv 21 × 1/25628 × 8 × 256
Level 7Conv 13 × 3/25618 × 8 × 256
Conv 23 × 3/25618 × 8 × 256
De-Conv 12 × 2/128216 × 16 × 128
De-Conv 21 × 1/128216 × 16 × 128
Level 8Conv 13 × 3/128116 × 16 × 128
Conv 23 × 3/128116 × 16 × 128
De-Conv 12 × 2/64232 × 32 × 64
De-Conv 21 × 1/64232 × 32 × 64
Level 9Conv 13 × 3/64132 × 32 × 64
Conv 23 × 3/64132 × 32 × 64
Branch Upsampling moduleLevel 10De-Conv 12 × 2/64232 × 32 × 64
Conv 11 × 1/64132 × 32 × 64
De-Conv 21 × 1/64232 × 32 × 64
Level 11De-Conv 12 × 2/32132 × 32 × 32
Conv 13 × 3/32132 × 32 × 32
De-Conv 21 × 1/32132 × 32 × 32
Output Conv 13 × 3132 × 32 × 10
Table 2. Sample distribution across lithological units in the core and entire study areas.
Lithological UnitCore Area (1:25,000)Core Area (1:50,000)Entire Area (1:50,000)
Number%Number%Number%
Cenozoic sediments8083.58%4387.29%10588.31%
Triassic Elashan Formation****2662.09%
Triassic Hongshuichuan Formation****1200.94%
Carboniferous Haotelowa Formation****510.40%
Carboniferous Halagole Formation****1731.36%
Xiaomiao Formation in Changcheng System7373.27%2303.83%10167.98%
Paleoproterozoic Jinshuikou Group608326.99%156526.04%305023.95%
Triassic granite20959.29%62010.31%138510.88%
Triassic granodiorite793535.20%194932.42%367528.86%
Permian quartz diorite1760.78%340.57%920.72%
Carboniferous granodiorite18138.04%4467.42%7335.76%
Silurian granodiorite2831.26%781.30%2001.57%
Ordovician tonalite261211.59%65110.83%9147.18%
Total22,542100.00%6011100.00%12,734100.00%
Note: * Not exposed or no samples collected.
Table 3. Statistical characteristics comparison of selected elements obtained from different geochemical surveys.
ElementMinMaxXMdQPEK
CRERCRERCRERCRER
1:25,0001:50,0001:50,0001:25,0001:50,0001:50,0001:25,0001:50,0001:50,0001:25,0001:50,0001:50,000--
As0.010.040.04806.45292.10379.788.787.789.446.086.116.5413.612.3
Sb0.010.010.0140.1221.7044.100.530.570.710.360.390.450.930.96
Bi0.010.010.0110021.7928.490.370.290.310.200.200.200.290.33
Au *0.030.500.501212.5149.30390.791.351.661.300.891.301.811.351.61
Ag *10.005.205.2050001681.00500087.9863.4168.1065.0049.0046.8065.051.0
Cu0.501.321.323000608.00947.2722.9217.6819.8418.6015.5416.3019.920.2
Pb0.362.632.633411.82664.00125023.3517.4620.8120.9015.6016.6519.9718.7
Zn1.1814.8314.832638.82460.00779.6659.9547.0352.2155.3044.1046.7357.558.3
Sn0.100.370.3710032.3541.122.562.222.202.272.001.702.612.36
Mo0.010.070.07237.1039.6139.611.251.131.210.980.961.020.640.80
Min-minimum; Max-maximum; X-mean; Md-median; CR-core area; ER-entire area; QP-elemental abundances in stream sediments of Qinghai Province; EK-elemental abundances in stream sediments of East Kunlun; * unit in μg/kg, the others in mg/kg.
Table 4. Semantic word vectors of geological entities.
Geological EntitiesWord Vector Dimensions
12345
Cenozoic sediments1.31970.96352.9743−1.2355−0.1188
Triassic Elashan Formation0.0934−0.10823.3596−0.9471−1.0408
Triassic Hongshuichuan Formation1.37640.25992.8317−0.9789−1.6656
Carboniferous Haotelowa Formation1.25790.53883.1968−1.3147−1.3434
Carboniferous Halagole Formation0.86480.13563.2156−1.1133−1.0306
Xiaomiao Formation in Changcheng System0.81920.36872.3485−0.8228−0.5159
Paleoproterozoic Jinshuikou Group0.62190.30793.6535−1.3698−1.3064
Triassic granite−0.00080.08922.5573−0.7160−1.3924
Triassic granodiorite0.25460.42633.4675−1.3776−1.1784
Permian quartz diorite0.3586−0.28292.5137−0.3464−1.8281
Carboniferous granodiorite0.66950.05712.3866−0.5355−1.9742
Silurian granodiorite0.18300.30012.3072−0.7561−0.6536
Ordovician tonalite0.49880.17361.8549−0.4664−0.8848
Table 5. Settings of model training hyperparameters.
HyperparametersValue
Batch size32
Initial learning rate0.001
Learning rate adjustment strategyWith a 50% reduction applied every 40 iterations
Epochs1000
OptimizerAdam
Low resolution image size32 × 32
High resolution image size32 × 32
Table 6. Computed PSNR and SSIM scores for SRCNN, VDSR, U-net, and the proposed method in the test set.
Network StructureGeochemical MapsTopographic Feature MapsEmbedded Geological MapsPSNRSSIM
MaximumAverageMaximumAverage
SRCNNYesYesYes27.49313.4010.7690.273
YesYesNo26.79113.0040.7810.239
YesNoNo25.87413.0580.7410.235
VDSRYesYesYes35.19920.6780.9330.623
YesYesNo30.01716.5180.8490.419
YesNoNo30.08116.1670.8310.407
U-netYesYesYes36.07022.0430.9450.714
YesYesNo36.96722.7590.9460.708
YesNoNo36.33320.1010.9190.642
The proposed methodYesYesYes38.48625.3340.9680.817
YesYesNo37.33622.1360.9460.722
YesNoNo36.45523.1470.9450.713
Disclaimer/Publisher’s Note: The statements, opinions and data contained in all publications are solely those of the individual author(s) and contributor(s) and not of MDPI and/or the editor(s). MDPI and/or the editor(s) disclaim responsibility for any injury to people or property resulting from any ideas, methods, instructions or products referred to in the content.