Article

Modeling of an Ideal Solar Evaporation Pond for Lithium Extraction from Brines

1
Department of Metallurgical Engineering, University of Concepción, Edmundo Larenas 285, Concepción 4070371, Chile
2
Albemarle Ltda. Apoquindo 2730, Torre 1, piso 10, Las Condes, Santiago 7550000, Chile
3
University of Concepción, Garcia Hurtado de Mendoza 490, Concepción 4090832, Chile
*
Author to whom correspondence should be addressed.
Retired.
Minerals 2025, 15(10), 1078; https://doi.org/10.3390/min15101078
Submission received: 14 September 2025 / Revised: 8 October 2025 / Accepted: 12 October 2025 / Published: 16 October 2025
(This article belongs to the Special Issue Extraction of Valuable Elements from Salt Lake Brine)

Abstract

In the coming decades, anticipated population growth is projected to escalate the demand for essential resources such as NaCl, KCl, and LiCl, which are critical for human consumption, agriculture, and battery production. A substantial proportion of these salts is produced from brines using solar evaporation ponds. This article presents a one-dimensional surrogate mathematical model of an ideal solar evaporation pond working at a steady state. The ideal pond considers only water evaporation, with a uniform evaporation rate per unit area. The model’s equation, or the ideal solar evaporation law, allows calculating the ion concentration profile in an ideal pond just given the feed and discharge concentrations. The validation of the law was conducted with industrial data collected in the year 2023 in a lithium recovery plant throughout 15 ponds in series at the Salar de Atacama, Chile. The results verified that the model could accurately predict the monthly concentration profiles (R2 in the range 0.9646 to 0.9864) if lithium does not precipitate in the pond. The model provides accurate values of pond inventories and area requirements for designing stages. The model’s relevance extends beyond the lithium industry to encompass any solar evaporation processes for salt recovery or solution concentration.

Graphical Abstract

1. Introduction

Salts have been indispensable to humankind since ancient times. Back then, common salt (NaCl) primarily used for domestic purposes, was directly extracted from rock deposits. However, after the Industrial Revolution, it became necessary to seek other resources such as brines or seawater [1]. Currently, inorganic salts are not limited only to human consumption but are also used as fertilizers for agriculture (KCl), in the formulation of detergents (Na2SO4), in the manufacturing of glass and paper (Na2CO3), in the production of batteries (LiCl) [2], among others. In general, there are four types of brine resources from which a wide range of salts are extracted: oceans and seas, salt lakes, salars, and solution mining [3]. Brines from salars are one of the most important sources of salt production in the world. Salars are salt lakes that have evaporated over time leaving layers of salts hundreds of meters deep. In these salars, brine is trapped in the interstices and is then pumped to the surface for processing. The Salar de Uyuni in Bolivia and the Salar de Atacama in Chile are excellent examples [4].
In the industrial extraction of salts, various fractional or sequential crystallization techniques are used [2,5]. Among the technologies used, solar evaporation ponds stand out primarily in arid or semi-arid regions [6] because they take advantage of intense solar radiation and low humidity, which are key factors in the evaporation process. Notably, the Salar de Atacama, in northern Chile, has brine with the highest known lithium concentration averaging 0.14% (1.68 g/L) [7]. This salar also holds approximately 60% of the world’s lithium reserves, and it is the largest lithium producer from brine in the world [8]. The two companies currently operating at the Salar the Atacama under lease agreement with the Chilean government are SQM and Albemarle, which reported production of lithium carbonate equivalent (LCE) in the year 2023 of 168,000 and 50,400 tons, respectively.
The climatic conditions of the Salar de Atacama favor the efficiency of solar evaporation for the recovery of lithium and other industrial salts present in the brine. The average daily temperature ranges between 22 °C in February and 8 °C in July, with a maximum oscillation of approximately 14 °C. Wind speed varies daily from less than 2 m/s in the morning to 15 m/s in the afternoon. Rainfall corresponds to a desert climate, with an annual average of 11.6 mm at the lithium saltworks [9]. The average relative air humidity is 19.8%, with a maximum of 27% in February and a minimum of 15% in October.
From the thermodynamic point of view, studying solar evaporation from brines is complex because they are electrolyte solutions; therefore, brines exhibit non-ideal behavior at very low concentrations due to ionic electrostatic interactions [10]. One of the most advanced thermodynamic models is the OLI Mixed-Solvent Electrolyte model [11]. This model integrates standard-state thermochemical properties of solution species with an expression for excess Gibbs energy. The excess Gibbs energy model incorporates a long-range electrostatic interaction term (Pitzer–Debye–Hückel equation), a short-range electrostatic interaction term (UNIQUAC model), and a middle-range electrostatic interaction term (second virial coefficient type equation). While long-range forces dominate in dilute electrolyte solutions, chemical and physical forces become significant at moderate and short separation distances between species. As a result, the expression for excess Gibbs energy includes the sum of these three interaction terms.
Besides the thermodynamic complexities, the operation of solar evaporation ponds is influenced by physical phenomena that governs water removal. For instance, it is known that the evaporation rate is proportional to the difference between the saturated vapor pressure at the water temperature and the vapor pressure of the surrounding air [12]. Furthermore, it has been shown that dissolved solids decrease the saturation vapor pressure of brine [13]. Additionally, the limited number of studies on infiltration [1,14] highlighted that it is still a little understood phenomenon.
Despite the above considerations, several studies have applied solubility phase diagrams to salt lakes and brines [2,15,16,17,18,19]. These studies aimed to establish relationships between ion concentrations and the crystallization points of salts. However, the vast number of ion combinations in brines, which fixes the possible combinations of salts to precipitate, turn into a very complex system. Therefore, phase diagram approaches often face practical drawbacks including difficulty of calibrating parameters for complex brine systems and their limited scalability to large-scale pond operations.
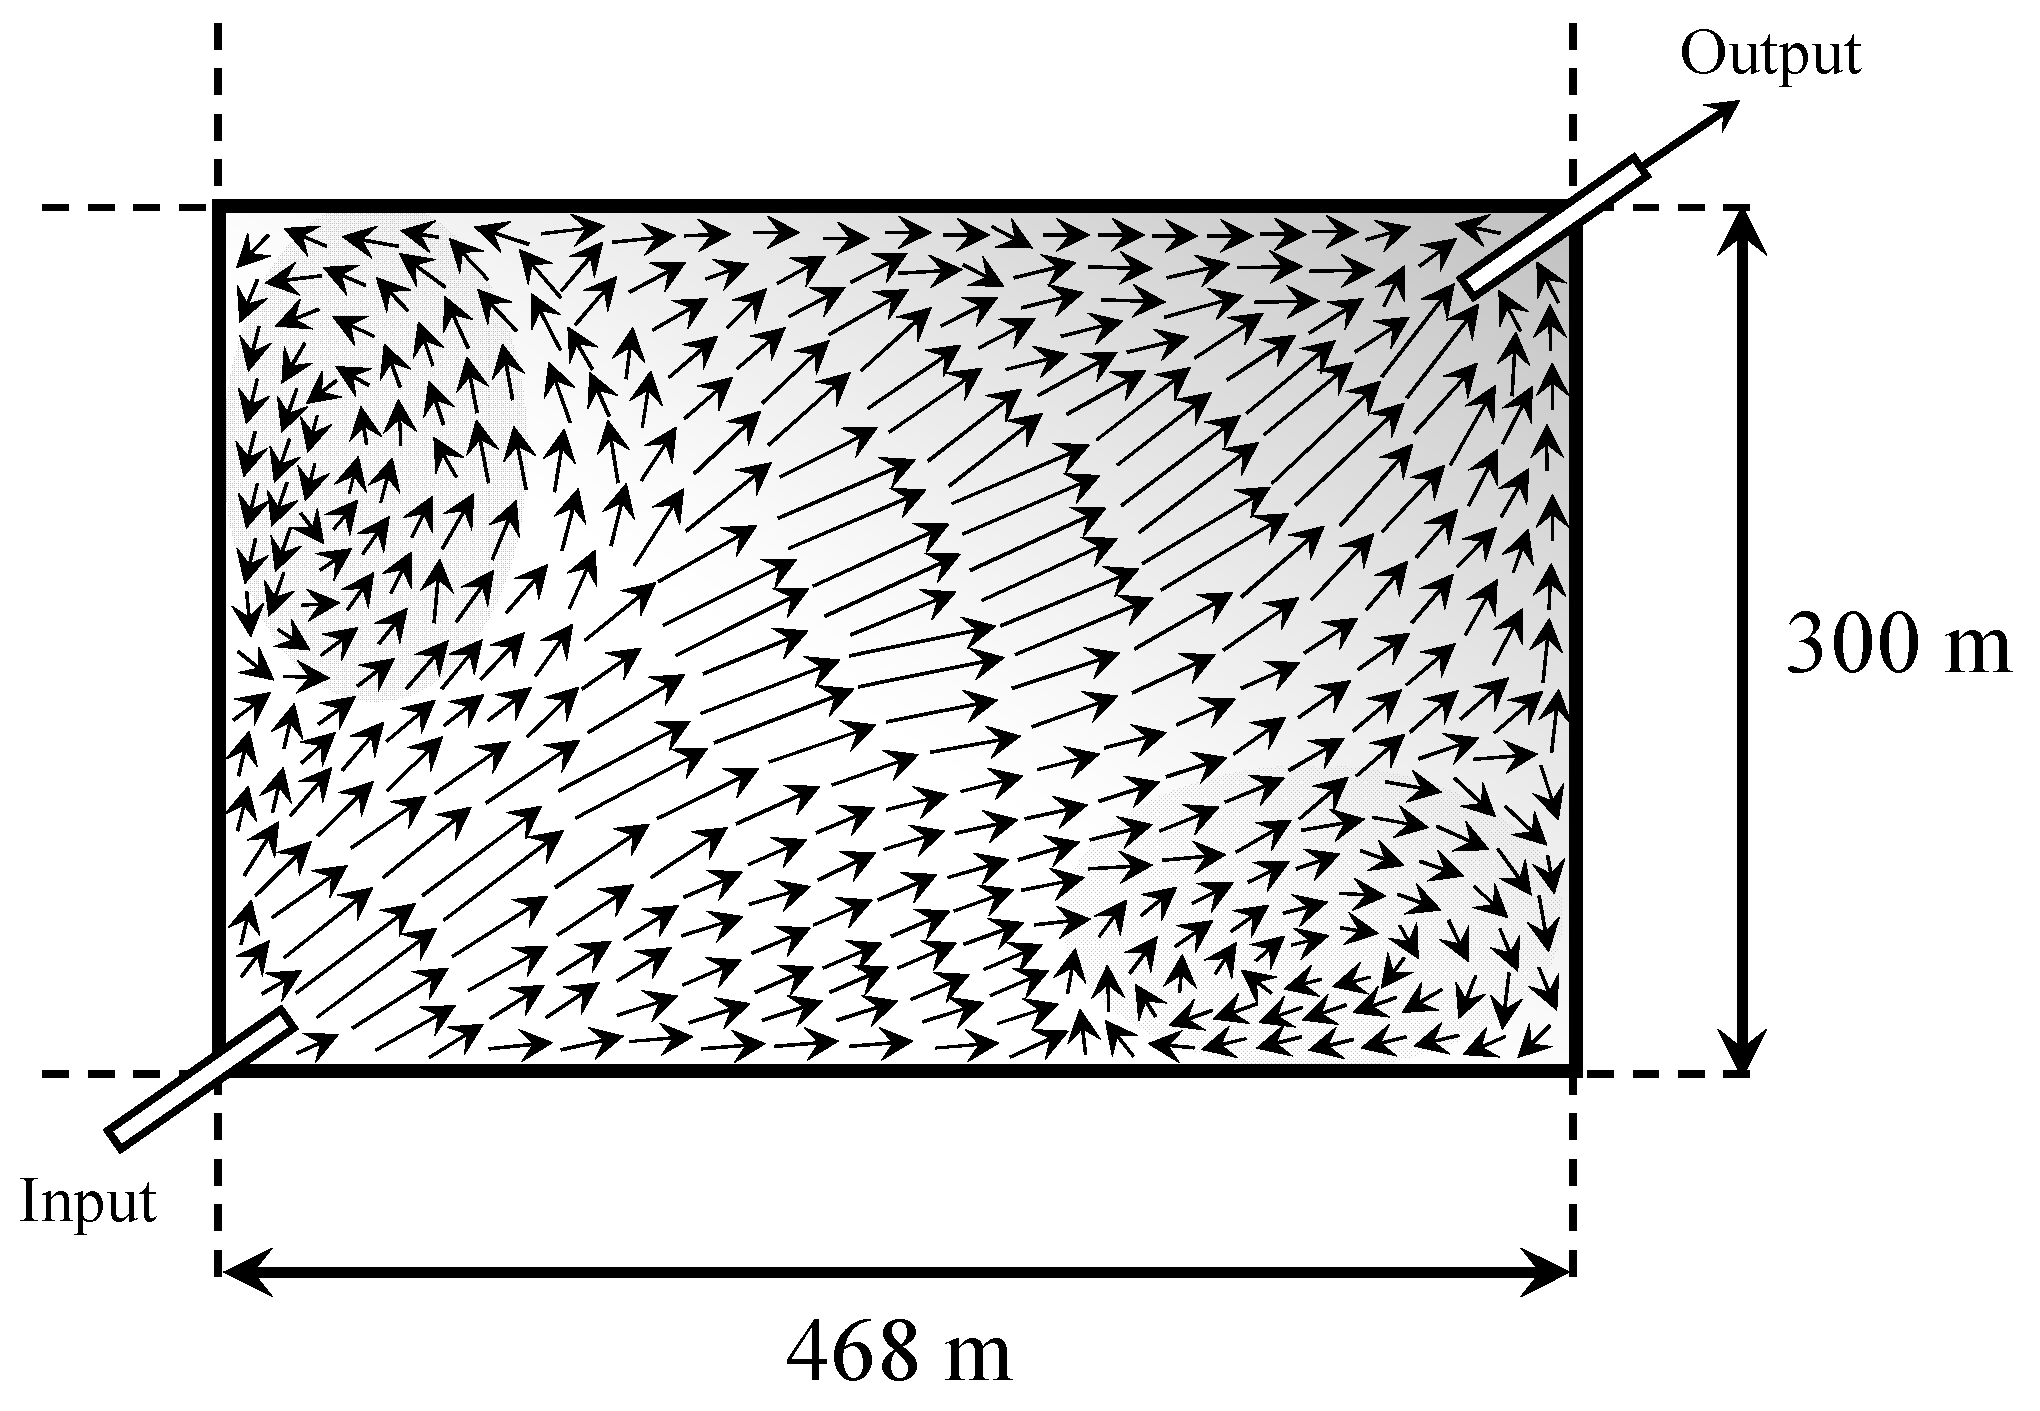
Since the nature of the solar evaporation process is inherently three-dimensional, with various physicochemical phenomena occurring in the ponds, the modeling becomes very demanding. For instance, Figure 1 qualitatively displays velocity and concentration fields for the simplest type of evaporation ponds without any baffles.
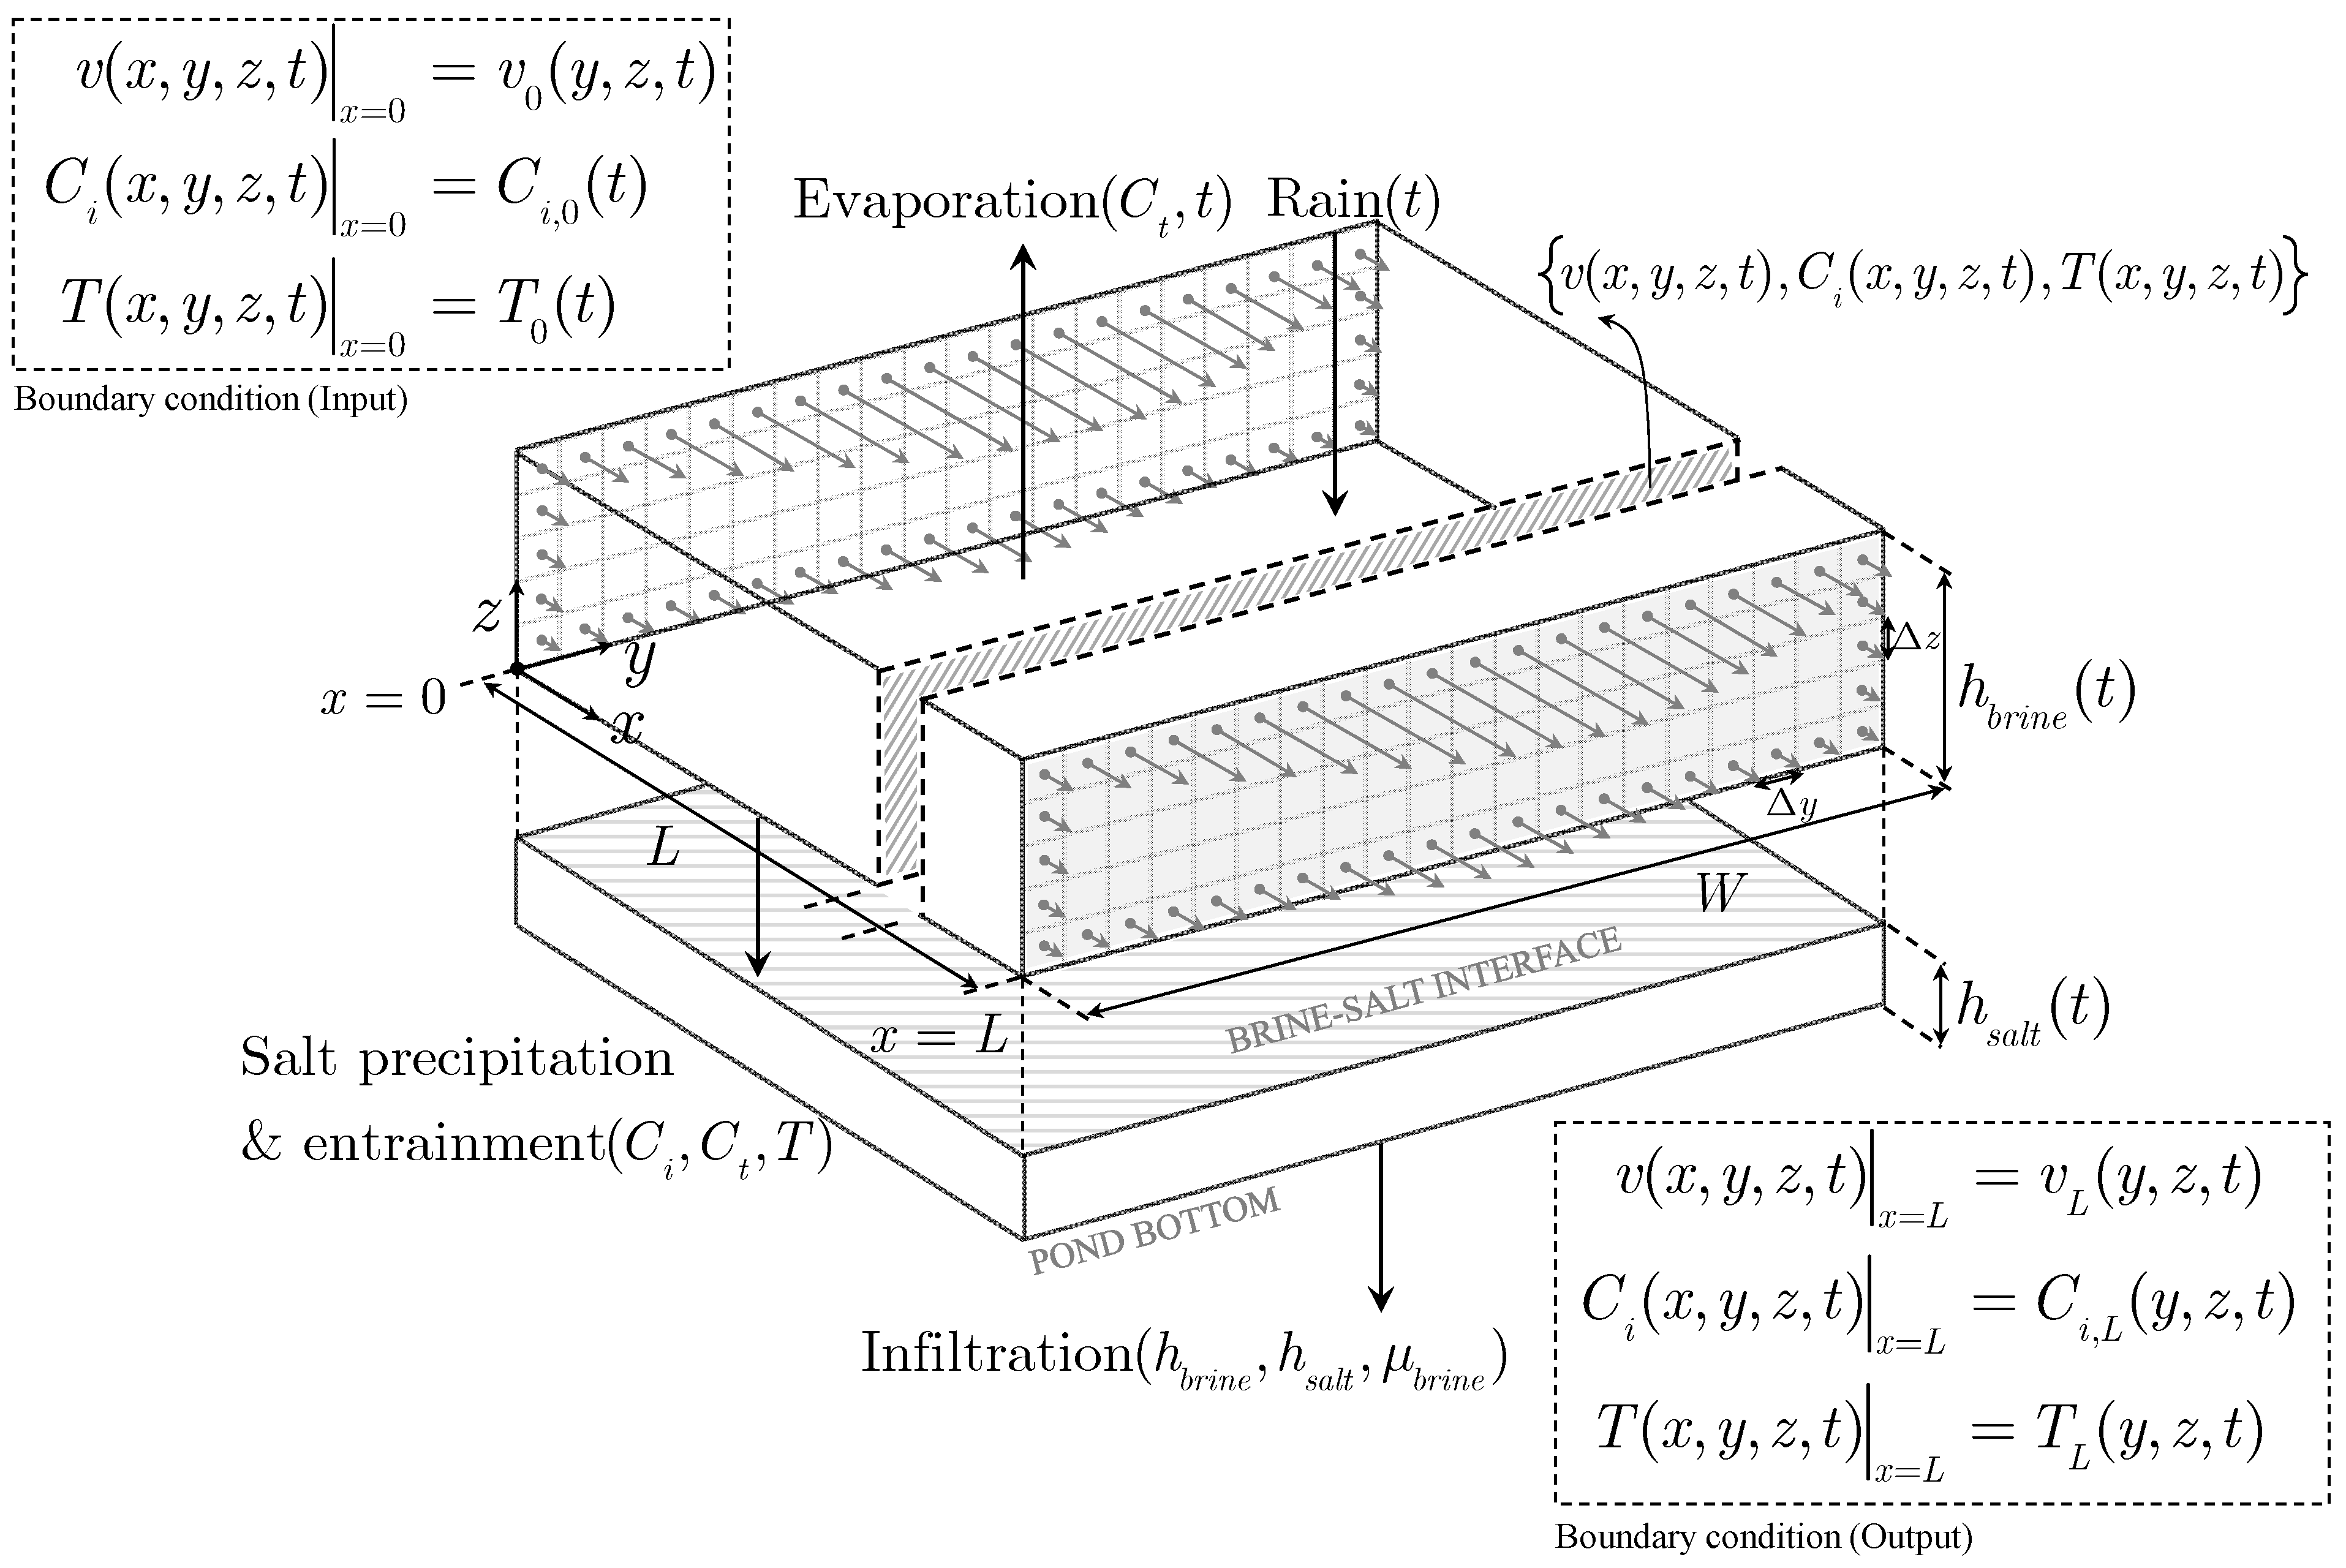
In the figure, velocity arrows indicate how the pond corners trap brine, increasing residence time, and species’ local concentrations (shades of gray). At the same time, the figure shows the length and width of the pond and how the brine is fed and discharged. The depth of the ponds is small, usually less than 1 m. Gradients in concentration also occur in the vertical direction and a layer of solid precipitates will form when the brine concentration reaches the crystallization point of some of the salts. Because the heat capacity of the brine decreases with concentration, an increase in temperature is also anticipated in the zones of higher concentrations. Thus, fields of temperature, concentration, and velocity are established, requiring the formulation and solution of the mass, energy, and momentum balances in three dimensions, together with additional equations to close the system. To illustrate this, we conceptualize a three-dimensional solar evaporation pond as shown in Figure 2. For simplicity, the depiction considers unidirectional laminar flow. As indicated in the figure, in addition to water evaporation, other physicochemical phenomena need to be considered: salt precipitation, entrainment of brine in the precipitates, infiltration of brine in the soil, and rainfall.

Modeling Efforts on Solar Evaporation Ponds

The modeling efforts on solar evaporation ponds can be classified according to the dimensions considered for the property gradients.
The first and simplest conceptual model is the well-known perfect mixing model. In this model, it is assumed that the pond exhibits perfect mixing, ensuring uniformity in solute concentration and temperature throughout the entire volume. Despite its simplicity and the potential limitations in practical applications, this model has been widely used, as reported in the literature. Some of the models focused solely on either thermodynamic aspects or on mass balance aspects [20,21], in some cases, assuming steady-state conditions [22,23]. These models use mass balance relationships and constant rates for precipitation, entrainment, and infiltration with empirical adjustments for evaporation based on factors such as seasonality and brine density. Other models explore the system’s dynamics over discrete time intervals and provide thermodynamic closure through simulations of equilibrium conditions using hyperplanes [24].
The one-dimensional model would be next in complexity, which accounts for concentration, temperature, and velocity gradients along a single spatial dimension (typically, the length of the pond), thus providing a more realistic depiction of how these variables evolve as the fluid moves through the system. Little has been done in this category. The Myers model [25] is the only documented one-dimensional model in the literature for solar evaporation ponds. The model was developed to be used in a commercial plant for NaCl recovery from seawater. It considers a concentration stage, where seawater is progressively concentrated until reaching NaCl saturation, and a crystallization stage, where NaCl precipitates before other solutes begin to precipitate, ensuring purity. This model does not explicitly track NaCl concentration but models only the concentration of Mg, using the known relationship that NaCl begins to precipitate when Mg salinity reaches approximately 1.275%, corresponding to a brine density of 1215 g/L. After the NaCl crystallization, the final brine reaches a Mg salinity of 3.9% with a density of 1250 g/L. The model assumes that the seawater moves steadily from the inlet to the outlet, increasing gradually in salinity and absence of forward or backward mixing along the ponds. The primary variables considered in the model include the evaporation rate, rainfall, seawater’s salinity, the NaCl saturation concentration, and infiltration rate. Evaporation and infiltration are empirically correlated with the concentration of Mg in the brine, under the assumption that Mg does not precipitate during the process. The model’s objective was to determine the location where NaCl precipitation begins and to quantify the NaCl yield per unit area under varying evaporation rates, rainfall levels, and infiltration conditions. These calculations were based on average meteorological conditions and assumed no entrainment of seawater in the precipitate.
The next step in line would be the two-dimensional model, which could consider the concentration, temperature, and velocity gradients along two spatial dimensions, typically the length and width of the pond. Although this type of model would provide a more realistic representation of how concentrations and temperatures vary not just along the flow direction but also across the width of the pond, there is a lack of published literature on the subject.
The three-dimensional model, on the other hand, could consider the concentration, temperature, and velocity gradients in all three spatial dimensions, providing a detailed and realistic representation of the processes occurring within the pond. This comprehensive approach would allow obtaining vertical gradients and stratification effects, which are crucial for understanding the complete dynamics of the system. Therefore, a three-dimensional model has the potential to deliver accurate predictions for the behavior of solar evaporation ponds. On this subject, Kasedde et al. [26] reported a simulation of a sodium chloride extraction evaporation pond in Uganda using a tridimensional CFD approach. This pioneering effort is a valuable step in modeling a complex system, where some limitations were noted, particularly the absence of thermodynamic closure equations for sodium chloride precipitation. Additionally, the infiltration and entrainment of brine in the precipitates were also ignored. The simulated temperature and velocity fields showed unexpected variations (20-degree Celsius increase in 5 h), and evaporation rates were not reported. Nevertheless, this study formally remained an important documented contribution of its kind, highlighting the challenges and opportunities that still exist for future developments in this area.
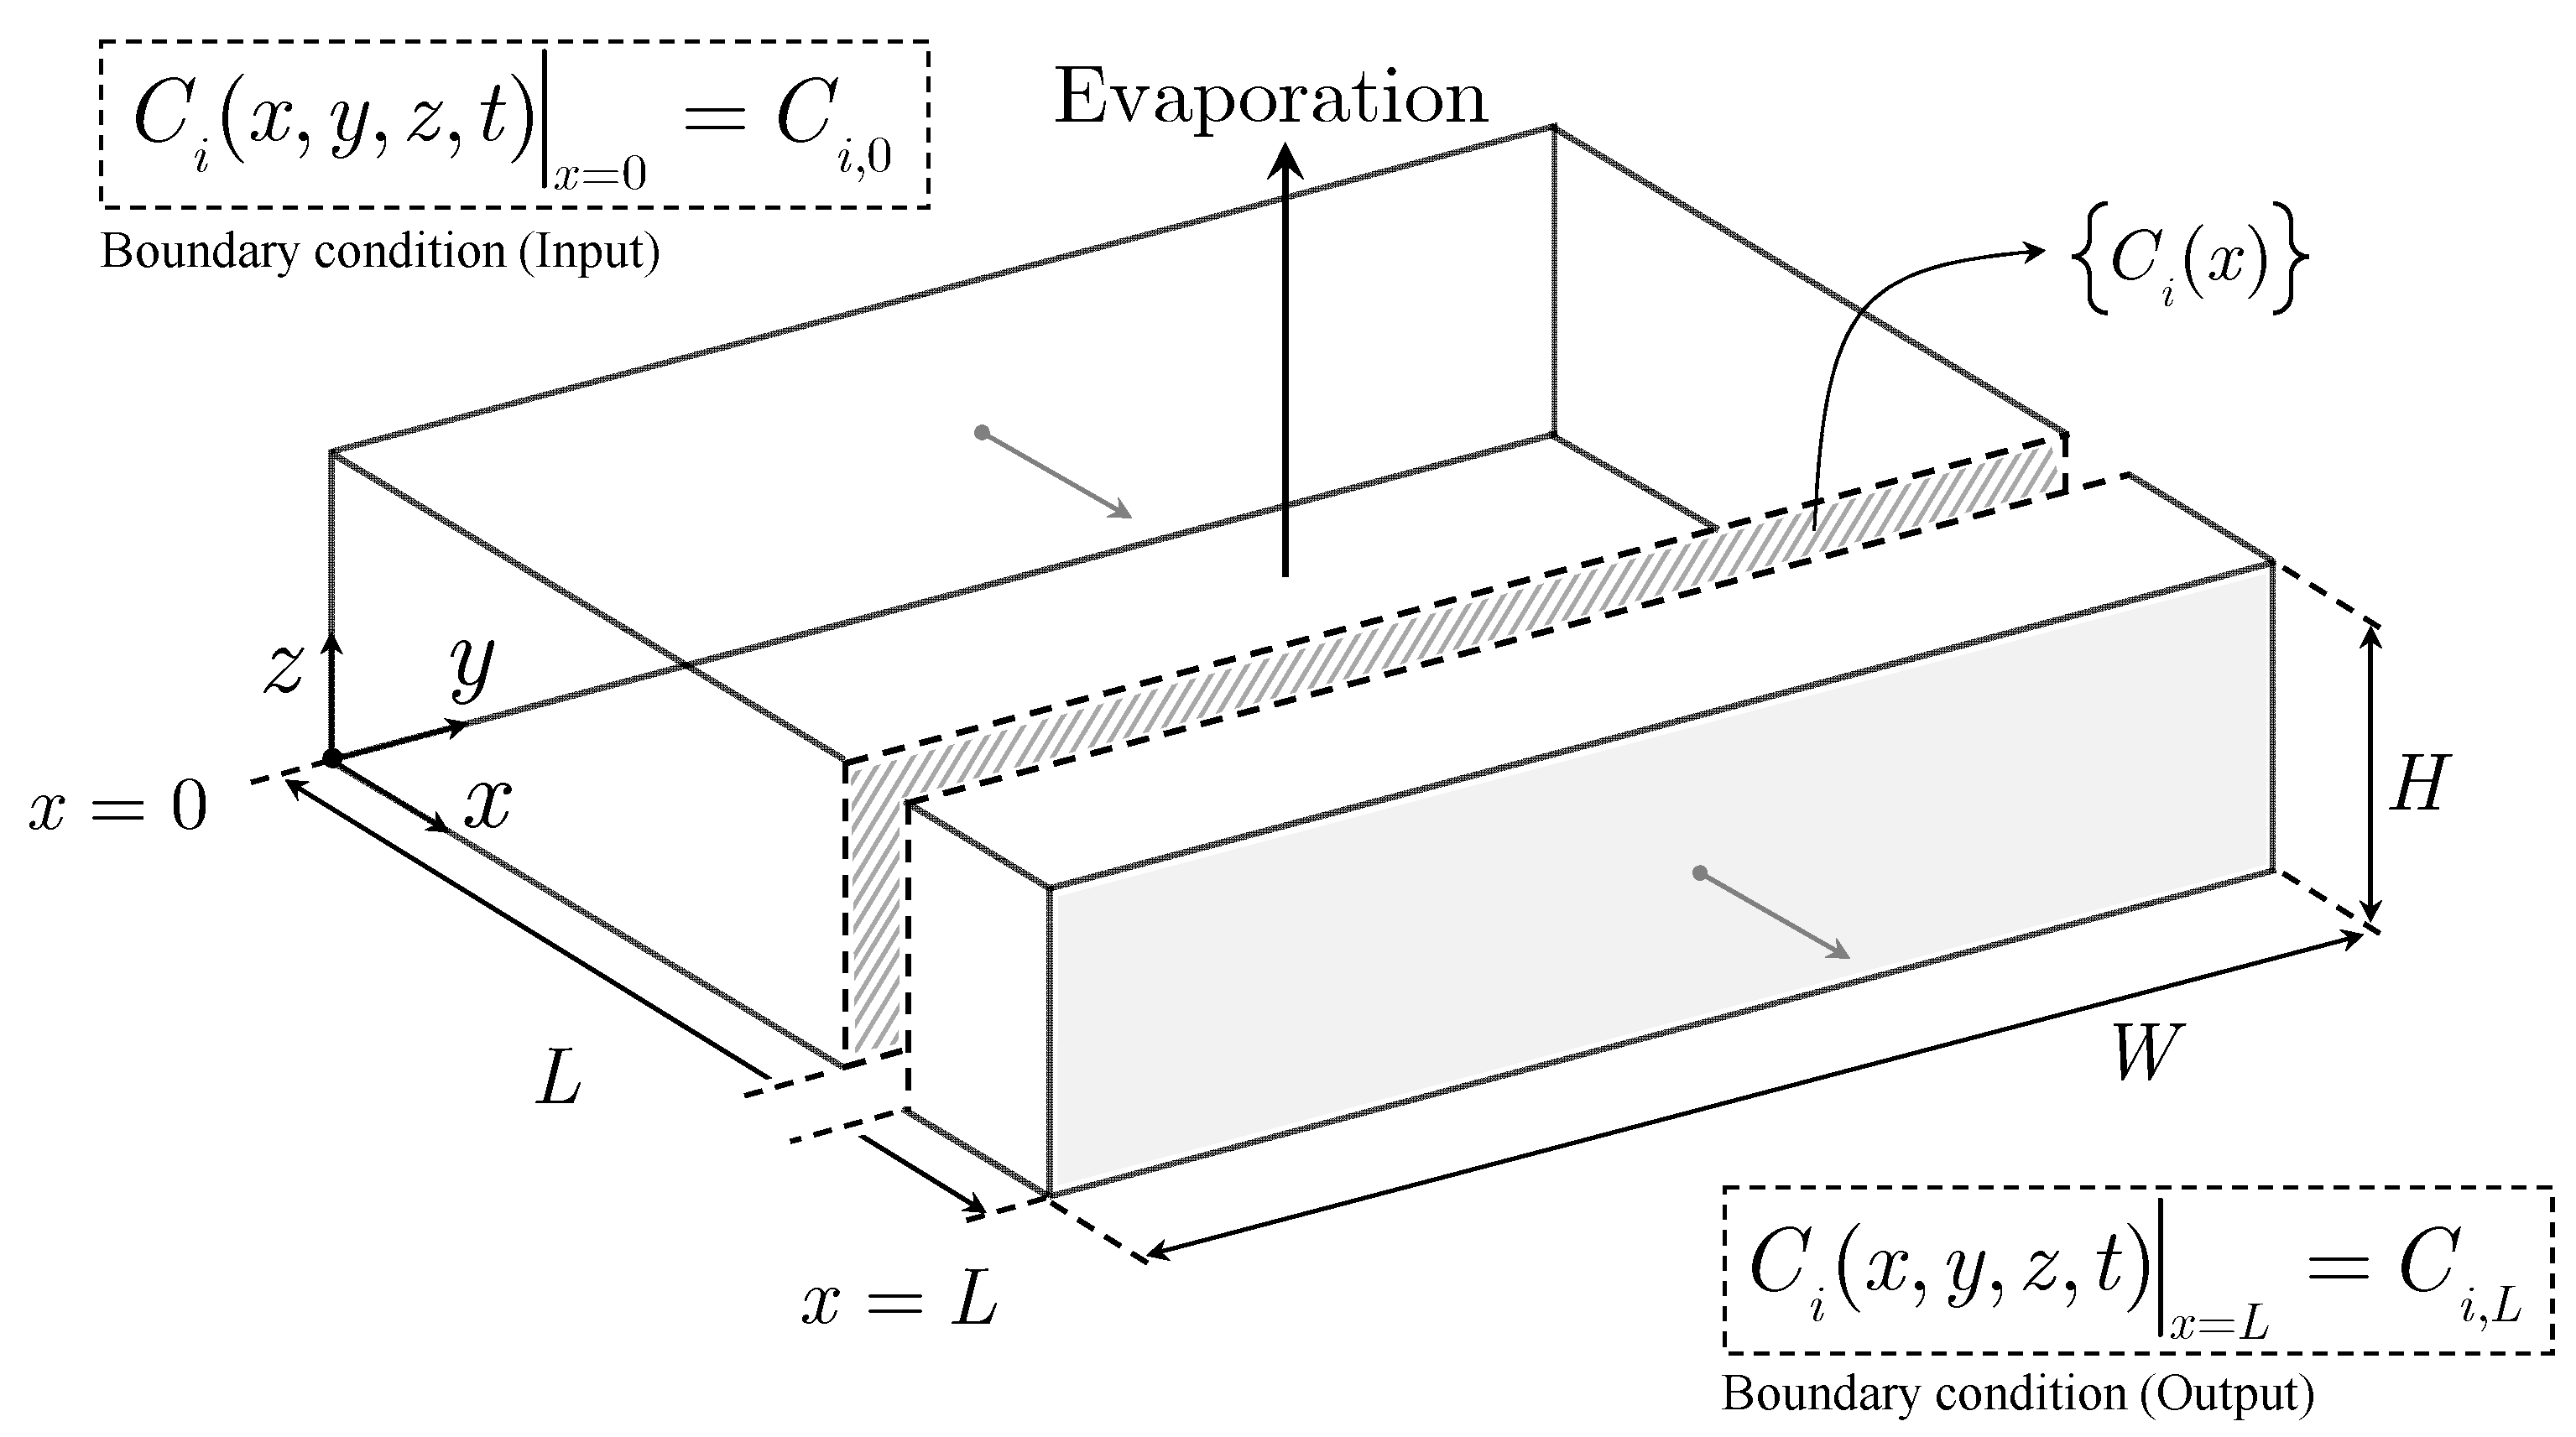
Having discussed above the complexity of modeling a solar evaporation pond, in the present paper, we introduce a surrogate mathematical model based on an ideal solar evaporation pond. The conceptualization of such a pond considers only evaporation excluding phenomena such as solids precipitation and entrainment, rainfall, and infiltration. Additionally, the model assumes that the rate of evaporation per unit area is constant in the pond. Consequently, evaporation is directly proportional to the pond’s length (or area) and independent of the local concentration of species i or any other variable. The shape of the ideal pond is assumed to be an orthogonal parallelepiped with the top rectangular area exposed to solar radiation. Figure 3 illustrates a one-dimensional ideal solar evaporation pond, where the brine flow in the pond is unidirectional along its length, while maintaining a constant brine height, and the brine feed and discharge are continuous. Variables such as velocity and temperature are explicitly excluded, focusing solely on the concentration profile of species i along the pond’s length as the primary variable of interest.
From this conceptualization, a governing equation was derived in this work—the ideal solar evaporation law—which is novel, not being previously reported in the literature. The model represents a significant advancement in the field of solar evaporation because it is ingenious and applicable to any solar evaporation process as discussed in the following section.

2. Development of a Surrogate Model for a Solar Evaporation Pond

Based on simple mathematical considerations, it is possible to derive a relationship between the steady state ion concentration along the length of the ideal pond and the concentrations of the feed and discharge of the pond. The developed mathematical model is one-dimensional and straightforward.
The model is based on the following assumptions (see Figure 3):
  • The area exposed to solar radiation has a length L, and a width W.
  • The pond is continuously fed and discharged with brine at x = 0 and x = L , respectively, and the system is at a steady state, maintaining a constant brine height H.
  • The feed and discharge concentration of species i, C i , 0   a n d   C i L , respectively, are known.
Let n be the number of times when half of the water is removed from x = 0 to x = L . Thus, if n = 1 , half of the water is removed once along the length of the pond, resulting in C i , L = 2 C i , 0 . If n = 2 , half of the water is removed twice, doubling the concentration twice, so that C i , L = ( 2 ) ( 2 ) C i , 0 , and so on. Then, it becomes clear that
C i , L n = 2 n · C i , 0
Additionally, if n = 0 , it follows that C i , L = C i , 0 , meaning there was no evaporation.
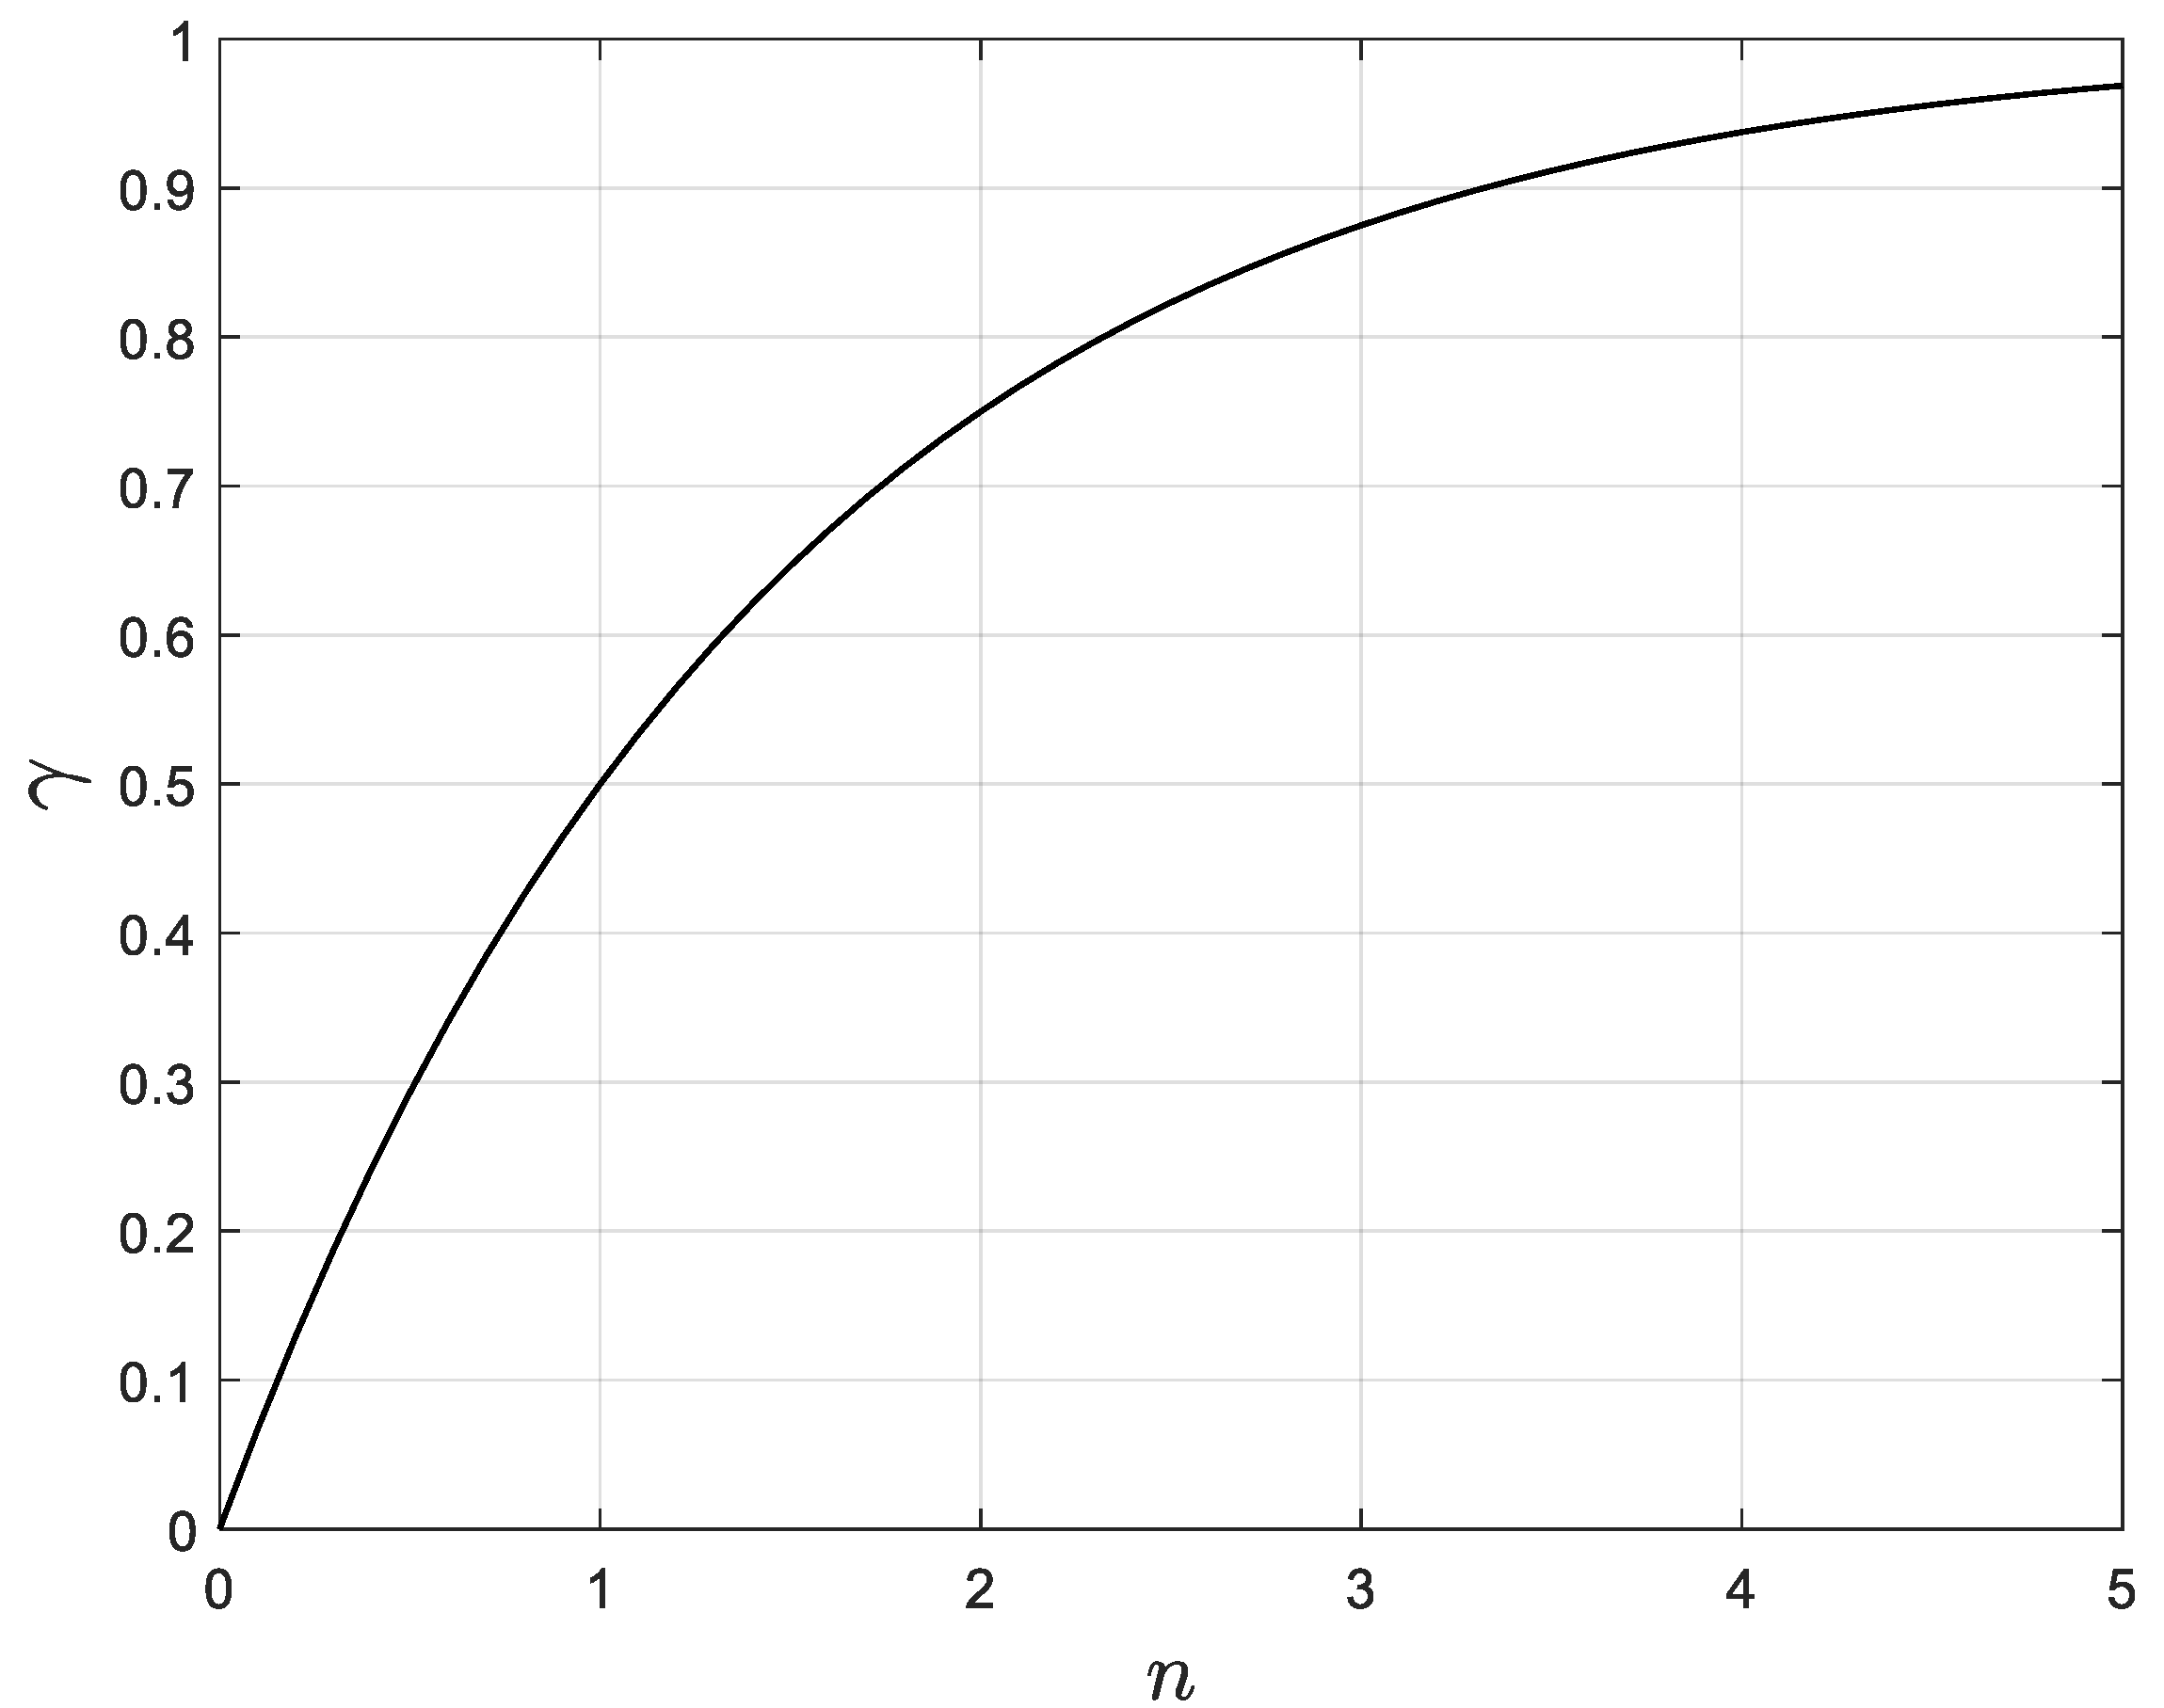
Clearly, there is a relationship between n   and the fraction of water remaining in the system. Indeed, if n = 0 , the fraction of water remaining is 1. If n = 1 , the fraction of water remaining is 1/2. Then, if n = 2 , the fraction of water remaining is 1/4, and so on. Thus, the fraction of water remaining in the system is   ( 1 / 2 ) n . Moreover, the fraction of water removed,   γ , plus the fraction of water remaining must always be equal to 1. Thus, the fraction of water removed γ must satisfy Equation (2):
γ + 1 2 n = 1
This relationship between γ and n is shown in Figure 4.
Solving for n in terms of γ
n = log 2 1 1 γ
Substituting this result in Equation (1), we obtain
C i , L = 2 log 2 1 1 γ · C i , 0
Since 2 l o g 2 ( x ) = x , it follows that
C i , L = C i , 0 1 γ
Since the fraction of water removed is directly proportional to the length of the pond (see Figure 3), γ = 0   a t   x = 0 , and γ = γ L   a t   x = L . Thus
γ x = γ L L x
Replacing in Equation (5)
C i ( x ) = C i , 0 1 γ L L x
At the feed and discharge locations, Equation (7) is satisfied as follows:
C i x = 0 = C i , 0 1 γ L L 0 = C i , 0
C i x = L = C i , L = C i , 0 1 γ L L L = C i , 0 1 γ L
Consequently, from Equation (9), the fraction of water removed in the pond can be written as follows:
γ L = 1 C i , 0 C i , L
Considering that γ L = f ( C i , 0 , C i , L ) , Equation (7) can be referred to as the “ideal solar evaporation law” because it uniquely determines the ion concentration profile just given the feed concentration at x = 0 and the discharge concentration at x = L ; it is also clear that this equation is independent of the concentration units used for the species i. Thus, solar evaporation systems following this law must satisfy that
l o g 2 C i ( x ) = l o g 2 C i , 0 + l o g 2 1 1 γ L L x
Therefore, plotting the experimental data on a graph l o g 2 ( C i ( x ) ) as a function of l o g 2 1 1 γ L / L x should result in a straight line with an intercept of l o g 2 ( C i , 0 ) .

3. Model Simulations

3.1. Determination of the Ion Concentration Profile

Let the concentration of lithium in the feed to a pond be C L i , 0 = 0.22 % , the discharge concentration be C L i , L = 0.26 % , and the length be L = 400 m. These concentrations are typical values of the first feed in one of Albemarle’s industrial pond systems. Thus, with these concentrations, the value of γ L can be obtained
γ L = 1 0.22 0.26 = 0.154
Therefore, the Li concentration profile in % along the length of the pond is given by
C L i x = 0.22 % 1 0.154 400 x   ,     0 x 400

3.2. Sensitivity Analysis

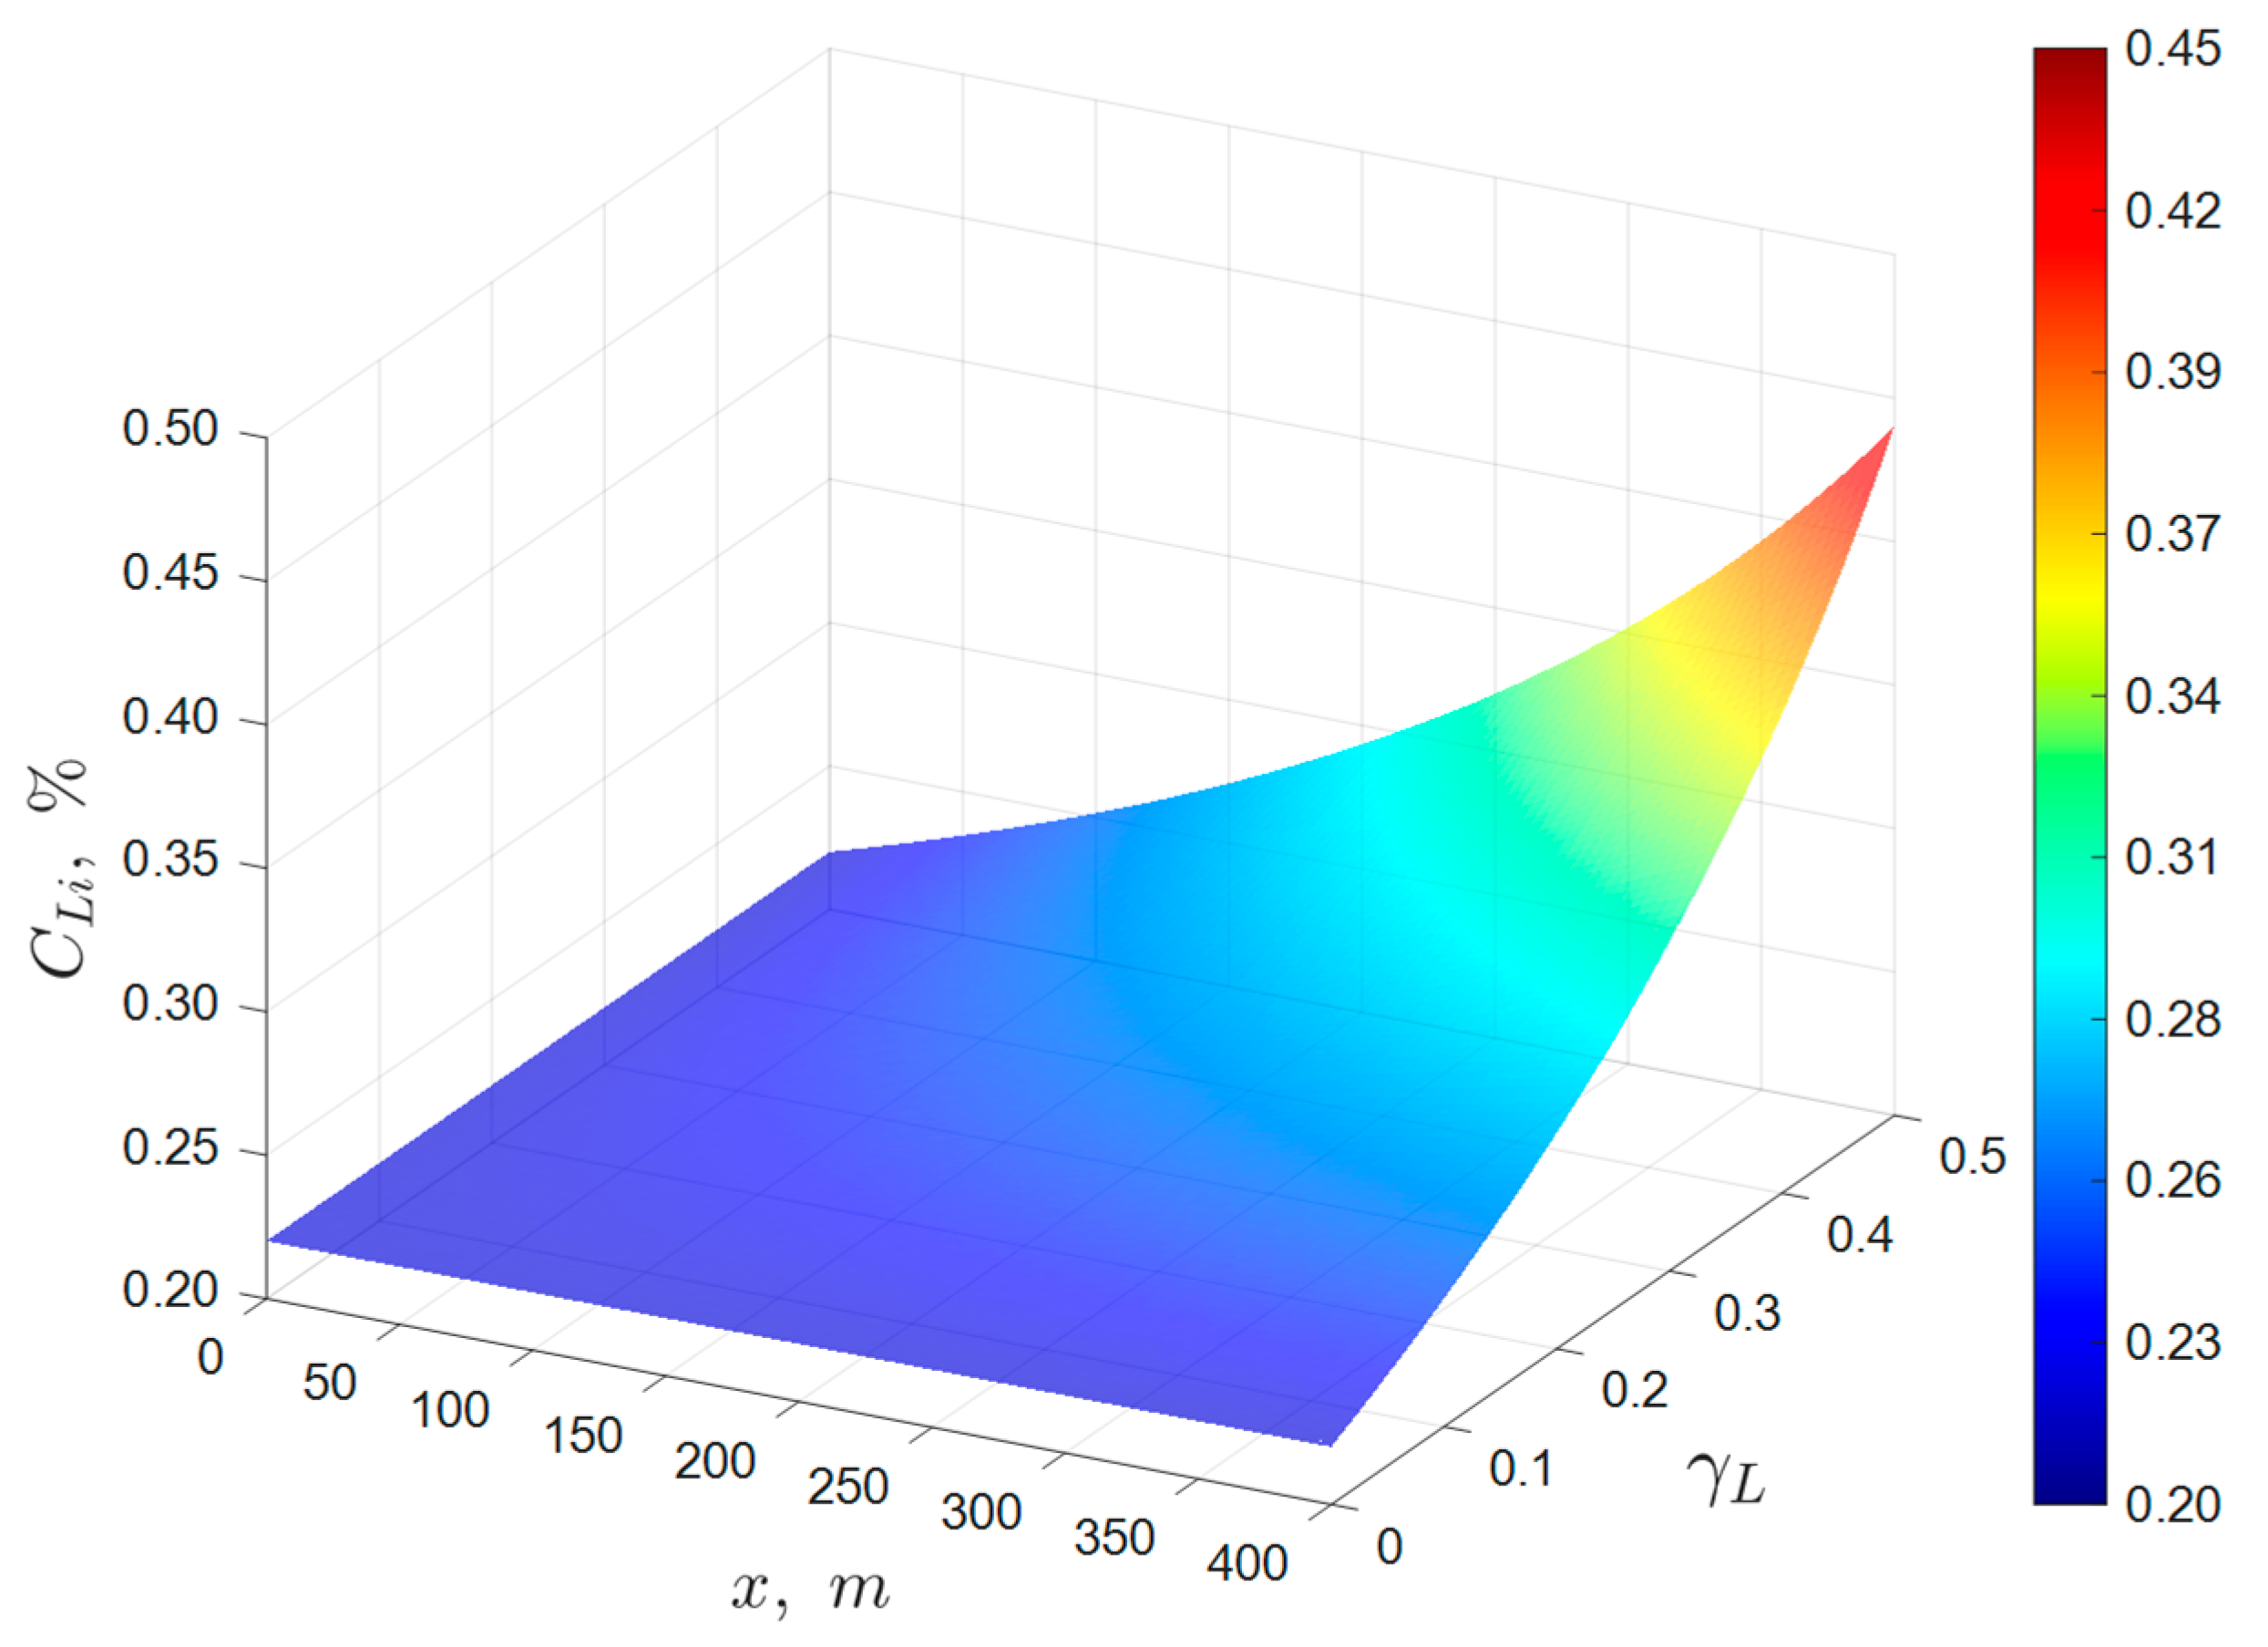
Let the feed concentration be C L i , 0 = 0.22 % , and the pond length be L = 400 m. This setup allows for the study of the effect of γ L on the concentration profile and its impact on the discharge concentration C L i , L . For the case 0 γ L 0.5 , can be obtained:
C L i x = 0.22 % 1 γ L 400 x ,     0 x 400 ,     0 γ L 0.5
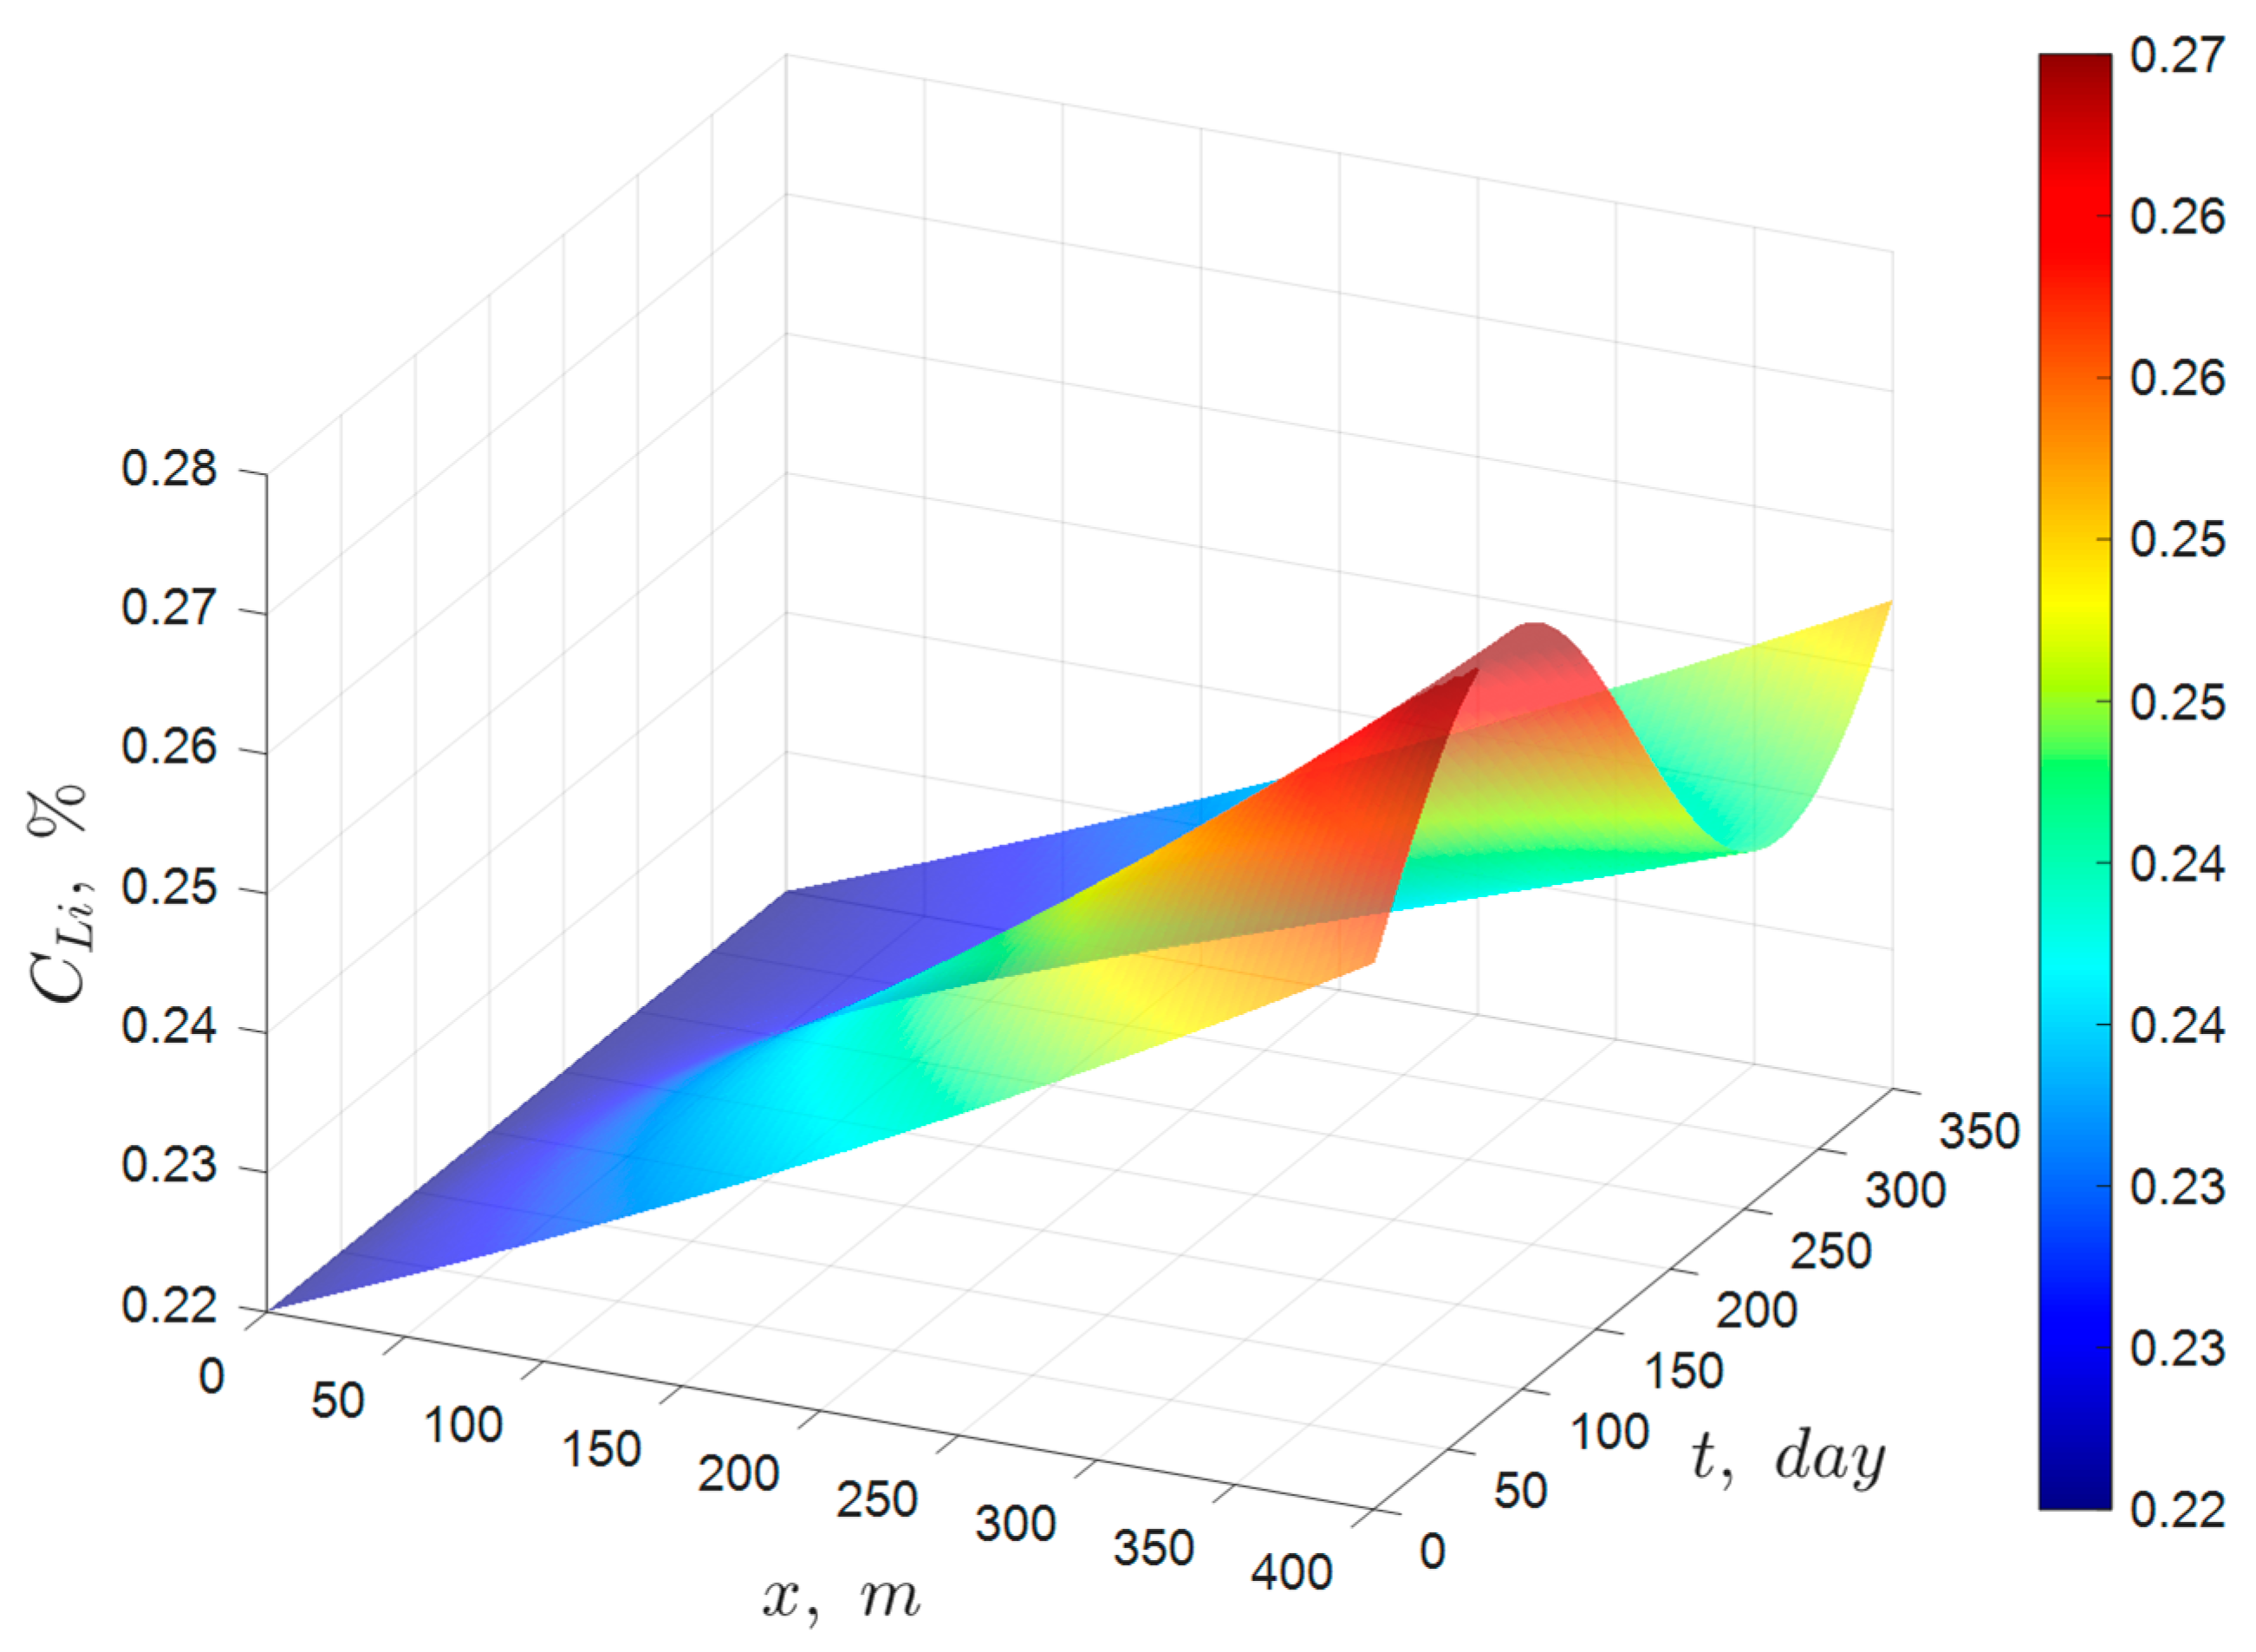
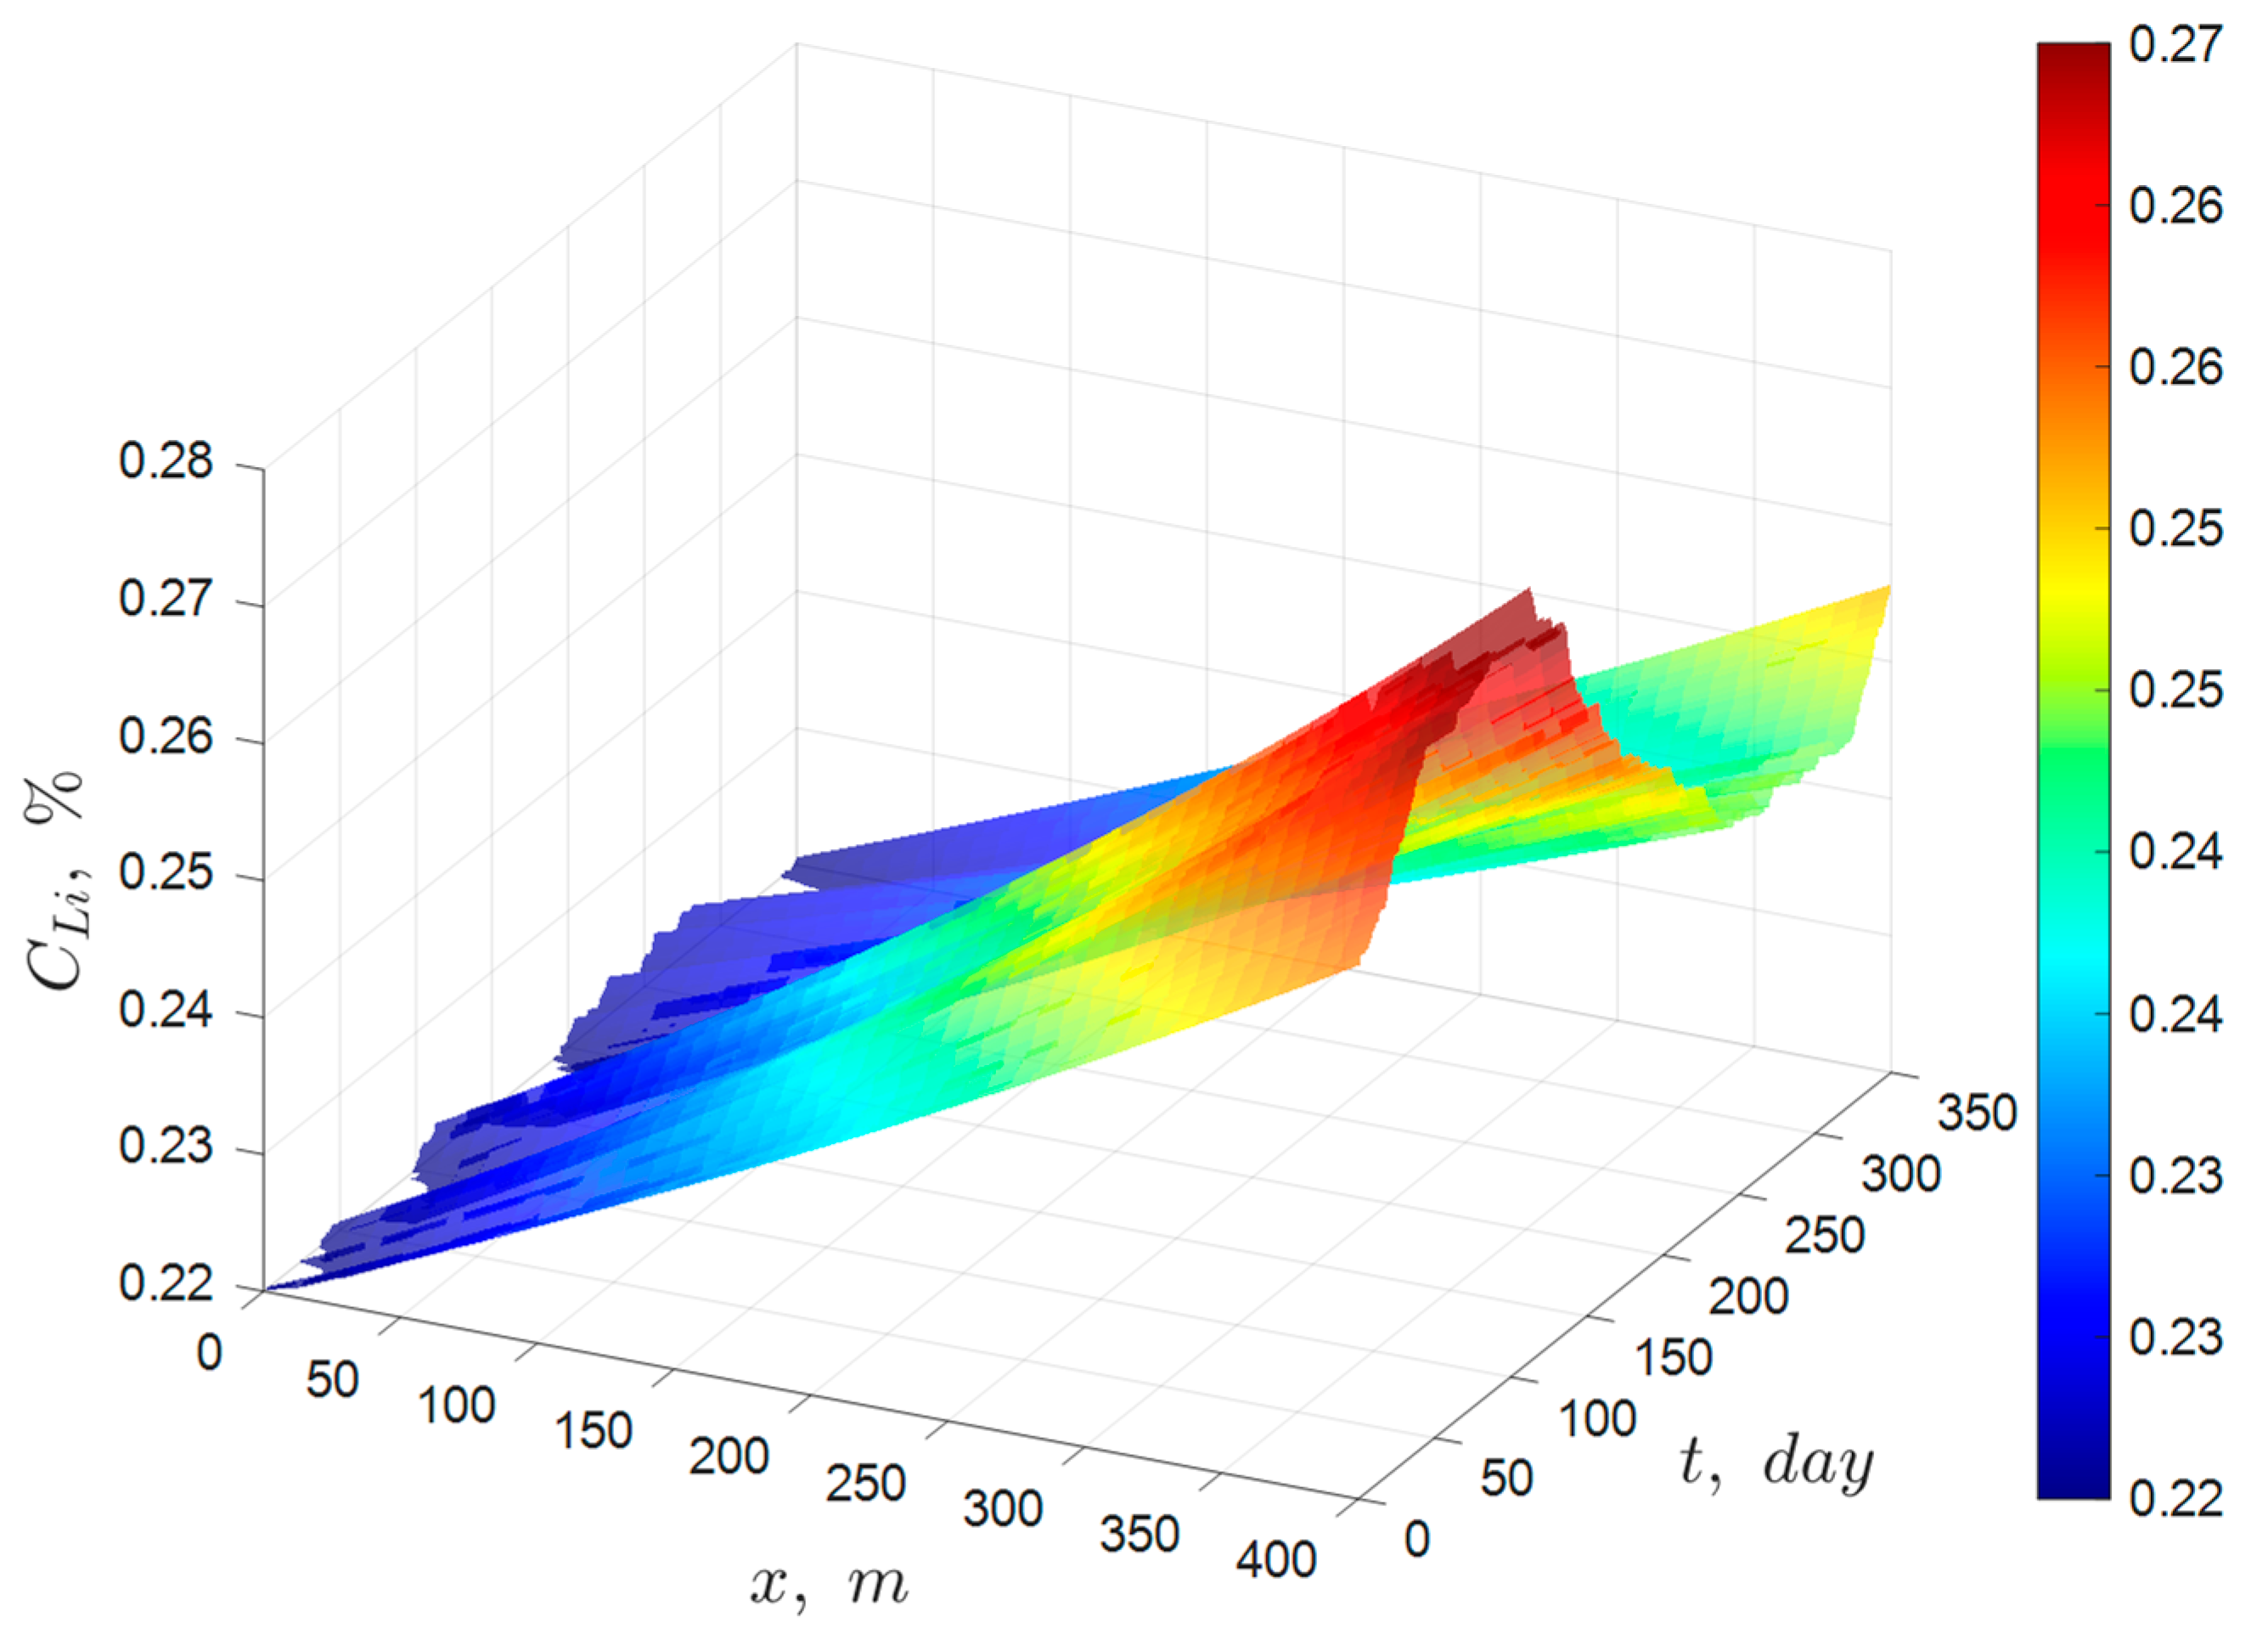
The results are depicted in Figure 5, which shows that as γ L increases, the entire concentration profile rises. Additionally, γ L can vary temporally, for instance, due to seasonal solar radiation changes. Thus, if a sinusoidal function were used for the daily value of γ L as given by Equation (15), the entire concentration profile would shift to a maximum in summer and a minimum in winter as shown in Figure 6.
γ L t = 0.15 + 0.05 · s i n 2 π t 365 ,       0 t 365
To further analyze the model’s sensitivity, C L i , 0 could be varied randomly over time. This was simulated by generating a series of random values with an amplitude of 0.01 and smoothing them using a moving average filter. The result is shown in Figure 7.

3.3. Calculations with the Model

3.3.1. Average Concentration of a Pond

According to the ideal solar evaporation law, the concentration profile of any species i that augments along a pond, which is fed with a concentration C i , 0 and discharges with a concentration C i , L is given by Equation (7). Thus, the average concentration is given as
C ¯ i = 1 L 0 L C i x d x = 1 L 0 L C i , 0 1 γ L L x d x
Setting a = γ L / L , it is obtained that
C ¯ i = 1 L 0 L C i , 0 1 a x d x = C i , 0 L 1 a l n 1 γ L L L
Since 1 γ L > 0 , then | 1 γ L | = 1 γ L ; therefore, the average concentration is given by
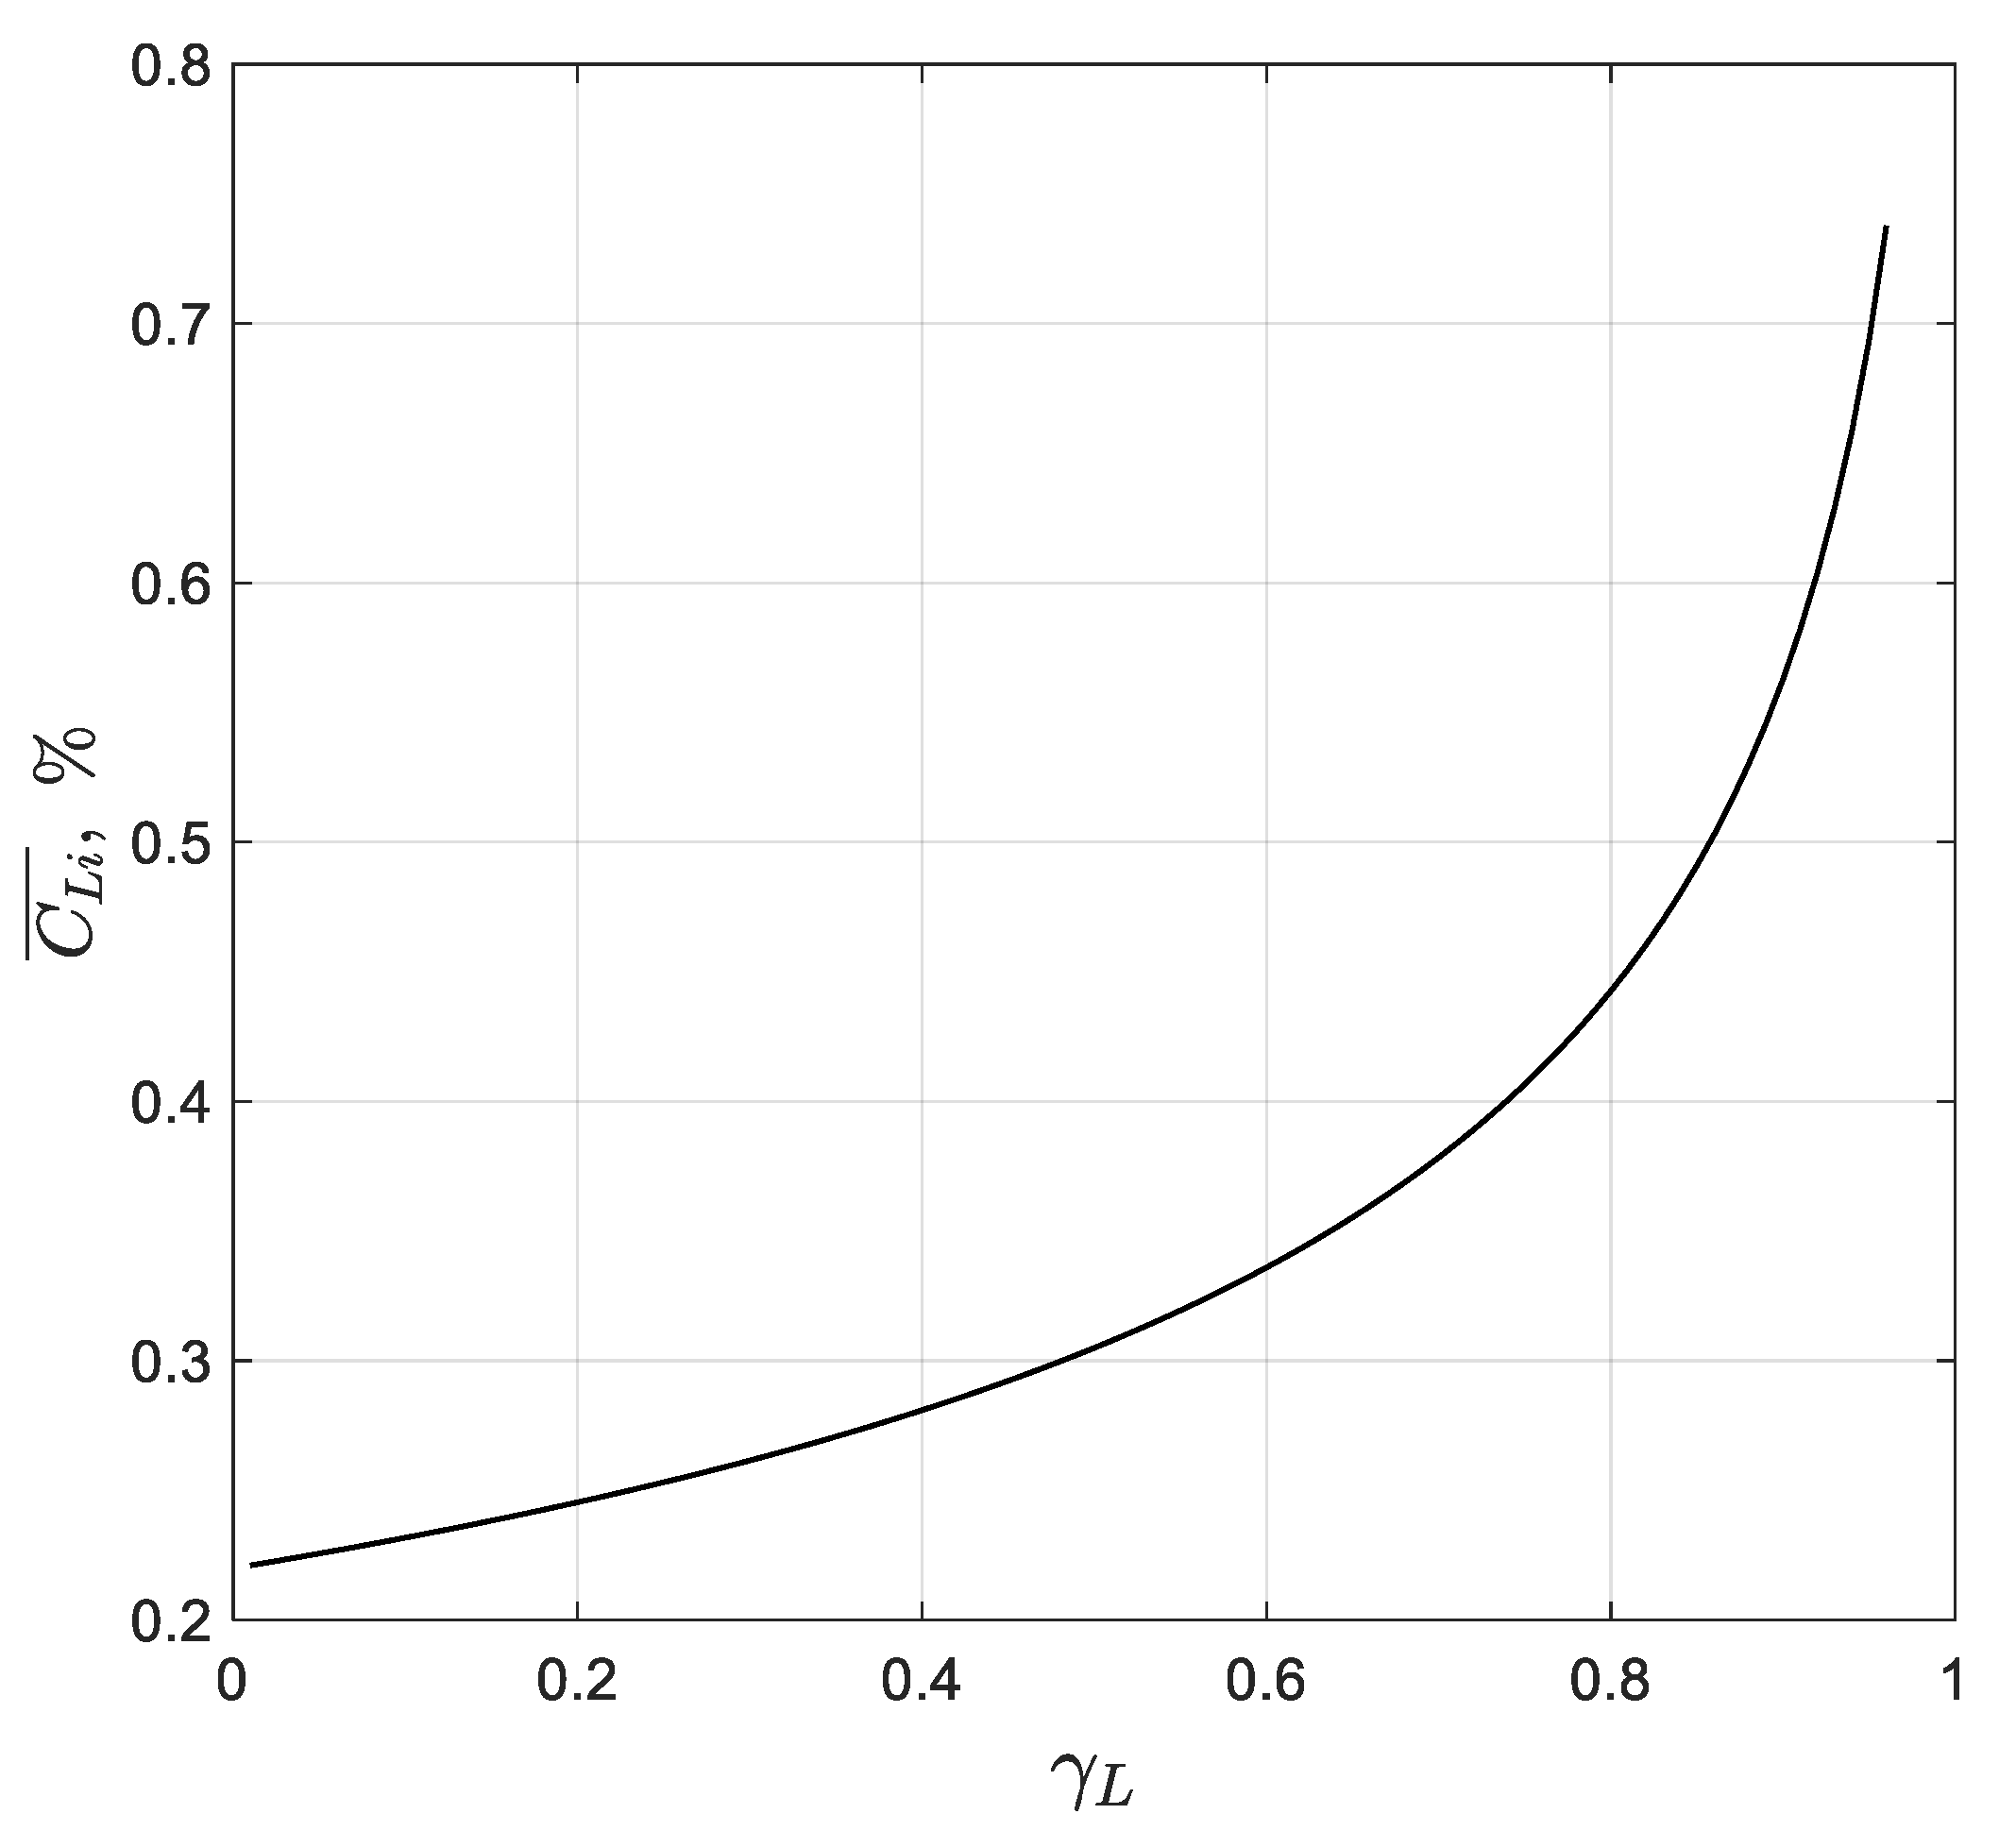
C ¯ i = C i , 0 γ L l n 1 1 γ L ,     0 < γ L < 1
Thus, for a pond system, which concentrates Li from 0.22 to 5.5%, the fraction of water removed in the system is calculated as
γ L = 1 C i , 0 C i , L = 1 0.22 5.5 = 0.96
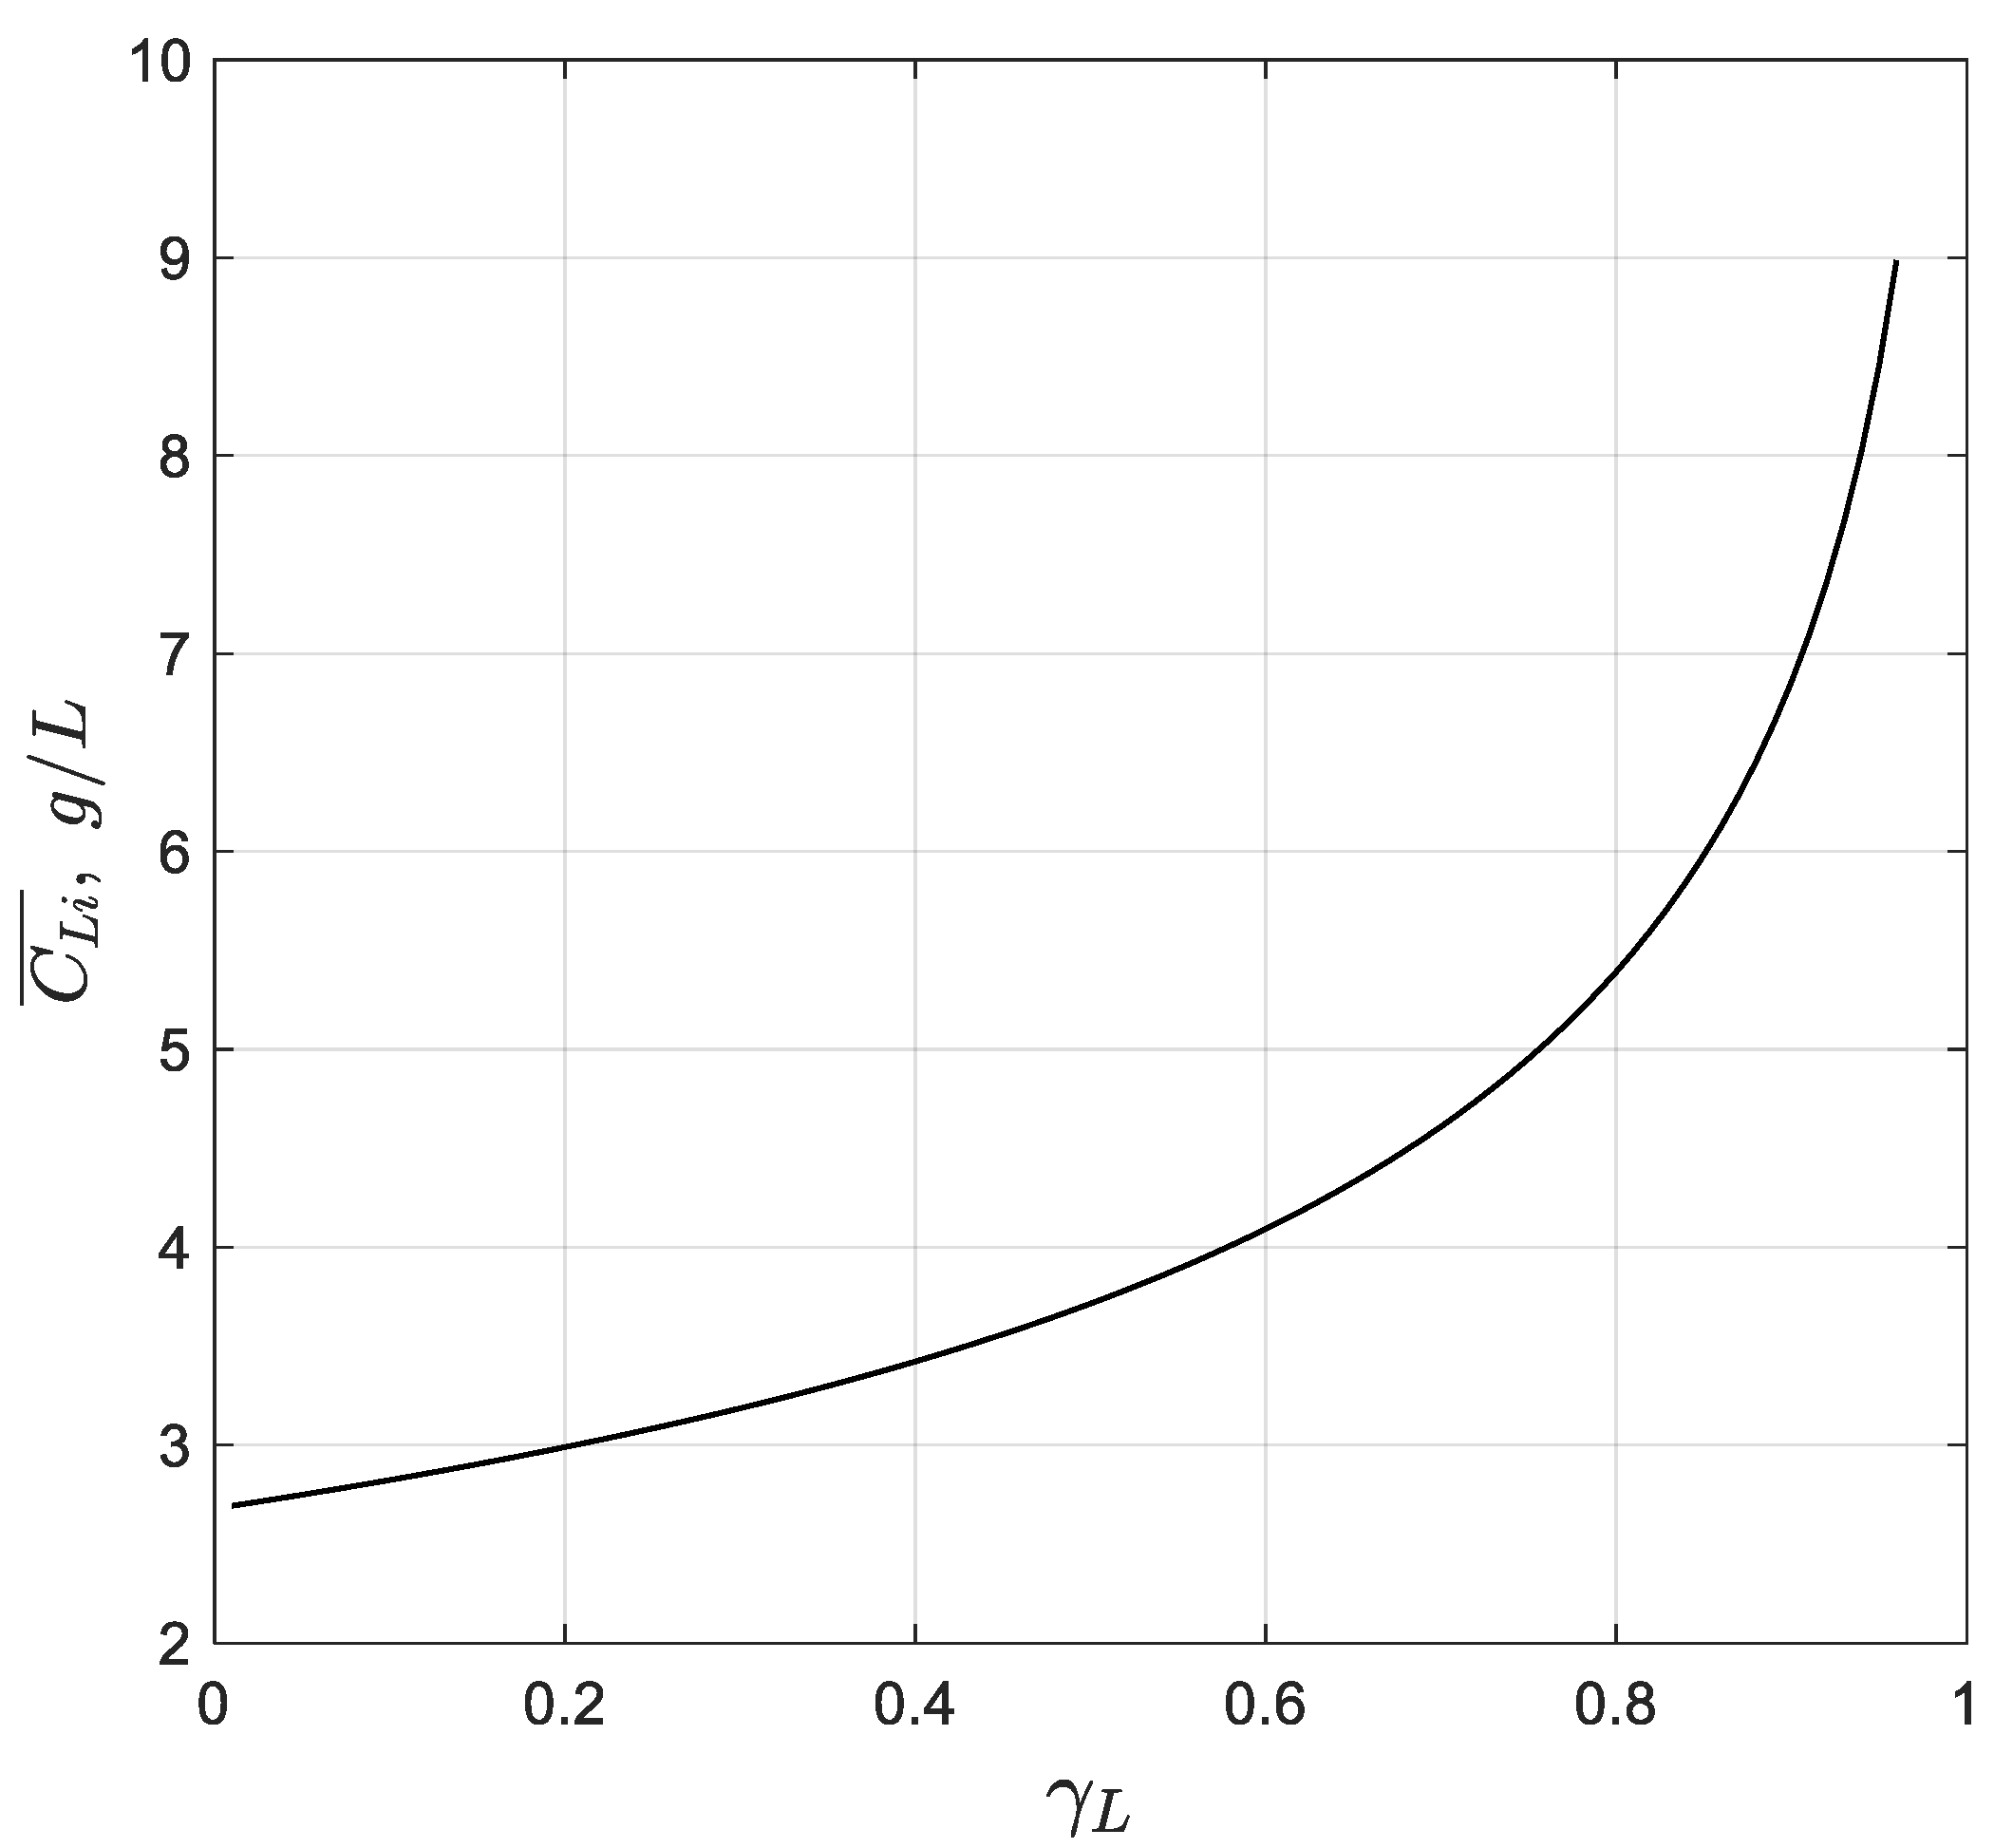
Therefore, using Equation (18), the average lithium concentration will be: C ¯ L i = 0.737 % . Thus, for a given feed brine concentration, Equation (18) allows us to calculate the average concentration of a species in a pond for any value of γ L . Then, considering a feed concentration of C i , 0 = 0.22 % , the average lithium concentration in percentage as a function of γ L is shown in Figure 8. On the other hand, considering a brine density of 1218 g/L, and a feed concentration of C i , 0 = 0.22 % , a feed concentration of C i , 0 = 2.68 g/L is obtained. Thus, Figure 9 shows the resulting average lithium concentration in grams per liter as a function of γ L .

3.3.2. Pond Inventory Calculation

Let the volume of a pond be 70,000 m3, the feed concentration of Li be C L i , 0 = 2.68 g/L, and the discharge concentration of Li be C L i , L = 3.17 g/L for the given conditions; it is then obtained that
γ L = 1 2.68 3.17 = 0.155
Then, using Equation (18), the average Li concentration in the pond is given by
C ¯ L i = 2.68 0.155 l n 1 1 0.155 = 2.91 g L = 2.91 k g m 3
Therefore, the Li inventory is
I L i = 70,000   m 3 · 2.91 k g m 3 = 203.7   t o n s   L i
The inventory, based on the assumption that the average concentration is equal to the discharge concentration—a common practice in industrial applications—is as follows:
I L i = 70,000   m 3 · 3.17 k g m 3 = 221.9   t o n s   L i
Therefore, the relative error associated with that approximation is
221.9 203.7 221.9 · 100 = 8.2 %

3.3.3. Inventory Calculation in a Pond System

In the case of a pond system, which may include several ponds of different dimensions, it is preferable to calculate the concentration profile as a function of the evaporation area. Thus, for a species i that concentrates across a pond system with a total area A t , which is fed with a concentration C i , 0 , and discharges with a concentration C i , A t , the ideal solar evaporation law can be written as
C i A = C i , 0 1 γ A t A t A ,     0 A A t
γ A t = 1 C i , 0 C i , A t
Let the pond system have a total evaporation area of 131 hectares. Considering a feed concentration of Li, C L i , 0 = 0.22 % and a discharge concentration of Li of C L i , A t = 5.5 %. Then
γ A t = 1 0.22 5.5 = 0.96
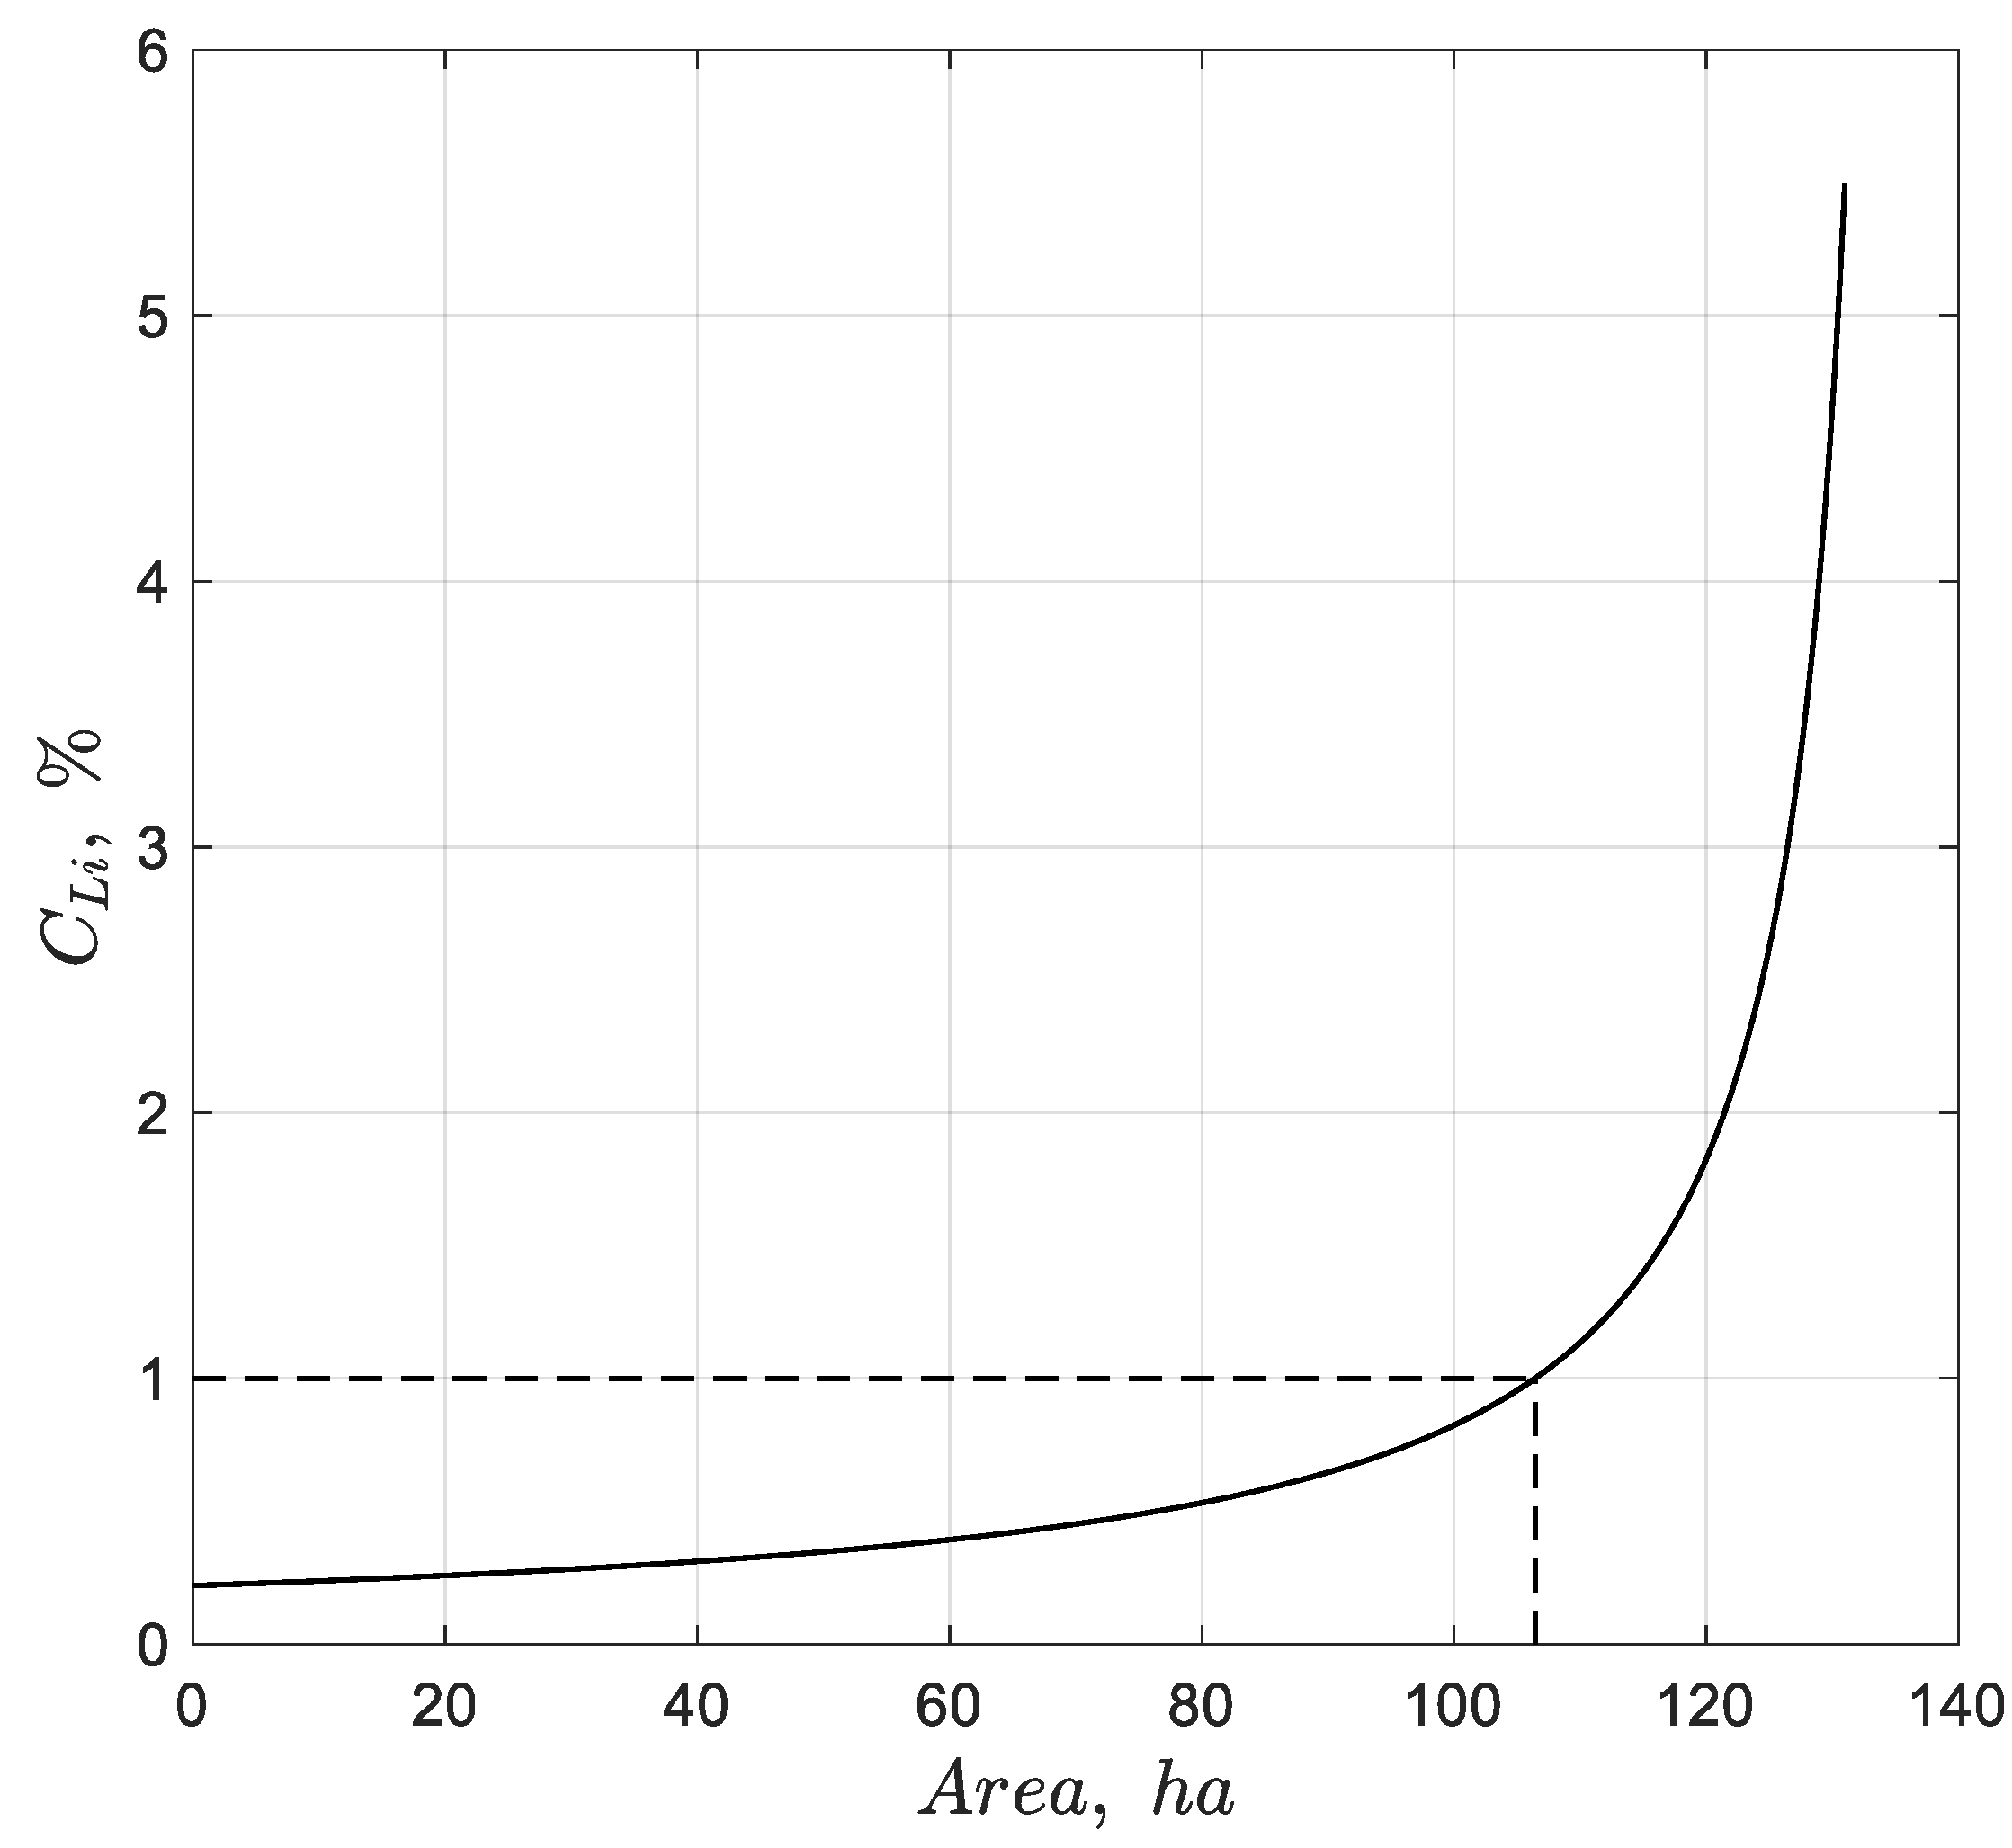
Therefore, the concentration profile across the pond system is given by Equation (28) and shown in Figure 10:
C i A = C i , 0 1 0.96 131 A ,     0 A 131
From Figure 10, we can see that about 80% of the total area is used to increase the concentration of lithium from 0.22 to nearly 1% Li.
To calculate the Li inventory of the pond system, it is necessary to determine the average concentration of the entire pond system. Thus, considering a feed concentration of 2.68 g/L and using Equation (18), it is obtained that
C ¯ L i = C i , 0 γ A t l n 1 1 γ A t = 2.68 0.96 l n 1 1 0.96 = 8.98 g L
Finally, considering an area of 1,310,000 m2 and an average brine height of 0.4 m, the Li inventory is given by
I L i = 1,310,000   m 2 · 0.4 m · 8.98 k g m 3 = 4705.5   t o n s   L i

3.3.4. Required Area Calculation

Let us consider that a pond with an area of 140,519 m2 was constructed, which was fed with a brine with a Li concentration of C L i , 0 = 0.22 % and with a specific flow rate such that, at the steady state, the pond discharged a brine with a concentration of C L i , L = 0.245 %. The objective is to estimate the required area for a system of ponds to discharge a final concentration of C L i , f i n a l = 5.5 % Li. For these conditions, the following is obtained:
γ A 1 i n i t i a l   p o n d = 1 0.22 0.245 = 0.102
γ A 2 f i n a l   p o n d = 1 0.22 5.5 = 0.960
The fraction of evaporated water is directly proportional to the length or area, so
γ A 1 A 1 = γ A 2 A 2 = c o n s t a n t
Then
A 2 = A 1 · 0.960 0.102 = 140,519 m 2 · 0.960 0.102 = 1,322,013   m 2

3.3.5. Comparison with Literature Data

Since the Myers model [25] is the only documented one-dimensional model available in the literature, it will be used to verify the present model.
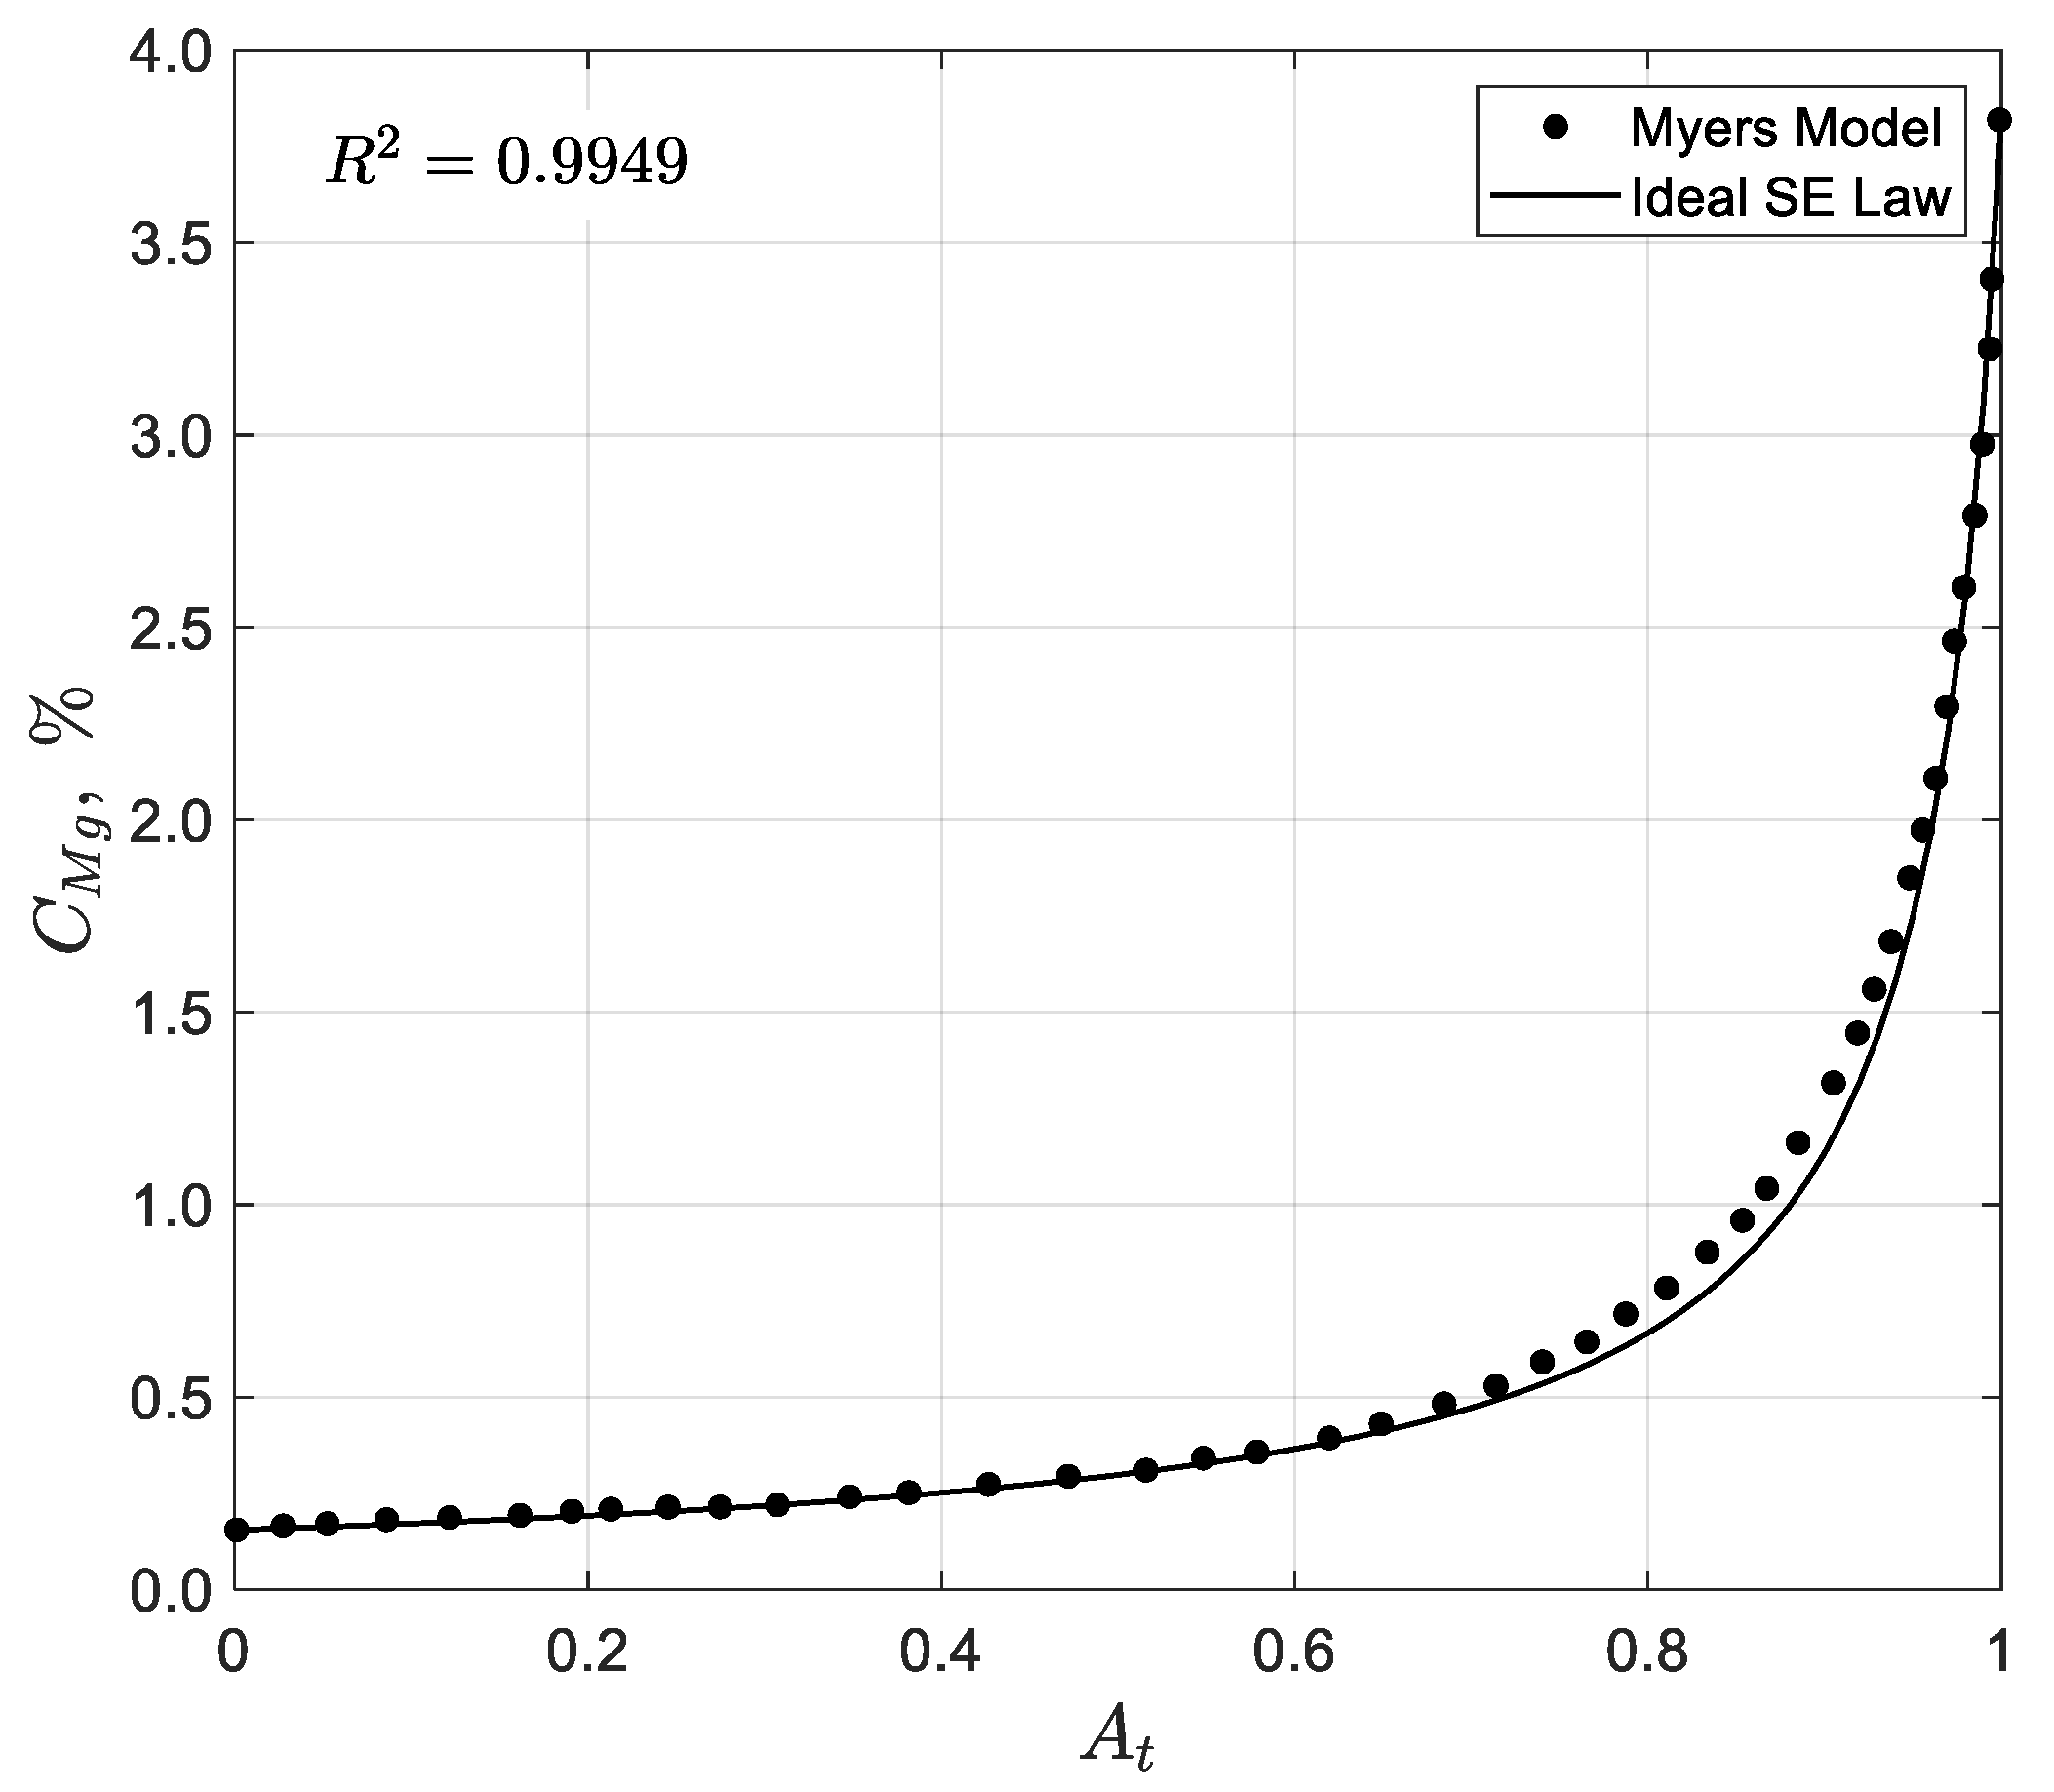
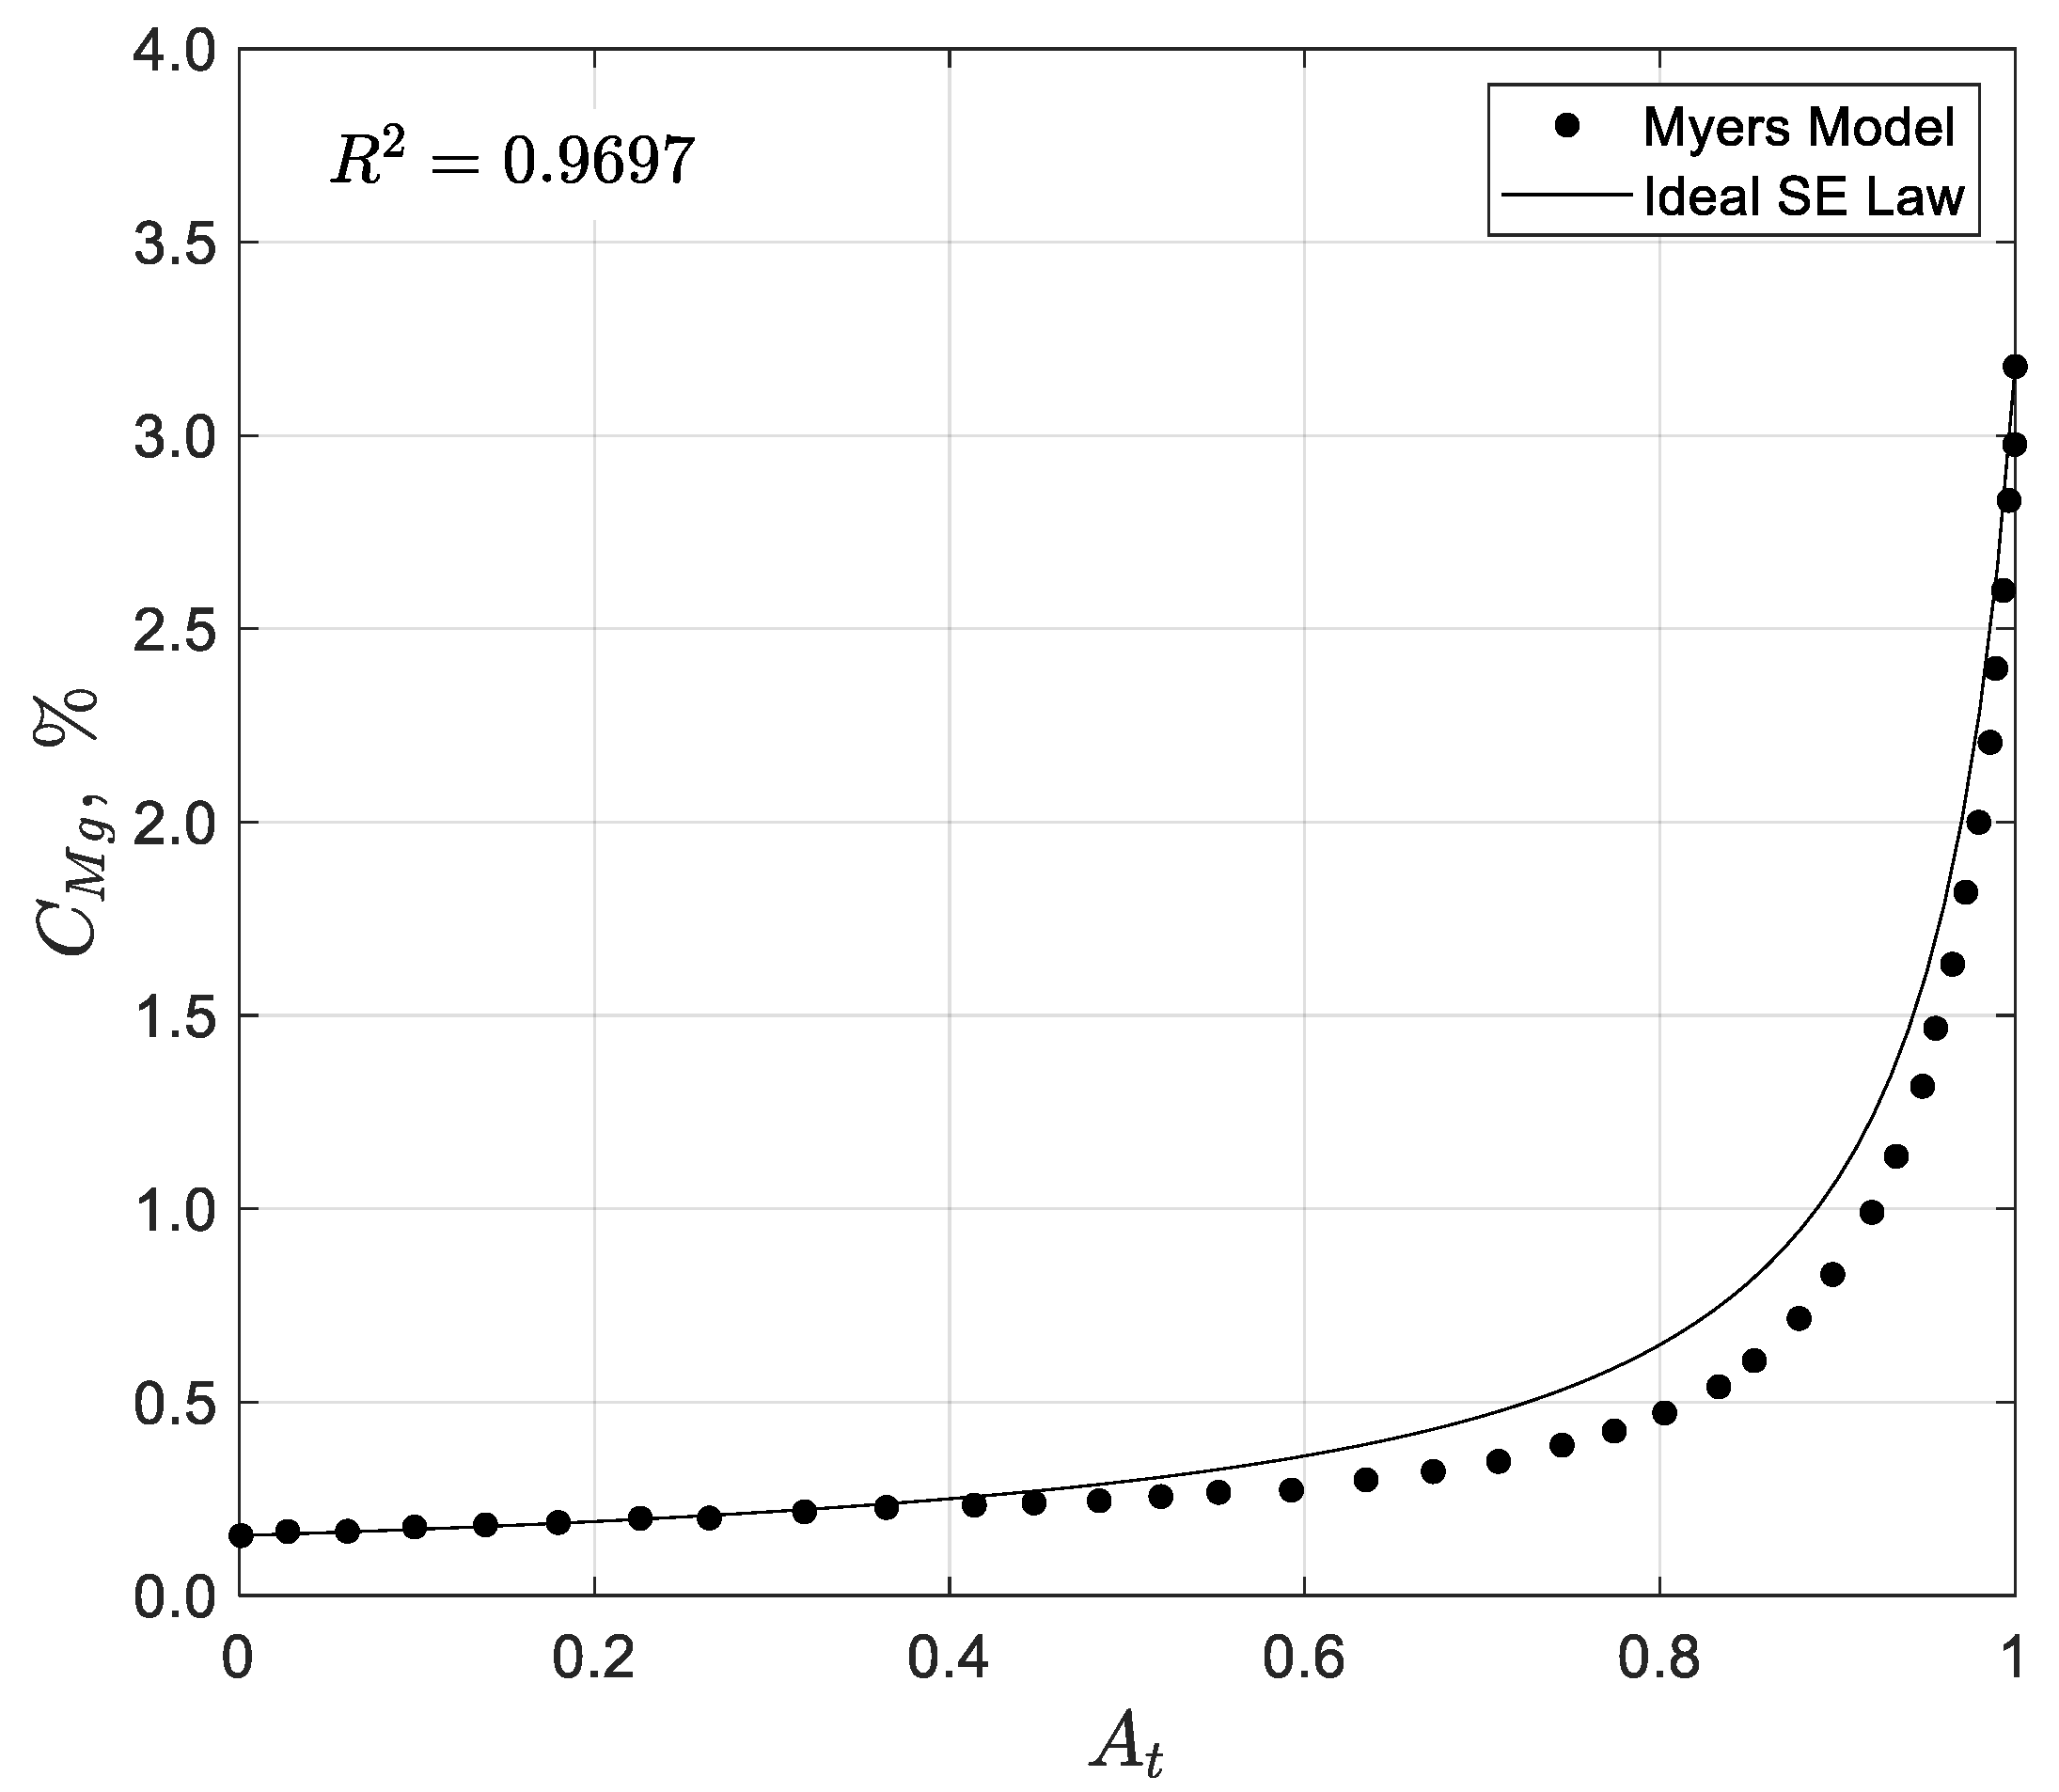
Figure 11 and Figure 12 compare the Mg concentration profile calculated using the ideal solar evaporation law to the Myers model for two different situations. As seen in Figure 11, the Myers model, under conditions of zero rainfall and infiltration, aligns well with the ideal solar evaporation with R2 = 0.9949. However, under conditions of maximum rainfall and infiltration, the model deviates from ideal behavior, exhibiting a shift toward non-ideal evaporation with R2 = 0.9697 (see Figure 12).
Although the Myers model incorporates additional physical phenomena through empirical correlations, it requires many parameters and a calibration effort that complicates its wider application. On the other hand, the ideal evaporation law is much better suited for general practical application given its simplicity and that it only requires the inlet and outlet concentration to a pond, which should be easily available in any industrial plant.

4. Experimental Validation of the Model

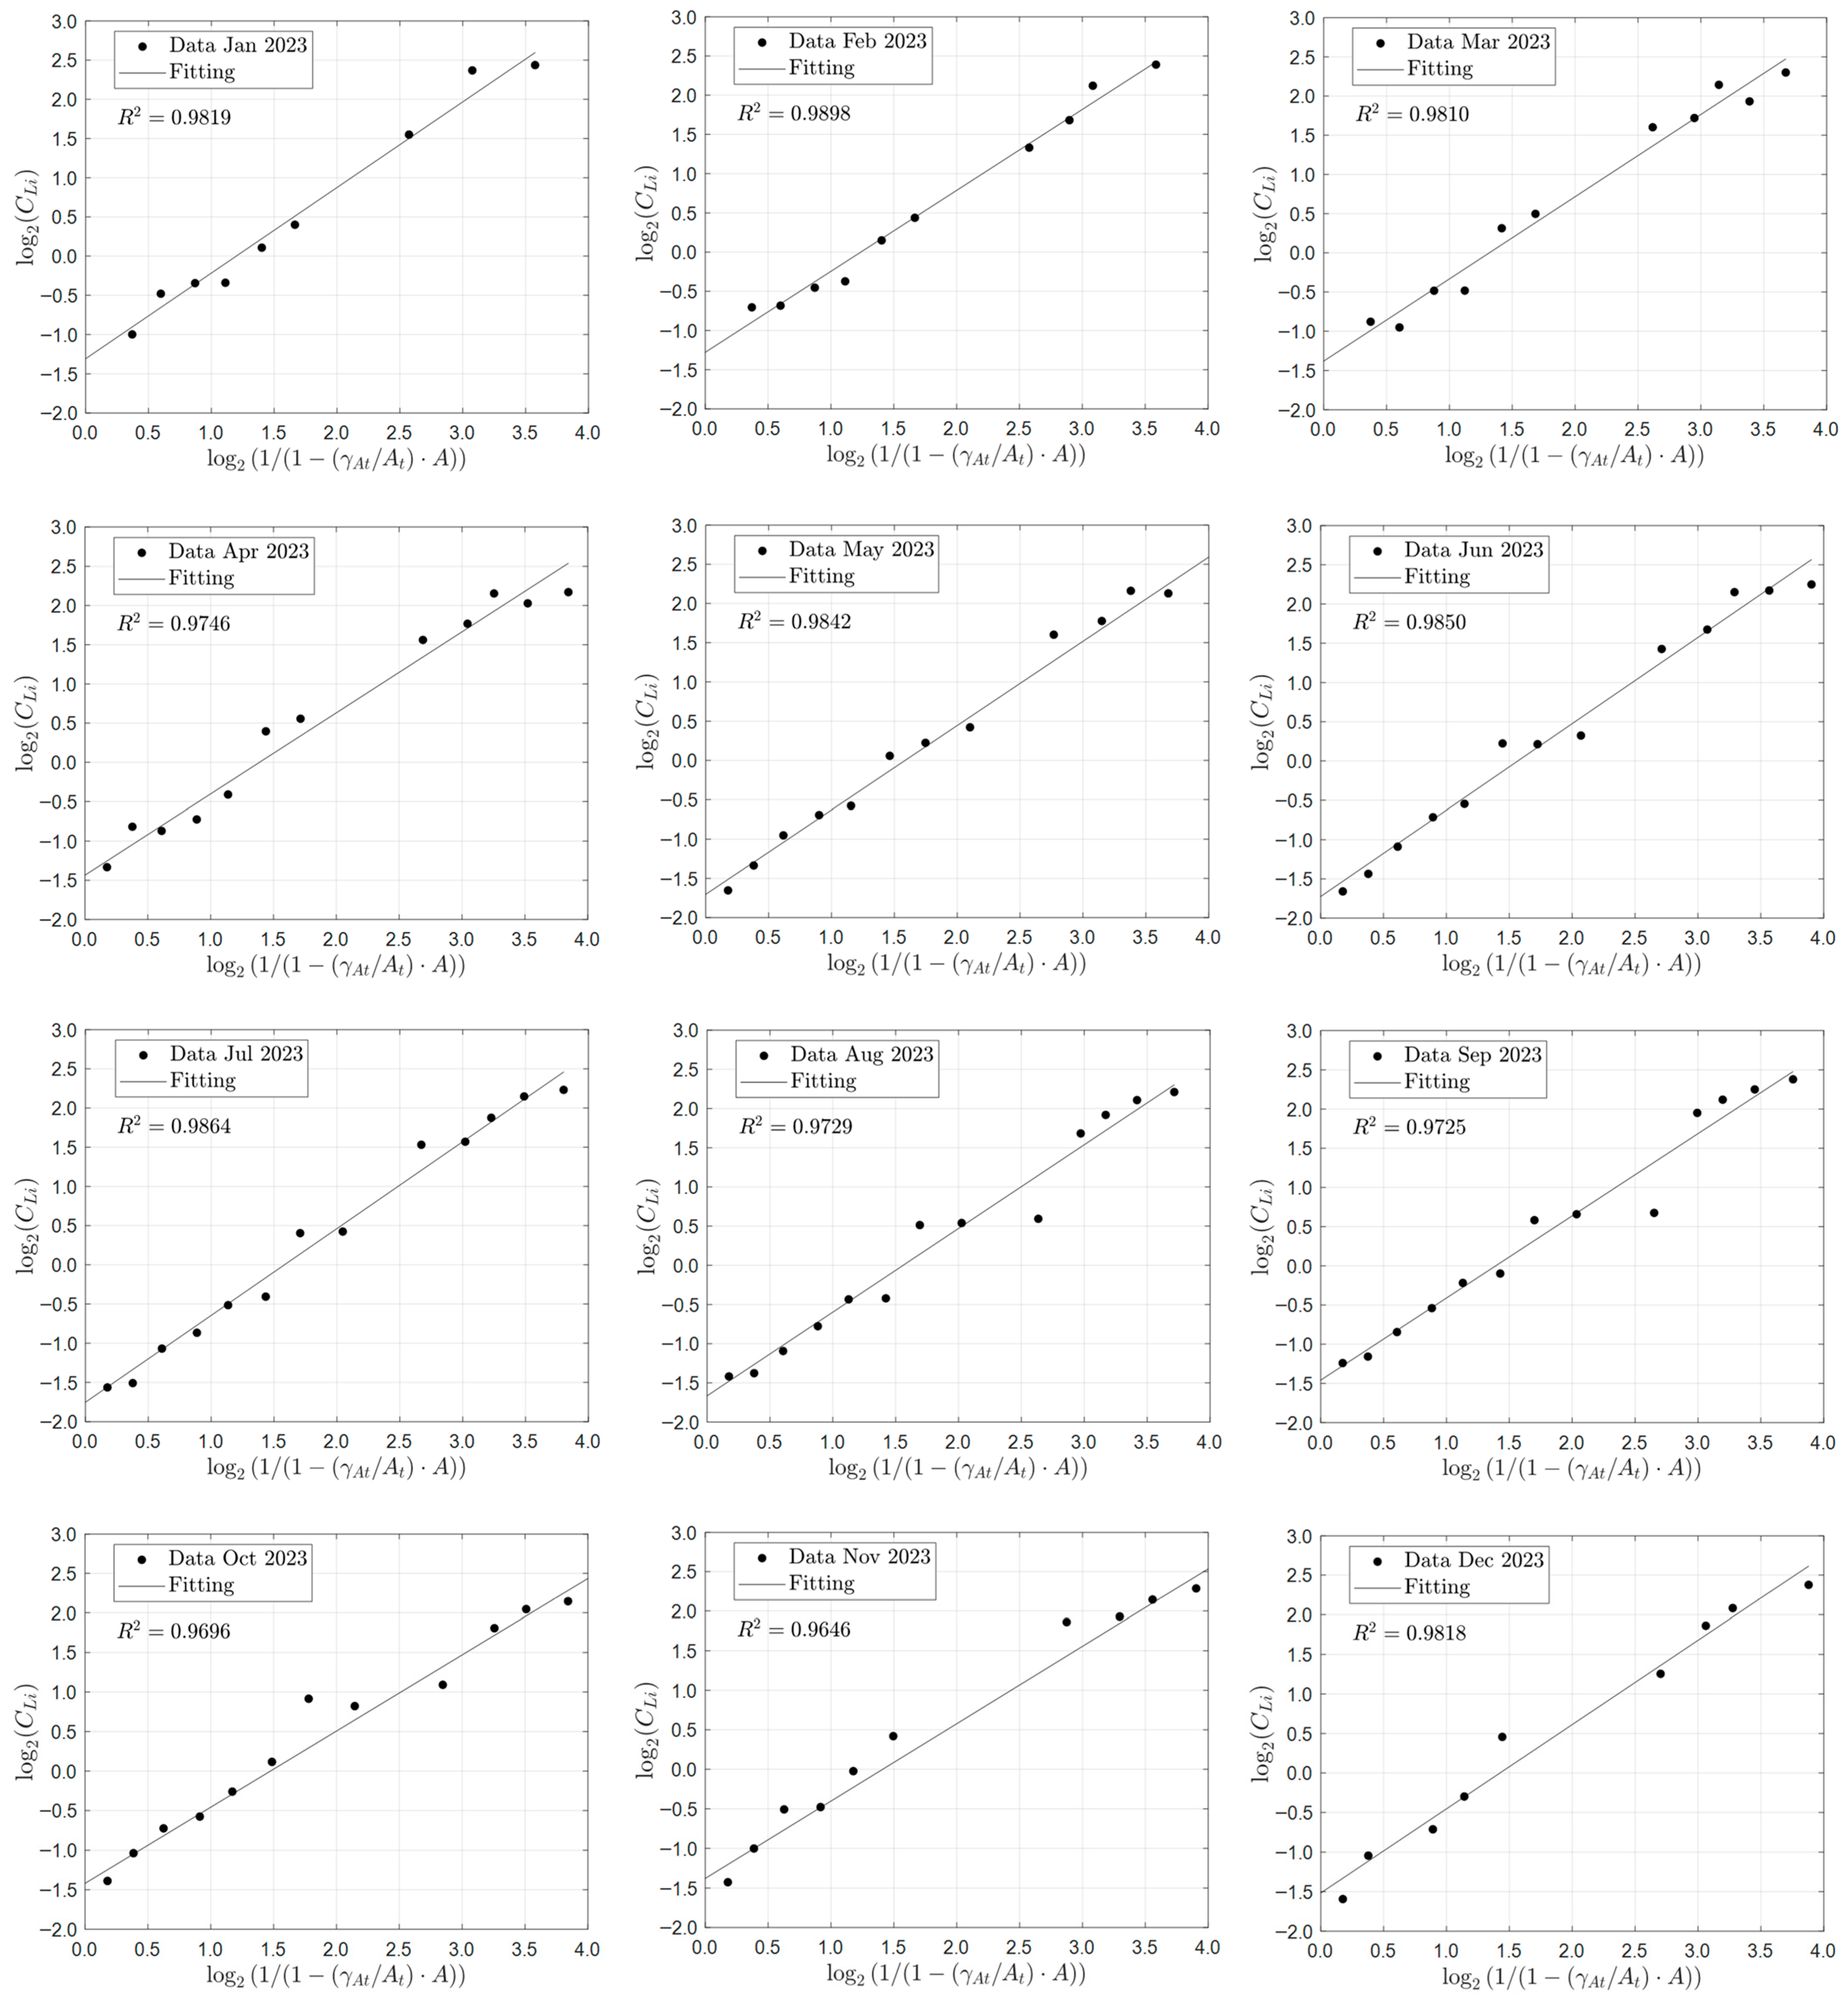
Although the ideal solar evaporation law was developed for an ideal pond that excludes infiltration, rainfall, and precipitation of the species of interest, it should be able to accurately predict the behavior of industrial solar ponds when applied to species that predominantly remain in solution. Therefore, the validation of the ideal solar evaporation law was carried out by comparing the model predictions with averaged monthly industrial data collected in the year 2023 from a pond system of 15 ponds arranged in series at one of Albemarle’s solar evaporation trains in the Salar de Atacama, Chile. The main species of interest in the brine were lithium, magnesium, and boron. The validation results for lithium are summarized below in Figure 13, which shows the comparison between the predictions of the ideal solar evaporation law and the experimental data for lithium from January to December 2023. The linear Equation (11) was used for the validation to better visualize deviations from a straight-line behavior and to protect Albemarle’s proprietary data. The good agreement observed (R2 in the range 0.9646 to 0.9864) indicated that low values of infiltration and rainfall in the industrial ponds do not affect appreciably the lithium concentration profile. Therefore, the ideal solar evaporation law can be used to accurately predict the concentration profile of lithium in an industrial evaporation pond system, and consequently, the lithium inventory of the system.
In the case of magnesium and boron in the brine, their concentrations were expected to increase proportionally with lithium according to the model assumptions. However, the experimental outlet concentrations for these species were significantly lower than predicted by the model, indicating that precipitation occurred within the pond. This is consistent with the known precipitation of magnesium primarily as potassium carnallite (KMgCl3·6H2O) and bischofite (MgCl2·6H2O), and boron precipitation mainly as calcium borate (Ca3(BO3)2). As a result, the ideal solar evaporation model cannot be used to determine the magnesium and boron concentration profiles under these conditions. However, it allows predicting the amounts of B and Mg that precipitate in the pond. The concentration behavior of B and Mg will be addressed further in subsequent articles, using more advanced models developed by the authors. Nevertheless, despite the precipitation of B and Mg in the pond system, the possible entrainment of lithium within the solid phases does not notably affect its concentration profile, thereby preserving the validity of the ideal solar evaporation model for lithium.
Overall, the results confirm that the ideal solar evaporation law provides a robust framework for predicting lithium concentration profiles in industrial ponds when the precipitation of lithium does not occur; and infiltration and rainfall, and the precipitation effects of other species in the brine remain low.
5. Conclusions

The resulting model’s equation, or ideal solar evaporation law, allows us to calculate any species’ concentration profile in an ideal pond just given the concentrations of the species at the inlet and outlet of the pond. The validation of the model using industrial data collected in 2023 in a lithium recovery plant confirmed its accuracy in predicting lithium concentration profiles.
The ideal solar evaporation law allows the calculation of accurate values of pond inventories and area requirements for designing stages. Therefore, the relevance of this study extends beyond the lithium industry to encompass any solar evaporation process aimed at salt recovery or solution concentration.

Author Contributions

Conceptualization, M.S., M.C.R. and R.P.; methodology, M.S.; software, M.S.; validation, M.S., M.C.R. and R.P.; formal analysis, M.S.; investigation, M.S.; resources, D.T.; data curation, D.T.; writing—original draft preparation. M.S.; writing—review and editing, M.C.R. and R.P.; visualization, R.P.; supervision, R.P. All authors have read and agreed to the published version of the manuscript.

Funding

This research received no external funding.

Data Availability Statement

The data presented in this study are available on request from the authors.

Acknowledgments

M. Silva acknowledges The National Agency for Research and Development (ANID) of Chile for support through graduate scholarship Doctorado Becas Chile 2016 #21161780.

Conflicts of Interest

Manuel Silva and Diego Toro are employees of Albemarle Ltda. The paper reflects the views of the scientists and not the company.

References

  1. Makavana, R.; Joshi, V.; Lad, H. Simulation for brine evaporation parameters acquired using distributed embedded system and seepage estimation. In Proceedings of the Second International Conference of Inventive Communication and Computational Technologies (ICICCT), Piscataway, NJ, USA, 20–21 April 2018; pp. 337–340. [Google Scholar] [CrossRef]
  2. Kwok, K.S.; Ng, K.M.; Taboada, M.E.; Cisternas, L.A. Thermodynamics of salt lake system: Representation, experiments, and visualization. AIChE J. 2008, 54, 706–727. [Google Scholar] [CrossRef]
  3. Butts, D. Chemicals from brine. In Kirk-Othmer Encyclopedia of Chemical Technology; Wiley: Hoboken, NJ, USA, 2000. [Google Scholar] [CrossRef]
  4. Pueyo, J.J.; Chong, G.; Ayora, C. Lithium saltworks of the Salar de Atacama: A model for MgSO4-free ancient potash deposits. Chem. Geol. 2017, 466, 173–186. [Google Scholar] [CrossRef]
  5. Wilkomirsky, I. Production of Lithium Carbonate from Brines. U.S. Patent 5,993,759, 30 November 1999. [Google Scholar]
  6. Bloch, M.R.; Farkas, L.; Spiegler, K.S. Solar evaporation of salt brines. Ind. Eng. Chem. 1951, 43, 1544–1553. [Google Scholar] [CrossRef]
  7. Cabello, J. Lithium brine production, reserves, resources and exploration in Chile: An updated review. Ore Geol. Rev. 2021, 128, 103883. [Google Scholar] [CrossRef]
  8. U.S. Geological Survey. Lithium. In Mineral Commodity Summaries; U.S. Geological Survey: Reston, VA, USA, 2020; pp. 98–99. [Google Scholar] [CrossRef]
  9. Kampf, S.K.; Tyler, S.W.; Ortiz, C.A.; Muñoz, J.F.; Adkins, P.L. Evaporation and land surface energy budget at the Salar de Atacama, Northern Chile. J. Hydrol. 2005, 310, 236–252. [Google Scholar] [CrossRef]
  10. McQuarrie, D.A.; Simon, J.D. Physical Chemistry: A Molecular Approach; University Science Books: Sausalito, CA, USA, 1997; Volume 1. [Google Scholar]
  11. Wang, P.; Anderko, A.; Young, R.D. A speciation-based model for mixed-solvent electrolyte systems. Fluid Phase Equilibria 2002, 203, 141–176. [Google Scholar] [CrossRef]
  12. Turk, L.J. Evaporation of brine: A field study on the Bonneville Salt Flats, Utah. Water Resour. Res. 1970, 6, 1209–1215. [Google Scholar] [CrossRef]
  13. Harbeck, G.E., Jr. The Effect of Salinity on Evaporation; U.S. Government Printing Office: Washington, DC, USA, 1955; p. 272-A. [Google Scholar] [CrossRef]
  14. Pancharatnam, S. Leakage of brine from solar evaporation ponds. Desalination 1972, 11, 303–313. [Google Scholar] [CrossRef]
  15. Pengsheng, S.; Yan, Y. Thermodynamics and phase diagram of the salt lake brine system at 298.15 K: V. model for the system Li+, Na+, K+, Mg2+/Cl, SO42−–H2O and its applications. Calphad 2003, 27, 343–352. [Google Scholar] [CrossRef]
  16. Musso, J.A. Solubility phase diagrams coupled to computer science (DPAO). Part I: Theory of the sequential representation. Calphad 2003, 27, 65–69. [Google Scholar] [CrossRef]
  17. Hammi, H.; Musso, J.A.; M’nif, A.; Rokbani, R. Solubility phase diagrams coupled to computer science (DPAO). Part II: Applied to isothermal evaporation of Tunisian natural brines. Calphad 2003, 27, 71–77. [Google Scholar] [CrossRef]
  18. Hammi, H.; Musso, J.; M’nif, A.; Rokbani, R. Crystallization path of natural brine evaporation using the DPAO method. Desalination 2004, 166, 205–208. [Google Scholar] [CrossRef]
  19. Hammi, H.; Musso, J.; M’nif, A.; Rokbani, R. Tunisian salt lakes evaporation studied by the DPAO method based on solubility phase diagrams. Desalination 2003, 158, 215–220. [Google Scholar] [CrossRef]
  20. Sartori, E. Solar still versus solar evaporator: A comparative study between their thermal behaviors. Sol. Energy 1996, 56, 199–206. [Google Scholar] [CrossRef]
  21. Tamimi, A.; Rawajfeh, K. Lumped modeling of solar-evaporative ponds charged from the water of the Dead Sea. Desalination 2007, 216, 356–366. [Google Scholar] [CrossRef]
  22. El-Badry, H. Development of solar ponds optimization model: Arab potash solar system—A case study. Nat. Resour. 2013, 4, 71–82. [Google Scholar] [CrossRef]
  23. Butts, D.S. Basic solar pond modeling and material balance techniques. In Salts & Brines ‘85: Proceedings of the Symposium, Solution Mining of Salts and Brines; Society of Mining Engineers, AIME: Littleton, CO, USA, 1985; p. 135. [Google Scholar]
  24. Ossandón, K.; Pinto, P.; Cisternas, L.A. Planning and scheduling of salt harvest in solar evaporation ponds. Comput. Chem. Eng. 2010, 34, 620–630. [Google Scholar] [CrossRef]
  25. Myers, D.M.; Bonython, C.W. The theory of recovering salt from seawater by solar evaporation. J. Appl. Chem. 1958, 8, 207–219. [Google Scholar] [CrossRef]
  26. Kasedde, H.; Namagambe, A.; Lwanyaga, J.D.; Kirabira, J.B.; Okumu, D. Numerical modelling of a solar salt pan for improved salt production at Lake Katwe, Uganda. Case Stud. Therm. Eng. 2023, 42, 102592. [Google Scholar] [CrossRef]
Figure 1. Qualitative velocity and concentration fields of a solar evaporation pond without baffles.
Minerals 15 01078 g001
Figure 2. Three-dimensional conceptualization of a solar evaporation pond illustrated with unidirectional laminar flow (gray arrows are velocity vectors.
Minerals 15 01078 g002
Figure 3. Conceptualization of an ideal solar evaporation pond (gray arrows are velocity vectors).
Minerals 15 01078 g003
Figure 4. Relationship between the fraction of water removed, γ , and n.
Minerals 15 01078 g004
Figure 5. Effect of increasing γ L from 0 to 0.5.
Minerals 15 01078 g005
Figure 6. Effect of a sinusoidal γ L produced by temporal variation (seasonal radiation).
Minerals 15 01078 g006
Figure 7. Effect of a sinusoidal γ L produced by temporal variation and smooth random noise in the feed concentration C L i , 0 .
Minerals 15 01078 g007
Figure 8. Average lithium concentration in % as a function of   γ L .
Minerals 15 01078 g008
Figure 9. Average lithium concentration in g/L as a function of   γ L .
Minerals 15 01078 g009
Figure 10. Lithium concentration profile in % across the pond system.
Minerals 15 01078 g010
Figure 11. Comparison of the Mg concentration profile according to the ideal solar evaporation law to the Myers model profile for the case of zero rainfall and infiltration.
Minerals 15 01078 g011
Figure 12. Comparison of the Mg concentration profile according to the ideal solar evaporation law to the Myers profile for the case of maximum rainfall and infiltration.
Minerals 15 01078 g012
Figure 13. Validation of the ideal solar evaporation law for lithium over the year 2023.
Minerals 15 01078 g013
Disclaimer/Publisher’s Note: The statements, opinions and data contained in all publications are solely those of the individual author(s) and contributor(s) and not of MDPI and/or the editor(s). MDPI and/or the editor(s) disclaim responsibility for any injury to people or property resulting from any ideas, methods, instructions or products referred to in the content.