Article

Electrical Imaging Across Eastern South China: New Insights into the Intracontinental Tectonic Process During Mesozoic

1
State Key Laboratory of Deep Earth and Mineral Exploration, Chinese Academy of Geological Sciences, Beijing 100037, China
2
School of Geophysics and Space Exploration, East China Institute of Technology, Nanchang 330013, China
3
Guizhou Qianmei Foundation Engineering Co., Ltd., Guiyang 550081, China
4
Changjiang Geophysical Exploration & Testing Co., Ltd., Wuhan 430014, China
*
Authors to whom correspondence should be addressed.
Minerals 2025, 15(10), 1035; https://doi.org/10.3390/min15101035
Submission received: 27 August 2025 / Revised: 26 September 2025 / Accepted: 28 September 2025 / Published: 29 September 2025

Abstract

To further investigate the collision process and tectonic regime transition between the North China (NCB) and South China Block (SCB), two magnetotelluric profiles were arranged across the Dabie Orogeny Belt (DOB) and eastern SCB. We then obtain the lithospheric resistivity models. The prominent feature revealed by our new model is an extensive conductive arc from the lower crust to the upper mantle, across the Jiangnan orogenic belt (JNOB) and the eastern Cathaysia Block (CAB). In addition, a huge resistor beneath the conductive arc is revealed, which is separated by a conductive wedge. Combining the heat flow and seismic tomographic imaging results, the conductors are to contain a large amount of hot material that present as the detachment layers (belts) controlled by the two subduction slabs. Considering multi-phase magmatism in the study area, new models suggest an intracontinental tectonic event in eastern CAB. Therefore, we propose a reliable tectonic process that occurred in the study area, including five stages: (1) an eastward intracontinental subduction and orogen carried out in CAB before the collision between SCB and NCB; (2) an extensional structural developed in CAB, following the subduction slab wrecking/sinking; (3) after the collision with NCB, the SCB crust/lithosphere thickened following the westward subduction of the Paleo-Pacific plate; (4) following the westward Yangtze slab sinking, the regional extension developed with the asthenosphere upwelling beneath SCB; (5) afterwards, the SCB was welded into one continent in a setting of westward compression.

1. Introduction

The South China block (SCB) is located in the southeast of Eurasia, on the verge of the Western Pacific, and borders the Qinling–Dabie orogenic belt on the northwest [1]. Following the closing of the South China Ocean, the amalgamation between the Cathaysia (CAB) and Yangtze blocks (YGB) took place along the northeast–southwest trending Jiangshan–Shaoxing suture [2], forming the Jiangnan orogenic belt (JNOB) [3,4]. The accretion time is believed to be earlier than the Late Paleozoic [4]. In the early Mesozoic, a subduction–collision process occurred between the North China block (NCB) and SCB at 245–215 Ma [5,6,7], forming the Lower Yangtze Depression (LYD) as the foreland [8,9]. Controlled by the strong Mesozoic magmatism [9,10,11], abundant resources are stored in the LYD (also called the Middle-Lower Reaches of Yangtze metallogenic belt, MLRYMB) and eastern JNOB (also called Qinzhou-Hangzhou metallogenic belt, QHMB) [8,12]. A theory of intracontinental mineralization has been proposed to explain the extensive mineralization in eastern SCB as a product of vertical crust-mantle interaction in the Mesozoic [1].
In the LYD (MLRYMB), more than 200 kinds of polymetallic (Cu-Au-Pb-Zn, etc.) deposits have been found [8], which were majorly constrained by three deep faults, the Xiangfan–Guangji fault (XGF) and Tancheng–Lujiang fault (TLF) in the northwest, and the Yangxin–Changzhou fault (YCF) in the southeast [13]. In the eastern JNOB (QNMB) of our study area, more than 40 super-large Cu-Au-Pb-Zn-Ag deposits have been revealed [14], constrained by two deep faults: the Hangzhou–Jinxiu fault (HJF) on the northwest and Jiangshan–Shaoxing fault (JSF) on the southeast [15].
Because of the great scientific significance and resource potential of the MLRYMB and QHMB, geoscientists have intensively studied their tectonic-magmatism and mineralization mechanism, e.g., [8,9,12,16]. However, most studies focused on geologic, geochemical, and geochronometric results and were limited to local ore deposits and districts, e.g., [8,11,14,17], lacking deep geophysical constraints. Moreover, the tectonic setting and genesis of magmatism are still debated, especially in eastern SCB. One is Alps-type continental collision, mantle plume activities, or continental extension [18,19,20] models independent of Paleo-Pacific plate subduction. The other is plate or oceanic ridge subduction, or multi-block interaction models [21,22] dependent on Paleo-Pacific activity. More results show a feature of reconstruction of the ancient continental margin and intracontinental structure in eastern SCB, lacking ocean-island basalt and continental-arc andesite [15]. Therefore, intracontinental structures become the key for tectonic-magnetism and mineral system understanding.
The magnetotelluric (MT) was well used in the deep tectonic and process studies, e.g., [16,23], because of its advantage of exploration depth and sensitivity for fluid. We carried out two MT profiles (Figure 1) and proposed a five-stage geologic model to explain the intracontinental evolution of eastern SCB.

2. Geologic Setting

The study area can be divided into four sub-belts, including DOB, LYD, JNOB, and CAB, which are bounded by TLF, Jiangnan fault (JNF), and JSF [9,15]. In the eastern SCB, a huge metamorphic volcano-sedimentary basement of Paleo-Neoproterozoic is exposed on the surface, distributed in the CAB and YGB [3]. Then, sedimentary clastic rocks formed in the Palaeozoic (Cambrian—Permian), but coal-bearing and carbonate formations were mixed from the Carboniferous. In the Mesozoic, clastic rocks of continental facies formed, and volcanic-sedimentary rocks formed and were widely distributed from late Jurassic to early Cretaceous [9].
The regional faults with northeast direction are well developed in the eastern SCB, such as TLF, NLF, HJF, JSF, and ZDF (Figure 1). Magmatism widely occurred in the late Mesozoic [24], mainly composed of the early Cretaceous acid lava and Yanshanian (early Jurassic to late Cretaceous) granite (I-type, S-type, A-type) rocks [25,26]. It was evidenced as one important control factor for the mineralization [12].

3. Data Processing and Analysis

3.1. Data Acquisition and Processing

Broadband MT data were subsequently collected at 179 stations along two profiles (Figure 1) in the eastern SCB and DOB with site spacing of 3–5 km. The profile in the northeast starts from the LYD (east of the Yangtze River) and extends southeastward, across Wuhu, Xuancheng, Hangzhou, Shaoxing, and Shengzhou cities. Moreover, it crosses a series of major faults (Figure 1), such as the NLF, HJF, JSF, and ZDF. The profile in the southwest starts from eastern DOB and extends southeastward across Anqing and Huangshan cities and TLF, HJF, and NLF.
Time series of two orthogonal horizontal electric channels (Ex, Ey, x is north-south direction; y is east-west direction) and three magnetic channels (Hx, Hy, Hz, z is depth direction) were collected, with an average recording time of 40 h. They were used to calculate impedance (Z = E/H) transfer functions with robust estimation and remote reference denoising techniques. The impedance data were obtained over a frequency range of 0.0005–320 Hz. The skin depth, which can be estimated by the product of the period and corresponding apparent resistivity, reaches an adequate penetration depth (~300 km) for all stations with 0.0005 Hz and an average apparent resistivity value ~1000 Ω·m.
Although apparent resistivity and impedance phase curves are generally coherent with each other and have a good quality, a de-noising method [27] appendix has been used to select the data automatically. The data, which cannot fit into a 1D inversion, was removed to achieve curve continuity and smoothness. Then, we sorted the data manually for a quality check. For the static shift correction, a new method [28] based on constraining inversion was used here.

3.2. Data Analysis

(1)
Phase tensor analysis
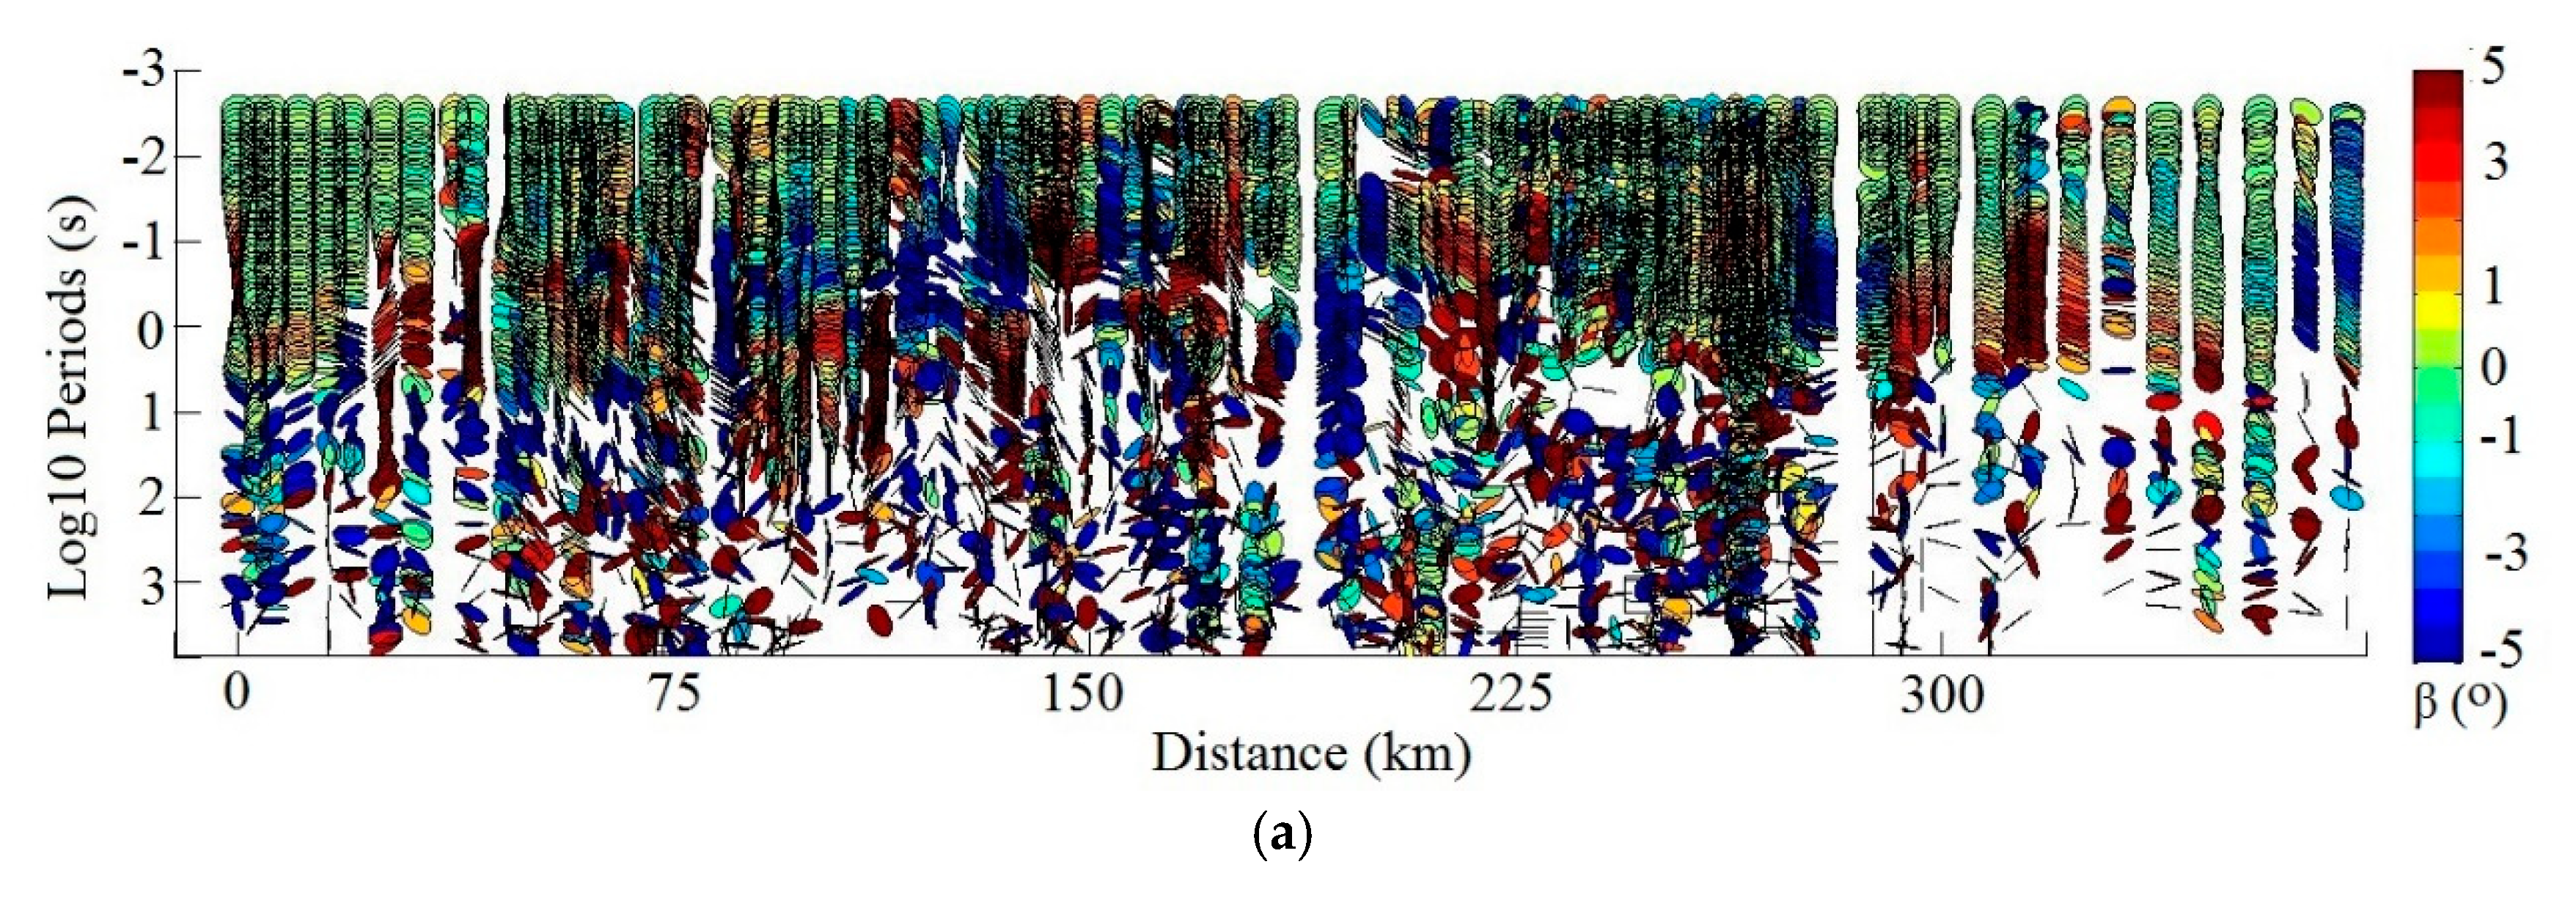
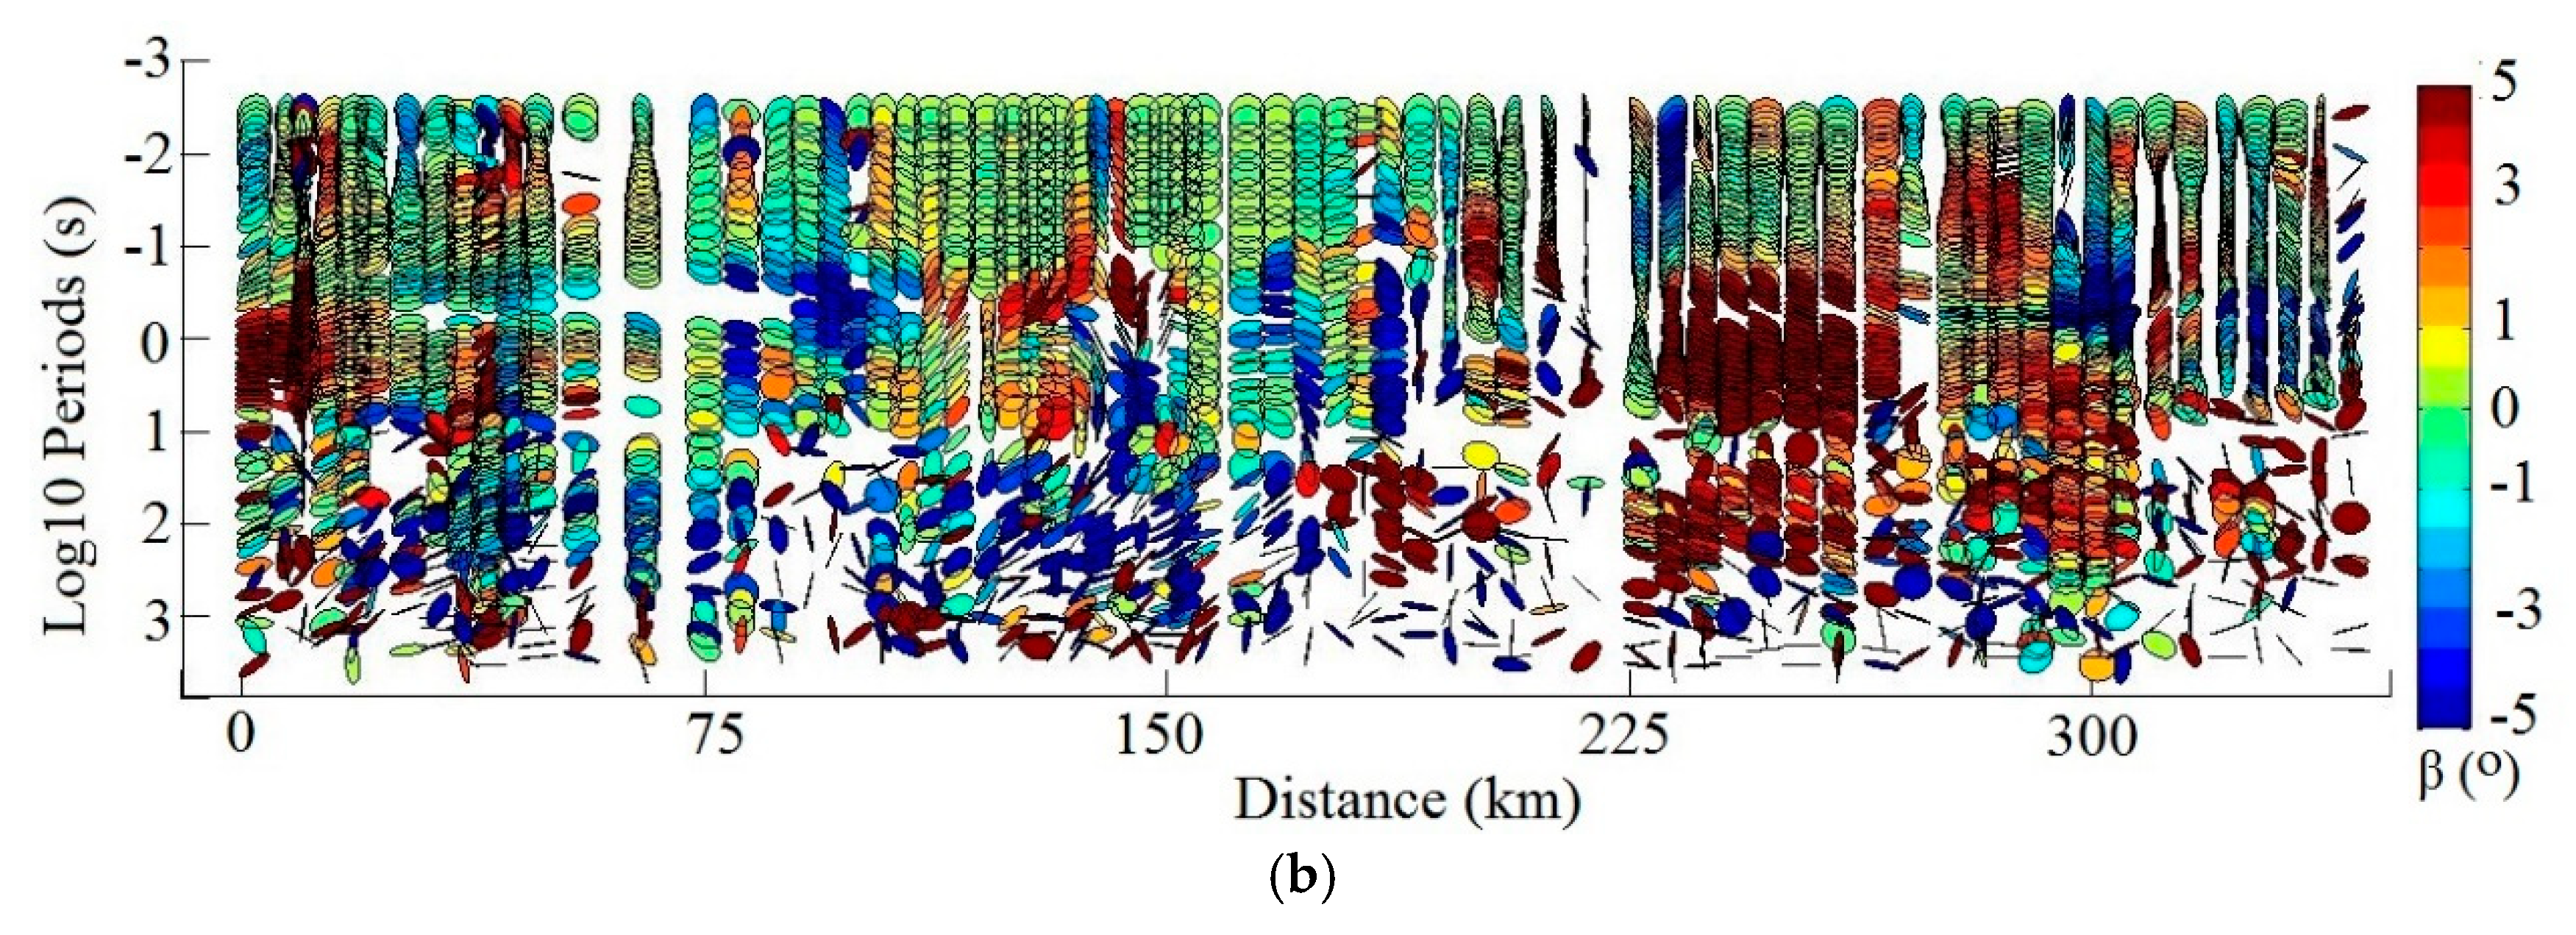
The phase tensor analysis [29] is used here to reveal the dimensionality and strike direction of the MT data (the computation software is courtesy of Hao Dong, China University of Geosciences). The phase tensor ellipses at all frequencies for all stations are shown in Figure 2a,b. The current flow direction is shown by the color-filled ellipses with skew values (|β|), indicating data dimensionality. The dimensionality can be considered as 1-D or 2-D when |β| < 3, and as 3-D with larger |β| values. The major and minor axes of the ellipse indicate the electrical principal axis and strike direction with uncertainty of 90 degrees.
In Figure 2a, the ellipses for all sites of line Hangzhou show weak polarization and relatively low skew values in the high frequency range (>10 Hz), which represent the electrical features in the uppermost crust. The ellipses show northeast direction at the boundary zone of blocks (e.g., at profile distance ~90, 230, 310 km), and different directions for shallow structures (e.g., at profile distance ~40, 110, 130, 150, 175, 200, 290, 360 km) with relatively high skew, indicating 2D-3D structures. In the frequency range of 10–0.1 Hz, the phase tensor ellipses present as a waved layer (“M” shaped) with high skew values (|β| > 3) in most areas except both sides of the profile. The major strike directions change in NE-EW-NW-EW-NW-NE-NW from northwestern profile to the southeast. As the frequency decreases (<0.1 Hz), a “W” shaped layer with high skew values (mostly |β| > 3) exists along the profile underlying the “M” shaped layer at the middle frequency. The two opposite layers indicate a huge anomaly existed in the center of the profile, representing distinct tectonic processes in the study area.
In Figure 2b, the ellipses of line Anqing show weak polarization and relatively low skew value in the high frequency range (>3 Hz), representing the uppermost crust. The northeast-directed structures represent the suture zones of blocks (e.g., at line distances of ~110, 140, 205 km). Other shallow structures (e.g., at line distances of ~0–100, 190–230, 290–355 km) show non-uniform directions with relatively high skew. At middle frequency (3–0.1 Hz), the ellipses form a waved layer with high skew values (|β| > 3) in most areas except the center of the profile, and the major strike directions change in NE-NW-NE from northwestern profile to the southeast. The waved layer contains two main inflexions at distances of ~140 and 260–280 km with high skew values. As the frequency decreases (<0.1 Hz), another waved layer with high skew values (mostly |β| >3) occurs with an opposite formation to that at the middle frequency. And the strike changes into NE-NW. Similarly, the two waved layers indicate a huge anomaly in the southeastern profile, representing different tectonic processes of YGB and CAB.
(2)
Pseudo-sections analysis
Typical curves of apparent resistivity (ρ = |Z|2/ωμ) and impedance phase (P = atan [Zima/Zreal]) for the TE (Ex/Hy) and TM (Ey/Hx) mode data are shown in Figure 3 with data rotation (now x is the perpendicular direction of the line, y is the line direction) and denoising (delete the crude data). The reserved data has better quality for the inversion.
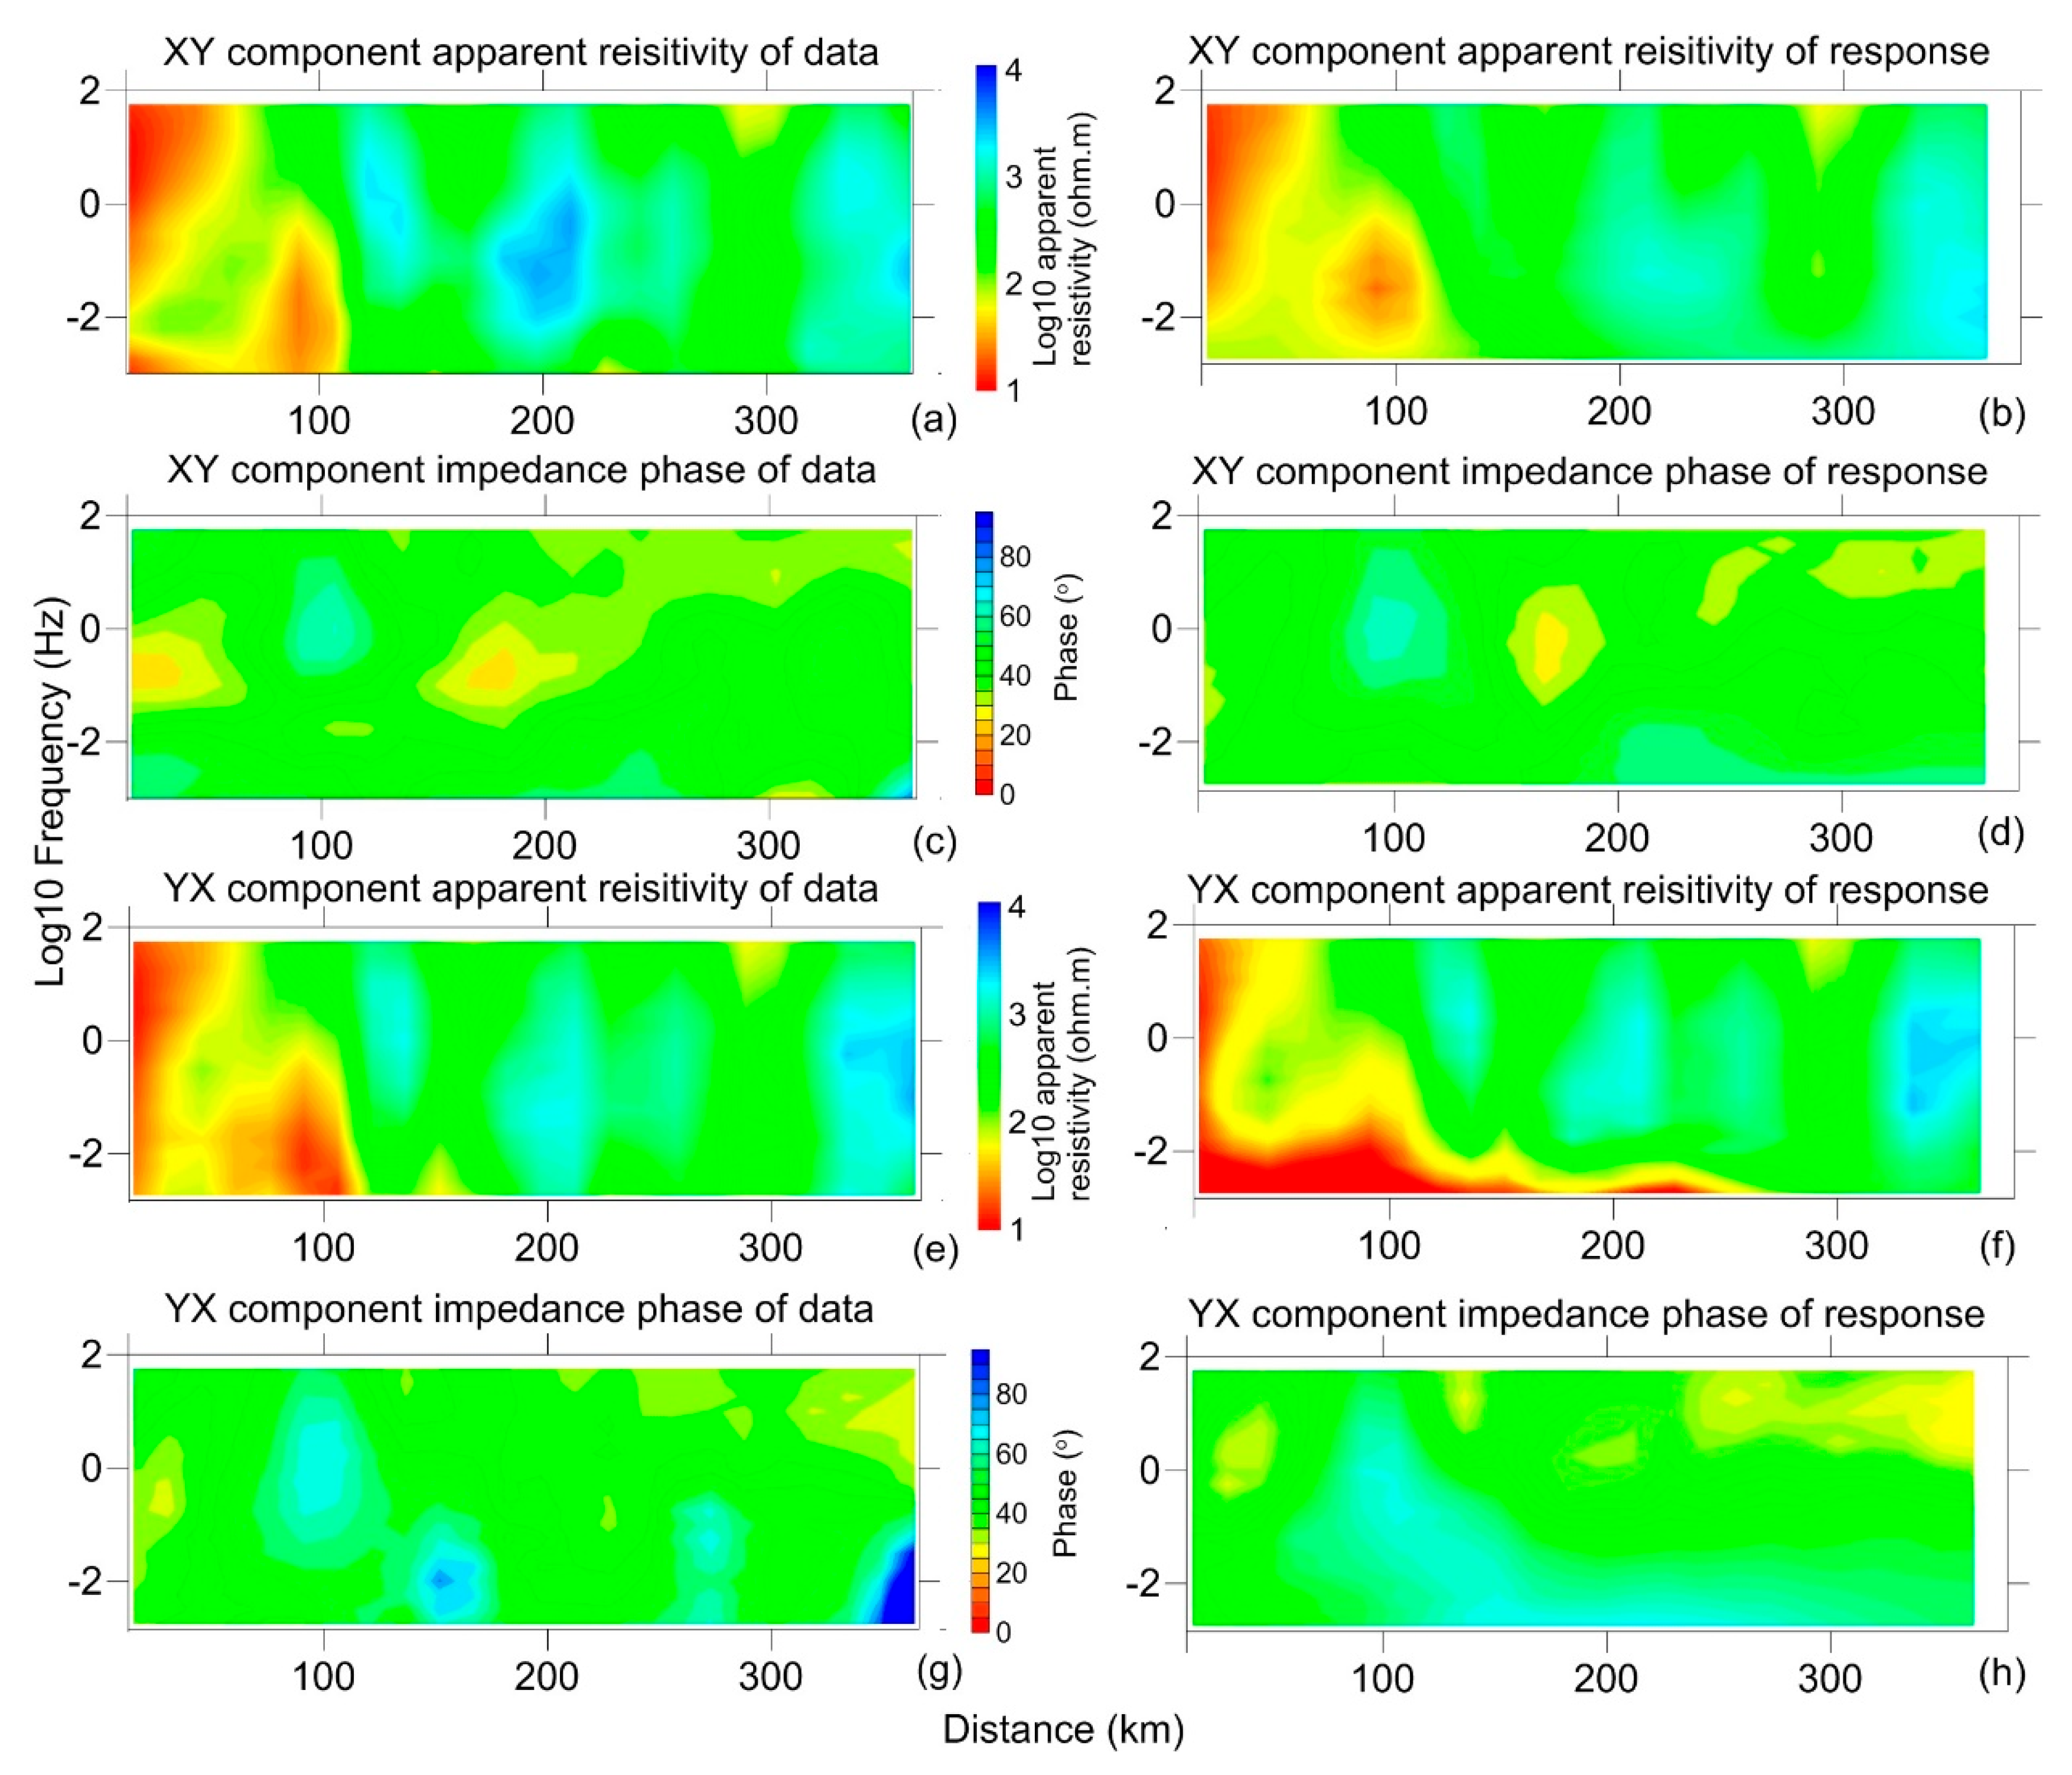
Pseudo-sections provide a convenient way to display all the MT data, shown in Figure 4 and Figure 5a,c,e,g. Apparent resistivity profiles of line Hangzhou show four major parts (Figure 4a,e), featured by a series of alternating resistivity structures (low-high-low-high) from northwest to southeast in most frequency ranges overlying a conductive layer, except for two local spots at 180–220 and 320–350 km. In the northwestern part (at 0–110 km), two steep layers are high frequency, and a vertical belt at a lower frequency is revealed. To the southeast (at 110–270 km), three major resistivity highs are separated by two vertical conductive belts. At 270–300 km in profile, there is a vertical conductive belt in the highest frequency range. Finally (>300 km), one resistivity high is invaded by several conductors. In the impedance phase sections (Figure 4c,g), similar structures are shown with more details (more layers) in the middle part.
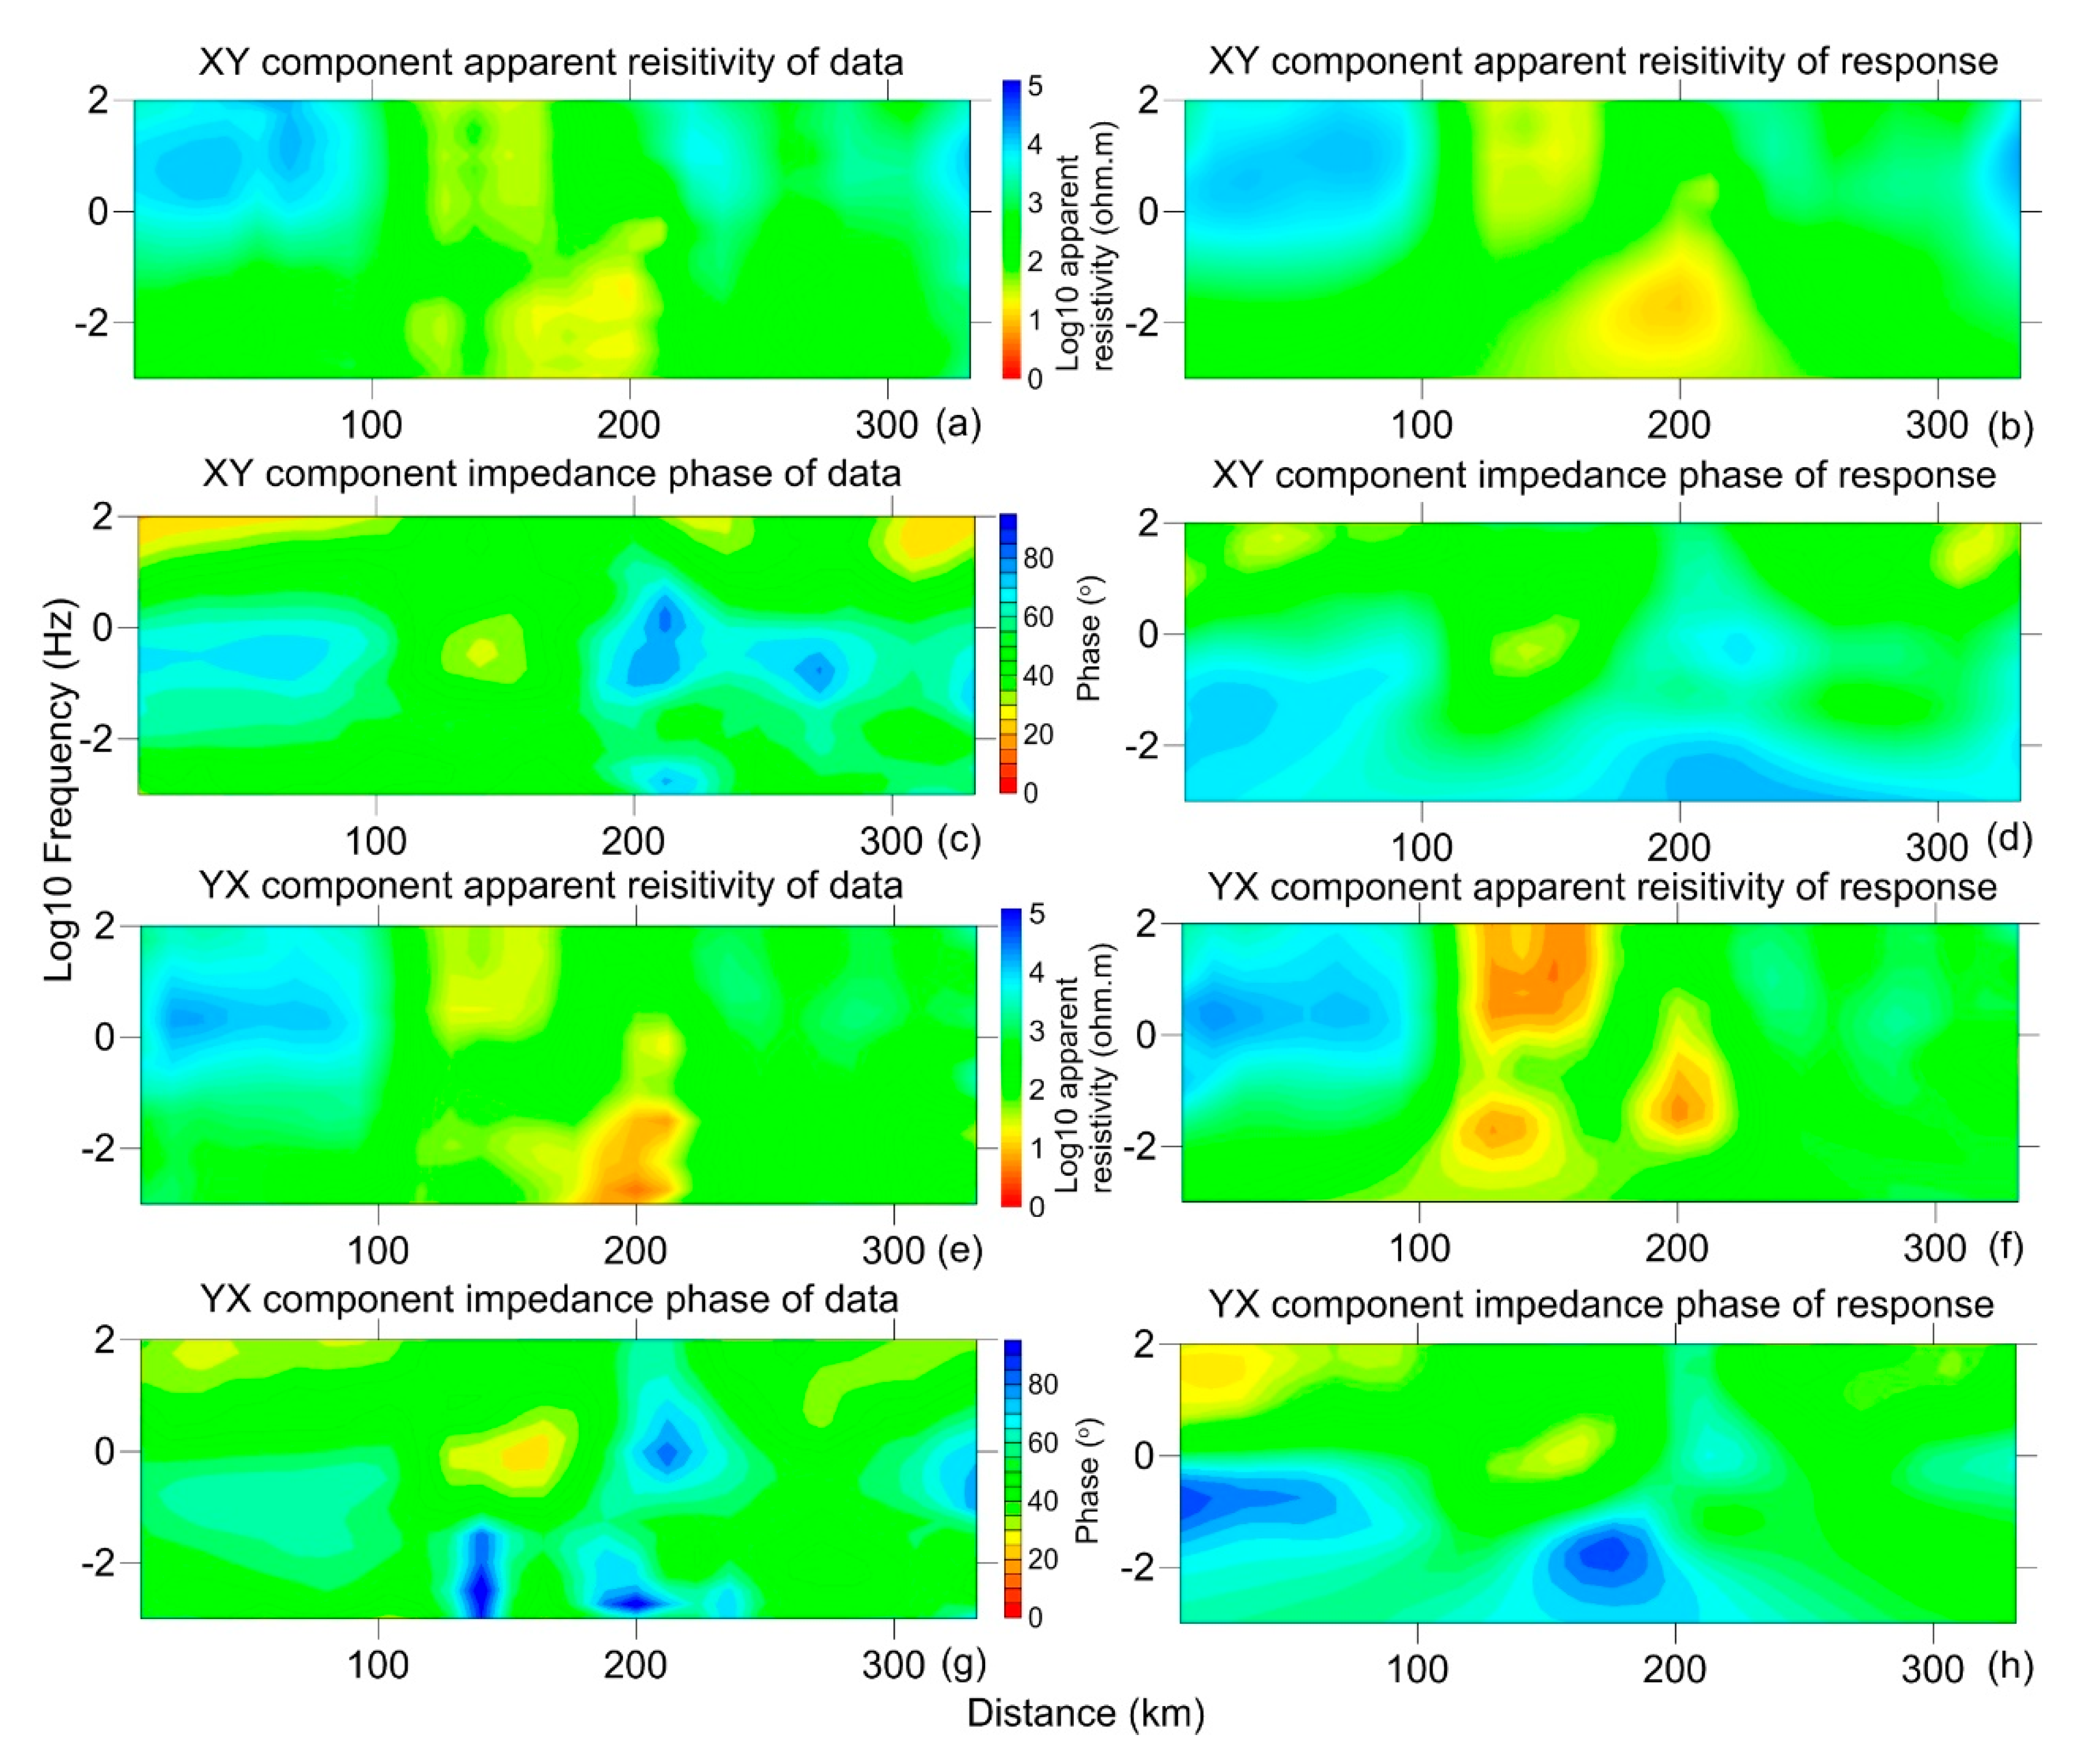
For line Anqing, three major parts are revealed in the apparent resistivity profiles (Figure 5a,e), showing high-low-high resistivity characteristics from northwest to southeast in the high-middle frequency range and a relatively conductive layer at the bottom. At 0–100 km, two low-resistivity layers exist. To the southeast (at 100–220 km), three steep belts with alternating resistivity overlays on a relatively conductive layer along the frequency axis. In the southeast, three resistors are separated by two vertical conductive belts in the high–middle frequency range. Moreover, the impedance phase profiles (Figure 5c,g) show similar characteristics.

4. Inversion and Interpretation

4.1. Inversion

The EMinv platform (developed by Zhang Kun), based on the non-linear conjugate gradients (NLCG) method [30], was used for 2D inversion of the MT data because of its advantages, both for computational efficiency and accuracy. The finite difference method is used for modeling forward, and objective function of inversion is expressed as:
ϕ = [ ( d F ( m ) ) / ε ] 2 + λ m T W T W m
ϕ d / m = 2 Re ( ( d F ( m ) ) / ε )     F / m
where φ is the object function; d is apparent resistivity (and impedance phase) data; ε is data error; F ( m ) is forward modeling operator; λ is a regularization factor; m is model; and W is the model covariance matrix.
In the inversion experiments, static shift correction [28], which used data (apparent resistivity and impedance phase) as the prior information for the justification and calculation of the constraining parameter, was added for data fit and result improvement. The data error floor was set to 5%–40% for apparent resistivity and phase. A grid mesh of 6000 km (Y) × 1000 km (Z) was used, in which the central mesh was 400 km (Y) × 150 km (Z) for the profiles. Grid spacing in the central part of the domain was approximately 1–2 km, and a half-space (100–1000 Ω·m) was used in the initial model. The regularization factor was tested in 30, 10, 3, and 1. Data of 76 frequencies in the range of 0.0005–320 Hz were sorted for inversion. Comparing the inversion results using different parameters and data, the model using TE data has differences from other inversion results. Instead, inversion results using TM and TE + TM data are similar with minor deviations in details, with different parameters. The test results show relatively high stability and low non-uniqueness of the inversion. Finally, joint inversion results with the best parameter combination (TE + TM mode data, error floor was 10% for TM data and 40% for TE data, regularization factor was 10, initial model resistivity was 100 Ω·m) are selected as the preferred models, consistent with geological information. The root mean square misfits are 2.5 for data fit (DF) and 0.7 for model roughness (MR) in line Hangzhoun (Figure 6a), and 2.3 for DF and 0.6 for MC in line Anqing (Figure 6b).
The inversion responses (apparent resistivity and impedance phase) are shown in Figure 4 and Figure 5b,d,f,h, consistent with the data in most areas and frequencies. We conclude that the inversion results are reliable.

4.2. Electrical Models Interpretation

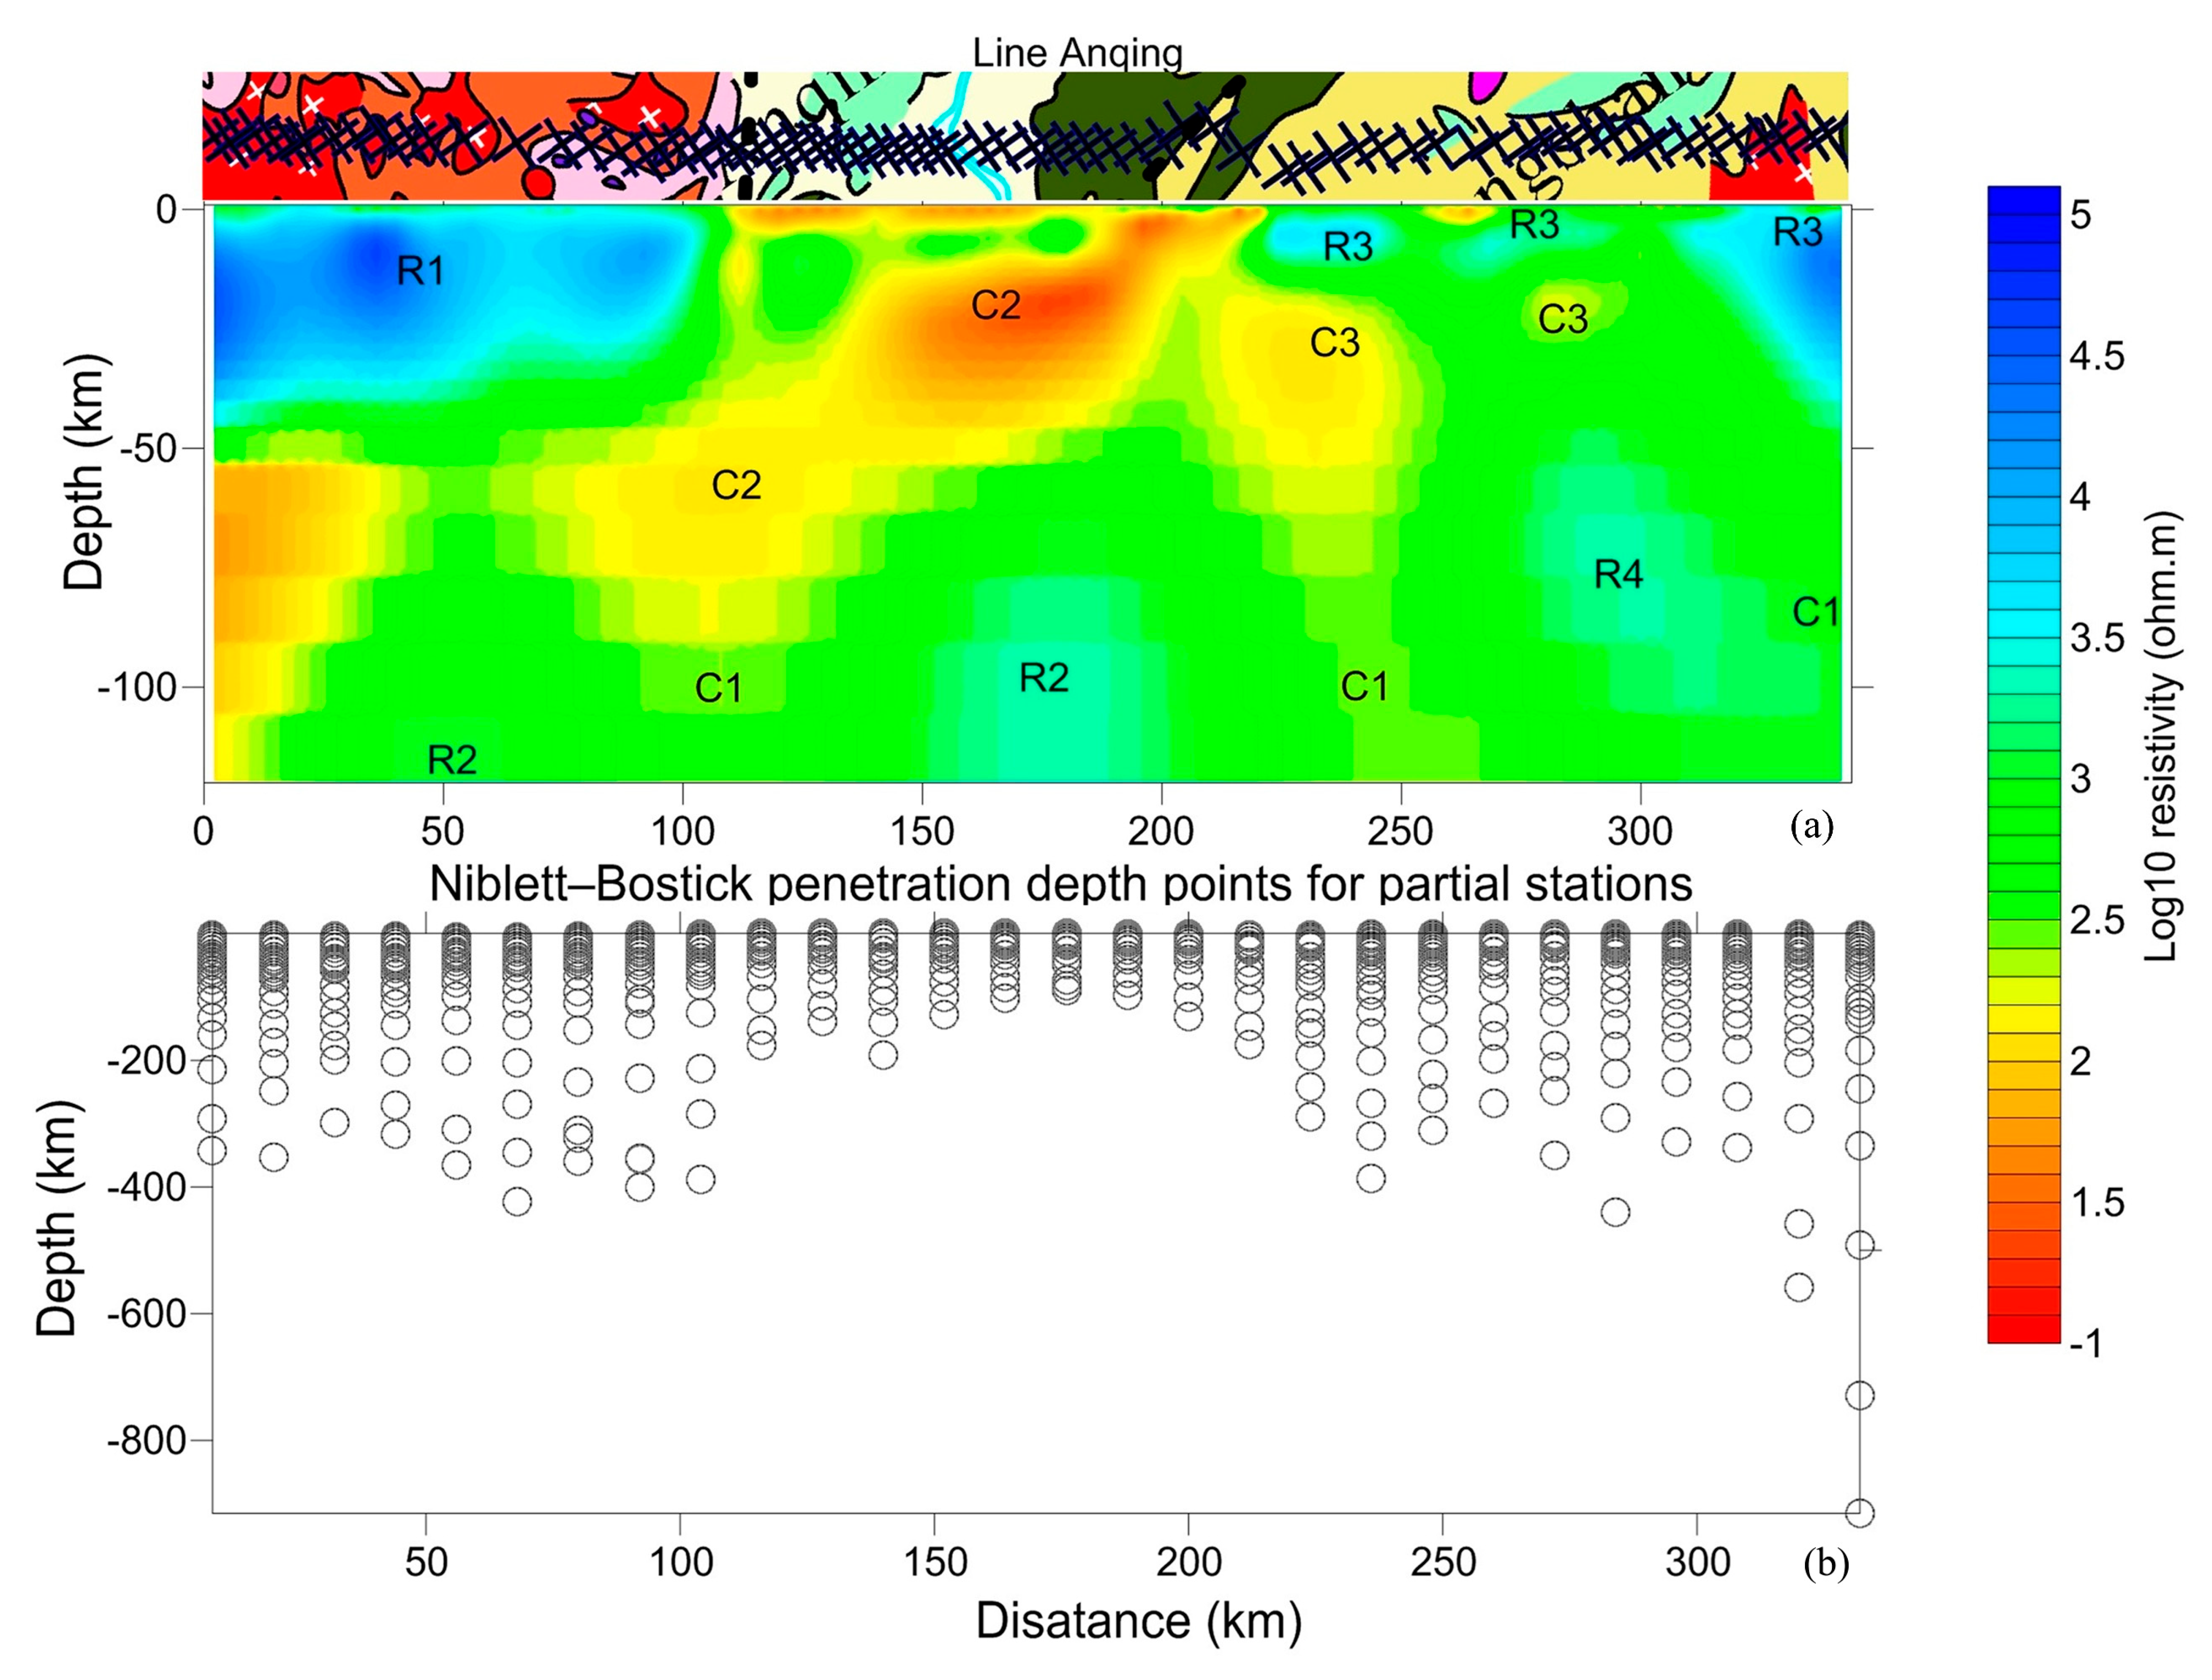
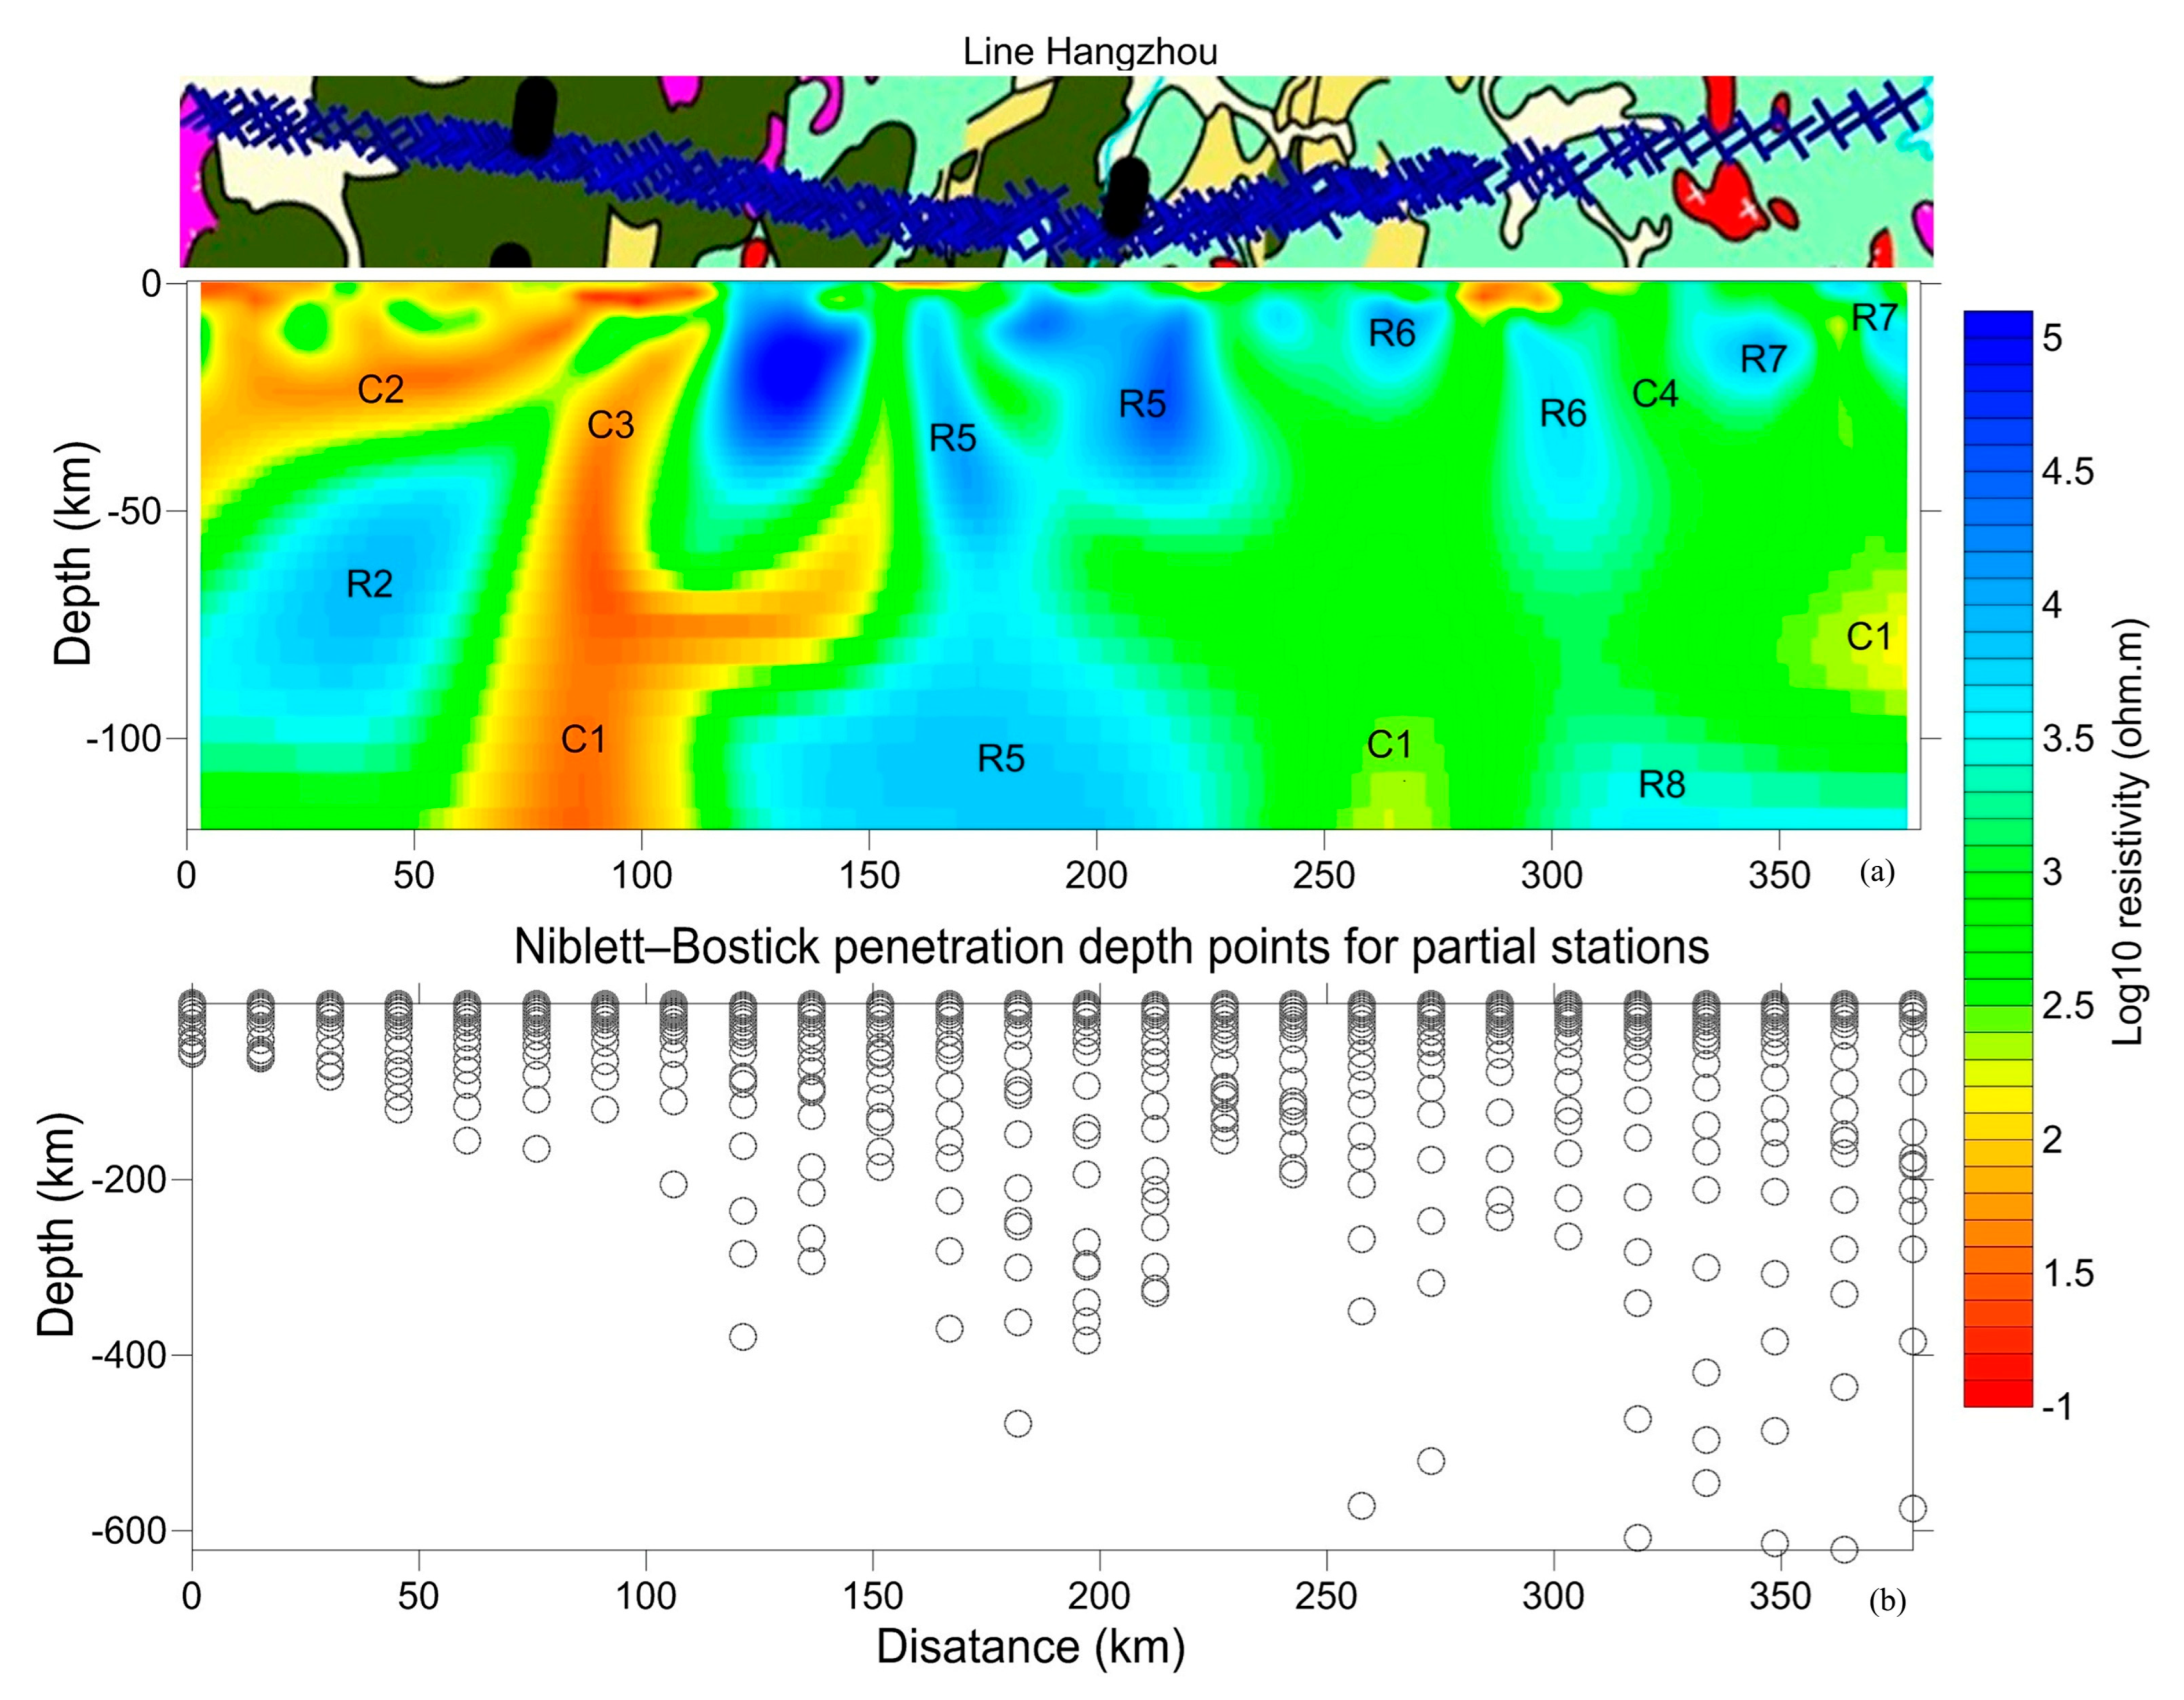
The prominent structures revealed by the inversion models are the extensive lower lithospheric layers featured by the conductive arch (C2 and C3, <200 Ω·m) and a steep conductive belt (C1, <100 Ω m) (Figure 7 and Figure 8), beneath the DOB, YGB, and CAB. The lower lithospheric resistors beneath the conductive layers are revealed in eastern YGB, separated into R2, R4, and R5 by the conductive belt (C1). The crustal resistors are distributed in CAB, separated into R6-R8 by the conductive belts (C1, C4). The interpretation area is divided into six parts horizontally based on the locations of the conductive arch and belts in line Anqing (at ~110 and 225 km) and line Hangzhou (at ~120, 160, 255, and 320 km). Furthermore, we focus on four major conductors (C1, C2, C3, C4) and eight resistors (R1–R8), with different geometries and resistivity characteristics.
Previous seismic and geological results indicate that the crust thickness is about 30–40 km, and the lithosphere thickness is about 70–80 km in SCB [9,29]. In our models, C1 distributes beneath the crust and separates the lithospheric resistors steeply, connecting C2 in the northwest. The Archean–Proterozoic component of the mantle lithosphere beneath the eastern SCB shows metasomatic alteration by hot, fertile juvenile melts during the Late Mesozoic to Early Cenozoic [31,32,33]. Alkaline basalt occurred in the northwest (DOB) and middle (LYD) parts of the study region [34], as well as the latites and A-type granite exposed in the middle study area, relating to the alkaline magma [35]. Based on the geometry relationship between C1 and the overlying conductors (C2 and C3), we infer that C1 was the upwelling channel for multistage upwelling of mantle material, supported by the presence of low-velocity layers [7] and columnar channels [13] in the upper mantle. Moreover, the MASH (melting, assimilation, storage, and homogenisation) process probably occurred [9,24] at the same time [11], indicating a process of upper mantle uplift and asthenosphere upwelling in the Late Mesozoic [24].
C2 is located in the lower lithosphere with a depth of ~30–60 km at the bottom. In the subduction–collision process between NCB and YGB, the LYD formed as the collision suture zone and foreland [9,16]. Therefore, C2 is inferred as the weak layer overlying the subduction slab, forming into a detachment layer in the later extensional process. Moreover, the abundant water has been dehydrated in the subduction–collision process and moved into the lithosphere of the upper plate [34,36], evidenced by resistivity lows beneath DOB and LYD.
C3 is located in the lower lithosphere with a depth of ~40–50 km at the bottom. Previous geological results show that JNOB has undergone a multi-stage accretion and break-up process [3,37], leading to strong interaction between asthenosphere materials and lithosphere that can remove or replace the lithospheric root [38,39]. Therefore, C3 is inferred as a weak layer overlying the delaminated lithosphere [7], similar to C2. In addition, C3 may be composed of water-rich fluid and/or hydrated melts exhumed in dehydration, driven by the subduction.
C4 presents as a steep belt in the lower lithosphere. The Precambrian basement in western CAB was intruded by early Paleozoic felsic magma [40], showing a major magmatic and metamorphic event (ca. 460–420 Ma) [21] in western CAB. Eastern CAB consists of a series of metasedimentary and metaplutonic rocks, representing two major magmatic events in Paleoproterozoic (1.9–1.8 Ga) and Mesozoic (ca. 250–230 Ma) metamorphism [40,41,42]. Therefore, C4 can be the boundary between West Cathaysia (WCAB) and East (ECAB).
R1 (Figure 7) is located in the upper crust to the west of C2. It is bounded by the shallow-vertical conductor (at 100–110 km in line Anqing) with a variable depth at the bottom (10–35 km). Mantle uplift and large-scale magmatism are developed in NCB and YGB [24,43], and intrusions beneath DOB were formed by the late Mesozoic magmatism [6]. Metamorphic rocks in DOB contain Neoproterozoic metamorphic granites and mafic magmatic rocks [44]. In addition, pre-Neoproterozoic magmatism and metamorphism existed in the southern DOB. Therefore, R1 can be inferred as the metamorphic basement, reformed by the Mesozoic magmatism.
R2 (Figure 7) is located in the lower lithosphere with a top depth of 30 km, dipping northwest. Previous studies suggest a high-velocity body in the upper mantle beneath LYD [7] and a northward subduction slab between NCB (DOB) and YGB [36,43]. Therefore, we infer that R2 is the deep subduction slab, separated from R4 (Figure 7 and Figure 8) by C1.
R3 (Figure 7) is located in the crust (at 225–340 km in line Anqing) with a bottom depth of 15–40 km, overlying C1 and C3. The Neoproterozoic sedimentary formation (argillaceous rocks) is exposed in eastern JNOB, as well as the Paleozoic marine-facies and volcanic-sedimentary rocks, and the Mesozoic continental-facies clastic rocks [45]. Hence, R3 is supposed to represent the metamorphic basement bearing sedimentary strata and magmatite, influenced by the magmatism.
R4 (Figure 7) is located in the lithosphere (at 260–340 km in line Anqing) with a top depth of 35–45 km and bottom depth > 120 km. Upon the R4, Precambrian metamorphic rocks and Quaternary cover are exposed on the surface. As the suture between CAB and YGB, JNO, composed of the Precambrian metamorphic complex [3], has been influenced by lateral multi-magmatism. Hence, the R4 is supposed to be the lithosphere root beneath YGB, separated from R3 by C3, indicating an asthenosphere upwelling [10].
R5, constrained by JSF, is located in northeastern JNOB, composing a thick lithosphere root [3,4]. Geological results, e.g., [2,3,4], show a subduction–collision process between YGB and CAB, in which JNOB was formed as the suture zone. Then, JNOB underwent multi-stage tectonic-magmatism since the Paleozoic, peaking at the Mesozoic. So, the upper part of R5 is proposed as the metamorphic basement and sedimentary strata influenced by magmatism, and the lower part of R5 is the lithospheric root of YGB, which was influenced and reformed by the upwelling material [10].
R6 and R7 (Figure 8) are located on both sides of C4 in the crust. Combining the different strata and tectonic processes between WCAB and ECAB [40], we propose that R6 represents Precambrian metamorphic basement influenced by early Paleozoic magmatism, and R7 represents Precambrian metamorphic basement reformed by Mesozoic magmatism.
R8 (Figure 8) is located in the upper mantle (at 310–380 km in line Hangzhou) with a top depth of about 100 km. Previous results show a strong magmatic event in the Mesozoic [40]. Furthermore, the geometry of R8 and R6 presents a trend of connection. So, we propose a subduction or obduction process between WCAB and ECAB, in which C4 + C1 represented the weak layer between the two blocks, and R8 represented the broken slab or delaminated lithosphere root.

5. Discussion

5.1. Lithospheric Structure in Eastern SCB

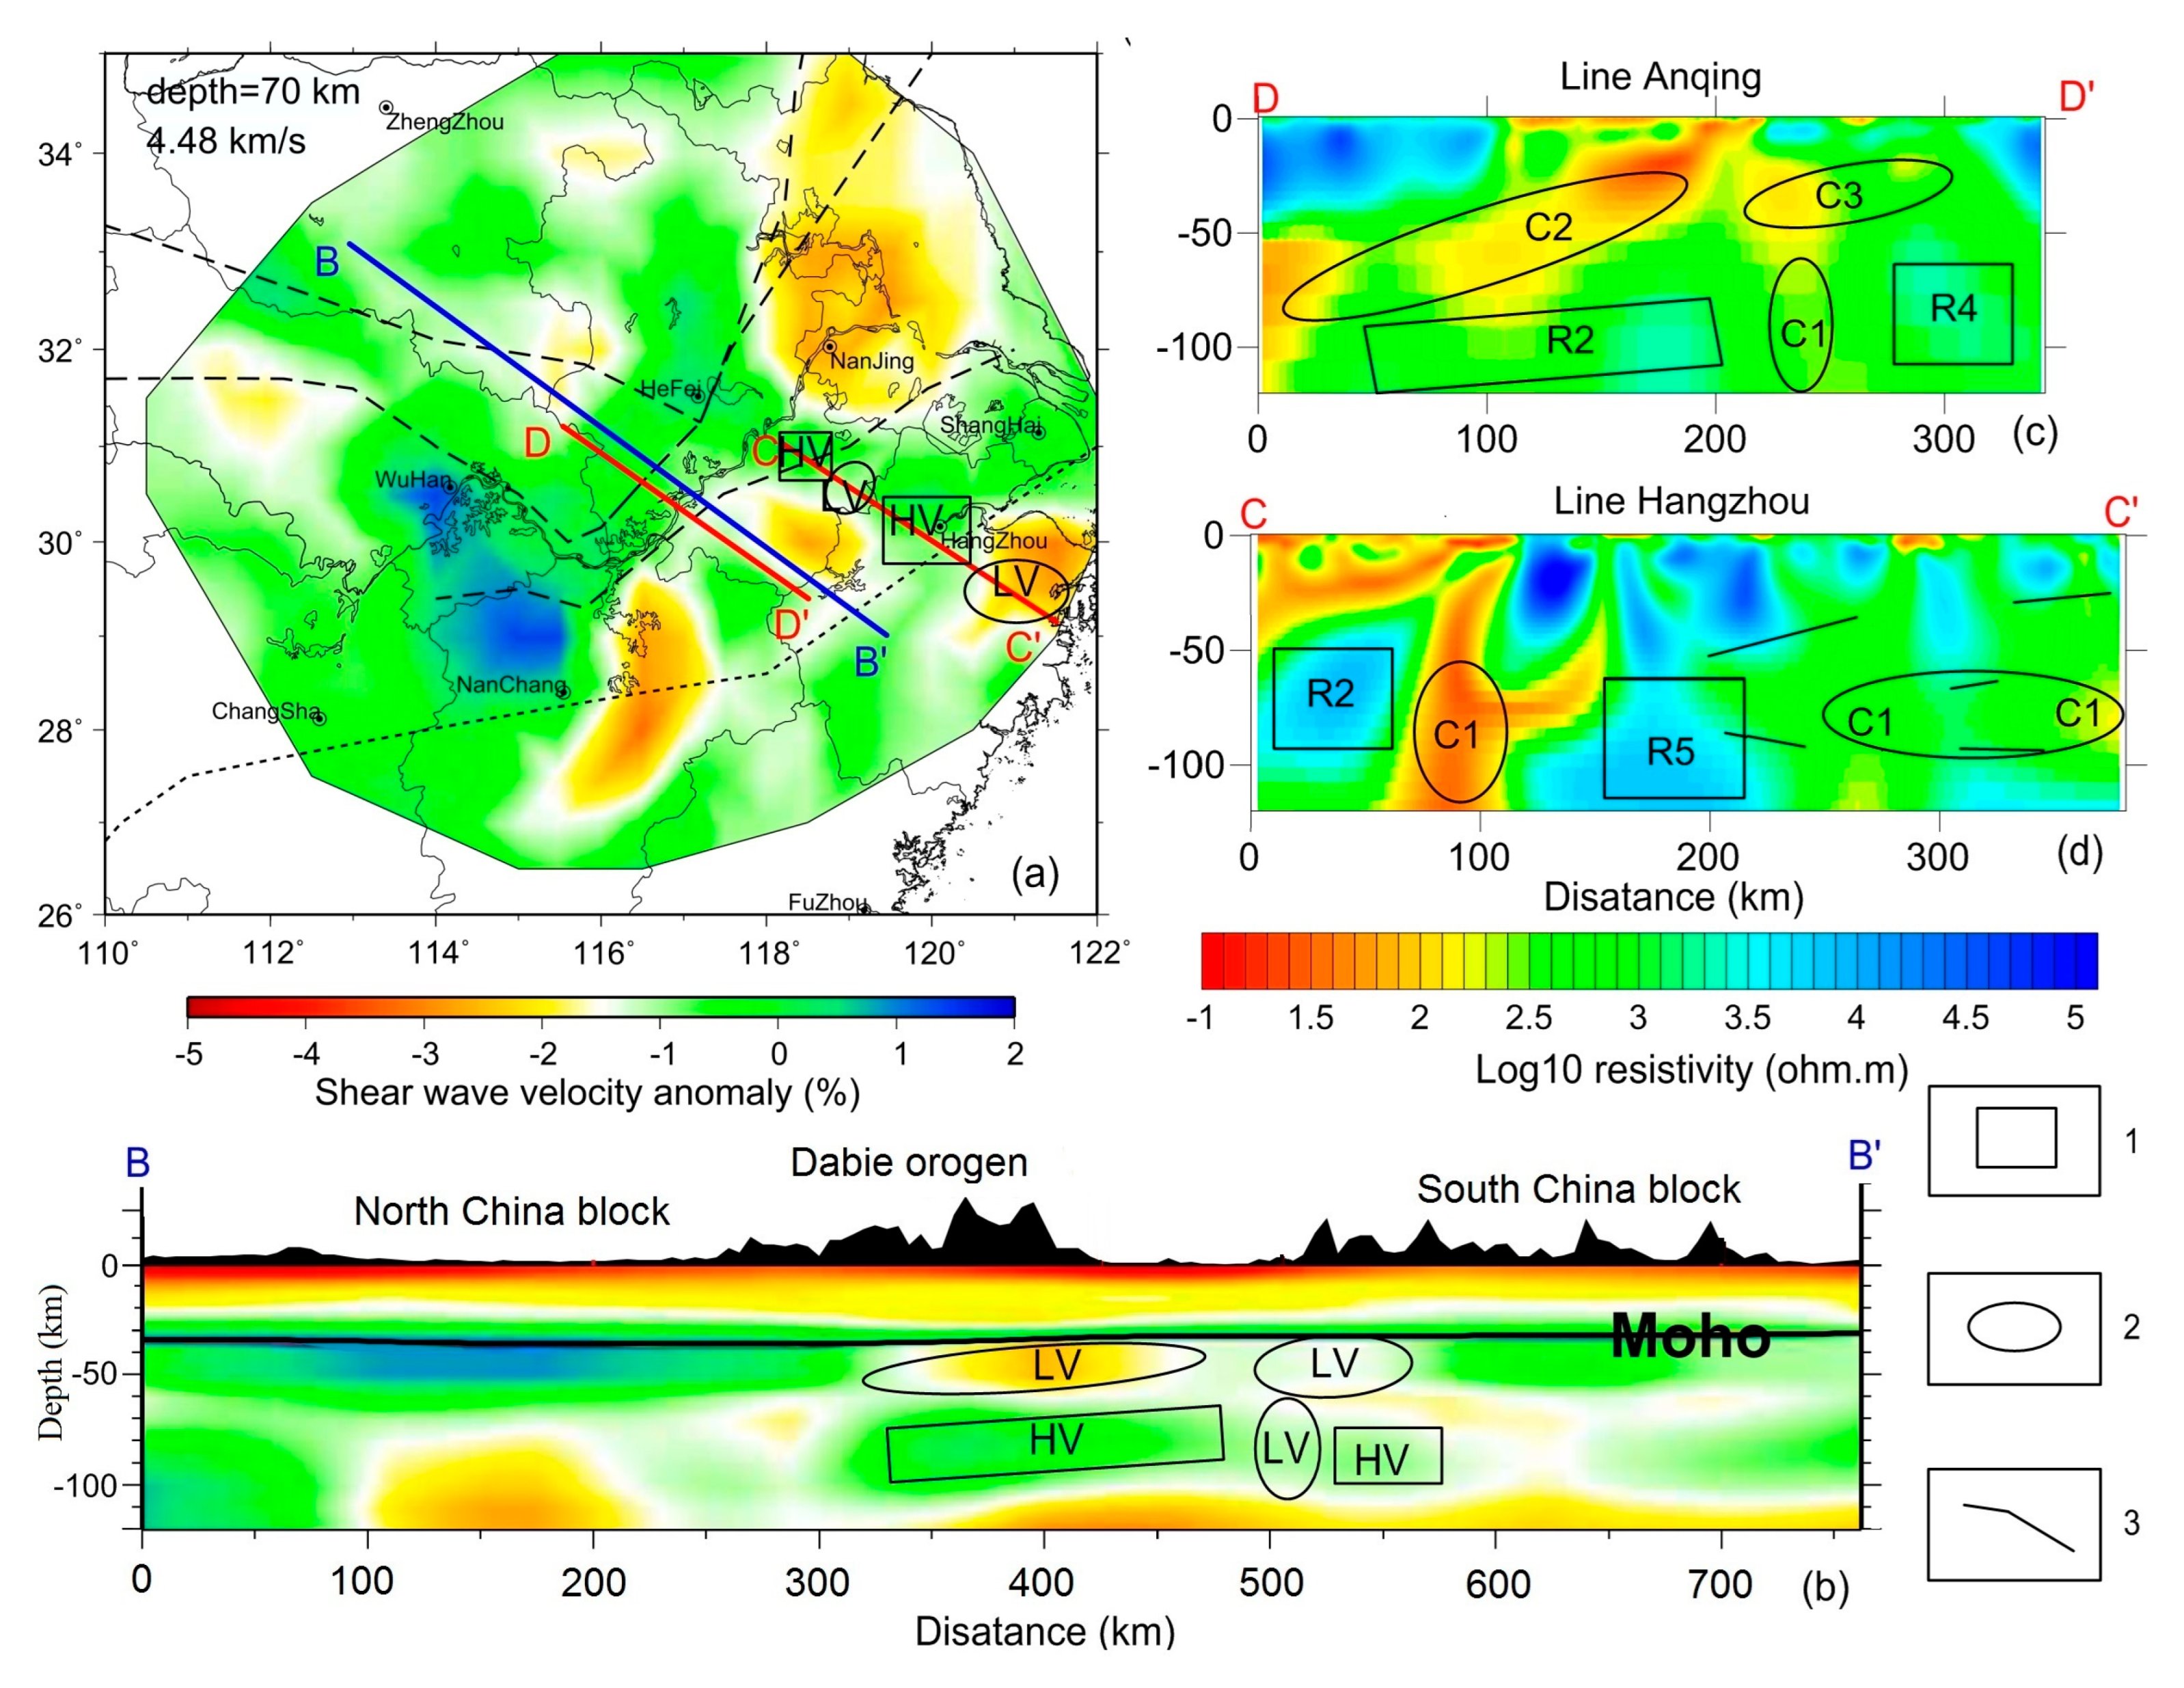
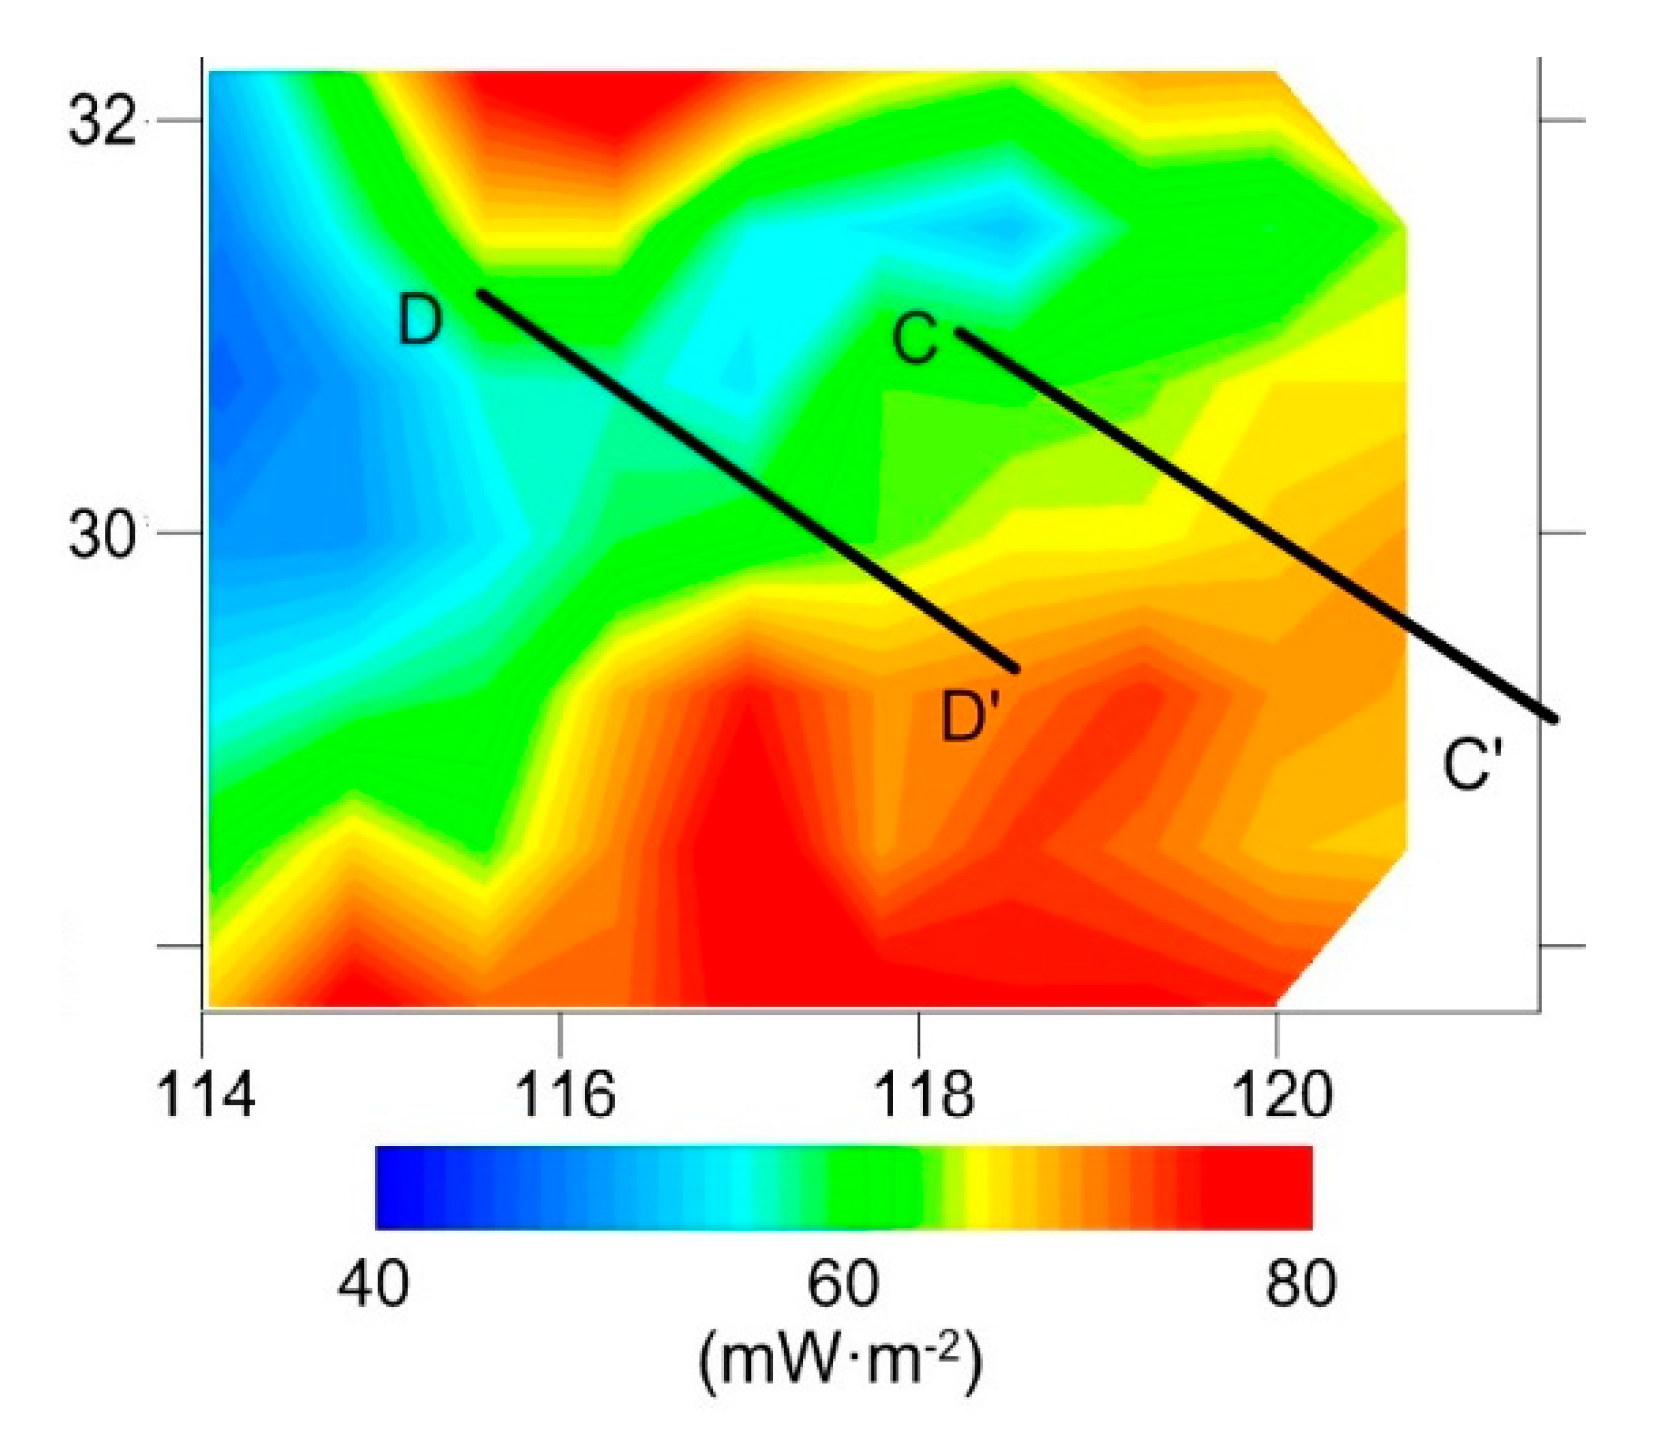
The strong deformation of the crust (including TLF) can be attributed to the tectonic regime of a deep system composed of widespread weak layers and channels (LV and C1–C3), as well as the lithosphere root (HV, R2, R4, R5) (Figure 9). In addition, the low heat flow values [46] (Figure 10) in the northwestern line Anqing indicate the thickness decrease of the “heat” lithosphere (140–60 km) [46] from northwest to southeast. It also suggests that the lithospheric material beneath the (DOB-) LYD is colder than that beneath JNOB and CAB, revealing two kinds of lithosphere (cold: R2, R4, R5, HV; hot: C1–C3, LV). Considering the weak tectonic during the Cenozoic, the collision system of NCB and SCB in the Mesozoic was composed of (intracontinental) subduction slabs (R2 and R8) with relatively low temperature and the detachment layers (Figure 8, C4; Figure 9, C1–C3) featured by hot and plastic [47], corresponding to the thicker “heat” lithosphere in the northwestern study region [46].

5.2. The Mesozoic Tectonic Process in Eastern SCB

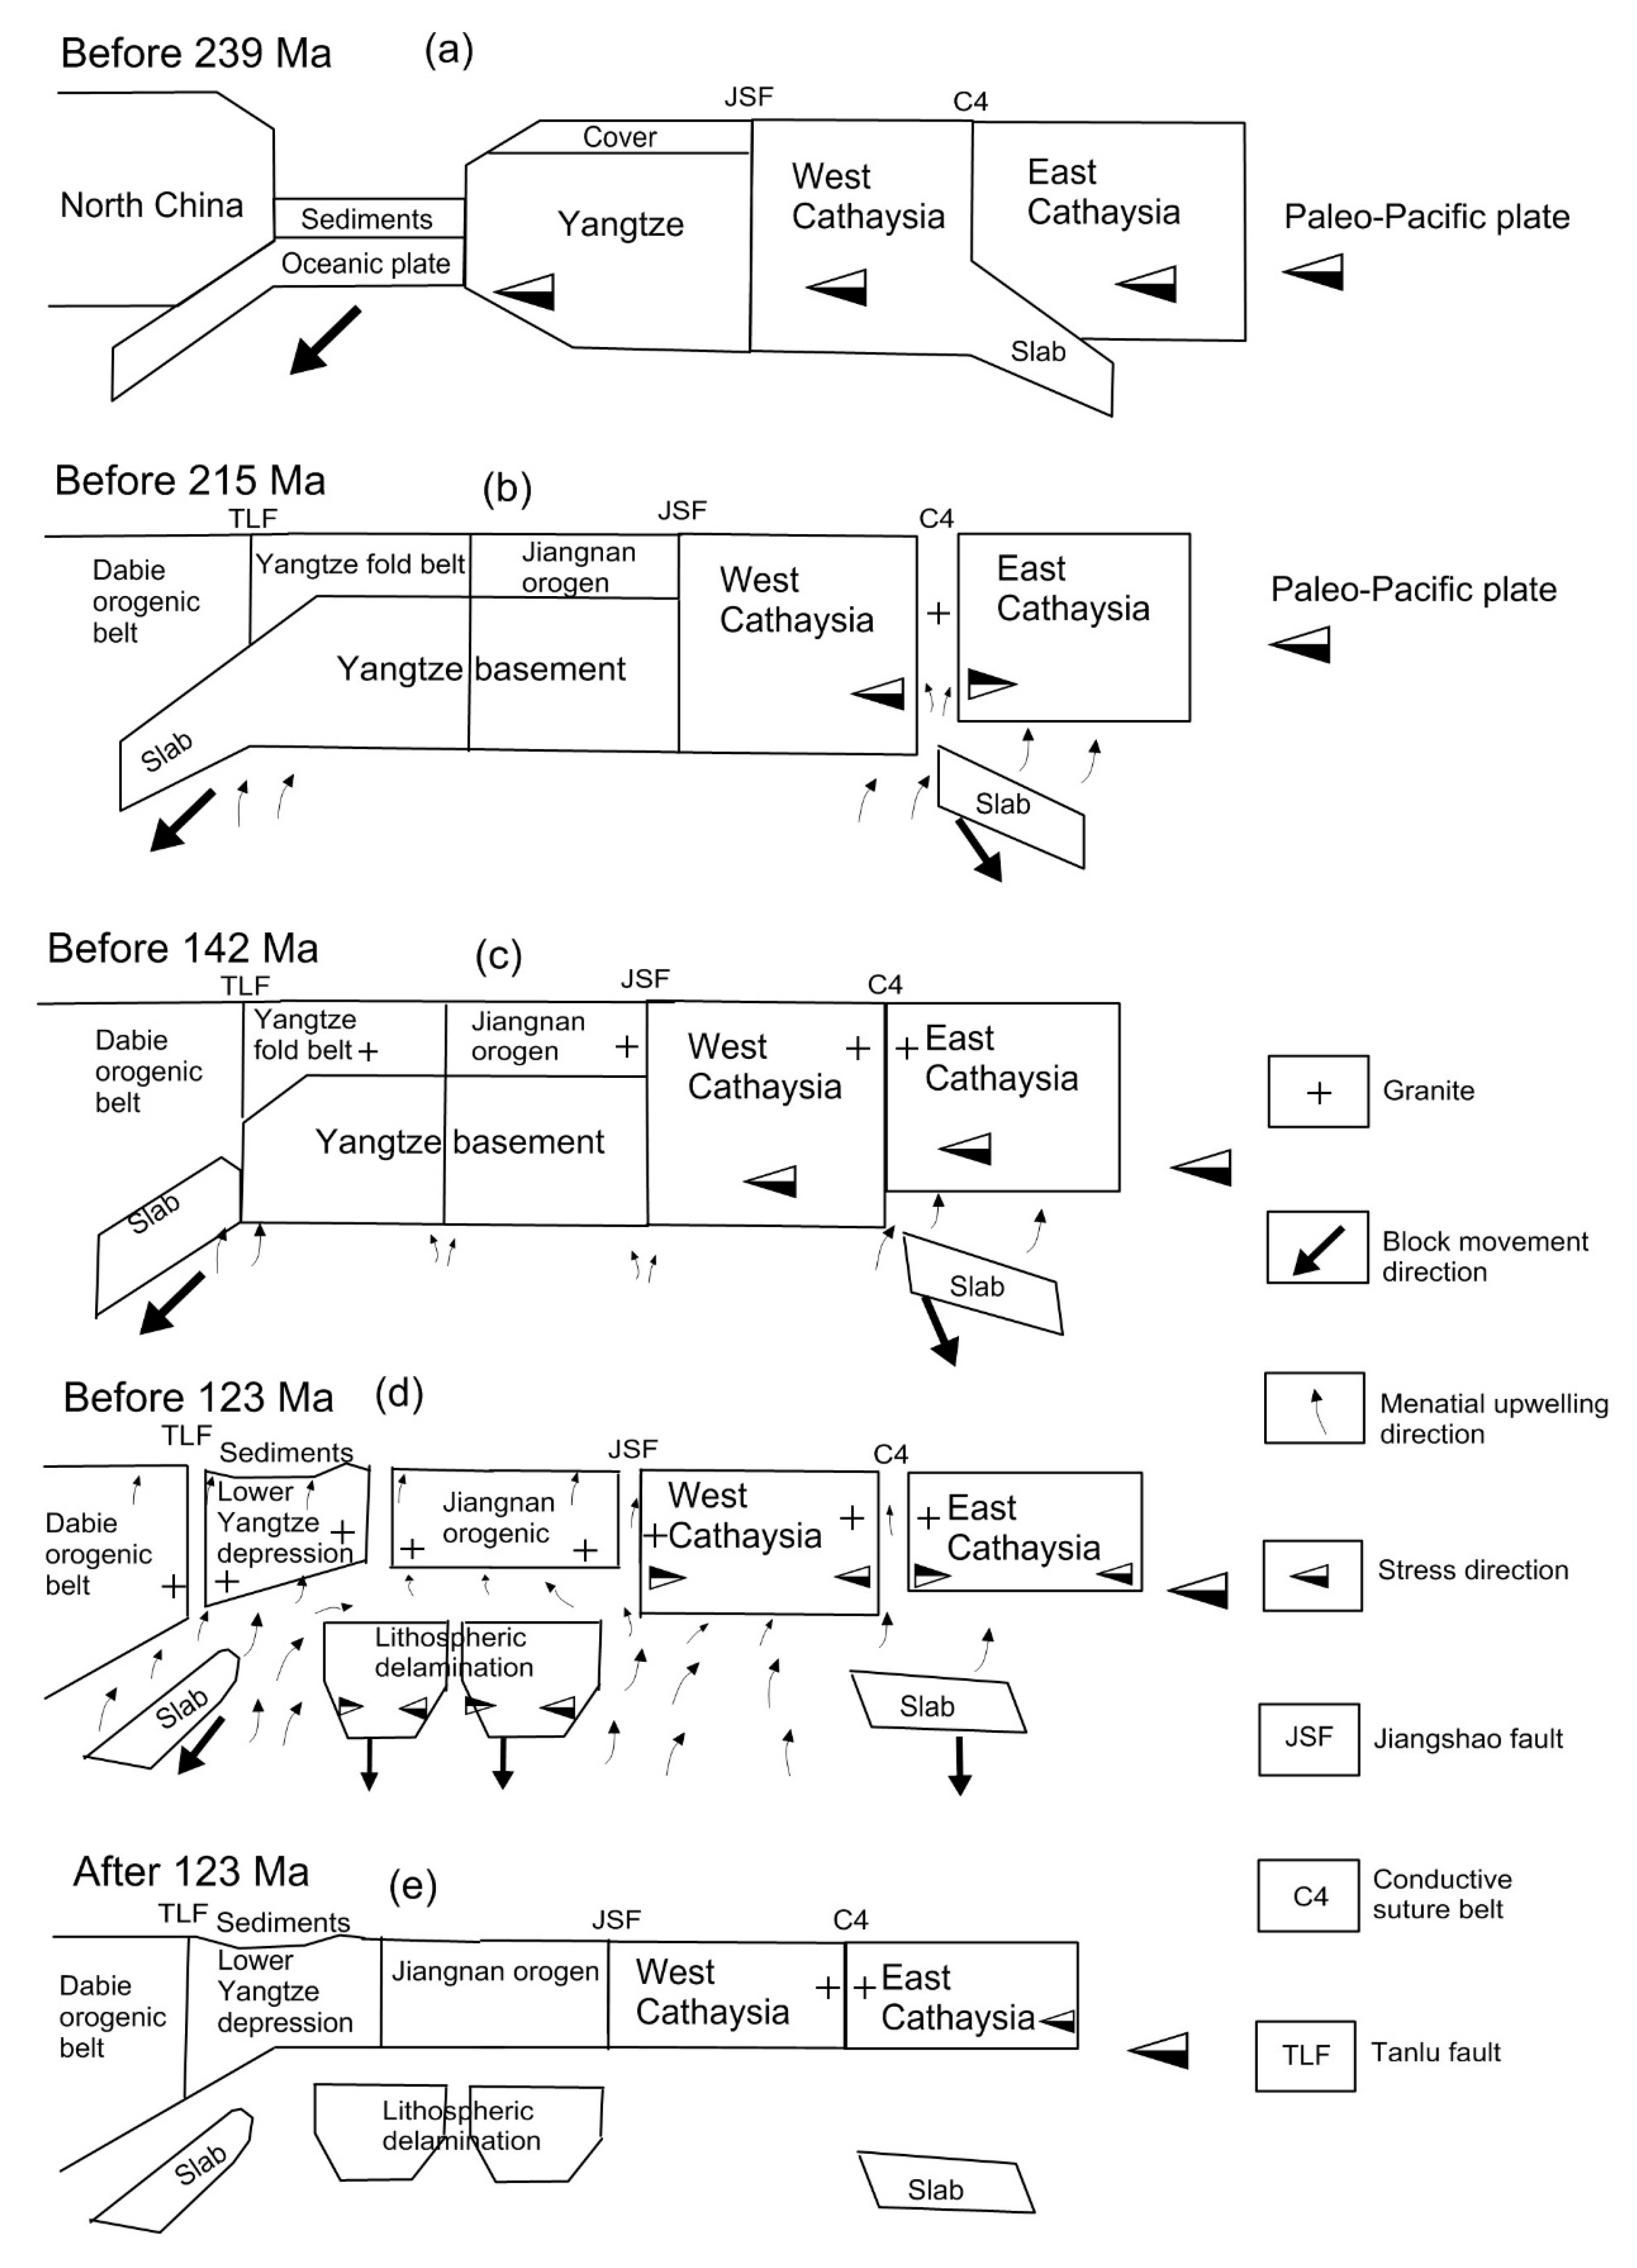
The tectonic events during the Mesozoic in eastern SCB are closely related to the subduction–collision process between NCB and SCB. It is believed that the Paleo Tethys Ocean existed between NCB and SCB before the Triassic [48], and the oceanic subduction led to the continental collision and the following intracontinental subduction [27]. However, the pre- (late) Mesozoic alkaline migmatite and reactive magmatism in the interior CAB [49] indicate a strong material migration between ECAB and WCAB before the NCB–SCB collision. Furthermore, the conductive channels (C4 and eastern C1) revealed in our new resistivity models suggest another accretion process between WCAB and ECAB, which can explain the intracontinental orogeny and basic magmatism beneath CAB. We then propose a subsequent process of tectonic adjustment with five stages (Figure 11).
(1) The NCB–SCB collision peaking at 240–225 Ma [50] led to the suture reactivation in CAB. Deep material migration can be believed to be the cause of the CAB intracontinental orogeny [21]. Here, we attribute the orogeny to the detachment of the lithosphere root (R8), after the accretion of WCAB and ECAB and before the NCB–SCB collision. Moreover, a southeastward intracontinental subduction followed the block convergence (Figure 11a). On the contrary, the oceanic crust was subducted beneath the NCB in the Triassic, northwestward. This tectonic process was developed in a compressional regime, accompanied by the westward movement of the Paleo-Pacific plate.
(2) Following the break-off of the WCAB slab (or lithosphere delamination), deep material migrated upward, converting the stress regime into intracontinental extension (Figure 11b). It was supported by the granite before 215 Ma [11,15]. Simultaneously, the YGB lithosphere (R2) was further wedged into the NCB (DOB) tract by oceanic subduction. Then LYD formed as the foreland between NCB and SCB [48].
(3) In the third stage, the sank lithosphere roots (lower part of R2 and R8) indicate a crustal/lithospheric thickening process (Figure 11c) after the regional extension adjustment, supported by abundant adakitic rocks (176–142 Ma) and S-type granite (170–155 Ma) [51,52,53].
(4) Afterward, the stress regime was converted into extension, supported by A-type granite, binodal lava, and dike in eastern SCB (ca. 145–123 Ma) [39,53]. It can be attributed to the break-off and sinking of subduction slabs (R2 and R8), driving the lithospheric modification of YGB and CAB. The asthenosphere upwelling provided material and energy for the subsequent magmatism [11] through the channels/sutures, leading to material spreading and lithosphere decoupling [16,27] and delamination [54] (Figure 11d).
(5) Following the sinking of intracontinental subduction slabs, the lithosphere of SCB was welded completely in the westward compression caused by the movement of the Paleo-Pacific plate (Figure 11e), deforming complicatedly compared to other regions, such as Garber structure (USA) [55].

6. Conclusions

To further understand the intracontinental tectonic process and its mechanism of the eastern SCB during the Mesozoic, two MT profiles are carried out to reveal the lithospheric structure of DOB, LYD, eastern JNOB, and eastern CAB. New resistivity models reveal a conductive arch and some steep belts in the lower lithosphere as the major features. Moreover, there is a huge resistor beneath the arch, separated by the conductive belts. The electrical structures show a double-directed subduction system with slabs on both sides (resistive wedge), underlying the detachment layer (conductive arch). Considering the heat flow and seismic tomographic results, we propose a new geologic model with five stages to explain the intracontinental tectonic. The repeated conversion of compressional and extensional regimes is inferred as the mechanism, driven by the break-off of subduction slabs and fluid migration. It is noted that the Mesozoic tectonic in eastern SCB is complicatedly superposed by multiple events, showing complex structures. Therefore, further anisotropy research is suggested to explain the detailed geological questions.

Author Contributions

Formal Analysis, Investigation, Project Administration, Writing, K.Z., Formal Analysis, Investigation, Z.W., Data Curation, Resources, X.M., Y.Y. and H.H. All authors have read and agreed to the published version of the manuscript.

Funding

This study was funded by the National Science Program (42174087), the China Magnetotelluric Array, National Science and Technology Major Project (2024ZD1000200; 2024ZD1000204), the Geological Survey Project (DD20230008), and Basic Research Business Expense Project (JKY202411).

Data Availability Statement

The original contributions presented in this study are included in the article. Further inquiries can be directed at the corresponding authors.

Conflicts of Interest

Author Zhaohong Wan was employed by the Guizhou Qianmei Foundation Engineering Co., Ltd. Author Hao Hu was employed by the Changjiang Geophysical Exploration & Testing Co., Ltd. The authors declare that the research was conducted in the absence of any commercial or financial relationships that could be construed as a potential conflict of interest.

References

  1. Hu, R.Z.; Mao, J.W.; Hua, R.M.; Fan, W.M. Intracontinental Mineralization in South China; Science Press: Beijing, China, 2015. (In Chinese) [Google Scholar]
  2. Wang, X.-L.; Zhou, J.-C.; Griffin, W.; Wang, R.-C.; Qiu, J.-S.; O’Reilly, S.; Xu, X.; Liu, X.-M.; Zhang, G.-L. Detrital zircon geochronology of Precambrian basement sequences in the Jiangnan orogen: Dating the assembly of the Yangtze and Cathaysia Blocks. Precambrian Res. 2007, 159, 117–131. [Google Scholar] [CrossRef]
  3. Zhai, M.; Zhou, Y. General Precambrian Geology in China. In Precambrian Geology of China; Springer: Berlin/Heidelberg, Germany, 2015. [Google Scholar]
  4. Cawood, P.A.; Wang, Y.; Xu, Y.; Zhao, G. Locating South China in Rodinia and Gondwana: A fragment of greater India lithosphere? Geology 2013, 41, 903–906. [Google Scholar] [CrossRef]
  5. Hacker, B.R.; Wallis, S.R.; Ratschbacher, L.; Grove, M.; Gehrels, G. High temperature geochronology constraints on the tectonic history and architecture of the ultrahigh-pressure Dabie–Sulu Orogen. Tectonics 2006, 25, TC5006. [Google Scholar] [CrossRef]
  6. Yang, W.; Yu, C. Kinetics and dynamics of development of the Dabie-Sulu UHPM terranes based on geophysical evidences. Chin. J. Geophys. 2001, 44, 340–356, (In Chinese with English Abstract). [Google Scholar]
  7. Jiang, G.; Zhang, G.; Lü, Q.; Shi, D.; Xu, Y. 3-D velocity model beneath the Middle–Lower Yangtze River and its implication to the deep geodynamics. Tectonophysics 2013, 606, 36–47. [Google Scholar] [CrossRef]
  8. Pan, Y.; Dong, P. The Lower Changjiang (Yangzi/Yangtze River) metallogenic belt, east central China: Intrusion- and wall rock-hosted Cu–Fe–Au, Mo, Zn, Pb, Ag deposits. Ore Geol. Rev. 1999, 15, 177–242. [Google Scholar] [CrossRef]
  9. Lü, Q.T.; Meng, G.X.; Zhang, K.; Liu, Z.D.; Yan, J.Y.; Shi, D.N.; Han, J.G.; Gong, X.J. The lithospheric architecture of the Lower Yangtze Metallogenic Belt, East China: Insights into an extensive Fe–Cu mineral system. Ore Geol. Rev. 2021, 132, 103989. [Google Scholar] [CrossRef]
  10. Zhou, X.M.; Sun, T.; Shen, W.Z.; Shu, L.S.; Niu, Y.L. Petrogenesis of Mesozoic granitoids and volcanic rocks in South China: A response to tectonic evolution. Episodes 2006, 29, 26–33. [Google Scholar] [CrossRef] [PubMed]
  11. Zhou, T.F.; Wang, S.W.; Yuan, F.; Fan, Y.; Zhang, D.Y.; Chang, Y.F.; White, N.C. Magmatism and related mineralization of the intracontinental porphyry deposits in the Middle-Lower Yangtze River Valley Matellogenic Belt. Acta Petrol. Sin. 2016, 32, 271–288. [Google Scholar]
  12. Pirajno, F. The Geology and Tectonic Settings of China’s Mineral Deposits; Springer: New York, NY, USA, 2013. [Google Scholar]
  13. Ouyang, L.B.; Li, H.Y.; Lü, Q.T.; Yang, Y.J.; Li, X.F.; Jiang, G.M.; Zhang, G.; Shi, D.; Zheng, D.; Sun, S.; et al. Crustal and uppermost mantle velocity structure and its relationship with the formation of ore districts in the Middle–Lower Yangtze River region. Earth Planet. Sci. Lett. 2014, 408, 378–389. [Google Scholar] [CrossRef]
  14. Dalhkamp, F.J. Uranium Deposits of the World; Springer: Berlin/Heidelberg, Germany, 2009; Volume 4. [Google Scholar]
  15. Mao, J.R.; Li, Z.L.; Ye, H.M. Mesozoic tectono-magmatic activities in South China: Retrospect and prospect. Sci. China Earth Sci. 2014, 57, 2853–2877. [Google Scholar] [CrossRef]
  16. Zhang, K.; Lü, Q.T.; Lan, X.Y.; Guo, D.; Wang, Q.N.; Yan, J.Y.; Zhao, J.H. Magnetotelluric evidence for crustal decoupling: Insights into tectonic controls on the magmatic mineral system in the Nanling–Xuancheng area, SE China. Ore Geol. Rev. 2021, 131, 104045. [Google Scholar] [CrossRef]
  17. Hou, Z.Q.; Pan, X.F.; Yang, Z.M.; Qu, X.M. Porphyry Cu–(Mo–Au) deposits no related to oceanic-slab subduction: Examples from Chinese porphyry deposits in continental settings. Geoscience 2007, 21, 332–351. [Google Scholar]
  18. Hsü, K.J.; Li, J.L.; Chen, H.H. Mesozoic overthrust tectonics in South China. Geology 1998, 16, 418–421. [Google Scholar] [CrossRef]
  19. Gilder, S.A.; Gill, J.; Coe, R.S. Isotopic and palaeomagnetic constraints on the Mesozoic tectonic evolution of south China. J. Geophys. Res. 1996, 101, 16137–16154. [Google Scholar] [CrossRef]
  20. Li, X.H. Cretaceous magmatism and lithospheric extension in southeast China. J. Asian Earth Sci. 2000, 18, 293–305. [Google Scholar] [CrossRef]
  21. Wang, Y.J.; Fan, W.M.; Zhang, G.W.; Zhang, Y.Z. Phanerozoic tectonics of the South China Block: Key observations and controversies. Gondwana Res. 2013, 23, 1273–1305. [Google Scholar] [CrossRef]
  22. Ling, M.X.; Wang, F.Y.; Ding, X. Cretaceous ridge subduction along the Lower Yangtze River Belt, Eastern China. Econ. Geol. 2009, 104, 303–321. [Google Scholar] [CrossRef]
  23. Wannamaker, P.; Hill, G.; Stodt, J.; Maris, V.; Ogawa, Y.; Selway, K.; Boren, G.; Bertrand, E.; Uhlmann, D.; Ayling, B.; et al. Uplift of the central transantarctic mountains. Nat. Commun. 2017, 8, 1588. [Google Scholar] [CrossRef]
  24. Lü, Q.T.; Liu, Z.D.; Dong, S.W.; Yan, J.Y.; Zhang, Y.Q. The nature of Yangtze River deep fault zone: Evidence for deep seismic data. Chin. J. Geophys. 2015, 58, 4344–4359, (In Chinese with English Abstract). [Google Scholar]
  25. Swell, R.J.; Davis, D.W.; Campbell, S.D.G. High precision U-Pb zircon ages for Mesozoic igneous rocks from Hong Kong. J. Asian Earth Sci. 2012, 43, 164–175. [Google Scholar] [CrossRef]
  26. Ye, H.M.; Mao, J.R.; Zhao, X.L. Revisiting to the Early Yanshanian (190~170 Ma) igneous activity in Nanling Mountains, South China: Geochemistry and geodynamic implications. J. Asian. Earth Sci. 2013, 72, 108–117. [Google Scholar] [CrossRef]
  27. Zhang, K.; Lü, Q.T.; Yan, J.Y.; Shao, L.S.; Guo, D. The subduction and continental collision of the North China and Yangtze Blocks: Magnetotelluric evidence from the Susong-Anqing section of Western Anhui, China. Geophys. J. Int. 2019, 216, 2114–2128. [Google Scholar] [CrossRef]
  28. Zhang, K.; Yan, J.Y.; Lü, Q.T.; Wei, W.B.; Wang, H.F.; Zhang, Y.W. Correction of magnetotelluric static shift by analysis of 3D forward modeling and measured test data. Explor. Geophys. 2016, 47, 100–107. [Google Scholar] [CrossRef]
  29. Caldwell, T.G.; Bibby, H.M.; Brown, C. The magnetotelluric phase tensor. Geophys. J. Int. 2004, 158, 457–469. [Google Scholar] [CrossRef]
  30. Rodi, W.; Mackie, R.L. Nonlinear conjugate gradients algorithm for 2-D magnetotelluric inversion. Geophysics 2001, 61, 174–187. [Google Scholar] [CrossRef]
  31. Xu, X.; O’Reilly, S.Y.; Griffin, W.L.; Zhou, X.M. Enrichment of upper mantle peridotite: Petrological, trace element and isotopic evidence in xenoliths from SE China. Chem. Geol. 2003, 198, 163–188. [Google Scholar] [CrossRef]
  32. Zheng, J.P.; O’Reilly, S.Y.; Griffin, W.L.; Zhang, M.; Lu, F.X.; Liu, G.L. Nature and evolution of Mesozoic–Cenozoic lithospheric mantle beneath the Cathaysia block, SE China. Lithos 2004, 74, 41–65. [Google Scholar] [CrossRef]
  33. Yao, Y.; Xu, X.; Griffin, W.L.; O’Reilly, S.Y.; Xia, Q.K. H2O contents and their modification in the Cenozoic subcontinental lithospheric mantle beneath the Cathaysia block, SE China. Lithos 2011, 126, 182–197. [Google Scholar] [CrossRef]
  34. Zheng, Y.F. Metamorphic chemical geodynamics in continental subduction zones. Chem. Geol. 2012, 328, 5–48. [Google Scholar] [CrossRef]
  35. Xue, H.M.; Dong, S.W.; Ma, F.I. Zircon U-Pb SHRMP ages of sub-volcanic bodies related with porphyritic Fe-deposits on the Luzong and Ningwu basins Middle and Lower Yangtze River Reaches, Central China. Acta Petrol. Sin. 2010, 26, 2653–2664, (In Chinese with English Abstract). [Google Scholar]
  36. Uno, K.; Huang, B. Constraints on the Jurassic swing of the apparent polar wander path for the North China Block. Geophys. J. Int. 2003, 154, 801–810. [Google Scholar] [CrossRef]
  37. Xu, Y.; Yang, B.; Zhang, S. Magnetotelluric Imaging of a Fossil Paleozoic Intra–oceanic Subduction Zone in Western Junggar, NW China. J. Geophys. Res. Solid Earth 2016, 121, 4103–4117. [Google Scholar] [CrossRef]
  38. Xu, Y.G. Thermo-tectonic destruction of the Archean lithospheric keel beneath eastern China: Evidence, timing, and mechanism. Phys. Chem. Earth A 2001, 26, 747–757. [Google Scholar] [CrossRef]
  39. Zhou, X.; Yu, X.Q.; Yang, H.M.; Wang, D.E.; Du, Y.D.; Ke, H.B. Petrogenesis and geochronology of the high Ba-Sr Kaobeijian granodiorite porphyry, Jixi County, SouthAnhui Province. Acta Petrol. Sin. 2012, 28, 3403–3417. [Google Scholar]
  40. Lin, S.F.; Xing, G.F.; Davis, D.W.; Yin, C.Q.; Wu, M.L.; Li, L.M.; Jiang, Y.; Chen, Z. Appalachian-style multi-terrane Wilson cycle model for the assembly of South China. Geology 2018, 46, 319–322. [Google Scholar] [CrossRef]
  41. Yu, J.H.; Wang, L.J.; Griffin, W.L.; O’Reilly, S.Y.; Zhang, M.; Li, C.Z.; Shu, L.S. A Paleoproterozoic orogeny recorded in a long-lived cratonic remnant (Wuyishan terrane), eastern Cathaysia Block, China. Precambrian Res. 2009, 174, 347–363. [Google Scholar] [CrossRef]
  42. Zhao, L.; Zhou, X.W.; Zhai, M.G.; Santosh, M.; Geng, Y. Zircon U-Th-Pb-Hf isotopes of the basement rocks in northeastern Cathaysia block, South China: Implications for Phanerozoic multiple metamorphic reworking of a Paleoproterozoic terrane. Gondwana Res. 2015, 28, 246–261. [Google Scholar] [CrossRef]
  43. Li, X.Y.; Zhu, P.M.; Kusky, T.M.; Gu, Y.; Peng, S.B.; Yuan, Y.F.; Fu, J. Has the Yangtze craton lost its root? A comparison between the North China and Yangtze cratons. Tectonophysics 2015, 655, 1–14. [Google Scholar] [CrossRef]
  44. Zheng, Y.F.; Chen, F.K.; Gong, B. The nature of protoliths for coesite-bearing metamorphic terrain of the Dabie Mountains, central China and their geotectonic implications. J. Southeast Asian Earth Sci. 2003, 11, 1–13. [Google Scholar]
  45. Xu, X.B.; Tang, S.; Li, Y. Characteristics of Neoproterozoic—Early Mesozoic multiphase orogenic activities of eastern Jiangnan Orogen. Geol. China 2015, 42, 33–50, (In Chinese with English Abstract). [Google Scholar]
  46. He, L.J.; Hu, S.B.; Wang, J.Y. The characteristics of thermal structure of lithosphere in East China. Prog. Nat. Sci. 2001, 11, 966–969. (In Chinese) [Google Scholar]
  47. Zheng, Y.F.; Chen, R.X.; Xu, Z.; Zhang, S.B. The transport of water in subduction zones. Sci. China Earth Sci. 2016, 59, 651–681. [Google Scholar] [CrossRef]
  48. Ye, K.; Cong, B.L.; Ye, D.N. The possible subduction of continental material to depths greater than 200 km. Nature 2000, 407, 734–736. [Google Scholar] [CrossRef] [PubMed]
  49. Zhang, G.W.; Guo, A.L.; Wang, Y.J.; Li, S.Z.; Dong, Y.P.; Liu, S.F.; Dong, Y.P.; Liu, S.F.; He, D.F.; Cheng, S.Y.; et al. Tectonics of south china continent and its implications. Sci. China Earth Sci. 2013, 56, 1804–1828. [Google Scholar] [CrossRef]
  50. Zheng, Y.F.; Chen, R.X.; Zhao, Z.F. Chemical geodynamics of continental subduction-zone metamorphism: Insights from studies of the Chinese Continental Scientific Drilling (CCSD) core samples. Tectonophysics 2009, 475, 327–358. [Google Scholar] [CrossRef]
  51. Liu, X.; Fan, H.R.; Santoshi, M. Remelting of Neoproterozoic relict volcanic arcs in the Middle Jurassic: Implication for the formation of the Dexing porphyry copper deposit, Southeastern China. Lithos 2012, 150, 85–100. [Google Scholar] [CrossRef]
  52. Wang, G.-G.; Ni, P.; Zhao, K.-D. Petrogenesis of the Middle Jurassic Yinshan volcanic-intrusive complex, SE China: Implications for tectonic evolution and Cu-Au mineralization. Lithos 2012, 150, 135–154. [Google Scholar] [CrossRef]
  53. Li, Z.L.; Zhou, J.; Mao, J.R. Zircon U-Pb geochronology and geochemistry of two episodes of granitoids from the northwestern Zhejiang Province, SE China: Implication for magmatic evolution and tectonic transition. Lithos 2013, 179, 334–352. [Google Scholar] [CrossRef]
  54. Zhang, H.; Lü, Q.T.; Wang, X.L.; Han, S.; Liu, L.; Gao, L.; Wang, R.; Hou, Z.Q. Seismically imaged lithospheric delamination and its controls on the Mesozoic Magmatic Province in South China. Nat. Commun. 2023, 14, 2718. [Google Scholar] [CrossRef]
  55. Mehanee, S.A.; Heinson, G. Gravity data inversion by a faulted 2-D horizontal block of arbitrary thickness with application to crustal imaging. IEEE Trans. Geosci. Remote Sens. 2025, 63, 1–21. [Google Scholar] [CrossRef]
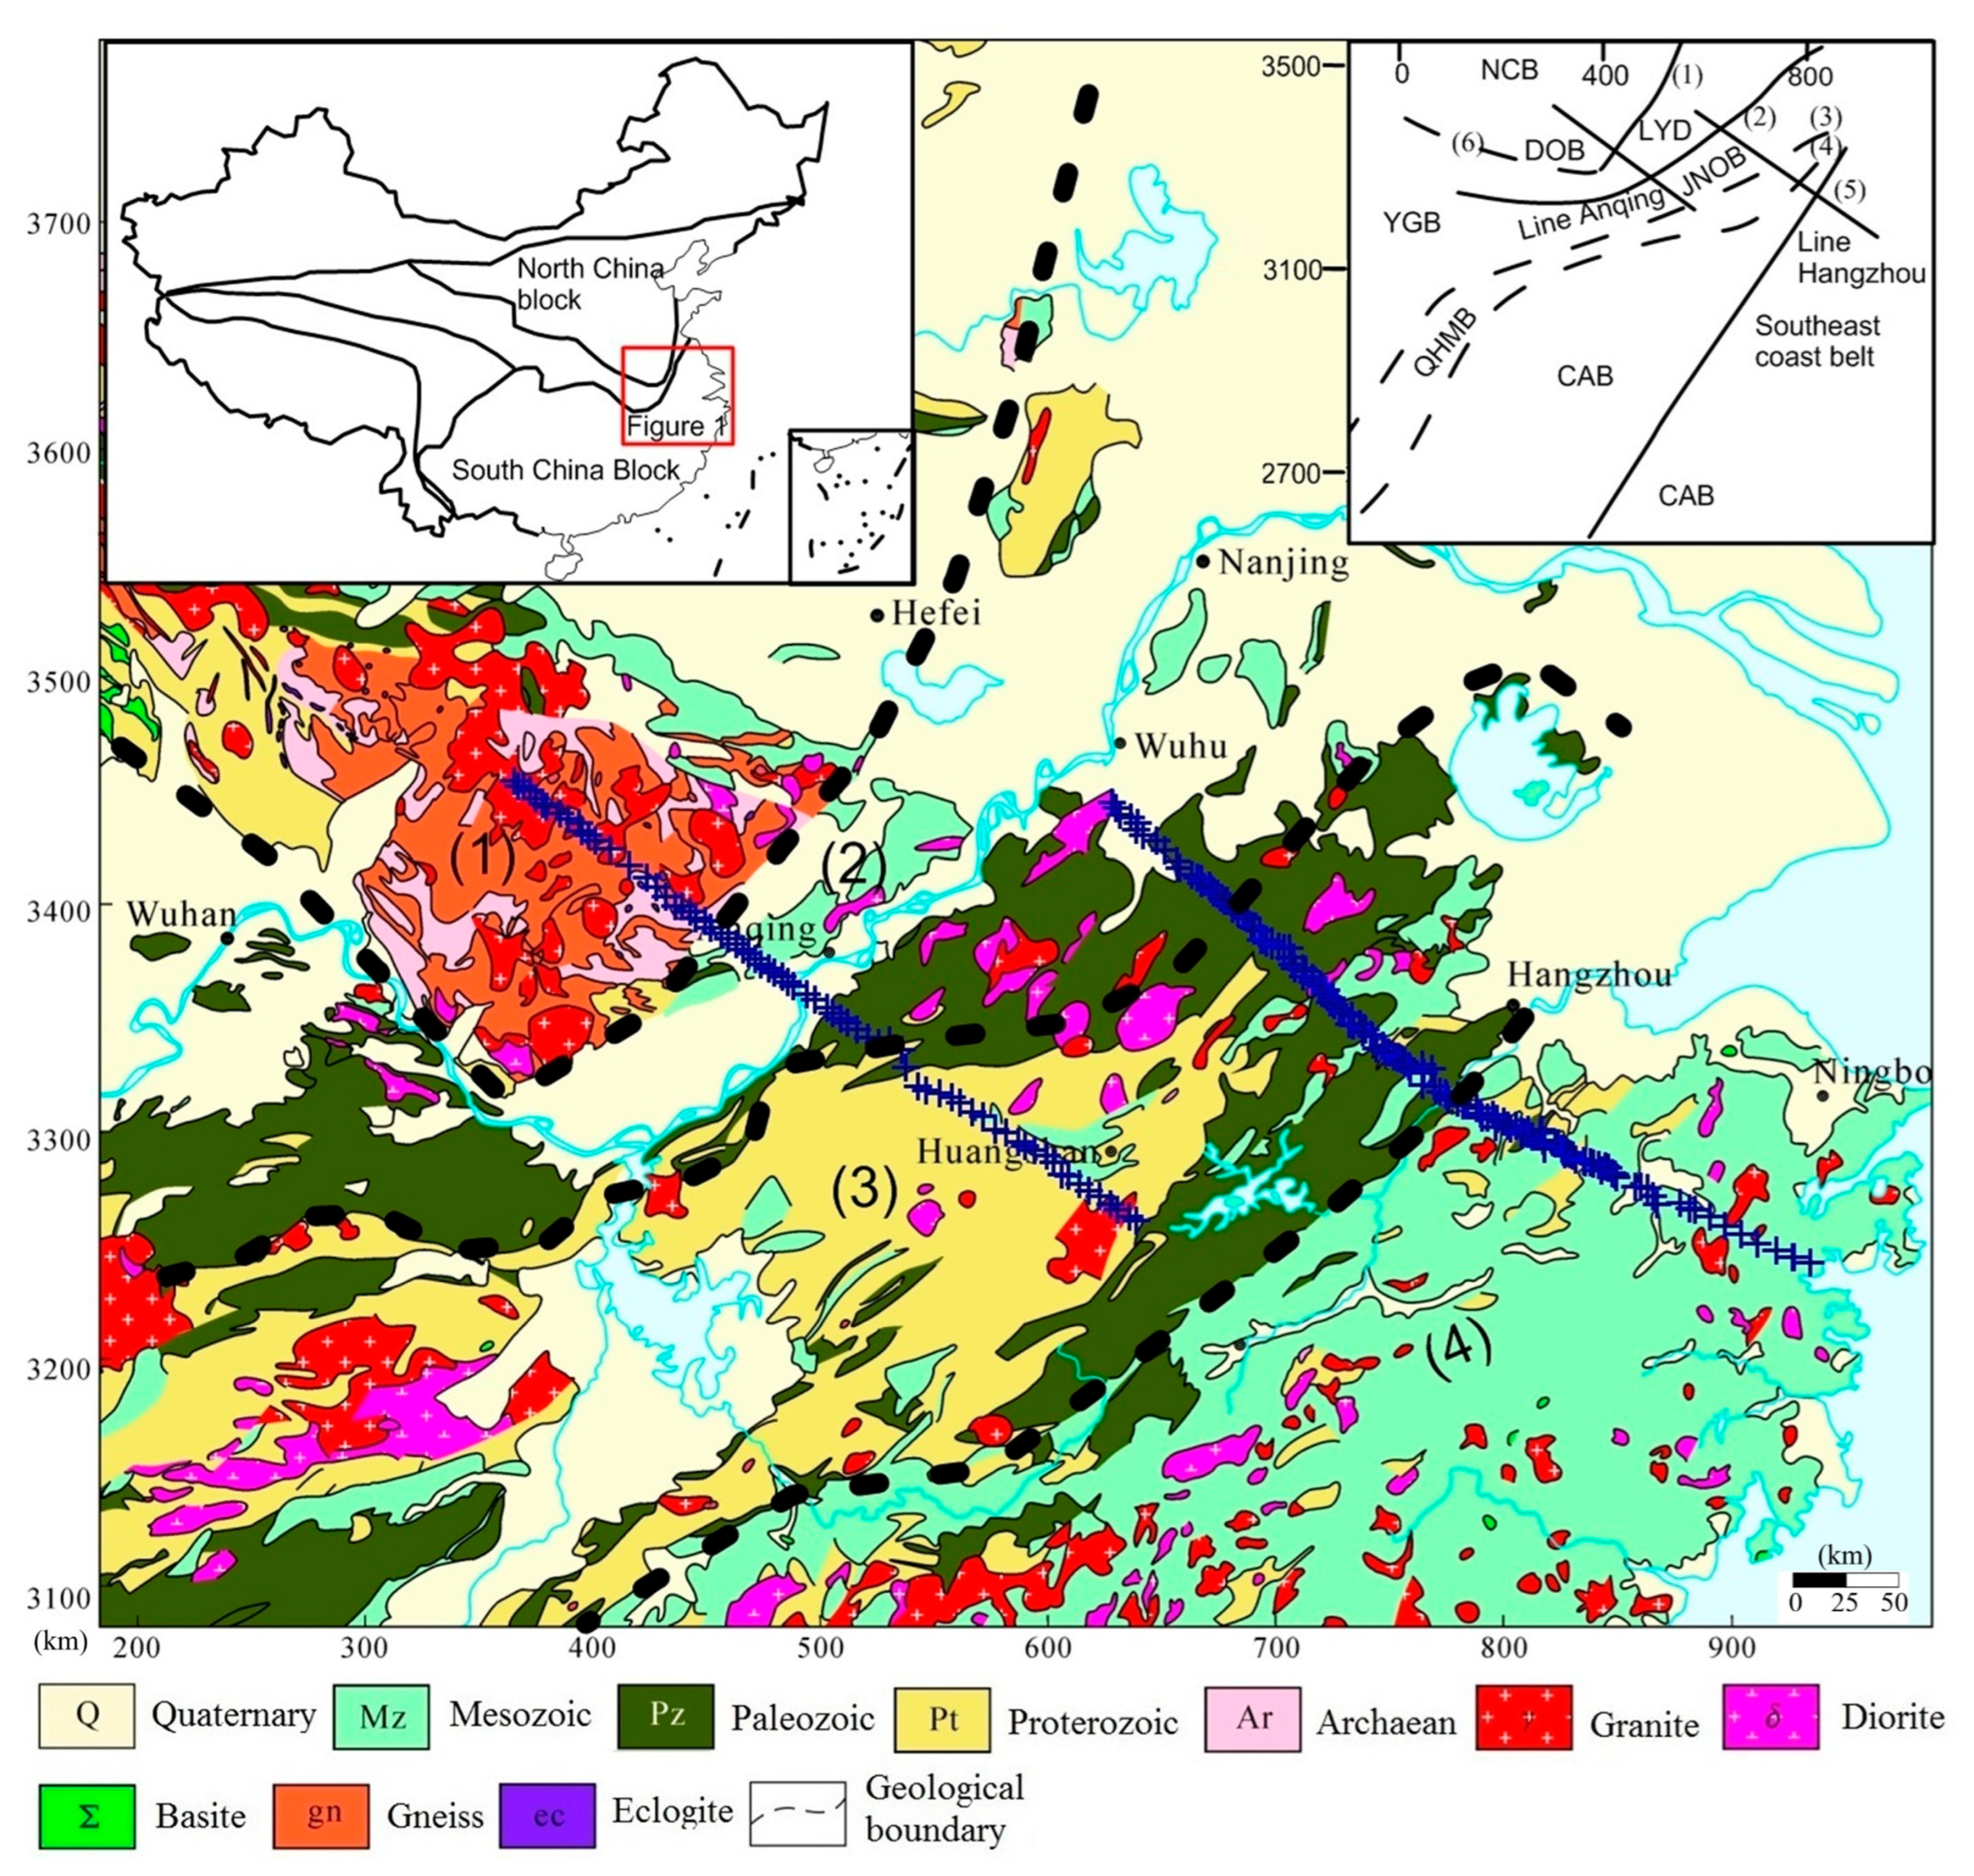
Figure 1. Geological map of East China with MT profiles (“+” are MT stations) after [24]. (1): Dabie orogenic belt (DOB); (2): Lower Yangtze Depression (LYD); (3): Jiangnan orogenic belt (JNOB); (4): Cathaysia block (CAB). Corner subfigure: (1) Tancheng–Lujiang fault (TLF); (2) Nantong–Lushan fault (NLF); (3) Hangzhou–Jinxiu fault (HJF); (4) Jiangshan–Shaoxing fault (JSF); (5) Zhenghe–Dapu fault (ZDF); (6) South faults of the Dabie orogeny.
Minerals 15 01035 g001
Figure 2. (a). Phase tensor ellipses of all the data in line Hangzhou. (b). Phase tensor ellipses of all the data in line Anqing.
Minerals 15 01035 g002aMinerals 15 01035 g002b
Figure 3. Processing data results. Data of four typical TE and TM mode data (apparent resistivity and impedance phase).
Minerals 15 01035 g003
Figure 4. The apparent resistivity and impedance phase comparison of measured data and inversion responses for line Hangzhou. (a) apparent resistivity of TE mode data; (b) apparent resistivity of TE mode inversion response; (c) impedance phase of TE mode data; (d) impedance phase of TE mode inversion response; (e) apparent resistivity of TM mode data; (f) apparent resistivity of TM mode inversion response; (g) impedance phase of TM mode data; (h) impedance phase of TM mode inversion response.
Minerals 15 01035 g004
Figure 5. The apparent resistivity and impedance phase comparison of measured data and inversion responses for line Anqing. (a) apparent resistivity of TE mode data; (b) apparent resistivity of TE mode inversion response; (c) impedance phase of TE mode data; (d) impedance phase of TE mode inversion response; (e) apparent resistivity of TM mode data; (f) apparent resistivity of TM mode inversion response; (g) impedance phase of TM mode data; (h) impedance phase of TM mode inversion response.
Minerals 15 01035 g005
Figure 6. The data fit and model roughness of the inversion model for line Hangzhou (a) and line Anqing (b).
Minerals 15 01035 g006
Figure 7. TE + TM data inversion model of line Anqing. (a): resistivity model; (b): penetration depth. “C”: conductors; “R”: resistors; “+”: MT stations.
Minerals 15 01035 g007
Figure 8. TE + TM data inversion model of line Hangzhou. (a): resistivity model; (b): penetration depth. “C”: conductors; “R”: resistors; “+”: MT stations.
Minerals 15 01035 g008
Figure 9. The comparison of seismic tomography and MT inversion results. (a) Seismic tomography section of the South China block; (b) seismic tomography profile of Line B-B’ (after [13]); (c): resistivity model of line Anqing; (d): resistivity of line Hangzhou. 1: high velocity and resistivity body; 2: low velocity and resistivity body; 3: deduced detachment interface.
Minerals 15 01035 g009
Figure 10. Thermal heat flow after [46]. C-C’ and D-D’ are profiles shown in Figure 9.
Minerals 15 01035 g010
Figure 11. The geological model of the Mesozoic evolution of SCB. (a): intracontinental subduction between WCAB and ECAB before the NCB–SCB collision; (b): an extensional regime conversion in CAB after the break-off of eastern slab (R8); (c): a compressional regime conversion in SCB driven by slab (R2) traction and Paleo-Pacific plate movement; (d): extensional regime conversion driven by slab (R2) sinking and asthenosphere upwelling; (e): continental welding in a compressional setting.
Minerals 15 01035 g011
Disclaimer/Publisher’s Note: The statements, opinions and data contained in all publications are solely those of the individual author(s) and contributor(s) and not of MDPI and/or the editor(s). MDPI and/or the editor(s) disclaim responsibility for any injury to people or property resulting from any ideas, methods, instructions or products referred to in the content.