Article

Optimizing Mineral Resources with Automated Mineralogy Techniques: The Case of Colquiri in the Central Andean Tin Belt

by
Pura Alfonso
1,*,
Miguel Ruiz
2,
Marçal Terricabras
1,
Arnau Martínez
1,
Maite Garcia-Valles
3,
Hernan Anticoi
1,
Maria Teresa Yubero
1 and
Susanna Valls
4
1
Departament d’Enginyeria Minera, Industrial i TIC, Universitat Politècnica de Catalunya Barcelona Tech, Av. Bases de Manresa 61–63, 08242 Manresa, Spain
2
Facultad Nacional de Ingeniería, Universidad Técnica de Oruro, Ciudadela Universitaria, Oruro 0401, Bolivia
3
Departament de Mineralogia, Petrologia i Geologia Aplicada, Universitat de Barcelona, Carrer Martí i Franquès, s/n, 08028 Barcelona, Spain
4
Department d’Enginyeria Civil i Enginyeria Ambiental, Universitat Politècnica de Catalunya BarcelonaTech, Campus Nord UPC, 08034 Barcelona, Spain
*
Author to whom correspondence should be addressed.
Minerals 2025, 15(10), 1017; https://doi.org/10.3390/min15101017
Submission received: 12 July 2025 / Revised: 21 September 2025 / Accepted: 23 September 2025 / Published: 25 September 2025

Abstract

Colquiri is one of several deposits from the Central Andean tin belt, where sphalerite and cassiterite are mined. Although this is a high-grade Zn-Sn deposit, processing results in a low overall yield, with significant amounts of zinc and tin being discarded as tailings. In this study, mineralogical research was conducted to identify the causes of the low yield, so that the flow diagram could be modified to improve recovery. Particle size was measured, and chemical and mineralogical analyses were performed using optical and electron microscopy and X-ray diffraction. The mineral chemistry of the ores was determined using electron probe microanalysis (EPMA), and mineral liberation analyses were performed to complete the characterization. Mineralization occurred in four stages: (1) formation of silicates and oxides; (2) main precipitation of sulfides, including pyrrhotite, sphalerite, and stannite; (3) precipitation of fluorite and the replacement of pyrrhotite by pyrite, which was then replaced by siderite; and (4) weathering of previously formed minerals. The run-of-mine material contains approximately 12 wt.% ZnO and 1.5 wt.% SnO2. The Zn concentrate contains up to 43.90 wt.% ZnO, and the Sn concentrate contains 52 wt.% SnO2. The final tailings still retain more than 3–4.5 wt.% ZnO and 1.2 wt.% SnO2. The average grain size of sphalerite is 200 µm, while that of cassiterite and stannite is 45 µm. The liberated fraction of sphalerite is 51.43%, and binary particles of sphalerite plus stannite account for 60 wt.%. Cassiterite is liberated at 54.68 wt.%. To increase the recovery of sphalerite (with stannite) and cassiterite, as well as the grade of the concentrates, it is necessary to reduce the particle size of the processed ores to less than 100 µm.

1. Introduction

In the present-day world, mineral resources are a key component of our development, and, given their non-renewable nature, it is essential to ensure their optimal exploitation so that future generations can continue to benefit from the resources currently available to us [1]. This is particularly important for strategically significant metals such as indium and tin. Although tin is not currently listed among critical minerals for the European Union, its widespread use in the electronics industry, especially in micro-soldering applications, highlights its key role as a raw material [2]. Both metals are used in the production of indium tin oxide (ITO), which is essential for touch screens, solar panels, and biosensors [3].
In recent years, the growing concern about the scarcity of certain mineral resources has led to an increased focus on optimizing raw material availability through improved recovery efficiency. This includes the reprocessing of tailings, which often contain significant amounts of valuable metals, making them potential secondary sources [4,5]. Recovering metals from old sulfide tailings presents a dual opportunity: not only does it enable the extraction of useful metals, but it also helps reduce the environmental impact of potentially harmful elements remaining in the tailings [6,7].
Historically, low recovery rates can be largely attributed to the limited technology available at the time of exploitation. However, with the advanced mineralogical and processing tools available today, recovery should be significantly more efficient, minimizing the amount of valuable material left in tailings. Achieving optimal metal recovery efficiency requires a comprehensive understanding of both the mineralogy and geochemistry of the deposit, as well as the processes involved in ore concentration. Process mineralogy plays a key role in identifying which valuable minerals can be effectively recovered [8]. It also aids in evaluating the efficiency of resource exploitation and contributes to optimizing the current processing flow diagram [9]. Despite numerous studies highlighting the importance of detailed mineralogical characterization of ores [9,10], mineralogy is still often treated as secondary. This oversight frequently results in suboptimal resource recovery—significantly lower than what could be achieved with a more informed approach. Such inefficiency not only leads to economic losses but also to the unnecessary loss of valuable raw materials, which either remain unrecovered or are only identified later as components of tailings.
In these cases, detailed chemical and mineralogical studies become essential for the reprocessing and recovery of valuable metals [11]. Otherwise, new waste dumps will continue to accumulate, eventually becoming secondary sources of raw materials themselves, as seen in the case of mining residues in Llallagua, located in the Central Andean tin belt [12]. It is not only important to determine the content and mineralogy of trace elements of potential economic interest, but also to understand them, since some of these elements can act as penalties during the metallurgical process [13].
Today, automated mineralogy techniques can be used to obtain detailed information about the presence of minerals and their interrelationships, either in a natural deposit or in the materials resulting from their processing. This information helps complete the data obtained from other complementary studies, such as microscopic observations, X-ray diffraction analyses, and geochemical and mineral chemistry studies. Additionally, the data gathered using these techniques are invaluable for building a robust database, which is essential for achieving high-quality results across automated mineralogy methods. Even so, the data obtained through automated mineralogy should be interpreted with caution, as several factors can cause inaccuracies in the results [14,15]. The primary limitations include the small sample volume analyzed and the stereological error due to measurements being made in two dimensions [16,17,18].
These techniques are currently widely applied as they allow making or adapting the flowsheet to optimize profits [19]. However, their use also contributes to the geological study of the deposit and the establishment of its genetic model [20,21], which can benefit mine design, support successful planning of its processing [22], and enhance knowledge of potential by-products.
At the beginning of the 20th century, Bolivia was the world’s leading producer of Sn; today, it ranks fifth globally [23]. The Central Andean tin belt accounts for 15% of the world’s tin production [2,24]. Moreover, most deposits within this belt are of significant interest due to their high potential to host substantial amounts of critical metals, mainly In and, to a lesser extent, Ge and Ga [5,25,26,27,28,29].
The primary objective of this study is to evaluate the efficiency of resource utilization of the Colquiri deposit through a comprehensive processing mineralogy analysis aimed at improving metal recovery. To achieve this, the chemical composition of the ore, concentrates, and tailings was determined to assess processing performance. In addition, a detailed examination of the chemical composition of the economically important minerals was conducted, along with analyses of their quantitative mineralogy and mineral liberation characteristics.
The Colquiri deposit is located in the southeast of the department of La Paz, at an altitude between 4200 and 4400 m. The mine is currently one of the most productive in Bolivia, extracting zinc and tin ore. The run-of-mine material is processed at a plant located next to the mine site. Tailings are disposed of in a nearby containment pond. This deposit was of great interest in the first half of the 20th century, when it was considered the second largest tin mine in Bolivia in terms of tin production, being mentioned by Ahlfeld [30] and described by Campbell [31], who provided an overview of the mine, the description of the main minerals, and a genetic study based on petrographic observations. The genetic model was elaborated in more detail in subsequent studies, including fluid inclusion analyses [32,33]. The detailed mineralogy of Colquiri was described by Hanus [34].

2. Geological Setting

The Colquiri deposit, located at the southern end of the Cordillera Real mountain range, belongs to the La Paz district of the Central Andean tin belt (Figure 1), which extends from southern Peru to northern Argentina and hosts numerous world-class mineral deposits containing Sn, W, Ag, and base metals, associated with peraluminous granites and porphyry intrusions of crustal melts formed during two distinct geological periods: a Late Triassic–Early Jurassic episode in the northern part of the belt, and a Late Oligocene to Miocene episode in the central and southern parts [35,36,37].
The Colquiri deposit, composed of fissure-filling polymetallic veins, originated as a result of subvolcanic or plutonic acidic magmatism during the Oligocene–Miocene period [33]. The Cordillera Real is composed of Paleozoic materials intruded by various granitic bodies; however, no intrusive rocks have been identified in the vicinity of the deposit [26]. Despite this, the Colquiri deposit has been associated with the Quimsa Cruz intrusive, although there is a distance of about 50 km between them. It is composed of granodiorites and quartz monzonites [38,39]
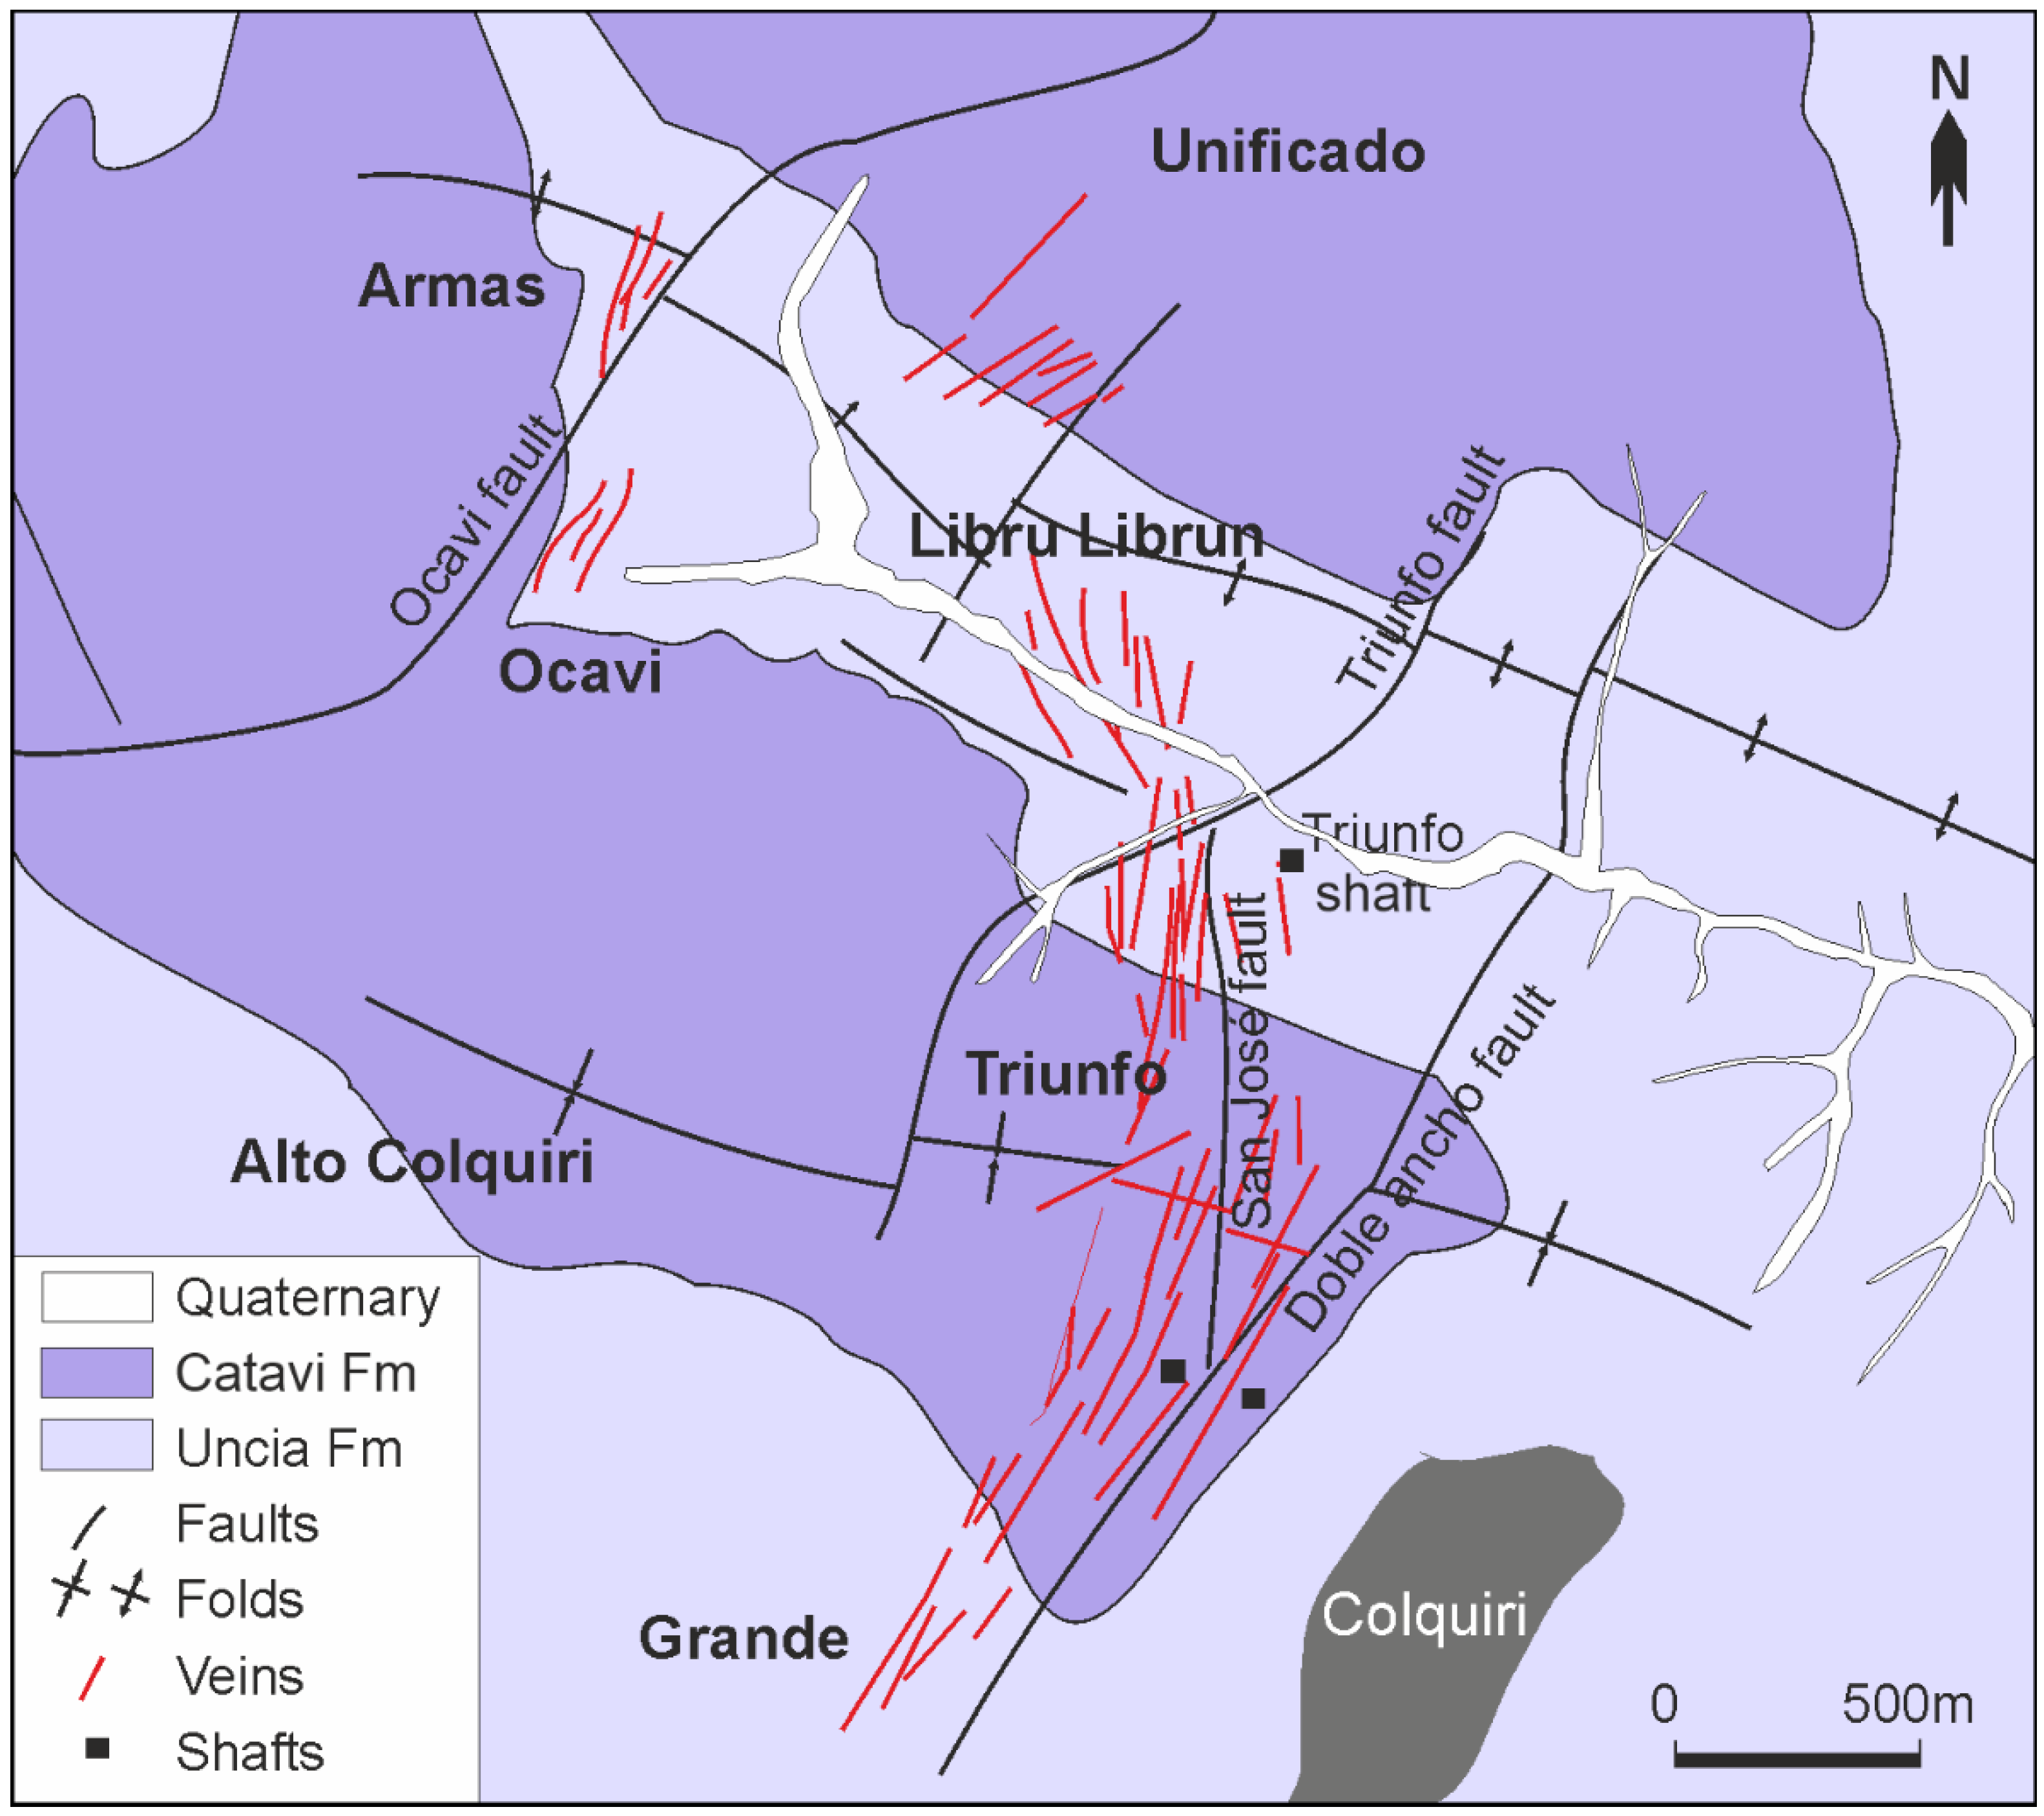
The deposit consists of veins hosted within Silurian shales and quartzites of the Uncía and Catavi Formations (Figure 2). The Uncía Formation is composed primarily of pelitic rocks with sandy intercalations toward its upper levels, while the Catavi Formation comprises alternating layers of quartzites and black shales, with a total thickness of approximately 500 m. All these rock units have been affected by folding with a NW–SE structural trend. The mineralized veins are found filling faults with N–S and NNE orientations, with the main fault systems being San José, Ocavi, Triunfo, and Doble Ancho. These veins can reach lengths of up to 700 m and thicknesses of up to 2 m. The most significant veins are Blanca, Rosario, San Antonio, and San Carlos. According to the distribution of veins, the deposit has been divided into seven sectors [33]: Armas, Ocavi, Unificada, Triunfo, Grande, Alto Colquiri, and Central.
The ore minerals consist of both oxides and sulfides. The sulfide assemblage includes sphalerite, pyrrhotite, pyrite, arsenopyrite, stannite, and marcasite, along with cassiterite, which is the primary tin ore mineral. The cassiterite content increases with depth. Magnetite is also present. The gangue minerals are mainly composed of quartz, fluorite, topaz, tourmaline, siderite, and fluorite.

3. Materials and Methods

3.1. Materials

The studied materials came from the Colquiri mine and its processing plant. At the mine, samples were collected along the shafts located at the levels currently being worked, corresponding to −535 and −600 m, and belonging to the Blanca vein. A total of approximately 20 kg of samples was taken along 400 m of each of the two shafts.
At the processing plant, samples were taken at various points along the process chain. Feed materials and Zn and Sn concentrates were collected at three different times that were several months apart.
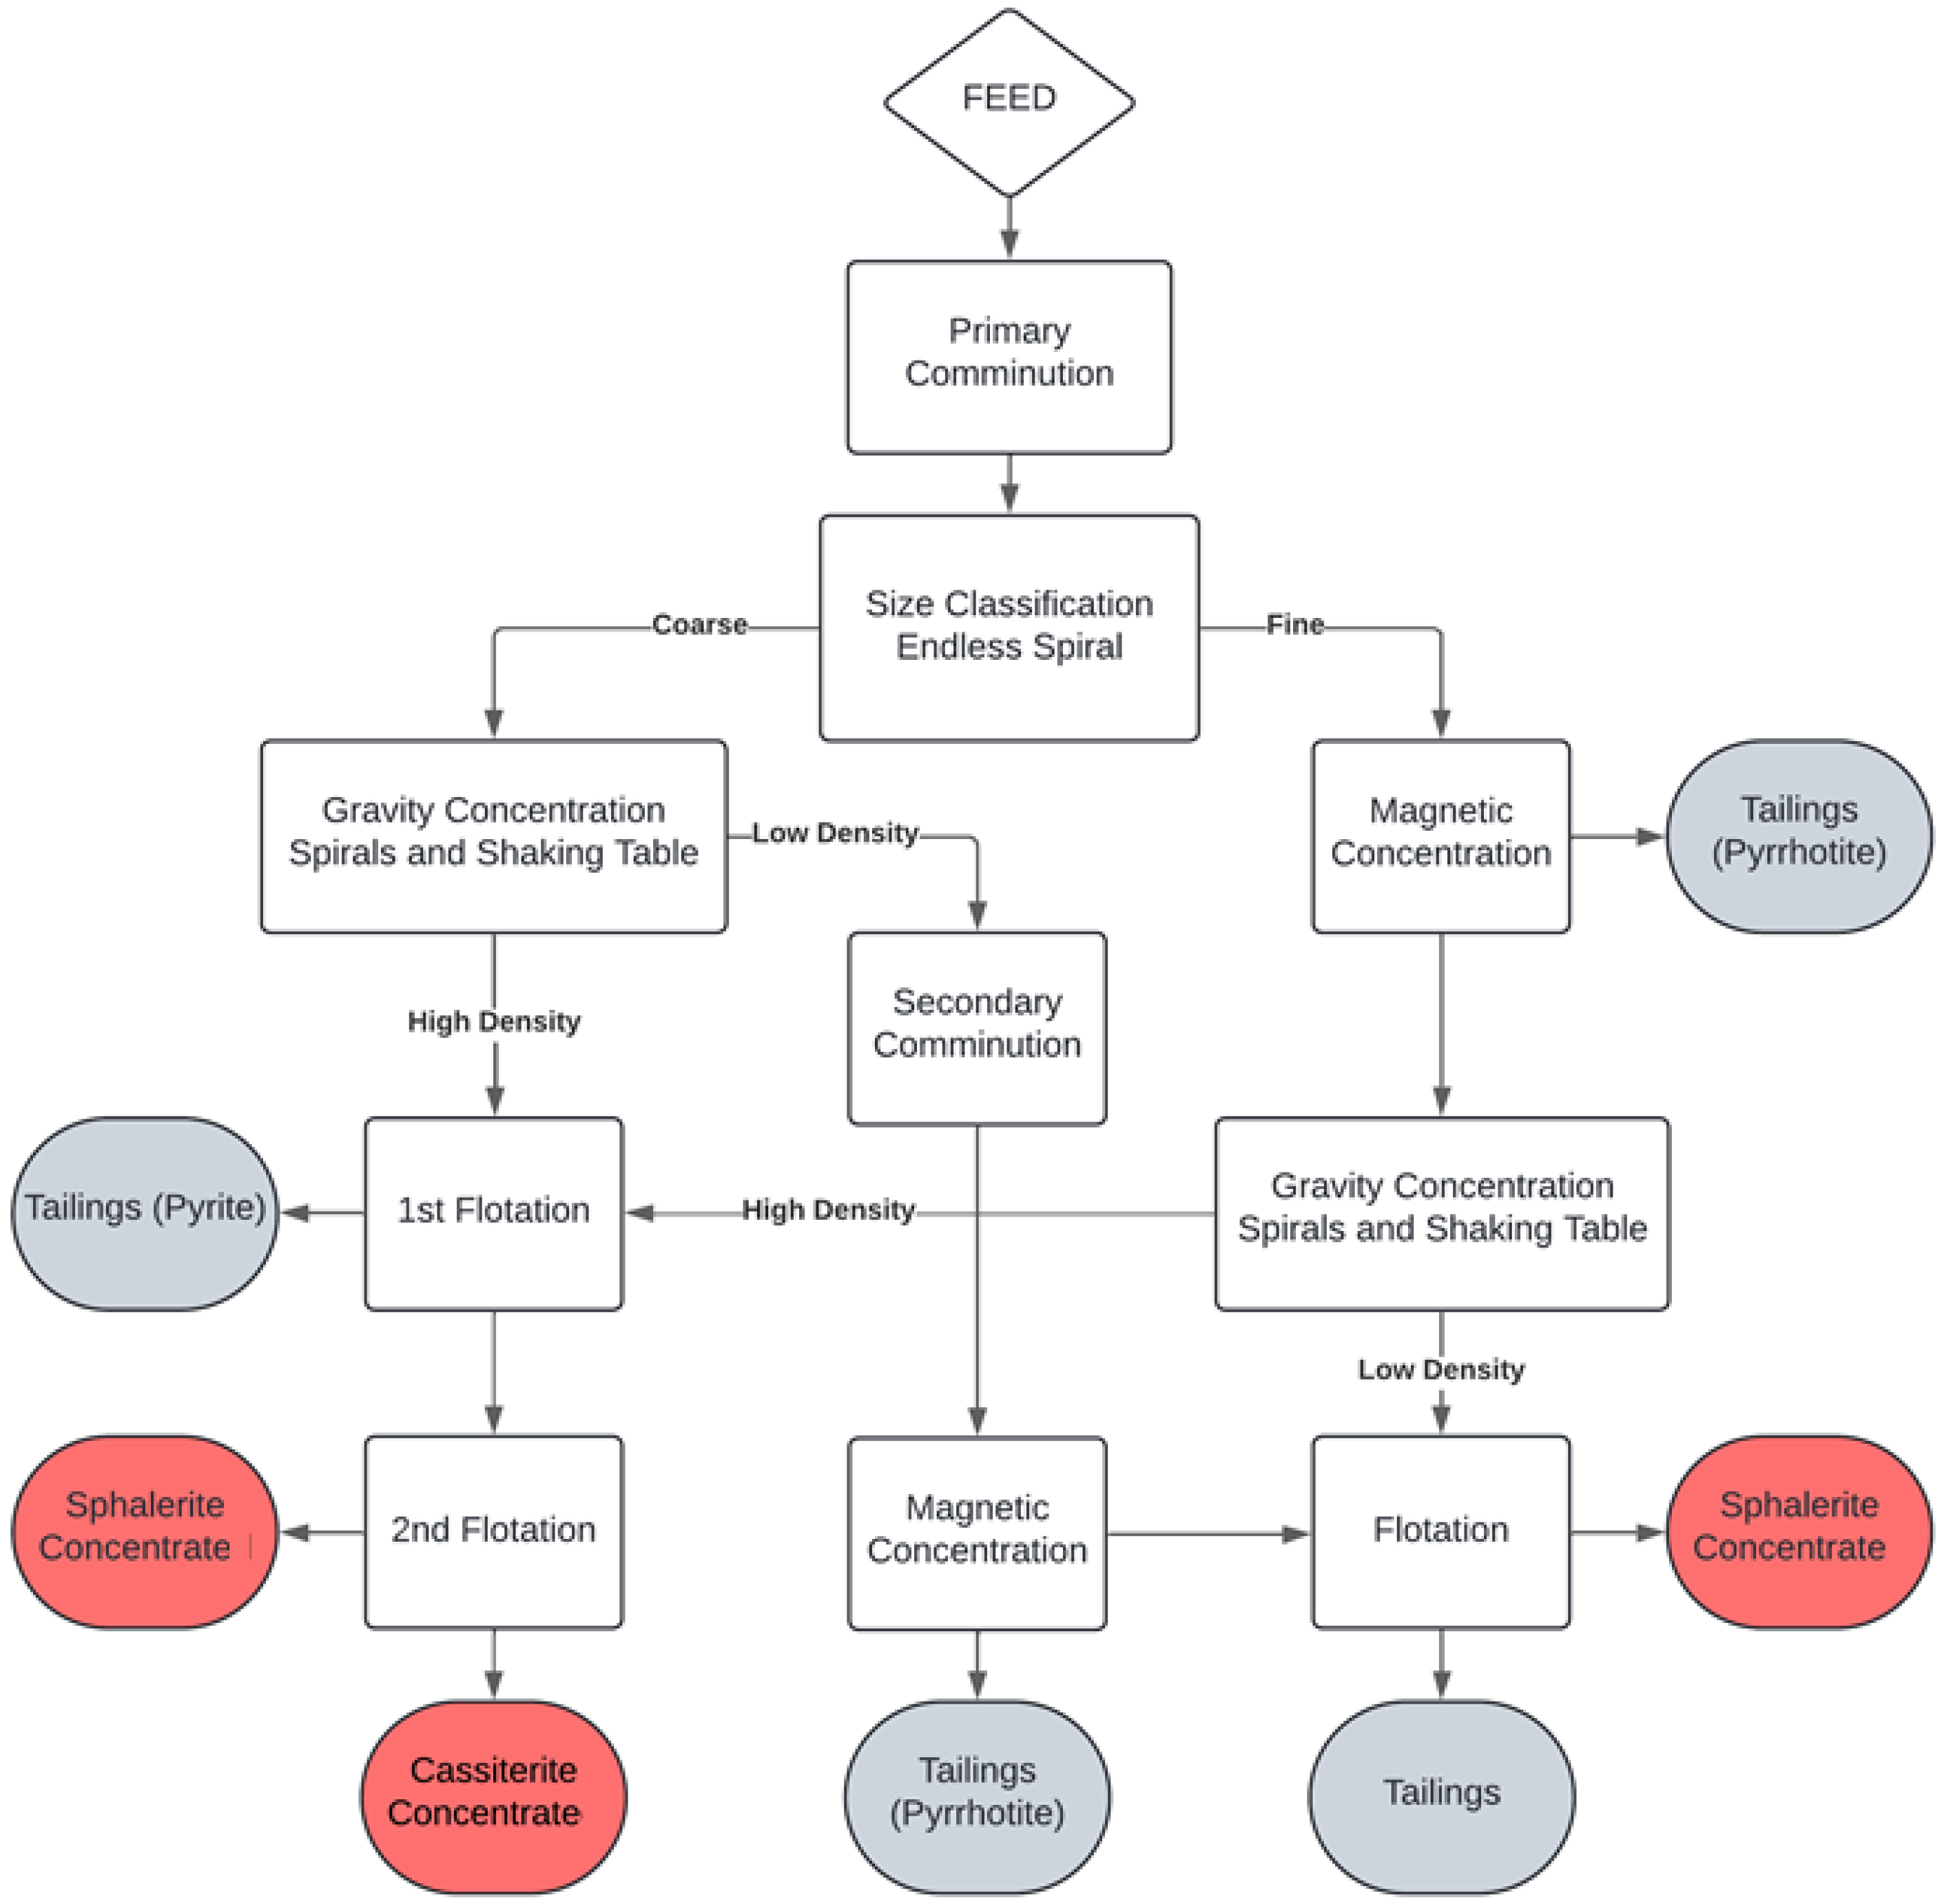
A flowsheet diagram of the processing plant is shown in Figure 3. Initially, the run-of-mine material is screened. After that, it proceeds directly to the first crushing stage, where a crusher reduces its size. Next, the material enters a grinding stage using a semi-autogenous mill (SAG), which uses fewer balls than a conventional ball mill, allowing the material itself to play a significant role in the grinding process. After this grinding stage, the material passes through a screen that recirculates oversized particles back through the SAG, while allowing appropriately sized material to move forward. In the final reduction phase, the material undergoes a last grinding using a rod mill.
The second concentration stage involves a magnetic separator with magnetized drums, which primarily removes pyrrhotite, the most abundant mineral in this deposit, sending it to the tailings. The remaining material goes through gravimetric separators, such as spirals, to enhance separation based on density. Following this, the material is processed through a shaking table system for further concentration. The final stage involves flotation cells, where the ore is refined to produce the final concentrate.
Samples were collected at both the input and output of the different mills to determine their particle size distribution. The sample sizes were obtained based on the particle size to ensure representative screening. Additionally, material was collected from the output of the magnetic concentrator. Final tailings were also sampled at five different locations within the tailings pond to conduct a comprehensive analysis.

3.2. Analytical Methods

The particle size distribution of materials from different points in the processing plant was determined manually and using a LS 13 320 Beckman Coulter Particle Size Analyzer (Brea, CA, USA). The chemical composition was determined for two whole-rock samples (one from each of the two levels of the sampled shafts), the plant feed material, and three concentrates, which were obtained from five areas of the tailings pond. Sieved and unsieved samples were analyzed via X-ray fluorescence (XRF) using Epsilon-1 equipment (Malvern Panalytical Ltd., Malvern, UK), from the ore processing laboratory of the Universitat Politècnica de Catalunya. Some analyses were conducted at ALS Laboratories for use in calibration. Sn, Zn, and In were determined at ALS Laboratories via ICP-Ms using a four-acid digestion method.
Mineralogy was characterized using X-ray powder diffraction (XRD), optical microscopy, employing both reflected and transmitted light, and scanning electron microscopy (SEM) coupled with an energy-dispersive X-ray spectroscope (EDS). To this end, 20 thick polished sections were prepared from samples collected from the shafts, processing plant feed, concentrates, and tailings. Additionally, two thin polished sections of the material from the shaft samples were prepared. The samples were initially examined under an optical microscope, followed by observation under an electron microscope. XRD was systematically applied to all samples, including both sieved and unsieved materials.
The XRD spectra were measured using a Bruker D8-A25 powder diffractometer (Bruker Corporation, Billerica, MA, USA), with graphite monochromator, automatic gap, Kα-radiation of Cu at λ = 1.5406 Å, powered at 40 kV–40 mA, and a scanning range of 4°–60° with a 0.019° 2θ step size and a measuring time of 0.8 s per step. Identification and Rietveld semiquantitative evaluation of phases were conducted with PANanalytical X’Pert HighScore software, version 2.2.5 (PANalytical, Almelo, The Netherlands). Scanning electron microscopy with energy-dispersive spectral analysis (SEM–EDS) was performed using a Hitachi TM-1000 tabletop electron microscope (EDX, High-Technologies Corporation, Tokyo, Japan).
Mineral chemistry of sulfide minerals and cassiterite was performed on 8 polished thick sections of the geological samples using a five-channel JEOL JXA-8230 electron microprobe (EMP; Jeol Ltd., Tokyo, Japan) at Centres Científics i Tecnològics of the University of Barcelona (CCiT-UB), operated at 20 kV acceleration voltage, 20 nA beam current, and with a beam diameter of 5 µm. Analytical standards and lines used for analyses were as follows: sphalerite (Zn, Kα), cassiterite (Sn, Lα), chalcopyrite (Cu, Kα, FeS2 (Fe and S, Kα), Ag2S (Ag, Lα), Sb (Sb, Lα), CdS (Cd, Lβ), PbS (Pb, Mα), GaAs (As, Lβ), InSe2 (In, Lβ), and Ge (Ge, Lα).
Automated mineral liberation analysis (MLA) was employed to determine the liberation characteristics of the ore. A representative, unsieved sample of the feed material from the processing plant was selected after the initial grinding process. A thick section was prepared within a cylindrical mold using resin. To prevent particle segregation based on density, the thick section was then cut into two vertical slices [28]. Analyses were carried out at the University of Tasmania using a FEI MLA650 (FEI, Hillsboro, OR, USA) environmental scanning electron microscope equipped with a Bruker Quantax Esprit 1.9 EDS system with two XFlash 5030 SDD detectors (Bruker, Berlin, Germany). MLA measurements were performed at 20 kV with a 1.5 µm pixel resolution using the XBSE method. This approach captures a series of backscattered electron (BSE) images at a specified resolution, segments the images into different mineral grains based on BSE contrast and textural features, and acquires a single EDS in the center of each identified mineral grain. Mineral liberation analysis was carried out using the MLA software package v3.1 and the Bruker automated mineral identification and characterization system (AMICS) software package v3. The latter is a more advanced system, capable of analyzing smaller grains and featuring a significantly larger database than traditional MLA software [40].

4. Results

4.1. Mineralogy of Ores

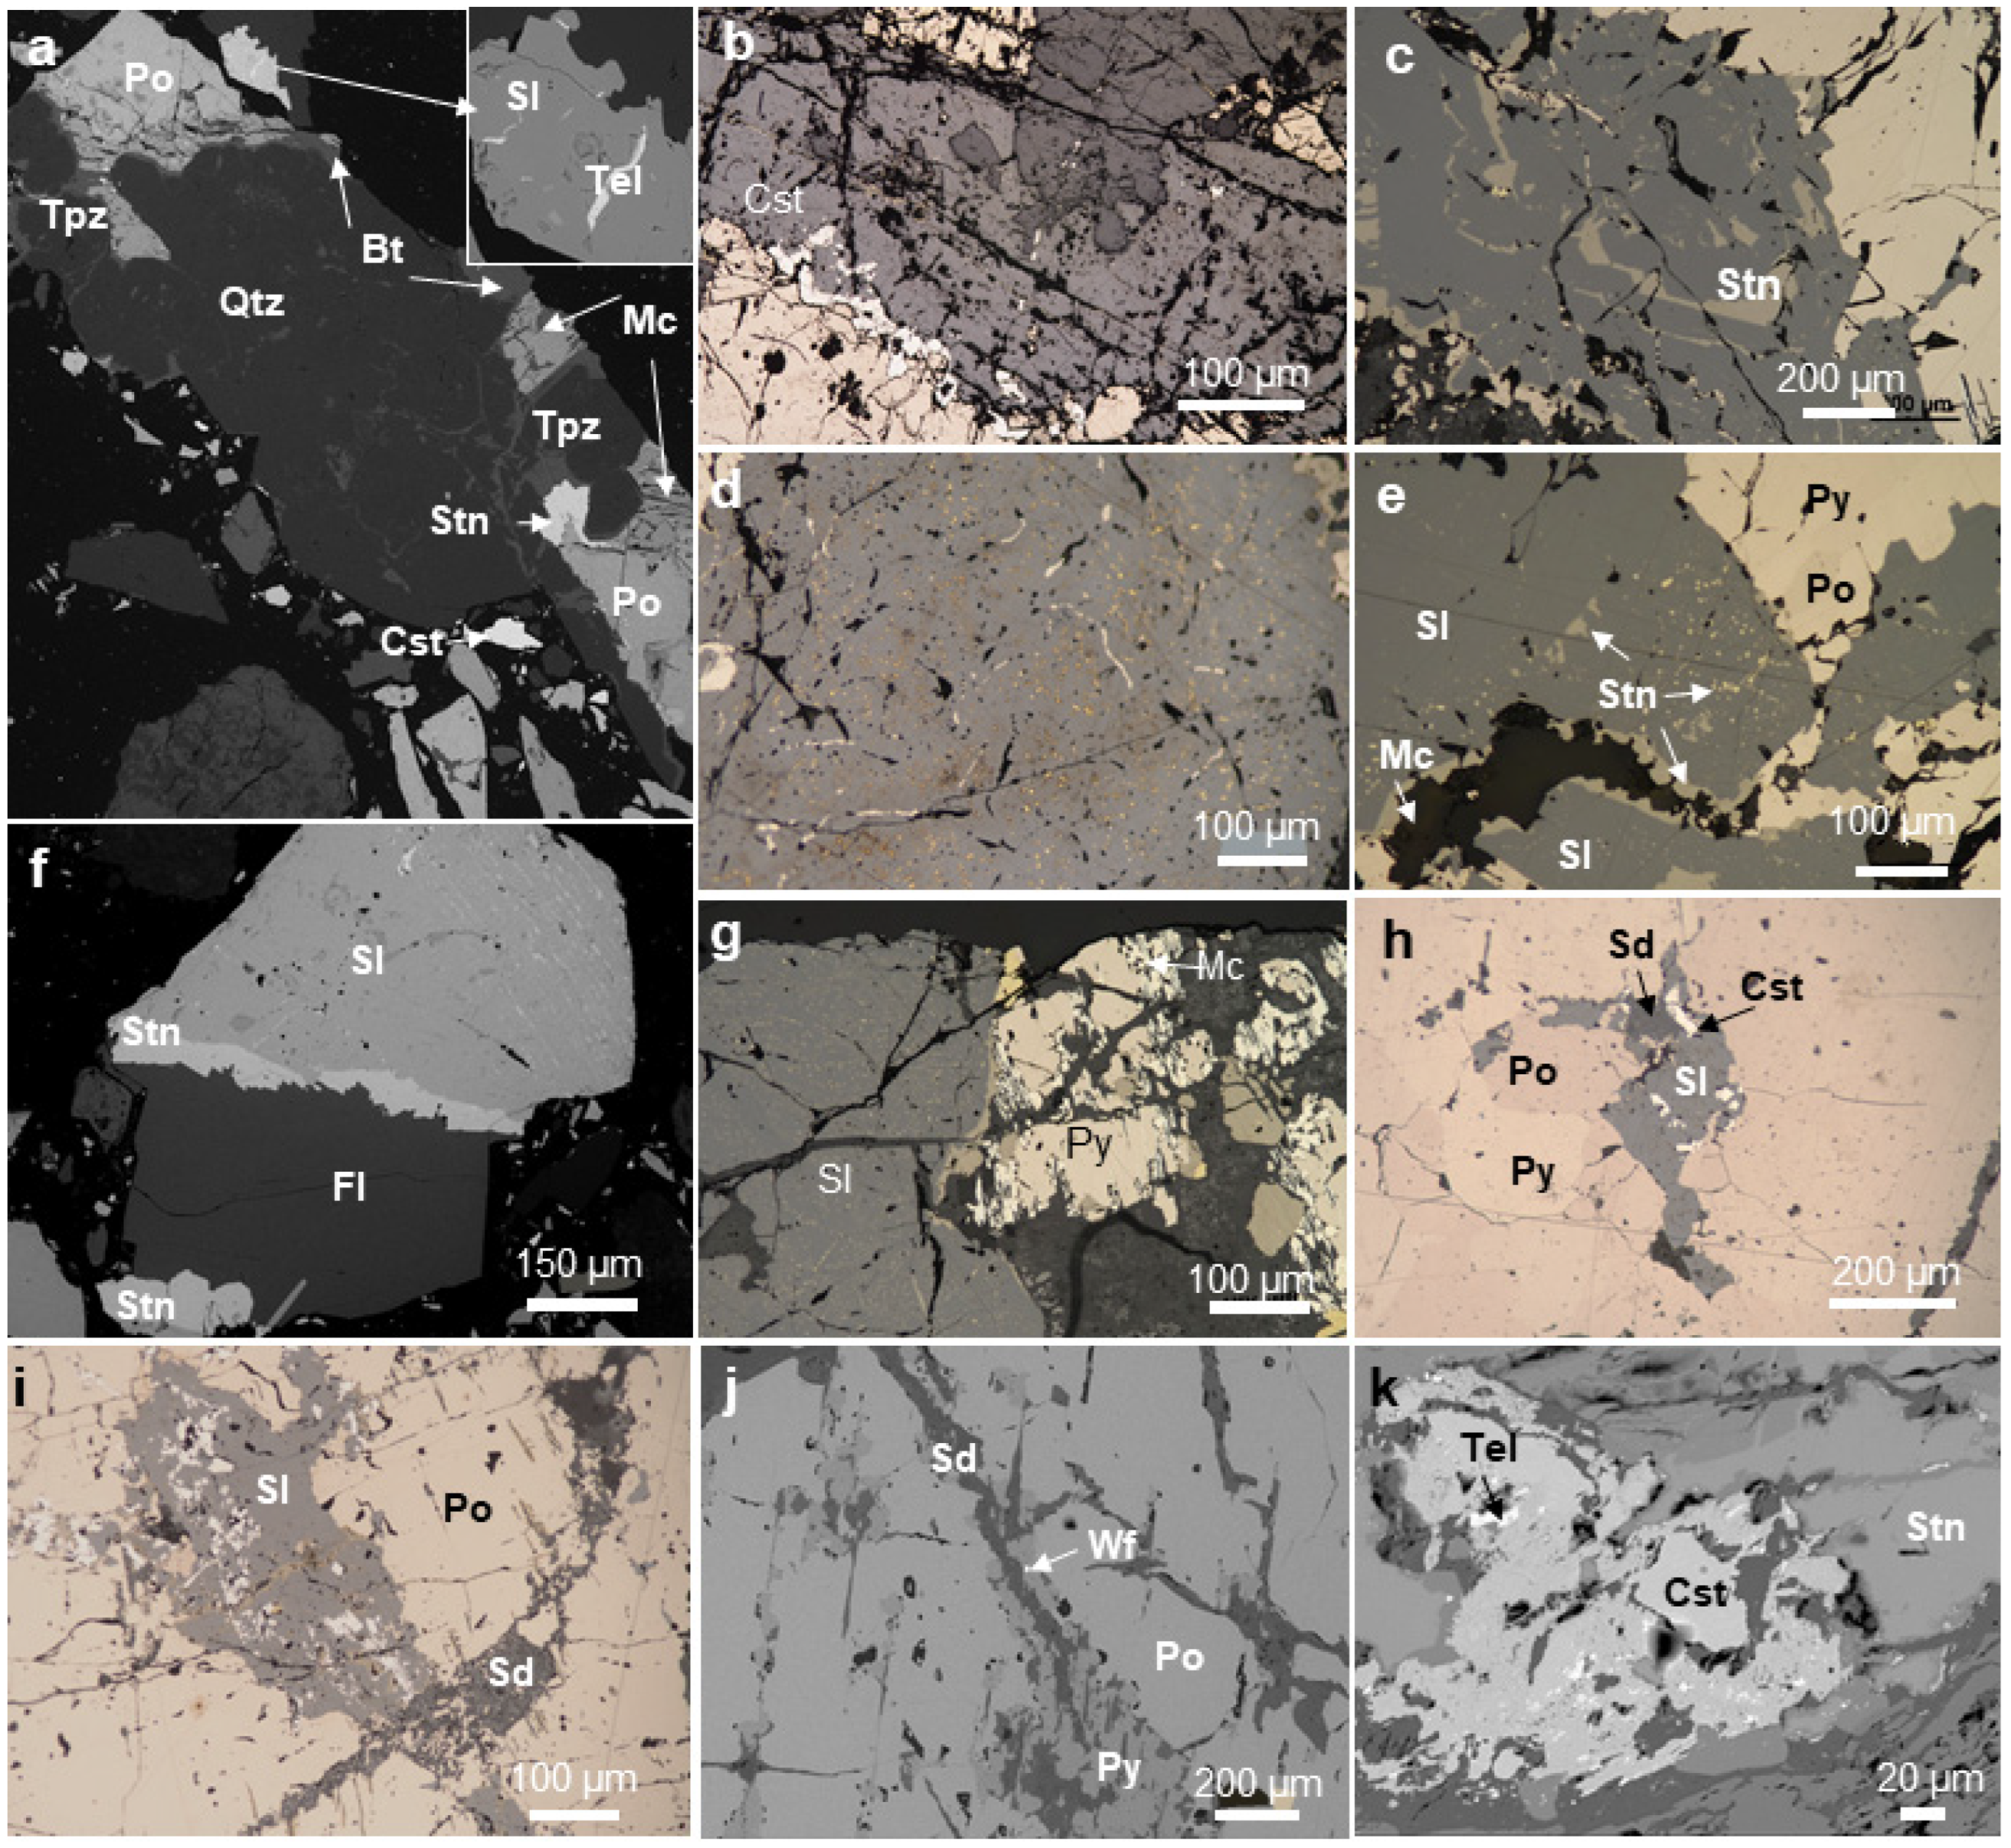
The Colquiri deposit is composed mainly of sulfides and oxides, with sulfides being more common in the upper parts of the deposit, while the ratio of oxides increases with depth. The main ore minerals include pyrrhotite, sphalerite, pyrite, stannite, and cassiterite (Figure 4).
Similarly to other deposits within the Central Andean tin belt, the mineralogy of Colquiri can be categorized into four distinct stages [2,32,34]: first, an early vein stage characterized by the precipitation of silicates and oxides; second, a stage of primary sulfide formation; third, a period dominated by fluorite precipitation, sulfide replacements, and the formation of late sulfides; and fourth, a stage involving the deposition of late minerals and the alteration of silicates (Figure 4a) [32,34].
Cassiterite is the most abundant oxide. It occurs in hemihedral and anhedral crystals usually up to 100 µm in size, although some crystals extend several millimeters (Figure 4b). Additionally, minor amounts of wolframite and rutile are present.
Silicates are mainly quartz, biotite, topaz, and dravite. The feldspar content is almost negligible and has only been determined via AMICS and MLA characterization. This scarcity can be attributed to the fact that the hydrothermal fluids responsible for forming the vein minerals caused the alteration of the previously formed silicates, transforming them into secondary minerals. As a result, kaolinite, sericite, and chlorite formed.
The second stage is characterized by sulfide deposition and begins with the formation of pyrrhotite, which is the main iron sulfide. Sphalerite, which is the most abundant ore, occurs as black grains in a massive distribution. Two different generations can be identified. The earlier generation contains numerous inclusions of other minerals, mainly stannite and, to a lesser extent, pyrrhotite and chalcopyrite.
In Colquiri, stannite is primarily associated with sphalerite. It can be found in alternating bands with sphalerite, indicating coprecipitation, and in exsolved grains within sphalerite, forming rims around this mineral (Figure 4c–e). Chalcopyrite occurs mainly as exsolutions within sphalerite. Galena, tetrahedrite, freibergite, and bismuthinite are present in minor amounts as late minerals. Teallite was also observed as thin veinlets within sphalerite and is associated with stannite (Figure 4a,k).
In the third stage, fluorite and replacements of the previous sulfides are produced. In the study area, fluorite was observed only occasionally; however, according to other studies, in some parts of the Colquiri deposit, this is a major mineral and can be produced in two different stages [32]. In the studied mineralization, fluorite appears, filling the innermost parts of veins and cavities, in which sphalerite and stannite have previously crystallized (Figure 4f).
As crystallization progresses, the availability of sulfur increases. Consequently, after some time, pyrite becomes the most stable mineral. Pyrite occurs in masses and cubic crystals up to 2 mm in size, often replacing pyrrhotite. Additionally, pyrrhotite is also replaced by marcasite, which frequently exhibits a bird’s eye texture. Subsequently, siderite replaces all these minerals (Figure 4g–k).
Teallite has been described by several authors in Colquiri [41]). In the present work, it has always been identified as a late-stage mineral, both associated with cassiterite and sphalerite. In this case, smaller amounts of galena and some Ag-rich minerals, such as freibergite, are also found.
Finally, the last stage involves the formation of Fe oxides. The late generation of fluorite has also been attributed to this stage by Kelly and Turneaure [32].
The detailed study of the mineralogy and its textures allowed us to establish the paragenetic sequence. Previously, other authors had presented a paragenetic sequence of the Colquiri minerals [32,34]; however, this could be completed with aspects of interest from the economic point of view. For example, in this study, it has been seen that there are at least two generations of sphalerite (Figure 5). This sequence is consistent with the model proposed by Lehman [2] for the formation of Bolivian tin deposits.
The use of the various mineralogical analytical techniques has made it possible to complete the list of minerals present in the deposit and the quantification of the phases, as shown in Table 1. Here, it can be seen that the differences between the results provided via MLA and AMICS are minimal.

4.2. Mineralogy of Concentrates and Tailings

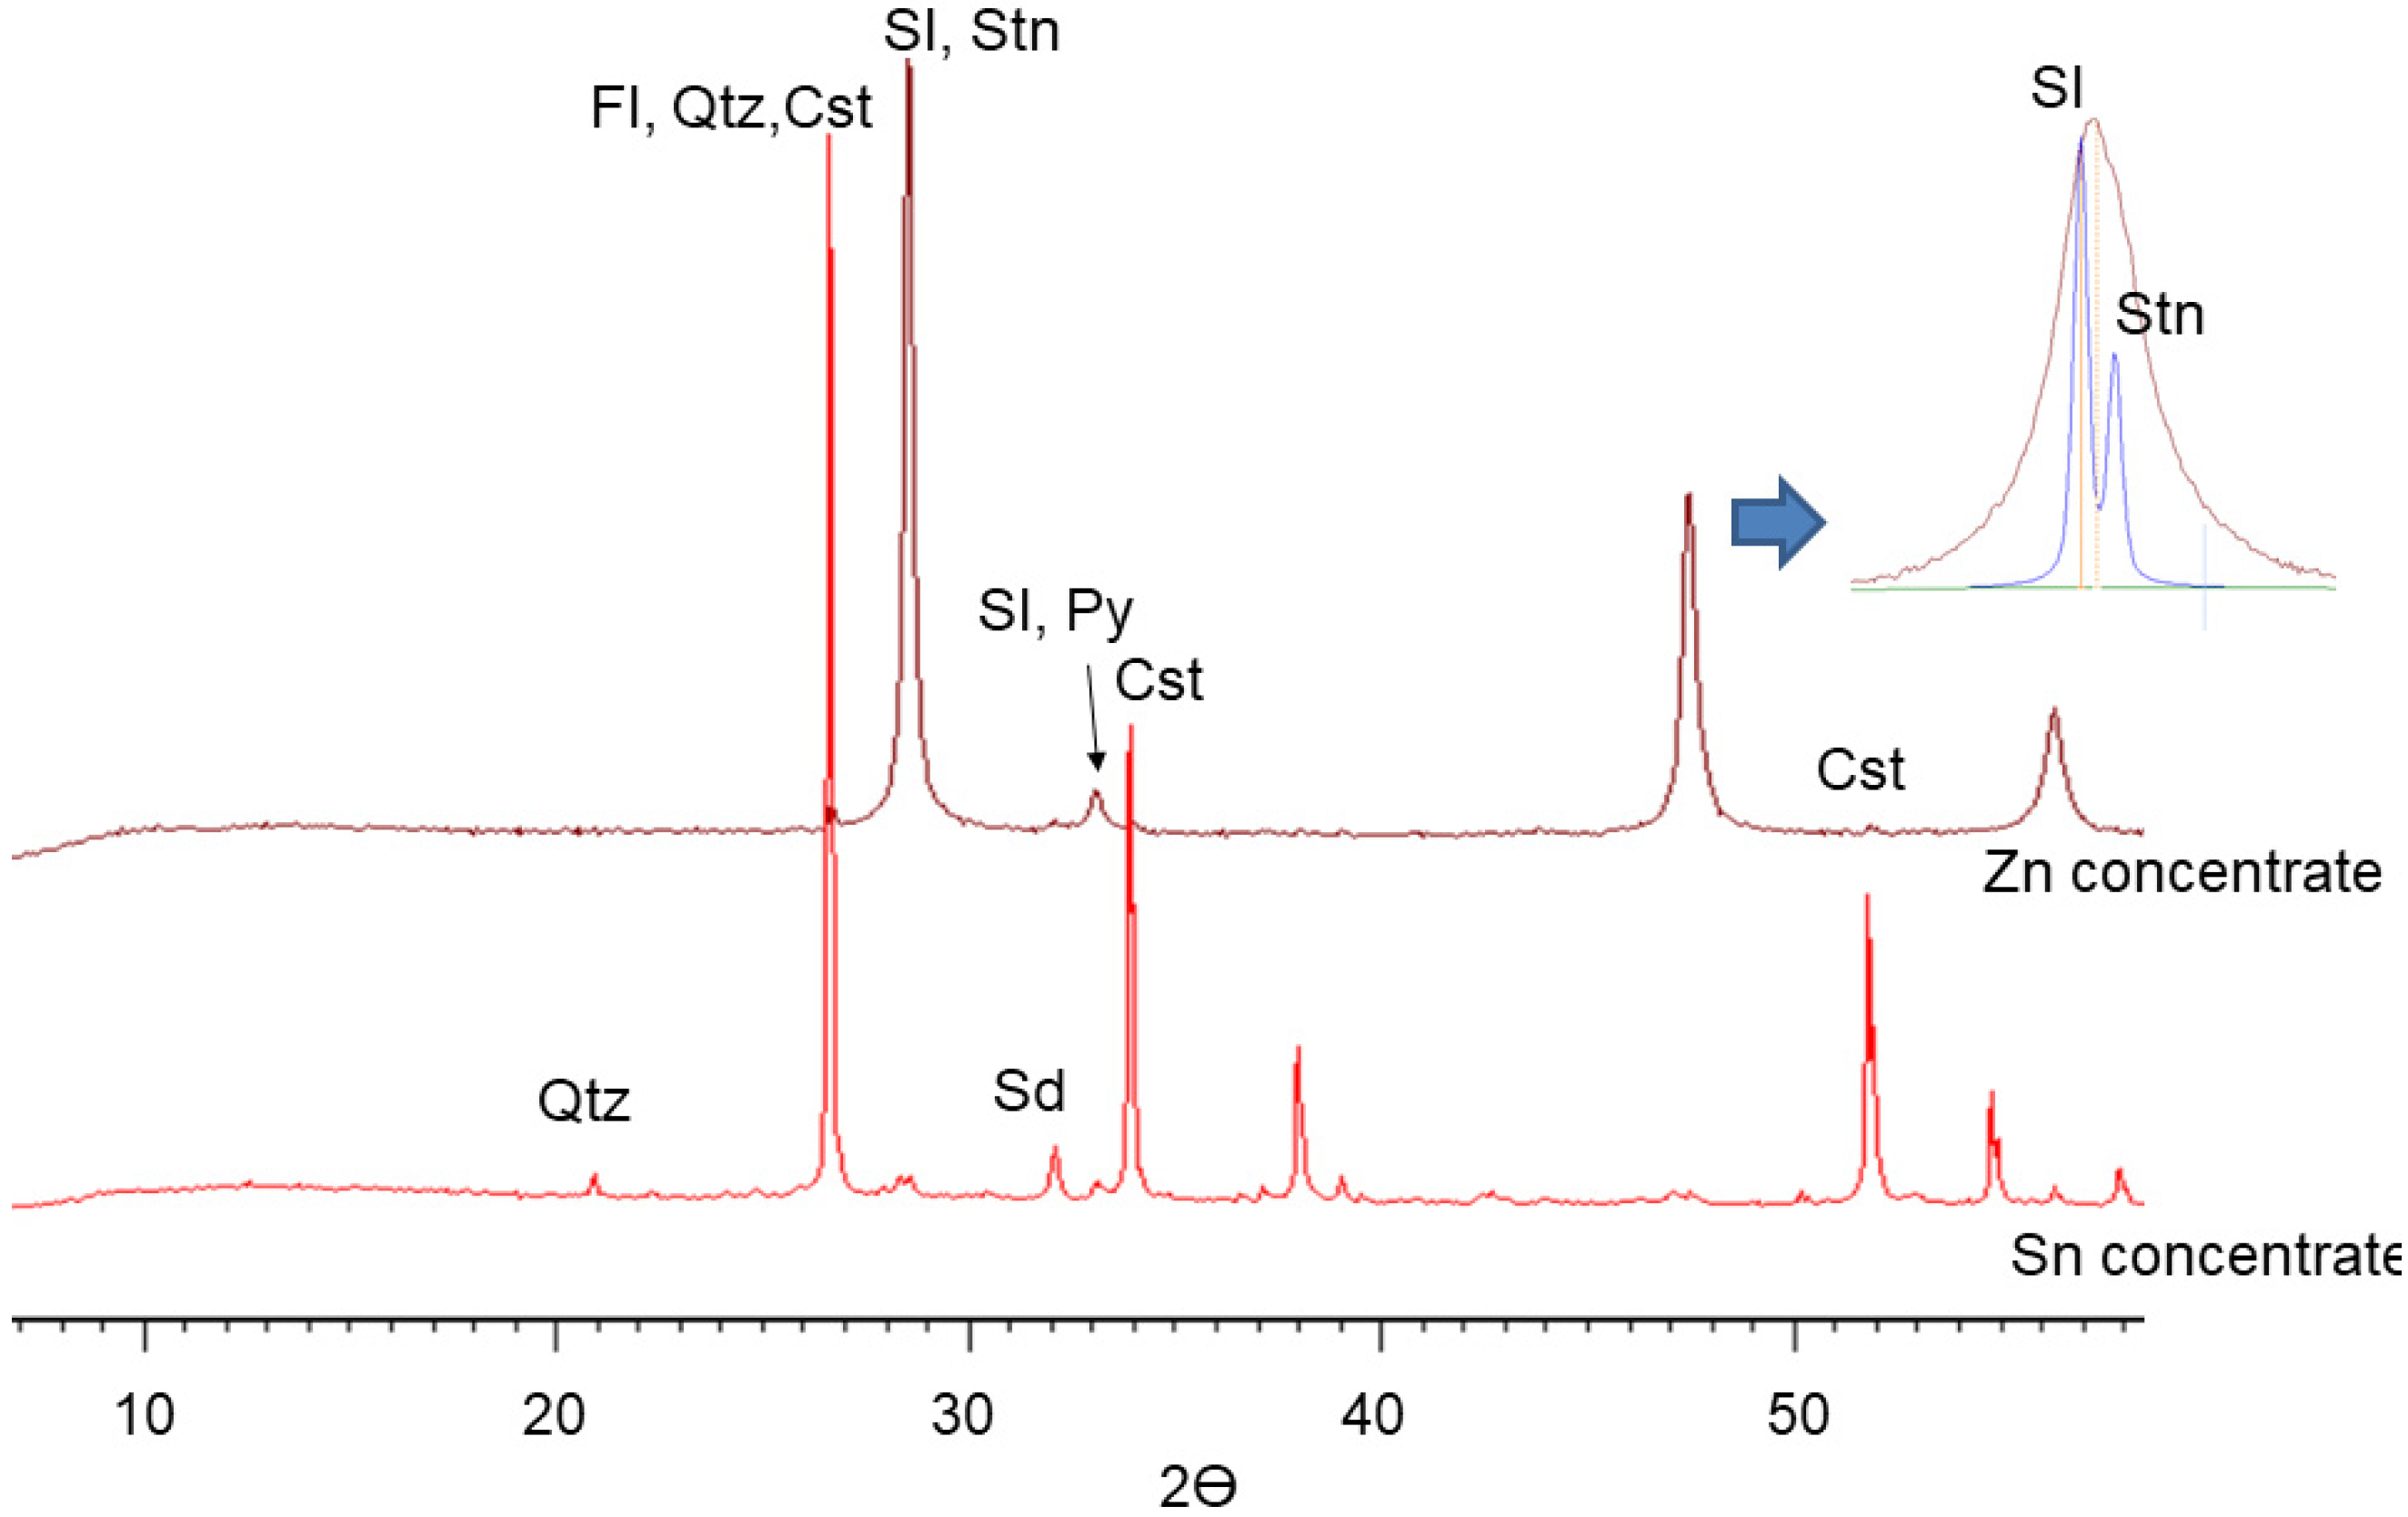
Mineralogy of concentrates and tailings was determined via XRD, and samples were observed in thick sections via optical microscopy, SEM, and XRD. According to the XRD diffractograms (Figure 6), the Zn concentrate consists of 65 wt.% sphalerite, 2.5 wt.% stannite, and 1.3 wt.% cassiterite, with a minor amount of quartz. The Sn concentrate has slightly more than 50 wt.% cassiterite and about 20 wt.% of quartz. The stannite content is negligible, but it contains sphalerite, siderite, and minor amounts of pyrite and fluorite.

4.3. Chemical Composition

Chemical analyses of the run-of-mine, concentrates, and tailings are shown in Table 2. Run-of-mine and ores have an average of 13 wt.% Zn and approximately 3 wt.% SnO2. Regarding other elements of interest, these materials show indium concentrations ranging from 155 to 172 ppm. The mineralization contains an average of 40.6 ppm Ga. On the other hand, in all cases, the Ta and Nb contents are negligible.
The richest Zn concentrate contains up to 43.9 wt.% Zn and 14.35 wt.% Fe. In addition, there is up to 1.35 wt.% SnO2 and 7790 ppm Cu. These concentrates have high indium contents, with values up to 481 ppm. The Sn concentrate contains 52.56 wt.% SnO2, 7.6 wt.% Fe, and 2.08 wt.% Zn. In contrast to the Zn concentrate, the Sn concentrate is low in indium, with only an average of 18 ppm.
The tailings are rich in Fe and SiO2, with up to 30.5% Fe and 23.5% SiO2. In terms of the mined metals, these still contain an average of 4.60 wt.% Zn, locally reaching up to 5% by weight, and an average of 1.0% SnO2, reaching up to 1.13 wt.% SnO2.
Despite the high Zn and Sn contents, the processing plant produces zinc and tin concentrates with relatively low grades, leaving economically valuable amounts of these metals in the tailings.
In Colquiri, indium content correlates with Zn content (Figure 7).
Previously, highly variable indium contents have been reported for the Colquiri deposit, ranging from as low as 37 ppm [42] to an average of 213 ppm across different sectors [26]. The concentrations obtained in this study are consistent with those reported by Murakami and Ishihara [43] for the Porco deposit, which is one of the most In-rich deposits in the Central Andean tin belt. Additionally, Cu content also correlates with Zn and is higher in the Zn concentrate. The same applies to Ga, which correlates with Zn and not with Sn, suggesting that sphalerite contains high amounts of Ga, as several authors have suggested [44,45].

4.4. Mineral Chemistry

Mineral chemistry was carried out to determine the specific composition of the ore minerals and the distribution of certain elements of economic interest, such as In and Ge. Most analyses were conducted on sphalerite, stannite-group minerals, and cassiterite (Table 3).
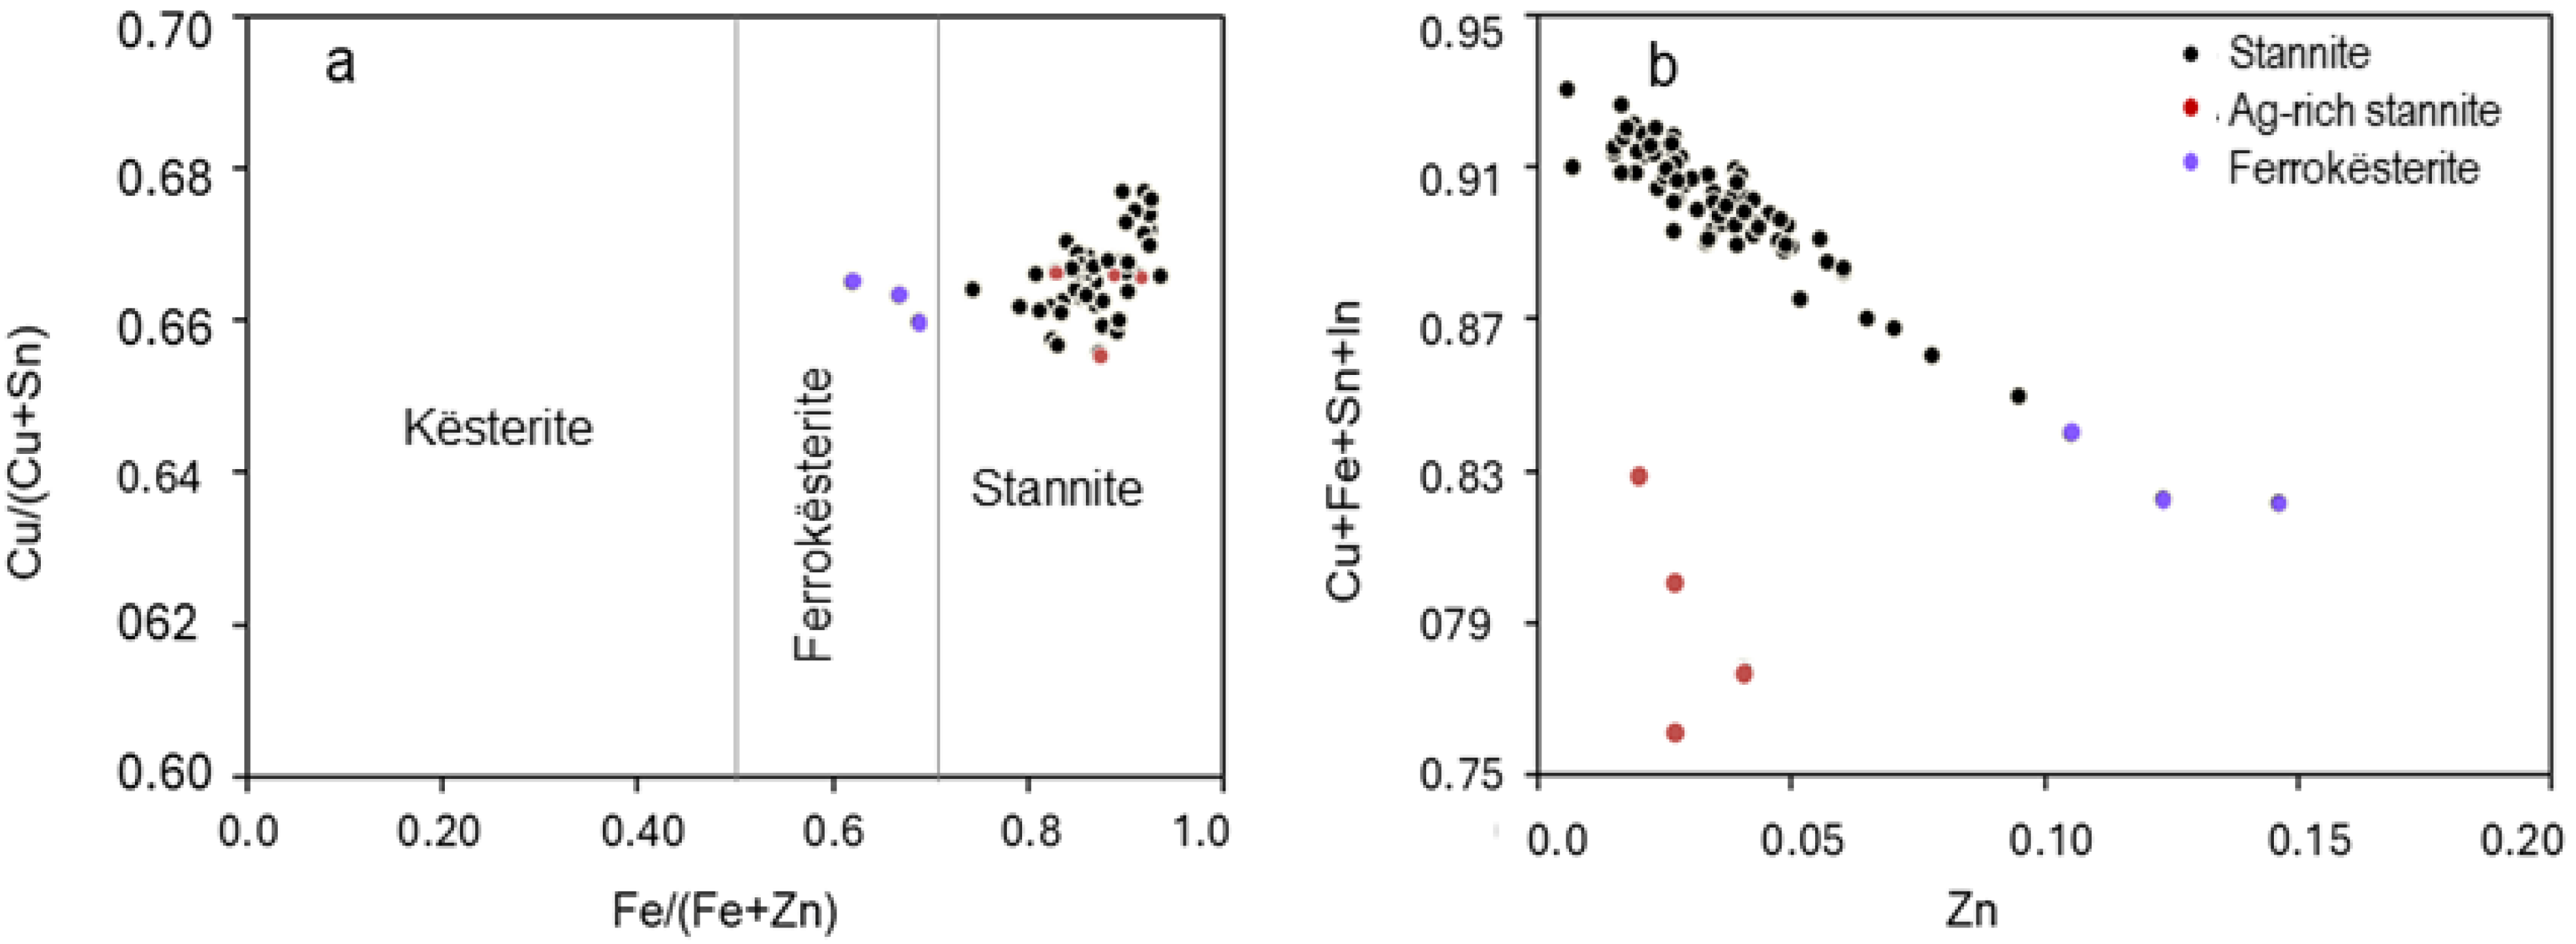
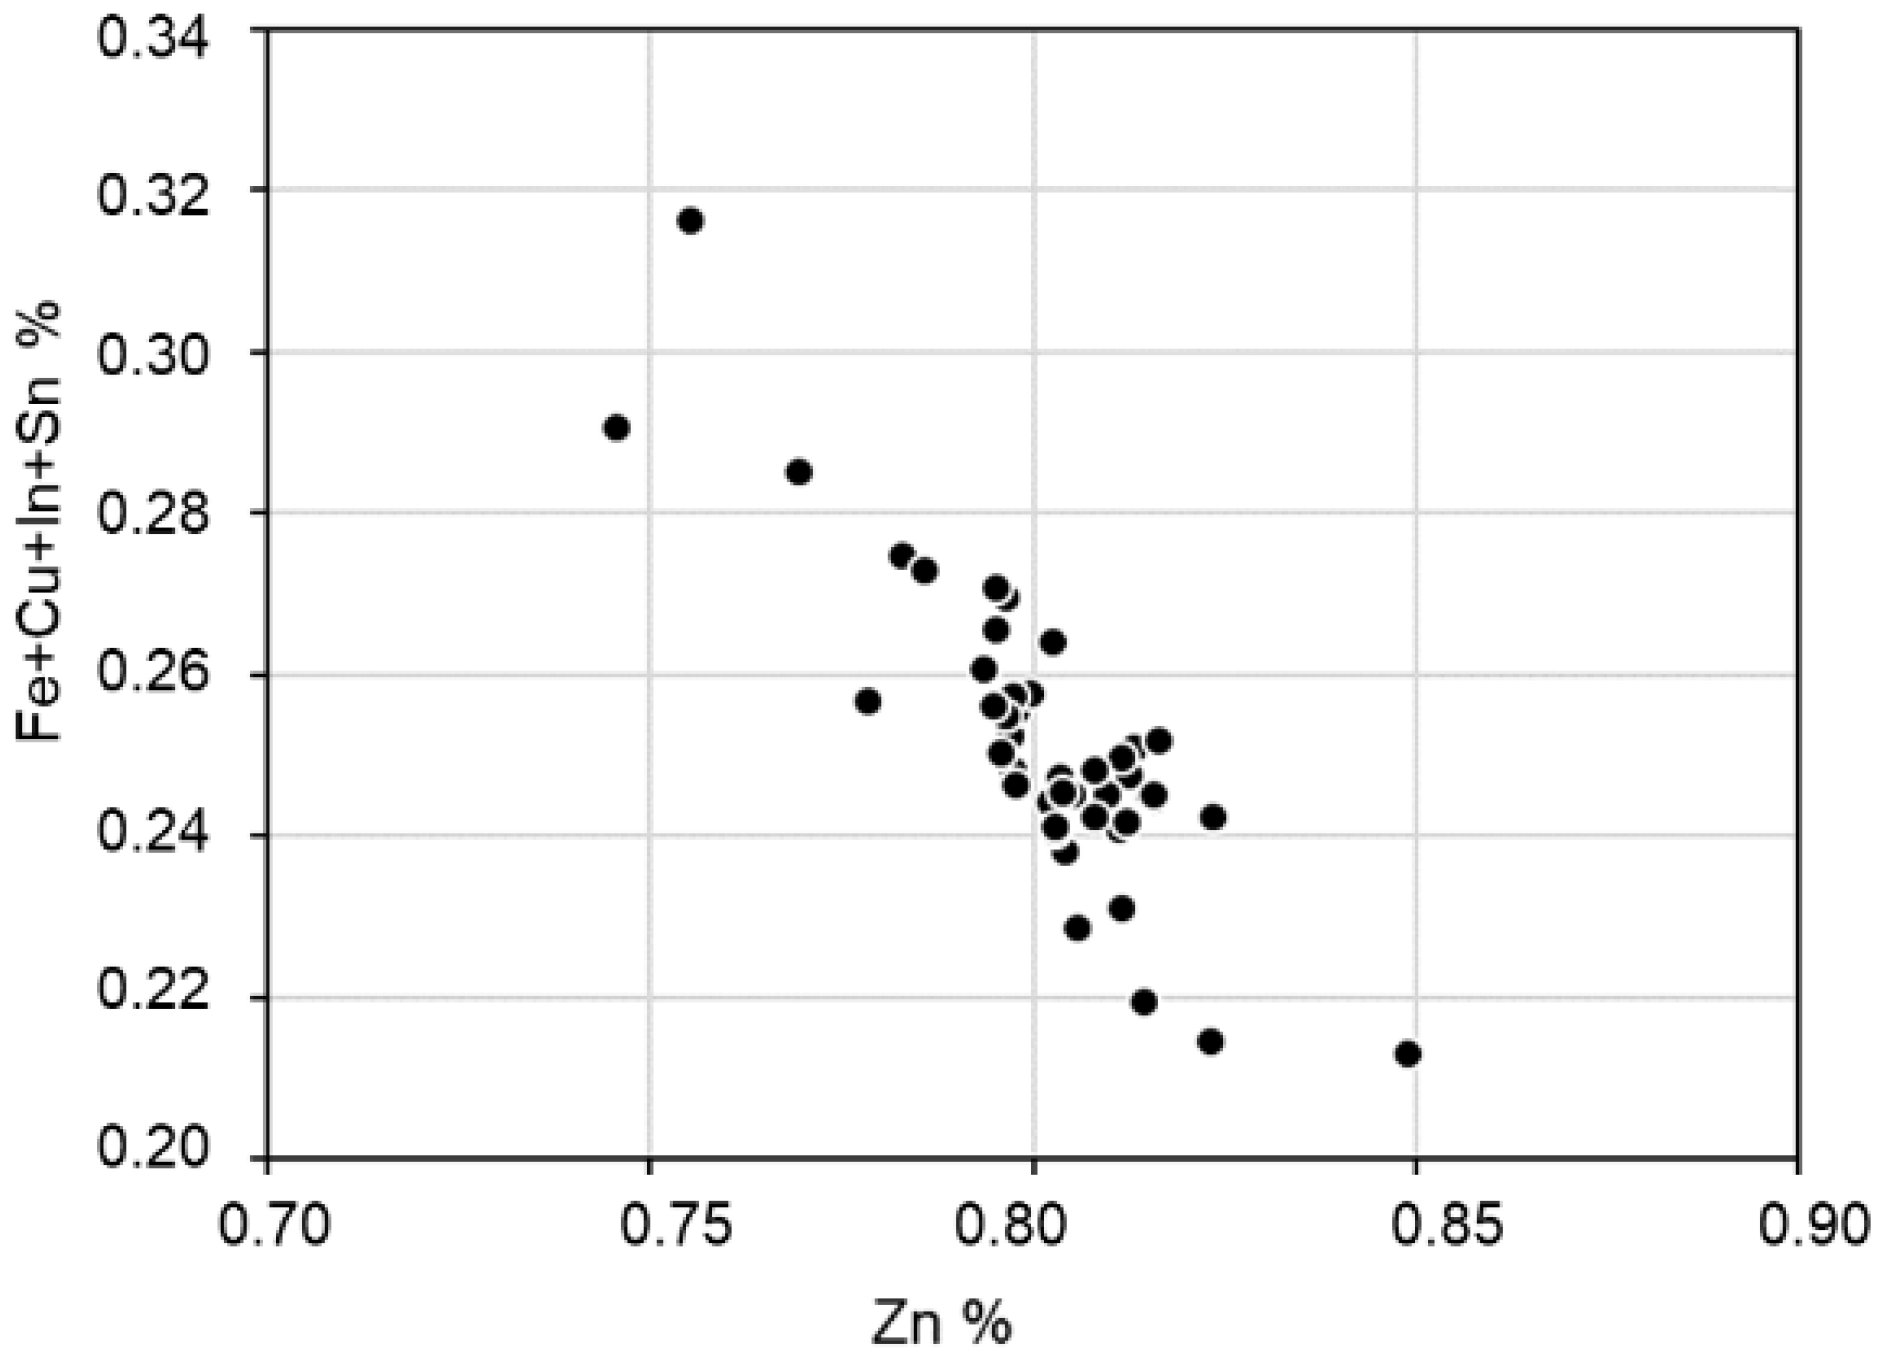
Sphalerite from Colquiri is characterized by high Fe contents, with values between 11 and 16 wt.% Fe, and an average of 11.36 wt.%. Cd content reaches up to 0.49 wt.%, Cu content ranges between 0.3 and 2.15 wt.%, and indium can reach up to 0.22 wt.%, with an average of 0.04 wt.%. There is a negative correlation between the Cu + Fe + In + Sn content and Zn content (Figure 8). This result is predictable due to the substitution in the structure of sphalerite according to the following reaction: Cu+ + In3+ + Sn4+ ↔ 3Zn2+ [43].
Stannite and kësterite form a solid solution with the following formula Cu2(Fe,Zn)SnS4, with stannite being the Fe-rich end-member and kësterite being the Zn-rich end-member [46]. In Colquiri, the chemical composition of stannite deviates slightly from the ideal structural formula, with Fe atoms being close to unity (average value of 1.05 atoms per unit formula, apfu); Cu has average values of 2.0 apfu, Sn 1.0 apfu, and Zn 0.17 apfu. According to the classification proposed by Watanabe et al. [47], most of these minerals belong to stannite, showing, in some cases, a composition corresponding to ferrokërsterite (Figure 9a).
In addition, stannite from Colquiri contains Ag, usually up to 1.3 wt.%. Some analyses yielded values of up to 10 wt.% The Ag-richest stannite presents a unit formula of Cu1.91Fe0.95Sn0.97Ag0.39. Previously, the highest Ag contents in stannite recorded came from the Ánimas deposit, located in the Central Andean tin belt, with 3.12 wt.% Ag [29], and from the Wallah Wallah Silver Mine, with 1.7 wt.% Ag [48]. Stannite from the Toshan deposit in India reaches up to 0.7 wt.% Ag [49].
There is a good correlation between Cu + Fe + Sn + In with Zn, except in the case of Ag-rich stannite (Figure 9b). This correlation has been considered to be the result of the existence of a solid solution between stannite and sphalerite [50]. The indium content is similar to that of sphalerite, up to 0.26 wt.%
Figure 9. Geochemical data of stannite-group minerals from Colquiri. (a) Cu/(Cu + Sn) vs. Fe/(Fe + Zn) shows compositional fields based on the Fe/(Fe + Zn) ratio according to intervals proposed by [47], after Petruk [51]. The gray lines separate the fields of kësterite, ferrokësterite, and stannite. (b) Correlation between Zn and Cu + Fe + Sn + In.
Minerals 15 01017 g009
Teallite (PbSnS2) constitutes a solid solution with herzenbergite (PbSnS2). The composition in Colquiri is Pb0.625Sn1.515In0.002Cu0.141Zn0.008S2, which is similar to the other Bolivian deposits [52].
EPMA reveals significant In concentrations in cassiterite, ranging from 0.00 to 0.28 wt.% In, with an average of 0.12 wt.% In (62 analyses).
The relatively high indium content provided via EPMA contrasts with the analyses of the bulk chemical composition of the cassiterite concentrate, which indicate that Nb and Ta contents are extremely low in this ore (Table 1). In addition, the chemical analyses of all the samples show a correlation between Zn and indium, but no significant relationship between In and Sn (Figure 7). Previous studies have also reported discrepancies in indium concentrations in cassiterite when comparing different analytical techniques. For instance, Cacho et al. [27] reported significantly lower indium values using EPMA compared to laser ablation in their analysis of the Huanuni deposit, which is also located in the Central Andean tin belt. Other studies have shown that In tends to concentrate preferentially in Zn-bearing minerals rather than in cassiterite [13,53,54], suggesting that In preferentially fractionates into Zn sulfide [13].
The indium contents in the upper continental crust, oceanic crust, chondrites, and seawater are approximately 0.056 ppm [55]. Granite-related Sn polymetallic deposits usually host high-grade indium reserves. About two-thirds of the world’s total refined indium comes from polymetallic Sn deposits related to granite in China [23,56]. The indium contents in the Colquiri deposit are moderate in comparison to other deposits of the Central Andean belt, as in the case of Huari Huari, where contents up to 3.49 wt.% in sphalerite were reported [57], reaching up to 15.86 wt.% [43]. Although Bolivia contains significant quantities of indium, it does not appear in production statistics. This may be due to different causes, but one of them is the lack of efficiency in its extraction.

4.5. Mineral Liberation

4.5.1. Particle and Grain Size Distribution

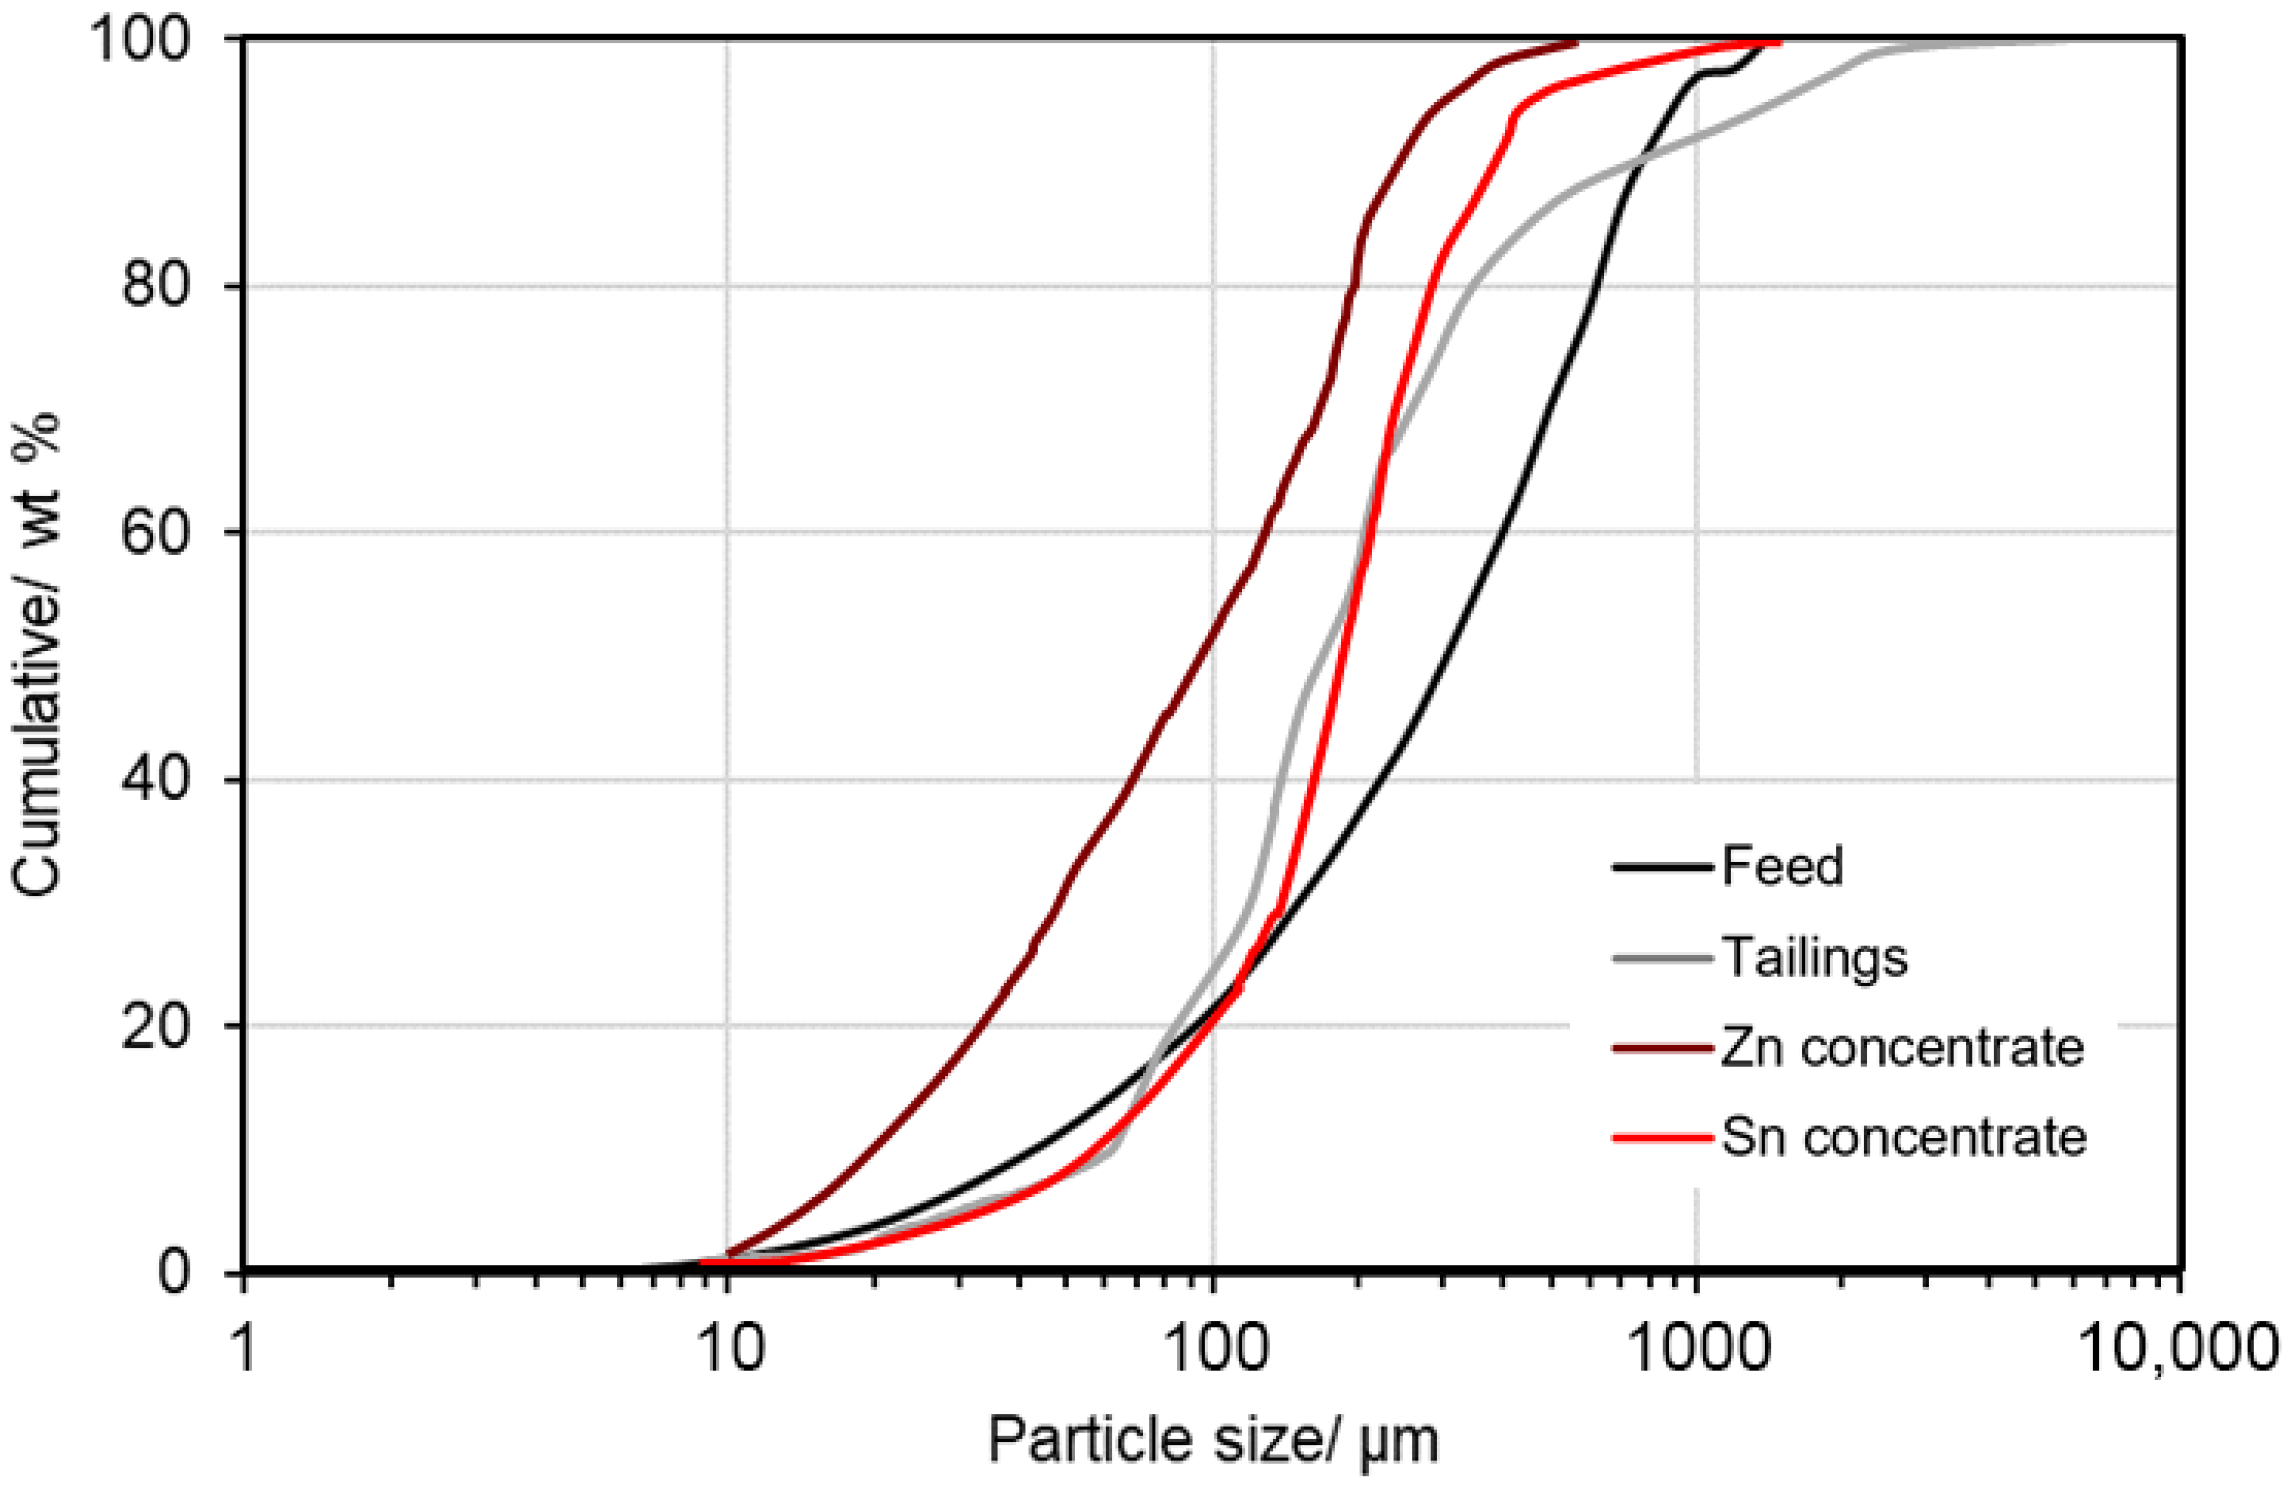
Particle size is a fundamental parameter for achieving both high ore recovery and high-grade materials. The particle sizes of the feed, concentrates, and tailings from the Colquiri plant are shown in Figure 10. The particle size of the feeding plant material, after the first grinding stage, reaches a P80 of 624 µm. The cassiterite concentrate has a P80 of 300 µm, while the sphalerite concentrate may be of this size or smaller, depending on the flow diagram trajectory from which it originates (see Figure 3), reaching a P80 of about 200 µm. The final tailings contain material provided from different stages of the plant’s flow diagram, resulting in a particle size with a P80 of 380 µm.
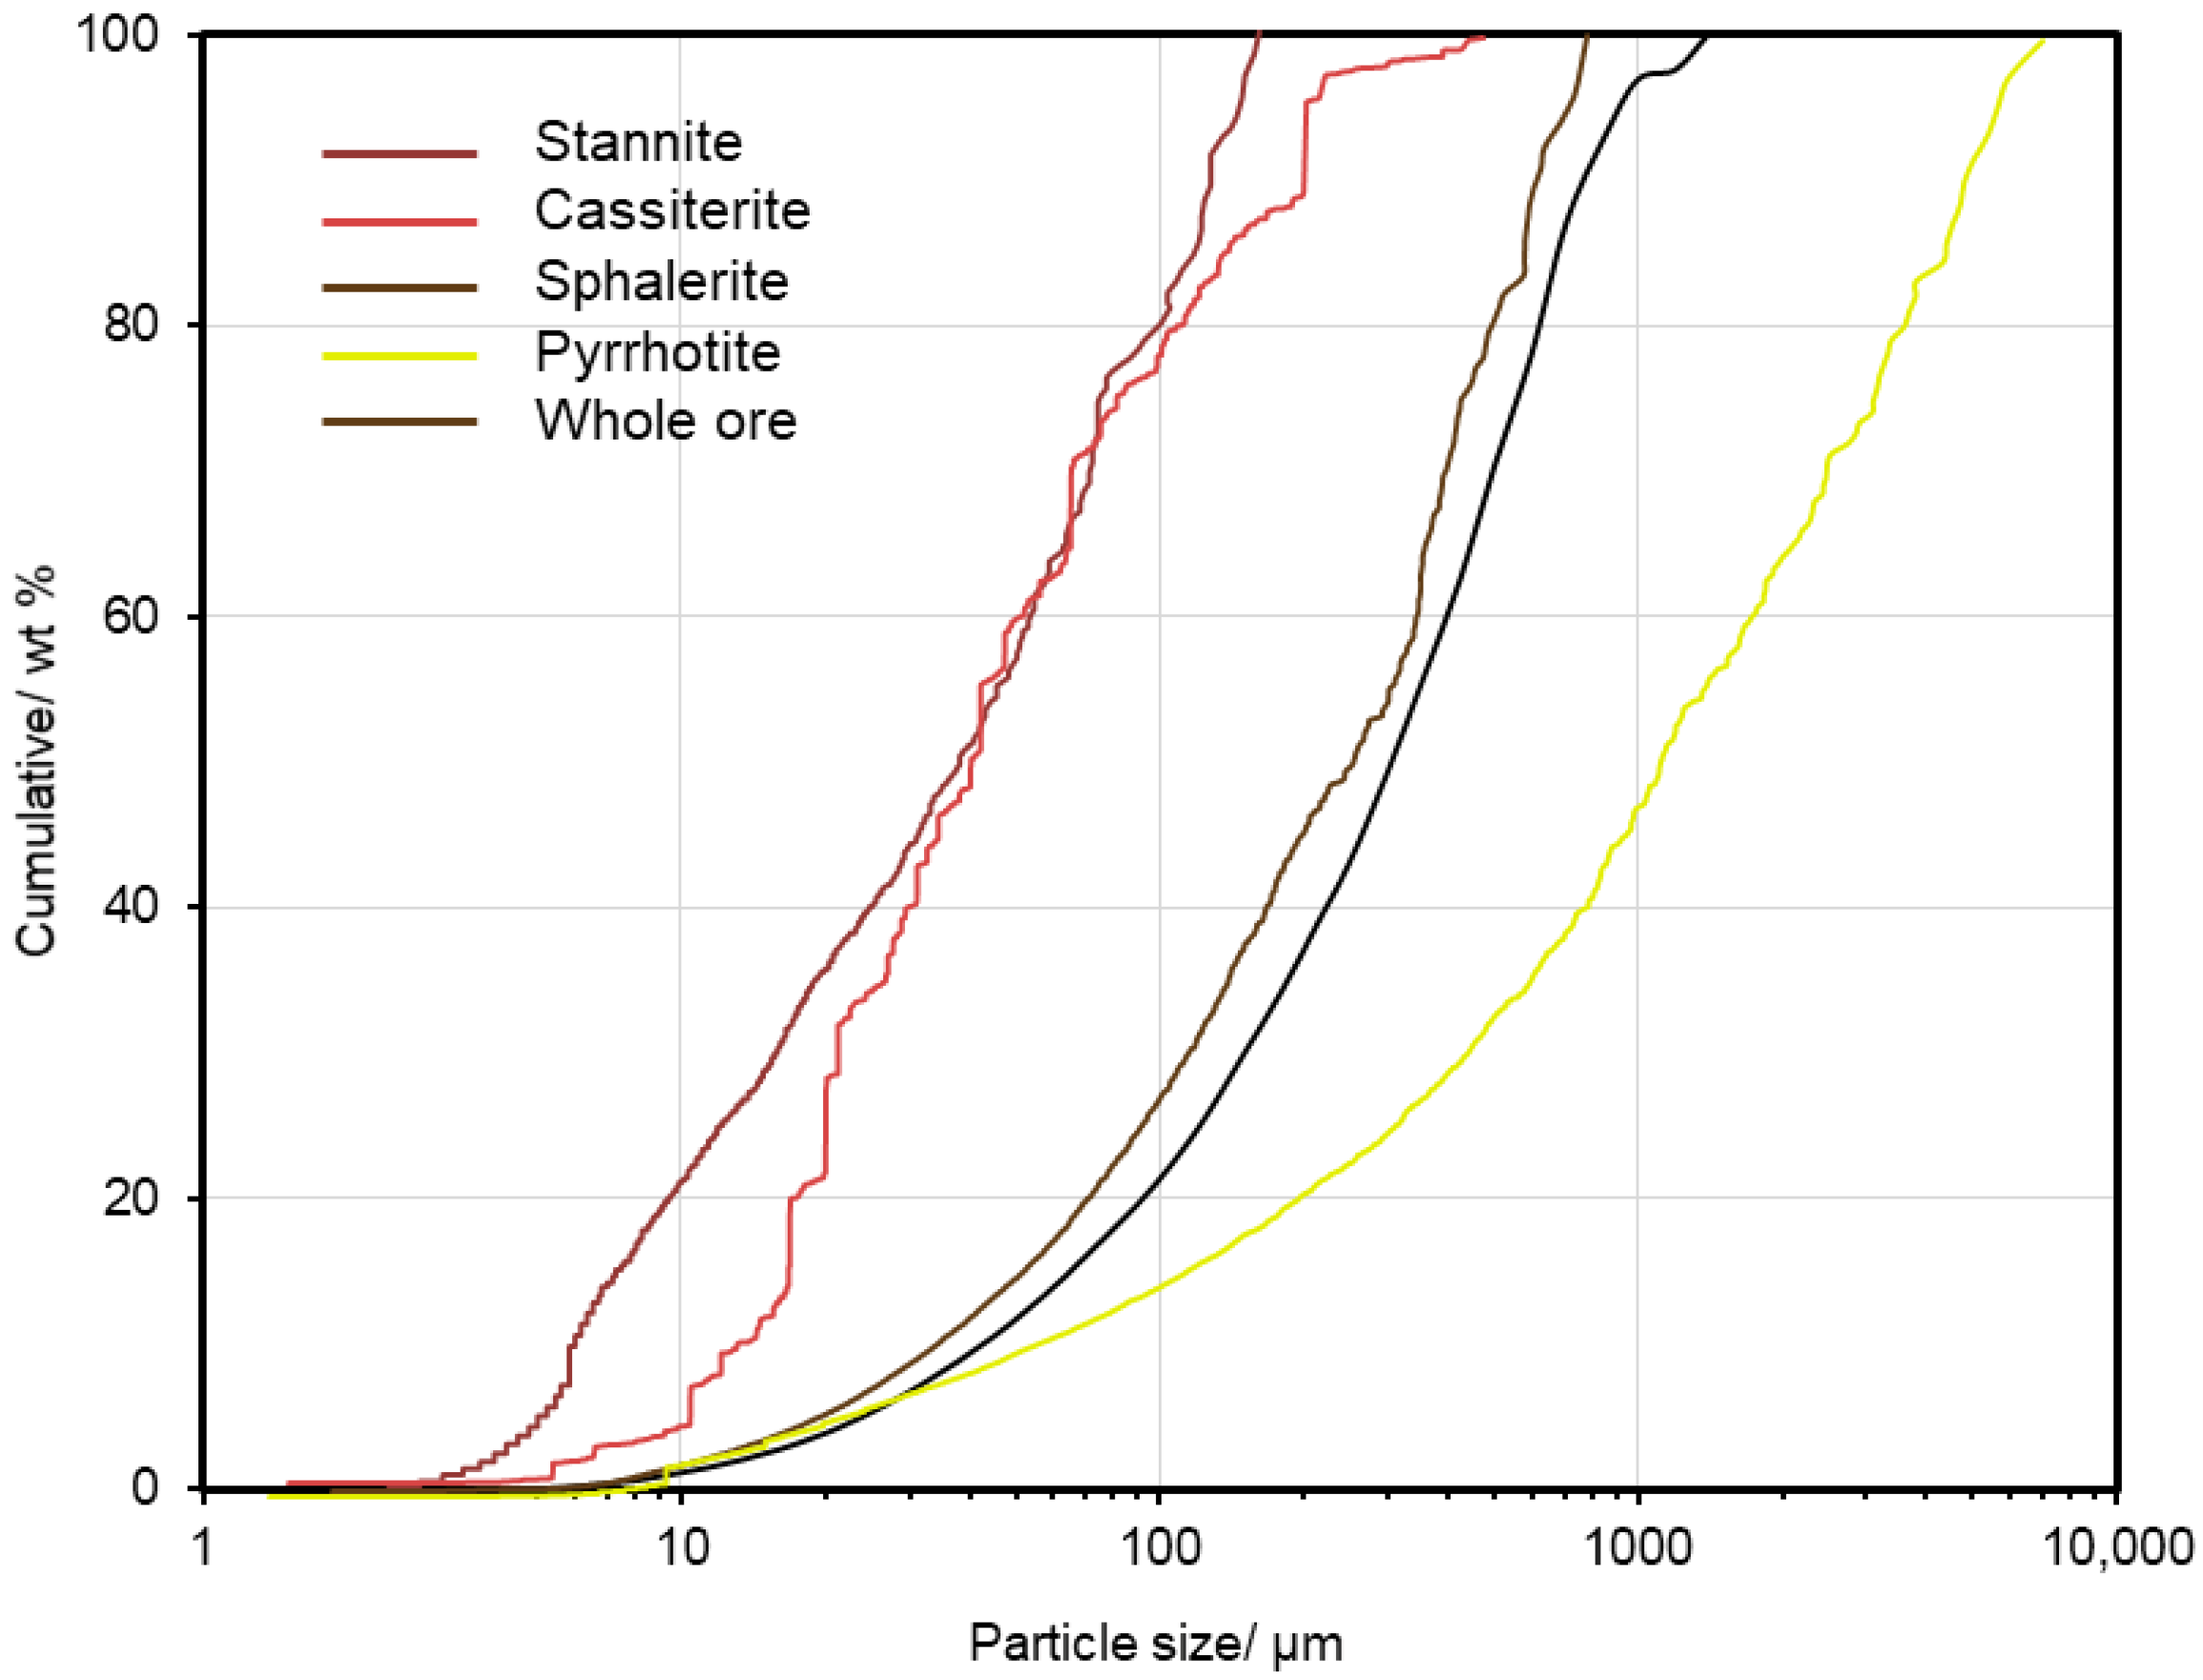
To evaluate whether the final grinding has achieved the appropriate sizes so that the ore can be properly separated at the processing plant, the grain size of each type of mineral must be examined. This information is provided via MLA/AMICS. Based on the MLA results, the grain size distribution of the ores—sphalerite, stannite, and cassiterite—has been determined. Pyrrhotite, which is the most abundant mineral, exhibits a grain size with a P80 of 502 µm (Figure 11). Sphalerite has a finer grain size than the particle size of the overall run-of-mine material, with a P80 of 460 µm, while stannite and cassiterite are significantly finer, with P80 values of 108 µm and 120 µm, respectively.

4.5.2. Mineral Association

The liberation and the association among minerals could be established using the MLA and AMICS. The total number of particles analyzed in the sample of the run-of-mine material was 70,944, and the number of grains was 190,795. Of these, there are 7724 grains of sphalerite, 2716 of stannite, and 1284 of cassiterite. The liberation characteristics and mineral association of the non-liberated particles of ores (locked in other minerals) from Colquiri are shown in Table 4.
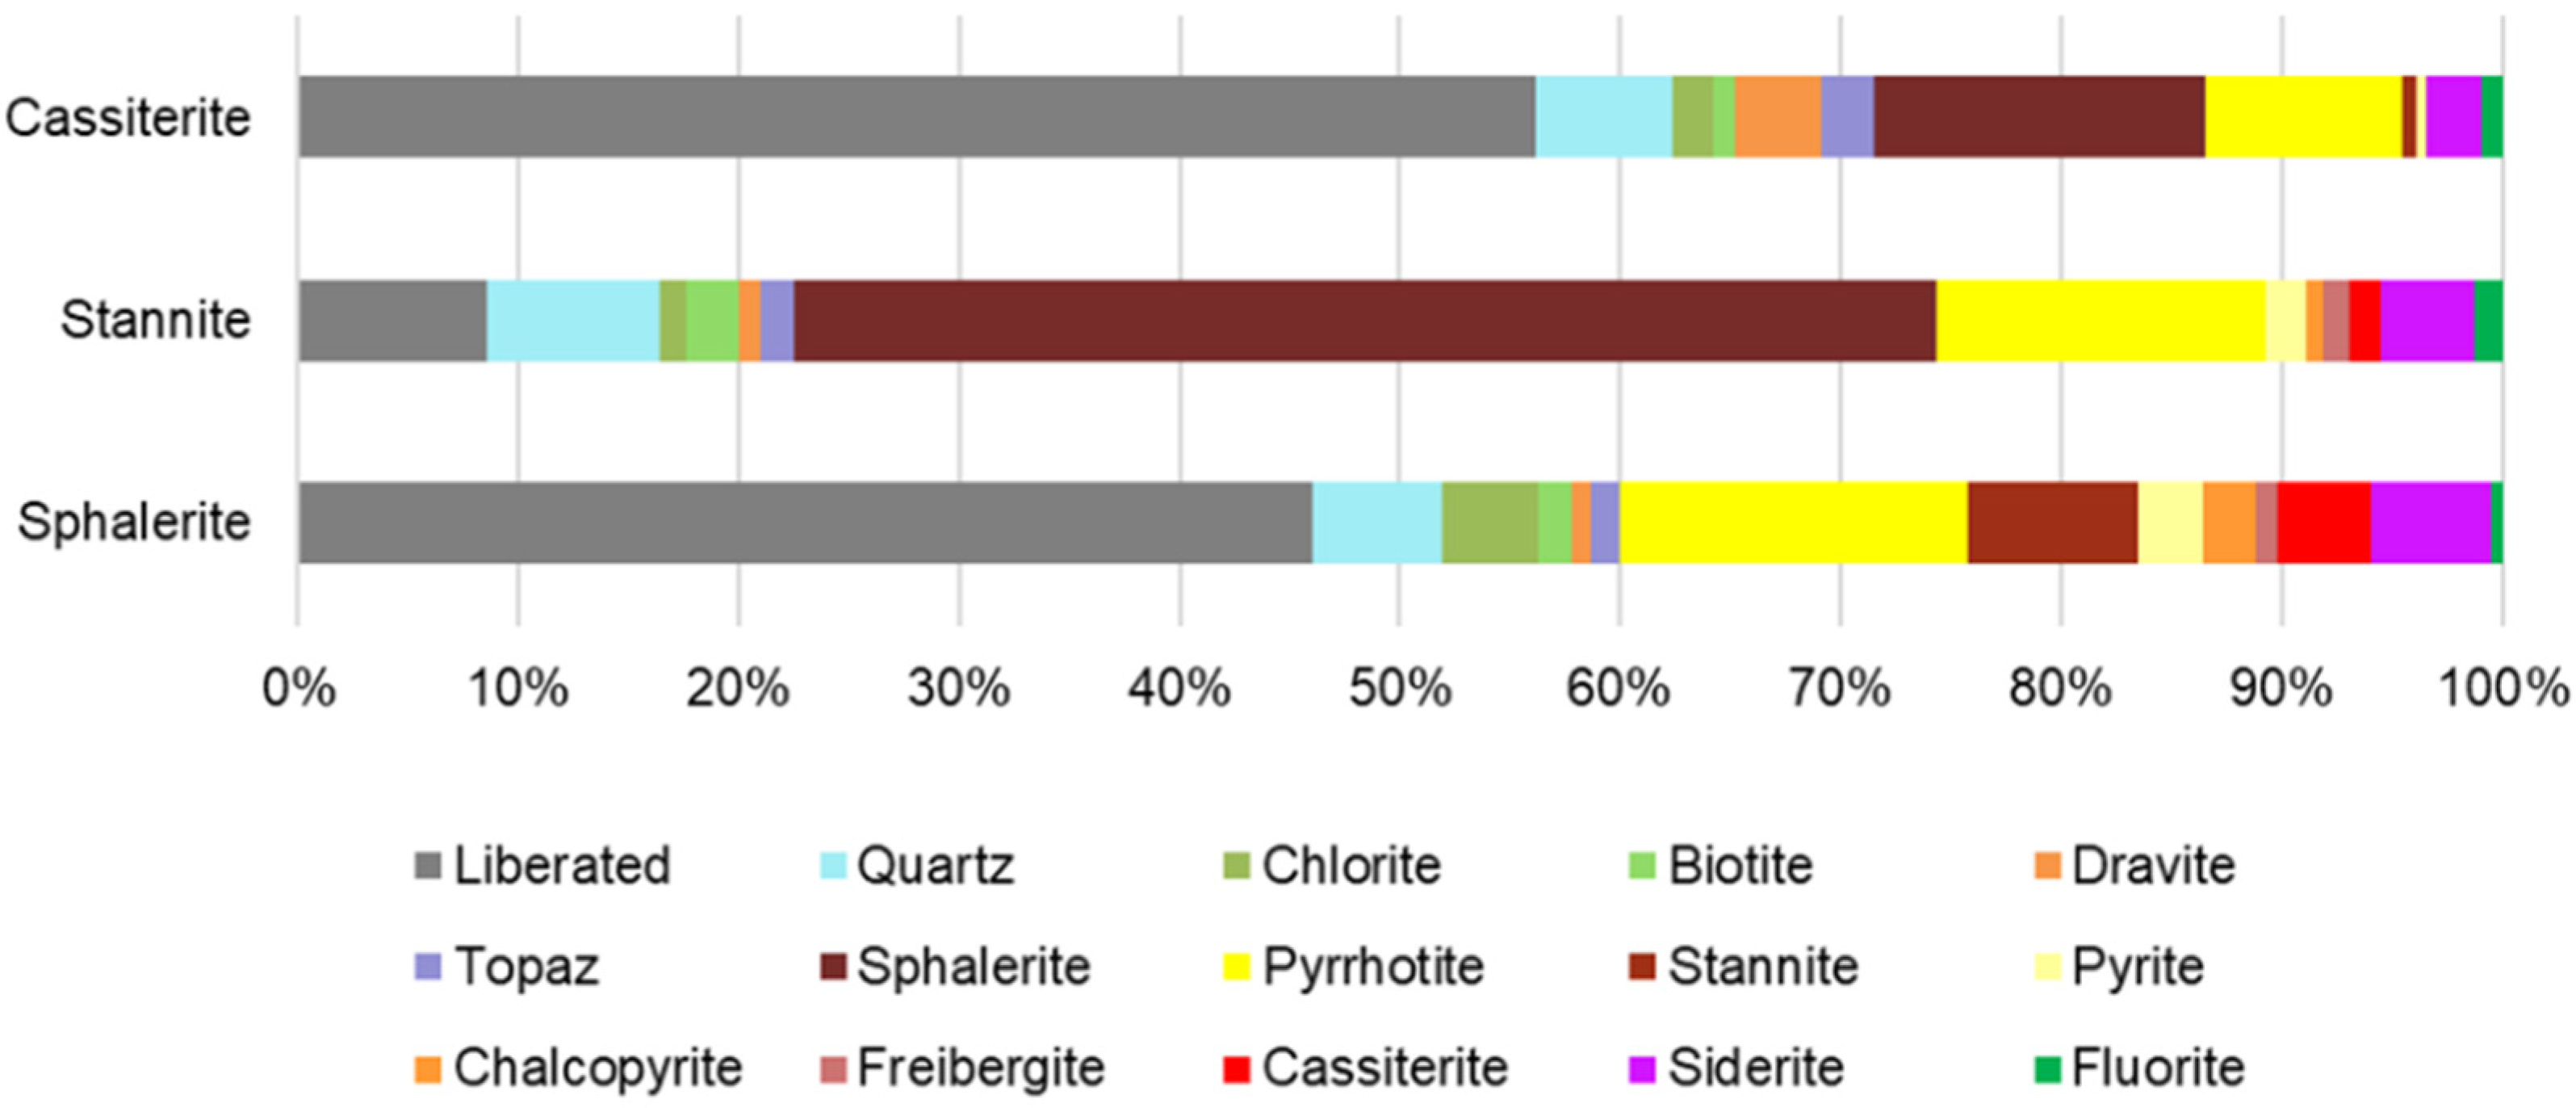
Although macroscopic observations reveal large masses that appear to be pure sphalerite, the MLA results reveal that only 45.38 wt.% of the mineral is actually liberated (Figure 12). Among the non-liberated portion, 3.63 wt.% is exclusively associated with stannite, and 7.66 wt.% occurs in ternary particles, indicating that these mineral associations persist through the separation process. A more critical issue is the 15.57 wt.% of sphalerite that is attached to pyrrhotite. This portion is largely lost during magnetic separation and ends up in the tailings. The remaining sphalerite is mainly associated with siderite (5.3 wt.%), cassiterite (4.25 wt.%), quartz (5.71 wt.%), and chlorite (4.37 wt.%). Currently, only about 65 wt.% of sphalerite is recovered, which corresponds to the liberated sphalerite and that solely associated with stannite.
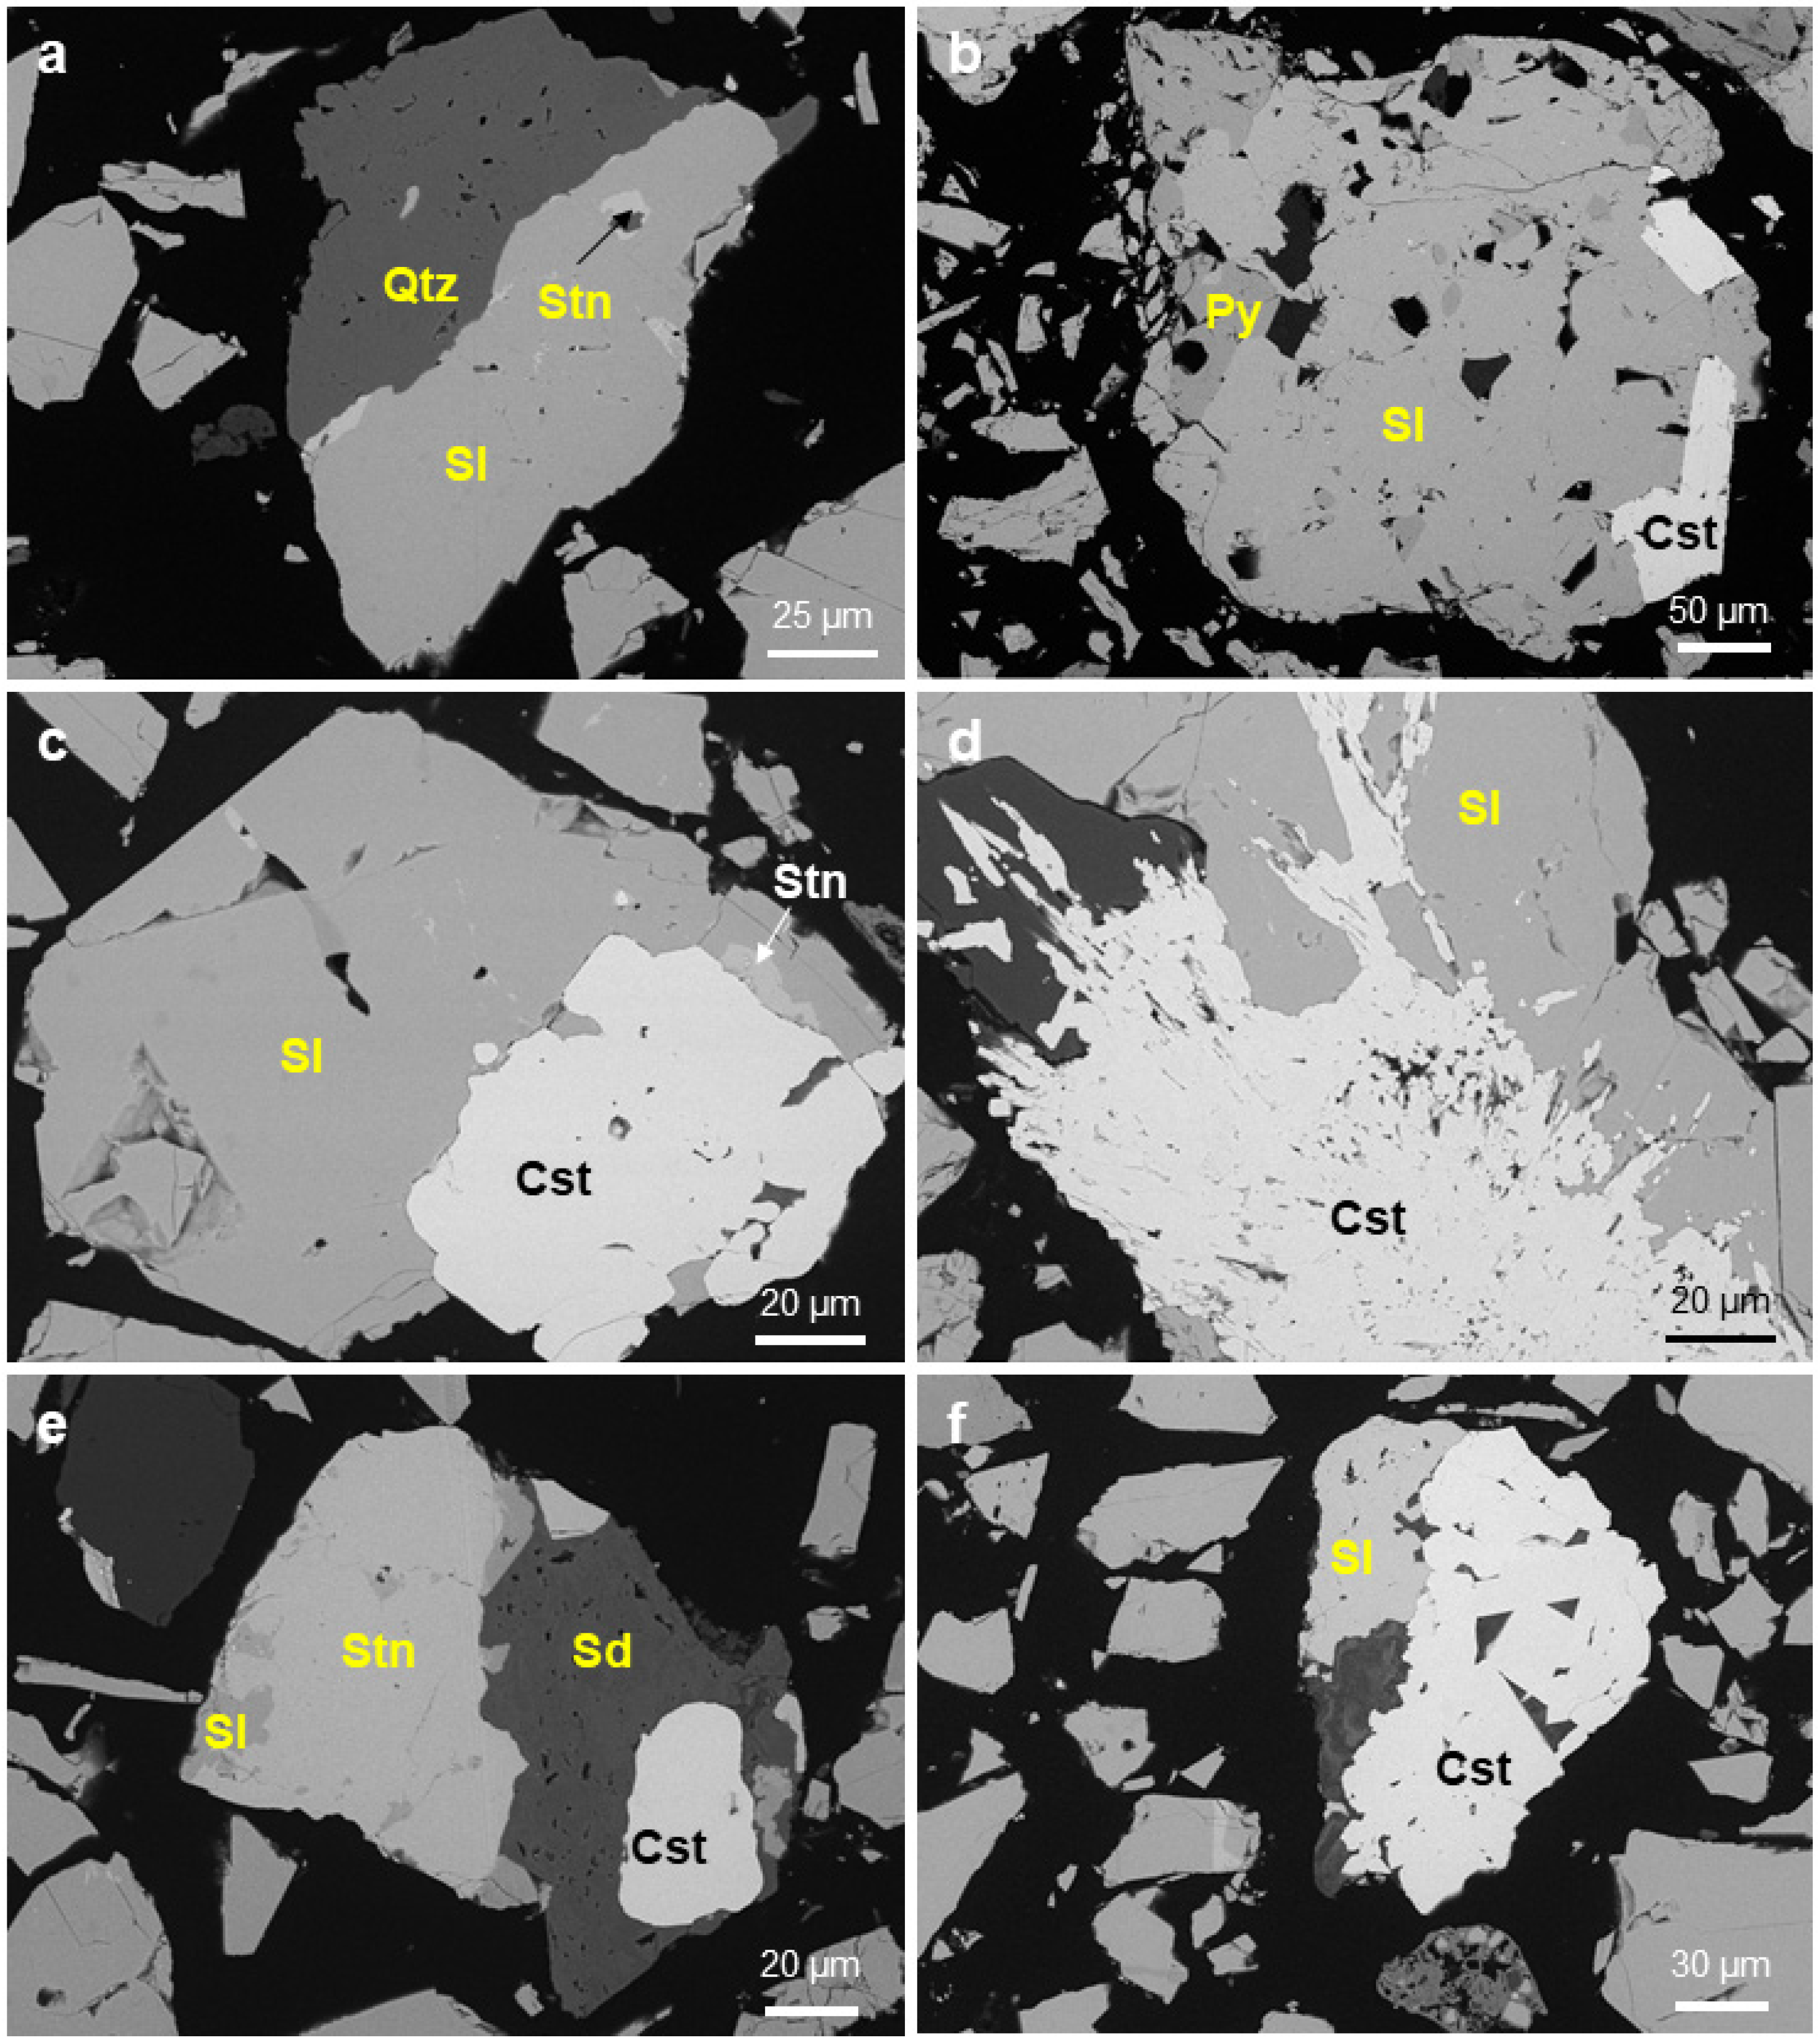
As expected, the MLA and AMICS confirm that stannite is poorly liberated, with only 8 wt.% being free, while the majority remains associated with sphalerite, 51.43 wt.%. As for cassiterite, 54.68 wt.% is liberated. Among the other, 8.72 wt.% is associated with pyrrhotite, 14.58 wt.% with sphalerite, and 6.04 wt.% with quartz. This mineral association leads to the presence of cassiterite-bearing particles in the Zn concentrate (Figure 13).
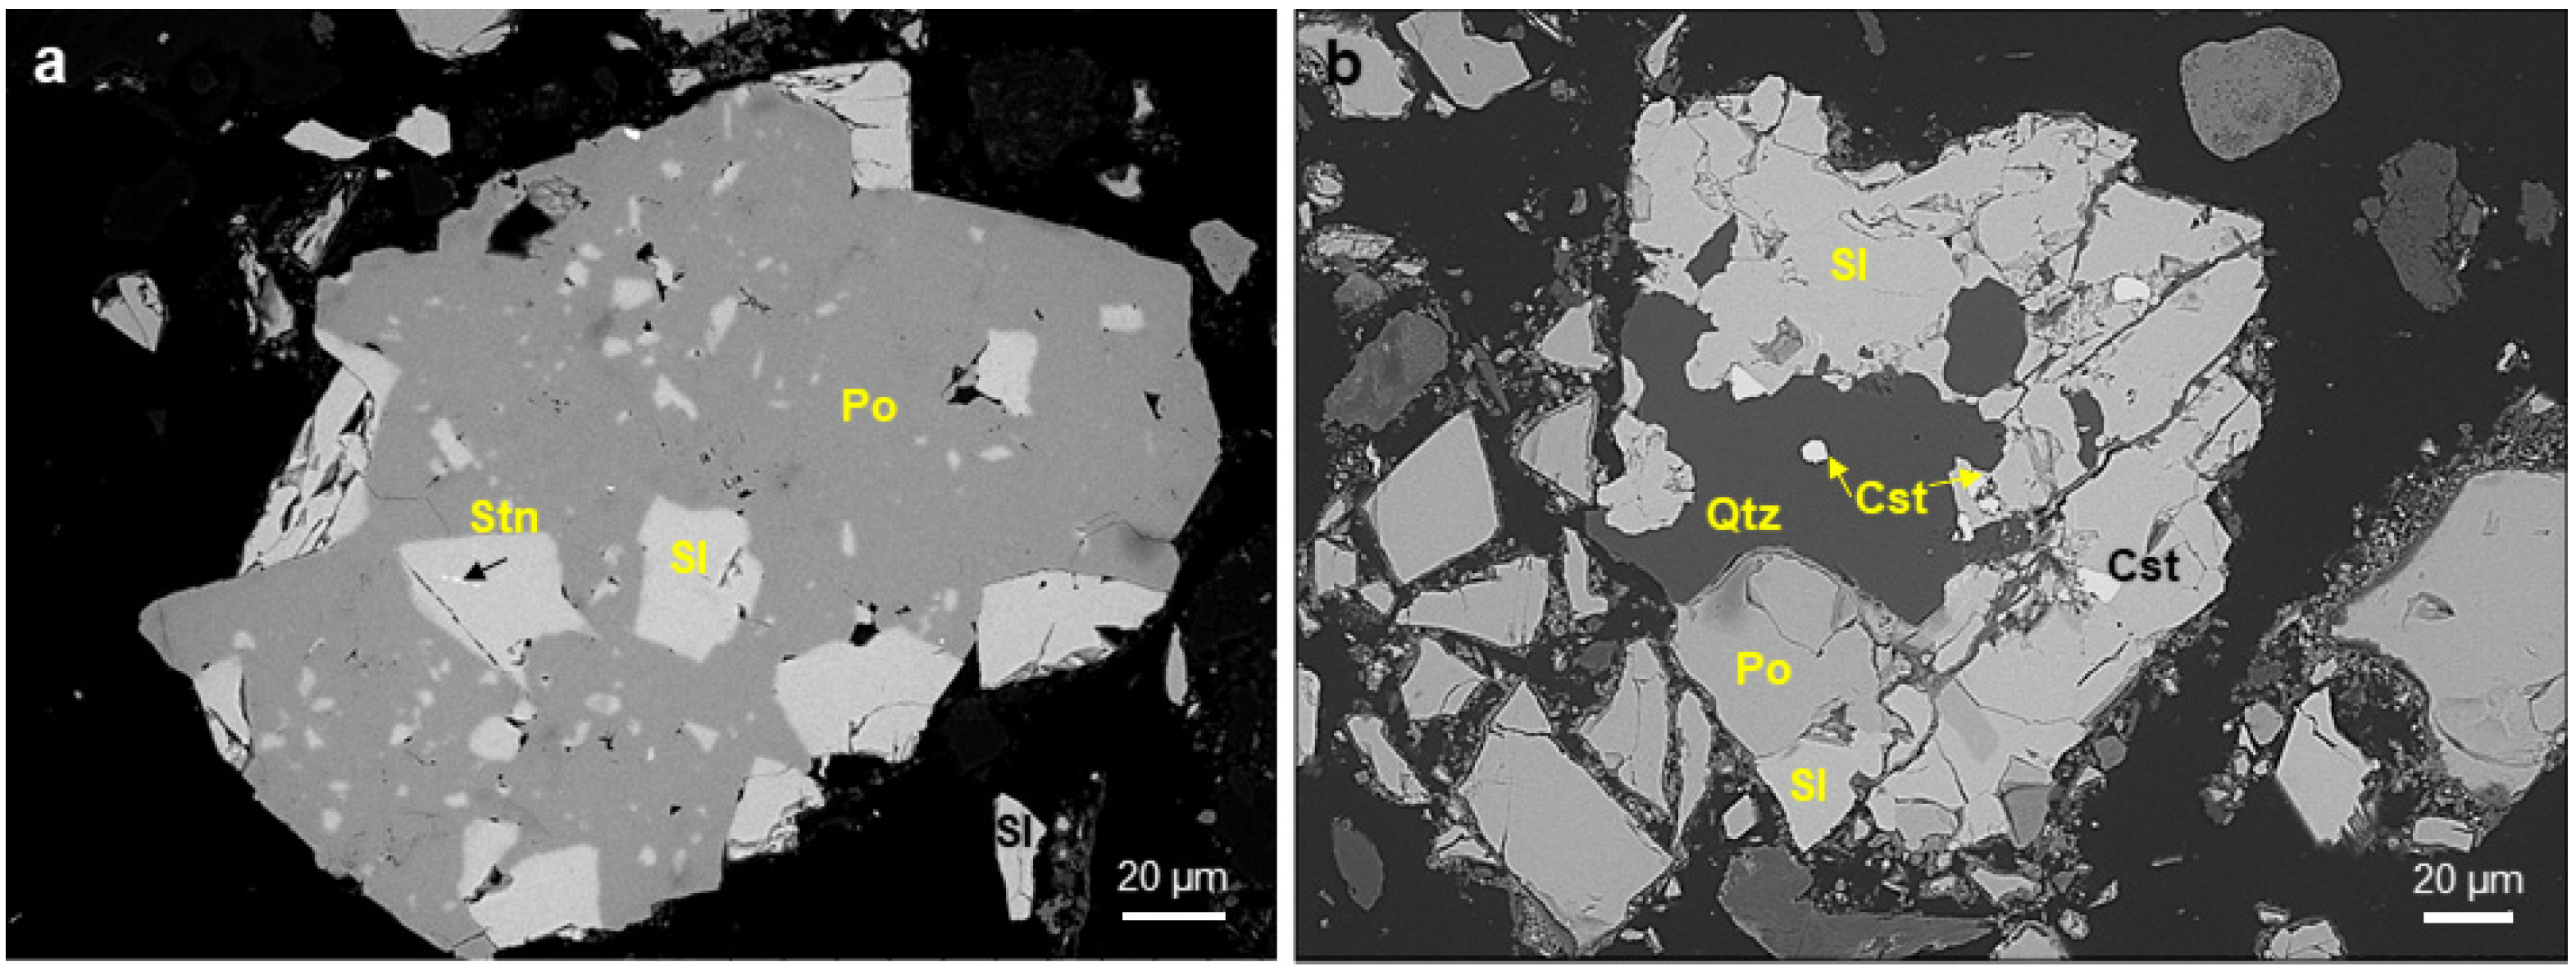
The mineral associations observed in the feed sample can also be found in the tailings. These contain abundant mixed particles with pyrrhotite that have been introduced during the magnetic separation process (Figure 14).
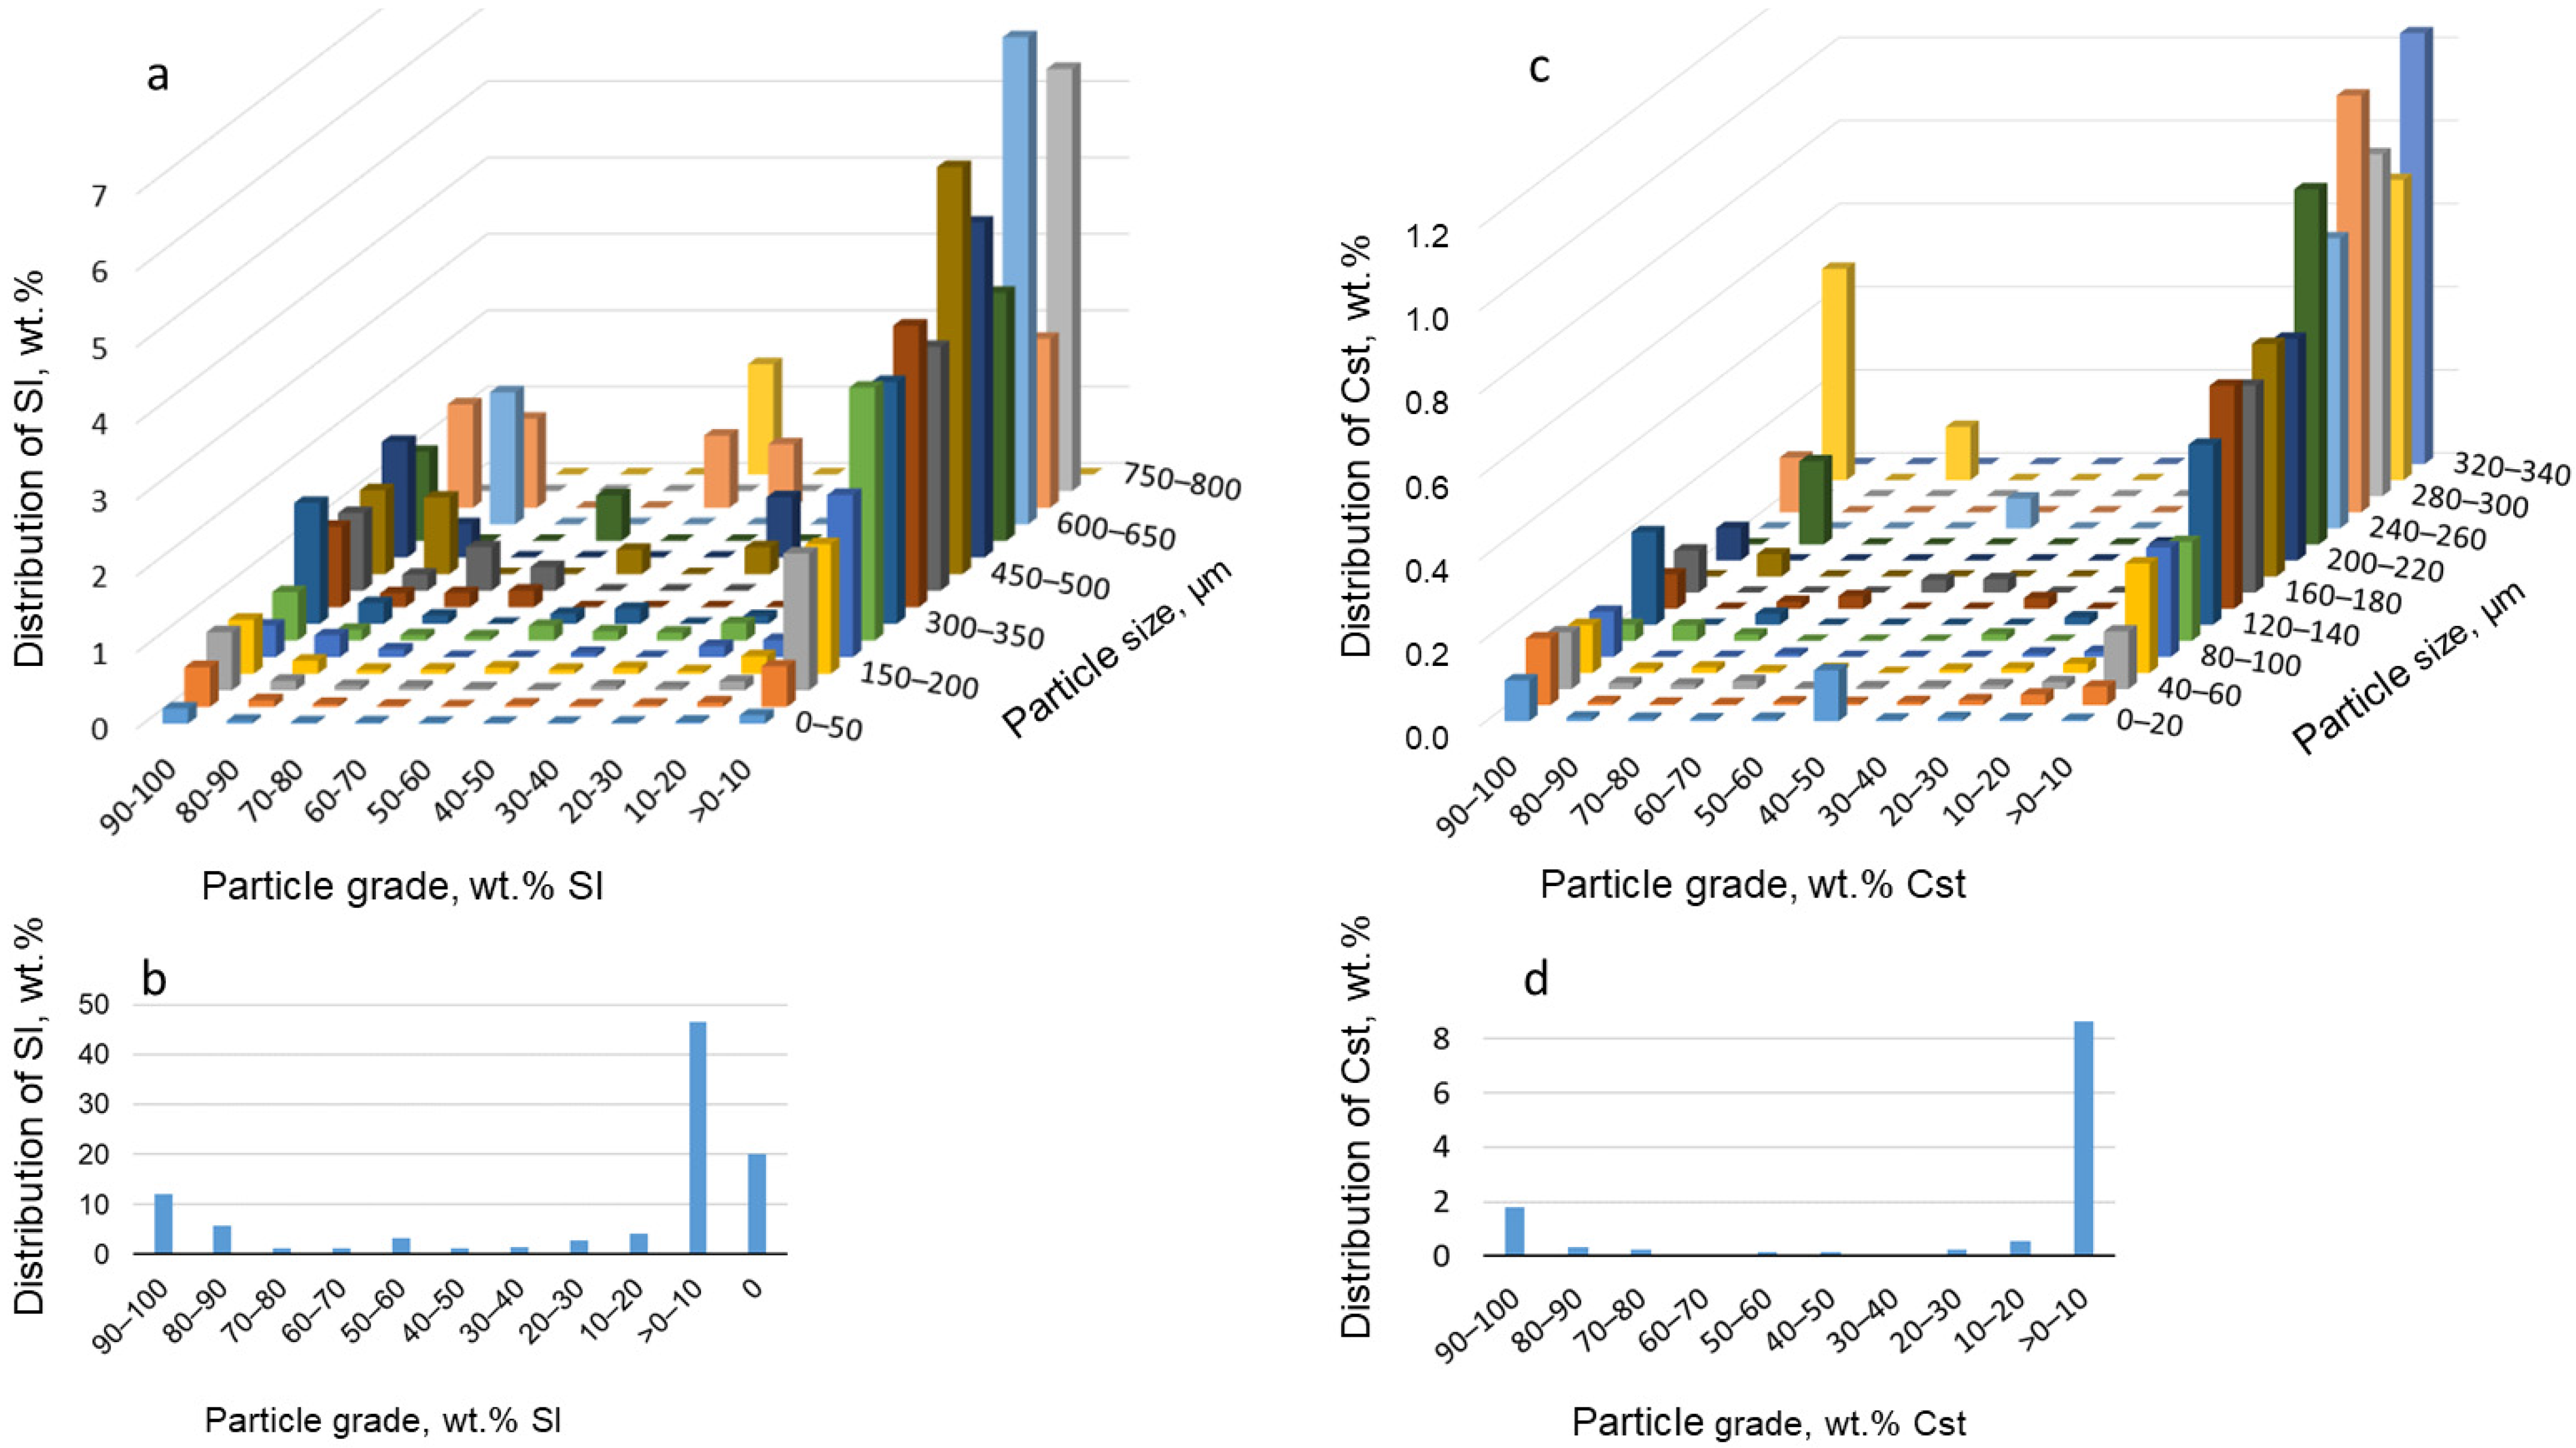
Using the MLA data, the differential mass of all samples was determined at different grade classes and size fractions. Although optimal results are obtained from analyses performed on samples classified by size, data obtained from samples not classified by size, as in this study, also provide quality information [58].
The calculation of the ore grade distribution by particle size and modeling of liberation is shown in Figure 15. According to these data, particles containing sphalerite account for 79.9% wt.%. Of these, 12 wt.% are liberated and 45 wt.% contain sphalerite with a grade lower than 10 wt.%.
In the case of cassiterite, 42.7 wt.% is in particles larger than 340 µm, most of which have grades below 20 wt.%. In Figure 15c,d, only particles larger than 340 µm are plotted. Of these, liberated cassiterite particles (grade >90 wt.%) account for just 1.8 wt.% of the entire material. Additionally, 30 wt.% of cassiterite is present in particles where it constitutes less than 10 wt.%. Similarly to sphalerite, lower-grade particles increase with size, with fewer low-grade particles found below 50 µm.

5. Discussion

The analysis of particle and grain sizes, as well as the association of minerals, provides the information necessary to analyze the causes of possible low recovery and reveal possibilities for improvement. For example, in the case of flotation, particle size plays a fundamental role in the success of separation [59]. This parameter is also fundamental in gravitational separation processes.
The fact that the feed particle size is still coarse when the separation processes begin, entering the magnetic separation at 624 µm, which is initially used to remove pyrrhotite, has direct consequences on the quality of the concentrates and tailings. In this case, in addition to particles composed entirely of pyrrhotite, a considerable number of mixed particles containing both pyrrhotite and non-magnetic minerals are also removed. As a result, significant amounts of sphalerite and cassiterite are lost during this process, as shown in their chemical composition, with high Zn and SnO2 contents.
The milling size of the material separated in the concentrates is also insufficient and too large. As can be seen from the mineral liberation study, these sizes are much larger than the liberation sizes obtained for Zn and Sn ores. This means that many of the particles subjected to the different separation processes are mixed, so that, depending on the proportion of their minerals, they end up in the concentrates or in the tailings. If they go to the concentrates, the minerals they contain that are not part of the ore would lower the grade of the concentrate. If they go to the tailings, the proportion of the ore mineral contained in the mixed particle would be lost.
Currently, only about 50 wt.% of cassiterite is recovered, which is an even lower amount than the ratio of liberated cassiterite. The grain size of cassiterite is much finer than the particle size in which it is found, which explains the high percentage of unrecovered ore. In contrast, the size of sphalerite is similar to that of the particles, explaining why the percentage of concentrated sphalerite is much higher than that of cassiterite. Difficulties in separating cassiterite using gravitational separation are common in processing plants, as it is difficult to recover when it is very small, and even with flotation, recovery does not usually exceed 80% [60].
Therefore, this study shows that the particle sizes prior to the separation processes should be considerably smaller in order to obtain concentrates with a high grade. When comparing particle grades to their size (Figure 15), it becomes evident that lower-grade particles tend to increase with size; these particles are relatively scarce below 100 µm.

6. Conclusions

The mineralogical and geochemical study of the Colquiri deposit confirms its complex, multistage hydrothermal evolution, which is consistent with other Sn polymetallic systems of the Central Andean tin belt. The mineralization is characterized by the predominance of sulfides, such as pyrrhotite, sphalerite, stannite, pyrite, marcasite, and cassiterite, as the main oxides. The paragenetic sequence reveals four distinct mineralization stages, from early precipitation of silicates and oxides to late sulfide replacements and alteration. Pyrrhotite is the main sulfide mineral and has been partly replaced by pyrite and marcasite, which are then replaced by siderite.
Sphalerite and cassiterite are the main ores. Sphalerite and stannite are associated and form interrelated textures. Indium is mainly present in sphalerite, reaching up to 0.22 wt.% In, and the whole-rock contents range from 150 to 172 ppm In.
The recovery rates of sphalerite and cassiterite in the processing plant are low, with concentrate grades of approximately 65 wt.% for sphalerite and 52 wt.% for cassiterite. Despite the high grade of the deposit, and the fact that sphalerite has a liberation size of around 460 µm, achieving high liberation of sphalerite requires milling to a particle size finer than 100 µm. In the case of cassiterite, which has a particle size with a P80 of only 108 µm, milling to a particle size below 50 µm would be necessary to achieve optimal liberation.

Author Contributions

Conceptualization, P.A. and M.R.; methodology, P.A.; software, M.G.-V. and P.A.; validation, M.G.-V. and M.T.; formal analysis, P.A., A.M., M.G.-V. and S.V.; investigation, P.A., M.T., M.R. and H.A.; resources, P.A., M.T. and S.V.; data curation, P.A. and M.T.; writing—original draft preparation, P.A.; writing—review and editing, P.A., M.T.Y., M.R., H.A. and M.T.; visualization, P.A.; supervision, P.A.; project administration and funding acquisition, P.A. All authors have read and agreed to the published version of the manuscript.

Funding

This research was funded by the Centre de Cooperació al Desenvolupament de la Universitat Politècnica de Cataluya, grant number 2023-B006, and by the Generalitat de Catalunya to the Consolidated Research Groups SGR 01041 (RIIS) and SGR 0026 (GEOXiS).

Data Availability Statement

The original contributions presented in this study are included in the article. Further inquiries can be directed to the corresponding author.

Acknowledgments

We acknowledge Minera Colquiri for providing access to the processing plant and helping with the sampling.

Conflicts of Interest

The authors declare no conflicts of interest.

References

  1. Henckens, T. Scarce mineral resources: Extraction, consumption and limits of sustainability. Resour. Conserv. Recycl. 2021, 169, 105511. [Google Scholar] [CrossRef]
  2. Lehmann, B. Formation of tin ore deposits: A reassessment. Lithos 2021, 402, 105756. [Google Scholar] [CrossRef]
  3. Aydın, E.B.; Sezgintürk, M.K. Indium tin oxide (ITO): A promising material in biosensing technology. TrAC Trends Anal. Chem. 2017, 97, 309–315. [Google Scholar] [CrossRef]
  4. Manca, P.P.; Massacci, G.; Pintus, D.; Sogos, G. The flotation of sphalerite mine tailings as a remediation method. Miner. Eng. 2021, 165, 106862. [Google Scholar] [CrossRef]
  5. Mejías, O.; Parbhakar-Fox, A.; Jackson, L.; Valenta, R.; Townley, B. Indium in ore deposits and mine waste environments: Geochemistry, mineralogy, and opportunities for recovery. J. Geochem. Explor. 2023, 255, 107312. [Google Scholar] [CrossRef]
  6. Martin, M.; Janneck, E.; Kermer, R.; Patzig, A.; Reichel, S. Recovery of indium from sphalerite ore and flotation tailings by bioleaching and subsequent precipitation processes. Miner. Eng. 2015, 75, 94–99. [Google Scholar] [CrossRef]
  7. Kinnunen, P.; Karhu, M.; Yli-Rantala, E.; Kivikytö-Reponen, P.; Mäkinen, J. A review of circular economy strategies for mine tailings. Clean. Eng. Technol. 2022, 8, 100499. [Google Scholar] [CrossRef]
  8. Wills, B.A.; Finch, J. Wills’ Mineral Processing Technology: An Introduction to the Practical Aspects of Ore Treatment and Mineral Recovery, 7th ed.; Butterworth-Heinemann: Oxford, UK, 2015; pp. 1–27. [Google Scholar]
  9. Lotter, N.O. Modern Process Mineralogy: An integrated multi-disciplined approach to flowsheeting. Miner. Eng. 2011, 24, 1229–1237. [Google Scholar] [CrossRef]
  10. Becker, M. The contribution of applied mineralogy to sustainability in the mine life cycle. Miner. Eng. 2023, 199, 108121. [Google Scholar] [CrossRef]
  11. García, S.; Camus, L.; Gonzalez-Diaz, E.; Collao, R.; Townley, B.; Parviainen, A.; Caraballo, M.A. The importance of geochemical and mineralogical characterization of fresh Cu-Porphyry mine tailings in mineral processing plants to optimize their revalorization potential. J. Geochem. Explor. 2024, 259, 107439. [Google Scholar] [CrossRef]
  12. Alfonso, P.; Ruiz, M.; Zambrana, R.N.; Sendrós, M.; Garcia-Valles, M.; Anticoi, H.; Sidki-Rius, N.; Salas, A. Process mineralogy of the tailings from Llallagua: Towards a sustainable activity. Minerals 2022, 12, 214. [Google Scholar] [CrossRef]
  13. Cook, N.J.; Ciobanu, C.L.; Williams, T. The mineralogy and mineral chemistry of indium in sulphide deposits and implications for mineral processing. Hydrometallurgy 2011, 108, 226–228. [Google Scholar] [CrossRef]
  14. Schulz, B.; Sandmann, D.; Gilbricht, S. SEM-based automated mineralogy and its application in geo-and material sciences. Minerals 2020, 10, 1004. [Google Scholar] [CrossRef]
  15. Blannin, R.; Frenzel, M.; Tuşa, L.; Birtel, S.; Ivăşcanu, P.; Baker, T.; Gutzmer, J. Uncertainties in quantitative mineralogical studies using scanning electron microscope-based image analysis. Miner. Eng. 2021, 167, 106836. [Google Scholar] [CrossRef]
  16. Lastra, R.; Paktunc, D. An estimation of the variability in automated quantitative mineralogy measurements through inter-laboratory testing. Miner. Eng. 2016, 95, 138–145. [Google Scholar] [CrossRef]
  17. Ueda, T.; Oki, T.; Koyanaka, S. Experimental analysis of mineral liberation and stereological bias based on X-ray computed tomography and artificial binary particles. Adv. Powder Technol. 2018, 29, 462–470. [Google Scholar] [CrossRef]
  18. Spencer, S.; Sutherland, D. Stereological correction of mineral liberation grade distributions estimated by single sectioning of particles. Image Anal. Stereol. 2000, 19, 175–182. [Google Scholar] [CrossRef]
  19. Lotter, N.O.; Whiteman, E.; Hoffman, M.C.; Nkuna, V.; Amos, S.R.; Groenewald, A. Flowsheet development for and commissioning of the Kamoa-Kakula project. Miner. Eng. 2024, 210, 108671. [Google Scholar] [CrossRef]
  20. Holwell, D.A.; Adeyemi, Z.; Ward, L.A.; Smith, D.J.; Graham, S.D.; McDonald, I.; Smith, J.W. Low temperature alteration of magmatic Ni-Cu-PGE sulfides as a source for hydrothermal Ni and PGE ores: A quantitative approach using automated mineralogy. Ore Geol. Rev. 2017, 91, 718–740. [Google Scholar] [CrossRef]
  21. Shan, P.; Cao, M.; Evans, N.J.; Gao, H.; Mao, Y.; Gao, Y.; Salazar, L.; Zhao, Y.; Qin, K. Automated quantitative mineralogy analysis reveals characteristics of Co occurrence in the Jinchang porphyry deposit, NE China. Ore Geol. Rev. 2023, 158, 105524. [Google Scholar] [CrossRef]
  22. Kern, M.; Kästner, J.; Tolosana-Delgado, R.; Jeske, T.; Gutzmer, J. The inherent link between ore formation and geometallurgy as documented by complex tin mineralization at the Hämmerlein deposit (Erzgebirge, Germany). Miner. Depos. 2019, 54, 683–698. [Google Scholar] [CrossRef]
  23. USGS (United States Geological Survey), 2024. Mineral Commodity Summaries 2024. Available online: https://pubs.usgs.gov/periodicals/mcs2024/mcs2024-indium.pdf (accessed on 20 April 2025).
  24. Lehmann, B.; Ishihara, S.; Michel, H.; Miller, J.; Rapela, C.W.; Sanchez, A.; Tistl, M.; Winkelmann, L. The Bolivian tin province and regional tin distribution in the Central Andes; a reassessment. Econ. Geol. 1990, 85, 1044–1058. [Google Scholar] [CrossRef]
  25. Jiménez-Franco, A.; Alfonso, P.; Canet, C.; Trujillo, J.E. Mineral chemistry of In-bearing minerals in the Santa Fe mining district, Bolivia. Andean Geol. 2018, 45, 410–432. [Google Scholar] [CrossRef]
  26. Ishihara, S.; Murakami, H.; Marquez-Zavalia, M.F. Inferred indium resources of the Bolivian tin-polymetallic deposits. Resour. Geol. 2011, 61, 174–191. [Google Scholar] [CrossRef]
  27. Cacho, A.; Melgarejo, J.C.; Camprubí, A.; Torró, L.; Castillo-Oliver, M.; Torres, B.; Artiaga, D.; Tauler, E.; Martinez, A.; Campeny, M.; et al. Mineralogy and distribution of critical elements in the Sn–W–Pb–Ag–Zn Huanuni deposit, Bolivia. Minerals 2019, 9, 753. [Google Scholar] [CrossRef]
  28. Torres, B.; Melgarejo, J.C.; Torró, L.; Camprubí, A.; Castillo-Oliver, M.; Artiaga, D.; Campeny, M.; Tauler, E.; Jiménez-Franco, A.; Alfonso, P.; et al. The Poopó polymetallic epithermal deposit, Bolivia: Mineralogy, genetic constraints, and distribution of critical elements. Minerals 2019, 9, 472. [Google Scholar] [CrossRef]
  29. Torró, L.; Cazorla, M.; Melgarejo, J.C.; Camprubí, A.; Tarrés, M.; Gemmrich, L.; Campeny, M.; Artiaga, D.; Torres, B.; Martínez, A.; et al. Indium mineralization in the volcanic dome-hosted Ánimas–Chocaya–Siete Suyos polymetallic deposit, Potosí, Bolivia. Minerals 2019, 9, 604. [Google Scholar] [CrossRef]
  30. Ahlfeld, F. Supergene cassiterite in tin veins; discussion. Econ. Geol. 1930, 25, 546–548. [Google Scholar] [CrossRef]
  31. Campbell, D.F. Geology of the Colquiri tin mine, Bolivia. Econ. Geol. 1947, 42, 1–21. [Google Scholar] [CrossRef]
  32. Kelly, W.C.; Turneaure, F.S. Mineralogy, paragenesis and geothermometry of the tin and tungsten deposits of the eastern Andes, Bolivia. Econ. Geol. 1970, 65, 609–680. [Google Scholar] [CrossRef]
  33. Sugaki, A.; Ueno, H.; Kitakaze, A.; Hayashi, K.; Shimada, N.; Kusachi, I. Geological study on the ore deposits in the La Paz district, Bolivia. ci. Rept. Tohoku Univ. Ser. III 1985, 16, 131–198. [Google Scholar]
  34. Hanus, D. The Colquiri tin deposit: A contribution to its genesis. In Ore Genesis: The State of the Art; Springer: Berlin/Heidelberg, Germany, 1982; pp. 308–318. [Google Scholar]
  35. Clark, A.H.; Palma, V.V.; Archibald, D.A.; Farrar, E.; Arenas, F.M.J.; Robertson, R.C. Occurrence and age of tin mineralization in the Cordillera Oriental, southern Peru. Econ. Geol. 1983, 78, 514–520. [Google Scholar] [CrossRef]
  36. Mlynarczyk, M.S.; Williams-Jones, A.E. The role of collisional tectonics in the metallogeny of the Central Andean tin belt. Earth Planet. Sci. Lett. 2005, 240, 656–667. [Google Scholar] [CrossRef]
  37. Arce-Burgoa, O.R.; Goldfarb, R.J. Metallogeny of Bolivia. SEG Newsl. 2009, 79, 1–15. [Google Scholar] [CrossRef]
  38. Avila-Salinas, W.A. Tin-bearing granites from the Cordillera Real, Bolivia; a petrological and geochemical review. In Plutonism from Antarctica to Alaska; Special Paper 241; GeoScienceWorld: McLean, VA, USA, 1990. [Google Scholar]
  39. Schneider, H.J.; Lehmann, B. Contribution to a new genetical concept on the Bolivian tin province. In Time-and Strata-Bound Ore Deposits; Springer: Berlin/Heidelberg, Germany, 1977; pp. 153–168. [Google Scholar]
  40. Jiao, Y.; Qiu, K.H.; Zhang, P.C.; Li, J.F.; Zhang, W.T.; Chen, X.F. Process mineralogy of Dalucao rare earth ore and design of beneficiation process based on AMICS. Rare Met. 2020, 39, 959–966. [Google Scholar] [CrossRef]
  41. Sugaki, A.; Kitakaze, A. Tin-bearing minerals from Bolivian polymetallic deposits and their mineralization stages. Min. Geol. 1988, 38, 419–435. [Google Scholar]
  42. Schwarz-Schampera, U.; Herzig, P.M. Indium: Geology, Mineralogy and Economics; Springer: Berlin/Heidelberg, Germany, 2002; pp. 147–151. [Google Scholar]
  43. Murakami, H.; Ishihara, S. Trace elements of Indium-bearing sphalerite from tin-polymetallic deposits in Bolivia, China and Japan: A femto-second LA-ICPMS study. Ore Geol. Rev. 2013, 53, 223–243. [Google Scholar] [CrossRef]
  44. Cook, N.J.; Ciobanu, C.L.; Pring, A.; Skinner, W.; Shimizu, M.; Danyushevsky, L.; Saini-Eidukat, B.; Melcher, F. Trace and minor elements in sphalerite: A LA-ICPMS study. Geochim. Cosmochim. Acta 2009, 73, 4761–4791. [Google Scholar] [CrossRef]
  45. Frenzel, M.; Hirsch, T.; Gutzmer, J. Gallium, germanium, indium, and other trace and minor elements in sphalerite as a function of deposit type—A meta-analysis. Ore Geol. Rev. 2016, 76, 52–78. [Google Scholar] [CrossRef]
  46. Bonazzi, P.; Bindi, L.; Bernardini, G.P.; Menchetti, S. A model for the mechanism of incorporation of Cu, Fe and Zn in the stannite–kësterite series, Cu2FeSnS4–Cu2ZnSnS4. Can. Mineral. 2003, 41, 639–647. [Google Scholar] [CrossRef]
  47. Watanabe, M.; Hoshino, K.I.; Myint, K.K.; Miyazaki, K.; Nishido, H. Stannite from the Otoge kaolin-pyrophyllite deposits, Yamagata Prefecture, NE Japan and its genetical significance. Shigen-Chishitsu 1994, 44, 439–444. [Google Scholar]
  48. McQueen, K.G.; Box, S. Mineralization at the Wallah Wallah Silver Mine, Rye Park, New South Wales and its metallogenic significance. Mineral. Petrol. 1988, 39, 289–305. [Google Scholar] [CrossRef]
  49. Murao, S.; Deb, M.; Furuno, M. Mineralogical evolution of indium in high grade tin-polymetallic hydrothermal veins—A comparative study from Tosham, Haryana state, India and Goka, Naegi district, Japan. Ore Geol. Rev. 2008, 33, 490–504. [Google Scholar] [CrossRef]
  50. Benites, D.; Torró, L.; Vallance, J.; Laurent, O.; Quispe, P.; Rosas, S.; Uzieda, M.F.; Holm-Denoma, S.; Pianowki, L.S.; Camprubí, A.; et al. Geology, mineralogy, and cassiterite geochronology of the Ayawilca Zn-Pb-Ag-In-Sn-Cu deposit, Pasco, Peru. Miner. Depos. 2022, 57, 481–507. [Google Scholar] [CrossRef]
  51. Petruk, W. Tin sulphides from the deposit of Brunswick Tin Mines Limited. Can. Mineral. 1973, 12, 46–54. [Google Scholar]
  52. Hayashi, K.; Kitakaze, A.; Sugaki, A. A re-examination of herzenbergite–teallite solid solution at temperatures between 300 and 700 C. Mineral. Mag. 2001, 65, 645–651. [Google Scholar] [CrossRef]
  53. Pavlova, G.G.; Palessky, S.V.; Borisenko, A.S.; Vladimirov, A.G.; Seifert, T.; Phan, L.A. Indium in cassiterite and ores of tin deposits. Ore Geol. Rev. 2015, 66, 99–113. [Google Scholar] [CrossRef]
  54. Lerouge, C.; Gloaguen, E.; Wille, G.; Bailly, L. Distribution of In and other rare metals in cassiterite and associated minerals in Sn±W ore deposits of the western Variscan Belt. Eur. J. Mineral. 2017, 29, 739–753. [Google Scholar] [CrossRef]
  55. Rudnick, R.L.; Gao, S. Composition of the Continental Crust. In Treatise on Geochemistry; Holland, H.D., Turekian, K.K., Eds.; Elsevier: Amsterdam, The Netherlands, 2014; pp. 1–51. [Google Scholar]
  56. Zhao, T.; Chen, C.; He, X.; Meng, L.; Xu, J.; Liu, W. A synthesis of the geology, spatial–temporal distribution and enrichment mechanism of granite-related indium deposits in China. Ore Geol. Rev. 2022, 146, 104932. [Google Scholar] [CrossRef]
  57. Torró, L.; Melgarejo, J.C.; Gemmrich, L.; Mollinedo, D.; Cazorla, M.; Martínez, A.; Pujol-Solà, N.; Farré-de-Pablo, J.; Camprubí, A.; Artiaga, D.; et al. Spatial and temporal controls on the distribution of indium in xenothermal vein-deposits: The Huari Huari District, Potosí, Bolivia. Minerals 2019, 9, 304. [Google Scholar] [CrossRef]
  58. Lastra, R.; Petruk, W. Mineralogical characterization of sieved and un-sieved samples. JMMCE 2014, 2, 40–48. [Google Scholar] [CrossRef]
  59. Rahman, R.M.; Ata, S.; Jameson, G.J. The effect of flotation variables on the recovery of different particle size fractions in the froth and the pulp. Int. J. Mineral. Process. 2012, 106, 70–77. [Google Scholar] [CrossRef]
  60. Angadi, S.I.; Sreenivas, T.; Jeon, H.S.; Baek, S.H.; Mishra, B.K. A review of cassiterite beneficiation fundamentals and plant practices. Minerals Eng. 2015, 70, 178–200. [Google Scholar] [CrossRef]
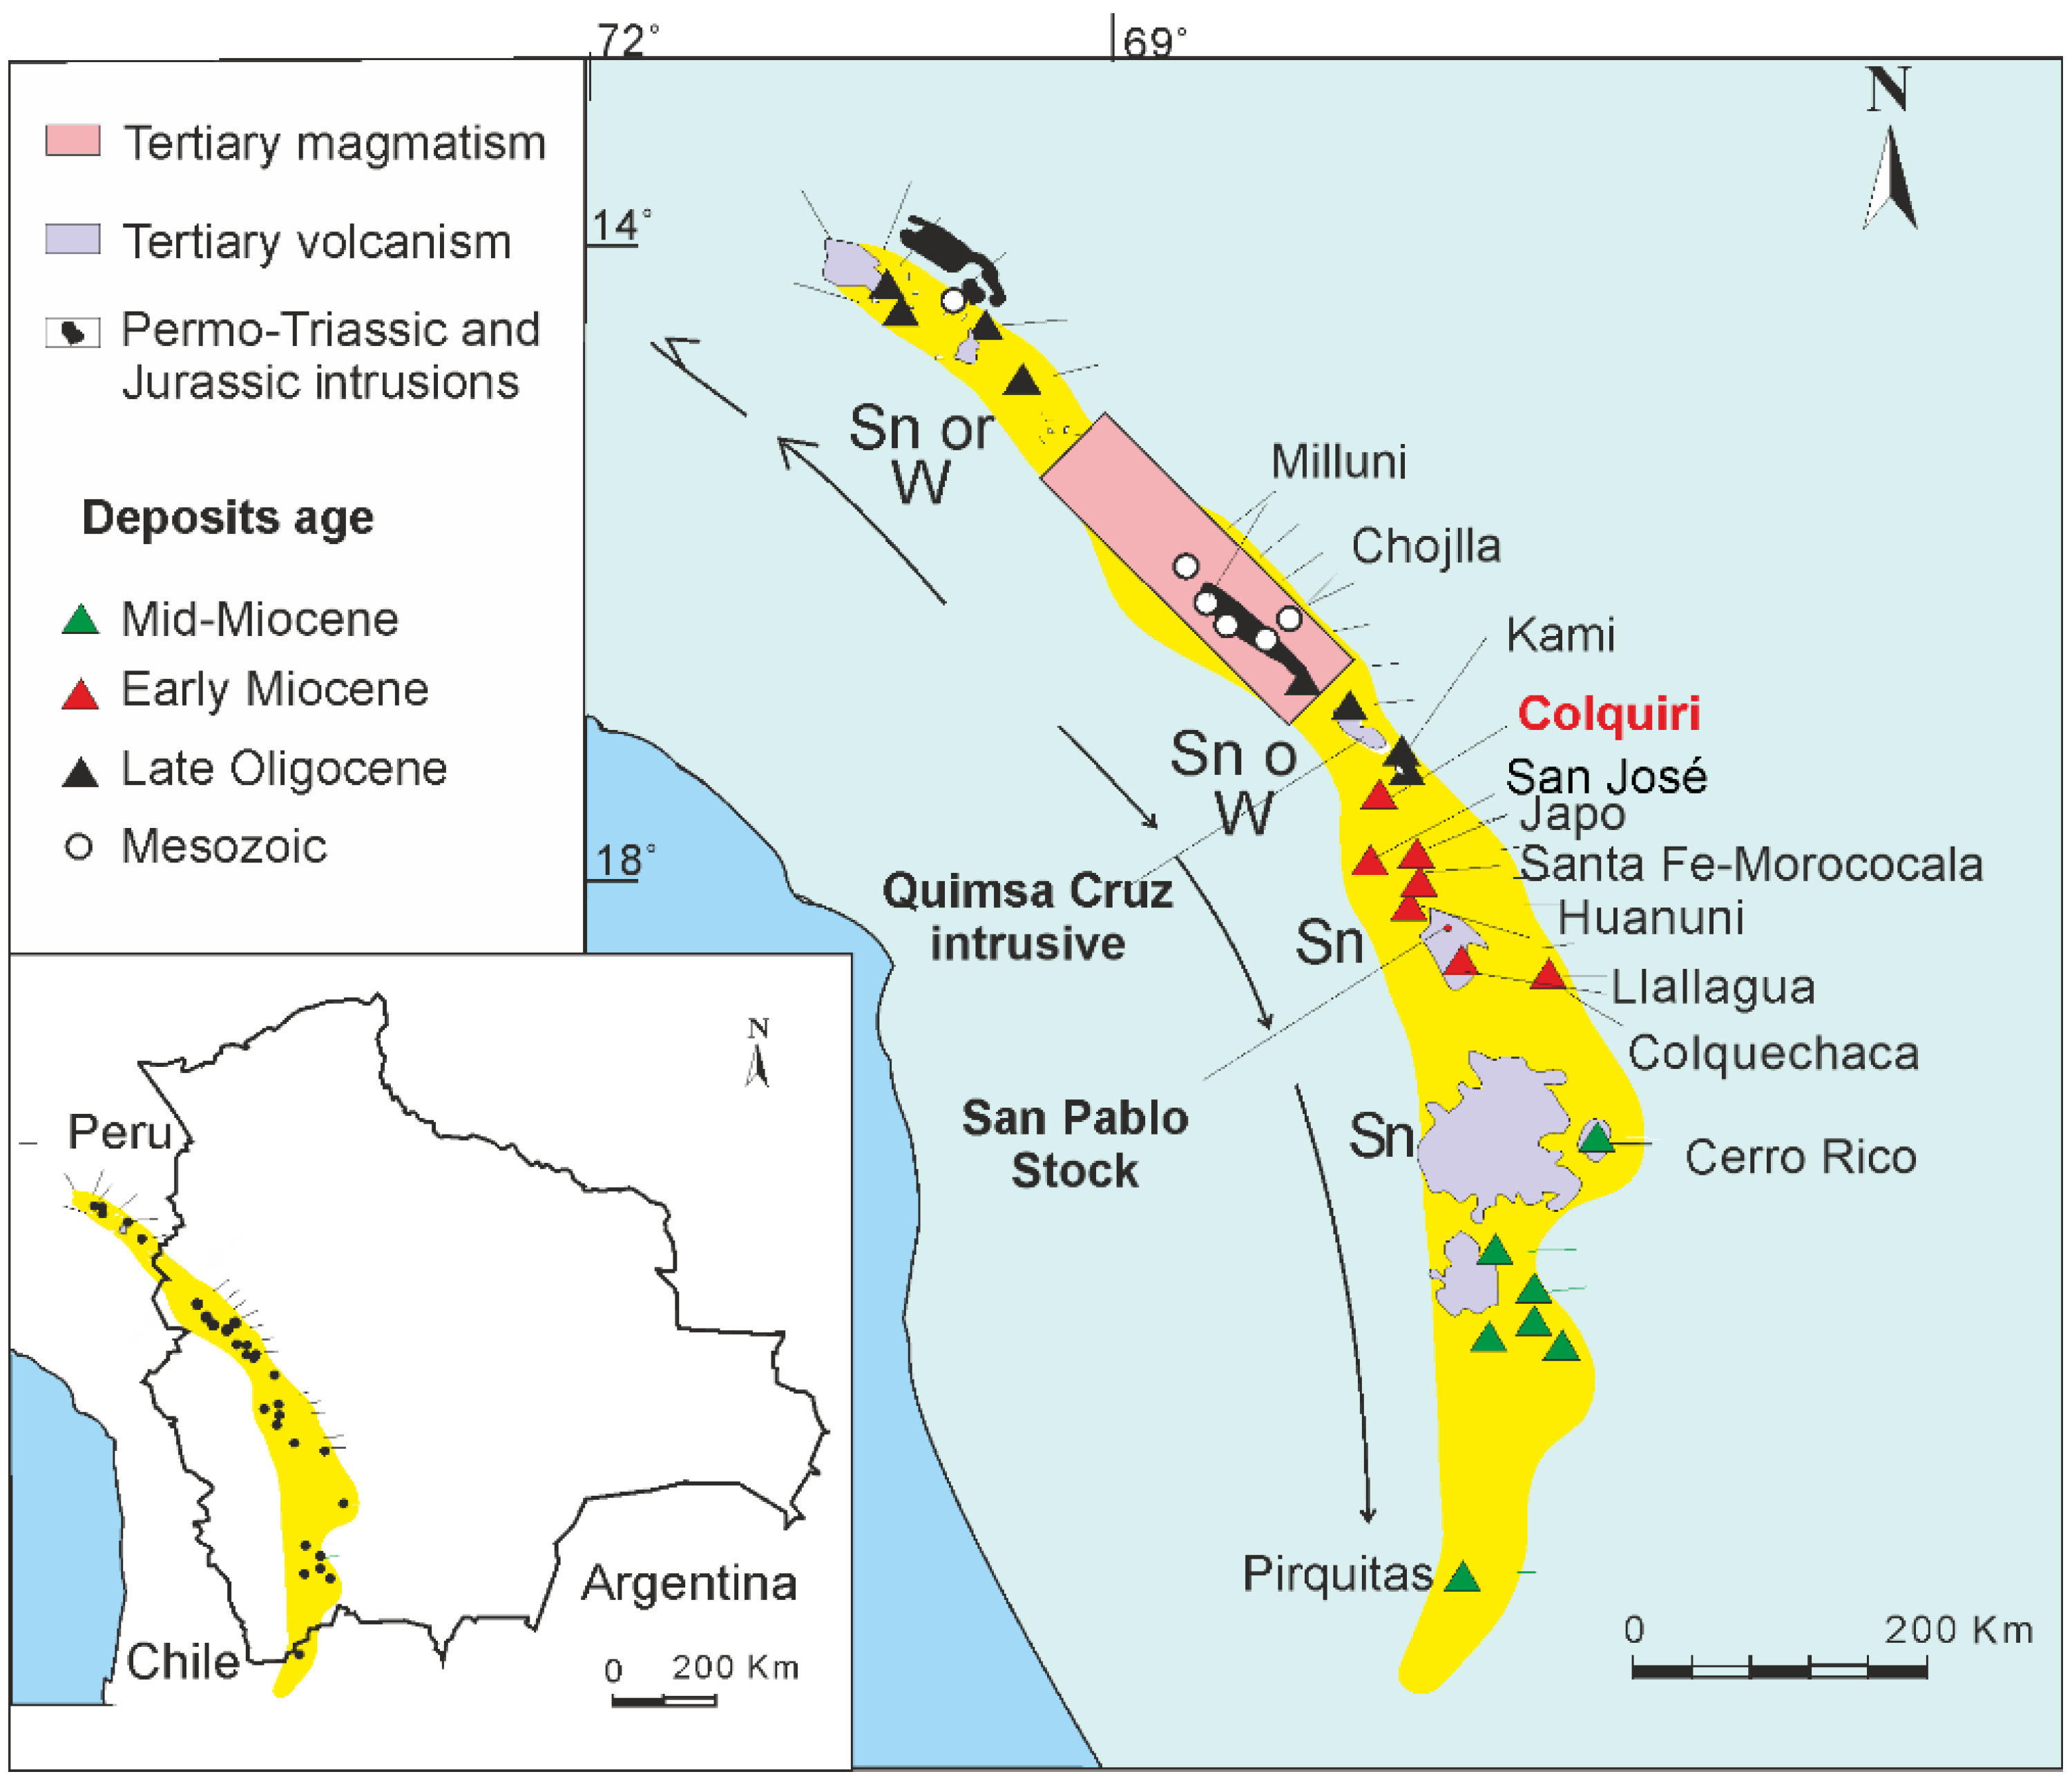
Figure 1. Location of Colquiri in the Central Andean tin belt. Data modified from [36].
Minerals 15 01017 g001
Figure 2. Geological map of Colquiri showing the sectors into which the deposit is divided and its main structures. Structural features from [33].
Minerals 15 01017 g002
Figure 3. Simplified flux diagram of the Colquiri processing plant.
Minerals 15 01017 g003
Figure 4. Ore minerals from Colquiri: (a,f,j,k) backscattered SEM images and (be,gi) reflected light photomicrographs. (a) Image of where the different crystallization stages are represented, including the early silicates and cassiterite, pyrrhotite, and sphalerite, together with the late sulfide. (b) Cassiterite in contact with pyrrhotite. (ce) Different textures of sphalerite associated with stannite. (f) Fluorite formed after deposition of stannite occupies the innermost part of a vein. (g) Pyrite replaced by marcasite; (h) sulfides are replaced by siderite. (i,j) replacement of pyrrhotite by pyrite and pyrite by siderite. (j,k) SEM images; (j) tiny inclusions of early-formed wolframite are also observed within pyrite. (k) Relationships between cassiterite and stannite, showing growths of teallite. Tpz = topaz; Qtz = quartz; Bt = biotite; Cst = cassiterite; Po = pyrrhotite; Sl = sphalerite; Stn = stannite; Tel = teallite; Py = pyrite; Mc = marcasite; Wf = wolframite; Fl = fluorite.
Minerals 15 01017 g004
Figure 5. Paragenetic sequence of the Colquiri mineralization (modified from [32,34]).
Minerals 15 01017 g005
Figure 6. XRD diagram of the Zn and Sn concentrates from the processing plant of Colquiri.
Minerals 15 01017 g006
Figure 7. Correlation between metal contents in materials from Colquiri: (a) Zn and In; (b) SnO2 and In; (c) Zn and Cu; (d) Zn and Ga.
Minerals 15 01017 g007
Figure 8. Correlation of Fe + Cu + In + Sn with Zn in sphalerite from Colquiri.
Minerals 15 01017 g008
Figure 10. Particle size distribution of the feed material (after the first milling), tailings, and concentrates from Colquiri.
Minerals 15 01017 g010
Figure 11. Grain size distribution of ores and pyrrhotite from Colquiri. The particle size distribution curve of the whole rock (feed) is maintained for ease of comparison.
Minerals 15 01017 g011
Figure 12. Liberation and mineral association of the main ores of the feed material from Colquiri.
Minerals 15 01017 g012
Figure 13. Particles from the Zn concentrate of Colquiri. (a) Ternary particle of sphalerite associated with stannite and quartz; (b) large particle of sphalerite, 350 µm in size, with pyrite and cassiterite; (c) sphalerite with stannite and cassiterite; (d) needle-like cassiterite within sphalerite; (e,f) multicomponent particles.
Minerals 15 01017 g013
Figure 14. Particles from the tailings of Colquiri. (a) Sphalerite encapsulated within pyrrhotite. (b) Multicomponent particle.
Minerals 15 01017 g014
Figure 15. Distribution of ores in the ground run-of-mine material of Colquiri according to particle size and ore grade classes. (a,b) Sphalerite. (c,d) Cassiterite.
Minerals 15 01017 g015
Table 1. Mineralogy of the studied ores of Colquiri. The techniques by which they have been observed are marked with an x.
Mineral, wt.%FormulaAMICSMLAXRDOMEPMA
QuartzSiO212.6210.63xx
Dravite–schorlNa(Mg,Fe)3Al6(BO3)3Si6O18(OH)42.452.63xx
TopazAl2SiO4F21.541.19 x
BiotiteK(Mg,Fe)3(AlSi3O10)(OH,F)20.251.91xx
AlbiteNaAlSi3O80.130.68
K-feldsparKAlSi3O80.060.8
Chlorite(Mg,Fe)3(Si,Al)4O10(OH)2·(Mg,Fe)3(OH)61.142.56 x
Kaolinite–dickiteAl2Si2O5(OH)40.260.26 x
PyrophylliteAl2Si4O10(OH)20.970.97
SideriteFeCO34.265.47xx
ApatiteCa5(PO4)3(F,Cl,OH)0.020.02
FluoriteCaF21.11.12xx
Pyrite/marcasiteFeS27.866.33x x
PyrrhotiteFe(1−x)S28.2231.05x x
ArsenopyriteFeAsS1.350.76 x
Sphalerite(Zn,Fe) S24.6924.46 x
StanniteCu2FeSnS40.830.95x x
ChalcopyriteFeCuS20.120.21 x
GalenaPbS0.040.05 xx
CassiteriteSnO22.872.91xxx
RutileTiO20.050.04
MagnetiteFe3O40.37 x
HematiteFe2O31.47 x
Fe-oxide/hydroxide 1.18 x
GoethiteFeO(OH)0.51 x
Wolframite(Fe,Mn)WO40.01 xx
Freibergite(Ag,Cu,Fe)12(Sb,As)4S13 0.18 x
PyrargyriteAg3SbS3 x
Tetrahedrite(Cu,Fe)12Sb4S13 0.03
TeallitePbSnS2 x
BismuthiniteBi2S3 x x
Other 3.830.26
Table 2. Chemical composition of representative samples of feed material, concentrates, and tailings from the Colquiri processing plant.
ElementCQ26CQ16CQ19CQ17CQ25
FeedFeedZn ConcentrateSn ConcentrateTailings
Wt.%
SiO213.5018.611.5022.5023.50
Al2O33.825.340.496.175.63
TiO20.130.150.020.220.22
MgO0.610.220.130.920.58
CaO1.190.510.242.231.65
Na2O0.010.020.000.010.01
K2O0.630.180.020.220.52
SnO22.963.761.3552.561.1
Fe28.6028.5014.357.6330.5
Zn13.2512.2543.902.085.03
S25.60 32.104.2122.10
ppm
Mn64111406212410852
Cd592503>100088151
Cu3760374077906881800
In1721554811847
Ga41.240.3125.59.2813.3
Ge0.540.480.280.090.5
Pb5696271375289409
As145538009729632160
Sb25.960.427.126.330.1
Ag58.982.1>10012.328.7
Nb0.260.220.100.210.23
Ta<0.01<0.01<0.01<0.01<0.01
W11.340018.216026.3
Table 3. Chemical composition of sphalerite- and stannite-group minerals. Average (Av) of n EMPA analyses. DL, detection limits.
MineralDLSphalerite, n = 51Stannite, n = 79Ag-Rich Stannite, n = 4
Element, wt.% AvMINMAXAvMINMAXAvMINMAX
S0.0132.6831.3533.7428.3523.9029.7826.5426.0726.96
Zn0.0352.4548.7655.522.530.379.551.861.272.64
Fe0.0213.6211.3615.7612.9010.7914.1811.0110.2311.74
Cu0.020.400.032.1528.1924.2529.4125.0824.0926.59
Sn0.040.100.000.6126.3322.9927.6623.7423.0324.92
Ag0.060.020.000.100.340.011.318.686.9510.38
Cd0.020.220.000.490.000.000.070.000.000.00
In0.020.040.000.220.060.000.260.000.000.00
As0.020.010.000.090.010.000.080.040.010.08
Table 4. Liberation characteristics of sphalerite, stannite, and cassiterite and mineral association of binary and ternary particles (wt.% locked in).
MineralSphaleriteStanniteCassiterite
Liberated45.388.4554.68
Quartz5.717.776.04
Chlorite4.371.241.80
Biotite1.412.300.88
Dravite0.891.023.87
Topaz1.271.512.36
Sphalerite 51.4314.58
Pyrrhotite15.5714.808.72
Stannite7.66 0.61
Pyrite2.841.840.40
Chalcopyrite2.330.72
Freibergite0.971.190.01
Cassiterite4.251.37
Siderite5.304.212.44
Fluorite0.531.270.94
Total98.4899.1397.32
Disclaimer/Publisher’s Note: The statements, opinions and data contained in all publications are solely those of the individual author(s) and contributor(s) and not of MDPI and/or the editor(s). MDPI and/or the editor(s) disclaim responsibility for any injury to people or property resulting from any ideas, methods, instructions or products referred to in the content.