Abstract
The depositional environments, weathering and provenance, organic matter enrichment, and preservation in the Gondwana and post-Gondwana units of the Lesser Himalayas, Nepal, are studied through geochemical and mineralogical analyses using petrography, X-ray diffraction, XRF, and ICP-MS. Mineralogical findings indicate that shales comprise 55% to 72% clay, 25% to 55% quartz, and less than 10% carbonate minerals, with a significant presence of illite, suggesting a transition from fluvial to shallow marine environments during post-Gondwana deposition. The thin sections of the post-Gondwana sandstone reveal an increase in quartz, feldspar, and plagioclase content, with rounded to sub-angular quartz grains indicating moderate transportation before lithification, resulting from the Indo-Asian collision. Geochemical data, including major, trace, and rare earth elements (REE), along with bivariate discrimination diagrams, reveal distinct environmental changes; Gondwana sediments exhibit oxic, arid conditions with continental provenance, while post-Gondwana deposits indicate humid environments favorable for organic matter enrichment, primarily sourced from felsic-intermediate igneous rocks. The TOC is less than 1 wt.% in the Gondwana and is 0.75 to 2 wt.% in the post-Gondwana shale, indicating better organic matter preservation. The existing geological structural data and the research findings highlight the pivotal role of Himalayan tectonism in enhancing the thermal maturity and hydrocarbon generation potential of organic-rich post-Gondwana shales, attributed to their substantial organic matter content.
1. Introduction
Geochemical analyses have been extensively used worldwide, reflecting detrital input, paleo-salinity, paleo-water depth, paleo-climatic conditions, and paleo-redox conditions in organic-rich shales [1,2,3,4]. These analyses have become crucial for understanding basin evolution, identifying source rocks, and determining paleo-deposition [5,6]. Depositional factors such as paleo-productivity, terrestrial input, paleo-salinity, and preservation conditions like redox conditions and paleo-water depth significantly affect the accumulation and preservation of organic matter in sedimentary deposits [7,8]. Similarly, the depositional environments modulate the distribution and concentration of elements in sedimentary deposits. Inorganic geochemical proxies, including specific element ratios and abundances, infer paleoenvironmental conditions and understand the processes influencing organic matter preservation and enrichment [9,10]. The major elemental oxides obtained from X-ray fluorescence (XRF) analysis of sedimentary rocks are essential for characterizing the provenance and discriminating the felsic, intermediate, and mafic parent rocks of the shales [11,12]. Additionally, the XRF reveals the degree of chemical weathering of source rocks [13,14] and documents the paleotectonic setting [15]. Similarly, the concentration of trace and rare-earth elements (REE) helps to determine the paleoenvironment and depositional conditions [16,17] in the sediments (clay-rich), which are valuable proxies to address their source characteristics and the tectonic setting of deposition [18]. The spatial and temporal distribution of sediments and their geochemical records can be used to restrict the complete exhumation history, foreland basin tectonics, and related foreland propagated thrust belts.
The Gondwana is a distinct stratigraphic framework primarily associated with the Gondwana supercontinent, which existed during the Late Paleozoic to Early Mesozoic era and consists of sedimentary rock layers with substantial lithological diversity, including sandstones, shales, clays, conglomerates, and coal seams. Gondwana and associated rocks, deposited in paralic facies and overlying Foreland Basin Sequences, have been identified within the Lesser Himalayan in different geographic locations in Nepal [19,20]. The Gondwana rocks are divided into three units based on deposition time: Lower Gondwana in the Late Carbonaceous–Permian, Upper Gondwana in the Jurassic–Lower Cretaceous, and post-Gondwana in the Paleocene–Middle Miocene [19]. The post-Gondwana is the foreland deposit, deposited during and after the India–Eurasian collision. The Gondwana exposures exist mainly within the basement of the Tansen syncloronium, lying unconformably over the Precambrian–Early Paleozoic Lakharpata Group [19]. The post-Gondwana Himalayan foreland basin is filled with hundreds to thousands of meter thicknesses of sediments that have preserved the records of Cenozoic Himalayan tectonics, such as exhumation and upliftment from the beginning to the termination stage of collision and post-collision [21]. Some of the past researchers have completed the stratigraphy, provenance analysis, and petrography of the Gondwana and a post-Gondwana in the Lesser Himalayas, Nepal [22,23,24,25]. Similarly, some past studies were centric on the impact of paleo-environment and climate [26], geochronology, detrital zircon U–Pb ages, Hf isotopic constraints, and trace element analysis [23,27,28]. In addition, some other literature focused on the structural and thermal evolution of the Gondwana sequence and the foreland basin in the Lesser Himalayas, Nepal [21,29,30,31,32]. However, the complete geochemical dataset still lacks the key features to comprehend the tectonic evolution of the Himalayas. Thus, the whole-rock geochemical analysis of the sandstone and shale sequence in a post-Gondwana can be used as a proxy to understand the provenance and tectonic evolution of the Himalayan orogeny [31,33].
Despite existing studies on the paleo-depositional environment and provenance analysis of Gondwana units in the Himalayan regions, there remains a significant gap in research concerning the enrichment and preservation of organic matter in the black shale of the Gondwana units, Lesser Himalaya, Nepal. This study addresses that gap by conducting a comprehensive geochemical and mineralogical characterization of shale and sandstone from various Gondwana units in the Tansen and Surkhet basins of the Lesser Himalayas. The research investigates explicitly the mineralogical and geochemical properties of these rock types to ascertain their provenance and paleo-weathering history. Utilizing advanced techniques such as petrography microscopy, X-ray Diffractometry (XRD), X-ray Fluorescence (XRF), and Inductively Coupled Plasma Mass Spectrometry (ICP-MS), this study seeks to enhance understanding of organic matter enrichment in these rock strata. The findings are expected to provide valuable insights into the region’s characteristics of hydrocarbon source rocks.
2. Geological Background
Tectonic and Stratigraphic Overview of Central Himalaya
The Nepal Himalayas occupy the central sector of the Himalayan arc and extend about 800 km which is divided into four tectonostratigraphic zones from south to north (Figure 1a): the Sub-Himalaya (SW), Lesser Himalaya (LH), Higher Himalaya (HH), and Tethys Himalaya (TH) [34]. The geological evolution is marked by the Gondwana sequence, deposited upon the Proterozoic Lesser Himalayan sequence during the Late Paleozoic to Mesozoic Era [35]. The Gondwana sequence in the Himalayas demonstrates discrete patches located in various geographical areas along the front of the Himalayan Thrust Fold Belt (HTFB). Several isolated Gondwana rock formations have been documented in the segments of western, central, and eastern Nepal, Sikkim/Darjeeling, Kameng, and the Siang region [19,20,36]. The Gondwana sequence is further divided into Lower and Upper Gondwana [19], characterized by initial glaciomarine deposits transitioning to meandering fluvial systems rich in coal, carbonaceous shale, and siltstone due to humid conditions [37]. Climate fluctuations led to changes in facies composition, with meandering river systems dominating, occasionally influenced by marine incursions.
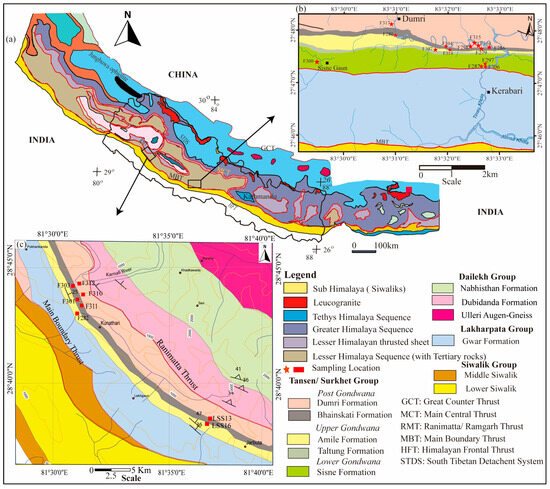
Figure 1.
(a) Regional geological map of the Himalayas showing the study area, (b) geological map of the Tansen area with sample locations, modified after Dhital [34] and Sakai [19], and (c) geological map of the Surkhet area with the sample location modified after DeCelles, Carrapa [33].
The Tansen Basin exhibits distinct lithofacies, including conglomerate, coal, sandstone, carbonaceous shale, and gray shale-siltstone. The Tansen Group (Figure 1b), encompassing the Late Carboniferous to Early Miocene clastic rocks, is a reference for the Gondwana sequences in Nepal. Notable formations include the Sisne, Taltung, and Amile formations (Gondwana) and the Bhainskati and Dumri formations (post-Gondwana). The Sisne Formation comprises diamictite, shale, coal, and sandstone from glacio-marine to meandering deposits. It provides key insights into the paleoclimatic and depositional conditions of the region during the Late Carboniferous and Permian. In contrast, the Taltung Formation exhibits upward fining sequences indicative of fluvial activity, while volcanism is evidenced in the associated Aulis basalt [27,38], which points to volcanic activity contemporaneous with sediment deposition. The coal-rich Amile Formation originates from the Proterozoic and Cretaceous volcanic sources of Indian affinity [23]. During the Cretaceous to Palaeocene, the region experienced a humid and tropical climate that led to extensive chemical weathering of sandstone found within the Amile sediments. In contrast, the Bhainskati Formation consists of 100–150 m of organic-rich dark grey and black shales, representing the last marine sedimentary sequence in the southern Himalayas before and during the India-Asian collision [19]. The thick hematite- and kaolinite-rich oxisol at the uppermost part of this formation represents slight to gradual regression, indicating transitions to terrestrial conditions spanning approximately 15–20 million years [21,26]. Initially, the region experienced a transition from a marine to a brackish water environment during the Eocene, gradually shifting towards freshwater conditions at higher stratigraphic levels. This shift indicates a general marine regression, as evidenced by the presence of Nummulites and terrestrial mammal skeletal fragments in the sedimentary rocks, suggesting that the sea receded by the end of the Eocene [19]. The topmost unit, Dumri Formation, characterized by multistoried fluvial sandstones, laminated siltstone, and red-purple shale, was deposited after the Early Miocene unroofing of the Greater Himalayan sequence due to the MCT and the South Tibetan Detachment System (STDS) [31]. These post-Gondwana formations correlate with the Melpani, Swat, and Suntar formations in the Surkhet area (Figure 1c), indicating the regional geological consistency.
The post-Gondwana Bhainskati and Dumri Formations predominantly sourced from the erosion of crystalline rocks in the Himalayan orogenic belt during and after the collision of the Indian and Asian plates. These sediments are mainly clastic, comprising sandstone, mudstone, and siltstone, with varying clay mineral content, which reflects a dynamic sediment transport regime shaped by tectonic forces. The primary mode of sediment transportation was through fluvial systems, where river and stream processes were significantly influenced by tectonic deformation as the Himalayas uplifted. The Bhainskati Formation is characterized by evidence of shallow marine deposition, but the Dumri Formation features fluvial, floodplains, and possibly lacustrine environments, all resulting from active tectonic uplift leading to high-energy fluvial conditions that facilitated rapid sediment transport [19,21]. The clay minerals in the Bhainskati shale are primarily a product of diagenesis, occurring under relatively low temperatures and pressure. This mechanism leads to the transformation and alteration of initial sediments, including the breakdown of larger particles and the conversion of feldspar and volcanic minerals into clay minerals such as illite, smectite, and kaolinite [32,39]. Consequently, these diagenetic alterations significantly influence the mineralogical composition and character of the shale. Furthermore, the tectonic uplift of the Himalayas has resulted in increased pressures and temperatures within the sedimentary basins, which facilitate the recrystallization of clays and the cementation of sandstones, enhancing the overall complexity of the sedimentary rock assemblage in the Tansen Unit.
3. Samples and Methods
Extensive fieldwork was carried out in the section of Gondwana and post-Gondwana sequences in the Tansen unit (e.g., Butwal to Tansen section) and the Surkhet unit (Surkhet to Dailekh section) within the Lesser Himalaya, Nepal. Twenty-four samples (13 shales and 11 sandstone) from the Gondwana and the post-Gondwana units from the Tansen and Surkhet areas (Figure 2), and four samples from the Siwalik Group of the Tansen area (Table 1) were collected based on the formation, color, texture, and other morphological changes for subsequent mineralogical and geochemical analyses. Shales were dark gray to black, laminated, and sandstones were predominantly medium to coarse-grained, greyish-white, compact, and massive, with trough cross-stratified and planar cross-stratified bedding. The following methods were conducted in the Laboratory of Guizhou Coal Field Geological Bureau, Guizhou, China.
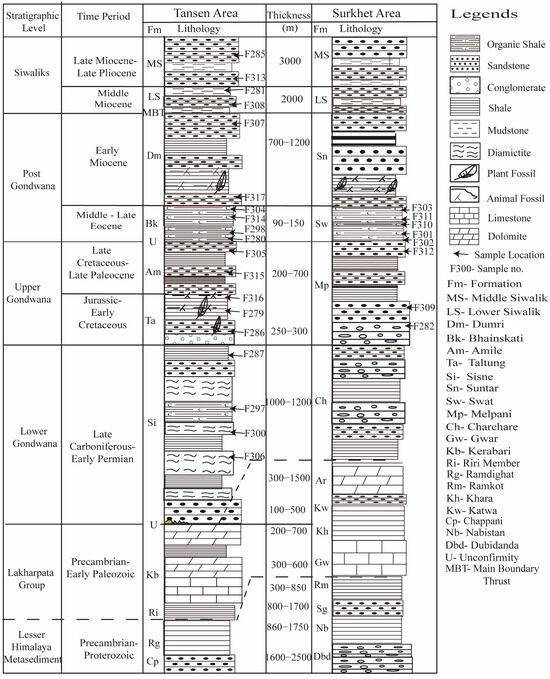
Figure 2.
Columnar section of the Tansen area and Surkhet area with the sample location modified after Sakai [19] and Kayastha [40].

Table 1.
Global positioning system (GPS) coordinates and stratigraphy of Gondwana–Siwalik samples.
- Petrographic Analysis: Shale and sandstone samples were cut perpendicular to the bedding plane, and thin polished sections were prepared for the petrographic analysis. The polished thin sections were prepared according to the methods described by Littke et al. [41]. The analysis used reflected white light and fluorescence modes to observe mineral grains, organic matter, macerals, structures, pores, and fractures. Optical microscopy with polarized light was used to determine the mineralogical composition. Petrographic sections were prepared and observed under a polarized light microscope (ZEISS Axio Scope A1) in the Laboratory of China University of Mining and Technology, Xuzhou;
- X-Ray Diffraction (XRD): XRD was employed to assess the mineralogical characteristics of 13 shale and 13 sandstone samples. To prepare the samples for analysis, they were crushed and ground to a particle size of less than 200 mesh (74 µm). The mineralogical analysis utilized the X’ Pert Pro MPD DY3794 X-ray diffraction instrument (PANalytical, UK) to identify clay and non-clay minerals in sedimentary rocks, adhering to the SY/T 5163-2018 standard;
- Total Organic Carbon (TOC) Analysis: The TOC content of 11 representative shale samples was determined using an infrared sulfur analyzer, CS230 (LECO Corporation, Saint Joseph, MI, USA) following the methodologies outlined in the Chinese National Standard Method;
- X-Ray Fluorescence Spectrometry (XRF): XRF spectrometry was implemented to analyze oxides of major elements, including SiO2, TiO2, Al2O3, Fe2O3, FeO, MnO, MgO, CaO, Na2O, K2O, and P2O5 across nine shales and seven sandstone samples. Initially, the powdered samples were heated and fused into glass sheets using a mixture of anhydrous lithium tetraborate, lithium fluoride, and ammonium nitrate, which were subjected to heat in a muffle furnace to assess loss on ignition. Subsequently, the fused samples underwent heating to 800 °C for analysis with an ARL PERFORMX PerformX4200 XRF spectrometer instrument, (Thermo Fisher Technologies LTD, Waltham, MA, USA);
- Inductively Coupled Plasma Mass Spectrometry (ICP-MS): The analysis of trace elements, rare earth elements (REEs), and minor elements was performed using the NexION 2000 ICP-MS apparatus, (American PE companies, NY, USA) operating at 15–30 °C temperature. The process involved heating the powdered samples with hydrofluoric acid (HF) and nitric acid (HNO3). After the initial evaporation to dryness, HNO3 was reintroduced to the beaker and heated to 130 °C to dissolve the samples comprehensively. The resulting solution was then diluted with distilled water for trace element analysis.
4. Results
4.1. Petrography Analysis
The microscopic analysis of thin sections from Gondwana and post-Gondwana shale and sandstone reveals important sedimentary rocks’ characteristics. The petrological characteristics of the source rocks are vital in understanding the paleo-depositional environment, mineralogy, and their hydrocarbon potential. The rock types, mineral composition, and depositional environments shape the capacity of these formations to generate and store hydrocarbons, particularly in unconventional gas systems like shale gas. The organic petrographic analysis conducted in this study provides valuable insights into the diverse constituents of organic matter. The Gondwana shale (Figure 3a) of the Sisne Formation contains liptinite macerals, implying that the material originated from algal or bacterial ancestors in marine or lacustrine environments. The white areas in these images represent clay minerals, mainly illite. In Figure 3b, volcanic lithic wacke and volcanic rock fragments are observed in the shale sample of the Taltung Formation, along with kaolinite as a clay mineral. The predominance of vitrinite in the Eocene shale samples (Figure 3c,d) suggests a substantial contribution from terrestrial plants to organic matter deposition. The presence of pyrites in the Eocene shale implies preserving organic matter in periodically low oxygen concentrations in pore water and anoxic depositional conditions [42]. The fracture is observed clearly in the thin sections of Bhainskati shales (Figure 3c,d). Compared with sub-vertical fractures, the horizontal fractures exhibit an irregular surface in the Eocene shale (Figure 3c,d). Hydrocarbons can be preserved in bulk, organic, and inorganic kerogen [43]. The total organic content significantly affects shale rocks’ specific surface area, porosity, and permeability. The thin sections of sandstone (Figure 3e–h) from the post-Gondwana reveal that these primary intergranular pores are the predominant feature within the samples, indicating their importance in the overall porosity of the rock. The sandstone samples exhibit more quartz, feldspar, and plagioclase. The Amile Formation sandstone from the Surkhet area has large quartz grains and is compacted to each other (Figure 3d). The quartz grains are sub-angular to rounded, suggesting a moderate degree of transportation and abrasion before lithification. The Bhainskati sandstone samples comprise quartz as a major mineral, reflecting a critical record of the foreland basin dynamics resulting from the Indo-Asia continental collision and a few organic particles and clay minerals (Figure 3f–h). The heavy minerals are mainly magnetite and hematite in opaque and non-opaque minerals are zircon, tourmaline, and apatite (Figure 3).
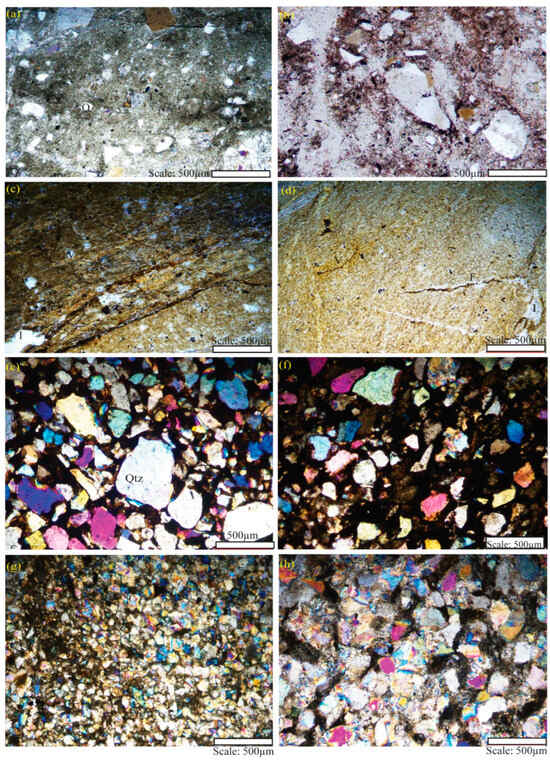
Figure 3.
Representative Polarizing microscope photomicrographs showing the characteristics of different minerals in the Gondwana and post-Gondwana shale (a–d). Sandstones (e–h). (a) Sisne Fm, (b) Taltung Fm, (c) Bhainskati Fm, (d) Swat Fm, (e) Amile Fm, (f) Swat Fm, and (g,h) Bhainskati Fm. (Qtz-quartz, Q-quartz arenite, F-fracture, I-Illite, V-Vitrinite, T-Tourmaline).
4.2. Mineralogical Compositions and TOC Content
The major minerals identified by XRD analysis are quartz, clay, plagioclase, carbonates, and other minor minerals observed in shale and sandstone (Table 2). Clay minerals accounted for 43%–72% of the samples, dominated by chlorite and illite with rare kaolinite and mixed-layer illite/smectite, followed by quartz (23%–42%), carbonates (3%–27%), and plagioclase (10%–20%) in shale. The Gondwana shale exhibits clay minerals <50%, whereas the post-Gondwana shale consists of (60%–70%) of clay minerals (Table 2). The Gondwana shale exhibits plagioclase; however, the post-Gondwana shales are free of plagioclase. Small quantities (<2%) of feldspar, pyrite, and siderite were observed in a few samples. Illite constitutes 58%–87% of clay minerals, averaging 73%. The others are chlorite at 8%–26% (average 15.4%) and kaolinite at 5%–13% (average 9%), from the highest to the lowest. However, the Upper Gondwana, Taltung Formation sample exhibits kaolinite with the highest concentration at 57%, chlorite at 42%, and illite at only 1% (Table 2). The TOC content in 11 shale samples ranges from 0.5% to 1.56% (Table 2). The Gondwana shale exhibited a TOC of ≤0.75%, while the post-Gondwana shale had a higher value (up to 1.56%). Similarly, the sandstone reveals that quartz accounted (56%–78%), clay minerals for (14%–32%), followed by plagioclase (6%–12%). The representative Lower Siwalik sandstone sample exhibits higher quartz content than the Middle Siwalik and the clay mineral ranges between 11.5 and 14% (Table 2). The Siwalik sandstones exhibit many carbonates, 18.77% in the Lower Siwalik and (41 to 51.9) wt.% in the Middle Siwalik (Table 2).
Table 2.
Mineralogical composition, TOC content, and MIA of shale and sandstone samples.
Furthermore, the Mineralogical Index of Alteration (MIA) measures weathering intensity, reflecting the relative concentration of stable quartz at the expense of unstable feldspars. It can quantify the degree of weathering in the source region and is not affected by sorting or abrasion [13,44]. The MIA is calculated as in Equation (1).
It is depicted graphically on a Q–Pl–KF triangular plot, with quartz (Q), plagioclase (Pl), and K-feldspar (K-f) at the apices (Figure 3a).
4.3. Major Elements
The distribution of the major elements in the representative shale and sandstone samples from the Gondwana and post-Gondwana (Table 3) from the Tansen and Surkhet basins exhibit variations in the concentration of major oxides. Notably, SiO2 enrichment relative to Al2O3, K2O, and CaO is observed in shale, with the Lower Gondwana averaging 64.36 wt.%, Upper Gondwana 53.54 wt.%, and the post-Gondwana 56 wt.%. Al2O3 varies between 12.47–20.85 wt.%, with the highest levels in Gondwana. Fe2O3 content ranges between 5.085–11.44 wt.% in the Lower Gondwana, 6.66–9.49 wt.% in post-Gondwana, and peaks in the Upper Gondwana at 9.54–13.34 wt.%. MnO contents in shales range from 0.1–0.22 wt.% and are stable proxies during thermal diagenesis. The reciprocal values of different major oxides in shale from the Lower Gondwana, Upper Gondwana, and the post-Gondwana are, on average, given as SiO2/Al2O3 5.2, 2.6, and 3.2, respectively. Similarly, K2O/Na2O from 3.76–4.51, 10.78–12.29, and 15.78–19.50, respectively, K2O/Al2O3 from 0.27,0.15, and 0.20; Al2O3/TiO2 average 17.32, 7.39 and 13.58 respectively. Furthermore, major oxide concentrations in sandstones in the post-Gondwana exhibit SiO2 content ranging from 79.63–88.99 wt.%, Al2O3 varying from 0.89% to 5.88%. The post-Gondwana sandstone exhibits 7.49–8.88 wt.% Al2O3 in Bhainskati Formation, while Dumri Formation has 4.72% Al2O3, and Na2O is 0.09–0.19 wt.% (Figure 4b). The correlation coefficient matrix for shales and sandstone of Gondwana and post-Gondwana are presented in Table 3 and Table 4, respectively. The SiO2 in shale is positively correlated with MgO, Na2O, and P2O5 and negatively correlated with other major elements (Table 3). In contrast, SiO2 of sandstone is negatively correlated with all the other major oxides (Table 4). SiO2 demonstrates a negative correlation with Al2O3 in shale and sandstone (Table 3 and Table 4). The SiO2 content is likely associated with quartz, clay minerals, and plagioclase, whereas Al2O3 is predominantly linked to the preferential inclusion of aluminous clays in shale. The weak correlation between SiO2 and Al2O3 suggests that SiO2 primarily exists as detrital silicates and is not significantly influenced by clay minerals [45]. The K2O/Al2O3 ratio serves as an indicator of the original composition of ancient sediments, with distinct ranges for clay minerals (0.0 to 0.3) and feldspars (0.3 to 0.9) [7]. The average K2O/Al2O3 ratios in the examined shale and sandstone samples (Table 5) are <0.3, suggesting that illite is the predominant clay mineral in these samples. The Siwalik Group sandstone exhibits the lowest SiO2, with 55.31 wt.%, and the highest CaO of 16.48 wt.% (Table 5).
Table 3.
Correlation coefficient matrix for shales of Gondwana and post-Gondwana.
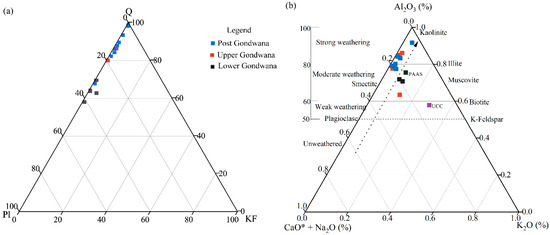
Figure 4.
Mineralogical and compositional variations in sandstones and shale from Tansen and Surkhet (a) Q–Pl–KF (quartz–plagioclase–K-feldspar) diagram (Mineralogical Index of Alteration, MIA and (b) Al2O3– (CaO* + Na2O)–K2O (A-CN-K) diagram [13,14] of the shale and sandstone samples from this study. In (b), the samples analyzed along the dotted line parallel to the A–CN edge are the ideal weathering trend (IWT).
Table 4.
Correlation coefficient matrix for sandstone of Upper and post-Gondwana.
Table 5.
Major oxide concentrations (wt.%), their ratios, and some calculated indices of shales and sandstones from the Tansen and Surkhet area, Nepal.
The Chemical Index of Alteration (CIA) is a geochemical measure of weathering intensity that assesses the conversion of feldspars to clay minerals and serves as a proxy for reconstructing paleoclimatic conditions, considering other factors [6,13,14,46]. The CIA is expressed as Equation (2).
CaO* is only the CaO in silicate minerals [46]. If CaO ≤ Na2O, then CaO* equals CaO; if CaO > Na2O, Na2O is used as CaO*. The CIA in shale is positively correlated with Al2O3 and Fe2O3 and negatively with others (Table 3), but in sandstone, it is positively correlated only with SiO2 and Al2O3 (Table 4).
CIA and weathering paths can also be evaluated using plots of A–CN–K (Al2O3–CaO* + Na2O–K2O) [46]. The average CIA value of the shale of the Lower Gondwana is 71, Upper Gondwana is 85, and the post-Gondwana ranges from 82, which is higher than the PAAS (75.6). In contrast, the CIA values for Upper Gondwana sandstone range from 63 to 77, whereas the post-Gondwana sandstone exhibits CIA values ranging from 77.85 to 91.61.
The Index of Compositional Variability is given in Equation (3).
For these analyzed samples from different units of Gondwana, an ICV value between 0.5 and 1.6 was indicated (Table 5).
4.4. Trace and REE Elements
Trace and rare earth element (REE) data for 16 samples are detailed in Table 6 and Table 7, respectively, showing total REE (∑REE) values ranging from 310.17 to 780.81 μg/g in shale and 195.82 to 281.61 μg/g in sandstone. The concentration of light rare earth elements (LREEs) exceeds that of heavy rare earth elements (HREEs), consistent with typical REE distributions in shales [47]. The LREE/HREE ratios range from 12.94 to 15.75 in shale and 8.25 to 13.74 in sandstone, higher than the PAAS and UCC (La/Yb)N values, which reflect LREE/HREE ratios, range from 3.17 to 4.98, indicating LREE enrichment (Table 8). The V/Cr ratios for the different units of Gondwana sediments show a range of 0.37–0.78 except for a sample from the Upper Gondwana shale exhibits, i.e., 1.6. The Ni/Co ratios in the investigated Gondwana shale range from 2.06 to 4.55, and in sandstone between 1.78 and 3.38. The Ba/Sr ratios in shale from the Gondwana range from 4.06 to 7.9, post-Gondwana from 2.99 to 15.65, and sandstones up to 33.51 (Table 8).
Table 6.
The concentration of rare earth elements (ppm) in shale and sandstones compares with PAAS.
Table 7.
Trace elemental concentration in shale and sandstone.
Table 8.
Ratios of trace element concentration of shales and sandstones from different units.
Regarding chondrites, REE patterns with Eu and Ce anomalies are commonly used to infer sediment source regions [48]. The shale samples exhibit negative Eu anomaly, indicating a reducing depositional environment [49,50]. The REE patterns also provide insight into sedimentary provenance [48], with a high LREE/HREE ratio suggesting a felsic source and vice versa for a mafic source [12].
Europium anomaly (Eu/Eu*) is calculated in Equation (4) after McLennan [51] and Cerium anomaly (Ce/Ce*) in Equation (5) after Worrall and Pearson [52].
after McLennan [51]
after Worrall and Pearson [52]
Similarly, the normalization of rare earth elements (REEs) utilizes the post-Archean Average Shale (PAAS) as the Equation (6).
after Kala, Turlapati [53].
5. Discussion
5.1. Paleo Depositional Environment
High-resolution elemental analyses have revealed paleo-productivity, paleo-salinity, paleo-water depth, paleo-redox conditions, and detrital influx within shales [3]. The dominance of quartz and significant clay minerals in sandstone indicate deposition in a fluvial or shallow marine environment with considerable reworking. Sedimentation in the Gondwana basin was initiated during the Early Permian over the Archean crystalline basement.
Hydrological differentiation, source composition, and chemical weathering influence the chemical composition of sedimentary suites. As sediments mature, quartz replaces feldspar and lithic fragments, leading to increased SiO2 and decreased Fe2O3, Al2O3, K2O, MgO, and CaO. These sediments are chemically classified (Figure 4a) as lithic arenite due to the dominance of silica in the matrix and cement fractions of the sandstones, based on the log (SiO2/Al2O3) versus log (Fe2O3/K2O) diagram [54]. Few sandstones fall into the Fe sand category due to their ferruginous nature (Figure 5a). The samples plotted on a K2O versus Na2O diagram as described by Crook [55] fall within the quartz abundance area, indicating quartz-rich shale and sandstones (Figure 5b). Among SiO2, CaO, and Al2O3, sandstones and shale samples have a variable enrichment of SiO2, as shown by the ternary plot of these major oxides (Figure 6a). The variation in the concentrations of minerals in various units of Gondwana is due to the different depositional environments. The dominance of illite followed by quartz in shale and sandstone indicates a source area rich in weathered feldspar and a significant input from continental crust materials. The highest concentration of illite (>50%) as clay minerals and 14%–20% of plagioclase in the shale refers to a shallow oxic deposition environment during the Gondwana deposition (Figure 5b). The depositional conditions suggest a range of redox environments, influenced by both glacial meltwater and fluvial systems, typically characterized by fluctuating redox states due to variations in sedimentation rates and organic matter input during glacial periods.
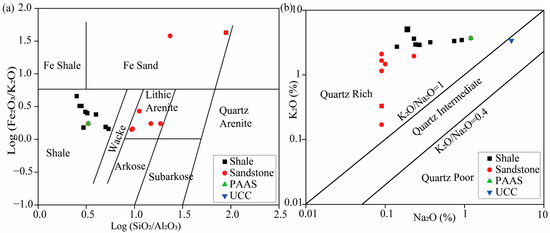
Figure 5.
(a) Chemical classification of the Gondwana and post-Gondwana shale and sandstone using major oxide data (log (Fe2O3/K2O) vs. log (SiO2/Al2O3)) after Herron [54] and (b) quartz richness analysis Na2O–K2O diagram after Crook [55].
The Upper Gondwana shale indicates a robust reducing depositional environment in anoxic settings with restricted water circulation, while the post-Gondwana showed an aquatic environment deposited at shallow sea level [26]. Alumina is a good measure of the detrital flux, and the positive correlation of TiO2 with Al2O3 (r2 = 0.741, Table 3) suggests a relatively constant detrital source. The Mn/TiO2 ratio is a reliable and widely accepted approach to evaluating depositional conditions [56]. The samples analyzed possess MnO/TiO2 ratios less than 0.5, suggesting a shallow marine or fluvial continental sedimentary environment. Sc/Cr ratio slope analysis [57] of the analyzed shale and sandstones in the Lower Gondwana samples show mixed influences. The coal seams and associated organic-rich sediments in the Amile Formation suggest deposition in a swampy, deltaic, or low-energy floodplain environment. These settings were influenced by alternating episodes of fluvial sedimentation and organic matter accumulation under humid conditions. The predominance of kaolinite reflects the intense chemical weathering of feldspar-rich source rocks in a tropical to subtropical climate. This result is identical to the past study that highlighted the humid paleoclimate and prolonged weathering in the source regions during the Late Cretaceous and Paleocene [58].
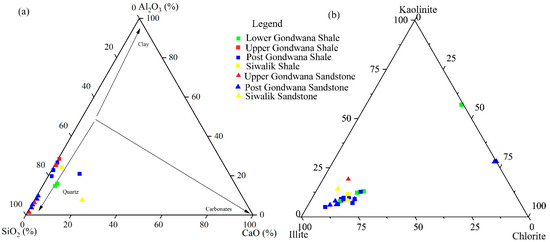
Figure 6.
(a) The Ternary diagram showing the major oxide concentration of shale and sandstones (SiO2-Al2O3-CaO) [59] and (b) Ternary diagram of the major clay mineral groups (Illite–Kaolinite–Chlorite) [60] of the different units of Gondwana and Siwalik.
In contrast, the Upper and the post-Gondwana samples reflect hydrothermal deposition. The Bhainskati Formation marks a transition to marine sedimentation typical of shallow marine environments. This formation exhibits characteristics aligned with more stable deposition conditions, where redox states may favor anoxic or suboxic conditions, especially in deeper marine settings. The environment shifts from the terrestrial, glacially influenced habitats of the Gondwana to a marine environment dominated by finer sediments, suggesting a shift to less turbulent hydrodynamic conditions [19]. This hydrothermal was evidenced by a linear correlation between the V/Cr and V/Sc ratios in shale samples from the Tansen area, reflecting changes in the redox environment. The V/Cr ratios range from 0.37–1.6, i.e., below 2 indicates oxic deposition conditions [61], suggesting that these sediments were deposited in an environment with well-oxygenated bottom waters, typical of shallow marine or continental settings. The Ga/Rb ratio is <0.28 for all shale samples, and only two sandstone samples exceed this value, suggesting a warm and arid climate [62] during deposition (Figure 7). The Sr/Cu ratio is also sensitive to climatic changes, and the Sr/Cu ratio in the Lower Gondwana samples is greater than 5 with a value of 5.04–5.34 (Table 2), indicating a warm–humid to dry and arid climate [63] during the deposition and indicates conditions with limited organic matter preservation, further supporting an oxic depositional environment. Furthermore, the post-Gondwana and the Siwalik shale samples are within 1.3 and 5.0, suggesting a warm-humid depositional environment. According to Sakai [19], the Bhainskati Formation was primarily deposited in a marine setting, transitioning into brackish and eventually freshwater environments as a result of regional regression. The sedimentary facies include organic-rich dark grey to black shales, minor sandstones, and siltstones. These deposits suggest transportation by suspension and turbidity currents in the deeper marine settings, with occasional contributions from fluvial and deltaic processes in shallower environments [19] that imply changes in sedimentation due to marine transgressions and regressions associated with tectonic activity and global sea-level changes. The petrographic characteristics of quartz grains suggest derivation from a predominantly granitic source with some contribution from metamorphic rocks. The presence of micas in sandstone signifies the weathering and erosional origin of pre-existing rocks, which were subsequently transported and deposited. The existence of authigenic mica reveals that they were formed in place during the diagenesis process. The distinct change in the depositional environment from marine to continental and the shift in sediment provenance from cratonic India to the Himalayan orogenic belt highlight the effects of orogenic activity and adjustments within the overall basin dynamics [21,31].
Some of the studies by DeCelles (2001, 2004) highlighted the role of the Himalayan tectonic uplift during the India–Asia collision in influencing sediment supply. The post-Gondwana Bhainskati Formation received sediments primarily from the unroofing of Proterozoic basement rocks and the Greater Himalayan Sequence. Fluvial systems likely delivered clastic material to a shallow marine shelf, where finer-grained sediments were deposited in relatively low-energy settings. The presence of organic-rich shales points to anoxic conditions during sediment deposition, further emphasizing the dominance of suspension transport mechanisms [21,29]. Clay minerals in the Bhainskati Formation provide valuable insights into the weathering processes and sediment provenance. Kaolinite in the upper portions of the Bhainskati Formation indicates intense chemical weathering under warm and humid conditions. Hematite and kaolinite-rich oxisols at the topmost layers suggest prolonged exposure to subaerial weathering during a phase of marine regression [19]. DeCelles (2004) elaborates on the clay mineral assemblages, noting contributions from weathered feldspathic and volcanic source rocks. The presence of illite and chlorite in the lower sections of the formation reflects moderate physical weathering of primary minerals, likely derived from the crystalline rocks of the rising Himalayas. As tectonic activity intensified and weathering conditions evolved, kaolinite enrichment in the upper stratigraphic levels marked a shift towards stronger chemical weathering processes [21]. The V/Cr ratios in the analyzed samples range from 0.37 to 1.60, indicating oxidizing conditions, as values below 2 suggest a more oxidizing environment [61].
The cerium anomaly (δCe) values range from 1.01 to 1.2 (Table 5), implying a slight positive anomaly, suggesting oxic conditions since values above 1 indicate aerated environments [63]. Additionally, the Rb/Sr ratio is higher than the PAAS, further supporting the notion of a warm and humid climate during the deposition of Gondwana shale alongside increased weathering intensity. Freshwater deposits are confirmed by the Sr/Ba ratios, which are consistently below 1 in all tested samples. The Sr/Ba ratios of the analyzed samples exhibit values less than 0.6 (Table 8), consistently noted in freshwater sediments, whereas marine sediments generally exceed values of 1.0 [64]. The high Sr/Ba ratio is suggested to reflect changes in water salinity (Sr/Ba < 0.6: freshwater; 0.6 < Sr/Ba < 1.0: transition; Sr/Ba > 1: saline water) [65]. Our results indicate that the analyzed samples are of a fresh to transitional state of salinity. The gas shale quality increases during periods of enhanced salinity in the bottom waters, leading to anoxic conditions. This indicates that the low TOC content in the analyzed samples is due to fresh water and shallow marine depositional environments during the deposition of the post-Gondwana Bhainskati Formation.
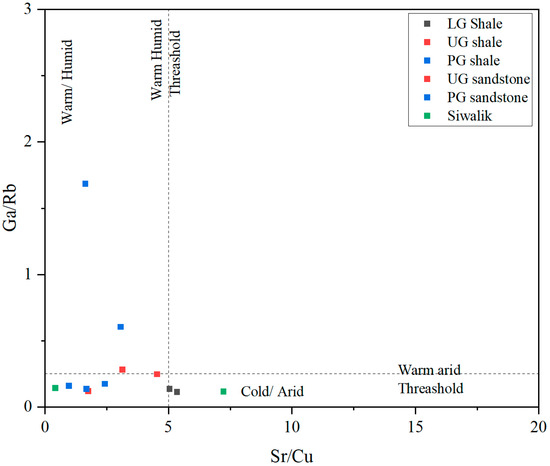
Figure 7.
A plot of Ga/Rb versus Sr/Cu ratios showing paleoclimatic conditions after Ding et al. [65]. LG, Lower Gondwana; PG, post-Gondwana; UG, Upper Gondwana.
The paleo-depositional environment of the Gondwana and post-Gondwana units within the Lesser Himalayas, Nepal, reflects a dynamic interplay of geological processes spanning millions of years. During the Permian period, glacial deposits formed in emergent basins at high southern latitudes, signaling a period of global climatic change. Over time, these glacial environments gave way to meandering fluvial systems characterized by the deposition of coal, shale, siltstone, and carbonaceous shale [37]. The Lower Gondwana unit was deposited within a continental rift valley (Figure 8a), and the Upper Gondwana reflected deposition in a passive continental margin setting. Aulis basalt with plagioclase porphyritic basalt repeatedly shows the eruption of volcanoes and erosion and sedimentation as fluvial beds (Figure 8b) during the late Jurassic to early Cretaceous [27,38]. Gondwana sediments are sourced from the Greater Himalayas and the Tethys Himalayas, or both of these units share the same source rocks, as there is a possibility of Indian affinity detritus in the Gondwana sequence [23]. At the same time, the post-Gondwana reflects a primary Himalayan provenance resulting from the collision of the Indian plate with the Eurasian plate (Figure 8e), further elucidating the tectonic influences on sediment deposition throughout the Gondwana units [28,66]. The post-Gondwana sediments represent the final marine sedimentary sequence in the southern Himalayas, suggesting a transition to terrestrial conditions driven by the Indo-Asian plate collision, leading to seawater’s westward retreat (Figure 8c). Eocene Foreland deposit has been interpreted as an indication of an aquatic environment allowing productive shallow sea level conditions [26]. The Eocene organic-rich shales and fossiliferous limestone, accumulated in a shallow-marine back-bulge depozone between a migrating fore bulge and the Indian craton [19,31], is probably deposited in extreme floodplains under tropical climatic conditions. Plant fossils in the post-Gondwana Bhainskati Formation point to a tropical rainforest climate during the Early and Middle Eocene, suitable for accumulating coaly source rocks.
Similarly, past studies reveal that the northern Indian shield provided the sole source of the Upper Gondwana, whereas the post-Gondwana reflects the Himalayan provenance (Figure 8d) [31]. A regional unconformity occurred during the Eocene-Oligocene transition, with the fluvial deposits overlapping the forebulge unconformity in the Early Miocene [31]. Significant erosion and quasi-plaining at the top of the Eocene Formation resulted from low-angle non-integration with the overlying Miocene Formation, characterized by meandering river deposits (Figure 8d).
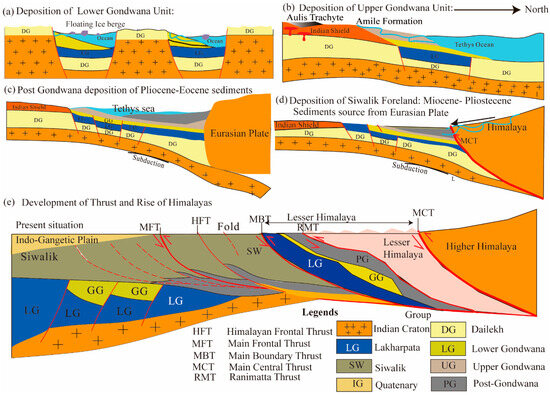
Figure 8.
Schematic deposition and tectonic sedimentary evolution model of different Gondwana units of the Nepal Himalayas. Depositional and sediment provenance model diagram (a–d) and (e) Tectonic model diagram showing the Gondwana and post-Gondwana units within the Lesser Himalaya and major thrusts, namely, Ranimatta Thrust RT, Main Central thrust MCT, Main Boundary Thrust MBT, and Main Frontal Thrust MFT in the Nepal Himalaya (modified from [67]).
5.2. Weathering and Its Impact on Sediment Composition
Chemical weathering significantly influences clay mineral formation, with montmorillonite transforming into illite as thermal maturity increases, eventually becoming a late diagenetic product [57]. The weathering history of the source area can be quantified through the CIA [46], PIA [14], and CIW [12,14,46]. Most shale and sandstone samples show illite dominance and supremacy of illite in the post-Gondwana sediments, reflecting the impact of Himalayan tectonic events (MCT/MBT) on nearby source rocks. Transport distance increases illite content while decreasing kaolinite along with the climate alternations. Shales enriched in trace metals and iron sulfides suggest sedimentary and terrigenous inputs [1], with high Fe2O3 content in the Upper and post-Gondwana units due to oxidative weathering. The Lower Gondwana shales have higher SiO2 than PAAS but lower than UCC, while Upper and post-Gondwana shales have lower SiO2 (Table 5) [48]. Al2O3, TiO2, and K2O align closely with PAAS and UCC. The K2O/Na2O ratio ranges from 3.76 to 19.70, higher than PAAS and UCC, suggesting Na substitution for K during later diagenesis and weathering [14] and migration during weathering. The CIA values of the Upper Gondwana (63–77) indicate moderate to intense weathering conditions [68] of the source rocks, while the post-Gondwana (70–90) experience higher weathering intensity under warm, humid conditions. The chemical alteration results with low CIA values in the Lower Gondwana samples may reflect cool and arid conditions during deposition (Figure 9a). This wide variation may be due to frequent climatic oscillations between warm-humid and semi-humid-semiarid conditions. Sandstones show higher SiO2 than shale and CIA values (77–91), indicating intensification weathering in source regions (Figure 4b). The ideal weathering trends (IWT) run parallel to the A–CN edge from pristine sources (CIA ~50). Data often diverge from IWT, trending towards illite–muscovite due to post-depositional K-metasomatism [14]. The CIA and CIW are interpreted similarly, with a value of 50 for fresh upper continental crust and about 100 for highly weathered materials with complete removal of alkali and alkaline-earth elements [6]. In our studies, the CIW values are higher than that of CIA and consistently increase for the younger deposits.
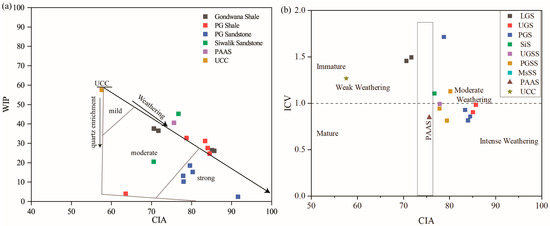
Figure 9.
(a) WIP versus CIA and (b) CIA versus ICV indicating maturity and intensity of weathering (after Cox, 1995) [69] (WIP: Weathering index of plagioclase; CIA: Chemical Index of weathering; ICV: Index of Compositional Variability).
The index of chemical variability (ICV) measures chemical weathering and identifies the compositional maturity of sediments based on alumina abundance relative to other oxides except silica [69]. Sediments with ICV values >1 are considered compositionally immature and originate from first-cycle processes in tectonically active environments. In contrast, sediments with ICV values <1 are classified as compositionally mature, indicating active recycling and significant weathering in tectonically stable or cratonic settings [69]. The Gondwana shale samples exhibit ICV values over 1, while the post-Gondwana shale samples range from 0.82 to 0.93, and most sandstone samples also show values above 1 (Table 5). These results suggest that the sediments are linked to alteration/weathering products like illite, chlorite, and kaolinite, deriving from tectonically active sources after active recycling for post-Gondwana sediments and mixed sources of Gondwana rocks. The dominance of quartz grains, along with a low presence of feldspars and rock fragments in the analyzed sandstones, indicates a prolonged period of intensive chemical weathering in a warm, humid climate. The combined ICV, CIA, and WIP values indicate moderate weathering at deposition for most samples (Figure 9). The ranges of CIA values for shale samples indicate early to vital chemical weathering stages, with sediments primarily losing Ca- and Na-bearing silicate minerals due to plagioclase weathering, highlighting that sediments are derived from parent rocks with compositions similar to UCC. The Plagioclase Index of Alteration (PIA) monitors the weathering of the plagioclase [14] in silicate rocks, as the mineral has a higher abundance in the clastic rocks derived from bare igneous rocks, and it also possesses a high dissolution nature. The PIA values are less than 50 in the Lower Gondwana and more significant in the Upper and the post-Gondwana, suggesting progressive weathering and alteration of feldspars, with more advanced weathering in the later periods. Sediments derived from intensely weathered sources fall near the Q apex with high MIA values (80–100), whereas incipiently weathered sediments plot at lower MIA (50–70), indicating variable weathering levels related to climatic influence. Gondwana shale samples exhibit lower MIA, indicating minimal weathering and cold and arid conditions [44], and the post-Gondwana shale has higher MIA (Table 2), probably due to intense chemical weathering in warm and humid conditions (Figure 3a).
Distribution patterns of major oxides normalized to PAAS values (Figure 10a) and normalized to UCC (Figure 10b) show different characteristics. Most oxides (Figure 9) have mean normalized values of less than 1, indicating extensive weathering and erosion. Comparing the proportions of the major elements with values obtained from PAAS shows that the studied shale samples are enriched in Fe2O3, MnO2, and TiO2 and highly deficient in Al2O3 and Na2O, more than the proportion of PAAS (Figure 10a). About 30% of Al2O3 and CaO and 80% of metallic oxides like Fe2O3, MnO2, and TiO2 in the studied shale samples are enriched when normalized to PAAS (Figure 10a). These findings suggest that the sedimentation during the post-Gondwana period potentially occurred in a dynamic environment characterized by variations in salinity and redox states, which influenced manganese and titanium distributions. Regarding titanium, its association with the clay fraction is well-established, often serving as an indicator of sediment provenance and injection intensity, especially sedimentation in the Himalayan regions. The high concentrations of titanium observed in our shales suggest significant contributions from terrigenous sediments, reflecting active weathering and erosion processes accompanying the tectonic movements in this region. Diagenetic processes cause the enrichment of Mn, Ti, and Ni in manganese deposits [70]. Meanwhile, the sandstone samples normalized with UCC exhibit different characteristics, i.e., enriched with Fe2O3, MnO2, and CaO is indicative of varied depositional environments [70]. Similarly, about 30% of the studied sandstone is enriched for Fe, Mn, and Ti oxides when normalized with UCC. In contrast, Al2O3, MgO, CaO, Na2O, K2O, and P2O5 in the study are deficient after normalization (Figure 10b).
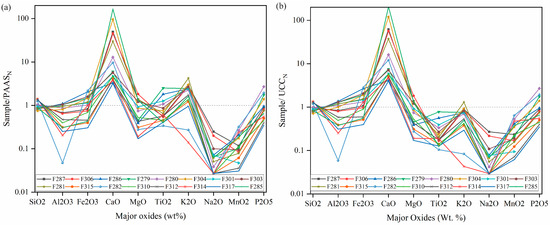
Figure 10.
(a) Distribution patterns of major oxides in samples normalized to PAAS values, (b) distribution patterns of major oxides in samples normalized to UCC values (normalizing values of UCC after Taylor and McLennan, 1985) [48] from the Tansen and Surkhet Basin.
5.3. Provenance and Tectonic Setting
The high percentage of quartz and the significant presence of plagioclase in the Gondwana and the post-Gondwana sandstone suggest a continental source, likely from weathered igneous rocks, such as granites or granodiorites, which further indicates a source area rich in weathered feldspar. The ternary plot of these oxides (Figure 6) shows a relationship between different units of Gondwana sediment deposition and diagenesis, particularly in the enrichment of SiO2 relative to Al2O3 and CaO, which implies the source variations in Gondwana and post-Gondwana deposits. REE is valuable for provenance studies and paleoenvironmental reconstructions [16,17]. The PAAS normalized REE distribution for the sediments shows nearly flat REE curves (Figure 11), whereas the chondrite normalization shows downward-sloping curves towards the La-Lu element (Figure 10b). The samples demonstrate negative europium anomalies concerning the Gondwana units. Eu depletion of comparable scale characterizes nearly all post-Archean sedimentary strata, suggesting the hallmark of an earlier event in a more reducing igneous environment than in the upper crust. Most post-Gondwana sandstone and shale samples show positive cerium anomalies, emphasizing an oxic depositional environment. The Gondwana (mainly Upper Gondwana) sandstone is sourced from an Indian basement craton, and the detritus in the post-Gondwana Formation was sourced from the Tethys Himalayan sediments, Asian Plate [23,32]. A recent study concluded that the source for Gondwana and post-Gondwana sequences must be the Greater Himalaya (or Tethys Himalaya) or the same source that provided sediments for the Greater Himalaya and the Tethys Himalaya [28].
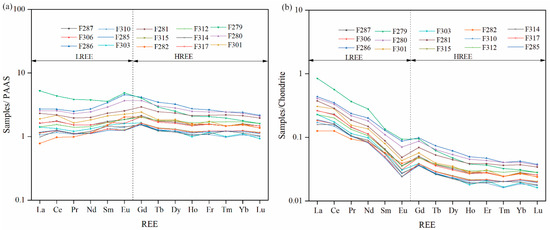
Figure 11.
(a) Distribution patterns of rare-earth elements in shales and sandstone samples from the Tansen and Surkhet Basin normalized to post-Archean Australian Shale (PAAS) values (normalizing values of PAAS after Condie, 1993) [71], (b) normalized to chondrite values (Chondrite normalization values from (Taylor and McLennan, 1985) [48].
The post-Gondwana sandstone samples display uniform patterns characterized by fractionated light rare earth elements (LREEs) with a LaN/SmN ratio ranging from 0.488 to 0.733 and heavy rare earth elements (HREEs) with a GdN/YbN ratio between 0.101 and 0.317. These samples show a negative europium (Eu) anomaly, with Eu/Eu* values ranging from 0.56 to 0.74 (average 0.6), indicating their derivation from a source area dominated by felsic rocks and minimal contributions from highly fractionated sources [6]. Moreover, the sample exhibits LREEs (6.80–20.81) and HREEs (8.367–21.14) with positive Eu anomaly (Figure 11a) normalized with PAAS and negative Eu anomaly normalized with chondrite (Figure 11b). The total rare earth elements (∑REE) exceeding 300 ppm further suggest that these shales primarily derive from felsic source rocks.
The high SiO2 content in post-Gondwana shale and sandstone and significant Fe2O3 and MnO concentrations indicate derivation from the continental crust and possible tectonic uplift and erosion. Na2O concentrations above 1% are likely due to plagioclase breakdown in the source region. K2O/Na2O ratios are lower (<5) in Gondwana and maximum (>10) in the post-Gondwana. The high K2O/Na2O ratios (3.76 to 19.70) suggest derivation from felsic rocks, likely granitic or gneissic, as these ratios are characteristic of source areas rich in K-feldspar and mica. The Al2O3/(Al2O3 + Fe2O3) ratio of the shale samples ranges from 0.64 to 0.95, with an average of 0.88, indicating sedimentation in a continental margin. The Al2O3/TiO2 ratio serves as a provenance index, with values spanning from 8 to 21 wt.%. The range suggests a predominant felsic to intermediate source (Figure 12a), consistent with sediments from a continental arc or active continental margin [72]. The tectonic environment of sedimentary rocks significantly impacts their clastic components. Clastic rocks contain various geochemical components that may have come from different tectonic settings [62]. Plotting TiO2 and Zr ratios of the sandstone and shale in the Lower Gondwana confirms the felsic source. In contrast, the Upper to post-Gondwana shale supports felsic to intermediate igneous rock as the source of clastic input (Figure 12b).
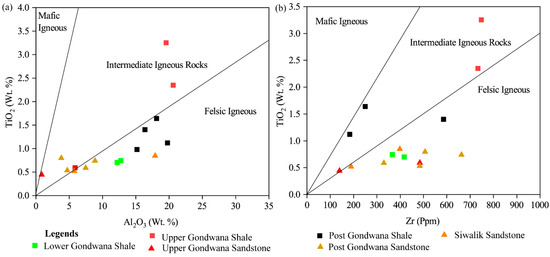
Figure 12.
(a) TiO2 versus Al2O3 and (b) TiO2 versus Zr (after McLennan et al. 1993) [6].
The interplay between tectonism and depositional systems significantly influences the geochemical compositions of sediments [6]. Active tectonism with steep slopes enables rapid sediment discharge, while tectonic quiescence with gentler slopes allows longer residence times and more weathering during transport. The REE abundances in source rocks and the weathering conditions in source areas are the major factors controlling the REE in the accumulating sediments. Hence, REE in clastic sedimentary rocks is widely used as the primary indicator to identify the provenance [18]. The La-Th-Sc discriminant diagram distinguishes between continental and oceanic island arcs, while the Th-Sc-Zr/10 diagram differentiates active from passive continental margins [18]. Plotting all shale and sandstone samples from the Gondwana and the post-Gondwana units on a La-Th-Sc (Figure 13a) discrimination ternary plot reveals that the sandstone source areas predominantly derive from Oceanic Island Arc (OIA) and Th-Sc-Zr/10 (Figure 13b) indicate mixed source sandstones mainly from Oceanic Island Arc and shale from Continental Island Arc.
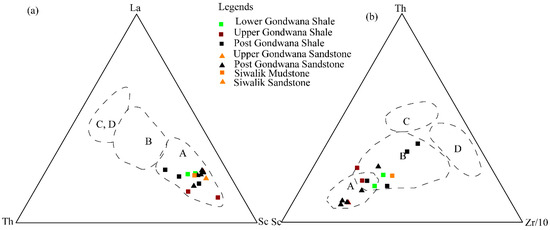
Figure 13.
(a) Tectonic discriminating diagrams of shale and sandstones for all units of Gondwana and Siwaliks. (a) La-Th-Sc ternary plot of shale and sandstones (b) Th-Sc-Zr/10 ternary diagram, after Bhatia and Crook (1986) [18]. A: Oceanic Island Arc; B = Continental Island Arc; C = Active Continental Margin; D = Passive Margin.
Like the Th/Sc ratios, the La/Sc ratios (Table 8) mainly lie within the felsic rock range (2.5–16.3) [12], indicating mixed sources with a dominant felsic contribution. Specifically, the La/Sc ratios range from 0.33 to 11.51, averaging 4.20 (Table 8), suggesting contributions from felsic sources. The tectonic setting (Figure 14a) can be revealed using a log K2O/Na2O vs. SiO2 (a) discriminant diagram [15] and discriminant function diagram (Figure 14b) [73], which indicates that the analyzed samples are from the active continental margins (Figure 14).
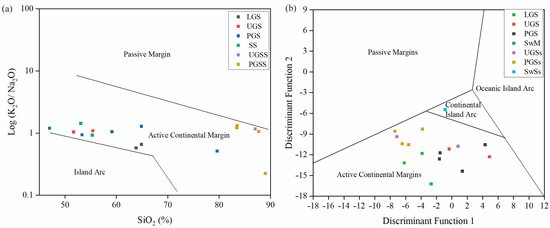
Figure 14.
Major element tectonic setting discrimination diagrams for shales and sandstones: (a) Log (K2O/Na2O) versus SiO2, after Roser and Korsch [15]; (b) discriminant function diagram, after Bhatia [74].
5.4. Organic Matter Enrichment and Preservation
Organic matter preservation and enrichment in shale are primarily influenced by redox conditions, paleoclimate, depositional environments, and tectonic settings. Submarine hydrothermal activity, warm and humid climates, and suboxic to anoxic conditions contribute significantly to organic richness. For instance, the Gondwanan basins transition from glaciomarine deposits in high-latitude areas to Permian fluvial systems consisting of coal, shale, siltstone, and carbonaceous shale [37], with climate fluctuations affecting facies composition [74]. Trace elements like Ni and Cu, often associated with OM, indicate high primary productivity and OM flux under reducing conditions [4]. The presence of these elements in the post-Gondwana shale is higher than in the Gondwana shale (Table 7), especially alongside high barium concentrations, highlighting significant OM deposition in marine settings due to nutrient influx from hydrothermal activity [63]. V/(V + Ni) ratios in the analyzed samples range from 0.49 to 0.87, indicating dysoxic to anoxic conditions [17] during the deposition (Figure 15), except for one sample from the Gondwana unit (Table 8). The post-Gondwana Eocene shale is enriched with vanadium or nickel, suggesting algal-derived organic matter encountered anaerobic conditions early in its settling, enhancing the preservation and enrichment of organic matter during this depositional environment. The low V/Cr ratios (<2) and Sr/Cu values (>5) indicate an oxic depositional climate less favorable for the preservation of organic matter due to oxidative degradation. The result of the analyzed samples (Table 8) suggests that the paleo depositional environment fluctuates regularly from shallow marine to fluvial during the deposition of post-Gondwana deposits.
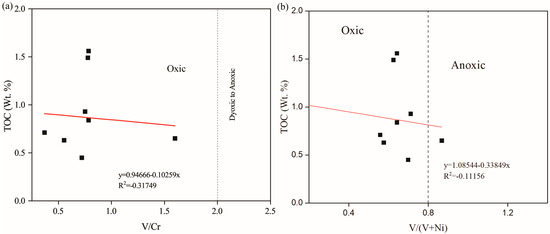
Figure 15.
Cross-plots of (a) TOC against redox condition proxies of trace element (V/Cr) ratio and (b) TOC versus V/(V + Ni) indicating negative correlation coefficient (after Hatch and Leventhal [17]).
The post-Gondwana, Bhainskati Formation experienced rapid and frequent transgressions and regressions, leading to sedimentary changes and multi-layer thin coal seams [19]. The organic matter primarily derives from marine organisms like sponges and diatoms, leading to the initial formation of organic-rich shale. The northward shift of the Indian plates enhances hydrothermal fluid upwelling, further contributing to black shale formation during the post-Gondwana deposit. Although long-term transgressions reduced productivity, their initial impact fostered conditions that favored OM preservation. Moderate Ba/Sr ratios indicate fluctuating productivity and preservation conditions, particularly in marine-influenced settings. Previous analyses in the same area reveal a TOC content ranging from 0.40% to 2.80% across various shale samples in the post-Gondwana [68]. However, in the present study, the TOC of 11 samples ranging from 0.56 to 1.56% indicates low to moderate organic carbon content (Table 2), amplifying predominantly continental sources of organic matter. The better preservation of OM in post-Gondwana shallow marine shales above 1% of TOC, enriched with clay minerals, contrasts with the lower preservation rates in the Gondwana fluvial shales. These higher clays protect the organic matter from decay and enhance preservation [1]. The depositional environment was primarily oxic with moderate preservation of organic matter, consistent with terrestrial and shallow marine settings during post-Gondwana deposition.
The tectonic activity associated with the Himalayan orogeny has played a crucial role in influencing the maturity of organic matter within both Gondwana and post-Gondwana shales. Due to significant burial depths and intense tectonic stress during this period, the organic matter has undergone considerable thermal alteration, reaching an over-mature stage suitable for shale gas generation. Previous studies on vitrinite reflectance (Ro%) of the analyzed samples from this area indicate a range of 1%–3%, suggesting that the samples are in the mature to overmature stage. Additionally, the pyrolysis results reveal a type III kerogen, which is conducive to dry gas generation [75]. As the Himalayas were exhumed, numerous local structural features emerged along the orogenic belt, substantially affecting the post-Gondwana shales. The development of various tectonic structures following the deposition of post-Gondwana shales, notably the Main Central Thrust (MCT), Main Boundary Thrust (MBT), Ranimatta Thrust (RT), along with local faults and folds, had a profound impact on geological conditions (Figure 8e). The overturning associated with the MBT and RT resulted in the creation of submerged tectonic traps, significantly increasing the source rocks’ burial depth. This alteration provided optimal conditions for the thermal maturation of hydrocarbons in areas like Tansen and Surkhet. Moreover, the activation of the MBT and the occurrence of local structural features have thrust the Gondwana and post-Gondwana strata within the Lesser Himalayan zone. This thrusting has transformed primary oil and gas reservoirs into secondary reservoirs, enhancing their potential for resource extraction [67]. The geological and tectonic activity, coupled with the favorable mineralogical composition of the post-Gondwana shale, is a prospective target for unconventional gas exploration in the Lesser Himalayan region.
6. Conclusions
The geochemical and mineralogical characteristics of shales and sandstones from Gondwana and post-Gondwana units in the Tansen and Surkhet basins exhibit distinct variations in mineral content and depositional environment.
- The petrographic analysis of the Gondwana shale contains liptinite macerals, suggesting lacustrine environments, whereas vitrinite in the Eocene suggests a substantial contribution from terrestrial plants to organic matter deposition in marine environments. The Upper and post-Gondwana sandstone samples exhibit more quartz over feldspar and plagioclase. The quartz grains are sub-angular to rounded, suggesting a moderate degree of transportation and abrasion before lithification;
- In the Gondwana unit, quartz and plagioclase are prominent, especially within the sandstones, which indicates a significant influx of clastic material. In contrast, the post-Gondwana unit predominates illite as the primary clay mineral, reflecting intense weathering at the source. SiO2 is the most abundant major element, followed by Al2O3 across the Gondwana and the post-Gondwana units. The CIA values of the analyzed samples exceed those of the PAAS, indicating moderate to extreme weathering of the source area;
- The geochemical analysis demonstrated through ratios and plots, such as La-Th-Sc, suggests that these sediments were predominantly derived from weathered rocks, with a significant contribution from granitic sources. The pronounced enrichment of LREE relative to HREE further supports a felsic provenance. The sedimentary records reveal variation in the paleo-depositional environment over geological time and the movement of the Indian plate towards the Eurasian plate;
- The elemental ratios analyzed suggest an oxic, dry, and cold climate during the deposition of the Lower Gondwana sediments, transitioning to a warmer environment during the deposition of the Upper and post-Gondwana units. This climatic shift is evidenced in preserving organic matter, with Gondwana shale displaying low TOC, attributed to oxic conditions and dilution by terrestrial inputs in contrast to the post-Gondwana shales. This result concludes that shales were primarily deposited in shallow marine environments and predominantly continental sources of organic matter. These findings suggest the shales are poorly enriched and have poor preservation of organic matter in the Gondwana shales compared to the post-Gondwana counterparts, aligning with deposition in an oxic environment;
- The paleo-depositional environment of the Gondwana and post-Gondwana units in the Lesser Himalayas of Nepal reveals a complex interplay of geological processes and climatic shifts. The Lower Gondwana was deposited in a continental rift valley, while the Upper Gondwana represents a passive continental margin. Gondwana sediments are predominantly sourced from the Greater and the Tethys Himalayas, with evidence of Indian-affinity detritus. In contrast, the post-Gondwana sediments primarily reflect the Himalayan provenance arising from the continental–continental collision;
- The tectonic evolution of the Himalayas has significantly influenced the sediment source and depositional processes in the post-Gondwana deposits. The organic matter in these sediments is highly matured and prone to gas generation, attributed to the Himalayan tectonism. The shifts in tectonic activity and related erosion and weathering patterns have profoundly impacted the sediment composition and organic matter preservation observed in these sequences.
Author Contributions
Conceptualization, K.K. and S.H.; methodology, K.K.; software, K.K., J.H., S.B. and D.M.; validation, K.K., S.S., S.H. and U.B.; formal analysis, K.K.; investigation, K.K.; resources, S.S. and S.H.; data curation, K.K. and J.H.; writing—original draft preparation, K.K.; writing—review and editing, S.S., S.H. and U.B.; visualization, K.K.; supervision, S.S.; project administration, S.S.; funding acquisition, S.S, S.H. and U.B. All authors have read and agreed to the published version of the manuscript.
Funding
This research was funded by the “BELT AND ROAD” INNOVATION COOPERATION PROJECT OF JIANGSU PROVINCE (Grant No. BZ2022015) and the NATIONAL NATURAL SCIENCE FOUNDATION OF CHINA (No. 42030810). Author U. Baral is partially supported by the INTERNATIONAL PARTNERSHIP PROGRAM OF THE CHINESE ACADEMY OF SCIENCES (Grant/Award Number: 131551KYSB20200021).
Data Availability Statement
All the data supporting the reported results provided in the table were generated during the study.
Acknowledgments
We acknowledge the Department of Mines and Geology, Nepal, for geological fieldwork permission and sample shipping. We also acknowledge the Laboratory of Guizhou Coal Field Geological Bureau, Guizhou, China, for its support in the laboratory analysis.
Conflicts of Interest
The authors declare no conflicts of interest. The funders had no role in the design of the study; in the collection, analyses, or interpretation of data; in the writing of the manuscript; or in the decision to publish the results.
References
- Ross, D.J.K.; Bustin, R.M. Investigating the use of sedimentary geochemical proxies for paleoenvironment interpretation of thermally mature organic-rich strata: Examples from the Devonian–Mississippian shales, Western Canadian Sedimentary Basin. Chem. Geol. 2009, 260, 1–19. [Google Scholar] [CrossRef]
- Zhang, L.; Dong, D.; Qiu, Z.; Wu, C.; Zhang, Q.; Wang, Y.; Liu, D.; Deng, Z.; Zhou, S.; Pan, S. Sedimentology and geochemistry of Carboniferous-Permian marine-continental transitional shales in the eastern Ordos Basin, North China. Palaeogeogr. Palaeoclimatol. Palaeoecol. 2021, 571, 110389. [Google Scholar] [CrossRef]
- Algeo, T.J.; Liu, J. A re-assessment of elemental proxies for paleoredox analysis. Chem. Geol. 2020, 540, 119549. [Google Scholar] [CrossRef]
- Algeo, T.J.; Kuwahara, K.; Sano, H.; Bates, S.; Lyons, T.; Elswick, E.; Hinnov, L.; Ellwood, B.; Moser, J.; Maynard, J.B. Spatial variation in sediment fluxes, redox conditions, and productivity in the Permian–Triassic Panthalassic Ocean. Palaeogeogr. Palaeoclimatol. Palaeoecol. 2011, 308, 65–83. [Google Scholar] [CrossRef]
- Lev, S.M.; Filer, J.K.; Tomascak, P. Orogenesis vs. diagenesis: Can we use organic-rich shales to interpret the tectonic evolution of a depositional basin? Earth-Sci. Rev. 2008, 86, 1–14. [Google Scholar] [CrossRef]
- McLennan, S.M.; Hemming, S.; McDaniel, D.K.; Hanson, G.N. Geochemical approaches to sedimentation, provenance, and tectonics. Geol. Soc. Am. 1993, 284, 21–40. [Google Scholar]
- Cox, G.M.; Jarrett, A.; Edwards, D.; Crockford, P.W.; Halverson, G.P.; Collins, A.S.; Poirier, A.; Li, Z.-X. Basin redox and primary productivity within the Mesoproterozoic Roper Seaway. Chem. Geol. 2016, 440, 101–114. [Google Scholar] [CrossRef]
- Liu, P.; Liu, C.; Guo, R. Depositional Environment and Organic Matter Enrichment in the Lower Paleozoic Shale from the Northeastern Margin of the Yangtze Platform, South China. J. Mar. Sci. Eng. 2023, 11, 501. [Google Scholar] [CrossRef]
- Li, Y.; Zhang, T.; Ellis, G.S.; Shao, D. Depositional environment and organic matter accumulation of Upper Ordovician–Lower Silurian marine shale in the Upper Yangtze Platform, South China. Palaeogeogr. Palaeoclimatol. Palaeoecol. 2017, 466, 252–264. [Google Scholar] [CrossRef]
- Rimmer, S.M. Geochemical paleoredox indicators in Devonian–Mississippian black shales, Central Appalachian Basin (USA). Chem. Geol. 2004, 206, 373–391. [Google Scholar] [CrossRef]
- Moradi, A.V.; Sarl, A.; Akkaya, P. Geochemistry of the Miocene oil shale (Hançili Formation) in the Çankırı-Çorum Basin, Central Turkey: Implications for paleoclimate conditions, source–area weathering, provenance and tectonic setting. Sed. Geol. 2016, 341, 289–303. [Google Scholar] [CrossRef]
- Cullers, R.L. The controls on the major-and trace-element evolution of shales, siltstones and sandstones of Ordovician to Tertiary age in the Wet Mountains region, Colorado, USA. Chem. Geol. 1995, 123, 107–131. [Google Scholar] [CrossRef]
- Nesbitt, H.; Young, G. Prediction of some weathering trends of plutonic and volcanic rocks based on thermodynamic and kinetic considerations. Geochim. Et Cosmochim. Acta 1984, 48, 1523–1534. [Google Scholar] [CrossRef]
- Fedo, C.M.; Nesbitt, H.W.; Young, G.M. Unraveling the effects of potassium metasomatism in sedimentary rocks and paleosols, with implications for paleoweathering conditions and provenance. Geology 1995, 23, 921–924. [Google Scholar] [CrossRef]
- Roser, B.P.; Korsch, R.J. Determination of Tectonic Setting of Sandstone-Mudstone Suites Using SiO2 Content and K2O/Na2O Ratio. J. Geol. 1986, 94, 635–650. [Google Scholar] [CrossRef]
- Piper, D.Z. Seawater as the source of minor elements in black shales, phosphorites and other sedimentary rocks. Chem. Geol. 1994, 114, 95–114. [Google Scholar] [CrossRef]
- Hatch, J.; Leventhal, J. Leventhal, Relationship between inferred redox potential of the depositional environment and geochemistry of the Upper Pennsylvanian (Missourian) Stark Shale Member of the Dennis Limestone, Wabaunsee County, Kansas, U.S.A. Chem. Geol. 1992, 99, 65–82. [Google Scholar] [CrossRef]
- Bhatia, M.R.; Crook, K.A.W. Trace element characteristics of graywackes and tectonic setting discrimination of sedimentary basins. Contrib. Mineral. Petrol. 1986, 92, 181–193. [Google Scholar] [CrossRef]
- Sakai, H. Geology of the Tansen Group of the Lesser Himalaya in Nepal; Series D Geology (25); Memoirs of the Faculty of Science Kyushu University: Fukuoka, Japan, 1983; pp. 27–74. [Google Scholar]
- Valdiya, K.S. Himalaya, the Northern Frontier of East Gondwanaland. Gondwana Res. 1997, 1, 3–9. [Google Scholar] [CrossRef]
- DeCelles, P.; Gehrels, G.; Najman, Y.; Martin, A.; Carter, A.; Garzanti, E. Detrital geochronology and geochemistry of Cretaceous–Early Miocene strata of Nepal: Implications for timing and diachroneity of initial Himalayan orogenesis. Earth Planet. Sci. Lett. 2004, 227, 313–330. [Google Scholar] [CrossRef]
- Neupane, B.; Zhao, J.; Gyawali, B.R.; Deng, Y.; Maharjan, B.; Nepal, R. Depositional environment of Upper Paleocene—Middle Eocene series of the Lesser Himalaya, Central Nepal. Lithos 2021, 388–389, 106060. [Google Scholar] [CrossRef]
- Baral, U.; Lin, D.; Chamlagain, D.; Qasim, M.; Paudayal, K.N.; Neupane, B. Detrital zircon U-Pb ages, Hf isotopic constraints, and trace element analysis of Upper Cretaceous-Neogene sedimentary units in the Western Nepal Himalaya: Implications for provenance changes and India-Asia collision. Geol. J. 2019, 54, 120–132. [Google Scholar] [CrossRef]
- Neupane, B.; Ju, Y.; Allen, C.M.; Das Ulak, P.; Han, K. Petrography and provenance of Upper Cretaceous—Palaeogene sandstones in the foreland basin system of Central Nepal. Int. Geol. Rev. 2018, 60, 135–156. [Google Scholar] [CrossRef]
- Sitaula, R.P. Petrofacies and Paleotectonic evolution of Gondwanan and Post Gondwanan sequences of Nepal, in Auburn University. Ph.D. Thesis, Auburn University, Auburn, AL, USA, 2009; p. 206. [Google Scholar]
- Khatri, D.B.; Zhang, W.; Fang, X.; Meng, Q.; Zhang, T.; Zhang, D.; Paudayal, K.N. Rock Magnetism of Late Cretaceous to Middle Eocene Strata in the Lesser Himalaya, Western Nepal: Inferences Regarding the Paleoenvironment. Front. Earth Sci. 2021, 9, 744063. [Google Scholar] [CrossRef]
- Bhandari, S.; Xiao, W.; Ao, S.; Windley, B.F.; Zhu, R.; Li, R.; Wang, H.Y.; Esmaeili, R. Rifting of the northern margin of the Indian craton in the Early Cretaceous: Insight from the Aulis Trachyte of the Lesser Himalaya (Nepal). Lithosphere 2019, 11, 643–651. [Google Scholar] [CrossRef]
- Bhandari, S.; Xiao, W.; Ao, S.; Windley, B.F.; Li, R.; Esmaeili, R. Detrital geochronology of the Gondwana sequence of the Lesser Himalaya of the Nepal Himalaya. Geol. J. 2018, 54, 3909–3920. [Google Scholar] [CrossRef]
- DeCelles, P.G.; Robinson, D.M.; Quade, J.; Ojha, T.P.; Garzione, C.N.; Copeland, P.; Upreti, B.N. Stratigraphy, structure, and tectonic evolution of the Himalayan fold-thrust belt in western Nepal. Tectonics 2001, 20, 487–509. [Google Scholar] [CrossRef]
- DeCelles, P.G.; Gehrels, G.E.; Quade, J.; LaReau, B.; Spurlin, M. Tectonic Implications of U-Pb Zircon Ages of the Himalayan Orogenic Belt in Nepal. Science 2000, 288, 497–499. [Google Scholar] [CrossRef]
- DeCelles, P.G.; Gehrels, G.E.; Quade, J.; Ojha, T.P. Eocene-Early Miocene foreland basin development and the history of Himalayan thrusting, western and central Nepal. Tectonics 1998, 17, 741–765. [Google Scholar] [CrossRef]
- DeCelles, P.G.; Kapp, P.; Gehrels, G.E.; Ding, L. Paleocene-Eocene foreland basin evolution in the Himalaya of southern Tibet and Nepal: Implications for the age of initial India-Asia collision. Tectonics 2014, 33, 824–849. [Google Scholar] [CrossRef]
- DeCelles, P.G.; Carrapa, B.; Ojha, T.P.; Gehrels, G.E.; Collins, D. Structural and Thermal Evolution of the Himalayan Thrust Belt in Midwestern Nepal; Geological Society of America: Boulder, CO, USA, 2020; pp. 1–79. [Google Scholar]
- Dhital, M. Geology of the Nepal Himalaya. Regional Geology Reviews, Regional Perspective of the Classic Collided Orogen; Oberhänsli, R., Wit, M.J.D., Roure, F.M., Eds.; Springer: Berlin/Heidelberg, Germany, 2015; Volume 1, p. 499. [Google Scholar]
- Robinson, D.M.; McQuarrie, N. Pulsed deformation and variable slip rates within the central Himalayan thrust belt. Lithosphere 2012, 4, 449–464. [Google Scholar] [CrossRef]
- Bashyal, R.P. Gondwana Formations of Nepal Himalayas and Their Regional Significance. Gondwana Res. 2001, 4, 572–573. [Google Scholar] [CrossRef]
- Dutta, P. Gondwana Lithostratigraphy of Peninsular India. Gondwana Res. 2002, 5, 540–553. [Google Scholar] [CrossRef]
- Sakai, H.; Hamamoto, R.; Arita, K. Radiometric Ages of the Alkaline Volcanic Rocks from the Upper Gondwana of the Lesser Himalayas, Western Central Nepal and their tectonic significance. In Bulletin of the Department of Geology; Tribhuvan University: Kathmandu, Nepal, 1992; Volume 2, pp. 65–74. [Google Scholar]
- Sakai, H. Rifting of the Gondwanaland and Uplifting of the Himalayas recorded in Mesozoic and Tertiary Fluvial sediments in Nepal Himalaya. In Sedimentary Facies in the Active Plate Margin; Terra Scientific Publishing Company: Denver, CO, USA, 1989. [Google Scholar]
- Kayastha, N.B. Stratigraphy of the lower tertiary rocks of Nepal Himalaya. J. Nepal Geol. Soc. 1992, 8, 21–30. [Google Scholar] [CrossRef]
- Littke, R.; Urai, J.L.; Uffmann, A.K.; Risvanis, F. Reflectance of dispersed vitrinite in Palaeozoic rocks with and without cleavage: Implications for burial and thermal history modeling in the Devonian of Rursee area, northern Rhenish Massif, Germany. Int. J. Coal Geol. 2012, 89, 41–50. [Google Scholar] [CrossRef]
- Huang, Y.; Zhang, J.; Zhang, P.; Tang, X.; Liu, C. Characteristics of Pyrite in Shale and Its Application in Shale Gas Enrichment Evaluation─a Case Study of Longmaxi Shales in the Xiang’exi Depression, China. Energy Fuels 2023, 37, 11942–11954. [Google Scholar] [CrossRef]
- Sang, Q.; Zhang, S.; Li, Y.; Dong, M.; Bryant, S. Determination of organic and inorganic hydrocarbon saturations and effective porosities in shale using vacuum-imbibition method. Int. J. Coal Geol. 2018, 200, 123–134. [Google Scholar] [CrossRef]
- Roy, D.K.; Roser, B.P. Climatic control on the composition of Carboniferous–Permian Gondwana sediments, Khalaspir basin, Bangladesh. Gondwana Res. 2013, 23, 1163–1171. [Google Scholar] [CrossRef]
- Wang, Z.; Wang, J.; Fu, X.; Feng, X.; Wang, D.; Song, C.; Chen, W.; Zeng, S. Petrography and geochemistry of upper Triassic sandstones from the Tumengela Formation in the Woruo Mountain area, North Qiangtang Basin, Tibet: Implications for provenance, source area weathering, and tectonic setting. Isl. Arc. 2017, 26, e12191. [Google Scholar] [CrossRef]
- Nesbitt, H.W.; Young, G.M. Early Proterozoic climates and plate motions inferred from major element chemistry of lutites. Nature 1982, 299, 715–717. [Google Scholar] [CrossRef]
- Gromet, L.P.; Haskin, L.A.; Korotev, R.L.; Dymek, R.F. The North American shale composite: Its compilation, major and trace element characteristics. Geochim. Et Cosmochim. Acta 1984, 48, 2469–2482. [Google Scholar] [CrossRef]
- Taylor, S.R.; McLennan, S.M. The Continental Crust: Its Composition and Evolution; Blackwell Scientific Publications: Oxford, UK, 1985. [Google Scholar]
- Berger, A.; Janots, E.; Gnos, E.; Frei, R.; Bernier, F. Rare earth element mineralogy and geochemistry in a laterite profile from Madagascar. Appl. Geochem. 2014, 41, 218–228. [Google Scholar] [CrossRef]
- Tao, S.; Shan, Y.; Tang, D.; Xu, H.; Li, S.; Cui, Y. Mineralogy, major and trace element geochemistry of Shichanggou oil shales, Jimusaer, Southern Junggar Basin, China: Implications for provenance, palaeoenvironment and tectonic setting. J. Pet. Sci. Eng. 2016, 146, 432–445. [Google Scholar] [CrossRef]
- McLennan, S.M. Rare earth elements in sedimentary rocks; influence of provenance and sedimentary processes. Rev. Mineral. Geochem. 1989, 21, 169–200. [Google Scholar]
- Worrall, F.; Pearson, D. Water-rock interaction in an acidic mine discharge as indicated by rare earth element patterns. Geochim. Et Cosmochim. Acta 2001, 65, 3027–3040. [Google Scholar] [CrossRef]
- Kala, S.; Turlapati, V.Y.; Devaraju, J.; Rasheed, M.; Sivaranjanee, N.; Ravi, A. Impact of sedimentary environment on pore parameters of thermally mature Permian shale: A study from Kommugudem Formation of Krishna Godavari Basin, India. Mar. Pet. Geol. 2021, 132, 105236. [Google Scholar] [CrossRef]
- Herron, M.M. Geochemical classification of terrigenous sands and shales from core or log data. J. Sediment. Res. 1988, 58, 820–829. [Google Scholar]
- Crook, K.A.W. Lithogenesis and Geotectonics: The Significance of Compositional Variation in Flysch Arenites (Graywackes); SEPM: Claremore, OK, USA, 1974. [Google Scholar]
- Wang, J.; Qiao, Z. Study on the material source and enrichment mechanism of REE-rich phosphorite in Zhijin, Guizhou. Sci. Rep. 2024, 14, 6474. [Google Scholar] [CrossRef] [PubMed]
- Yang, X.; Lei, Y.; Zhang, J.; Chen, S.; Chen, L.; Zhong, K.; He, L.; Li, D.; Wu, Q. Depositional environment of shales and enrichment of organic matters of the Lower Cambrian Niutitang Formation in the Upper Yangtze Region. Nat. Gas Ind. B 2021, 8, 666–679. [Google Scholar] [CrossRef]
- Najman; Bickle; Chapman. Early Himalayan exhumation: Isotopic constraints from the Indian foreland basin. Terra Nova 2000, 12, 28–34. [Google Scholar] [CrossRef]
- Riccardi, M.; Messiga, B.; Duminuco, P. An approach to the dynamics of clay firing. Appl. Clay Sci. 1999, 15, 393–409. [Google Scholar] [CrossRef]
- Chen, Q.; Liu, Z.; Kissel, C. Clay mineralogical and geochemical proxies of the East Asian summer monsoon evolution in the South China Sea during Late Quaternary. Sci. Rep. 2017, 7, 42083. [Google Scholar] [CrossRef] [PubMed]
- Jones, B.; Manning, D.A. Comparison of geochemical indices used for the interpretation of palaeoredox conditions in ancient mudstones. Chem. Geol. 1994, 111, 111–129. [Google Scholar] [CrossRef]
- Tan, J.; Jiang, Y.; Li, X.; Ji, C.; Gu, Y.; Wang, Z. Paleoenvironment of marine-continental transitional shales in the lower Permian Shanxi formation, southeastern Ordos Basin, China. Energy Geosci. 2024, 5, 100261. [Google Scholar] [CrossRef]
- Xie, G.; Shen, Y.; Liu, S.; Hao, W. Trace and rare earth element (REE) characteristics of mudstones from Eocene Pinghu Formation and Oligocene Huagang Formation in Xihu Sag, East China Sea Basin: Implications for provenance, depositional conditions and paleoclimate. Mar. Pet. Geol. 2018, 92, 20–36. [Google Scholar] [CrossRef]
- Ding, J.; Zhang, J.; Tang, X.; Huo, Z.; Han, S.; Lang, Y.; Zheng, Y.; Li, X.; Liu, T. Elemental Geochemical Evidence for Depositional Conditions and Organic Matter Enrichment of Black Rock Series Strata in an Inter-Platform Basin: The Lower Carboniferous Datang Formation, Southern Guizhou, Southwest China. Minerals 2018, 8, 509. [Google Scholar] [CrossRef]
- Xu, J.; Liu, Z.; Bechtel, A.; Meng, Q.; Sun, P.; Jia, J.; Cheng, L.; Song, Y. Basin evolution and oil shale deposition during Upper Cretaceous in the Songliao Basin (NE China): Implications from sequence stratigraphy and geochemistry. Int. J. Coal Geol. 2015, 149, 9–23. [Google Scholar] [CrossRef]
- Van Hinsbergen, D.J.; Lippert, P.C.; Dupont-Nivet, G.; McQuarrie, N.; Doubrovine, P.V.; Spakman, W.; Torsvik, T.H. Greater India Basin hypothesis and a two-stage Cenozoic collision between India and Asia. Proc. Natl. Acad. Sci. USA 2012, 109, 7659–7664. [Google Scholar] [CrossRef]
- Ping, Y.; Tan, F.W.; Shi, M.F.; Wang, Z.H.; Li, Z.X.; Zhan, W.Z.; Rajaure, S.; Tripathi, G.N. Oil-source correlation and hydrocarbon accumulation in the Lesser Himalayan belt of Nepal. Acta Geol. Sin. 2021, 95, 3426–3441. [Google Scholar]
- Bai, Y.; Liu, Z.; Sun, P.; Liu, R.; Hu, X.; Zhao, H.; Xu, Y. Rare earth and major element geochemistry of Eocene fine-grained sediments in oil shale- and coal-bearing layers of the Meihe Basin, Northeast China. J. Asian Earth Sci. 2015, 97, 89–101. [Google Scholar] [CrossRef]
- Cox, R.; Lowe, D.R.; Cullers, R. The influence of sediment recycling and basement composition on evolution of mudrock chemistry in the southwestern United States. Geochim. Et Cosmochim. Acta 1995, 59, 2919–2940. [Google Scholar] [CrossRef]
- Elmi, C.; Whitlock, J.R.; Macdowell, M.T.; Foust, R.D. Insights on the Formation Conditions of Manganese Oxides from Crimora, VA (USA). Geosciences 2023, 13, 235. [Google Scholar] [CrossRef]
- Condie, K.C. Chemical composition and evolution of the upper continental crust: Contrasting results from surface samples and shales. Chem. Geol. 1993, 104, 1–37. [Google Scholar] [CrossRef]
- Hayashi, K.-I.; Fujisawa, H.; Holland, H.D.; Ohmoto, H. Geochemistry of ∼1.9 Ga sedimentary rocks from northeastern Labrador, Canada. Geochim. Et Cosmochim. Acta 1997, 61, 4115–4137. [Google Scholar]
- Bhatia, M.R. Plate Tectonics and Geochemical Composition of Sandstones. J. Geol. 1983, 91, 611–627. [Google Scholar] [CrossRef]
- Vail, P.; Mitchum, R., Jr.; Thompson, S., III. Seismic stratigraphy and global changes of sea level: Part 3. Relative changes of sea level from Coastal Onlap: Section 2. Application of seismic reflection Configuration to Stratigrapic Interpretation. In Seismic Stratigraphy—Applications to Hydrocarbon Exploration; American Association of Petroleum Geologists: Tulsa, OK, USA, 1977. [Google Scholar]
- Khadka, K.; Sang, S.; Han, S.; He, J.; Baral, U.; Bhandari, S. Geological and Geochemical Characterisation of Shale as an Unconventional Gas Source and Reservoir Within the Lesser Himalaya. Nepal. Geol. J. 2024. [Google Scholar] [CrossRef]
Disclaimer/Publisher’s Note: The statements, opinions and data contained in all publications are solely those of the individual author(s) and contributor(s) and not of MDPI and/or the editor(s). MDPI and/or the editor(s) disclaim responsibility for any injury to people or property resulting from any ideas, methods, instructions or products referred to in the content. |
© 2025 by the authors. Licensee MDPI, Basel, Switzerland. This article is an open access article distributed under the terms and conditions of the Creative Commons Attribution (CC BY) license (https://creativecommons.org/licenses/by/4.0/).