
Porosity Characteristics of Coal Seams and the Control Mechanisms of Coal Petrology in the Xishanyao Formation in the Western Part of the Southern Junggar Basin


Abstract
1. Introduction
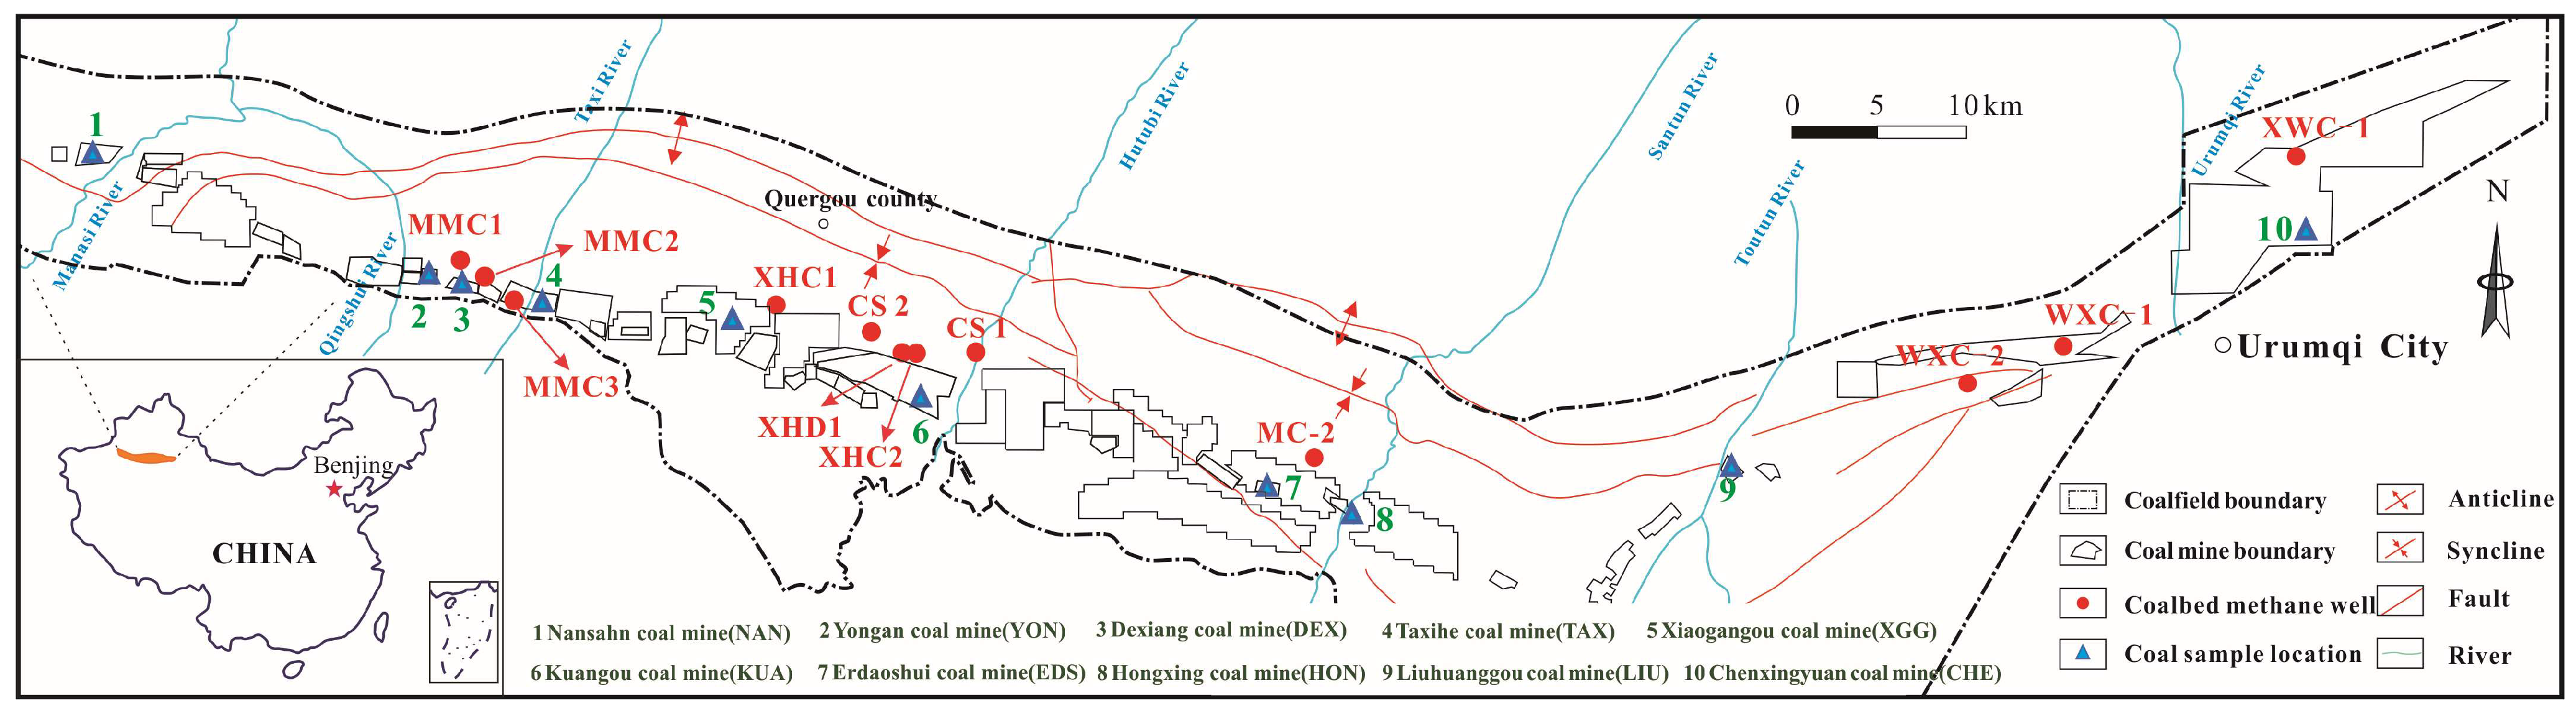
2. Geological Setting
3. Sample and Experiment Method
3.1. Sampling Collection and Experimental Scheme
3.2. Fundamental Information of the Samples
4. Results and Discussion
4.1. Microcrack Characteristics by NMR
- (1)
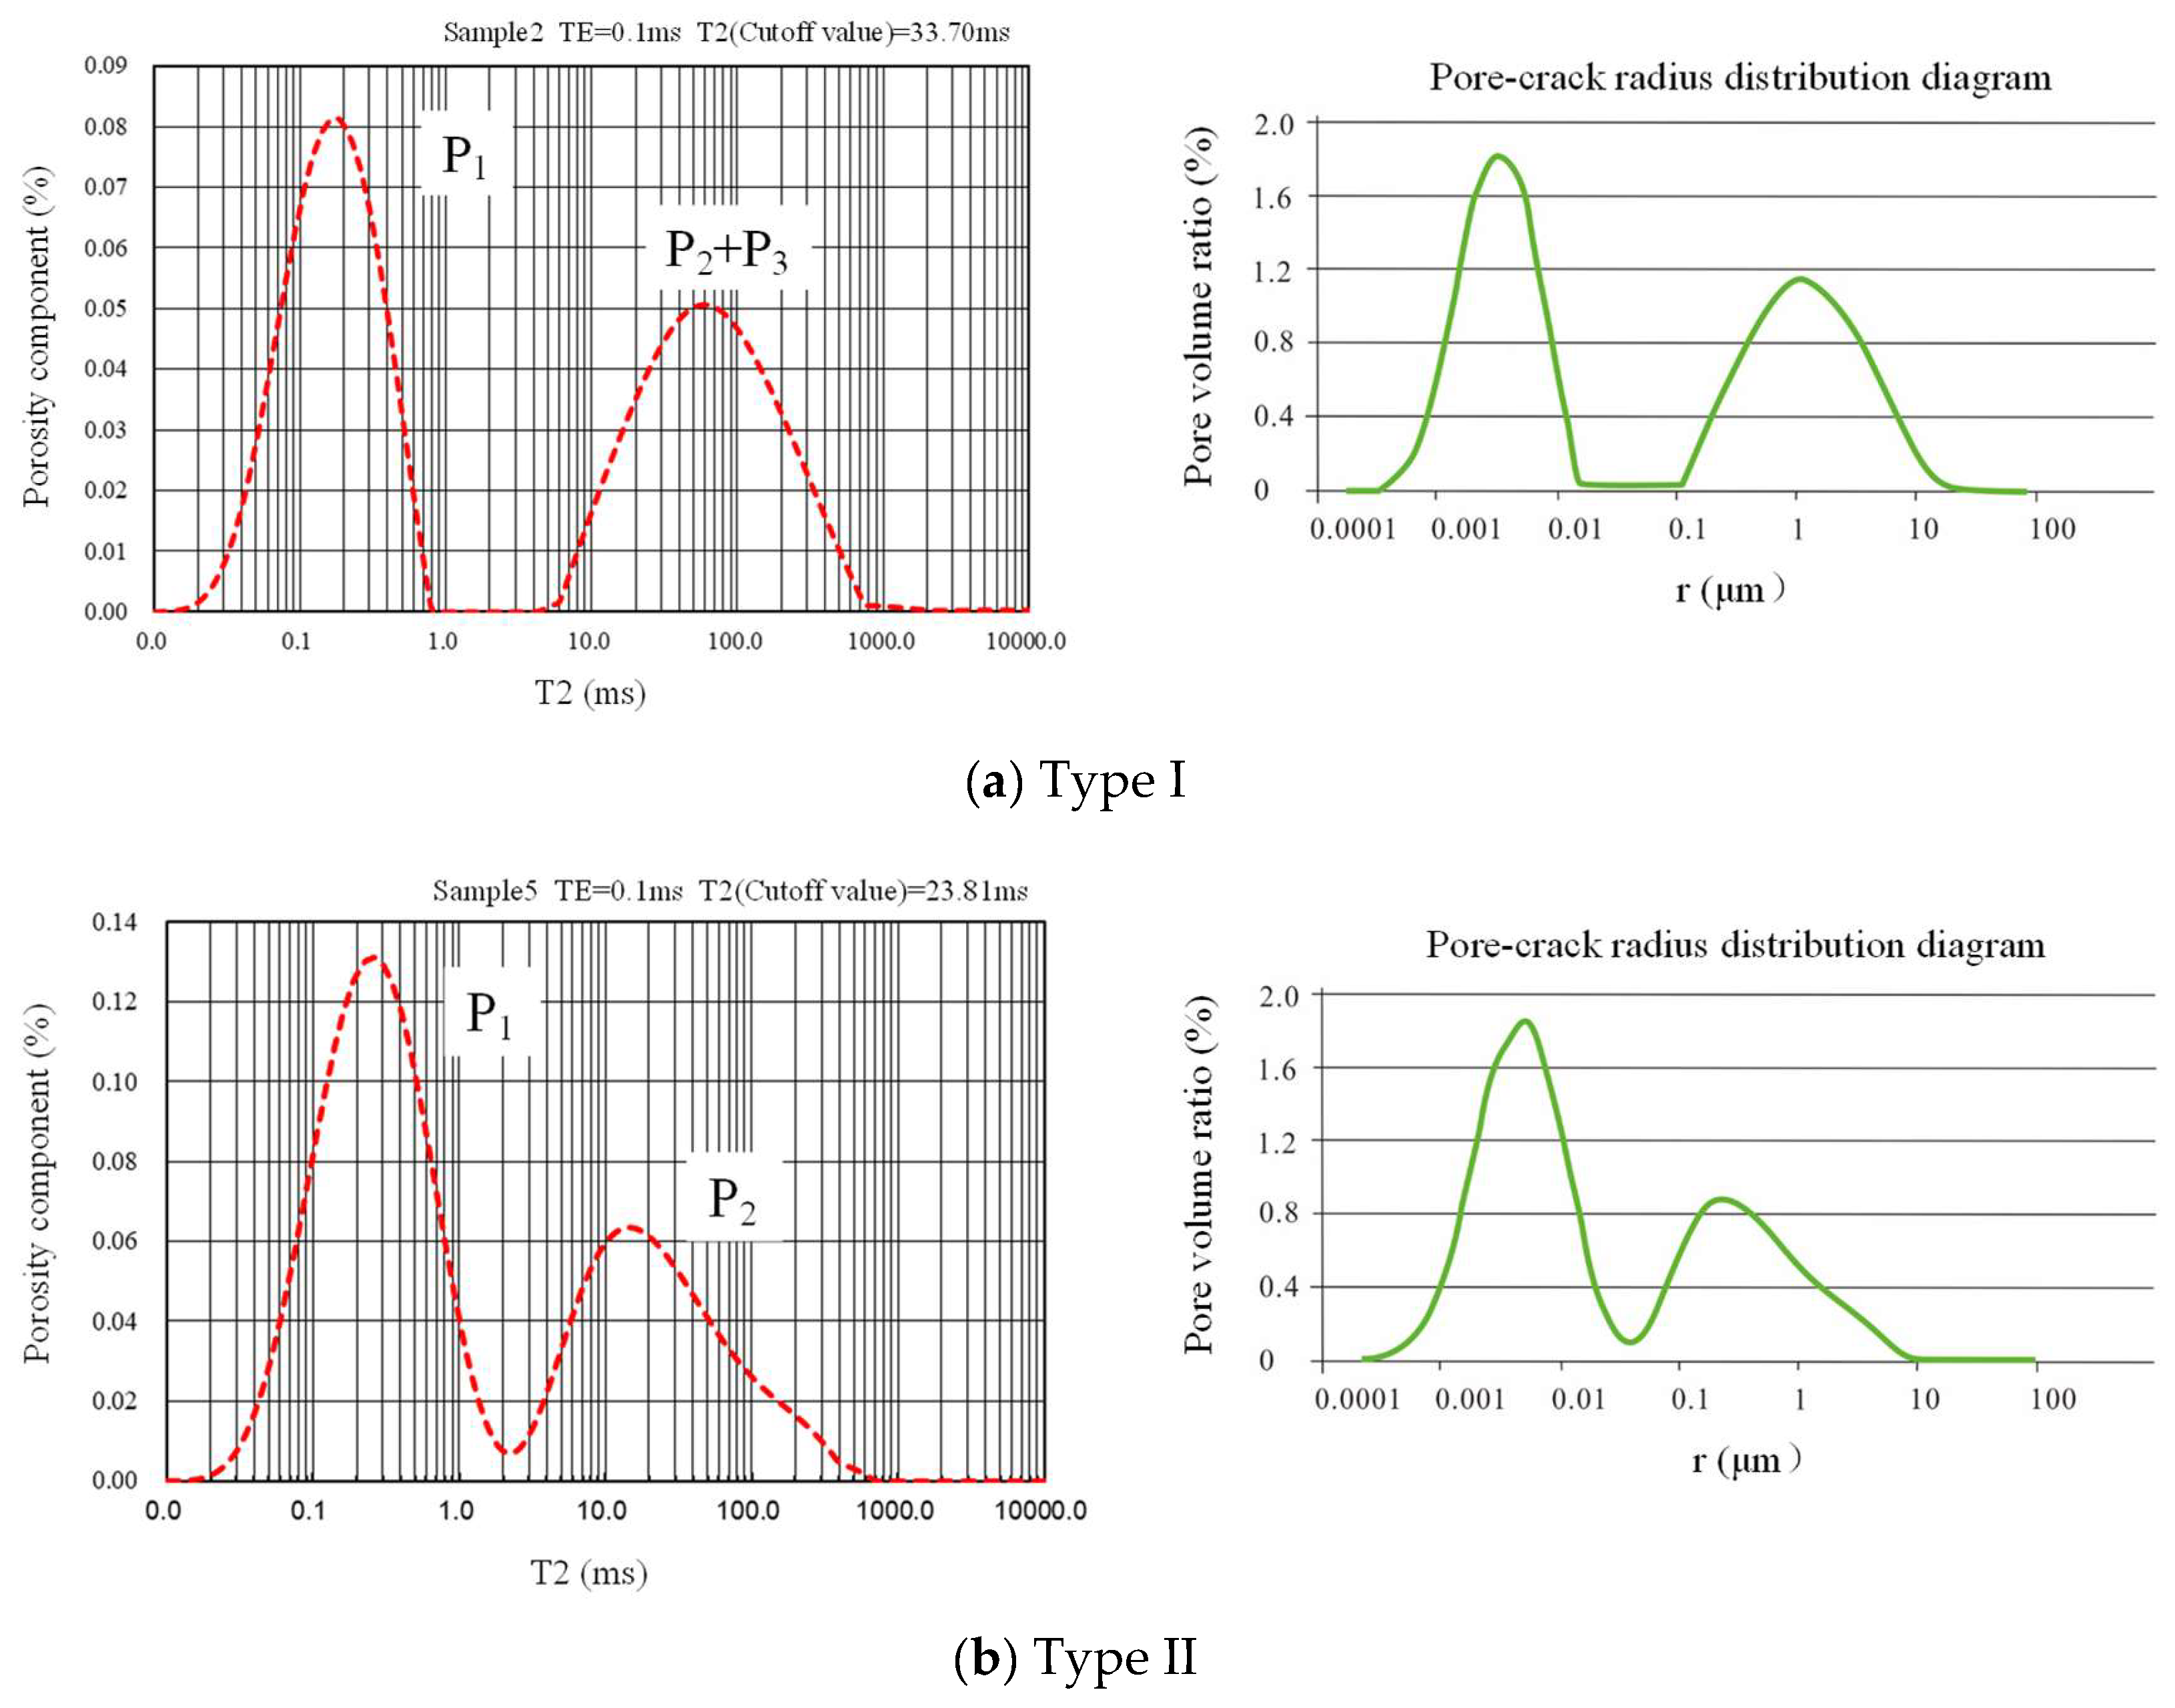
- Type I: The T2 relaxation curve displays a bimodal structure, with a gradual decrease in porosity contribution rate over the relaxation time. There is a significant weakening of the NMR signal and a large spacing between the two peaks, but P2 and P3 are continuous (Figure 3a). Overall, this type of coal reservoir is dominated by micropores and fine pores, forming excellent adsorption spaces; it also possesses a few seepage conditions. The porosity is relatively high, but the permeability is low. In general, the coal reservoir exhibits good adsorption performance but average physical properties.
- (2)
- Type II: The T2 relaxation curve also exhibits a bimodal structure but gradually approaching zero after displaying two peaks, P1 and P2, without a peak corresponding to P3 (Figure 3b). Based on this analysis, the pore structure in this type is primarily composed of micropores and fine pores, with the presence of some mesopores and macropores. The microcrack system is scarcely developed, resulting in low permeability and limiting the production of CBM. Overall, the physical properties of this type of coal reservoir are poor.
- (3)
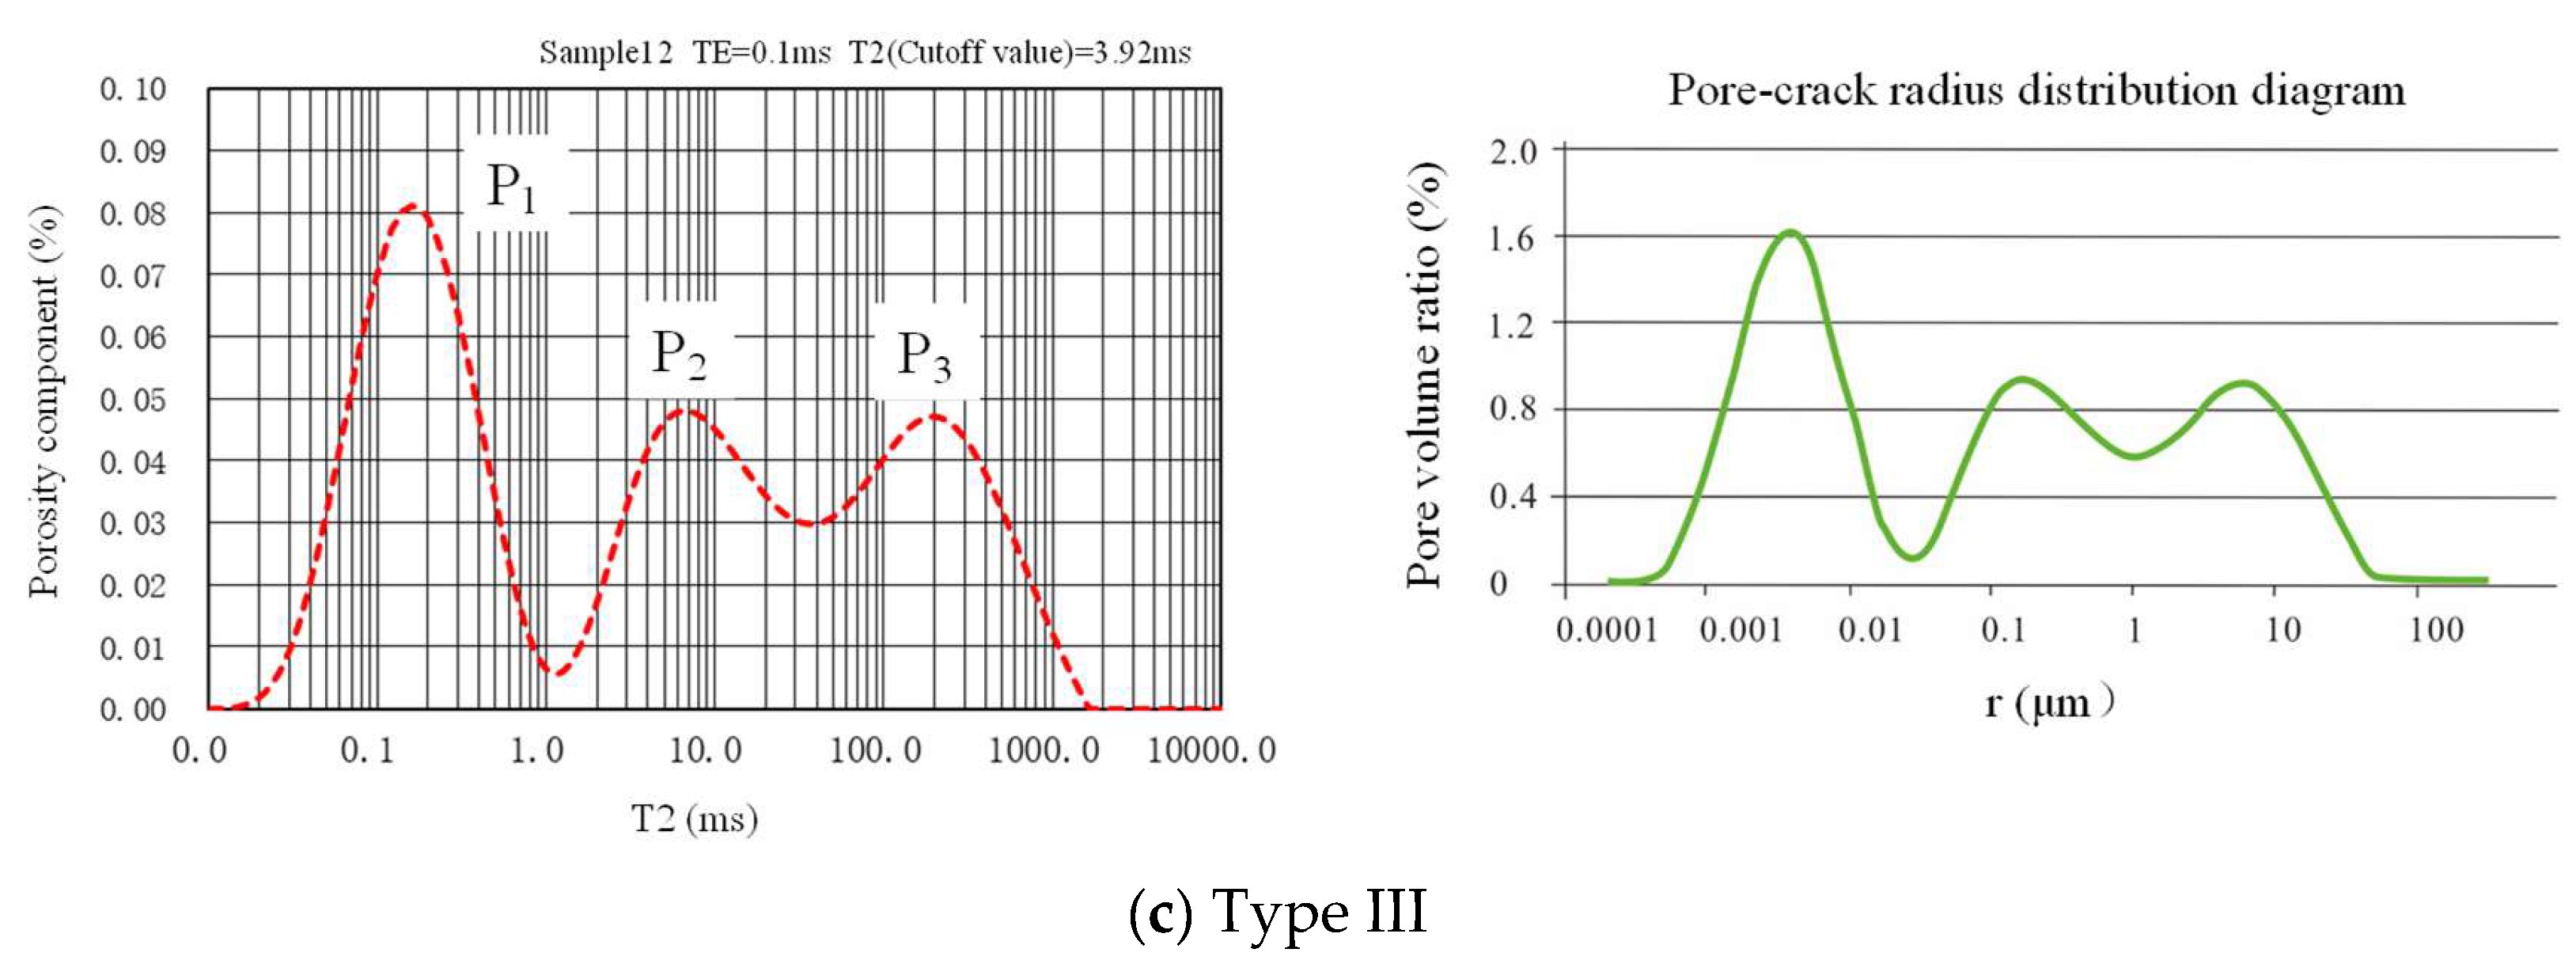
- Type III: The T2 relaxation curve exhibits a trimodal structure, with three continuous peaks, P1, P2, and P3 (Figure 3c). This suggests that the distribution of pores and endogenous fractures across different pore sizes is continuous, indicating relatively good physical properties of this type of coal reservoir.
4.2. Pore Characteristics by Low-Temperature Liquid Nitrogen
- (1)
- Type I: The curve resembles a slender bamboo leaf shape; it overlaps at the initial value (0) and maximum value (1) of relative pressure and separates between them (Figure 4a). The desorption curve consistently remains above its corresponding adsorption curve throughout its range but experiences a significant rise at a relative pressure approximately equal to 0.5. The adsorption curve shows a steady upward trend, with increasing acceleration when the relative pressure exceeds 0.8. Average pore size distribution curves associated with Type I reveal the distribution of micropores is significantly higher than that of other size pores.
- (2)
- Type II: The adsorption and desorption curves exhibit the closest proximity, with a nearly parallel trend, but they do not overlap even at a relative pressure of 1 (Figure 4b). The corresponding pore size distribution curve indicates that apart from micropores, fine pores also account for a significant proportion.
- (3)
- Type III: There is a significant distance between the adsorption and desorption curves at the initial pressures, but they become increasingly closer as the relative pressure increases and approach overlap when the relative pressure reaches 1 (Figure 4c). The corresponding pore size distribution curve is similar to that of Type I, with a significantly higher number of micropores compared to pores of other sizes.
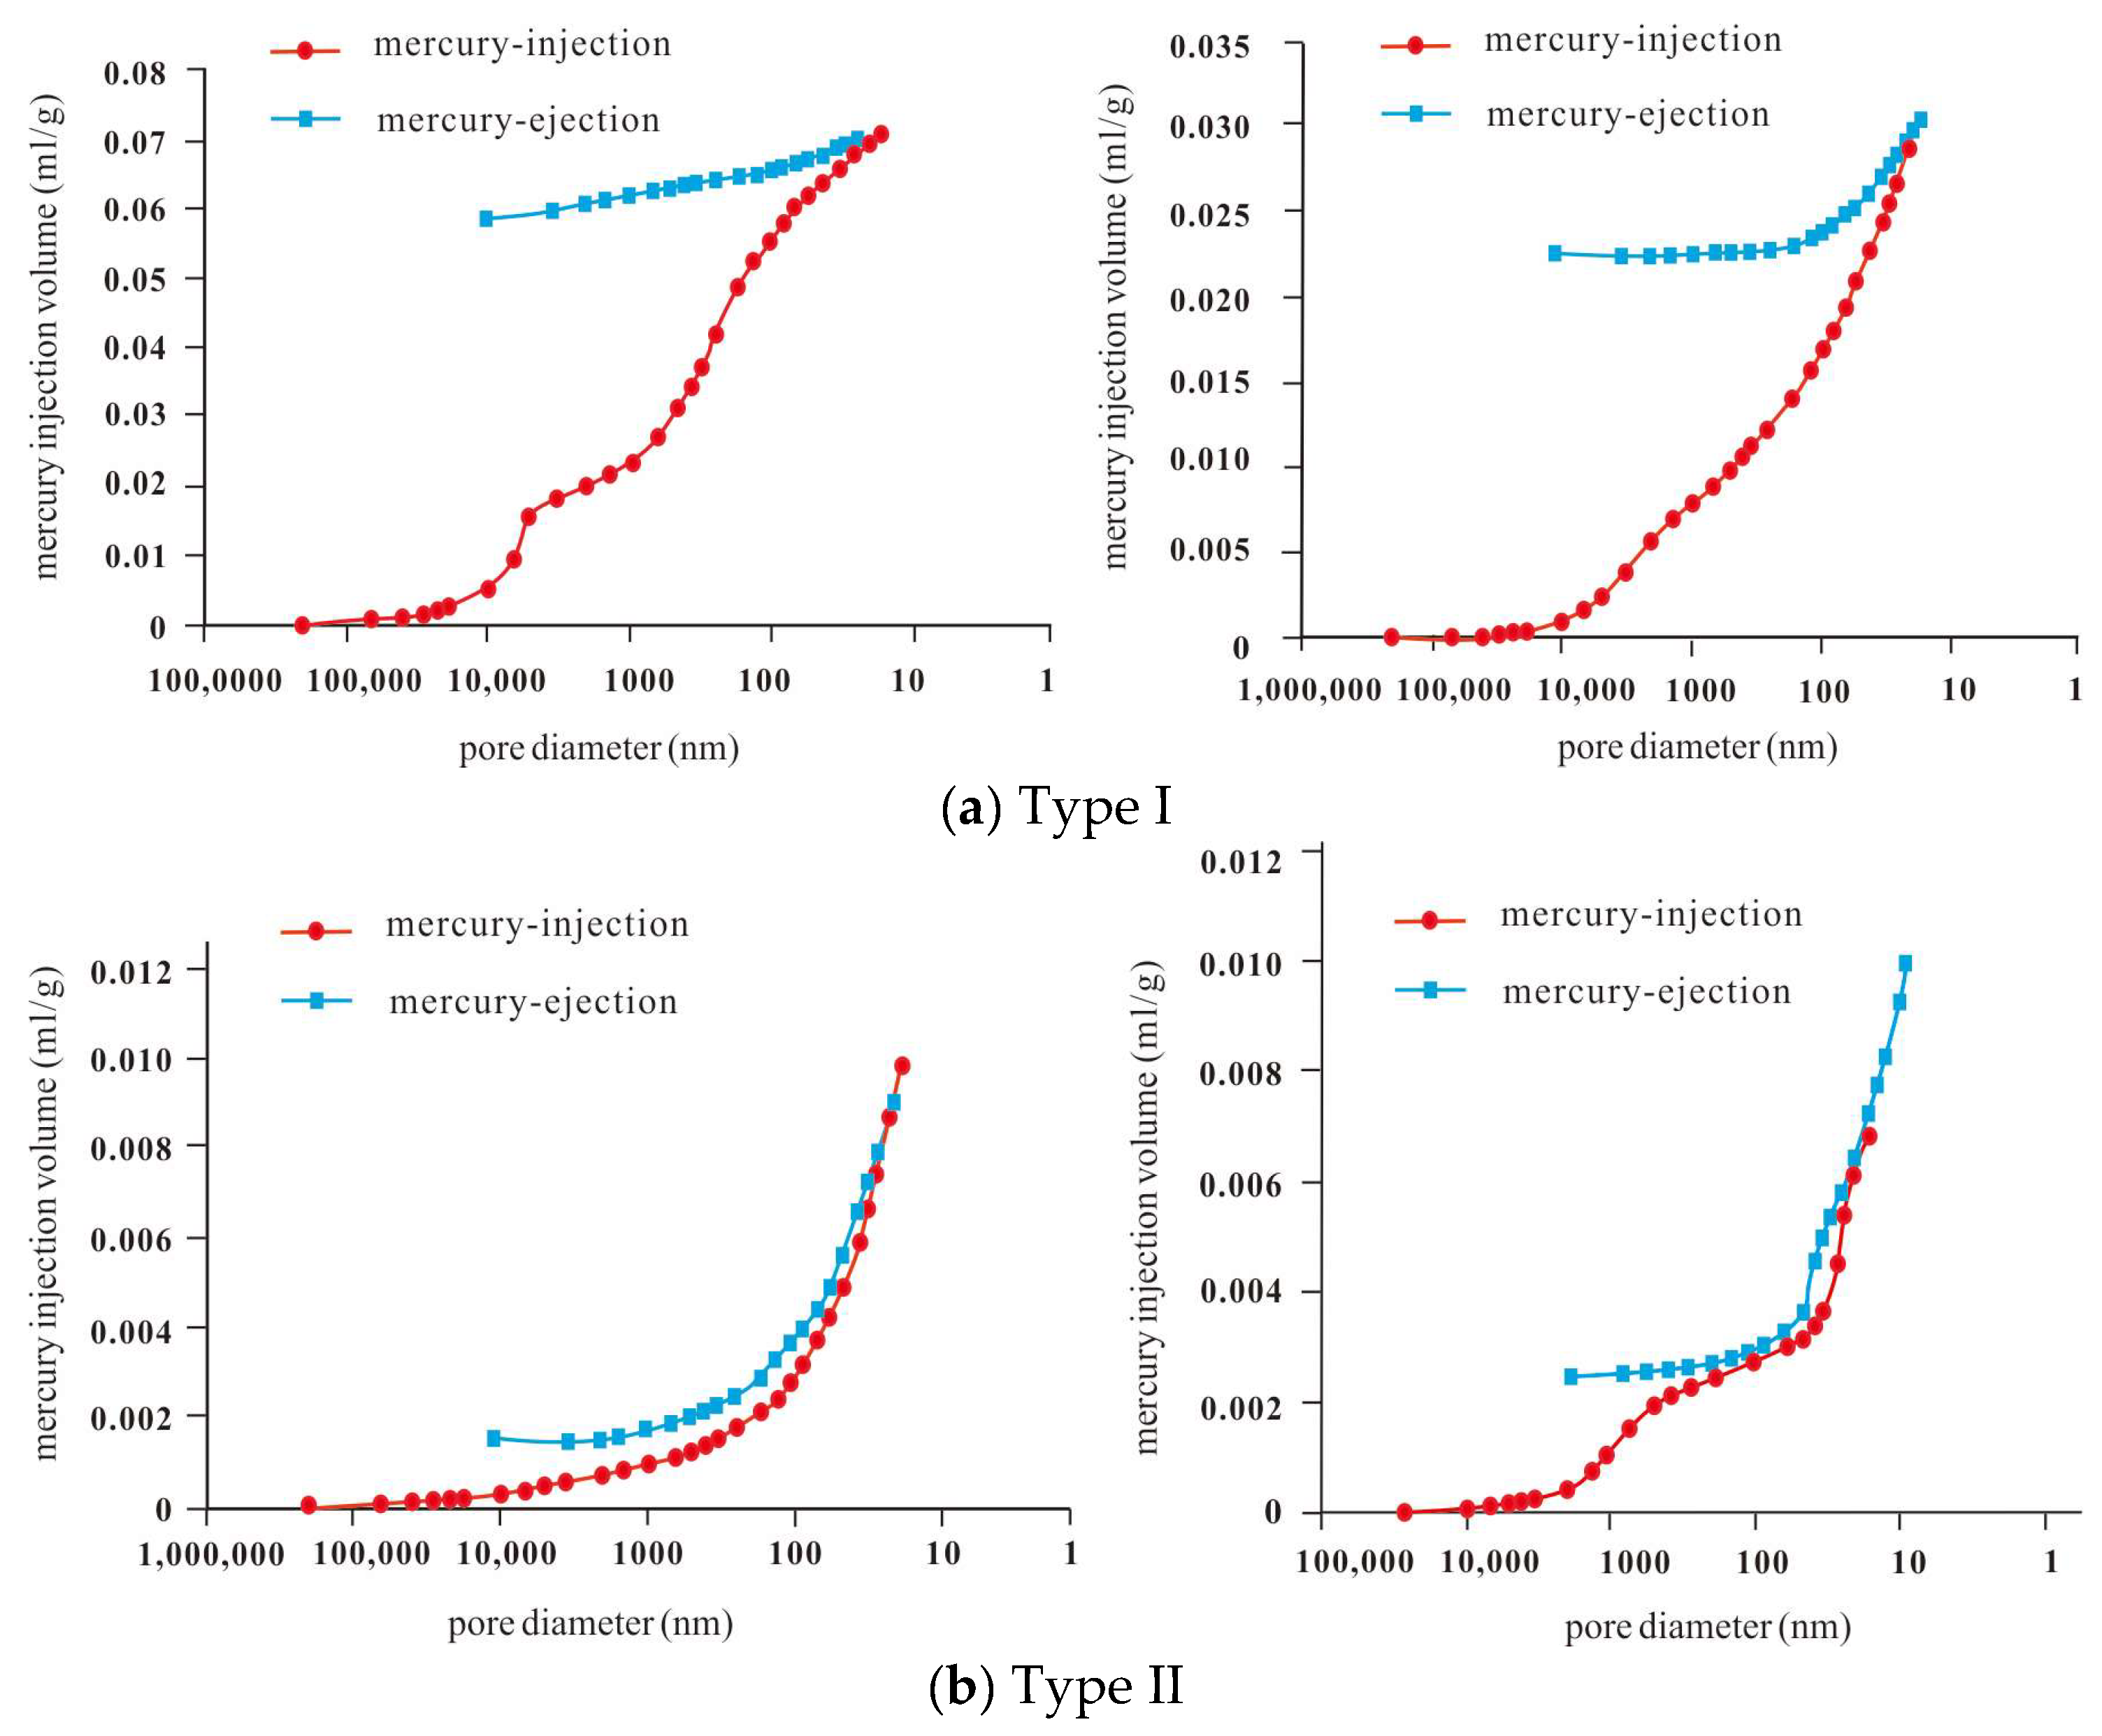
4.3. Pore Characteristics by MIP
5. Control Mechanism of Coal Petrology
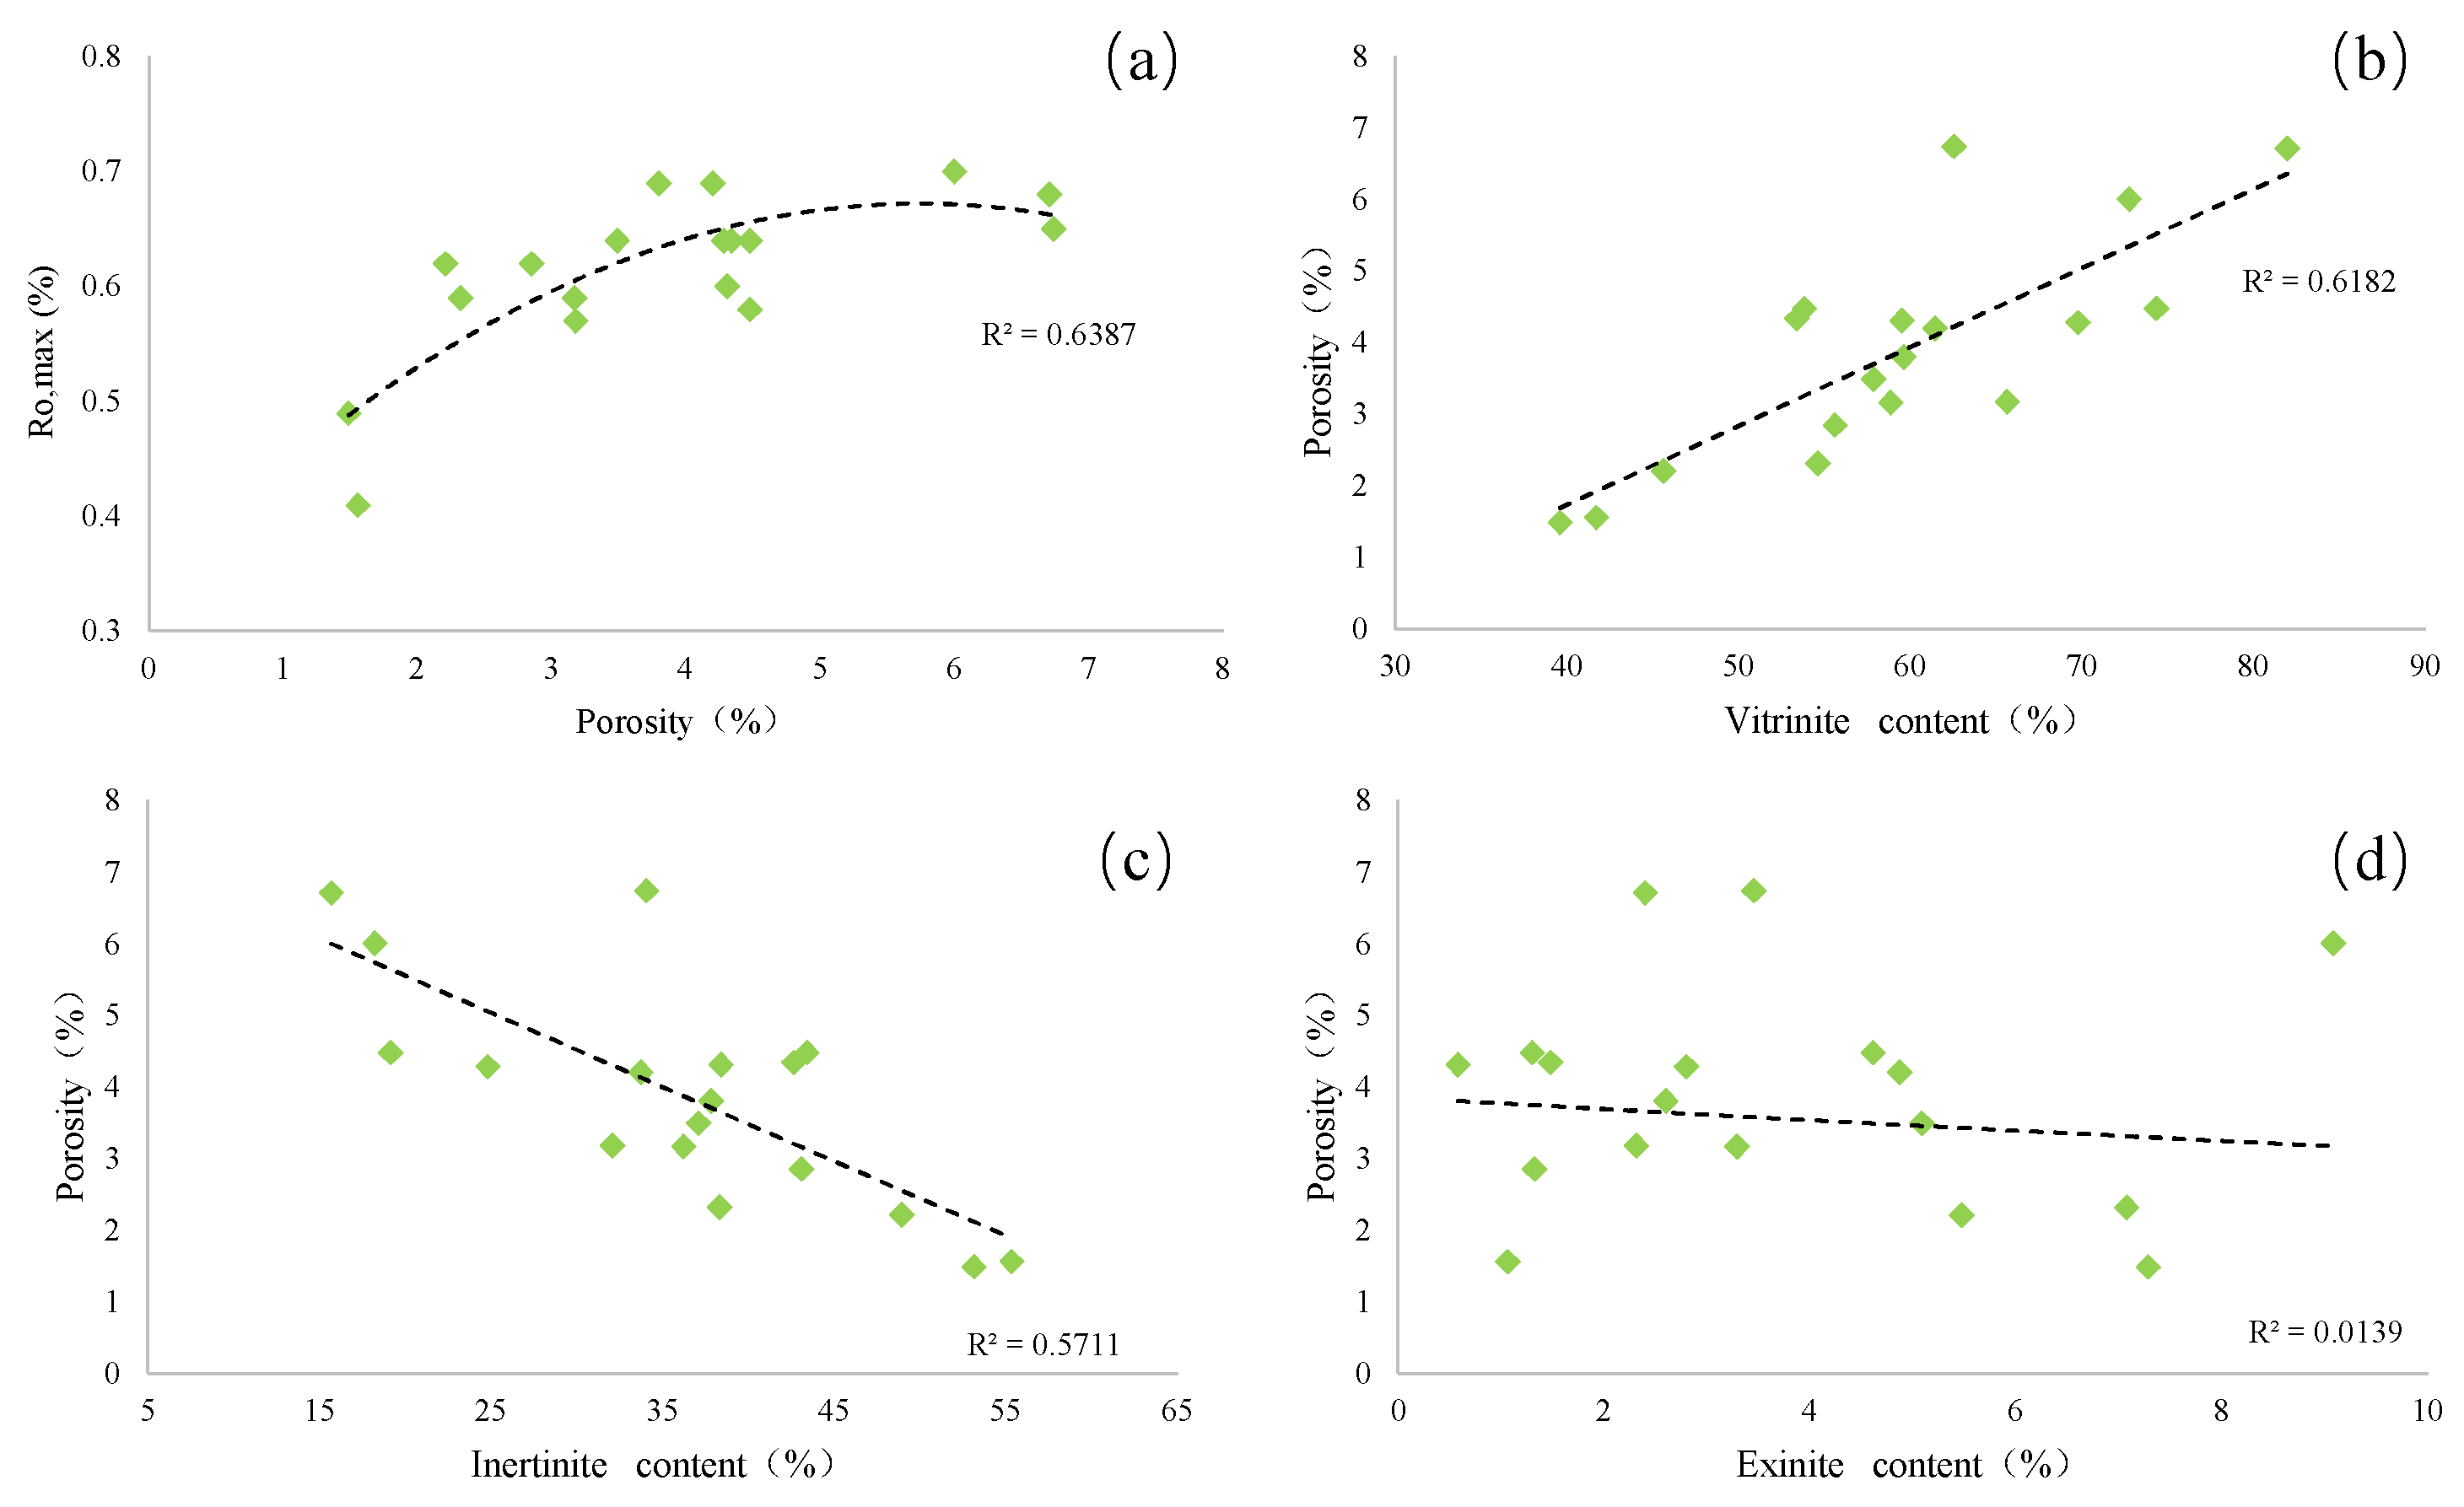
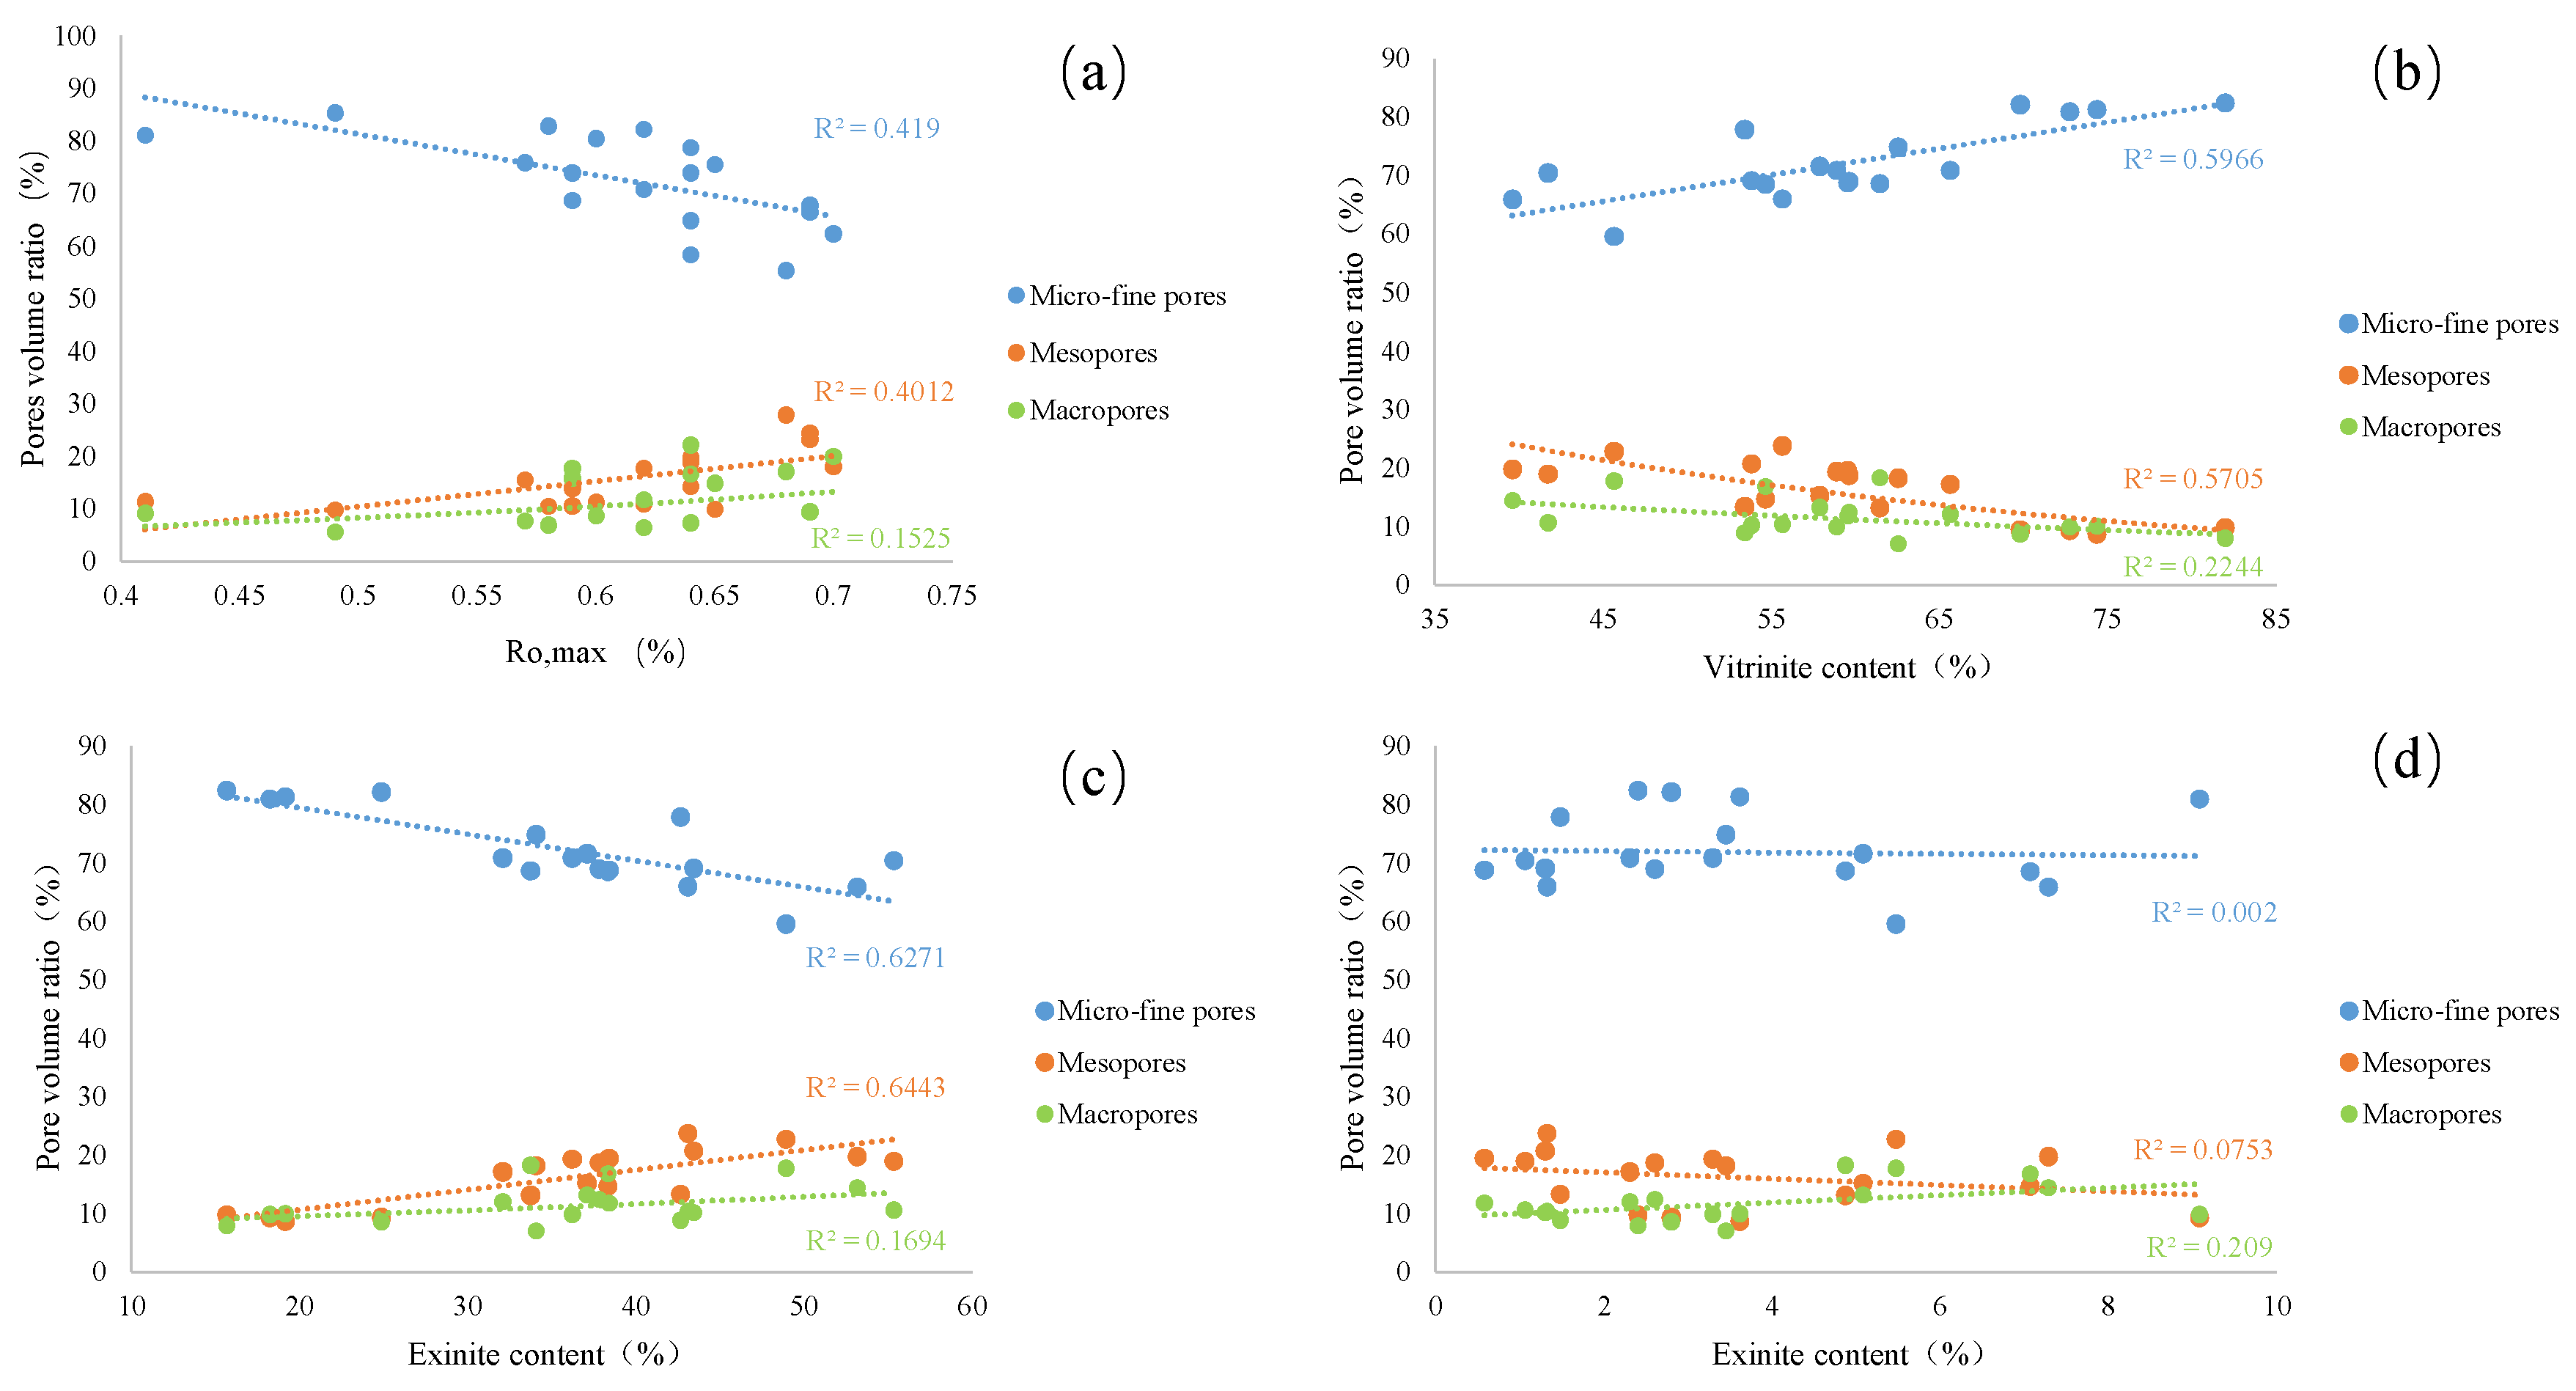
5.1. Organic Maceral
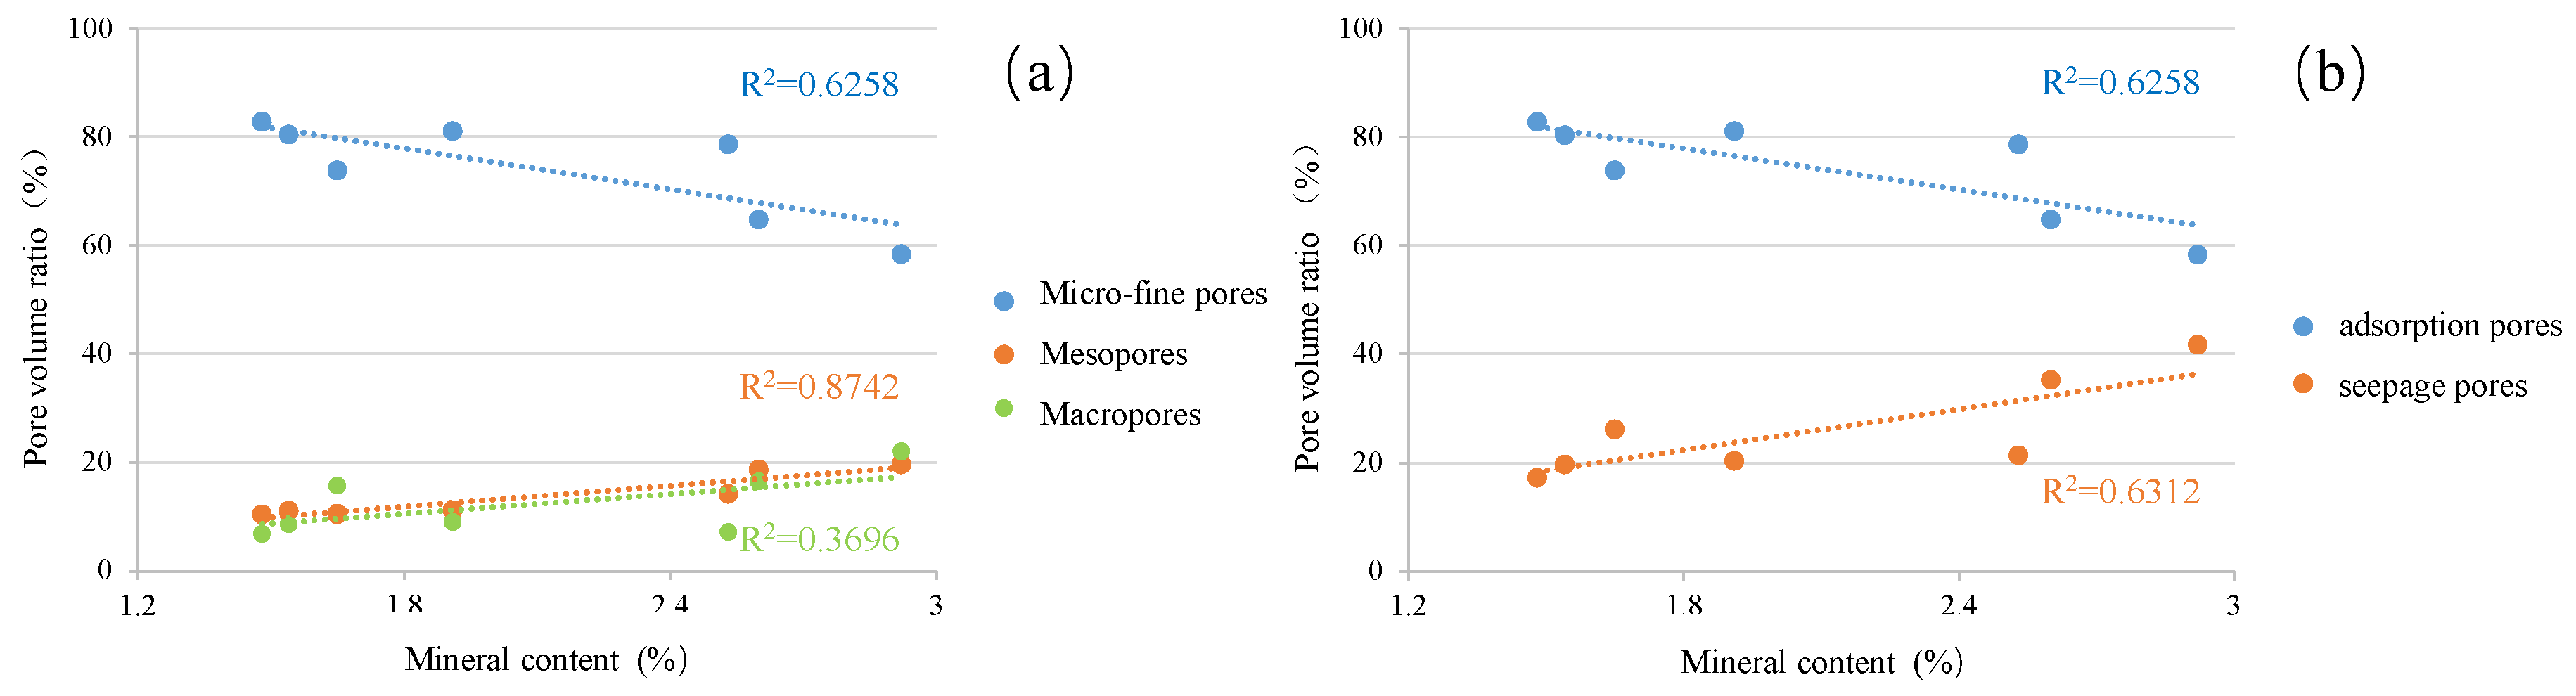
5.2. Mineral Matter
6. Conclusions
- (1)
- Based on the characteristics of NMR T2 relaxation curves, the NMR T2 spectrum of coal samples can be classified into three distinct types, with the Type I T2 spectrum being the most prominent. The coal reservoirs of the Xishanyao Formation are primarily composed of micropores and fine pores, which possess a high capacity for methane adsorption but offer limited pathways for methane migration, resulting in an overall assessment of good adsorption capacity but low permeability for the coal reservoir.
- (2)
- Based on low-temperature liquid nitrogen adsorption experiments, it is indicated that the total pore volume of coal samples varies greatly, ranging from 0.535 to 17.861 × 10⁻³ cm3/g with an average of 6.318 × 10⁻³ cm3/g. Among the pore volumes, micropore volume occupies a relatively high proportion, accounting for an average of 39.41%, followed by fine pores, accounting for an average of 39.41%. According to the low-temperature liquid nitrogen adsorption–desorption curves, the pore structure of coal reservoirs in the study area can be categorized into three distinct types.
- (3)
- Based on the high-pressure MIP experiments, the porosity in the study area ranges from 1.49% to 6.71%, with an average porosity of 3.87%. The coal seams have good gas storage capacity and connectivity yet display some heterogeneity. The coal reservoirs are dominated by micropores and fine pores throughout the study area. The proportion of micropores in the Manas–Hutubi area is lower than that in the Urumqi area. The displacement pressure of mercury intrusion curves is generally less than 0.1 MPa, indicating a uniform distribution of pores across different pore sizes and excellent gas storage capacity of the coal reservoir.
- (4)
- Within the range of lower coalification degrees in the study area, porosity increases with the elevation of coalification, accompanied by a gradual increase in the proportion of meso–macropore volumes. Furthermore, an increase in the vitrinite content promotes the development of micro–fine pores, while an increase in inertinite promotes the development of meso–macropores. The mineral content exhibits a negative correlation with the adsorption pore volume ratio and a positive correlation with the seepage pore volume ratio. This may be attributed to the filling of clay minerals or other minerals, which reduces the pore volume ratio of micro–fine pores, overall decreasing the specific surface area of the coal reservoir and ultimately leading to a decrease in porosity.
Author Contributions
Funding
Data Availability Statement
Acknowledgments
Conflicts of Interest
References
- Wang, X.; Hu, Z.; Li, Y.; Xue, L.; Cai, Y.; Ji, D.; Xia, Y. Characteristic and Exploration Potential of Deep Coal Measure Gas Assemblage in Jurassic of Junggar Basin. Coal Technol. 2020, 39, 60–64. [Google Scholar]
- Zhang, D.; Zhu, J.; Zhao, X.; Gao, Y.; Geng, M.; Chen, G.; Jiao, J.; Liu, S. Dynamic assessment of coalbed methane resources and availability in China. J. China Coal Soc. 2018, 43, 1598–1604. [Google Scholar]
- Sun, B.; Tang, S.; Tao, S.; Chen, S.; Zhi, Y.; Zhang, B.; Wen, Y. Geological and Geochemical Responses to Productivity of CBM Wells in the Baiyang River Block of the Southern Junggar Basin, China. Energies 2023, 16, 8063. [Google Scholar] [CrossRef]
- Sang, S.; Li, R.; Liu, S.; Zhou, X.; Wei, B.; Han, S.; Zheng, S.; Huang, F.; Liu, T.; Wang, Y.; et al. Large scale and efficient exploration and development of coalbed methane in Xinjiang. J. China Coal Soc. 2024, 49, 563–585. [Google Scholar]
- Du, S.; An, Q.; Chang, Z.; Li, P.; Ma, N.; Zhao, H. The exploration and development of coalbed methane in Xinjiang are entering a new stage. Unconv. Oil Gas 2023, 10, 1–7. [Google Scholar]
- Tang, D.; Yang, S.; Tang, S.; Tao, S.; Chen, S.; Zhang, A.; Pu, Y.; Zhang, T. Advance on exploration—Development and geological research of coalbed methane in the Junggar Basin. J. China Coal Soc. 2021, 46, 2412–2425. [Google Scholar]
- Li, R.; Zhou, Z. Development status and thoughts on coalbed methane industry in Xinjiang. Coal Geol. Explor. 2022, 50, 23–29. [Google Scholar]
- Cui, D.; Li, R.; Zhou, Z.; Wang, J. Prospects for Development and Utilization of Coalbed Methane in Xinjiang Uygur Autonomous Region. China Coalbed Methane 2021, 18, 41–45. [Google Scholar]
- Jiang, W.; Wu, H.; Wang, H. Research on the Reasons for Low Production of Coalbed Methane Wells and Measures for Increasing Production in Zhunnan Area of Xinjiang. China Coalbed Methane 2023, 20, 9–12. [Google Scholar]
- Hou, H.; Li, Q.; Liang, G.; Qin, Q.; Zhang, H.; Liu, S. Comparative study of cbm accumulation conditions between the xishanyao formation and the badaowan formation in the southern Jungagar basin. Oil Gas 2022, 9, 18–24. [Google Scholar]
- Li, Z.; Liu, Z. Analysis of Gas Bearing Property and Physical Properties of Coalbed Mehtane in Urumqi Hedong Mining Area. China Coalbed Methane 2021, 18, 21–24. [Google Scholar]
- Zhou, Z.; Zhang, W. Geological Research and Technical Progress of Coalbed Methane in Southern Margin of Junggar Basin. China Coalbed Methane 2022, 19, 8–12. [Google Scholar]
- Tang, Y. Research on Layer Selection Method for Fracturing of Multi-Layer Superpimposed CBM System in the Southern Junggar Basin. Ph.D. Thesis, China University of Geosciences (Beijing), Beijing, China, 2020. [Google Scholar]
- Su, X.; Feng, Y.; Chen, J. The characteristics and origins of cleat in coal from Western North China. Int. J. Coal Geol. 2001, 47, 51–62. [Google Scholar] [CrossRef]
- Li, Y.; Yao, C.; Yang, S.; FU, H.; Wang, G.; Zhang, N.; Liu, Z. Study on origin and accumulation mechanism of coalbed methane in Miquan Area of southern margin of Zhunggar Basin. Coal Sci. Technol. 2021, 49, 220–226. [Google Scholar]
- Wei, Y.; Zhang, Q.; Wang, A.; Ren, H.; Yuan, Y.; Cao, D. The influence of the salinity of groundwater in coal measures on low rank coalbed methane in the south margin of Junggar basin. Coal Geol. Explor. 2016, 44, 31–37. [Google Scholar]
- Shahid, F.; Marshall, M.; Chaffee, A.L. Active carbon monoliths from soft brown coal: A systematic study of their preparation, pore structure modification and characterization. J. Ind. Eng. Chem. 2024, 132, 424–436. [Google Scholar] [CrossRef]
- Wang, T.; Tian, F.; Deng, Z.; Hu, H. The Characteristic Development of Micropores in Deep Coal and Its Relationship with Adsorption Capacity on the Eastern Margin of the Ordos Basin, China. Minerals 2023, 13, 302. [Google Scholar] [CrossRef]
- Baublys, K.A.; Hofmann, H.; Esterle, J.S.; Cendon, D.I.; Vink, S.; Golding, S.D. Geochemical influences on methanogenic groundwater from a low rank coal seam gas reservoir; Walloon Subgroup, Surat Basin. Int. J. Coal Geol. 2021, 246, 103841. [Google Scholar] [CrossRef]
- Lu, W.; Zhuang, Z.; Zhang, W.; Zhang, C.; Song, S.; Wang, R.; Kong, B. Study on the Pore and Crack Change Characteristics of Bituminous Coal and Anthracite after Different Temperature Gradient Baking. Energy Fuels 2021, 35, 19448–19463. [Google Scholar] [CrossRef]
- Christonph, B. General Cluster Sorption Isotherm. Microporous Mesoporous Mater. 2021, 67, 909–922. [Google Scholar]
- Song, D.; Ji, F.; Li, Y.; Zhao, H.; Song, B.; He, K. Heterogeneous development of micropores in medium-high rank coal and its relationship with adsorption capacity. Int. J. Coal Geol. 2020, 226, 103497. [Google Scholar] [CrossRef]
- Tao, S.; Chen, S.; Tang, D.; Zhao, X.; Xu, H.; Li, S. Material composition, pore structure and adsorption capacity of low-rank coals around the first coalification jump: A case of eastern Junggar Basin, China. Fuel 2018, 211, 804–815. [Google Scholar] [CrossRef]
- Pan, J.; Wang, K.; Hou, Q.; Niu, Q.; Wang, H.; Ji, Z. Micro-pores and fractures of coals analysed by field emission scanning electron microscopy and fractal theory. Fuel 2016, 164, 277–285. [Google Scholar] [CrossRef]
- Thommes, M.; Cychosz, K.A. Physical adsorption characterization of nanoporous materials: Progress and challenges. Adsorption 2014, 20, 233–250. [Google Scholar] [CrossRef]
- Lee, G.J.; Pyun, S.J. The effect of pore structures on fractal characteristics of meso/macroporous carbons surfaces of reactivated micoporous carbons based on upon image analysis and gas adsorption. Microporous Mesoporous Mater. 2006, 93, 217–225. [Google Scholar] [CrossRef]
- Kara, C.T.; Okandan, E. Fracture/cleat analysis of coals from Zonguldak Basin (northwestern Turkey) elative to the potential of coalbed methane production. Int. J. Coal Geol. 2000, 44, 109–125. [Google Scholar]
- Longinos, S.N.; Azza, H.A.; Arman, B.; Piotr, S.; Randy, H. Application of Image Processing in Evaluation of Hydraulic Fracturing with Liquid Nitrogen: A Case Study of Coal Samples from Karaganda Basin. Appl. Sci. 2023, 13, 7861. [Google Scholar] [CrossRef]
- Longinos, S.N.; Serik, A.L.; Zhang, D.; Wang, L.; Hazlett, R. Experimental Evaluation of Liquid Nitrogen Fracturing on the Coal Rocks in Karaganda Basin, Kazakhstan. Arab. J. Sci. Eng. 2023, 48, 16623–16638. [Google Scholar] [CrossRef]
- Okolo, G.N.; Everson, R.C.; Neomagus, H.W.J.P.; Roberts, M.J.; Sakurovs, R. Comparing the porosity and surface areas of coal as measured by gas adsorption, mercury intrusion and SAXS techniques. Fuel 2015, 141, 293–304. [Google Scholar] [CrossRef]
- Chalmers, G.R.; Bustin, R.M.; Power, I.M. Characterization of gas shale pore systems by porosimetry, pycnometry, surface area, and field emission scanning electron microscopy/transmission electron microscopy image analyses: Examples from the Barnett, Woodford, Haynesville, Marcellus, and Doig units. AAPG Bull. 2012, 96, 1099–1119. [Google Scholar]
- Zhang, X.; Wang, G.; Yang, S. Experimental Evaluation of Pore Characteristics of LowRank Coal Seams in Xinjiang. China Coalbed Methane 2021, 18, 15–18. [Google Scholar]
- Chen, S.; Jiang, Z.; Quan, X.; Yang, X.; Mo, Q. Study on pore structure and fractal characteristics of fractured coal based on mercury injection and low temperature nitrogen adsorption tests. Saf. Coal Mines 2024, 55, 203–216. [Google Scholar]
- Ge, X.; Myersmt, M.T.; Liu, J. Determining the transverse surface relaxivity of reservoir rocks: A critical review and perspective. Mar. Pet. Geol. 2021, 126, 104934. [Google Scholar] [CrossRef]
- Wu, B. Microstructure Study and Fractal Quantitative Characterization of Coal Based on MIP Test. Coal Geol. China 2023, 12, 72–78. [Google Scholar]
- Yang, Q.; Xu, S.; Zhou, H.; Feng, P.; Gao, Y. Fine characterization on pore structure and evaluating influential factors on ab-sorptivity in low-rank coals, Turpan-Hami Basin. Nat. Gas Explor. Dev. 2023, 46, 131–139. [Google Scholar]
- Wang, Y.; Liu, D.; Cai, Y.; Li, X. Variation of Petrophysical Properties and Adsorption Capacity in Different Rank Coals: An Experimental Study of Coals from the Junggar, Ordos and Qinshui Basins in China. Energies 2019, 12, 986. [Google Scholar] [CrossRef]
- Lu, S.; Li, J.; Zhang, P.; Xue, H.; Wang, G.; Zhang, J.; Liu, H.; Li, Z. Classification of microscopic pore-throats and the grading evaluation on shale oil reservoirs. Pet. Explor. Dev. 2018, 45, 436–444. [Google Scholar] [CrossRef]
- Yang, Q.; Li, J.; Tian, W.; Sun, B.; Zhu, J.; Yang, Y. Characteristics on pore structures on full scale of lignite and main controlling factors in Hailar Basin. Nat. Gas Geosci. 2020, 31, 1603–1614. [Google Scholar]
- Zhai, C.; Sun, Y.; Fan, Y.; Yang, P.; Ge, X.; Wu, F.; Xu, J.; Yu, X.; Liu, T.; Zhao, Y. Application and prospect of low-field nuclear magnetic resonance technology in accurate characterization of coal pore structure. J. China Coal Soc. 2022, 47, 828–848. [Google Scholar]
- Li, N.; Liu, H.; Sang, S. Comparative study on pore size distribution in coal based on mercury in trusion-low temperature liquid nitrogen combined pore and nuclear magnetic resonance analysis. Saf. Coal Mines 2024, 55, 1–9. [Google Scholar]
- Shan, Y.; Bi, C.; Zhang, J.; Tang, Y.; Yuan, Y.; Xu, Y.; Pan, W. Productive industrial gas flow obtained in Middle Jurassic low-rank coalbed methane seam in southern Junggar Basin. Geol. China 2018, 45, 1078–1079. [Google Scholar]
- Huang, T.; Wang, G.; Yang, S.; Dong, L. Analysis of Coalbed Methane Occurrence Conditions in the Southern Hutubi Block in Southern Margin of Junggar Basin. China Coalbed Methane 2020, 17, 9–12. [Google Scholar]
- Chen, Z.; Meng, Z.; Zeng, L. Formation mechanism and enrichment patterns of middle-low rank coalbed methane in Southern Junggar Basin, China. J. China Coal Soc. 2017, 42, 3203–3211. [Google Scholar]
- Yuan, Y.; Shan, Y.; Tang, Y.; Cao, D. Coalbed methane enrichment regularity and major control factors in the Xishanyao Formation in the western part of the southern Junggar Basin. Acta Geol. Sin. Engl. Ed. 2020, 94, 485–500. [Google Scholar] [CrossRef]
- Zhao, C. Permeability Distribution Characteristics of Low-rank Coal Reservoir with Large Dip Angle in Urumchi Hedong Mining Area of Zhunan Coalfield, Xinjiang. China Coalbed Methane 2023, 20, 8–12. [Google Scholar]
- Lu, J.; Fu, X.; Kang, J. Quantitative and comprehensive characterization of full pore size in medium and low rank coal in southern margin of Junggar basin. China Sci. 2022, 17, 62–71. [Google Scholar]
- Yuan, Y.; Tang, Y.; Shan, Y.; Zhang, J.; Cao, D.; Wang, A. Coalbed methane reservoir evaluation in the Manas mining area, southern Junggar Basin. Energy Explor. Exploit. 2018, 36, 114–131. [Google Scholar] [CrossRef]
- Tang, Y.; Yuan, Y.; Hou, H.; Zhang, J.; Du, X.; Zhang, D.; Shan, Y. Coal reservoir pressure and gas-bearing system of the jurassic Xishanyao formation in the southern Junggar Basin: Influencing factors and division. Sci. Technol. Eng. 2020, 20, 3908–3918. [Google Scholar]
- Yuan, Y. Coalbed Methane Physical Properties and Enrichment Regularity of Xishanyao Formation in the Western Part of the Southern Junggar Basin. Ph.D. Thesis, China University of Mining and Technology (Beijing), Beijing, China, 2022. [Google Scholar]
- Jiang, K.; Tian, J.; Wang, L.; Peng, X.; Wang, W. Sedimentary Characteristics and Coal-accumulation Pattern of the Xishanyao Formation in Southern Margin Area of Junggar Basin. Geoscience 2010, 24, 1204–1212. [Google Scholar]
- Mastalerz, M.; Drobniak, A.; Rupp, J. Meso-and micropore characteristics of coal lithotypes: Implications for CO2 adsorption. Energy Fuels 2008, 22, 4049–4061. [Google Scholar] [CrossRef]
- Zhou, S.; Liu, D.; Cai, Y.; Karpyn, Z.; Yao, Y. Petrographic Controls on Pore and Fissure Characteristics of Coals from the Southern Junggar Coalfield, Northwest China. Energies 2018, 11, 1556. [Google Scholar] [CrossRef]
- Crosdale, P.J.; Beamish, B.B.; Valix, M. Coalbed methane sorption related to coal compositon. Int. J. Coal Geol. 1998, 35, 147–158. [Google Scholar] [CrossRef]
- Rice, D.D. Composition and origins of coalbed gas. Hydrocarbons from coal. Can. AAPG Spec. Publ. 1993, 38, 159–184. [Google Scholar]
- Sander, R.; Connell, L.D.; Camilleri, M.; Pan, Z.J. CH4, CO2, N2 diffusion in Bowen Basin (Australia) coal: Relationship between sorption kinetics of coal core and crushed coal particles. J. Nat. Gas Sci. Eng. 2020, 81, 103468. [Google Scholar] [CrossRef]
- Mosher, K.; He, J.; Liu, Y.; Rupp, E.; Wilcox, J. Molecular simulation of methane adsorption in micro-and mesoporous carbons with applications to coal and gas shale systems. Int. J. Coal Geol. 2013, 109, 36–44. [Google Scholar] [CrossRef]
- Billemont, P.; Coasne, B.; De Weireld, G. An Experimental and Molecular Simulation Study of the Adsorption of Carbon Dioxide and Methane in Nanoporous Carbons in the Presence of Water. Langmuir 2011, 27, 1015–1024. [Google Scholar] [CrossRef]
- Dawson, G.K.W.; Esterle, J.S. Controls on cleat spacing. Int. J. Coal Geol. 2010, 82, 213–218. [Google Scholar] [CrossRef]
- Law, B.E. The relation between coal rank and cleat spacing: Implications for the prediction of permeability in coal. Proc. Int. Coalbed Methane Symp. 1993, 2, 435–442. [Google Scholar]
- Pyun, S.; Rhee, C. An investigation of fractal characteristics of mesoporous carbon electrodes with various pore structures. Electrochim. Acta 2004, 49, 4171–4180. [Google Scholar] [CrossRef]
- Xohot, B.B. Coal and Gas Outburst; China Industry Press: Beijing, China, 1966. [Google Scholar]
- Alireza, S.; Abbas, Z.; Mohammed, S.A.; Nawaf, A.A.; Saad, A.A.; Alexander, B.; Mohammad, R.; Mojtaba, R. Experimental study of the impact of CO2 injection on the pore structure of coal; a case study from the Bowen Basin, Australia. Int. J. Coal Geol. 2023, 5, 104314. [Google Scholar]
- Adenutsi, C.D.; Li, Z.; Xv, Z. Influence of net confining stress on NMR T2 distribution and two-phase relative permeability. J. Pet. Sci. Eng. 2019, 178, 766–777. [Google Scholar] [CrossRef]
- Baysal, M.; Yürüm, A.; Yıldız, B.; Yürüm, Y. Structure of some western Anatolia coals investigated by FTIR, Raman, 13C solid state NMR spectroscopy and X-ray diffraction. Int. J. Coal Geol. 2016, 163, 166–176. [Google Scholar] [CrossRef]
- Okolo, G.N.; Neomagus, H.W.J.P.; Everson, R.C.; Roberts, M.; Bunt, J.R.; Sakurovs, R.; Mathews, J.P. Chemical–structural properties of South African bituminous coals: Insights from wide angle XRD–carbon fraction analysis, ATR–FTIR, solid state 13C NMR, and HRTEM techniques. Fuel 2015, 158, 779–792. [Google Scholar] [CrossRef]
- Yao, Y.; Liu, D. Petrophysical properties and fluids trans portation in gas shale: A NMR relaxation spectrum analysis method. J. China Coal Soc. 2018, 43, 181–189. [Google Scholar]
- Suárez-Ruiz, I.; Flores, D.; Mendonça Filho, J.G.; Hackley, P.C. Review and update of the applications of organic petrology: Part 1, Geological Applications. Int. J. Coal Geol. 2012, 99, 54–112. [Google Scholar] [CrossRef]
- Flores, R.M. Coal and Coalbed Gas: Fueling the Future: Chapter 4-Coalification, Gasification, and Gas Storage; Elsevier: Waltham, MA, USA, 2014; pp. 167–233. [Google Scholar]
- Wang, A.; Wei, Y.; Yuan, Y.; Li, C.; Li, Y.; Cao, D. Coalbed methane reservoirs’ pore-structure characterization of different macrolithotypes in the southern Junggar Basin of Northwest China. Mar. Pet. Geol. 2017, 86, 675–688. [Google Scholar] [CrossRef]
- Jin, K.; Xian, J. Automatic test for coal fraction quantification and vitrinite reflectance determination. J. China Inst. Min. Technol. 1986, 1, 8. [Google Scholar]
- Harris, L.A.; Yust, C.S. Transmission electron microscope observations of porosity in coal. Fuel 1976, 55, 233–236. [Google Scholar] [CrossRef]
- Karayiğit, A.I.; Bircan, C.; Mastalerz, M.; Oskay, R.G.; Querol, X.; Lieberman, N.R.; Türkmen, I. Coal characteristics, elemental composition and modes of occurrence of some elements in the İsaalan coal (Balıkesir, NW Turkey). Int. J. Coal Geol. 2017, 172, 43–59. [Google Scholar] [CrossRef]
- Mardon, S.M.; Eble, C.F.; Hower, J.C.; Takacs, K.; Mastalerz, M.; Bustin, R.M. Organic petrology, geochemistry, gas content and gas composition of Middle Pennsylvanian age coal beds in the Eastern Interior (Illinois) Basin: Implications for CBM development and carbon sequestration. Int. J. Coal Geol. 2014, 127, 56–74. [Google Scholar] [CrossRef]
- Chen, P.; Bo, D.; Zhao, Y. Analysis of Main Controlling Factors of Coal Reservoir Reservoir Performance. J. Oil Gas Technol. 2010, 32, 13–21. [Google Scholar]
- Xiang, J.; Li, X.; Gao, W.; Liu, Y.; Li, J.; Yang, J.; Gong, Y. Molecular Dynamics Simulation of Methane Adsorption and Diffusion: A Case Study of Low-Rank Coal in Fukang Area, Southern Junggar Basin. Minerals 2023, 13, 229. [Google Scholar] [CrossRef]
- Thommes, M.; Kaneko, K.; Neimark, A.V.; Olivier, J.P.; Rodriguez-Reinoso, F.; Rouquerol, J. Physisorption of gases, with special reference to the evaluation of surface area and pore size distribution (IUPAC Technical Report). Pure Appl. Chem. 2015, 87, 1051–1069. [Google Scholar] [CrossRef]


| Sample | Ro,max/%(avg.) | Macerals (Volume Fraction) (%) | Industrial Analysis (Mass Fraction) (%) | |||||
|---|---|---|---|---|---|---|---|---|
| Vitrinite | Inertinite | Exinite | Mineral | Mad | Aad | Vad | ||
| DAX-1 | 0.70 | 72.71 | 18.22 | 9.08 | 0.00 | 9.64 | 2.4 | 21.49 |
| CHE-2 | 0.57 | 65.62 | 32.08 | 2.31 | 0.00 | 4.29 | 5.7 | 36.63 |
| CHE-3 | 0.62 | 55.61 | 43.07 | 1.32 | 0.00 | 6.15 | 8.36 | 38.15 |
| XGG-1 | 0.65 | 62.50 | 34.05 | 3.45 | 0.00 | 2.24 | 5.08 | 34.15 |
| XGG-2 | 0.64 | 57.84 | 37.08 | 5.08 | 0.00 | 2.09 | 5.72 | 35.45 |
| TAX-1 | 0.68 | 81.93 | 15.67 | 2.40 | 0.00 | 2.32 | 24.13 | 25.20 |
| TAX-2 | 0.69 | 61.42 | 33.71 | 4.87 | 0.00 | 4.06 | 9.64 | 34.97 |
| TAX-3 | 0.69 | 59.60 | 37.80 | 2.60 | 0.00 | 4.15 | 13.88 | 39.19 |
| LIU-2 | 0.49 | 39.58 | 53.14 | 7.28 | 0.00 | 4.77 | 6.44 | 31.99 |
| LIU-3 | 0.41 | 41.70 | 55.32 | 1.06 | 1.91 | 3.69 | 2.8 | 32.95 |
| NAN-1 | 0.62 | 45.61 | 48.92 | 5.47 | 0.00 | 3.78 | 5.48 | 32.79 |
| NAN-2 | 0.59 | 54.61 | 38.32 | 7.07 | 0.00 | 5.43 | 2.91 | 32.8 |
| MMC2-2 | 0.64 | 74.32 | 19.15 | 3.61 | 2.92 | 4.47 | 6.00 | 33.94 |
| MMC3-1 | 0.60 | 59.50 | 38.39 | 0.58 | 1.54 | 4.36 | 8.93 | 31.50 |
| MMC3-2 | 0.58 | 53.80 | 43.41 | 1.30 | 1.48 | 4.34 | 9.67 | 36.00 |
| KUA-1 | 0.59 | 58.85 | 36.21 | 3.29 | 1.65 | 9.64 | 2.40 | 21.49 |
| KUA-2 | 0.64 | 53.38 | 42.62 | 1.48 | 2.53 | 4.29 | 5.70 | 36.63 |
| KUA-3 | 0.64 | 69.75 | 24.85 | 2.80 | 2.60 | 6.15 | 8.36 | 38.15 |
| Sample | Depth (m) | Oven-Dry Signal Quantity | Saturated Signal Quantity | Oven-Dry Weight (g) | Saturated Weight (g) | Volume (mL) | NMR Porosity (%) | Gravimetric Porosity (%) |
|---|---|---|---|---|---|---|---|---|
| MMC2-1 | 640.75 | 3129.158 | 11295.94 | 13.5735 | 14.1512 | 10.99 | 4.45 | 5.26 |
| MMC2-2 | 647.41 | 8008.744 | 20425.67 | 13.897 | 14.7033 | 10.92 | 6.97 | 7.38 |
| MMC3-1 | 675.30 | 3238.128 | 10874.41 | 11.9931 | 12.5652 | 9.55 | 4.76 | 5.99 |
| MMC3-2 | 730.12 | 6181.906 | 2979.59 | 17.7155 | 18.5331 | 13.90 | 5.86 | 5.88 |
| MMC3-3 | 728.66 | 7041.550 | 4071.01 | 18.1116 | 19.0668 | 13.62 | 6.79 | 7.01 |
| MMC3-4 | 782.86 | 3681.808 | 18371.01 | 13.4865 | 14.5027 | 10.95 | 8.28 | 9.28 |
| XHC2-1 | 793.93 | 6009.474 | 16899.78 | 14.4926 | 15.2164 | 11.31 | 5.86 | 6.40 |
| XHC2-2 | 790.65 | 3888.061 | 12686.29 | 15.3458 | 15.9387 | 12.01 | 4.40 | 4.94 |
| XHC2-3 | 821.63 | 4324.343 | 15592.78 | 13.4558 | 14.1940 | 10.69 | 6.43 | 6.91 |
| XWC1-1 | 883.62 | 3252.480 | 11951.41 | 14.3445 | 14.9602 | 11.55 | 4.53 | 5.33 |
| XWC1-2 | 901.82 | 3649.538 | 11038.91 | 13.3186 | 13.7849 | 10.38 | 4.23 | 4.49 |
| XWC1-3 | 916.63 | 3430.437 | 15266.30 | 13.3330 | 14.0405 | 10.77 | 6.72 | 6.57 |
| Sample | T2 Cutoff Value (ms) | Irreducible Fluid Saturation (%) | Movable Fluid Saturation (%) | NMR Permeability (10−3 μm2) |
|---|---|---|---|---|
| MMC2-1 | 13.5735 | 66.66 | 33.34 | 0.0098 |
| MMC2-2 | 13.897 | 83.23 | 16.77 | 0.0096 |
| MMC3-1 | 11.9931 | 65.11 | 34.89 | 0.0113 |
| MMC3-2 | 17.7155 | 48.33 | 51.67 | 0.1347 |
| MMC3-3 | 18.1116 | 57.71 | 42.29 | 0.1144 |
| MMC3-4 | 13.4865 | 64.63 | 35.37 | 0.0117 |
| XHC2-1 | 14.4926 | 80.24 | 19.76 | 0.0024 |
| XHC2-2 | 15.3458 | 46.37 | 53.63 | 0.0501 |
| XHC2-3 | 13.4558 | 80.34 | 19.66 | 0.0102 |
| XWC1-1 | 14.3445 | 74.55 | 25.45 | 0.0049 |
| XWC1-2 | 13.3186 | 69.68 | 30.32 | 0.0060 |
| XWC1-3 | 13.3330 | 65.98 | 34.02 | 0.0542 |
| Sample | Porosity (%) | Permeability (10−3 μm2) | Displacement Pressure (MPa) | Mercury Ejection Efficiency (%) | Average Throat Radius (μm) | Average Pore Radius (μm) | Pore Distribution (%) | ||
|---|---|---|---|---|---|---|---|---|---|
| Micro–Fine Pore | Mesopore | Macropore | |||||||
| DAX-1 | 6.00 | 0.541 | 0.025 | 47.76 | 5.621 | 184.981 | 62.23 | 17.91 | 19.86 |
| CHE-2 | 3.18 | 8.362 | 0.018 | 65.81 | 10.239 | 183.945 | 75.78 | 15.46 | 7.57 |
| CHE-3 | 2.85 | 0.121 | 0.105 | 63.57 | 4.791 | 165.269 | 82.16 | 10.78 | 6.35 |
| XGG-1 | 6.74 | 0.185 | 0.050 | 49.75 | 5.334 | 187.163 | 75.41 | 9.83 | 14.76 |
| XGG-2 | 3.49 | 0.017 | 0.020 | 46.33 | 4.464 | 171.084 | 73.86 | 18.93 | 7.21 |
| TAX-1 | 6.71 | 1.863 | 0.025 | 57.12 | 5.471 | 180.421 | 55.24 | 27.75 | 17.01 |
| TAX-2 | 4.20 | 0.184 | 0.021 | 76.32 | 5.233 | 163.788 | 66.39 | 24.34 | 9.27 |
| TAX-3 | 3.80 | 0.050 | 0.021 | 55.76 | 5.451 | 163.561 | 67.65 | 23.05 | 9.30 |
| LIU-2 | 1.49 | 0.042 | 0.066 | 58.43 | 6.581 | 178.870 | 85.3 | 9.67 | 5.47 |
| LIU-3 | 1.56 | 0.001 | 0.353 | 81.65 | 2.701 | 172.677 | 81.09 | 11.23 | 9.02 |
| NAS-1 | 2.21 | 0.132 | 0.059 | 72.46 | 4.415 | 158.612 | 50.71 | 27.68 | 21.61 |
| NAS-2 | 2.32 | 0.085 | 0.090 | 85.78 | 5.033 | 185.663 | 63.63 | 13.81 | 22.56 |
| MMC-2 | 4.48 | 0.010 | 0.141 | 57.80 | 4.764 | 177.563 | 58.31 | 9.47 | 32.22 |
| KUA-1 | 3.17 | 0.130 | 0.261 | 83.01 | 5.353 | 169.862 | 73.82 | 10.47 | 15.71 |
| KUA-2 | 4.34 | 1.080 | 5.503 | 72.43 | 5.249 | 168.201 | 78.66 | 14.18 | 7.16 |
| KUA-3 | 4.28 | 0.001 | 13.655 | 85.96 | 5.011 | 165.566 | 84.78 | 8.70 | 6.52 |
| KUA-4 | 4.31 | 0.005 | 13.532 | 81.77 | 5.231 | 164.450 | 80.35 | 11.09 | 8.57 |
| KUA-5 | 4.48 | 0.002 | 5.485 | 72.88 | 5.360 | 168.668 | 82.79 | 10.38 | 6.82 |
Disclaimer/Publisher’s Note: The statements, opinions and data contained in all publications are solely those of the individual author(s) and contributor(s) and not of MDPI and/or the editor(s). MDPI and/or the editor(s) disclaim responsibility for any injury to people or property resulting from any ideas, methods, instructions or products referred to in the content. |
© 2024 by the authors. Licensee MDPI, Basel, Switzerland. This article is an open access article distributed under the terms and conditions of the Creative Commons Attribution (CC BY) license (https://creativecommons.org/licenses/by/4.0/).
Share and Cite
Yuan, Y.; Tang, Y.; Tong, L.; Cao, D.; Wei, Y.; Bi, C. Porosity Characteristics of Coal Seams and the Control Mechanisms of Coal Petrology in the Xishanyao Formation in the Western Part of the Southern Junggar Basin. Minerals 2024, 14, 543. https://doi.org/10.3390/min14060543
Yuan Y, Tang Y, Tong L, Cao D, Wei Y, Bi C. Porosity Characteristics of Coal Seams and the Control Mechanisms of Coal Petrology in the Xishanyao Formation in the Western Part of the Southern Junggar Basin. Minerals. 2024; 14(6):543. https://doi.org/10.3390/min14060543
Chicago/Turabian StyleYuan, Yuan, Yue Tang, Lihua Tong, Daiyong Cao, Yingchun Wei, and Caiqin Bi. 2024. "Porosity Characteristics of Coal Seams and the Control Mechanisms of Coal Petrology in the Xishanyao Formation in the Western Part of the Southern Junggar Basin" Minerals 14, no. 6: 543. https://doi.org/10.3390/min14060543
APA StyleYuan, Y., Tang, Y., Tong, L., Cao, D., Wei, Y., & Bi, C. (2024). Porosity Characteristics of Coal Seams and the Control Mechanisms of Coal Petrology in the Xishanyao Formation in the Western Part of the Southern Junggar Basin. Minerals, 14(6), 543. https://doi.org/10.3390/min14060543