Article

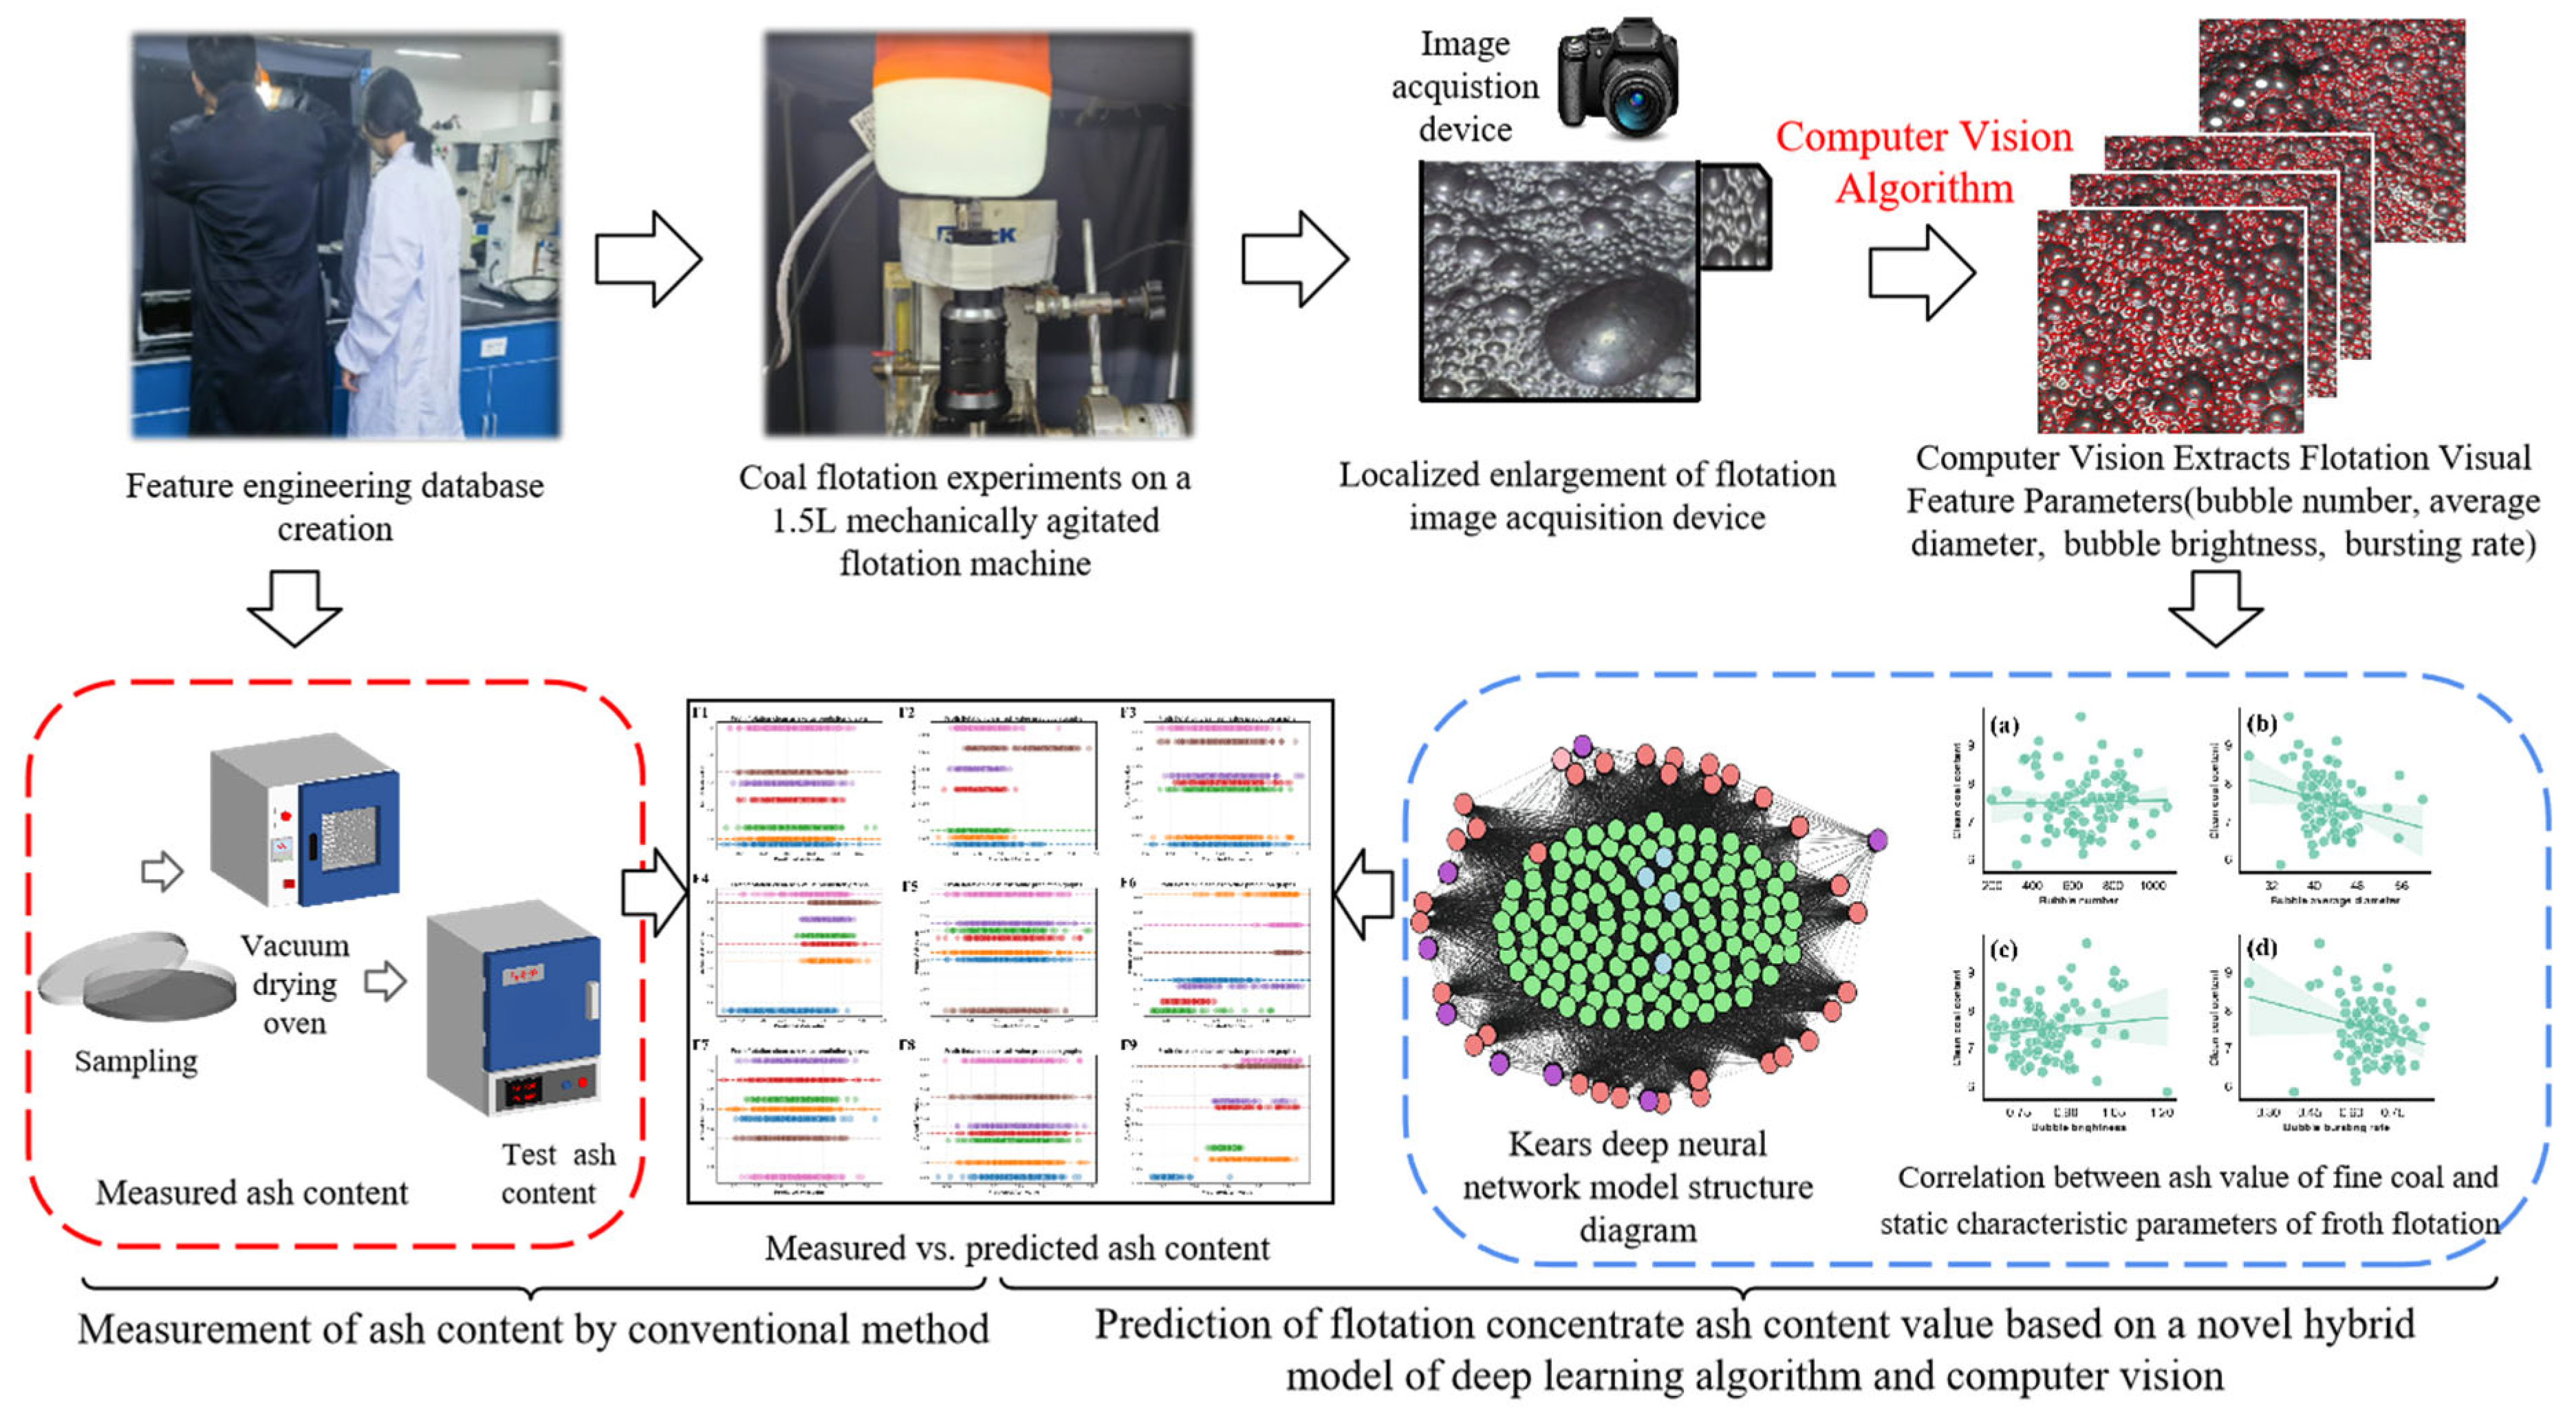
Investigating the Influence of Froth Image Attributes on Clean Coal Ash Content: A Novel Hybrid Model Employing Deep Learning and Computer Vision Techniques for Prediction Exploration

1
School of Materials Science and Engineering, Anhui University of Science and Technology, Huainan 232001, China
2
Beijing Polytechnic, Beijing 100176, China
*
Author to whom correspondence should be addressed.
Minerals 2024, 14(6), 536; https://doi.org/10.3390/min14060536
Submission received: 19 February 2024 / Revised: 7 May 2024 / Accepted: 20 May 2024 / Published: 22 May 2024
(This article belongs to the Section Mineral Processing and Extractive Metallurgy)

Abstract

:
In froth flotation, one of the pivotal metrics employed to evaluate the flotation efficacy is the clean ash content, given its widely acknowledged status as a paramount gauge of coal quality. Leveraging deep learning and computer vision, our study achieved the dynamic recognition of coal flotation froth, a key element for predicting and controlling the ash content in coal concentrate. A comprehensive dataset, assembled from 90 froth flotation videos, provided 16,200 images for analysis. These images revealed key froth characteristics including bubble diameter, quantity, brightness, and bursting rate. We employed Keras to build a comprehensive deep neural network model, incorporating multiple features and mixed data inputs, and subsequently trained it with a rigorous 10-fold cross-validation strategy. Our model was evaluated using robust metrics including the mean squared error, mean absolute error, and root mean squared error, demonstrating a high precision with respective values of 0.003017%, 0.053385%, and 0.042640%. With this innovative approach, our work significantly enhances the accuracy of ash content prediction and provides an important breakthrough for the intelligent advancement and efficiency of froth flotation processes in the coal industry.

1. Introduction

Artificial intelligence (AI) has emerged as a pivotal driver in the contemporary technological revolution and industrial metamorphosis, facilitating the transition to green practices and fostering low-carbon development in coal processing plants, thereby fostering the advancement of novel productivity paradigms. Froth flotation stands as a cornerstone technique in mineral processing, leveraging flotation reagents to produce bubbles and augment mineral grade. However, due to the intricate nature of the process, the frequent oscillations in ore composition, and the manifold operating conditions, production processes heavily rely on operators’ experiential acumen and visual analyses to discern flotation statuses. Operators adjust reagent dosages contingent on the visual characteristics of froth to regulate flotation statuses. Nonetheless, issues arising from human subjectivity, analytical inaccuracies, and inefficiencies impede timely responses to raw material variations, thereby impacting process stability, fluctuations in production metrics, and the inconsistency of product quality. Within coal froth flotation, one pivotal indicator for assessing flotation efficacy lies in the ash content of clean coal, widely regarded as a cardinal metric for gauging coal quality. Conventional methodologies for determining clean coal ash content entail multiple cumbersome procedures, are time-intensive, and fall short of fulfilling real-time control requisites. In flotation processes necessitating real-time control, conventional lagging methodologies for measuring the clean coal ash content prove inadequate, failing to flexibly adapt to changes in flotation input conditions.
Since the latter period of the 1980s, research and development endeavors in machine vision within froth flotation systems have steadily progressed. By accurately and expeditiously extracting static and dynamic features from froth flotation images and furnishing feedback to operators or process control systems, machine vision has supplanted traditional subjective adjustment methodologies. This extensive deployment of technology circumvents issues of subjectivity and precision inadequacies, thereby enhancing the stability and efficiency of the flotation process. Despite significant strides in the application of machine vision in froth flotation, establishing correlations between the clean coal ash content and froth characteristics remains challenging. Consequently, researchers resort to other variables to infer process performance. With the continuous evolution of AI technology, the advancement of machine vision technology in this domain remains ongoing.
In the early 1990s, it was postulated that the appearance of froth could serve as a robust qualitative indicator of process performance. Woodburn et al. (1992) proposed that optimal froth structures could be discerned through image analysis techniques, although the implementation of machine vision systems was hampered by the complexity of froth-related issues, particularly in image analysis and flotation aspects [1]. Symonds (1992) explored the application of digital image processing in characterizing surface froth structures in industrial flotation machines, successfully devising morphological image processing techniques for segmenting surface froth images [2]. Moolman and Aldrich (1994) employed machine vision systems to process video data of froth phases in a copper flotation plant, demonstrating the system’s ability to differentiate froth of varying copper contents and extract global features from visual characteristics of surface froth [3]. Moolman and Eksteen (1996) corroborated the efficacy of machine vision systems in addressing general issues in flotation plants, underscoring the benefits of efficient data acquisition, particularly in flotation plants with low levels of online monitoring systems [4]. Machine vision can be employed to investigate the visual appearance of froth surfaces, delineating morphological and color characteristics of froth. Parameters such as froth velocity, stability, bubble size, color, and texture are deemed pivotal visual features in controlling flotation performance, correlating with metallurgical performance parameters.
In the early 2000s, increasing recognition emerged regarding the potential of the froth’s appearance as a robust qualitative indicator of process performance. Bonifazi and Massacci (2000) explored the feasibility of the 3D reconstruction of froth surfaces through watershed segmentation, morphology, and morphometric analysis, constructing a 3D model of froth [5]. Bonifazi and Serranti (2001) introduced image processing techniques for the automatic measurement of froth bubble color and structure, with a focus on digital sample images collected from industrial flotation plants [6]. Holtham and Nguyen (2002) emphasized the wide-ranging application of low-cost image analysis hardware facilitated by the computer revolution, detailing the spectral texture and pixel tracking technology of JKFrothCam [7]. Citir et al. (2004) discussed the efficacy of froth flotation in separating sulfur and fine minerals, as well as the advantages of employing image analysis to determine reagent dosage [8]. Bartolacci et al. (2006) utilized Multivariate Image Analysis (MIA) to analyze froth, establishing an empirical model for predicting the froth grade [9]. Liu and MacGregor (2008) expounded novel methods for froth-based flotation modeling and control, achieving a controlled performance with specified froth appearance [10]. Despite some progress, results pertaining to the relationship between the clean coal grade, clean coal ash content, and froth image features remain inconsistent, necessitating further research to evaluate the predictability of froth characteristics. Despite two decades of research and development, the realization of long-term fully automated control systems employing machine vision remains elusive.
Since 2010, researchers have extensively emphasized the application of machine vision-based dynamic analysis in the realm of flotation. Aldrich and Marais (2010) underscored the advantages of this application owing to improvements in computational capabilities, which could be harnessed for the control, modeling, and prediction of the flotation process [11]. Bergh and Yianatos (2011) delved into the successful application of multivariate predictive control in other processes, analyzing the characteristics of the flotation process, the quality of key variable measurements, and the applicability of dynamic models in predictive control [12]. Morar et al. (2012) posited machine vision as a non-intrusive instrument for obtaining information pertaining to the performance of froth flotation stages, particularly in predicting performance factors [13]. Mehrabi et al. (2014) conducted studies on the continuous control of froth flotation, focusing on monitoring and controlling flotation circuits based on major visual features [14]. Zhang et al. (2014) proposed a method for predicting coarse coal ash content based on image analysis and support vector machines, while Massinaei and Jahedsaravaniet al. (2016–2020) successfully integrated machine vision with fuzzy logic, achieving the diagnosis of flotation column process conditions [15,16,17,18]. Recent research by Jia et al. (2023) has demonstrated that the efficiency of image storage can be significantly improved through image compression and reconstruction methods [19].
In summary, as one of the pivotal technologies in mineral processing, froth flotation exerts a significant influence on product quality. Conventional operating methodologies suffer from issues of subjectivity and instability, necessitating the integration of machine vision technology for real-time monitoring and control. With the continuous advancement of AI technology, significant progress has been made in machine vision-based froth flotation systems. Nonetheless, establishing correlations between the clean coal ash content and measurable attributes of froth stages remains challenging. In this regard, novel hybrid models based on deep learning algorithms and computer vision offer fresh insights and possibilities for addressing this issue. Through in-depth research and the prediction of the static features of froth images, flotation effectiveness can be more accurately assessed, thereby achieving the effective prediction and control of the clean coal ash content. Continued research in this field will provide vital support for the green transformation and low-carbon development of the mineral processing industry, further promoting the development of new productivity paradigms.

2. Flotation Experiments and Data Collection

2.1. Experimental Environment

In this investigation, Python was employed as the primary platform for all software development endeavors. The recognition and extraction of static feature parameters were executed through the application of sophisticated computer vision and deep learning algorithms. Noteworthy contributions were made by prominent software packages including Scikit-learn, TensorFlow, and Keras. The experimental environment, primarily utilizing relevant libraries, is as shown in Table 1. To optimize the efficacy of the training process, a robust infrastructure was established, featuring a service workstation equipped with an Intel i9-13900K CPU(Intel, Santa Clara, CA, USA) and 128 GB of RAM. The experimental procedures were conducted within the confines of a 1.5 L mechanical agitation flotation cell housed in the flotation laboratory. Positioned approximately 30 cm above the froth surface, a MV-CS200-10GC(HIKROBOT, Hangzhou, China) camera was meticulously placed at the apex of the flotation cell. Ensuring controlled imaging conditions, a shading hood was meticulously deployed to obviate extraneous light sources, with supplementary illumination provided by an LED lamp (240 W) situated atop the shading hood frame. Moreover, a dust box mechanism was integrated to facilitate the removal of particulate matter, thereby fostering a conducive environment for the acquisition of images.

2.2. Flotation Experiments

The coal specimens employed in this investigation were procured from the Panji Coal Preparation Plant located in Huainan, Anhui Province, China. Specifically, coal samples with a particle size distribution below 0.5 mm were selected for the flotation experiments. The flotation procedures strictly adhered to the protocols outlined in the “GB/T 30046.1-2013 Coal Powder (Slurry) Flotation Test” standard [20]. Subsequently, all collected concentrate samples obtained during the flotation process underwent filtration. Following filtration, the samples were subjected to an 8 h drying period in a drying oven maintained at a temperature of 75 °C. The ash content of the samples was quantified utilizing the combustion weighing method. The proposed method of predicting coal clean ash content in this study is compared with the traditional ash measurement technique in the process flowchart shown in Figure 1.

2.3. Data Acquisition

During the flotation experiments, once the flotation froth layer was established, the equipment parameters were adjusted to the anticipated values and maintained for a duration of 2 min. Subsequently, data collection commenced upon achieving a stable operational state of flotation. Following the methodology proposed by A. Mehrabi for monitoring industrial flotation cells in iron flotation plants, flotation video data were collected for 11 distinct process parameter conditions [14]. A total of 81 videos were amassed by A. Jahedsaravani for the development of a neural network-based flotation process model and the establishment of a flotation machine vision system, covering various flotation experiments conducted under different process conditions [15]. Additionally, C. Marais obtained 6856 images from an industrial platinum flotation plant in South Africa, capturing data under four distinct operating scenarios [21]. Jiakun Tan conducted coal froth flotation experiments with a camera frame rate of 30 frames per second, a flotation duration of 50 s, resulting in the acquisition of 1500 images utilized for the analysis of coal ash content [22]. Consequently, a total of 90 independent process parameter conditions were devised for the flotation experiments, each corresponding to a unique set of experimental conditions. In each experiment, the froth surface was recorded by a camera once the flotation reached a stable operational state. A total of 90 video segments were obtained, each lasting approximately 1 min and corresponding to a specific ash content amount. Furthermore, 3 frames were extracted per second, with images of the same ash content value captured within the same video. In total, 16,200 images were extracted from these videos for model training and validation. These images were resized to 600 × 600 using bilinear interpolation to balance resource consumption and model performance. All collected images were randomly divided into two sets, with 30% of the images allocated for the test set and the remaining images divided into the training set (70%).

3. Froth Flotation Foam Feature Extraction

The collected froth flotation images underwent image preprocessing, utilizing a fixed threshold 5 × 5 convolutional kernel Sobel edge detection algorithm, followed by non-maximum suppression for refinement [23,24,25,26,27]. This process involved filtering [28], grayscale equalization [29], and edge extraction [30], ultimately converting the images into binary representations [31]. Given the complexity of the froth flotation video sequences, this study employed the Hough transform ellipse detection algorithm [32,33,34]. Static features of the froth images were investigated, primarily including bubble count, average bubble diameter, bubble brightness, and bubble bursting rate.

3.1. 5 × 5 Convolution Kernel Sobel Operator

Flotation is a dynamic process, and due to limitations in the performance of industrial cameras, it is inevitable to encounter some instances of image blurring during the image acquisition process. The Sobel operator not only yields superior detection outcomes but also exhibits a smoothing effect on noise, thereby mitigating the blurring artifacts in edge detection [24]. The TenenGrad function is employed to assess the degree of image blur, whereby a 5 × 5 convolutional kernel is utilized in conjunction with the Sobel operator to extract the gradient values in both the horizontal and vertical directions [23].
Image edges refer to regions within an image characterized by pronounced variations in grayscale, representing the pixels with the highest grayscale transitions [25]. The Sobel operator, also known as a gradient-based edge operator, belongs to the class of first-order derivative edge operators [23,24,25,26]. In the context of computer vision, when computing the difference in grayscale values for image pixels, the linear term in the Maclaurin series is commonly employed. Thus, the calculation of the first-order partial derivative of this difference corresponds to the image gradient value at that specific location.
The horizontal gradient of the image at a specific x coordinate, denoted as G x , can be calculated by employing the forward difference method to compute its first-order partial derivative with respect to x .
g x = f ( x , y ) x = f ( x + 1 , y ) ( x , y )
The column-wise gradient of the image at a given y coordinate, denoted as G y , can be determined by employing the backward differencing scheme to calculate its first-order partial derivative with respect to y .
g y = f ( x , y ) y = f ( x , y + 1 ) f ( x , y )
The Sobel operator is employed to perform convolution on each frame of the foam flotation video using a 5 × 5 kernel. The kernel encompasses two distinct templates: a template for computing the gradient in the row direction and another template for computing the gradient in the column direction. These templates are specifically designed for the purpose of edge detection. The Sobel operator templates used for edge detection in this study are presented below:
G x = 5 4 0 4 5 8 10 0 10 8 10 20 0 20 10 8 10 0 10 8 5 4 0 4 5 G y = 5 8 10 8 5 4 10 20 10 4 0 0 0 0 0 4 10 20 10 4 5 8 10 8 5
The gradient of an image corresponds to the first-order derivative in the two-dimensional domain. At the ( x , y ) coordinates, the gradient plane vector of the image f ( x , y ) is represented by f ( x , y ) .
f g r a d ( f ) = [ g x , g y ] T = f x , f y T
The total gradient, denoted as ( x , y ) :
( x , y ) = m a g ( f ) = g x   2 + g y   2
The total gradient is simplified:
( x , y ) g x + g y
Then, the froth flotation image gradient is calculated:
G ( i , j ) = G x + G y

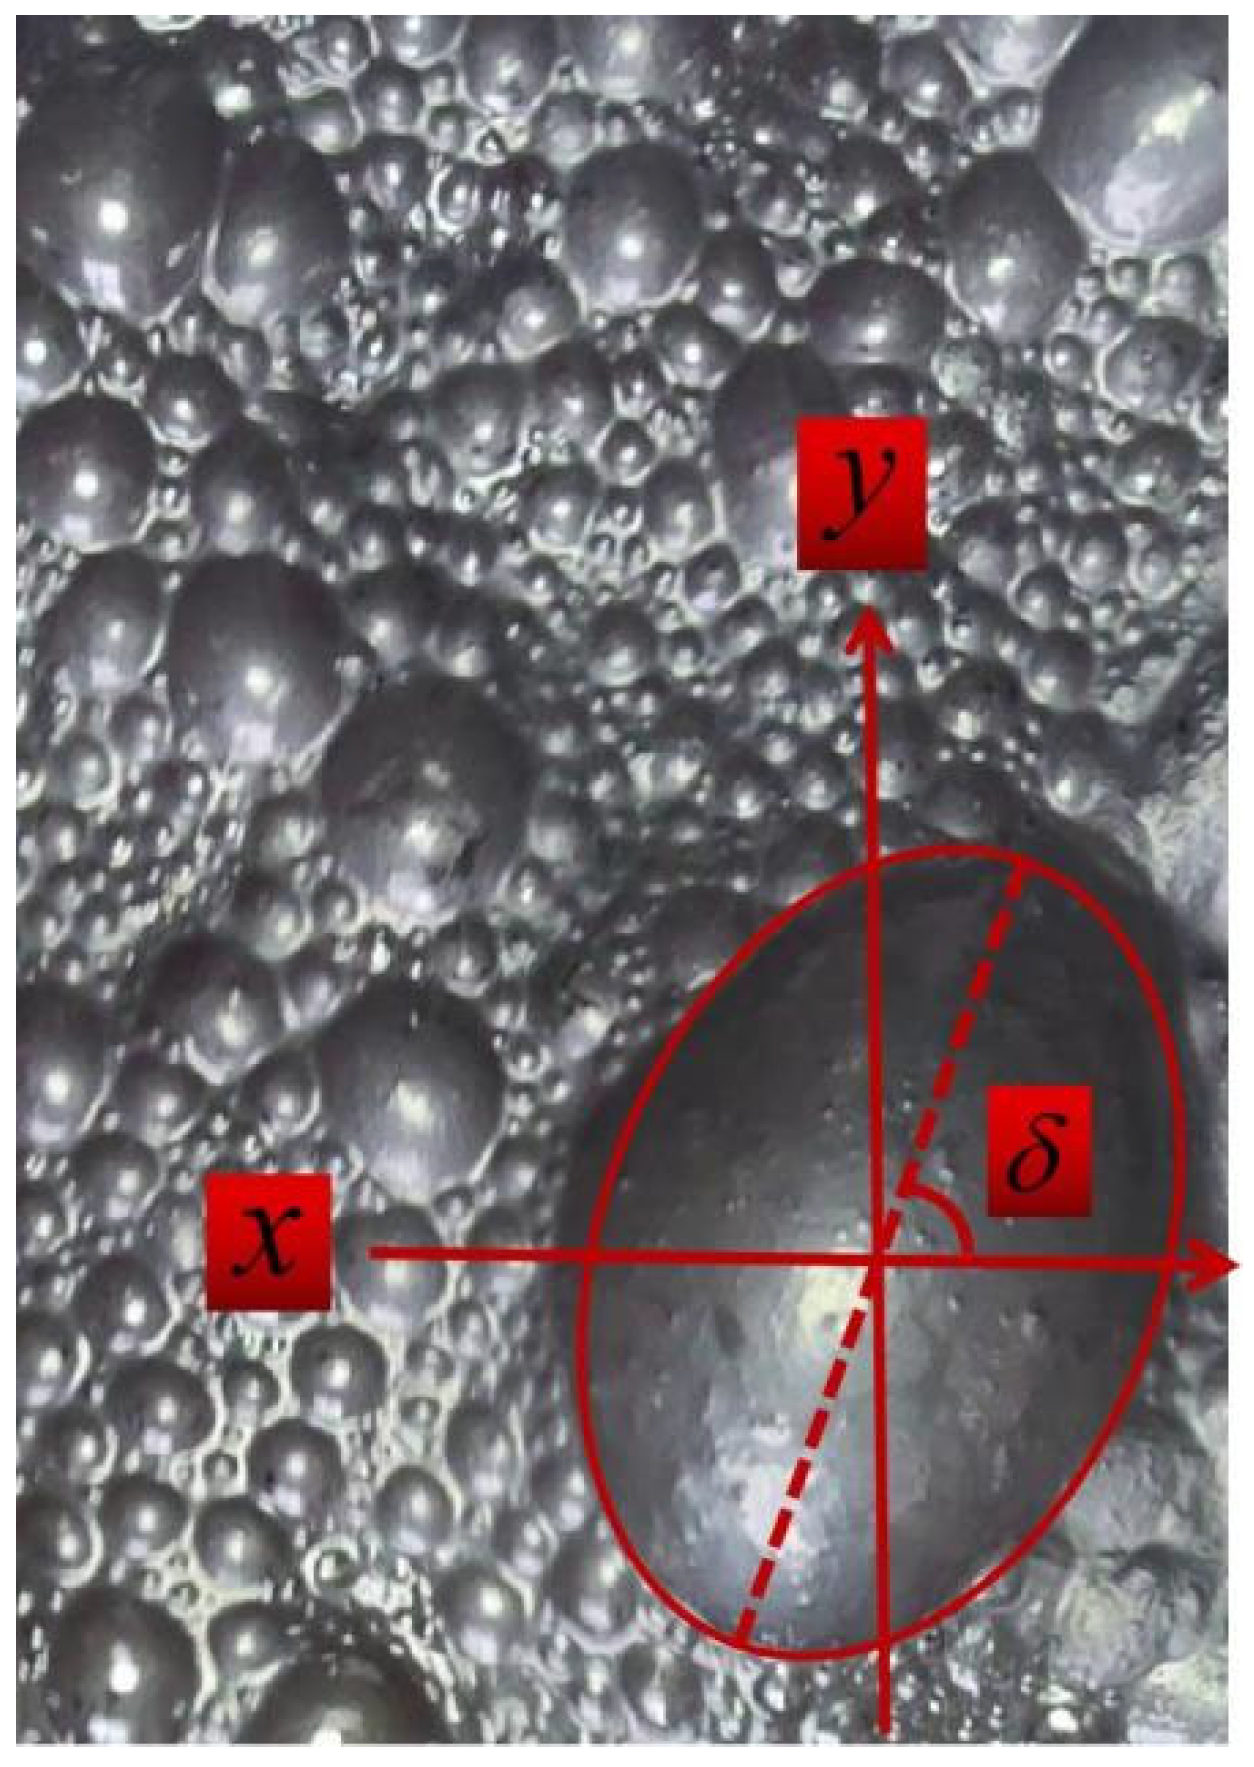
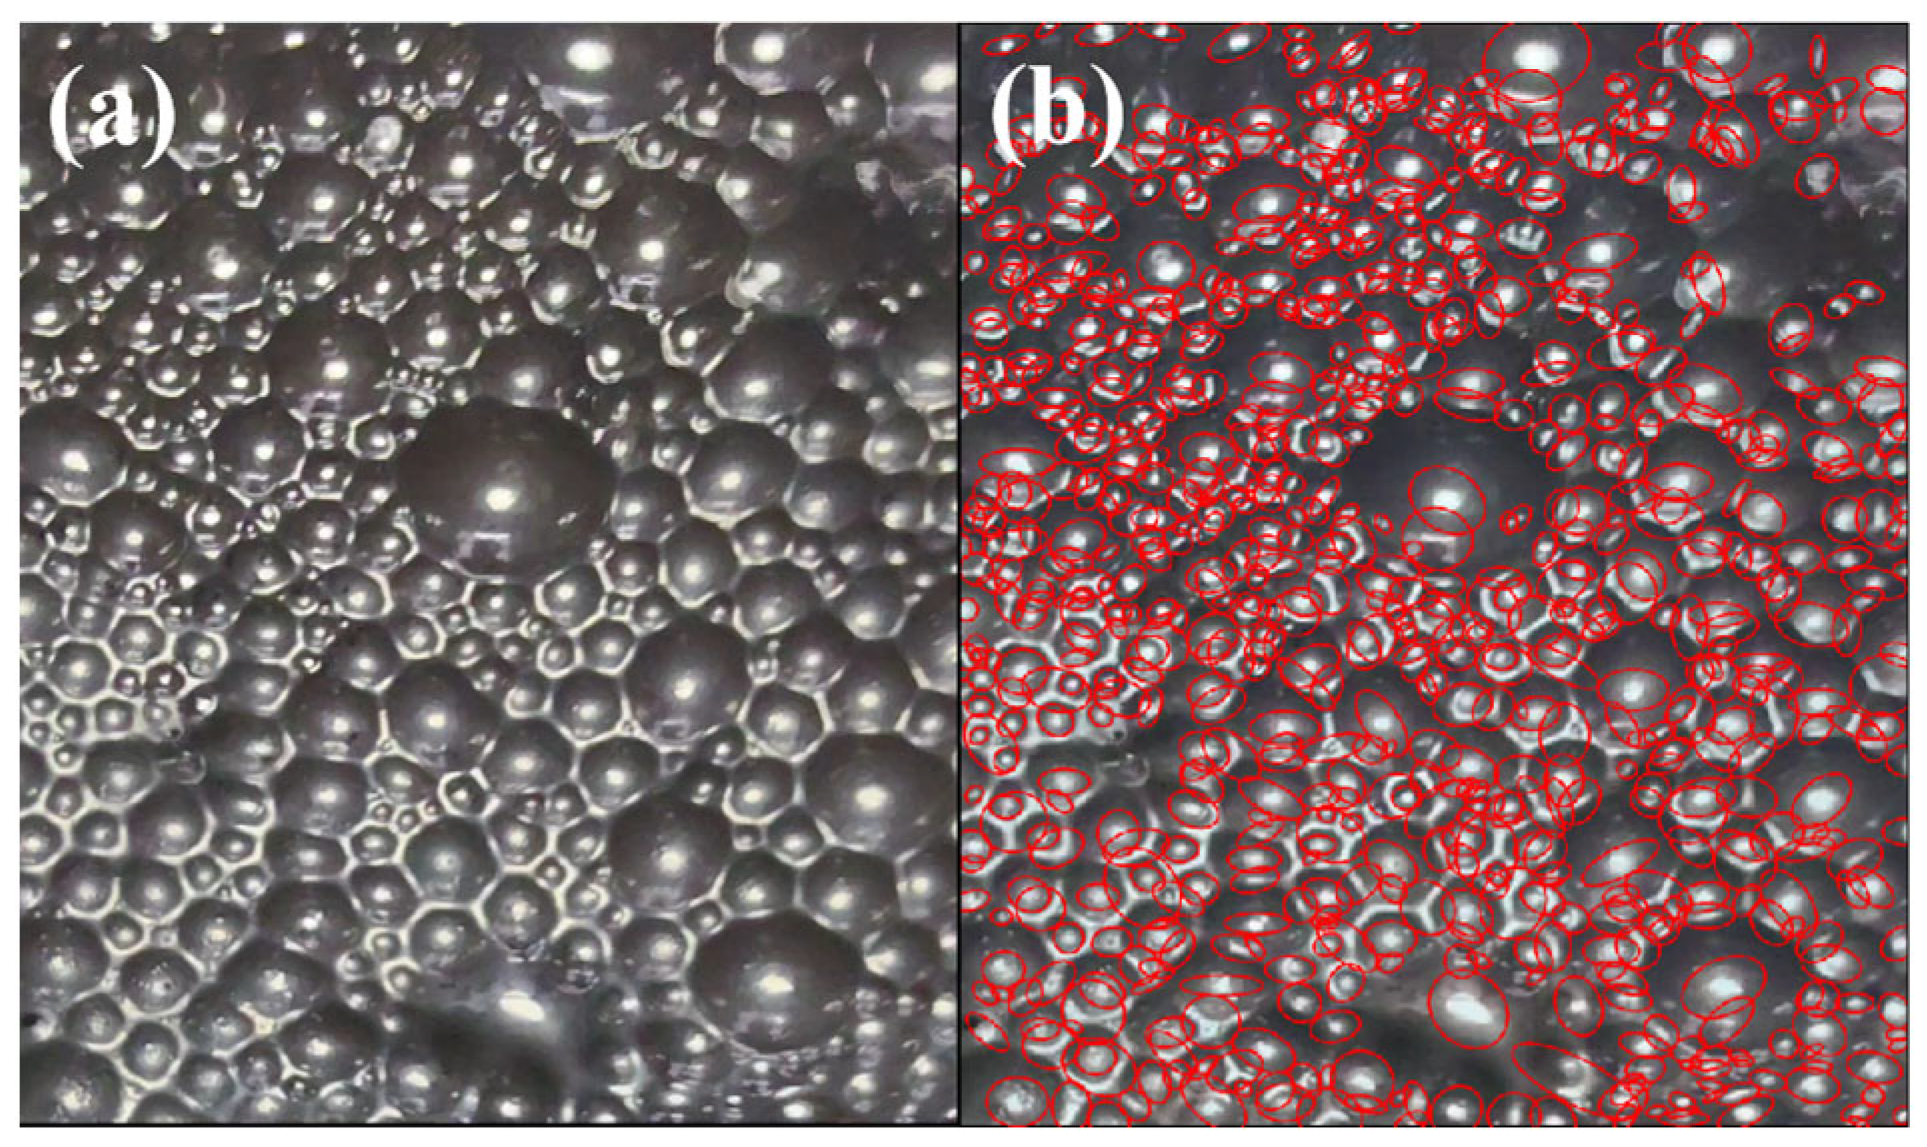
3.2. The Size and Quantity of Bubbles

Regarding the intricacy of the froth flotation video sequence, the Hough transform-based algorithm for ellipse detection is employed, which utilizes a fixed-threshold 5 × 5 Sobel edge detection algorithm as its foundation and refines the results through non-maximum suppression techniques [26]. As for the concentric Hough transform algorithm for ellipse detection [31], the mathematical expression of an ellipse in the Cartesian coordinate system is derived from the fundamental definition of an ellipse:
2 ψ = ( e x λ x ) 2 + ( e y λ y ) 2 + ( e x μ x ) 2 + ( e y μ y ) 2
In the equation provided, the symbol e represents an arbitrary point residing on the elliptical contour, whereas λ and μ denote the coordinates of the two foci of the ellipse. Additionally, ψ signifies the semi-major axis length of the ellipse.
For any arbitrary ellipse, its mathematical relationship can be defined as follows:
f ( M x , M y , ψ , ξ , δ )
In the equation, M denotes the centroid of the ellipse, ξ represents the semi-minor axis length of the ellipse, and δ denotes the angle formed between the major axis of the ellipse and the x -axis, as shown in Figure 2.
Let e denote an arbitrary point situated on the elliptical curve, while η and γ refer to the extremities of the major axis. Once the precise positioning of η and γ along the ellipse is established, for the purpose of facilitating a comprehensive depiction of the ellipse in various orientations and locations, the angle δ formed between the major axis of the ellipse and the x -axis can be represented through the utilization of the two foci.
δ = sin 1 ( γ y η y γ x η x ) cos 1 ( γ y η y γ x η x )
In the equation f ( M x , M y , ψ , ξ , δ ) , the parameter ξ , representing the length of the minor axis, is the only unknown variable. By solving for ξ , the equation of any arbitrary ellipse can be precisely determined. Following the fundamental definition of an ellipse, we obtain the following:
λ x = M x cos δ ψ 2 ξ 2
λ y = M y sin δ ψ 2 ξ 2
μ x = M x + cos δ ψ 2 ξ 2
μ y = M y + sin δ ψ 2 ξ 2
ε = ( e y M y ) 2 + ( e x M x ) 2
ρ = sin δ ( e y M y ) + cos δ ( e x M x )
The following is obtained:
ξ = ψ 2 ε 2 ψ 2 ρ 2 ψ 2 ρ 2
Based on the aforementioned derivation, it is evident that once the endpoints η and γ of the major axis are determined, the variables M x , M y , ψ , and δ in equation f ( M x , M y , ψ , ξ , δ ) can be readily obtained. The only remaining unknown is ξ . Subsequently, a multitude of edge points, denoted as e , are deliberately selected, each assumed to lie on the ellipse. For each E point, the corresponding ξ value can be computed by employing ξ = ψ 2 ε 2 ψ 2 ρ 2 ψ 2 ρ 2 . The center point of the ellipse is determined through the utilization of the Hough circle detection algorithm, while the selection of the major axis endpoints is not arbitrary. Instead, the existence of the minor axis guides this process. Specifically, the ξ value is initially derived from the feature point pair that exhibits the minimum distance to ( M x , M y ) , under the assumption that this point pair represents the endpoints of the minor axis. Typically, the minor axis endpoints correspond to the pair of points with the smallest or a relatively smaller distance from ( M x , M y ) . This enables the swift acquisition of the true endpoints, thereby reducing the temporal complexity. Once the minor axis endpoints are determined, the ξ value can be computed accordingly. The algorithm terminates upon the completion of processing all point pairs. Figure 3 presents the visual depiction of the detected bubble size quantities.

3.3. Bubble Brightness

Brightness refers to the intensity or degree of brightness of the light reflected from the surface of an object [35]. In the context of froth flotation, the brightness can be used to describe the intensity of light on the froth surface, indicating the level of brightness or darkness of the emitted or reflected light by the froth. Therefore, the brightness feature of the froth can be roughly utilized to estimate the ash content of the clean coal within the froth, aligning with the operational practices commonly employed by flotation operators. For grayscale images, brightness can be directly obtained from the pixel values. Each froth’s brightness value corresponds to the pixel grayscale value, allowing for the extraction of corresponding statistical data. By calculating the average value of the pixel grayscale values in the statistical data, the average brightness value of all the froth samples can be derived. Subsequently, this average brightness value is divided by the average froth area to obtain the brightness of the froth. The specific formula is as follows:
F b r i g h t n e s s = i = 1 N t o t a l S i 1 + i = 1 N t o t a l ( S i μ S ) 2 N t o t a l × j = 1 M t o t a l E j 1 + j = 1 M t o t a l ( E j μ E ) 2 M t o t a l N t o t a l
In this context, S i represents the luminance value (pixel grayscale value) of the i -th bubble, N t o t a l denotes the total count of bubbles, E j signifies the area of the j -th ellipse, M t o t a l corresponds to the cumulative sum of ellipse areas, μ S represents the mean luminance value of the froth, and μ E represents the average area of the ellipses.

3.4. Bubble Bursting Rate

The bursting rate of bubble in froth flotation images refers to the frequency and extent of bubble bursting during the flotation process [36]. In froth flotation, the bursting of bubbles results in the release of surface active agents and gases, which in turn affects the flotation efficiency and ore separation effectiveness. By summing the ratios of the surface area of the bursting bubbles to the total surface area of all the bubbles, and then dividing by the total number of bubbles, the bursting score is obtained as follows:
R b u r s t = i = 1 N b u r s t A i A t o t a l 1 exp L i L max 2 2 i = 1 N b u r s t ( L i σ L ) 2 N b u r s t N t o t a l × 100 %
In this context, R b u r s t denotes the bubble rupture rate, N b u r s t signifies the count of ruptured bubbles, N t o t a l represents the total number of bubbles, A i denotes the surface area of the i -th ruptured bubble, A t o t a l represents the cumulative surface area of all bubbles, L i signifies the major axis of the i -th ruptured bubble, L max corresponds to the major axis of the largest bubble, and σ L represents the average major axis of the ruptured bubbles.

4. KERAS Deep Neural Network Modeling with Multiple Feature Inputs and Mixed Data Inputs

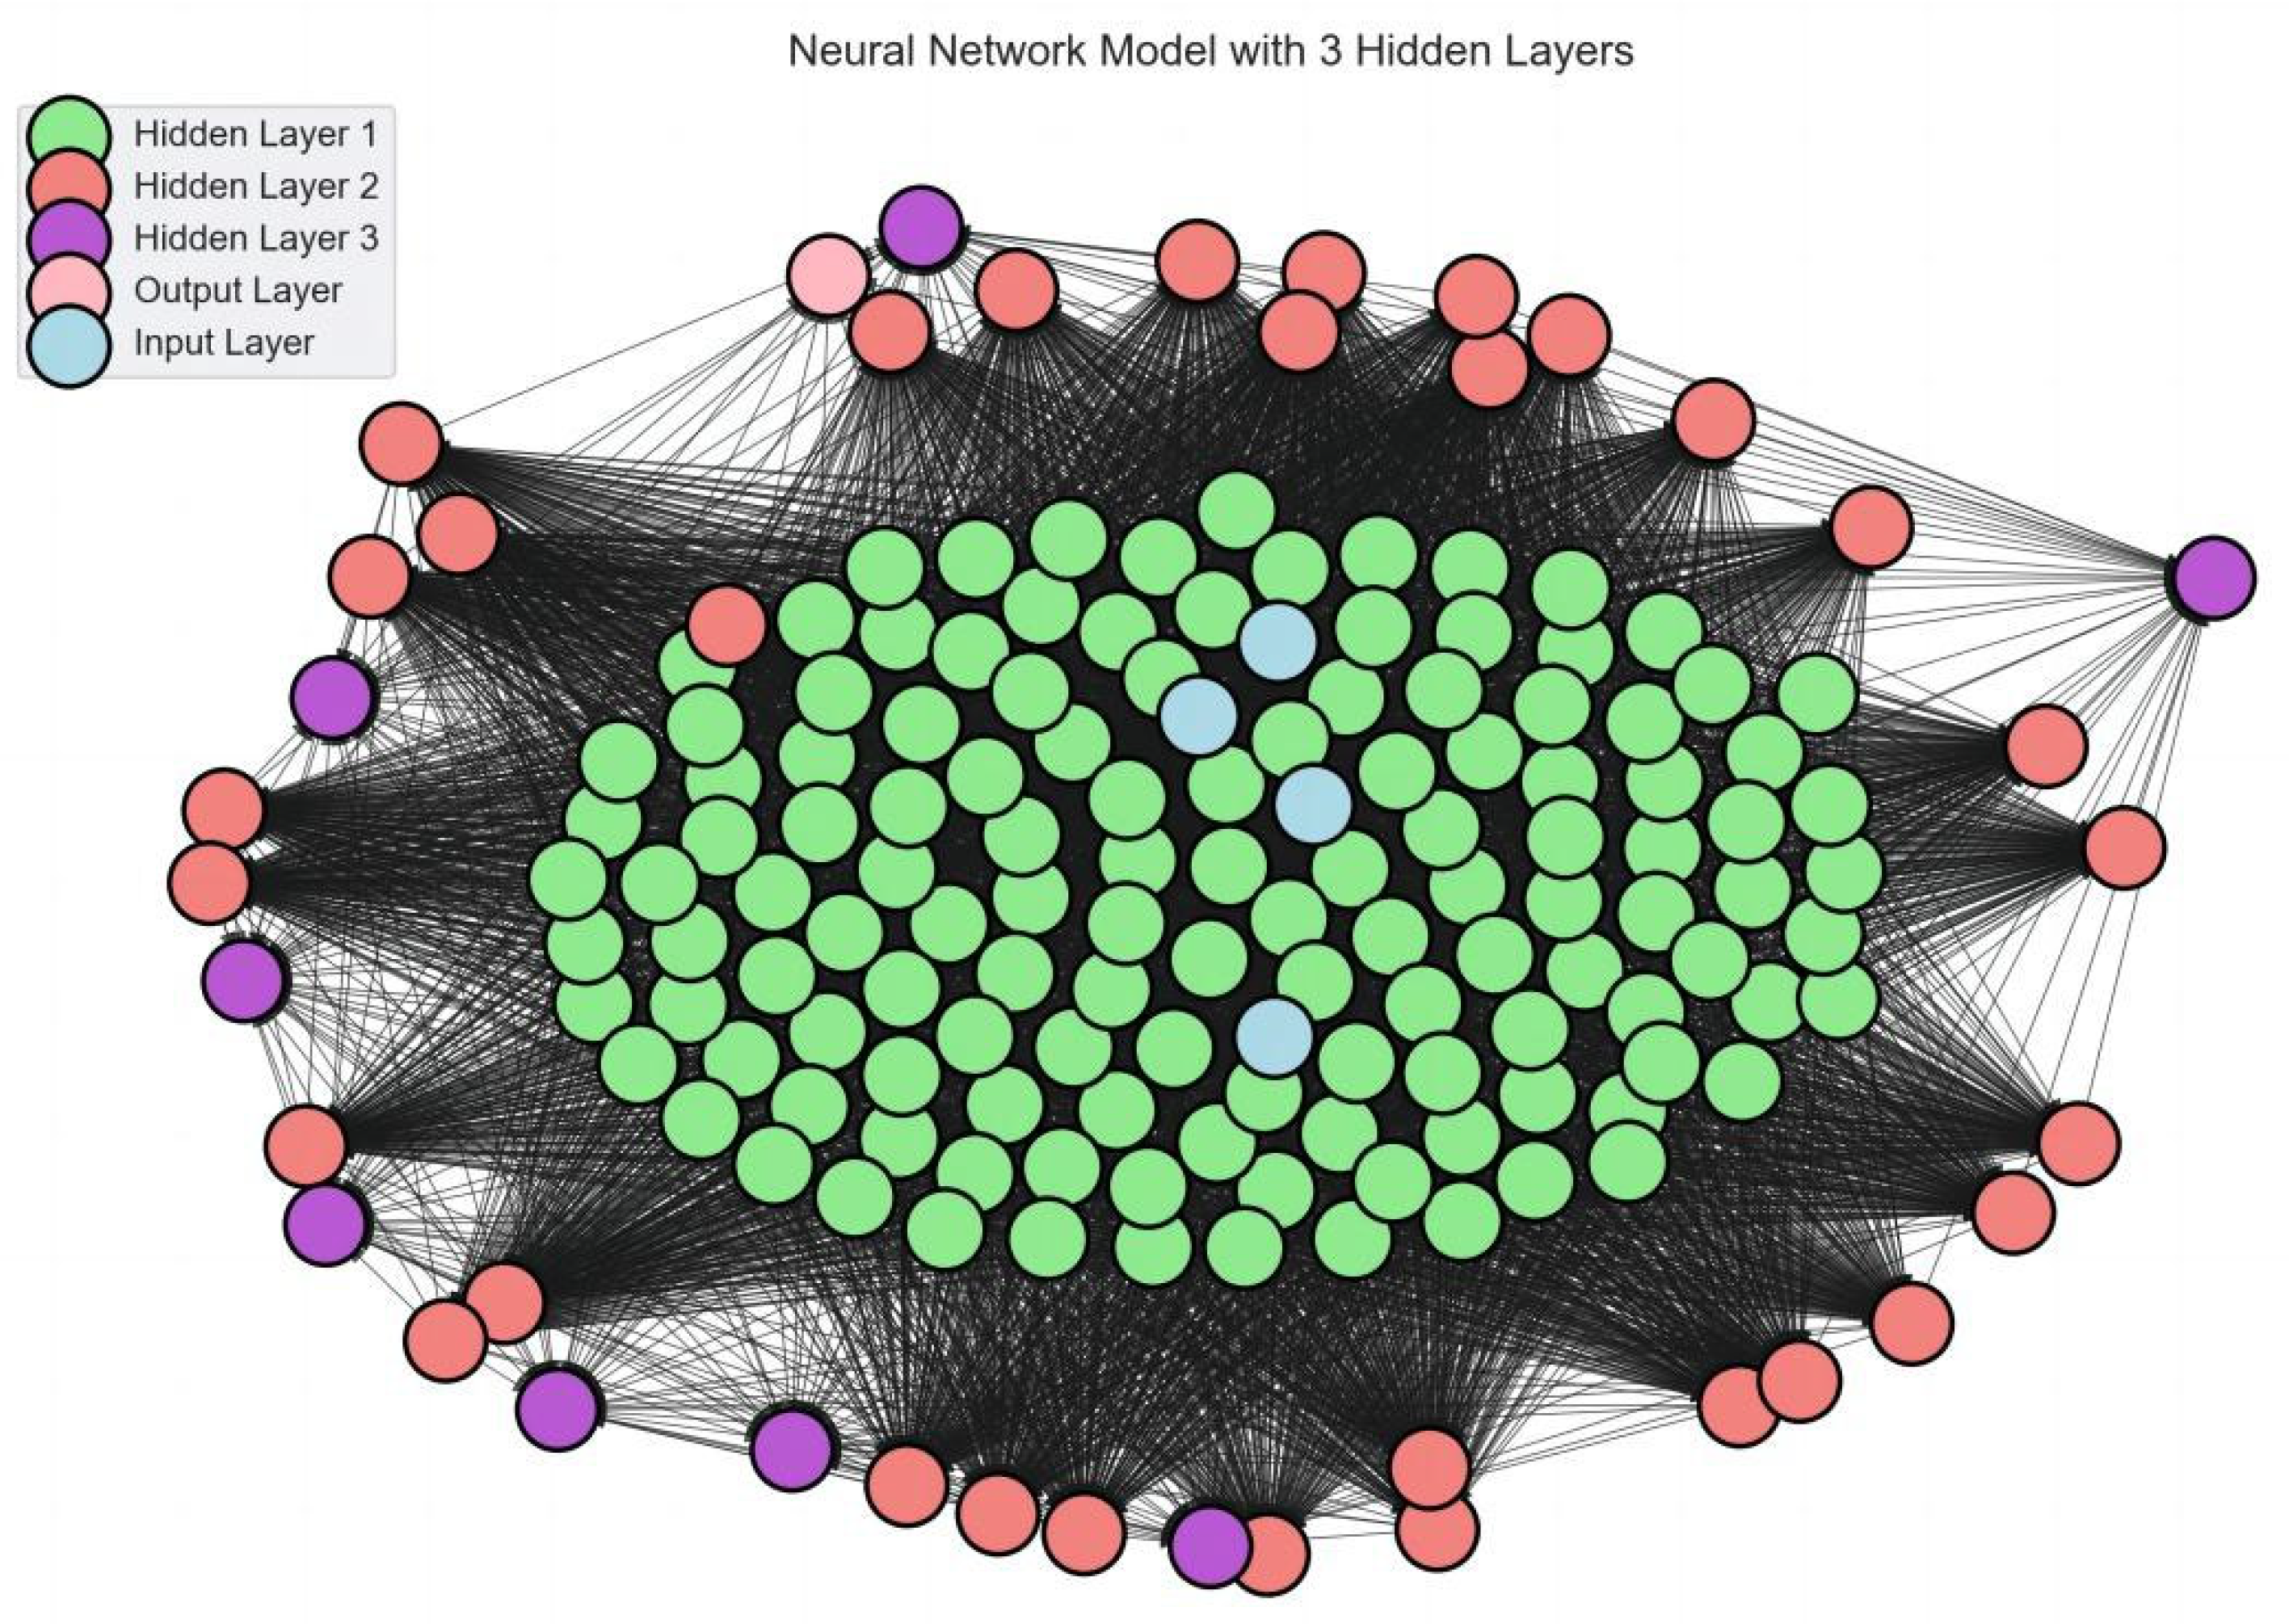
4.1. Predicting Ash Values in Froth Flotation Concentrates Using Deep Neural Networks

In this study, a deep neural network with multi-feature and hybrid data inputs was constructed using the Keras framework [37,38]. The model architecture, as illustrated in Figure 4, represents each input neuron as a feature parameter of the froth flotation image (such as the average bubble diameter, bubble number, bubble brightness, bubble bursting rate), while the ash content is represented by an output neuron. The dataset comprises 90 ash content values and a collection of 16,200 images. Among these, 11,340 froth flotation images were allocated for the training dataset, while the remaining 4860 images were utilized for the validation dataset. Detailed information regarding the experimental dataset is presented in Table 2.
As shown in Figure 4, a deep neural network with multiple feature inputs and mixed data inputs was constructed using Keras, consisting of a series of input neurons, a hidden layer, and an output neuron. The adjacent layers are fully connected, where each input neuron represents the parameters of the froth flotation image (such as average bubble diameter, bubble number, bubble brightness, bubble bursting rate), and the ash content is represented by an output neuron. The input layer of this deep neural network has four features, each connected to a hidden layer with 128 neurons. Subsequently, the output of this hidden layer is connected to a second hidden layer with 32 neurons, which is then connected to a third hidden layer with 8 neurons, and is finally connected to an output layer with 1 neuron. After attempting deeper network structures, it was found that these dimensions provided the best balance between prediction accuracy and limited overfitting.
In this study, the deep neural network was trained using the following hyperparameters: stochastic gradient descent (SGD) with a mini-batch size of 100, initialized with the Adam optimizer. The learning rate was set to 0.001, and a learning rate decay of 0.005 (initial learning rate divided by 200) was applied per training epoch. To mitigate overfitting, an early stopping strategy was employed, whereby training was halted if the loss function on the validation set failed to improve for 200 consecutive training iterations. The hidden layers utilized the Tanh activation function to enhance the network’s capacity for nonlinear representation. Additionally, a supplementary fully connected layer with a single output unit was introduced, employing a linear activation function to directly output continuous values. The training process encompassed 10,000,000 iterations; however, adhering to the early stopping strategy, training was prematurely terminated if the performance on the validation set did not exhibit improvement for 200 consecutive iterations, thereby ensuring model performance and optimizing resource utilization.

4.2. 10-Fold Cross-Validation Design

In order to fully leverage the sample information in the collected foam flotation dataset and accurately assess the performance of the deep neural network model in the context of multiple feature inputs and mixed data inputs, as well as its generalization capacity to unseen data, a 10-fold cross-validation methodology was employed in this study [39]. Within the 10-fold cross-validation, the initial dataset comprising 90 samples was randomly partitioned into nine groups, each consisting of 10 equally sized subsets. Among these 10 subsets, 3 subsets were designated as the validation set, serving the purpose of evaluating the performance of the proposed model. The remaining seven subsets were employed as the training set, facilitating the training process of the model. This cross-validation protocol was iterated 10 times (folds), with each fold reserving a distinct subset as the test set. Through this meticulous design, each subset was optimally utilized, and each subset functioned as the test set once.

4.3. Evaluation of Model Prediction Performance Metrics

The evaluation of model predictive performance relies on pivotal metrics, including the mean squared error (MSE), mean absolute error (MAE), and root mean squared error (RMSE). These metrics play a crucial role in assessing the efficacy of the model’s predictions. The computations are executed as follows:
M S E = i = 1 M s a m p l e y ( i )   a c t u a l y ( i )   a c t u a l _ p r e d 2 M s a m p l e
M A E = i = 1 M s a m p l e y ( i )   a c t u a l y ( i )   a c t u a l _ p r e d M s a m p l e
R M S E = i = 1 M s a m p l e y ( i )   a c t u a l y ( i )   a c t u a l _ p r e d 2 M s a m p l e
In this context, M s a m p l e denotes the total number of samples, y ( i )   a c t u a l corresponds to the actual value of the i -th sample, and y ( i )   a c t u a l _ p r e d signifies the predicted value of the i -th sample.

5. Results and Analysis

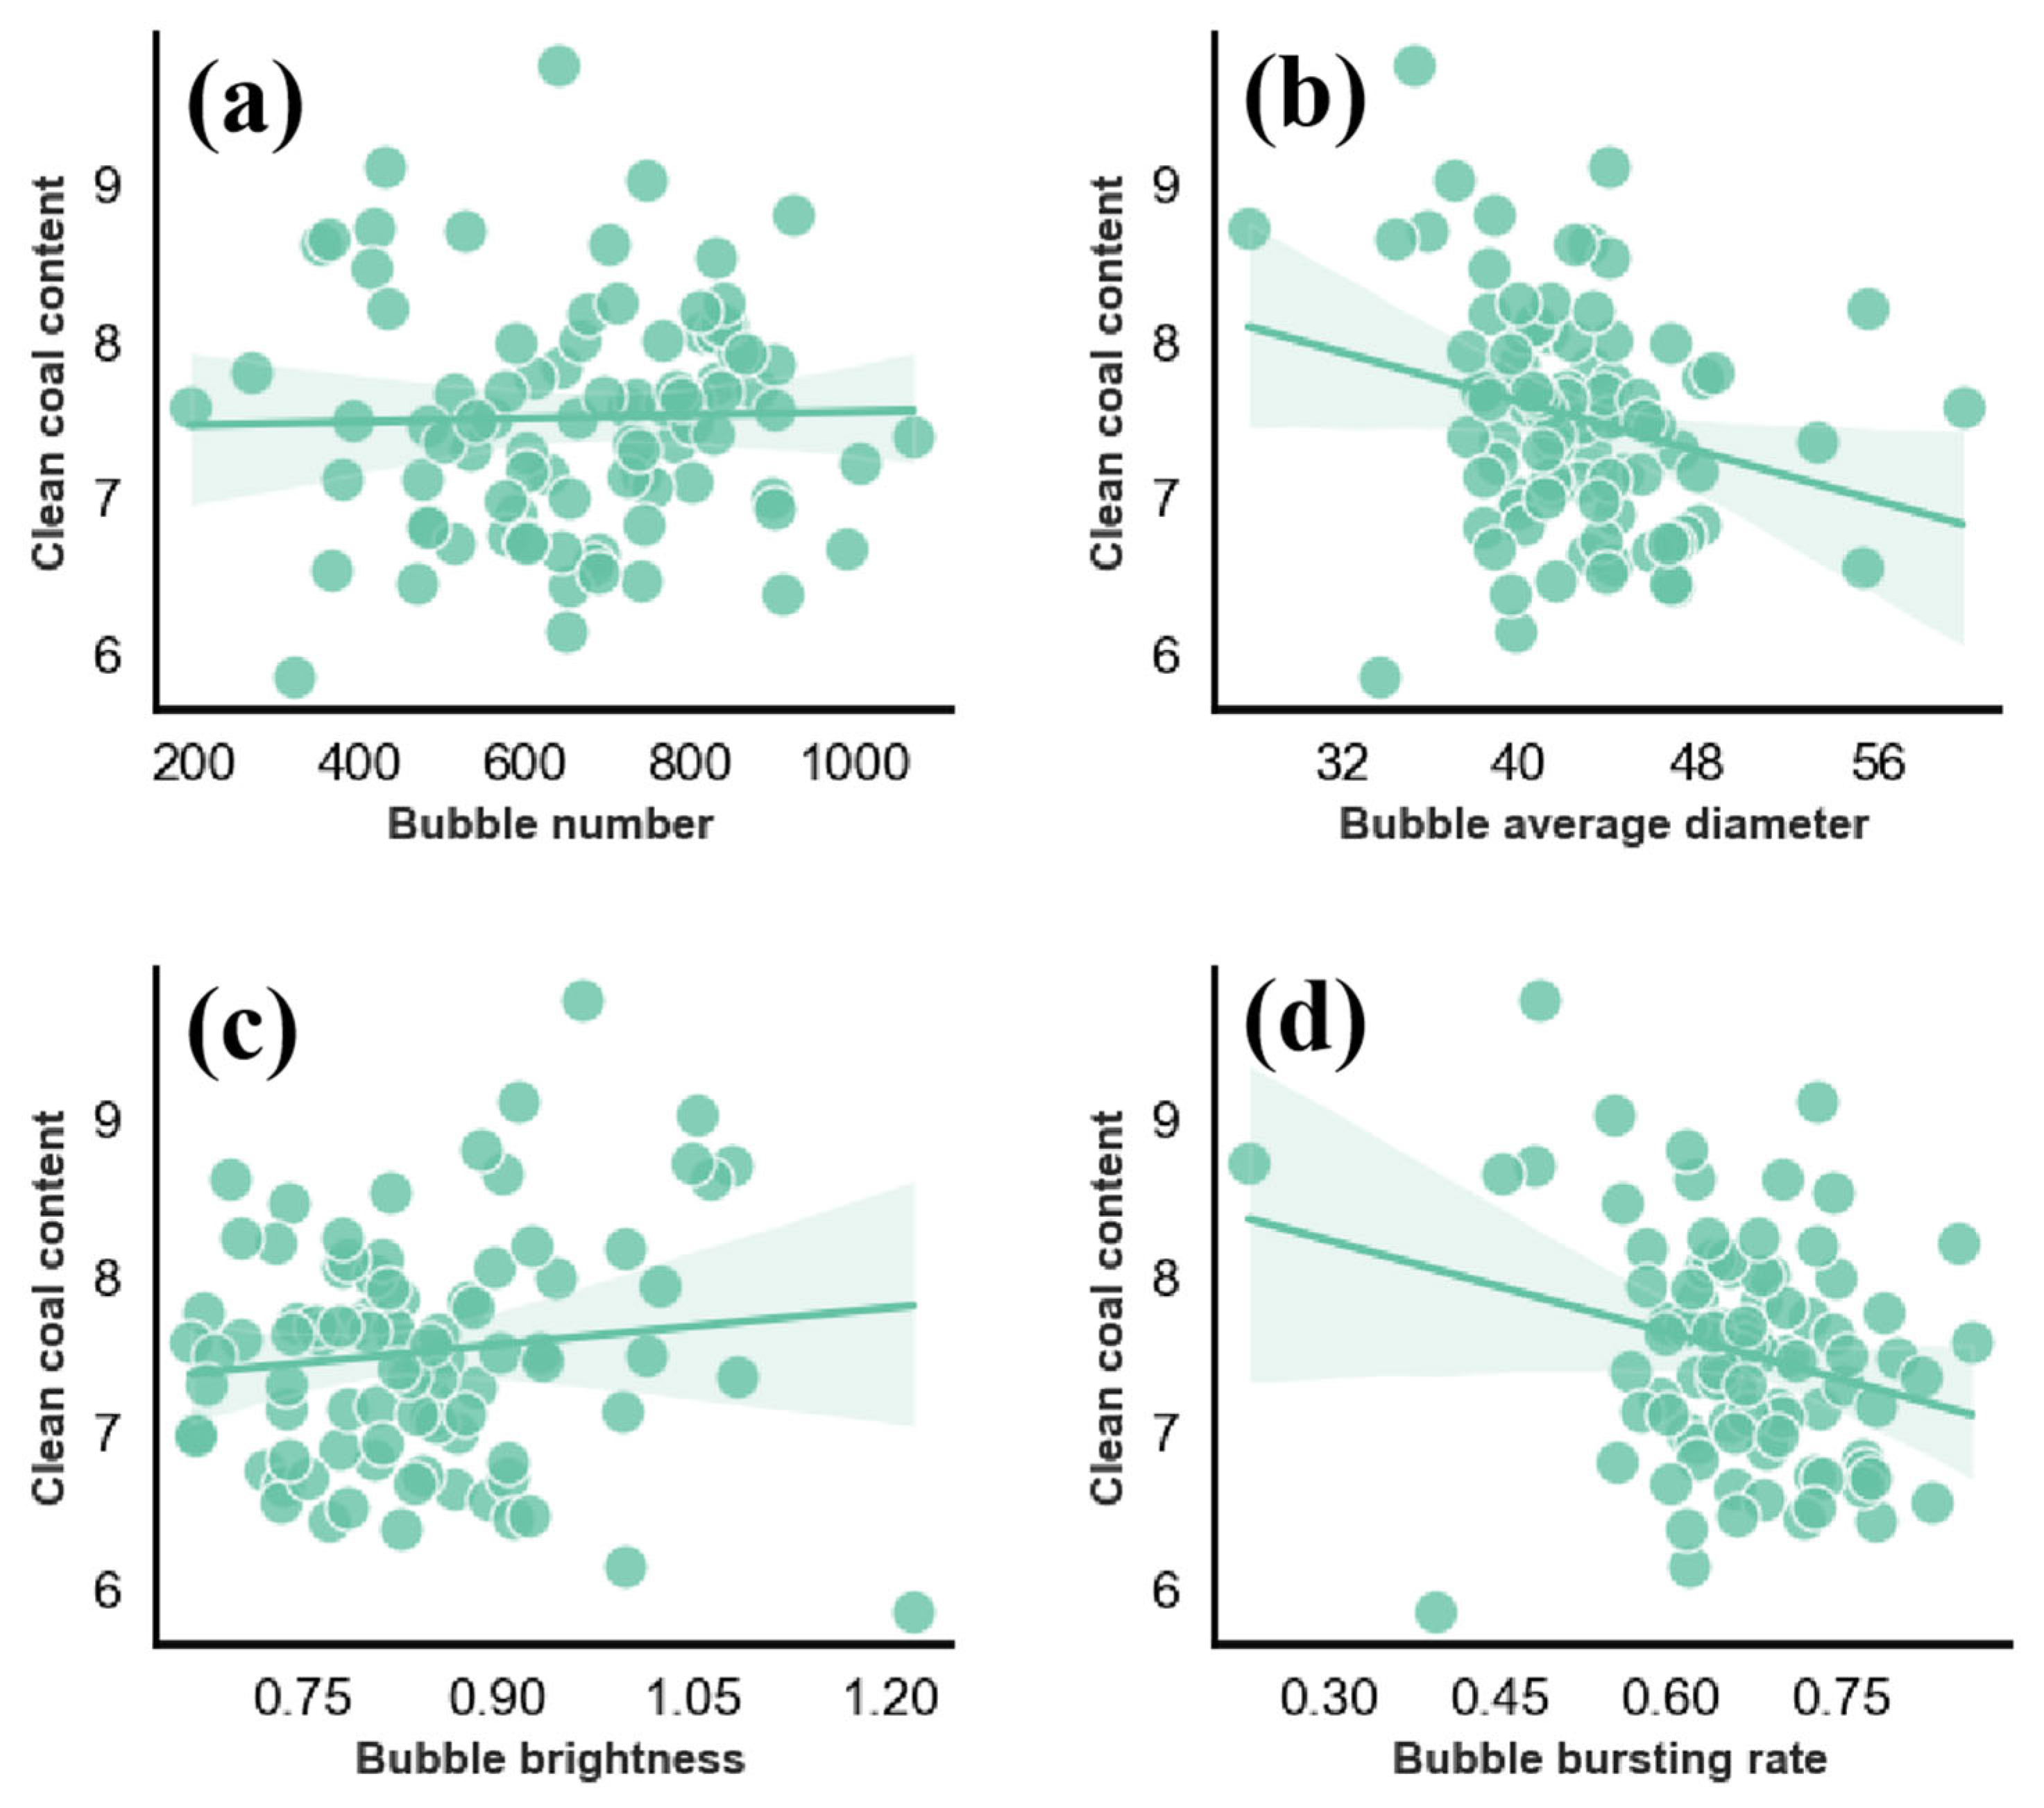
5.1. Relationship between Static Characteristic Parameters of Froth Flotation and Ash Values

Each video has a duration of approximately 1 min, corresponding to a specific ash content. Three frames are extracted per second, and all images within the same video share the same ash content. For each video image (a total of 180 images), the mean values of the static features in foam flotation are computed to investigate the relationship between the ash content of clean coal and the static parameters of froth flotation. The correlation between the ash content and the static feature parameters is presented in Figure 5.
Based on the conducted correlation analysis using the Python programming language, it was observed that the ash content of clean coal in froth flotation exhibits a positive correlation with the bubble number and bubble brightness, with correlation coefficients of 0.063527 and 0.009801, respectively. Figure 5a,c illustrate the increasing trend in the ash content with the augmentation of the bubble number and bubble brightness. Augmenting the bubble number may enhance the contact with coal gangue particles, thereby improving the ash capture and separation efficiency. Bubble brightness is associated with bubble size and stability, where brighter froth signifies smaller and more stable bubbles, facilitating the separation of coal and mineral particles. Conversely, Figure 5b,d demonstrate a negative correlation between the ash content and bubble diameter, as well as the bubble bursting rate, with correlation coefficients of −1.324398 and −0.027225, respectively. A smaller bubble diameter implies a larger surface area of bubbles, augmenting the contact area with coal particles and consequently enhancing the ash separation efficiency, leading to a reduced ash content in clean coal. However, a higher bubble bursting rate may decrease the contact time with coal particles, potentially impairing the ash separation efficiency and resulting in an increased ash content in clean coal.

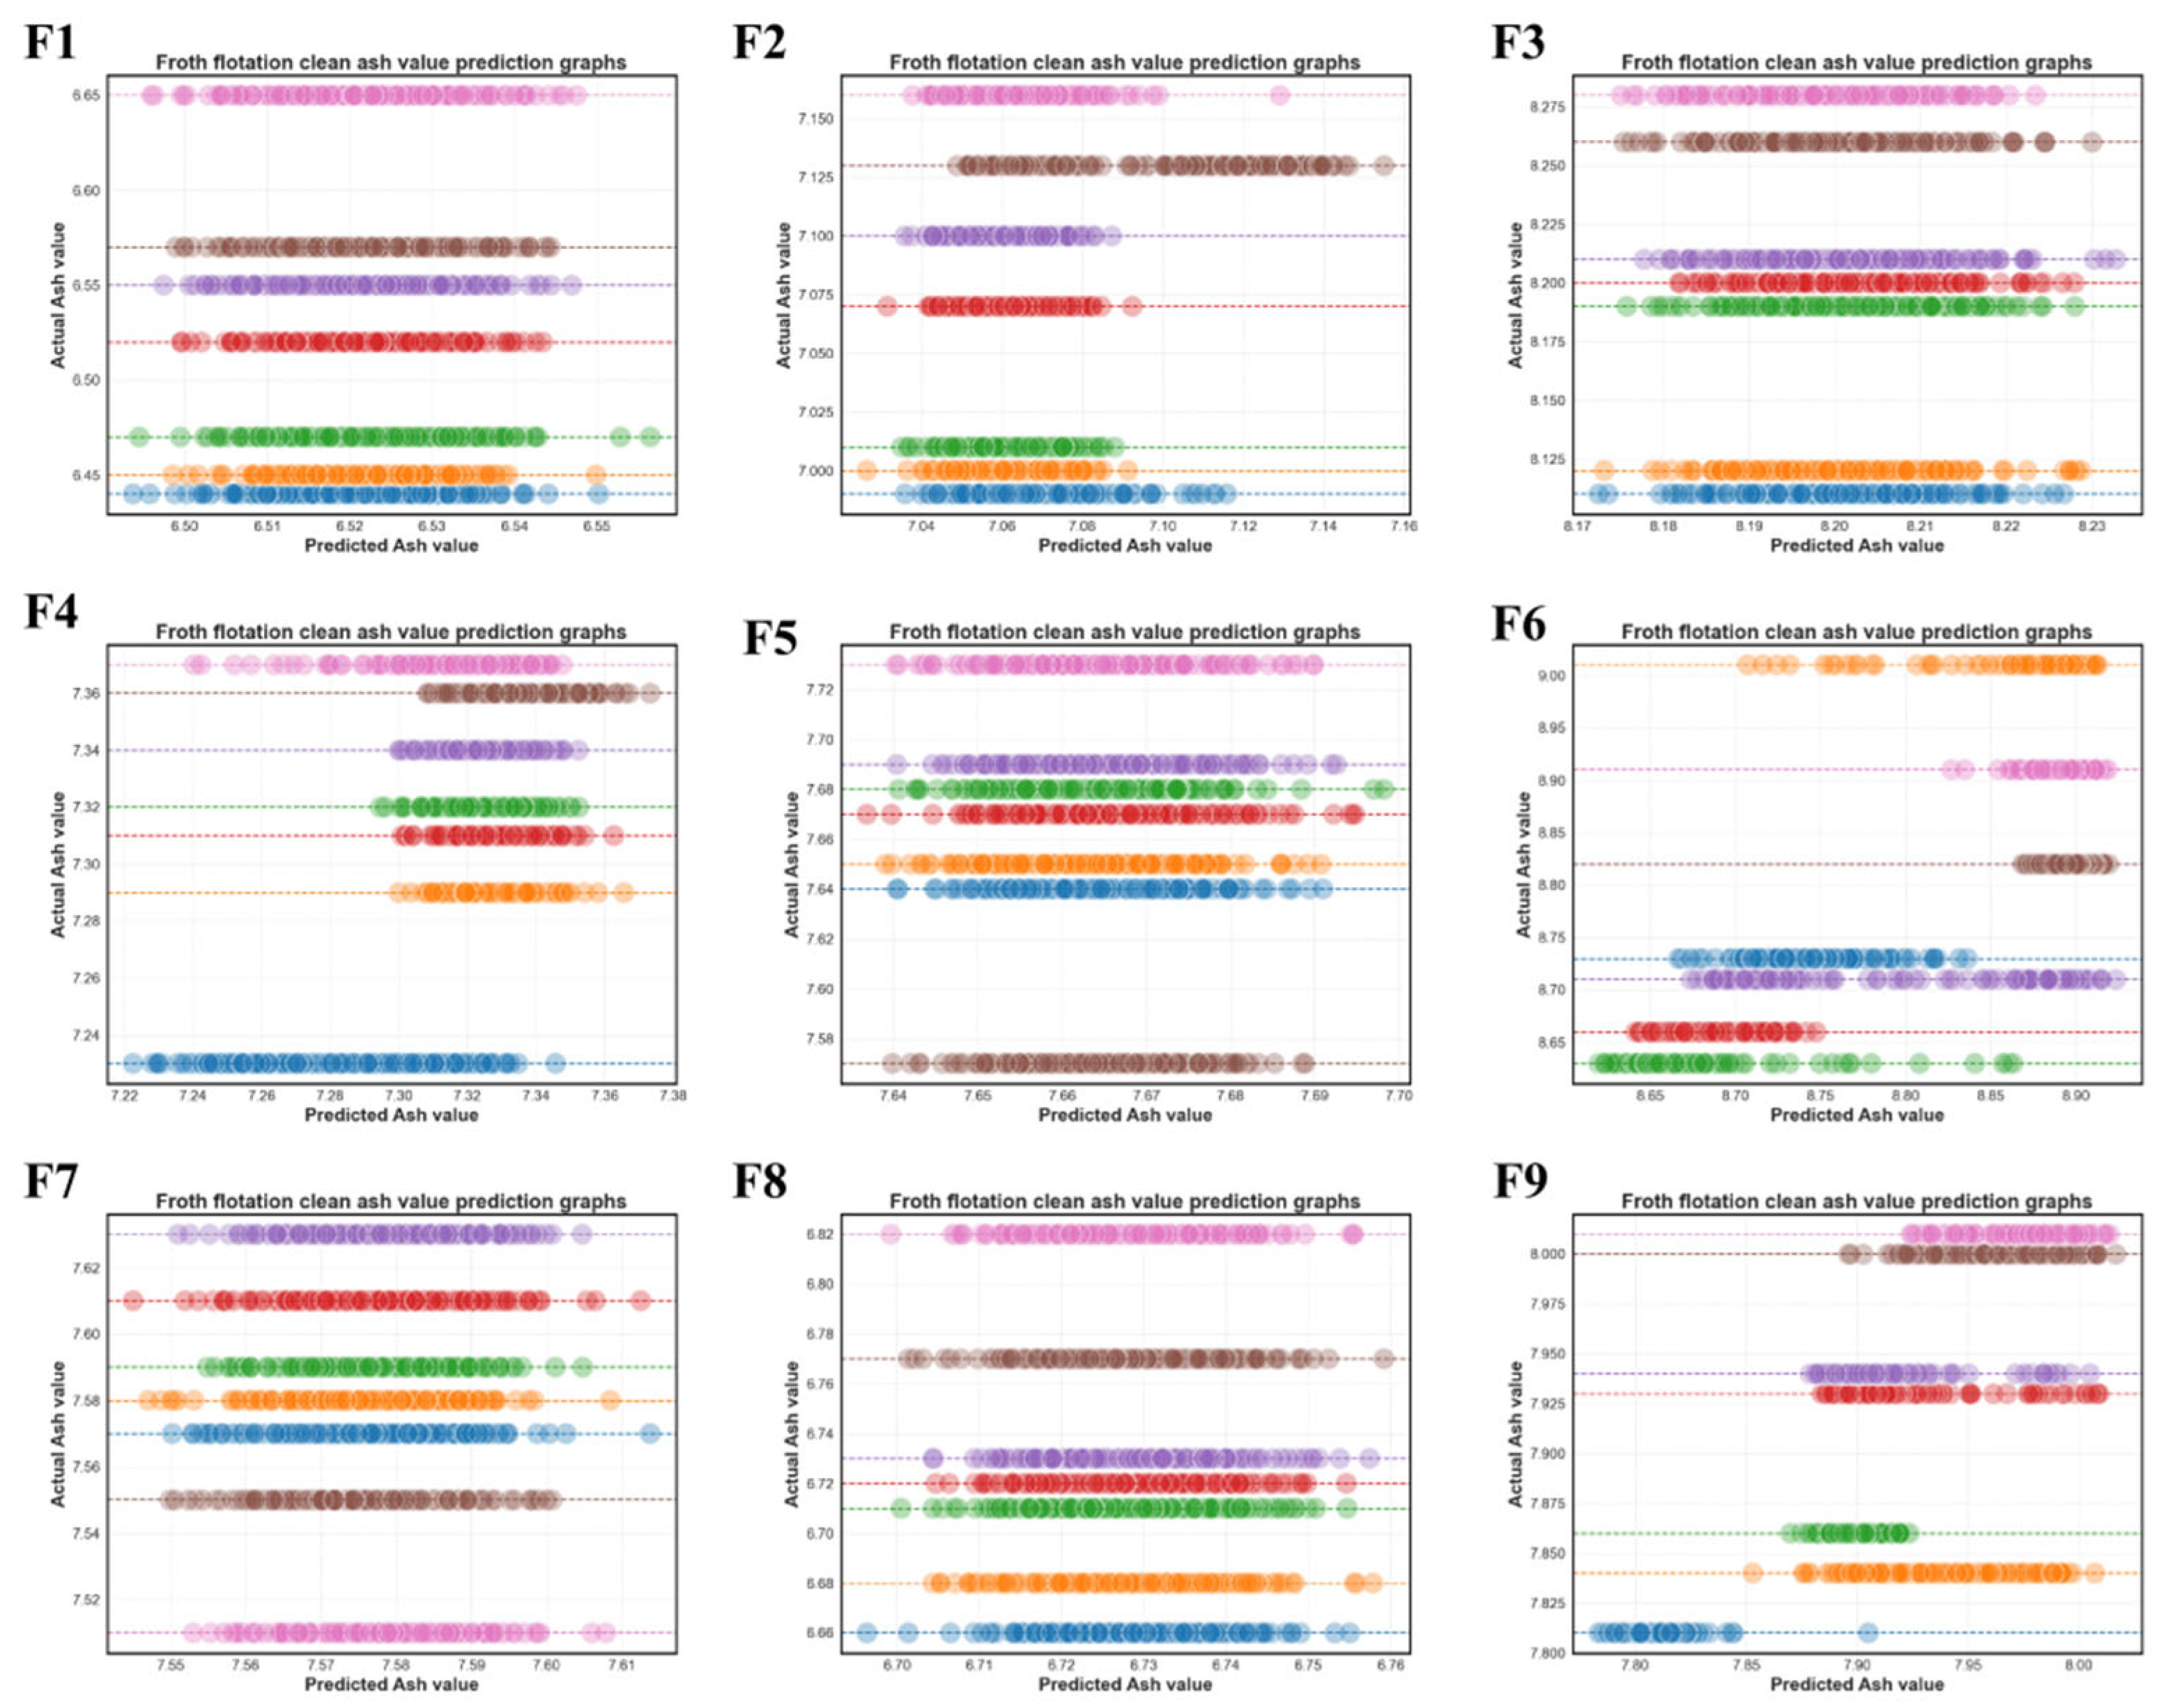
5.2. Froth Flotation Concentrate Ash Value Prediction and Result Analysis

In this study, the method of steepest descent was employed to train the network using the training dataset. The weights of the connections were iteratively adjusted layer by layer to minimize the disparity between the actual output and the desired output. The backpropagation of error signals was utilized to fine-tune the feedback, continually refining the weights to bring the actual output closer to the expected output. Through repeated training with multiple samples, the optimal thresholds and weights were obtained. The weight values of each layer and the biases of individual neurons were preserved, and the predictive accuracy of the network was assessed using the test dataset. Ultimately, a three-layer deep neural network, trained using the collected data, was utilized to predict the ash content of 90 clean coal samples. The Python programming language was utilized to plot the results of the predicted values and actual ash content values in the training and validation datasets, which are depicted in Figure 6 and Figure 7, respectively. From the observations made in Figure 6 and Figure 7, it is evident that the utilization of the deep neural network resulted in remarkably small prediction errors, underscoring its high degree of predictive accuracy. These findings demonstrate the model’s outstanding performance in predicting the ash content of clean coal.
Table 3 displays the error between the predicted ash content and the actual ash content in the training set. From Table 3, it can be observed that the mean squared error (MSE) between the predicted and actual ash content primarily ranges from 0.001319% to 0.005604%. Within the error range of 0.05% or less, it accounts for 88.89% of the nine groups of prediction sets. Only group F6’s predicted ash content deviates beyond 0.05%, reaching 0.005604%, but still not exceeding 0.06%. Throughout the training set, the average MSE between the predicted and actual ash content is only 0.003017%. Regarding the root mean squared error (RMSE) metric, its values range from 0.036328% to 0.074865%, with an average RMSE between the predicted and actual ash content of 0.053385%. Meanwhile, the mean absolute error (MAE) metric ranges from 0.028983% to 0.058772%, with an average MAE between the predicted and actual ash content of 0.042640%. These values are relatively small, as they all fall within a narrow range, and their means do not exceed the threshold of 0.05%. The overall trend indicates that the model’s prediction results meet the requirements, demonstrating a very high prediction accuracy. Therefore, the model effectively tracks the trend in the ash content changes.
Based on a comprehensive analysis of the results, the superiority and feasibility of the deep neural network in predicting the ash content of clean coal in coal flotation have been established. The empirical data demonstrate an exceptional predictive accuracy, enabling the precise tracking and forecasting of variations in the clean coal ash content during the flotation process. Through extensive learning and training on actual measurement data, the model can extract critical features and establish intricate nonlinear relationships between the ash content and various input parameters. By training the network with actual measurement data and establishing a corresponding database, the model can predict the ash content of clean coal in the same region or even different regions for similar coal flotation processes.

6. Conclusions

In this study, a series of algorithms including computer vision were utilized to extract and analyze froth static characteristic parameters relevant to the clean coal ash content. The investigation revealed that an increase in the bubble number and brightness contributes to an enhanced ash separation efficiency, as more froth provides greater contact opportunities and surface area, while brighter froth exhibits superior adhesiveness and separation capabilities. Additionally, this study explored the influence of the bubble diameter and burst rate on the ash content. Smaller froth diameters augment the contact area with coal particles, thereby reducing the ash content, whereas higher bursting rates may decrease the contact time with coal particles, resulting in an increased ash content. The study of the correlation between the clean coal ash content derived from froth images and froth static characteristics is instrumental in understanding flotation outcomes, holding significant implications for further flotation prediction and control.
Furthermore, this study proposes a method for predicting the clean coal ash content based on froth images, employing a deep neural network implemented with Keras to accurately determine the ash content of coal flotation concentrates. This method utilizes static froth features (including the average bubble diameter, bubble number, bubble brightness, bubble bursting rate) for prediction, and models the nonlinear and complex relationships through a Keras deep neural network, thereby accurately predicting the ash content of froth flotation concentrates. The evaluation results of the model indicate minimal prediction errors, with discrepancies from the actual measured values remaining within an acceptable range, and mean differences not exceeding the threshold of 0.05%.

Author Contributions

All authors have contributed to the study conception and design. F.L.: methodology, software, formal analysis, visualization, writing—original draft and writing—review. N.L.: Supervision, validation, writing—reviewing and editing. H.L.: conceptualization, methodology, funding acquisition, supervision, writing—original draft and writing—review and editing. All authors have read and agreed to the published version of the manuscript.

Funding

This research received no external funding.

Data Availability Statement

The data that have been used are confidential.

Conflicts of Interest

The authors declare that they have no known competing financial interests or personal relationships that could have appeared to influence the work reported in this paper.

References

  1. Woodburn, E.T.; Stockton, J.B.; Robbins, D.J. Vision-based characterization of three-phase froths. In International Colloquium–Developments in Froth Flotation; South African Institute of Mining and Metallurgy: Gordon’s Bay, South Africa, 1989; Volume 1, pp. 1–30. [Google Scholar]
  2. Symonds, P.; De Jager, G. A technique for automatically segmenting images of the surface froth structures that are prevalent in industrial flotation cells. In Proceedings of the 1992 South African Symposium on Communications and Signal Processing, Cape Town, South Africa, 11 September 1992. [Google Scholar]
  3. DMoolman, D.W.; Aldrich, C.; Van Deventer, J.S.J. The monitoring of froth surfaces on industria flotation plants using connectionist image processing techniques. Miner. Eng. 1995, 8, 23–30. [Google Scholar] [CrossRef]
  4. Moolman, D.W.; Eksteen, J.J.; Aldrich, C.; Van Deventer, J.S.J. Thle significance of flotation froth appearance for machine vision control. Int. J. Miner. Process. 1996, 48, 135–158. [Google Scholar] [CrossRef]
  5. Bonifazi, G.; Massacci, P.; Meloni, A. Prediction of complex sulfide flotation performances by a combined 3D fractal and colour analysis of the froths. Miner. Eng. 2000, 13, 737–746. [Google Scholar] [CrossRef]
  6. Bonifazi, G.; Serranti, S.; Volpe, F.; Zuco, R. Characterisation of flotation froth colour and structure by machine vision. Comput. Geosci. 2001, 27, 1111–1117. [Google Scholar] [CrossRef]
  7. Holtham, P.N.; Nguyen, K.K. On-line analysis of froth surface in coal and mineral flotation using JKFrothCam. Int. J. Miner. Process. 2002, 64, 163–180. [Google Scholar] [CrossRef]
  8. Citir, C.; Aktas, Z.; Berber, R. Off-line image analysis for froth flotation of coal. Comput. Chem. Eng. 2004, 28, 625–632. [Google Scholar] [CrossRef]
  9. Bartolacci, G.; Pelletier, P.; Tessier, J.; Duchesne, C.; Bossé, P.-A.; Fournier, J. Application of numerical image analysis to process diagnosis and physical parameter measurement in mineral processes—Part I: Flotation control based on froth textural characteristics. Miner. Eng. 2006, 19, 734–747. [Google Scholar] [CrossRef]
  10. Liu, J.J.; MacGregor, J.F. Froth-based modeling and control of flotation processes. Miner. Eng. 2008, 21, 642–651. [Google Scholar] [CrossRef]
  11. Aldrich, C.; Marais, C.; Shean, B.; Cilliers, J. Online monitoring and control of froth flotation systems with machine vision: A review. Int. J. Miner. Process. 2010, 96, 1–13. [Google Scholar] [CrossRef]
  12. Bergh, L.; Yianatos, J. The long way toward multivariate predictive control of flotation processes. J. Process Control 2011, 21, 226–234. [Google Scholar] [CrossRef]
  13. Morar, S.H.; Harris, M.C.; Bradshaw, D.J. The use of machine vision to predict flotation performance. Miner. Eng. 2012, 36–38, 31–36. [Google Scholar] [CrossRef]
  14. Mehrabi, A.; Mehrshad, N.; Massinaei, M. Machine vision based monitoring of an industrial flotation cell in an iron flotation plant. Int. J. Miner. Process. 2014, 133, 60–66. [Google Scholar] [CrossRef]
  15. Jahedsaravani, A.; Marhaban, M.; Massinaei, M.; Saripan, M.; Noor, S. Froth-based modeling and control of a batch flotation process. Int. J. Miner. Process. 2016, 146, 90–96. [Google Scholar] [CrossRef]
  16. Massinaei, M.; Jahedsaravani, A.; Taheri, E.; Khalilpour, J. Machine vision based monitoring and analysis of a coal column flotation circuit. Powder Technol. 2018, 343, 330–341. [Google Scholar] [CrossRef]
  17. Massinaei, M.; Jahedsaravani, A.; Mohseni, H. Recognition of process conditions of a coal column flotation circuit using computer vision and machine learning. Int. J. Coal Prep. Util. 2022, 42, 2204–2218. [Google Scholar] [CrossRef]
  18. Jia, R.; Yan, Y.; Lang, D.; He, D.; Li, K. Compression and reconstruction of flotation foam images based on generative adversarial networks. Miner. Eng. 2023, 202, 108299. [Google Scholar] [CrossRef]
  19. Jahedsaravani, A.; Massinaei, M.; Marhaban, M. Development of a machine vision system for real-time monitoring and control of batch flotation process. Int. J. Miner. Process. 2017, 167, 16–26. [Google Scholar] [CrossRef]
  20. GB/T 30046.1-2013; Forth flotation testing―Part 1: Laboratory procedure, General Administration of Quality Supervision, Inspection and Quarantine of the People’s Republic of China. Standardization Administration of the People’s Republic of China: Beijing, China, 2013.
  21. Marais, C.; Aldrich, C. Estimation of platinum flotation grades from froth image data. Miner. Eng. 2011, 24, 433–441. [Google Scholar] [CrossRef]
  22. Tan, J.; Liang, L.; Peng, Y.; Xie, G. The concentrate ash content analysis of coal flotation based on froth images. Miner. Eng. 2016, 92, 9–20. [Google Scholar] [CrossRef]
  23. Chang, Q.; Li, X.; Li, Y.; Miyazaki, J. Multi-directional Sobel operator kernel on GPUs. J. Parallel Distrib. Comput. 2023, 177, 160–170. [Google Scholar] [CrossRef]
  24. Biswas, S.; Ghoshal, D. Blood cell detection using thresholding estimation based watershed transformation with sobel filter in frequency domain. Procedia Comput. Sci. 2016, 89, 651–657. [Google Scholar] [CrossRef]
  25. Chen, S.; Yang, X.; You, Z.; Wang, M. Innovation of aggregate angularity characterization using gradient approach based upon the traditional and modified Sobel operation. Constr. Build. Mater. 2016, 120, 442–449. [Google Scholar] [CrossRef]
  26. Gao, P.; Song, Y.; Song, M.; Qian, P.; Su, Y. Extract nanoporous gold ligaments from SEM images by combining fully convolutional network and Sobel operator edge detection algorithm. Scr. Mater. 2022, 213, 114627. [Google Scholar] [CrossRef]
  27. Stimpel, B.; Syben, C.; Schirrmacher, F.; Hoelter, P.; Dorfler, A.; Maier, A. Multi-Modal deep guided filtering for comprehensible medical image processing. IEEE Trans. Med. Imaging 2019, 39, 1703–1711. [Google Scholar] [CrossRef] [PubMed]
  28. Wen, Z.; Zhou, C.; Pan, J.; Nie, T.; Jia, R.; Yang, F. Froth image feature engineering-based prediction method for concentrate ash content of coal flotation. Miner. Eng. 2021, 170, 107023. [Google Scholar] [CrossRef]
  29. Zhao, L.; Peng, T.; Xie, Y.; Gui, W.; Zhao, Y. Froth stereo visual feature extraction for the industrial flotation process. Ind. Eng. Chem. Res. 2019, 58, 14510–14519. [Google Scholar] [CrossRef]
  30. Busse, J.; de Dreuzy, J.; Torres, S.G.; Bringemeier, D.; Scheuermann, A. Image processing based characterisation of coal cleat networks. Int. J. Coal Geol. 2016, 169, 1–21. [Google Scholar] [CrossRef]
  31. Havaran, A.; Mahmoudi, M. Markers tracking and extracting structural vibration utilizing Randomized Hough transform. Autom. Constr. 2020, 116, 103235. [Google Scholar] [CrossRef]
  32. Dong, H.; Prasad, D.K.; Chen, I.-M. Accurate detection of ellipses with false detection control at video rates using a gradient analysis. Pattern Recognit. 2018, 81, 112–130. [Google Scholar] [CrossRef]
  33. Riquelme, A.; Desbiens, A.; del Villar, R.; Maldonado, M. Identification of a non-linear dynamic model of the bubble size distribution in a pilot flotation column. Int. J. Miner. Process. 2015, 145, 7–16. [Google Scholar] [CrossRef]
  34. Lu, M.; Liu, D.; Deng, Y.; Wu, L.; Xie, Y.; Chen, Z. R-K algorithm: A novel dynamic feature matching method of flotation froth. Measurement 2020, 156, 107581. [Google Scholar] [CrossRef]
  35. Lerer, A.; Supèr, H.; Keil, M.S. Luminance gradients and non-gradients as a cue for distinguishing reflectance and illumination in achromatic images: A computational approach. Neural Netw. 2019, 110, 66–81. [Google Scholar] [CrossRef] [PubMed]
  36. Zhang, H.; Tang, Z.; Xie, Y.; Gao, X.; Chen, Q.; Gui, W. A Similarity-Based Burst Bubble Recognition Using Weighted Normalized Cross Correlation and Chamfer Distance. IEEE Trans. Ind. Inform. 2020, 16, 4077–4089. [Google Scholar] [CrossRef]
  37. Chicho, B.T.; Sallow, A.B. A Comprehensive Survey of Deep Learning Models Based on Keras Framework. J. Soft Comput. Data Min. 2021, 2, 49–62. [Google Scholar] [CrossRef]
  38. Jiang, Z.; Shen, G. Prediction of House Price Based on The Back Propagation Neural Network in the Keras Deep Learning Framework. In Proceedings of the 2019 6th International Conference on Systems and Informatics (ICSAI), Shanghai, China, 2–4 November 2019. [Google Scholar]
  39. Lee, H.; Lee, J. Neural network prediction of sound quality via domain Knowledge-Based data augmentation and Bayesian approach with small data sets. Mech. Syst. Signal Process. 2021, 157, 107713. [Google Scholar] [CrossRef]
Figure 1. Flowchart of static experimental prediction of clean coal ash content in froth flotation and comparison with traditional ash measurement techniques.
Minerals 14 00536 g001
Figure 2. Ellipse parameters illustration of Hough transform similarity.
Minerals 14 00536 g002
Figure 3. (a) Original image of collected froth flotation image, (b) image processed using the Hough transform ellipse detection algorithm.
Minerals 14 00536 g003
Figure 4. Keras deep neural network model structure diagram.
Minerals 14 00536 g004
Figure 5. The correlation between clean coal content and bubble parameters in froth flotation: (a) bubble number, (b) bubble average diameter, (c) bubble brightness, (d) bubble bursting rate.
Minerals 14 00536 g005
Figure 6. Training results of froth flotation predicted value and actual ash value.
Minerals 14 00536 g006
Figure 7. Froth flotation predicted value versus actual ash value validation results plots.
Minerals 14 00536 g007
Table 1. Experimental environment.
Library NameVersion
Programming LanguagePython 3.9
Deep Learning FrameworkPyTorch 1.12.1
Scikit-learn0.24.2
TensorFlow2. 9. 1
Keras2.9.0
Matplotlib3.4.3
Theano1.1.2
Table 2. Image training dataset for froth flotation.
IdNumberDiameterBrightnessBurstingClean Ash Content
1.jpg185351.2480.4166.55
2.jpg187351.1980.4496.55
3.jpg183361.1760.4156.55
4.jpg155371.2340.4396.55
5.jpg175361.1940.4466.55
6.jpg186361.2360.436.55
7.jpg191361.2430.4556.55
8.jpg166371.3110.4346.55
9.jpg167361.3270.4496.55
10.jpg195351.2210.4316.55
179.jpg872340.7490.4696.55
180.jpg863340.7610.4576.55
181.jpg1133370.9260.5757.23
182.jpg1158370.8110.5377.23
16200.jpg666450.7250.6828.01
Table 3. Table below shows the errors between predicted ash content and actual ash content for each group’s training set and validation set(%).
GroupTraining SetValidation Set
MSE RMSEMAEMSE RMSEMAE
F10.0048690.0697820.0587720.2028900.4504330.394718
F20.0035530.0596140.0515320.0044890.0670010.056004
F30.0035360.0594720.0472690.1279730.3577330.352445
F40.0013560.0368270.0299440.0153030.1237080.122085
F50.0018000.0424260.0328380.0060370.0776980.072213
F60.0056040.0748650.0536370.3260400.5709990.547659
F70.0013190.0363280.0289830.0066230.0813840.080377
F80.0026740.0517190.0419120.0227330.1507760.144273
F90.0024430.0494340.0388800.0171500.1309580.122604
Average error value0.0030170.0533850.0426400.0810260.2234100.210264
Disclaimer/Publisher’s Note: The statements, opinions and data contained in all publications are solely those of the individual author(s) and contributor(s) and not of MDPI and/or the editor(s). MDPI and/or the editor(s) disclaim responsibility for any injury to people or property resulting from any ideas, methods, instructions or products referred to in the content.

