Review

A Challenged Evaporite Paradigm?

by
Hans Konrad Johnsen
1,*,
Martin Torvald Hovland
2 and
Hakon Rueslatten
3
1
Independent Research, N-7502 Stjørdal, Norway
2
Independent Research, N-4055 Sola, Norway
3
Independent Research, N-7049 Trondheim, Norway
*
Author to whom correspondence should be addressed.
Minerals 2024, 14(5), 527; https://doi.org/10.3390/min14050527
Submission received: 14 February 2024 / Revised: 11 May 2024 / Accepted: 15 May 2024 / Published: 20 May 2024

Abstract

:
The general subject of this article deals with the term salt. Salt deposits usually contain chlorides, sulphates/gypsum, borates, carbonates, etc., that are seemingly part of the same system. Even though this article mainly presents data and observations on chlorides, which are not easily explained by the present paradigm, it should also prove relevant for the formation of sulphates and other types of salts observed in major salt deposits. The paradigm explaining large salt deposits rests on two pillars governing salt formation and salt deformation. Salt formation is thought to occur vis solar evaporation of seawater in restricted basins. Salt deformation and forming of salt diapirs is thought to occur due to gravity-induced movements. Our review presents peer-reviewed and published data and observations from different authors within different disciplines that challenge the present evaporite paradigm. The current theory/paradigm rests on numerous observations and interpretations in support of it. Adding more observational interpretations in support of the paradigm will not nullify even one observation that contradicts or remains unexplained by the theory. The contradicting evidence must be explained within the present paradigm for it to survive. Significant observations of and within salt deposits are presented, as well as visual and geophysical observations of salinity in crusts and mantles in relevant tectonic settings. In our view, the omnipresent salinity observed in the subsurface needs to be understood and included in the description of a new salt formation mechanism in order to fully explain all features presented herein.

1. Introduction

The scientific method rests on some basic tenets that were introduced to move science away from being a belief-system. Science is the act of producing knowledge by using the scientific method. An eloquent introduction to what this implies was presented by Prof. Richard Feynman and shown here: https://youtu.be/EYPapE-3FRw (accessed on 13 February 2024).
Ref. [1] was the first to introduce the principle of falsification in natural science. From his writing, it follows that no theory within natural science can be proven correct. It can only be proven incorrect or insufficient by presenting observations and data that are inconsistent with the theory. If and when this happens, the observations might be “explained away” by adding ad hoc theories to the main paradigm. If this is not possible, the theory is wrong and should be replaced with a new theory that is capable of encompassing all data and observations from all relevant disciplines.
The paradigm covering large salt deposits rests on two pillars governing salt formation and salt deformation. Solid salt formation is thought to be the result of solar evaporation of saline water with subsequent deposition of the salts in (restricted) sections of the sea. Salt deformation and formation of salt domes/diapirs are thought to occur due to differential loading or gravity-driven salt flow/deformation. Brines and salts are observed during exploration for oil and minerals of economic interest and during research and mapping of the Earth, using geological, geophysical, chemical, and physical means. Their presence within a certain geological context and their composition are not always explained in a convincing way within the present paradigm.
There is consensus that the large salt accumulations observed on Earth are the result of processes in which saline waters or seawater has undergone separation of salt and water. Nevertheless, two seemingly conflicting observations related to the need for vast amounts of evaporation energy are apparently not readily available from sources other than the sun, including the observation of massive layers of salts in the deep oceans, where the sun does not shine. Starting with seawater, the sun can provide the needed energy within the appropriate timeframe, but only if the saline waters are allowed to precipitate solid salts that are not immediately dissolved/diluted by the influx of water.
To explain the observed salt thicknesses, an explanation based on solar evaporation of seawater will often rely on unrealistic tectonic processes for the re-filling of the evaporating basin with seawater, involving the opening and closing of oceanic basins, up to more than fifty consecutive times. Even then, the composition of the observed salts is not as might be expected from an oceanic seawater composition. Observations of salts formed in various environments should be proven consistent with isostatic considerations before adherence to a specific formation process is declared.
Furthermore, many salt deposits contain minerals that need high temperature for their formation and many salt deposits are devoid of marine fossils. Both facts point in another direction than an ocean with all its marine life, evaporating at temperatures well below 100 °C.
Dense brines are observed in crustal rocks during mining, drilling, and geophysical mapping, where their presence is not always compatible with the current evaporite theory. Thus, several observations indicate that other processes might be involved in brine and salt formation. This calls for the introduction of a new theory explaining the formation of large salt deposits including associated minerals.
Relevant observations are presented herein that might prove vital in a new theory for the formation of large salt deposits.

2. Observations from Solid Salt Deposits

2.1. Observations from the Mediterranean

The Messinian salts of the Mediterranean are probably the best studied salt deposits in the world and in essence form the basis for the present conventional evaporite model [2].
Ref. [3] present a state-of-the-art example from this scientific theme. Numerous observations from the Mediterranean are presented in an attempt to document a consistent history of the development of sedimentary deposits, including evaporites. Data from onshore and offshore sources have been assembled for this purpose. In summary, these data show that several basic questions related to the formation of salt still remain unanswered, such as certain mineralogical compositions of salt; biological questions related to the evaporation of seawater; and observation of erosion surfaces that indicate different water levels than those assumed. A difficult issue for many works on the Messinian salts is to balance the assumed water input from the Atlantic Ocean with observations of water level indicators to provide conditions that would promote precipitation of salts in the various basins where thick salts are observed [4].
Ref. [5] came to the following conclusion: “… the very last phase of the salinity crisis in the Mediterranean Sea did not experience desiccation, but that deposition took place under permanent subaqueous conditions”. This implies that salt formed on the sea floor without the water drying out. The authors refrain from stating what other mechanisms might have caused the solid salt to form.
Furthermore, a study by [6] states that the sea level drawdown of the Messinian is still under debate. Their work concentrates on erosional patterns around Ibiza and Orosei in the Tyrrhenian Basin. Their conclusion is that there must have been at least one low-stand sea level during the Messinian Salinity Crisis and possibly evaporite basins in the area to explain the salt deposits.
Ref. [7] studied the Lago Mare stage of the Messinian era within marginal basins in Spain. Based on the geochemical and sedimentological evidence, they conclude that during this phase of salt deposition, the Mediterranean must have been nearly full and close to the level of the Atlantic Ocean, with maybe a few hundred metres difference.
Ref. [8] investigated the flow of fluids through the Betic corridor, now the Guadalquivir Basin, from the Mediterranean to the Atlantic during the Messinian Salinity Crisis (MSC). Using high-resolution geochemical data (XRF) and stable isotope data from both the Mediterranean side and the Atlantic side, they conclude that there must have been transport of fluids even during the MSC. This might be indicative of a rather high water level in the Mediterranean during the MSC.
Ref. [9] present work from the eastern Mediterranean, specifically the Levant basin. Based on the material from recent commercial oil wells, they present some rather surprising conclusions: “Thus salt precipitation took place in a non-desiccated deep basin, having a restricted but often open connection with the Atlantic Ocean”. They also conclude the following: “However, the Levant record indicates that salt started to deposit in deep waters, so that deep-water settings occurred during at least a part of the salt emplacement. This calls for a different mechanism other than substantial desiccation for explaining the deep-basin deposition of halite”.
It is evident from the literature cited above that even within the well-studied area of the Mediterranean, the processes involved in the formation of salt deposits are not yet fully understood.
Based on the presented observations, one might even question the central argument for the desiccation of The Mediterranean during the MSC.

2.2. Biostratigraphy of Salt Beds without Marine Species

Ref. [10] applied the concepts of biostratigraphy to salt accumulations. This was performed by sampling sections of salts/anhydrite and carefully dissolving the salts in order to observe what living organisms have been trapped in different layers of the salt. The examined locations were as follows:
  • Loulé salt mine in southern Portugal, which is in Early Jurassic mobile salt. Impure halite, coaly shales, and dolomitised/silicified gypsum were sampled.
  • Souss-Massa salt mine in Morocco—an Early Jurassic non-mobile salt, where core samples from halite and shales were obtained.
  • Wieliczka salt mine in southern Poland, which comprises Miocene mobile salt. Several types of salt and interbedded shales were sampled.
  • Zechstein salt in northern Poland, where red and grey shales, impure black halite, dolomites, and black shales were sampled.
  • Santana gypsum quarry in central Portugal, where outcrop samples of recrystallised and re-precipitated gypsum and primary gypsum were obtained.
The conclusion from this study is as follows: “Overall, assemblages are dominated by spores and pollen and other terrestrially-derived organic particles. This suggests that the salt was being deposited or formed in a terrestrial environment or that sea water was only sporadically present”.
This conclusion is highly surprising if evaporation of the sea was the source for these major and varied salt accumulations. The results from their studies, therefore, confirm that other processes might have been involved—for example, hydrothermal processes. To maintain the current paradigm for salt giant formation, one would have to explain why major salt deposits are devoid of marine organisms.

2.3. Anomalous Features in Zechstein and Messinian Salts

Ref. [11] lists the occurrence of talc, talc/serpentinite, amenite, and penninite in Zechstein salt deposits in Germany. All of these minerals are associated with relatively high temperatures (talc > 300 °C) and environments rich in magnesium and aluminium. The formation of these minerals is not to be expected when considering the composition of and conditions for solar-evaporating seawater.
Ref. [11] also lists the occurrence of different gases that are encountered in salt deposits. Among these are hydrogen, helium, neon, and radon, i.e., gases that are rare in the normal atmosphere and in the ocean, but even so, they occur within deposited salts. These occurrences, again, may point in the direction of hydrothermal processes being intimately associated with salt formation.
An investigation by [12] deals with noble gas contents of brine inclusions in bedded salts from the Permian Salado formation in New Mexico. This formation and the brine inclusions are in the order of 200 Ma years old, and the brine inclusions were found to be enriched in both argon and helium relative to atmospheric values. Helium was enriched up to 250 times. Helium is present in the atmosphere as a trace gas (~ five parts per million) and is rather insoluble in seawater (two nano-moles per kg seawater). Ref. [12] also measured the content of nitrogen mixed with the helium (4He). The ratio of helium to nitrogen in these inclusions was in the order of 1:250. Knowing that nitrogen constitutes 78% of the Earth’s atmosphere and helium only 5 ppm, the observed ratios in the inclusions are way too high to reflect salt formation in contact with seawater and atmosphere.
The content of 4He is said to be due to the alpha decay of naturally occurring radioactive elements, e.g., argon from the decay of 40K. While this explanation may well be valid, the question of why helium ended up being concentrated relative to nitrogen in brine inclusions in salts is still intriguing. A viable explanation is that both gases were trapped simultaneously inside the inclusions, thus excluding both the atmosphere and the ocean as their source. As argon and helium are known to occur in the deep Earth, including the mantle, their presence and concentrations trapped in inclusions indicate that hydrothermal processes might be involved.
Ref. [3] report on the observation of unusually large selenite crystals (i.e., gypsum) in the Primary Lower Gypsum of the Messinian salts. They state that such crystals are not observed in modern natural environments, or even in man-made salt works. However, gypsum crystals may develop into huge dimensions, like the ones in the ‘Naica.Cave of Crystals’, Mexico. According to [13] such crystals can only develop in hydrothermal environments. Thus, the observation by [3] of large selenite crystals in Messinian salts might indicate hydrothermal formation as opposed to solar evaporation. Recently, new theories have emerged, highlighting the possibility of gypsum precipitation trigged by microbiological activity, and accordingly, these are somewhat in disagreement with the theory on solar evaporation as the only source of crystal formation [14,15,16].
Ref. [17] reported a physical experiment involving a perforated and sand-filled electric water heater submerged slightly above the bottom in a large seawater-filled tank. The object of this experiment was to see if precipitates from seawater could be produced below sea level. This was verified as the heating element became surrounded by anhydrite and halite. A layer of gypsum was also observed on the bottom of the large tank, beneath the test apparatus. Presumably, this gypsum had precipitated after contacting the exterior surface of the water heater via retrograde precipitation. This experiment indicates that seawater may precipitate gypsum at low temperatures and anhydrite at higher temperatures during hydrothermal circulation of seawater into hot seabeds.
Within the present paradigm, one would have to present a mechanism involving solar evaporation of seawater in contact with the atmosphere that would lead to the observed gas concentrations, concentration ratios of different gases, high-temperature minerals, and observed sulphate crystals.

2.4. Coloured Salts in the Klodawa Salt Stock, Poland

Ref. [18] reports on a peculiar property of the fluid inclusions in the salts of the Klodawa salt dome: a Polish section of the Zechstein salt deposits. One of the most striking aspects of the Klodawa salts is the occurrence of coloured salts, in blue and red, associated with doubly terminated quartz crystals and pyrite. Ref. [18] suggests that this phenomenon of blue salts is associated with the combined effect of high temperature, volcanic rocks, and magmatic fluids.
Temperature measurements based on inclusions in anhydrite crystals embedded in the halite salt showed homogenisation temperatures in the range of 350 °C to 450 °C, while inclusions in anhydrite crystals embedded in a boracite layer were found to vary between 197.8 °C and 473.8 °C [19]
Ref. [18] also observed euhedral, doubly terminated quartz crystals embedded in both halite and anhydrite. Such quartz crystals are believed to have crystallised from silica-saturated aqueous solutions in the salt and are commonly found in zones with anhydrite or dolomite matrix. However, such quartz crystals are never observed if aragonite is present [20] and aragonite is the most common shell-building mineral in marine fauna. Silica is also relatively sparse in normal seawater.
Ref. [18] also made observations of inherent pressures and fluid phases during the entrapment of inclusions, concluding that the large variation is consistent with a hydrothermal system and that hydrothermalism and fluid flow are partially responsible for the deformation and distribution of the various salts.
Tobola and [19] conclude that the Klodawa salt dome and other salt domes in Poland have mineral beds and homogenisation temperatures that are difficult to explain by sedimentary or diagenetic processes. Their observations are not consistent with the hypothesis that the salts and other minerals (e.g., quartz, pyrite, and marcasite) were formed by seawater evaporation. The observations presented above are not consistent with solar evaporation as the observed temperatures are much too high. Later processes involving mantle heat might provide an explanation in some cases; however, if this is always the case, the primary salt formation mechanism might indeed be questioned.

2.5. Soluble Salts Deposited in Humid Environments

Ref. [21] studied the deposition of highly soluble salts like tachyhydrite and bischofite during the Aptian in the South Atlantic and during the Messinian Salinity Crisis. These salts are claimed to be inconsistent with the wet and warm paleoclimate reconstructed for these periods. Ref. [21] performed a numerical simulation of mineral reactions involving serpentinisation by seawater. According to these simulations, brines formed during serpentinisation would mimic the observed composition of salts from natural environments, as described above.
Ref. [22] also concluded that abyssal serpentinites might be the source of large salt accumulations. Serpentinites concentrate brines and produce heat over extended periods. The subsequent ascent of hot, saline brines to the surface or seafloor may be a long-lasting process, mainly occurring in areas characterised by tectonic and/or magmatic activity.
If brines containing highly soluble salts are reduced in water content, i.e., by water-absorbing serpentinisation, the remaining brine may solidify upon cooling below ca. 120 °C, albeit still incorporating crystal water, as in tachyhydrite.
The observations presented above provide a possible link between common mineral reactions, common thermodynamical properties, and common salt deposit composition. It provides an additional route to salt formation; however, it does not exclude other mechanisms.

2.6. Diapiric or Extrusive Salt in the Northern Red Sea

In the northern Red Sea, ref. [23] describe up to 40 km long salt ridges that rise up to 250 m above the seafloor. Ref. [23] concluded the following: “We suggest that development of diapirs under these minimal overburden conditions was made possible by the high thermal gradients in the area, resulting from the underlying attenuated continental crust and ascending mantle, that prevail in the rift system of the northern Red Sea”.
Salt diapirs in the Northern Red Sea rise above the seabed, even though they are not pushed up by the weight of the surrounding sediments and even though the basin is extending and therefore providing no sideways push on the diapirs. Even after assuming that the salts were originally deposited as a result of solar evaporation, their further development remains enigmatic. As indicated by [23] other processes could be involved that might explain both the presence and deformation of the salts.
Ref. [24] have presented a new model for the development of oceanic crust in the Red Sea. They conclude that the Red Sea axis is completely underlain by oceanic crust as far north as the Red Sea–Dead Sea transform fault. This implies that the salt diapirs, observed by [23], might be located directly on top of the spreading oceanic crust, a situation which also supports the hypothesis of a mantle-sourced magmatic brine for the salt ridges.
Ref. [25] have interpreted two seismic transects west of Brothers Island in the northern Red Sea. They state that the area has not undergone tectonic activity since salt deposition. The absence of tectonic activity, minor tilting of the underlying basement, and little sediment loading above the observed salts are not consistent with the observation of diapiric salts. Even so, diapiric salt structures were identified, underlying layered salts with no sediments in between the two that might have induced differential loading (see Figure 1).
In a more recent article by [26], the same area is investigated further using more recent information. This includes both seismic profiles and data from three wells drilled through varying amounts of salts and sediments, down to the basement. These data are particularly valuable as they provide both correct stratigraphy and true vertical depths. It appears that some of the diapirs observed by [25] are in fact elongated salt ridges located along basement faults caused by the expanding Red Sea basin. The interpretation by [26] is that the salt has been pushed upwards by differential loading into the weak zones caused by these faults.
They also stated that salt deposition occurred during two consecutive phases. The first deposited salts created salt diapirs on top of faults penetrating into the basement. Only the first deposited salt (interpreted as Belayim and South Garib Fms) seems to be involved in the diapir building, although there is a thick, evenly distributed layer of salt of younger origin (interpreted as Zeit Fm.) on top of that. This layer of salt is substantially thicker than the one that caused the diapirism and it does not seem to be affected by the diapirism.
The situation prior to and during the first deposition of salt has not been presented. Without showing initial conditions with presumably stratified salts only, it is difficult to understand how [26] arrived at their first stage description.
Many salt diapirs are shown by [26] to be located on top of basement highs with basement faults inside the basement highs. This raises a question on the nature of the basement highs and the nature of these faults.
A process involving salt deposition from evaporating seawater would initially produce layered salts and no diapirs. Mechanical sculpting of the diapirs prior to layered salt deposition is conceivable, although not very likely without sediment loading because deformational forces would have been small then. Diapiric movements without the presence of later arriving salts are not very likely as this would have left the diapirs unsupported and unstable in whatever water was present. The diapiric movements caused by differential loading presumably would have involved the deformation of the entire salt body and not just salt inside the diapirs, especially since the salt thicknesses became a lot greater during later salt deposition. Bedded salts and diapiric salts, therefore, might have formed more or less simultaneously by some common process different from plain seawater evaporation followed by later differential loading.

2.7. Isostasy and Salt Basins

If salt basins deposit salts from solar evaporation of seawater, this will lead to an increasing load carried by the underlying mantle. This would lead to seabed subsidence that might be calculated and thus determine the level of the seabed before and after salt deposition. In an attempt to match observations, several models have been suggested regarding initial conditions. Ref. [27] argue against initially deep desiccated basins by stating that due to isostatic adjustment, an initially shallow basin with a controlled influx of evaporating seawater will deepen under the load of precipitating salts and possibly explain the observed salt thicknesses. This might also explain why such salt basins in their opinion lack deep- water sediments.
However, according to [3], the hypothesis of the shallow Mediterranean throughout the Messinian is disproved by observations of deep-water sediments below, within, and above the basinal evaporites.
One of the wells in the Red Sea presented by [26] the Quseir B-1X, was drilled in ca. 620 m water depth, down to 4214 m. It penetrated unrecovered sediments between the seabed and ca. 940 m depth. Thereafter, it penetrated salts with sediment stringers nearly all the way down to the basement at 4200 m. An anhydrite layer was penetrated between 3640 m and 3850 m. In other words, except for the sediments on top, the well penetrated evaporitic layers all the way to the basement.
As a side note, one might question what evaporative process would selectively lay down 210 m of anhydrite in between halite layers locally, in just one well, showing no sign of diapiric movements.
If the salt deposition was caused by solar evaporation, this would imply shallow water conditions with a sub-aerial basement at the time of deposition. Because the stratigraphy is known, isostatic calculations in Quseir B-1X may uncover whether this is possible.
In general, water-filled sediments with 30% porosity will have roughly the same density as salts—ca. 2.15 g/cm3. Therefore, when carrying out back-of-the-envelope calculations, no distinction between the two is necessary. Mantle density may be estimated at ca.3.3 g/cm3.
Loading the mantle with ca. 620 m seawater and salts/sediments down to 4200 m depth would make the original seabed/basement of Quseir B-1X sink in by ca. 2520 m. To end up at 4200 m, the initial salt deposition on the basement would have had to occur at 4200 m − 2520 m = 1680 m deeper than the present surface.
In Quseir A-1X, the lowermost salt is located at 3200 m depth. The seabed is located at ca. 600 m depth. An isostasy calculation produces a depth at the start of deposition at 1325 m below the surface in this well. In the third well, RSO-B 96-1, the base of the salt is located at ca. 2040 m. The well penetrated 500 m water plus sediments and salts down to the pre-salt sediments. A calculation on this well shows that the top of the pre-salt sediments would have had to be located at 1155 m below the present surface to end up at 2040 m.
The observations in all three wells are incompatible with solar evaporation when isostasy is taken into account.
Although it is possible to envision salts flowing from one location to another after initial deposition, the scale and areal extent of this would have had to be massive to explain the isostatic conditions in the three wells.
Ref. [26] repeat an observation from the Red Sea made by several previous authors. They observe a major unconformity on top of the Zeit formation indicating that the entire Red Sea basin became sub-aerially exposed at the end of the Miocene.
This implies that the erosional surface would then have been located ca. 940 m higher than present in Quseir B-1X, ca. 850 m higher in Quseir A-1X, and ca. 680 m higher in RSO-B 96-1. To lift the surface by 940 m due to uplift caused by erosion would imply the removal of ca. 940 × 3.3/2.15 m = ca. 1440 m of sediments above the unconformity. Similar calculations for the two remaining wells require the removal of 1300 m and 1040 m, respectively.
Figure 4 in [26] shows a global sea level of 70 m above the present level at the start of salt deposition and ca. 50 m above the present level at the end of the Miocene, where deposition ended. The start of salt deposition and the sub-aerial exposure at the end of the Miocene are therefore hard to explain by sea level alone as the salt deposition was occurring at the highest sea level of the entire Miocene.
Uplift of the entire basin by mantle movements is an available mechanism that might fit isostatic calculations and explain the erosional surface.
Ref. [28] used observations of ancient shorelines in the Mediterranean and calculated their original depth during the Messinian Salinity Crisis, accounting for flexural isostasy and sediment compaction. According to their results, halite deposition began in the Central Mallorca Depression at 1300–1500 m water depth. This is consistent with the paradigm-contradictory observations made by [26] and therefore proves an important point that is not confined to one region only.
Ref. [29] has studied the development of the salt basins of the South Atlantic and the Gulf of Mexico. He concludes that salt deposition occurred during or immediately after 2–3 km subsidence of the basins. Without other mechanisms causing subsidence, salt deposition of 3–4.5 km thickness would have been required to inflict this subsidence, if deposited by evaporation of seawater. This would place the salt surface 1–1.5 km above the existing sea level, as pre-salt strata were found to be located at sea level at the time of their deposition.
In another study from the South Atlantic, ref. [30] concluded that salt deposition in the Gabon basin occurred at the time of mantle exhumation: “This is direct proof that salt was deposited during mantle exhumation. Salt deposition is interpreted to have occurred at variable depths”. Ref. [30] also conclude that salt deposition must have occurred at water depths exceeding those expected during salt deposition due to solar evaporation.
Ref. [31] have documented an apparently universal and significant uplift of the crust due to mantle uplift prior to rifting, and the initiation of salt deposition appears to occur when the terrain is uplifted, a process occurring today in The East African Rift Valley at an altitude of more than 1000 metres. This confirms the importance of mantle movements and indicates that fluid content might act as a prime reason for such movements.
Maintaining isostatic balance in basins dictates that the capacity to accumulate salt thicknesses depends upon the initial depth of the basin to receive the salts. As explained by [27], a basin will deepen further from this depth when filled with salts, as the salts have a density larger than water.
However, as salts are less dense than the mantle, the build-up of salts will exceed the subsidence of the mantle. According to the current theory for salt deposition, salt deposition will end when the salt surface reaches the surface of the sea. The implication of this is that thick layers of salt in isostatic equilibrium can only be produced in deep basins—according to the current theory.
Assuming that a suitable supply of seawater is available and solar evaporation is occurring, any basin may end up being filled with solid salts of greater thickness than the initial basin depth (albeit not without traces of marine life).
A current example where this process might be occurring is found in Kara-Bogaz-Gol in The Caspian Sea. According to [32], the bottom of the bay was no more than 7 metres below The Caspian Sea which in turn was ca. 30 metres below sea level in 2020. Under the assumption that the sea is capable of leaking into Kara-Bogaz-Gol, a total of ca. 40 metres of basin depth is available for salt deposition before isostatic adjustments due to the increased weight of the salts that sets in. With the density of salts being roughly 2/3 of the density of the mantle, the isostatic balance would be reached at a salt thickness of ca. 60 metres and the top of salt at sea level. To accumulate very thick layers of salt, the initial depth of an evaporative basin must be a lot deeper unless the basin deepens during the process for other reasons than salt loading (mantle movements, the ascent of brines from below, etc.).
In both the Gulf of Mexico, the South Atlantic, the Red Sea, and in the Mediterranean, isostatic evidence suggests that salt deposition did occur under circumstances not compatible with the current theory for the formation of giant salt deposits. The formation of massive layers of solid salts in the deep ocean by solar evaporation remains unexplained and indicates that there are serious issues with the current evaporite theory and/or understanding of basin behaviour. Forming thick layers of salts in shallow basins is also not possible without additional movements of the basin floor by other mechanisms than salt loading.

3. Brines Sampled from Crust and Mantle

3.1. The Significance of Brines in the Subsurface

The presence of salinity and salts in the deep crust and mantle may prove to be a precursor for the formation of large salt deposits. A hydrothermal origin of large salt accumulations by the circulation of seawater into the crust/mantle is negated by the amount of energy required to evaporite vast amounts of dilute seawater. This objection is invalidated if it can be substantiated that the formation of solid salts is possible from existing, deep, hot fluid sources. Deep-sourced fluids in a hot, pressurised environment do not require heat input to produce the salts. They have all the internal energy needed to separate salts from the water phase.
Brines are commonly observed directly in rocks from the crust and mantle, or indirectly using geophysical tools. Many giant salt deposits are located on the continental crust or on the remains of rifted continental crust. What is missing is an established link between the deep-seated brines, their origin, and giant salt deposits. In order to prepare for the formulation of an alternative to the evaporite theory, a better understanding is required on the nature and quantity of subsurface brines. A selection of observations of saline brines from different regions, different depths, and using different tools of observation is presented in the following chapters.

3.2. Saline Brines collected from the Continental Crust

Several studies have attempted to explain the origin of the well-known hypersaline brines within the Canadian Precambrian shield. Ref. [33] studied chemical and isotopic data from deep-seated calcium chloride brine in the Miramar Con gold mine near Yellowknife, in the Northwest Territory. The objective was to determine whether the composition of the brines could be explained by a surface evaporative process, or a cryogenic process. The results strongly suggest that the brine salinity is of marine origin. The mechanism responsible for concentrating the hypersaline brine was not clear, as evidence exists to support both evaporative and cryogenic processes. Regardless of the concentrative mechanism, the chemical data indicate that the Yellowknife parent brine was concentrated 28- to 30-fold relative to seawater.
A study by [34] on the origin of saline ground waters of the Canadian and Fennoscandian shields tested the hypothesis of freezing as the main reason for the salinity of deep-seated fluids. Only the brackish waters of upper sections down to 1000 m were found to be affected by freezing. Based on the isotopic analysis and geochemical data, the following was concluded: “Physical and geochemical data do not support the hypothesis that shield brines formed cryogenically in glacial marginal troughs”. The formation of methane hydrates as part of the process was also considered, but not found to fit the data. A deep origin of the brine was not considered, but the presence of hypersaline brines in the upper crust remains a fact.
Ref. [35] investigated the origin of the salinity of crustal fluids in the Black Forest basement in Germany. Two fluid systems have been studied: deep thermal waters and more shallow mineral waters. An interesting observation is made on the composition of the two fluid systems. The shallow fluids are enriched in bicarbonates and depleted in chloride, relative to the deeper sourced thermal waters, indicating that they are the result of different processes.
Springs producing thermal waters in the Black Forest are normally found in granites, whereas mineral waters are located predominantly in gneiss. By observing the ratio of Cl versus Br in the thermal waters, ref. [35] concluded that they are not the result of the dissolution of nearby evaporitic halite deposits, but rather a result of seawater dilution. The conclusion regarding their final composition was found to be a result of surface waters equilibrating with rocks and then mixing with deep, stagnant, saline fluids within the crust.
The ratio between Cl and Br was shown by [36] to resemble that of seawater, even within inclusions from eclogites. This is a very important observation as it may indicate that mantle-derived brines might easily be interpreted as ocean-derived brines. Ref. [37] reached a similar conclusion. The source for the stagnant, saline fluids in the Black Forest might, therefore, be very deep and old, even if they share similarities with present seawater.

3.3. Fluids Observed in Deep Wells

The German superdeep KTB well was drilled down to 9.1 km in the vicinity of an extinct subduction zone. A bottom-hole temperature of 265 °C was encountered. Pump tests reported by [38] confirmed that pressures of less than 1 MPa (10 bar) above hydrostatic were sufficient to fracture the rocks and create microearthquakes, just above 9 km depth. The conclusion was that the well had been drilled down to the brittle-ductile transition zone.
Before drilling this well, a pilot hole was drilled down to 4 km depth, distanced 200 m away. This enabled the testing of permeability between the two wells. The composition of the fluids varied systematically with depth: groundwater in the upper 650 m, NaCl-dominated fluids of low salinity at intermediate depths, and highly saline (up to 48 wt% CaCl2-NaCl brines) basement brines below about 3200 m. Fluids were mostly confined to faults and fractures, and these were encountered, even at bottom-hole depths in numerous distinct zones up to several tens of metres thick. According to [38], the KTB well encountered three main lithological units: paragneisses, metabasites, and a “variegated” series of gneisses and amphibolites. The rocks were found to have been subducted to at least 40 km depth, before being lifted rapidly to cooler crustal levels. All three units had suffered a pervasive Barrovian-type metamorphism under upper amphibolite facies conditions, 6–8 kbar and 720 °C, under peak conditions of the paragneisses.
Formation pressures determined in brine-containing zones showed a nonlinear increase with depth, probably due to stepwise increases in salinity. The formation pressure of 103 MPa at 9 km was found to be near-hydrostatic. This, and the fact that experiments proved a hydraulic connection between the pilot hole and the main hole, indicates that fluid pathways were highly interconnected.
The Russian superdeep well drilled in the Kola Peninsula reached more than 12.2 km depth [39]). It differs from the KTB well in penetrating an intracratonic setting including Precambrian rocks. As observed in the KTB well, the Kola well encountered rocks containing saline fluids and dissolved gases. The temperature at the bottom of the well was 180 °C. Rocks were found to be highly fractured below ca. 7 km depth [39].
The expectation of the scientists before drilling was an encounter with dry granitic rocks at depth. This proved to be wrong. The metamorphic facies observed at depth in the well changed from greenschist facies at the top to epidote-amphibolite and amphibolite facies below 9 km depth. Brines escaping from fractures or released after being mobilised from the mineral structure showed increasing content of magnesium, sodium, calcium, and chloride ions, with depth. A substantial amount of He, H2, and CO2 was also liberated from the drilled rock.
Hence, both superdeep wells, in different tectonic settings, documented that the deeper crust is highly fractured, filled with brines or chemically bound brine components.
In fact, ref. [39] claims that, based on their observations, a new model for hydro-physical zonality was developed. He states that “This model not only explains the nature of hydrothermal fluids unrelated to intrusions, but also the mechanism of rock foliation in zones of disaggregation and formation of some tectonic faults, etc., but also radically changes the theory of the process of water circulation in the continental crust”.
Several wells have been drilled deep into the Fennoscandian shield in relation to mining activities. Ref. [40] studied data from several wells and noted three common types of saline groundwaters.
(1)
An uppermost layer of brackish and saline water from 300–900 m depth.
(2)
Saline water and brines from 1000–2000 m depth.
(3)
Superdeep brines which have been observed to a depth of at least 11 km in the drill hole on the Kola Peninsula, U.S.S.R.
Electrical and seismic studies in shield areas suggest that such brines are commonly present at even greater depths.
In the academic dissertation by [41] on deep ground waters in eastern Finland, a 2.5 km deep drill hole has been investigated. The salinity of ground waters was found to be moderate (less than 15 g/L) down to approximately 1.5 km and more than 60 g/L in the deeper sections below 2 km. The main solutes are CaCl2 and NaCl. A deep source for this salinity was not considered.
Based on the observations presented above, it is suggested that the hypersaline fluids observed at crustal depths are not the result of solar evaporation of surface waters. The works presented above also prove that deep crustal rocks might indeed contain large amounts of salts.

3.4. Fluids Observed in Rocks Originating from the Lower Crust and Mantle

Many authors have confirmed the presence of saline fluids in metamorphic and igneous rocks that have deep origins. A few examples are presented here.
Ref. [42] present data from fluid inclusions embedded in a serpentinite involved in the Alpine subduction. The inclusions formed at 2.5 GPa and 550–600 °C during partial devolatilisation and eclogitisation. The inclusions are salt-saturated and contain up to 50 wt% Cl, Na, K, Mg, and Fe.
Ref. [42] concluded the following: “The data presented suggest that the seafloor hydrothermal signature was inherited by the eclogitic fluid due to partitioning of chlorine and alkalis into the fluid phase”. This means that the presence of brines in eclogitised hydrous peridotites indicates deep recycling of seawater-derived fluids and that those hydrous ultramafic systems may act as large-scale carriers of seawater into the mantle.
Ref. [43] have analysed the subduction-related coesite-bearing eclogites of the Tso Morari Complex, Himalaya. These eclogites contain five major types of fluids, including high-salinity brines and low-salinity aqueous fluids. The coesite-bearing rocks are inferred to have been buried to a depth of >120 km, where they experienced ultrahigh-pressure metamorphism at ca. 750 °C and 39 kbar. The different fluid systems were created during the subduction phase of the observed rocks, as well as their later rise towards the present surface.
Ref. [44] made a study of primary fluid inclusions hosted in quartz and topaz from the Beauvoir granite (Massif central, France) and the metasomatised stockwork surrounding the granite. They concluded that the following: “Microthermometric and Raman spectrometry data show that the earliest fluid is of high temperature (500 to >600 °C), high salinity (17–28 wt% NaCl eq.), and Li-rich (Te < −70 °C) with Na/Li ratios ∼5”. This study demonstrates that primary fluid inclusions not only preserved the pristine signature of the magmatic-hydrothermal fluids in the Beauvoir granite but also in the stockwork rocks.
Ref. [44], therefore, document the presence of abundant brines within the ascending, molten granite body. As also reported by [45], this likely means that rising granite bodies (diapirs) are surrounded by high-density brines.
Ref. [36] studied the halogen content in fluid inclusions derived from eclogites within the gneiss region of western Norway. Salinities of 15–25 wt% NaCl equivalent were observed in omphasite- and garnet-hosted inclusions. They made an important observation regarding the apparent nature of the analysed fluids: “The Cl/Br vs. Br characteristics of the fluid inclusions resemble the chemical evolution of evaporating seawater, which might provide a basis for studying halogen mineral-fluid fractionation even at high P-T conditions”.
In other words, brines from depth in subducting systems, might be interpreted as evaporited seawater if only the ratio between Cl and Br is considered.
Ref. [46] present the first direct determinations of the composition of fluid inclusions in diamonds from eclogite xenoliths in the Udachnaya kimberlite pipe. The xenoliths had been exposed to 1150 °C at 50 kbar. The xenoliths were examined and fluid inclusions in clinopyroxene and garnet were analysed. High values of Cl (15–25 wt%) and K (10–20 wt%), carbonates, and small amounts of water were observed.
The work presented in this chapter also confirms the presence of salts and water in the deep crust that were not sourced directly from the surface.

4. Geophysical Observations of Salinity at Depth in the Crust and Mantle

4.1. Observations from the Cascadia Subduction Zone

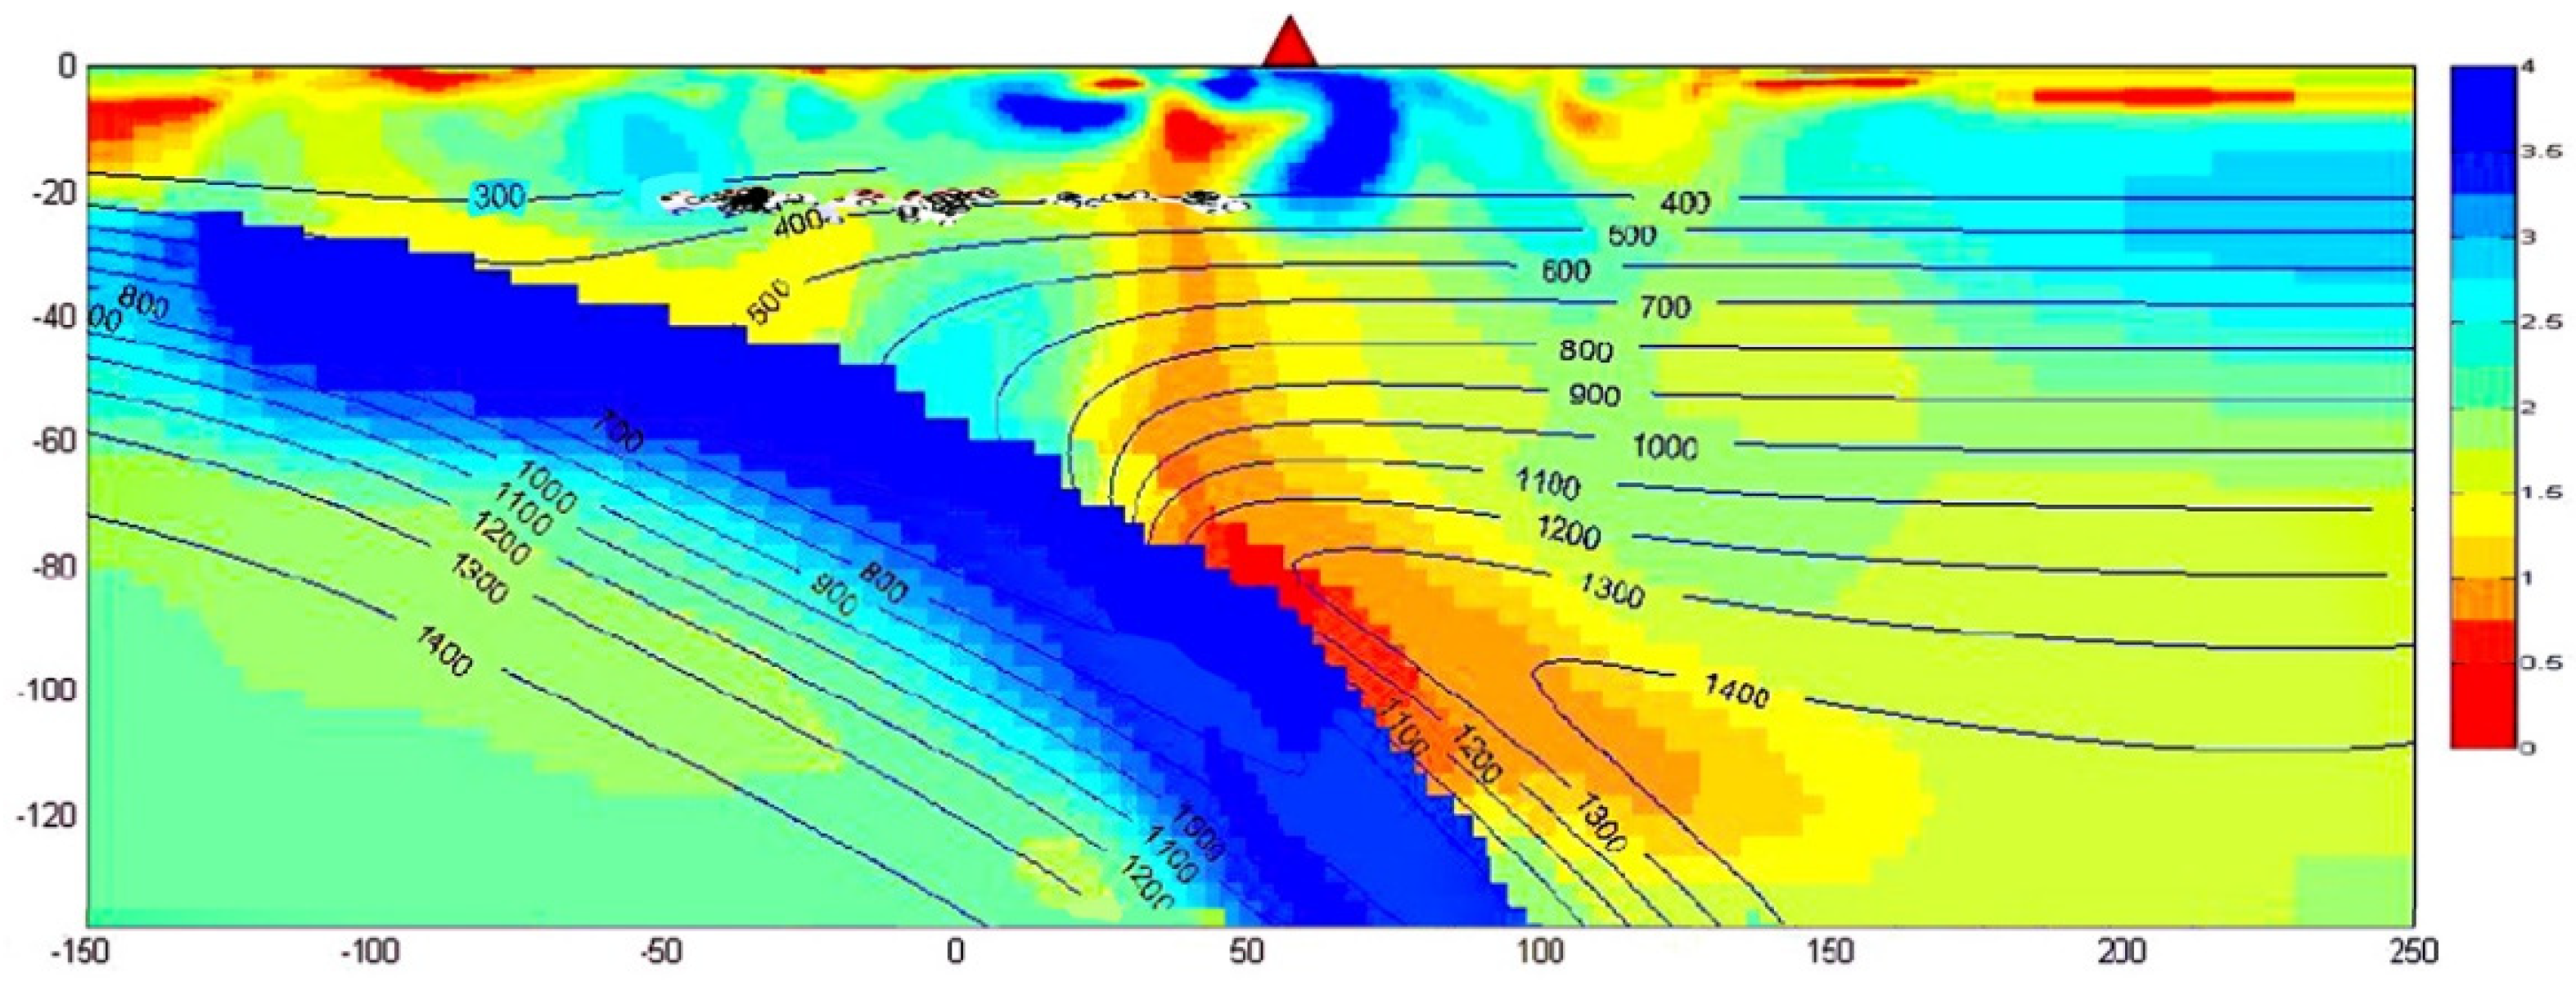
Ref. [47] present geophysical data from the Western US, including the Southern Washington Cascades Conductor (SWCC). They identify low-resistivity zones at slab depths of 35–40 km starting ca. 100 km west of the volcanic arc in all conductivity profiles along the western US. This is interpreted as being a result of prograde metamorphic fluid release from the subducting slab because of eclogitisation at estimated temperatures of 500–550 °C. The fluids rise to Moho levels and even crustal levels not far from the arc and are thought to have broken through the brittle crustal domain in a fracture mesh. Since this apparent fluid release is close to where low-frequency earthquakes are located, a connection between the two is likely. Ref. [47] also discuss the role of salinity in the observed conductive zones. A saline fluid content as low as 0.2% might produce the observed response, although it was not believed that the subducting slab would release saline fluids, the salinity might possibly increase during ascent in the mantle wedge. [47] believe the ascending fluid to be responsible for the extensive serpentinisation of the upper mantle wedge.
In the deeper segments, within the mantle wedge, a large and deep zone of increased conductivity is observed. Ref. [47] interpret this to be due to chlorite mineral breakdown and fluid release down to 800 °C. This zone is assumed to represent flux melting and it ascends nearly vertically towards the surface where it combines with the conductive zone arising from eclogitisation, just in front of the volcanic arc. However, the assumption about melting might not be valid. Ref. [48] state that depleted peridotite solidus is at 1050 °C, implying that saline fluids rather than melts were observed by [47].
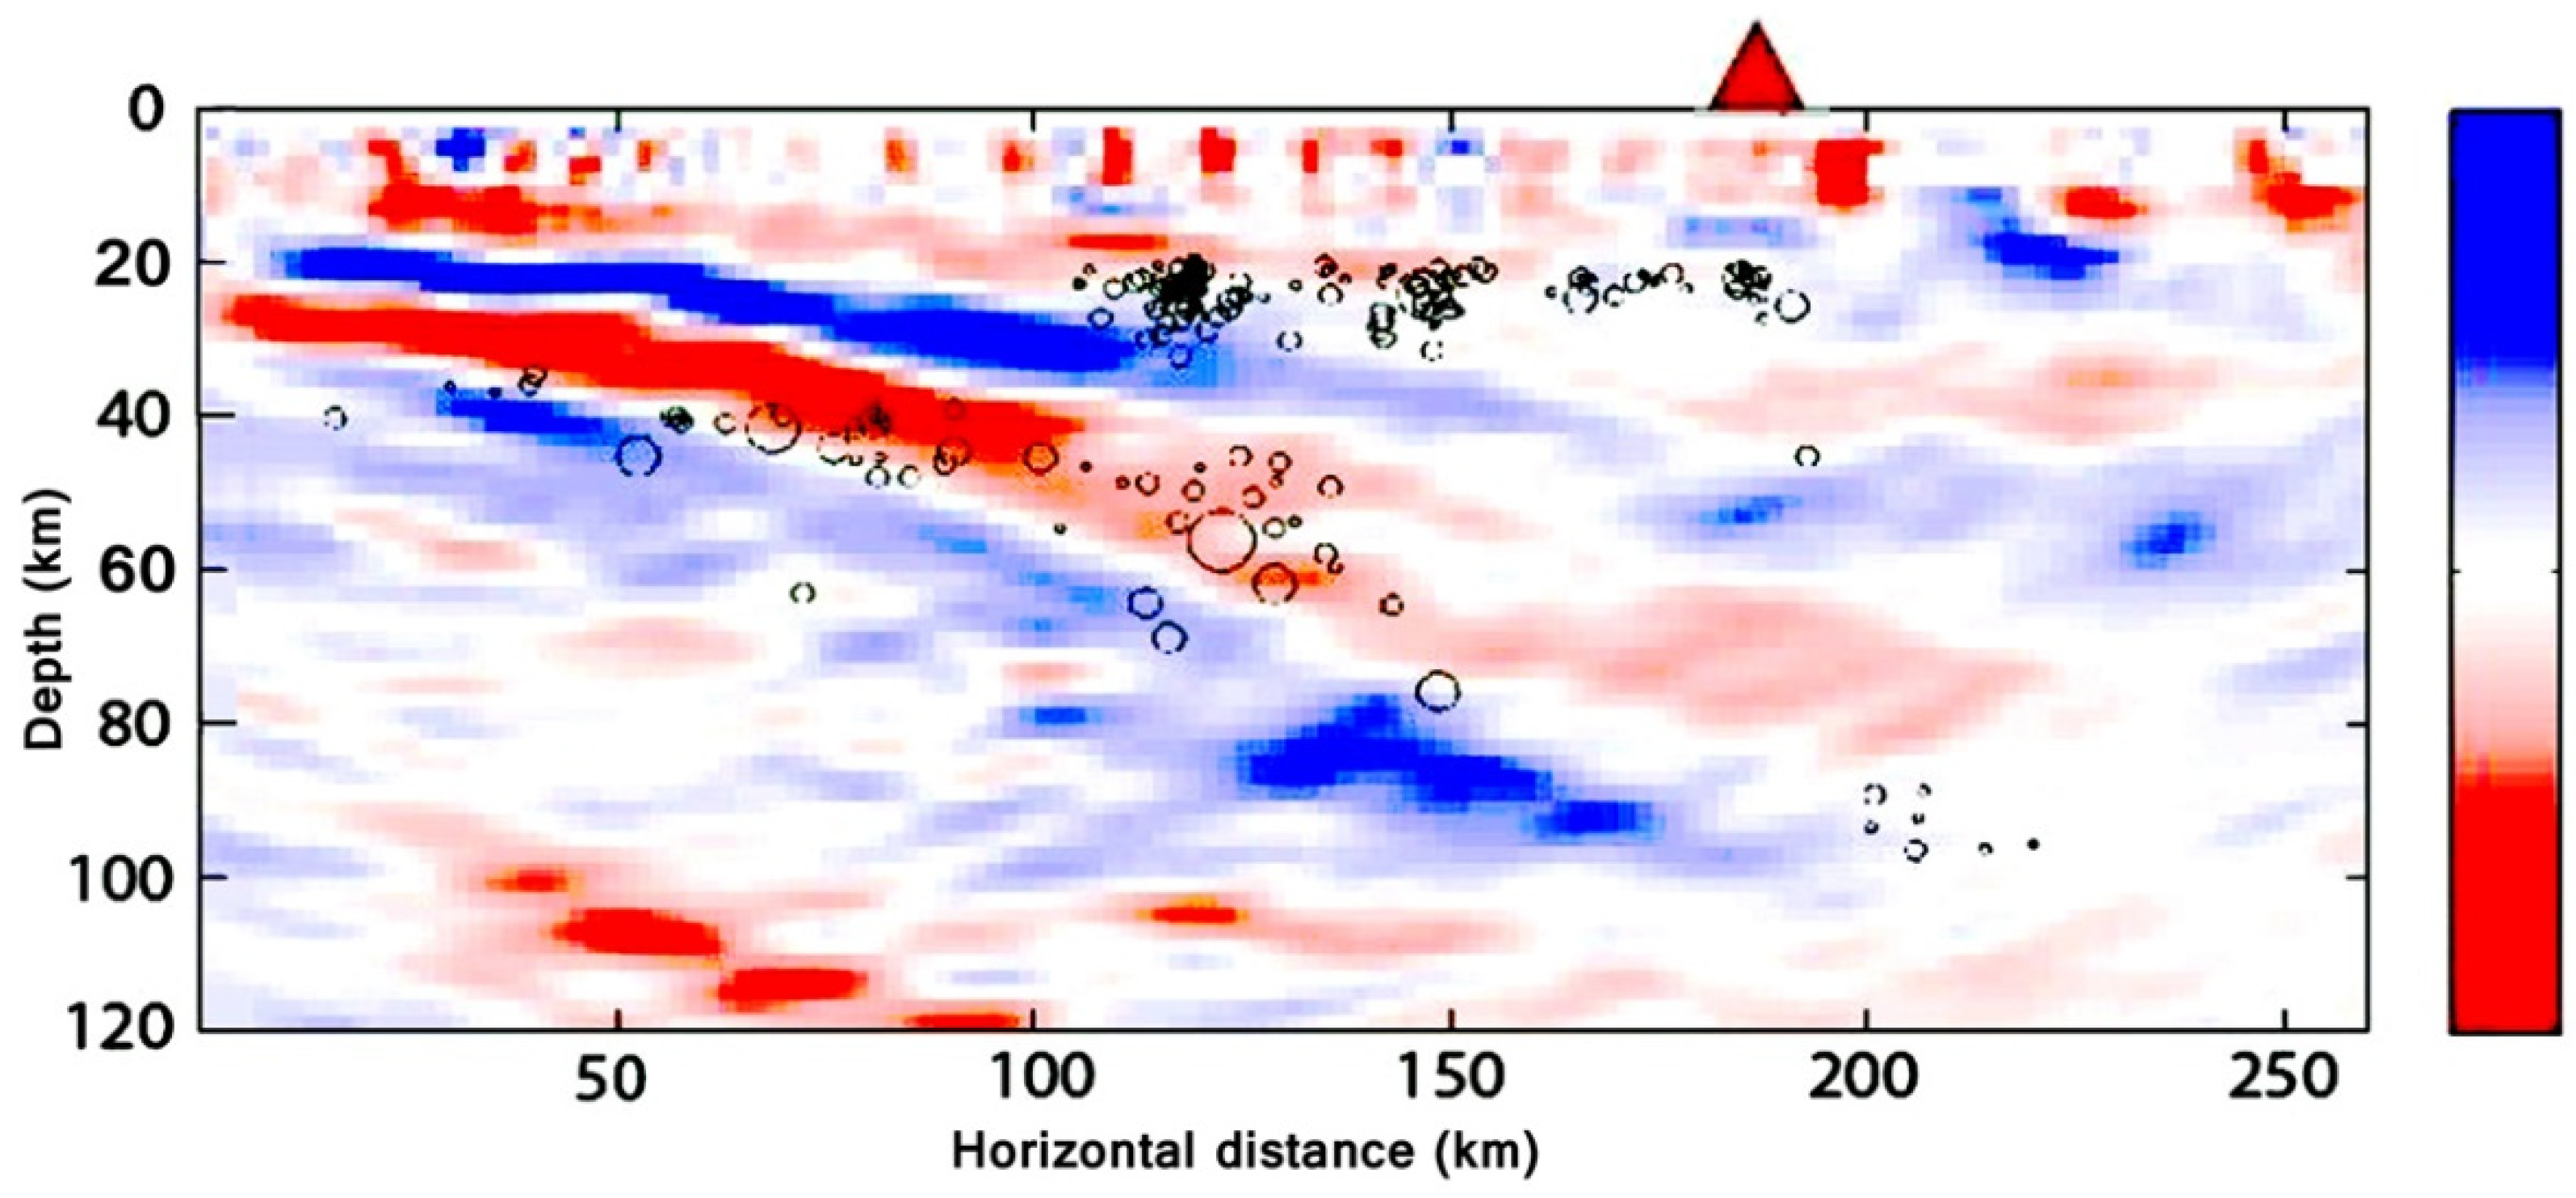
Ref. [49] used seismic information to constrain the magneto-telluric inversion, from the SWCC. As shown in Figure 2 and Figure 3, this resulted in a clearer impression of the conductive zones.
A conductive zone is shown above the subducting slab, from 120 km depth and nearly to the surface some kilometres away from the volcanic centre at Mount Rainier. The supposed zone, near the horizontal shear zone identified by [47] is more prominent in the results presented by [49] They identify this seismogenic zone below 20 km depth as being associated with fluids from the dehydration of hydrated metabasalt in the upper-crustal layer of the descending slab. Earthquakes are observed along the path of fluids moving from this dehydration zone. They are seemingly all located at ca. 20 km depth and just below the upper limit of the conductive zone. A temperature of 400 °C to 500 °C, at 20 km to 30 km depth, is too low to induce melting. A depth of 20–30 km would likely be within the ductile section of the lower crust.
The combination of hydration, distinct seismicity, and location of the conductive zone, resembles the situation observed by [51] in the Chilean Altiplano. Earthquakes might be the result of movement along a shear zone at ca. 20 km depth, as suggested by [47] Like the observation by [51] in the Altiplano, [48] also observe the perturbation in seismic velocity from high to low. The localising of earthquakes by [49] at and below 20 km depth, but not above, might also indicate the presence of strain-hardening minerals, capable of brittle behaviour even at this depth.
Ref. [49] indicate Moho at ca. 40 km depth. Low conductivity is observed to the east of and below the Mount Rainier volcano (Figure 2). No theory is presented to explain this observation.

4.2. Observations from the Altiplano, Lake Uyuni Area

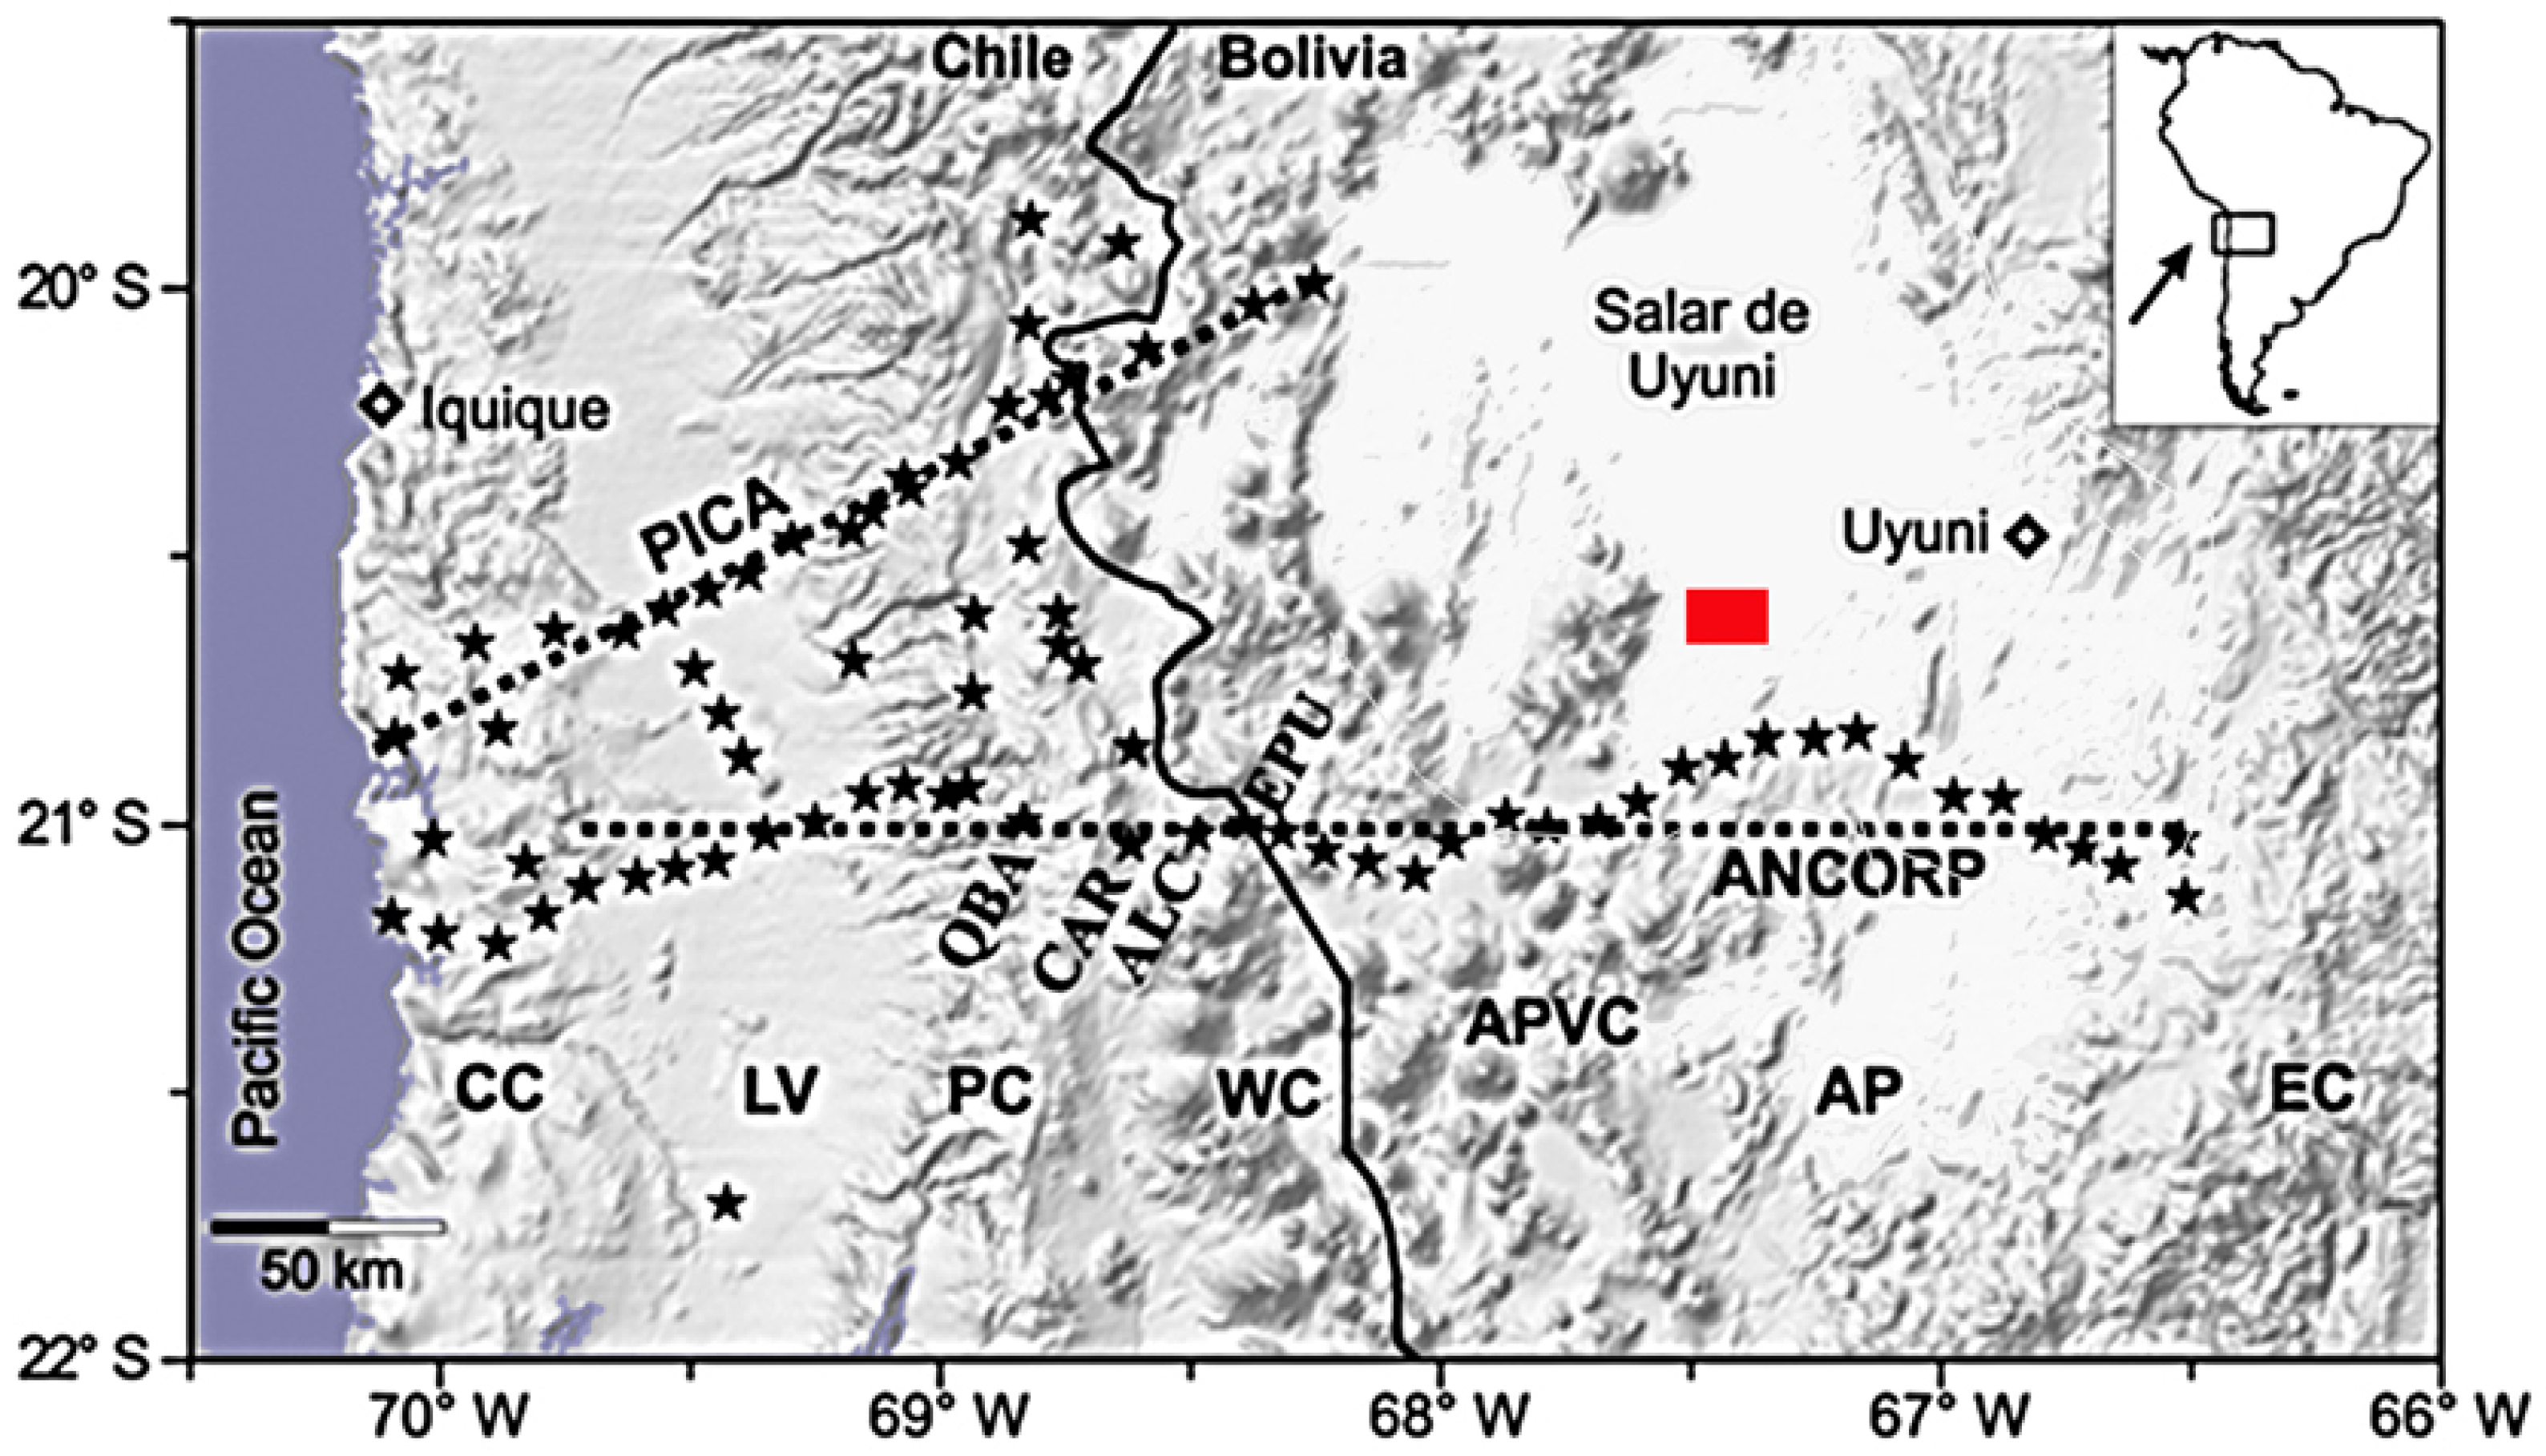
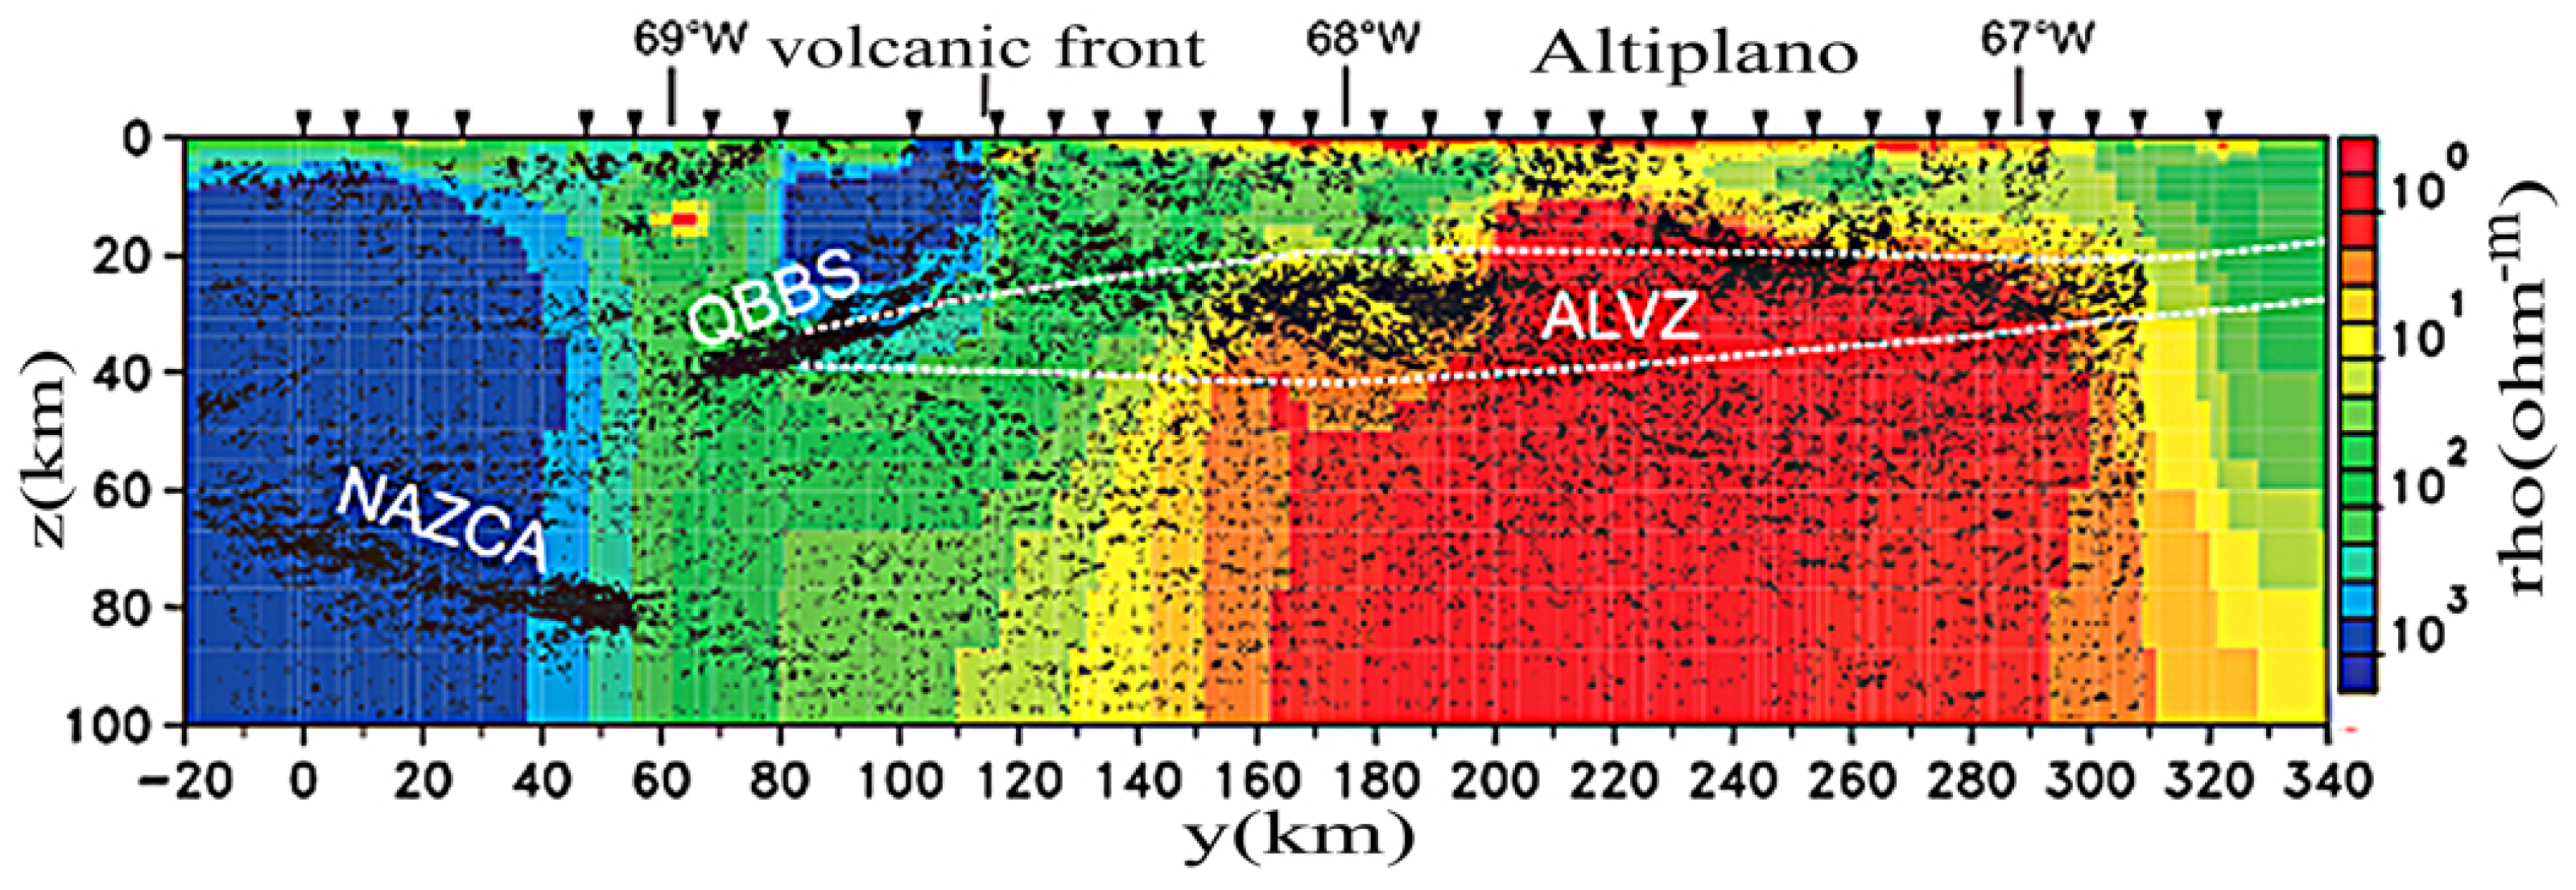
The Altiplano of the Chilean and Bolivian Andes have been studied extensively by several authors: [51,52,53,54,55,56]. Seismic data are combined with MT data between the Pacific Ocean and the Altiplano region, between ca. 20°S and 21°S. (Figure 4 and Figure 5).
One MT network is named ANCORP, where sensors are placed along the southern banks of the largest salt-lake on Earth, Lake Uyuni. Another network (PICA) is located further north and extends to the northwestern corner of Lake Uyuni. The Altiplano region is situated above a section with low-angle subduction by the Nazca plate. These investigations clearly indicate the presence of major conductive zones below the Lake Uyuni area. A zone of diverging seismic velocities (ALVZ) is observed on top of the large conductor. The upper part of the conductive region is situated below ca. 20 km depth and temperatures around 500 °C (see Figure 5).
Ref. [53] concluded the following: “This highly conductive domain also coincides with low seismic velocities and a zone of an elevated vp/vs ratio and, although not well resolved, with low Qp seismic quality factors. Taking into account the enhanced heat flow and a derived temperature model, the most probable explanation lies in the assumption of granitic partial melts”.
The observation of an anomalous heat-flow of up to 40 mW/m2 more than the expected value is not consistent with available radioactive elements in the area. Simulations on melt fractions and melt configurations have not been successful in recreating the appearance of the conductive zone. Although partial melts might explain the observations at depth and at elevated temperatures, low temperatures at ca. 20 km depth are not consistent with extensive melting. Ref. [55] point to the petrological evidence for high oxygen fugacity in ignimbrites from the area. This would argue against reduced carbon or graphite in the crust as being the cause of enhanced conductivity. Furthermore, graphite alone, or any other conductive minerals such as ores, would not cause the reduction in seismic velocities and damping of seismic waves as observed.
Ref. [51] summarised some of the observations of the ALVZ-reflector: “It remains enigmatic, however, why seismology sees the top of the fluid accumulation zone significantly lower than our MT model”. Seismology is sensitive to pore pressures and fluid content of the rocks, whereas elevated conductivity can also be the result of mineral type and fluids. The combination of depth, seismic activity, high Vp/Vs ratios, and temperature/heat production indicates that the invasion of high-pressure fluids from below and the presence of certain minerals might be the cause.
One surprising observation by [51] is the lack of conductivity directly below the volcanic arc. Similar observations are made in many other volcanic systems. Because volcanoes are driven by water, this tells us something about the non-conducting properties of some water-rich melts. A possible explanation for this phenomenon is presented by [57] where conductivity is claimed to be caused by three factors: melt conductivity, solid conductivity, and conductivity in a melt volatile phase (MVP) [58]. Ref. [57] claim that the more silicic melts are more conductive and that the types of dissolved minerals in the MVP are important for the total conductivity. Na-ions are regarded as important current carriers and their ability to move freely in the melt/fluid/rock-system is important for the observed conductivity. According to [57] adding one wt% of dissolved H2O to a melt leads to a 1.3 to 2.5-fold increase in the melt’s electrical conductivity. The implication of this is increasing conductivity with an increased content of minerals incorporating sodium and silica in volcanic melts.
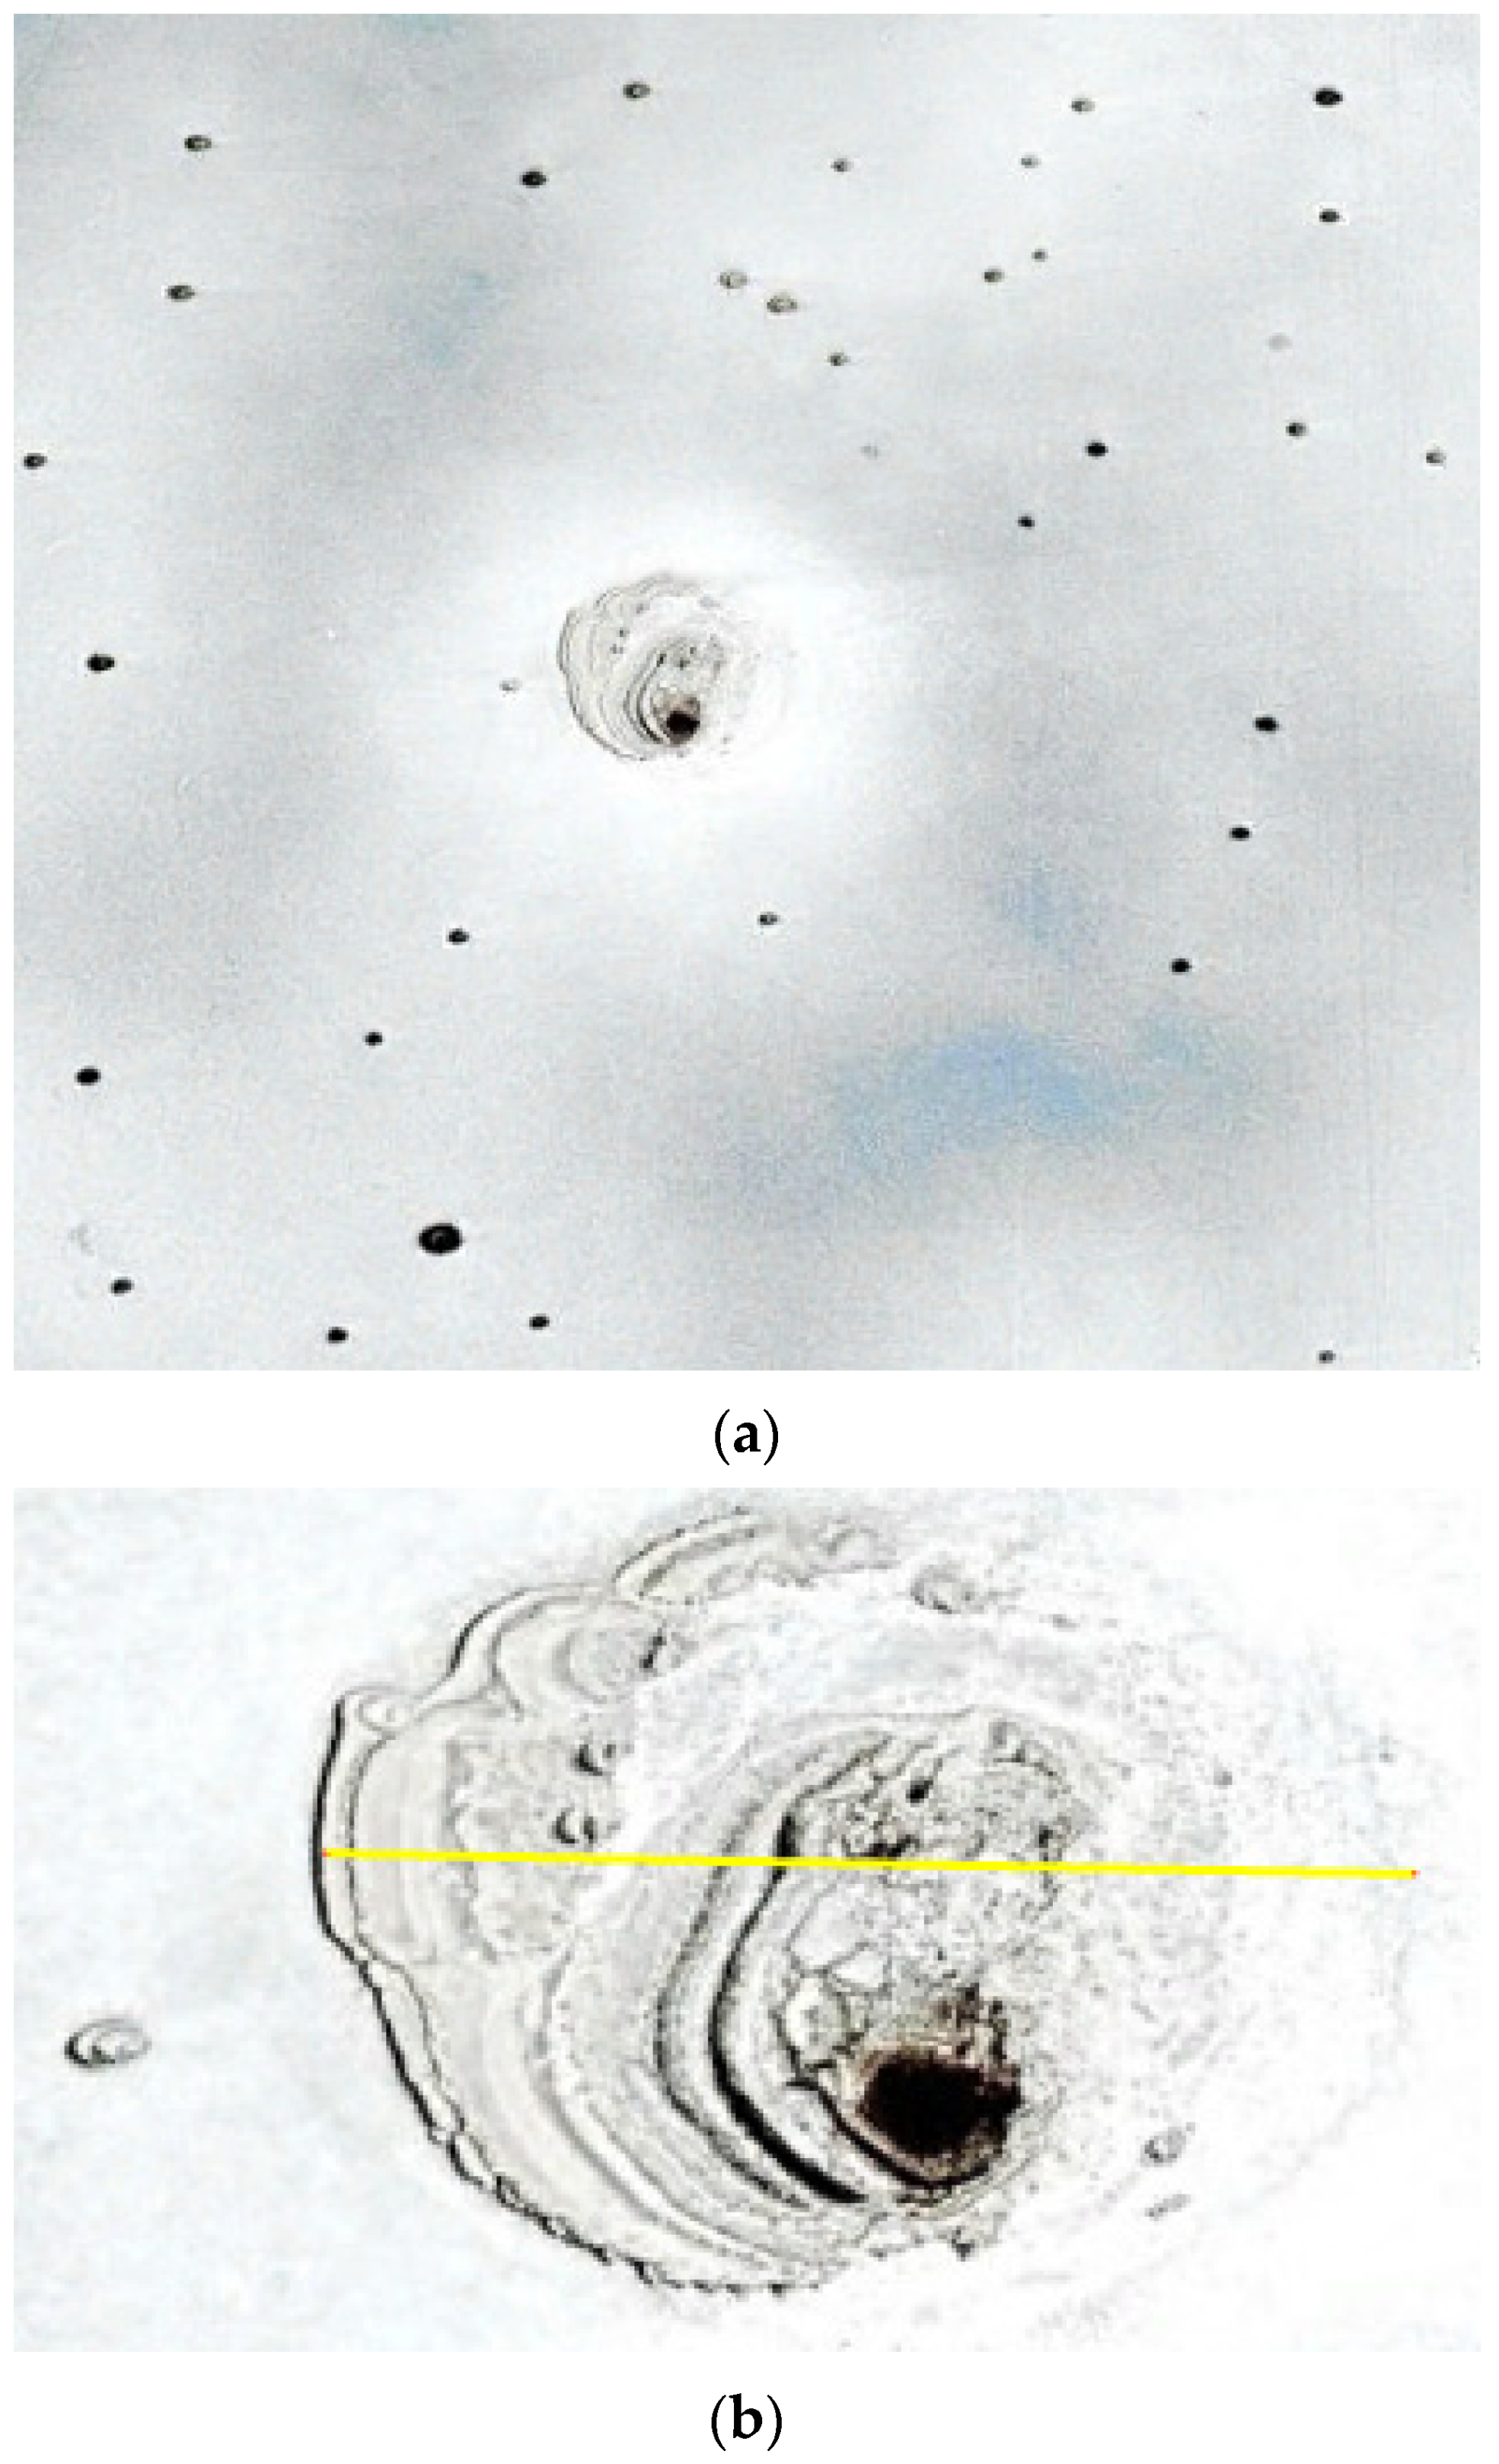
Our conclusion is that deep-seated and shallow saline fluids are the most obvious cause of the observed conductivity in the Lake Uyuni area. This conclusion is also supported by photographic evidence from the surface of Lake Uyuni, showing numerous pockmarks or saline springs (see Figure 6a,b).

4.3. Observations from the Altiplano-Puna Area, Bolivia

Above the Altiplano-Puna Magma Body (APMB), near the Uturuncu volcano, ref. [58] measured the electrical conductivity at depth. They also studied the Southern Washington Cascades Conductor (SWCC), using MT methods. Their objective was to estimate the apparent water content in these volcanic systems. Their estimates of water content in APMB and SWCC were based on calibrations from crystal-liquid equilibria and rock melt—H2O solubility experiments. Ref. [59] measured conductivity, performed laboratory experiments on the observed mineralogy, and calculated the effect of varying degrees of melt fraction and water content. Their conclusion on the conditions within the APMB was as follows: “These independent constraints strongly indicate that the magma body at 15 to 30 km bsl contains 10–20 vol% of H2O (±CO2) -saturated andesitic melts at a temperature close to 980 °C within a solid matrix”. In addition, the minimum melt water content must be eight wt%. Ref. [58] estimated the total volume of this water-rich magma body to be 500,000 km3.
Obviously, other substances might contribute to the observed conductivity, for instance, salts. Salts, if present, would reduce the estimated water content and still produce the observed conductivity. Ref. [59] also discuss the possibility that saline fluids could generate the high conductivity of the APMB. In our opinion, subducted salts might be contributing to the observed conductivity. Thus, saline fluids may create interconnected pores in magmatic systems and become visible in MT measurements.
Because of a mass balance calculation on the amount of subducted water in the region, [59] concluded that their estimate for water content within this subduction zone was unusually high compared to an average subduction zone. This might also be an indication that less water and more salts are involved.
Ref. [60] report data collected from the MT network in APMB in more detail. Clear indications of conductivity below 20 km depth (below sea level) were observed, with diapiric sections from this level up to ca. 5 km depth. Ref. [60] interpret the conductive zones beneath the volcanic centre to be andesitic melts. This is also in accordance with observations by [57] for andesitic melts with salinity and high silica content.
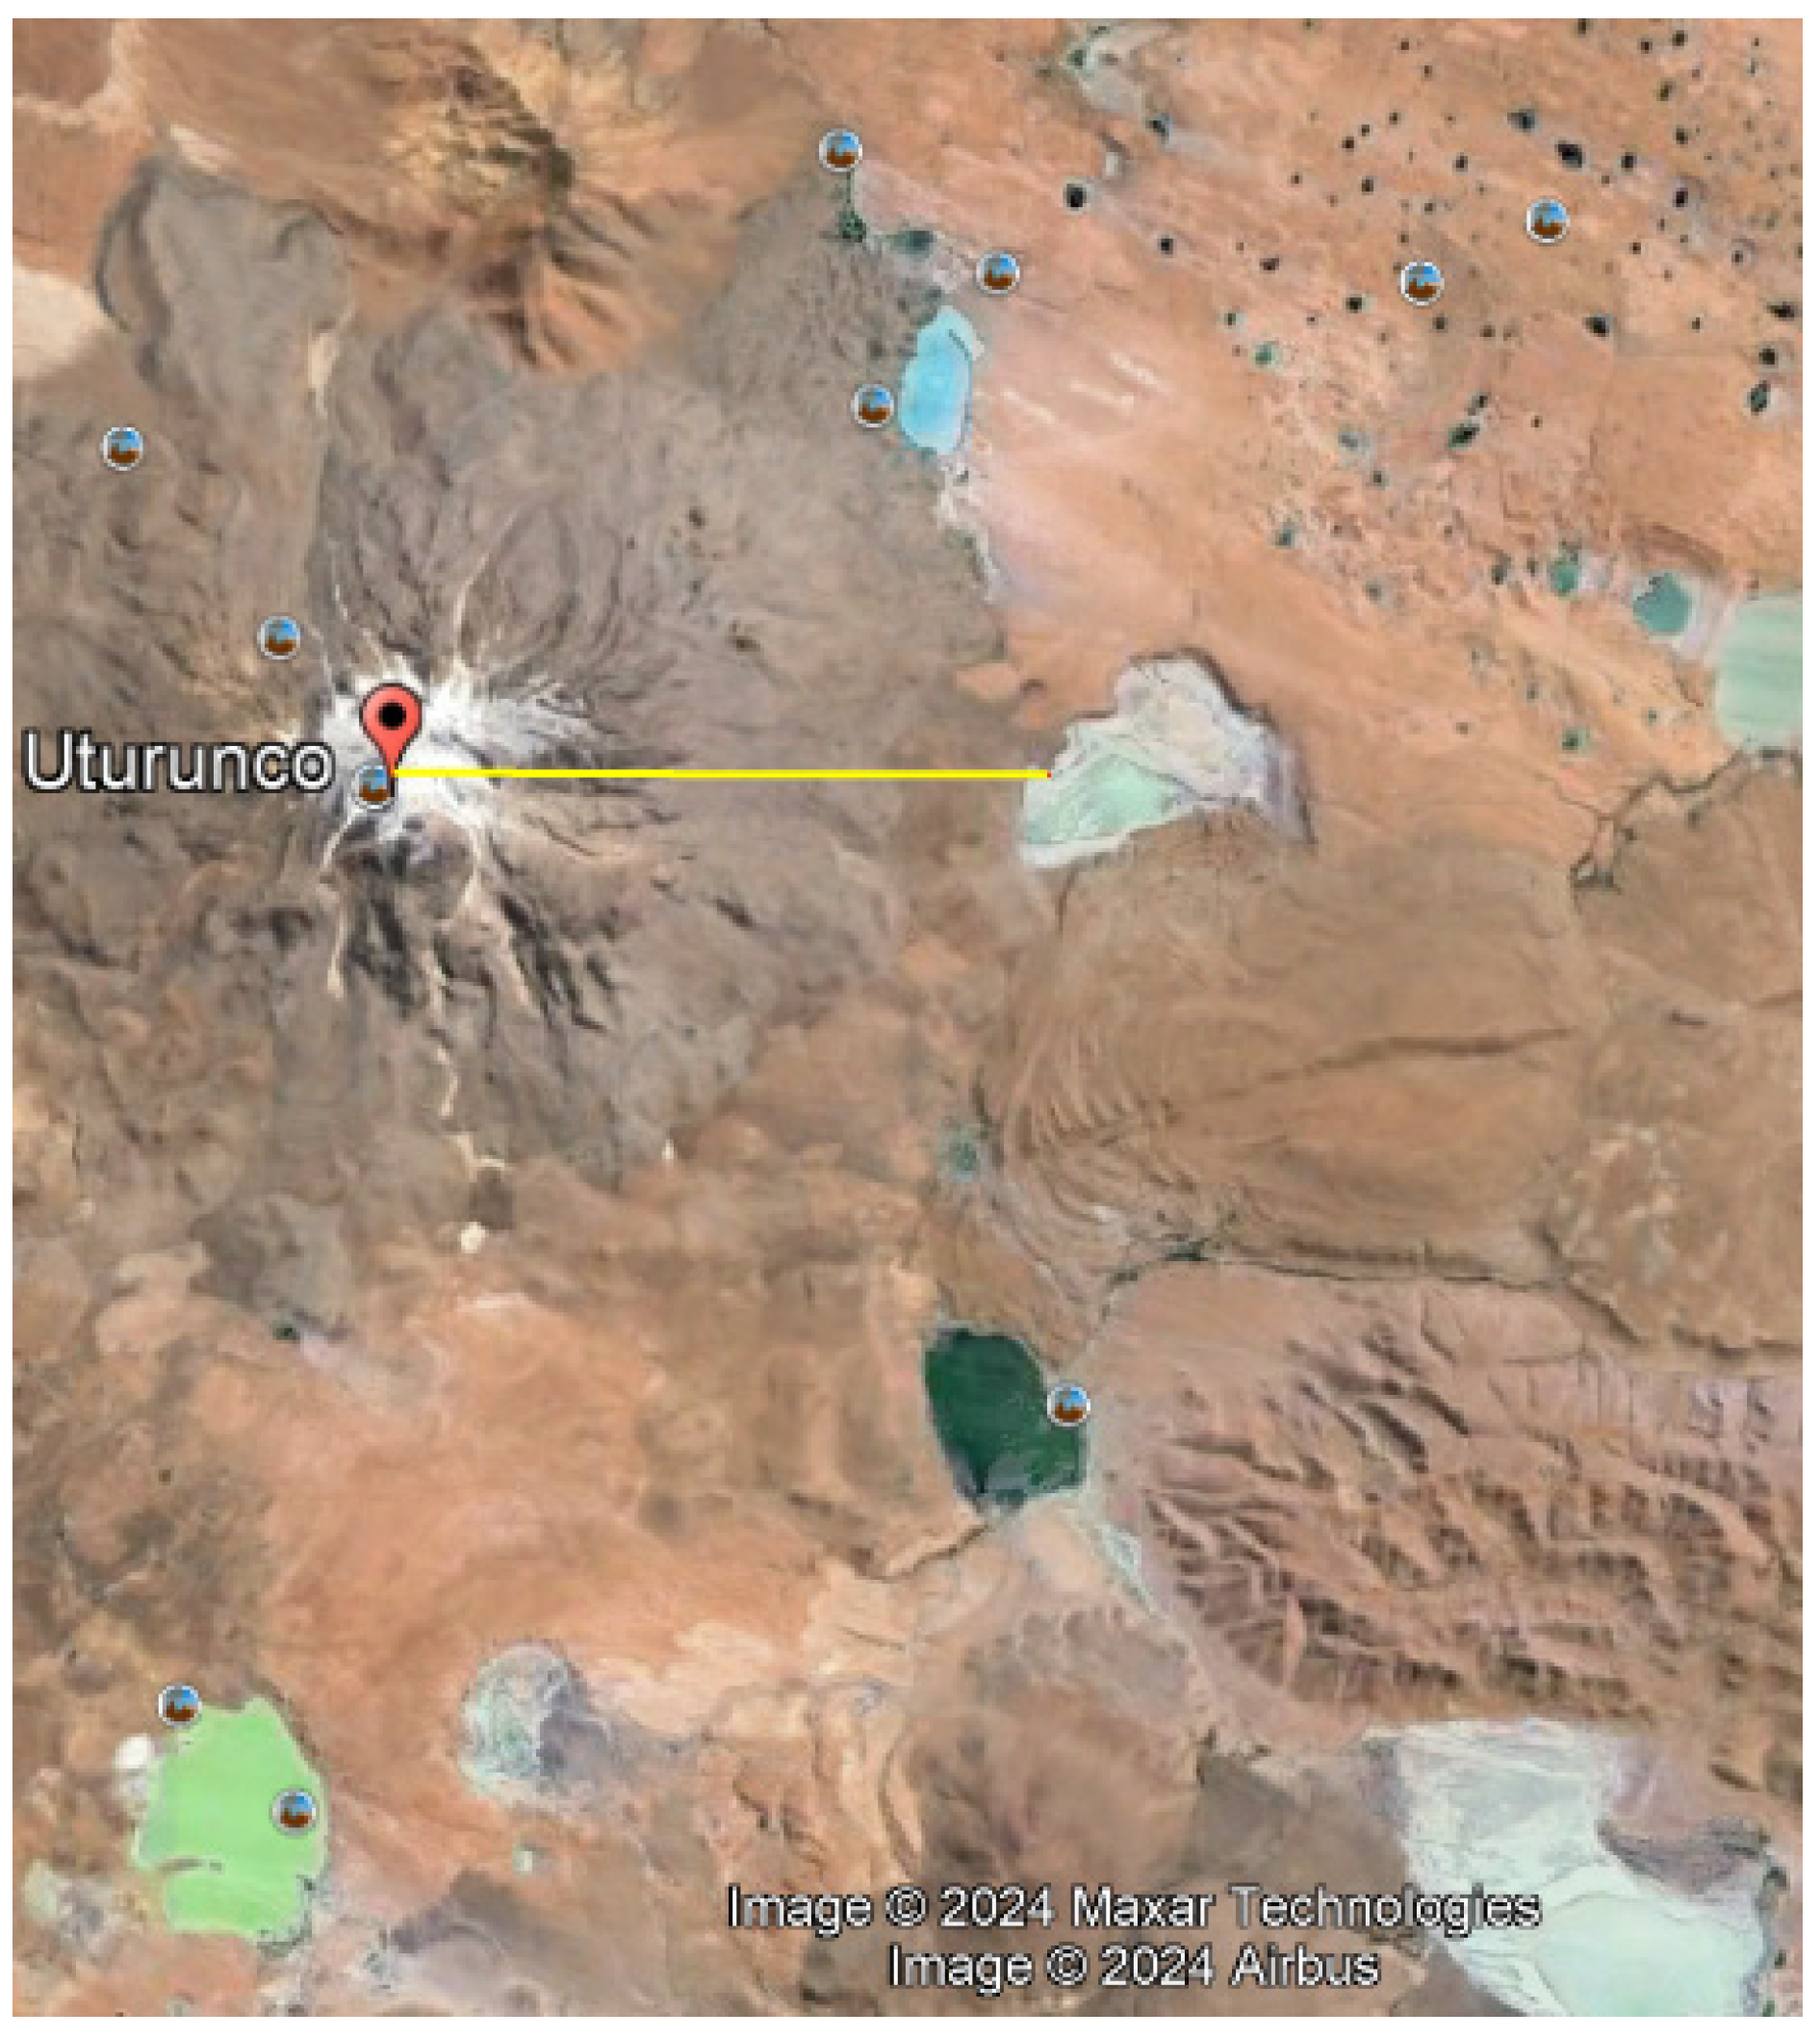
Ref. [60] interpret other shallow, high-conductivity zones as partial melts or fluids. Figure 7 shows parts of the Uturuncu region, above the APMB. The image clearly shows salt lakes and large pockmark fields, indicating the escape of saline, and perhaps less-saline fluids, from subsurface sources.
Ref. [61] performed numerical simulations of fluid behaviour in volcanic porphyry copper systems. The simulations include variations in brittle/ductile properties and permeability, hydraulic fracturing, and different salinities. Ref. [61] presents results from simulating a volcanic system including an influx of meteoric, colder water from above. He demonstrates that this leads to a self-organising permeability reduction in the mixing zone between magmatic and meteoric fluids around the magma chamber. In this situation, the expelled fluids from crystallising magma would follow a path to the surface, up to 7 km away from the volcanic centre, which is analogous to observations around the Uturuncu volcano. An illustration of this is shown in Figure 8.
Observations of high conductivity around volcanic centres, rather than directly below, might therefore be an indication of saline fluids forced into following the path of highest permeability after being expelled from the crystallised, outer parts of a magma chamber.
Similar to the Lake Uyuni area, salts escaping from the active subduction zone in the APMB area are observed from depth to surface. If we are to believe the conclusions made by [59] and [60], the salt lakes in the Uturuncu area probably represent just a minor part of the salt stored in the APMB. A later rifting in the area might release the full salt-producing potential.

4.4. Observations from China and Tibet

All continents are the result of tectonic processes involving subduction, in periods. Therefore, one should expect to find inherited structures from such events in the crust and mantle of stable continents. Of special interest to this study would be observations indicating salinity still exists in the mantle and crust from fossil subduction zones.
The continental crust and mantle of the Himalayan orogeny have been investigated in several studies utilising independent MT networks. A few results will be mentioned here to illustrate that even for this area, with a very thick crust (50–70 km in places), the observation of conductive zones shows what seems to be the result of a common, general process located above Moho in the lower crust.
Thus, ref. [62] performed an MT study of the northern Tibetan Plateau. Several, large and independent conductive zones are observed in less conductive zones, all along the magneto-telluric network. The more prominent conductive zones are all located beneath depths of 20 km to 30 km. Several smaller conductive zones rise higher than 10 km, and some seem to go all the way to the surface. Among the larger conductive zones, some go very deep. Zones of high conductivity are found in connection with well-known suture zones. Based on conductivity measurements alone, this association might be due to weaknesses created by fluids, or vice versa. Some conductive zones continue down to the depth limit of the investigation (100 km).
Ref. [62] concluded that a “… pervasively high conductance suggests that partial melt and/or aqueous fluids are widespread within the Tibetan crust”. They further conclude that in southern Tibet, the high-conductivity layer at 15 to 20 kilometres is probably due to partial melt and aqueous fluids in the crust. In northern Tibet, the conductive layer at 30 to 40 kilometres is likely due to partial melting. Zones of fluid may represent weaker areas that could accommodate deformation and lower crustal flow. However, it is not self-evident that melts exist at 20 km depth, as the temperatures of this depth normally do not exceed 5–600 °C.
Ref. [63] report results from an 800 km long MT network in a different region of the eastern Tibetan Plateau. Also, conductive zones are detected between 20 km and 30 km depth. These data indicate a physical link between other conductive zones and deep faults reaching well beyond Moho depth. A large-scale conductor is located below 20 km depth in the lower crust beneath the Songpan-Ganze Block. According to [63], it might act as a guiding channel that facilitates the eastward escaping movement of crustal materials from the Tibetan Plateau.
This observation strongly indicates that the zone below 20 km depth has a fault-localising capability and brittle behaviour.
Ref. [64] collected MT data to obtain a continuous image of the lithospheric electrical conductivity across the southeastern Tibetan Plateau margin. The resulting conductivity model reveals two major conductive features in the middle–lower crust beneath southeastern Tibet and the Chuxiong basin, both of which are consistent with the presence of fluids and likely enhanced by shear deformation along large faults. An anomalously high conductive zone was observed beneath the Chuxiong basin and was interpreted to contain substantial amounts of saline aqueous fluids.
As presented above, in studies performed on the Tibetan plateau, associations between faulting, suture zones, and zones of high conductivity are common. In a study of a fossil (Neoproterozoic to the end of the Paleozoic) interoceanic subduction and accretion zone in western Junggar, China, [65] made several important observations related to this subject. Data from conductivity measurements along an MT network show the presence of solute-rich fluids above the fossil subduction zone (Figure 9).
Surprisingly, serpentinites observed in the area by [65] show up as non-conducting, although studies have shown that serpentinisation by saline fluids produces serpentinites that contain substantial amounts of salts, e.g., ref. [22] Commonly, the measured conductivity of serpentinised, subducting slabs is also often low. Ref. [48] made observations of structurally bound chlorine, separated from sodium. Hence, the observation of reduced conductance by [65] might be due to the loss of mobile ions.

4.5. Observations from the Canadian Shield

Incidentally, the region where fluid samples from mines were analysed by [33] has also been subject to deep geophysical investigations. The 3D MT conductivity models established by [66] of the Archean Superior Province in Canada reveal the presence of high-conductivity zones in the –mid-lower crust. These were interpreted to reflect a protracted history of magmatic-hydrothermal activity contemporaneous with the construction and collapse of the crust. Sub-vertical zones of high conductivity in the –mid-upper crust represent corridors of paleo-fluid flow along crustal-scale structural networks and faults developed in response to terrane amalgamations. The subsequent orogenic collapse resulted in widespread lateral flow within the lower crust accommodated by sub-horizontal shear zones and included magmatic refertilisation. Figure 10 shows conductivity measurements in the Malartic region of the Abitibi sub-province in Eastern Canada.

4.6. Commonalities of Geophysical Observations in Deep Crust and Mantle

Using different geophysical methods in different tectonic settings, a set of common observations emerge:
  • Similar conductive patterns caused by saline fluids emerge in regions with ongoing subduction, and within old cratons where melting can be excluded as the cause.
  • Saline fluids are observed during ascent from subducting slabs, through the mantle wedge, towards a trench parallel zone ca. 30 km from the volcanic arc, in the direction of the subduction trench.
  • Saline fluids seem to remain in the mantle and lower crust, although some fluids may invade the upper crust via deep faults and weakness zones.
  • Trench parallel zones of conductivity, showing anomalous seismic velocities, ductile-brittle behaviour, and seismicity, are located at ca. 20 km depth and below, indicating certain mineralogical and mechanical properties of this zone caused by fluids.
  • In conclusion, the observations presented in chapter 4 provide evidence for the presence of saline fluids extending both shallow and deep environments under most continents and regions that have been subject to subduction.
  • Continental rifting in the vicinity of subduction zones, therefore, has the capacity to release vast amounts of salts.

5. Discussion

The salts dissolved in seawater today ended up there because water on the Earth dissolved them from the early crust and mantle via water–rock interaction. There is nothing to indicate an end to this process. As long as water is contacting the mantle and old cratonic crust, there is still a possibility for more salts to be leached out. During this process, there is also the possibility for ion-exchange between fluids and rocks, slightly altering the composition of the fluids.
The most common process where water approaches the mantle is subduction. This water is bound to be seawater because the subducting slabs are always made up of the oceanic crust and eventually some sediments. The oceanic crust can only be created and exist in the deep ocean and, therefore, must bring with it seawater components in pores and fractures during subduction. A large part of the subducted water is transported in the form of hydroxylated minerals. This would increase the salinity of the slab, relative to the initial salinity of the incorporated seawater. Some of this seawater is able to make it back to the continental crust and even higher. This has been proven to be directly observable in deep wells and mines. In addition, it has proven possible to indirectly observe saline fluids using geophysical means, bearing in mind that other mineralogical phenomena might also produce conductance anomalies similar to those created by saline fluids.
Observations of different phenomena and substances in salts and crustal brines that are inconsistent with solar evaporation do not exclude that this might still be an important process. However, a large number of observations deviate from what is to be expected. To explain these, ad hoc theories have to be introduced within the present evaporite paradigm. Processes occurring after the deposition of salts might explain some phenomena, but many of them cannot be explained in this way. Occam‘s Razor, therefore, calls for a new theory to explain observations of both dense brines and major solid salt deposits that seem to be related to deeper, mantle-related processes. Explaining these processes and presenting thermodynamics and observations supporting a new model/explanation should be the main objective of future work in this area.

6. Conclusions

Over the past twenty years, many works have been published that have expressed doubts about several aspects of the current paradigm for salt formation via solar evaporation of seawater. The work presented here is a review of peer-reviewed published literature where several issues are documented that are NOT compatible with the current paradigm for the formation of salt giants via solar evaporation alone. This also includes observations of minerals that have been formed together with the salt by the same processes, such as sulphates, carbonates, borates, and silicates. Another important observation is that the large salt deposits do not contain marine fossils but instead traces of terrestrial plants (e.g., pollen). This observation alone significantly weakens any claims that major salt deposits were formed via direct evaporation of seawater.
Observations indicate a clear connection between salt accumulations, high heat flow, tectonics, and magmatic and hydrothermal activities. The latter is confirmed by the content of hydrothermally associated minerals in salt deposits (talc, penninite, congolite, borasite, etc.), which suggests that the salt formation includes processes at elevated temperatures, well above temperatures caused by solar energy alone. These observations do not exclude that heat from the sun may be involved in the evaporation of salt water from hydrothermal sources, e.g., the evaporation of the hydrothermal brine that flows out on the Salar de Uyuni in Bolivia.
The documentation of salinity within the deep crust and mantle associated with subduction zones has received too little attention from the geological community, even though it is associated with large salt accumulations. Subduction of oceanic crust is a key concept for the transport of marine salt down into the mantle. Such processes go on for tens of millions of years and involve thousands of kilometres of salty oceanic crust that are brought down into the mantle.
Although salt deposits do not share the exact composition of seawater, the similarity between seawater and deep-seated brines in the crust indicates that the ocean is somehow involved in the formation of these brines and salt deposits. The release of previously subducted and accumulated seawater following mantle upwelling might provide an explanation for this similarity.
Different gases that are clearly related to the mantle, very rare in seawater, are found in salt deposits, including mantle minerals themselves. This further strengthens a link between salt deposits and the mantle
A seemingly universal and significant uplift due to mantle upwelling before continental rifting has been documented. Salt deposition during mantle exhumation occurred in Gabon salt deposits. In the East African Rift, the initiation of salt deposition seems to occur when the terrain is elevated above sea level. This seriously questions solar evaporation of massive amounts of seawater as the sole salt-forming process.
The current salt forming theory in combination with isostatic considerations dictates that thick layers of salt can only be produced in basins that were deep prior to salt deposition.
By conducting this review, we were aiming to integrate facts regarding the entire process of salt formation, including the confusing isostatic results that arise when applying the evaporite theory. This includes endogenous processes, where hydrothermal brines rise to the surface, causing the original surface to sink without additional stress being placed on the mantle. It is suggested that a new approach must be taken to explain all the inconsistencies and ambiguities concerning the processes that are taking place in typical salt basins. We have started this process by presenting observations that are incompatible with the current salt formation paradigm. True science, therefore, requires the development of a new model for the formation of large salt accumulations, in which all processes are included and are compatible with the new paradigm.

Author Contributions

All authors have worked on the manuscript and provided input and editing. All authors have read and agreed to the published version of the manuscript.

Funding

This research received no external funding.

Data Availability Statement

Data are contained within the article.

Conflicts of Interest

The authors declare no conflicts of interest.

References

  1. Popper, K. Logik der Forschung; Verlag von Julius Springer: Vienna, Austria, 1934. [Google Scholar]
  2. Hsü, K.J.; Cita, M.B.; Ryan, W.B.F. The origin of the Mediterranean evaporite. Initial Reports of the Deep Sea Drilling Project. Gov. Print. Off. 1973, 42, 1203–1232. [Google Scholar]
  3. Roveri, M.; Flecker, R.; Krijgsman, W.; Lofi, J.; Lugli, S.; Manzi, V.; Sierro, F.J.; Bertini, A.; Camerlenghi, A.; De Lange, G.; et al. The Messinian Salinity Crisis: Past and future of a great challenge for marine sciences. Mar. Geol. 2014, 352, 25–58. [Google Scholar] [CrossRef]
  4. Spatola, D.; del Moral-Erencia, J.D.; Micallef, A.; Camerlenghi, A.; Garcia-Castellanos, D.; Gupta, S.; Bohorquez, P.; Gutscher, M.-A.; Bertoni, C. A single-stage megaflood at the termination of the Messinian salinity crisis: Geophysical and modelling evidence from the eastern Mediterranean Basin. Mar. Geol. 2020, 430, 106337. [Google Scholar] [CrossRef]
  5. Lugli, S.; Manzi, V.; Roveri, M.; Schreiber, C.B. The deep record of the Messinian salinity crisis: Evidence of a non-desiccated Mediterranean Sea. Palaeogeogr. Palaeoclimatol. Palaeoecol. 2015, 433, 210–218. [Google Scholar] [CrossRef]
  6. Maillard, A.; Gaullier, V.; Lézin, C.; Chanier, F.; Odonne, F.; Lofi, J. New onshore/offshore evidence of the Messinian Erosion Surface from key areas: The Ibiza-Balearic Promontory and the Orosei-Eastern Sardinian margin. BSGF—Earth Sci. Bull. 2020, 191, 9. [Google Scholar] [CrossRef]
  7. Andreetto, F.; Matsubara, K.; Beets, C.J.; Fortuin, A.R.; Flecker, R.; Krijgsman, W. High Mediterranean water-level during the Lago-Mare phase of the Messinian Salinity Crisis: Insights from the Sr isotope records of Spanish marginal basins (SE Spain). Palaeogeogr. Palaeoclimatol. Palaeoecol. 2021, 562, 110139. [Google Scholar] [CrossRef]
  8. Bulian, F.; Jiménez-Espejo, F.J.; Andersen, N.; Larrasoaña, J.C.; Sierro, F.J. Mediterranean water in the Atlantic Iberian margin reveals early isolation events during the Messinian Salinity Crisis. Glob. Planet. Chang. 2023, 231, 104297. [Google Scholar] [CrossRef]
  9. Meilijson, A.; Steinberg, J.; Hilgen, F.; Bialik, O.M.; Waldmann, N.D.; Makovsky, Y. Deep-basin evidence resolves a 50-year-old debate and demonstrates synchronous onset of Messinian evaporite deposition in a non-desiccated Mediterranean. Geology 2018, 46, 243–246. [Google Scholar] [CrossRef]
  10. Machado, G. Salt Biostratigraphy in Oil and Gas Exploration: An Untapped Source of Data? Available online: https://archives.datapages.com/data/geo-expro-magazine/017/017001/pdfs/62.htm (accessed on 17 March 2020).
  11. Braitsch, O. Salt Deposits Their Origin and Composition; Springer: New York, NY, USA, 1971; ISBN 3-540-05206-2. [Google Scholar]
  12. Bauer, S.J.; Gardner, W.P.; Lee, H. Noble Gas Release from Bedded Rock Salt during Deformation. Geofluids 2019, 2019, 2871840. [Google Scholar] [CrossRef]
  13. Carreño-Márquez, I.J.A.; Castillo-Sandoval, I.; Pérez-Cázares, B.E.; Fuentes-Cobas, L.E.; Esparza Ponce, H.E.; Menéndez-Méndez, E.; Fuentes-Montero, M.E.; Montero-Cabrera, M.E. Evolution of the Astonishing Naica Giant Crystals in Chihuahua, Mexico. Minerals 2021, 11, 292. [Google Scholar] [CrossRef]
  14. Costanzo, A.; Cipriani, M.; Feely, M.; Cianflone, G.; Dominici, R. Messinian twinned selenite from the Catanzaro Trough, Calabria, Southern Italy: Field, petrographic and fluid inclusion perspectives. Carbonates Evaporites 2019, 34, 743–756. [Google Scholar] [CrossRef]
  15. Natalicchio, M.; Pellegrino, L.; Clari, P.; Pastero, L.; Dela Pierre, F. Gypsum lithofacies and stratigraphic architecture of a Messinian marginal basin (Piedmont Basin, NW Italy). Sediment. Geol. 2021, 425, 106009. [Google Scholar] [CrossRef]
  16. Aloisi, G.; Guibourdenche, L.; Natalicchio, M.; Caruso, A.; Haffert, L.; El Kilany, A.; Dela Pierre, F. The geochemical riddle of “low-salinity gypsum” deposits. Geochim. Cosmochim. Acta 2022, 327, 247–275. [Google Scholar] [CrossRef]
  17. Hovland, M.; Rueslåtten, H.G.; Johnsen, H.K.; Kvamme, B.; Kuznetsova, T. Salt formation associated with sub-surface boiling and supercritical water. Mar. Pet. Geol. 2006, 23, 855–869. [Google Scholar] [CrossRef]
  18. Tobola, T. Inclusions in anhydrite crystals from blue halite veins in the Klodawa Salt Dome (Zechstein, Poland). Geol. Q. 2016, 60–63, 572–585. [Google Scholar] [CrossRef]
  19. Tobola, T.; Wachowiak, J. Evidence of high-temperature rock salt transformations in areas of occurrence of borate minerals (Zechstein, Klodawa salt dome, Poland). Geol. Q. 2018, 62, 134–145. [Google Scholar] [CrossRef]
  20. Albright, J.L.; Lueth, V.W. Pecos diamonds–quartz and dolomite crystals from the Seven Rivers Formation outcrops of southeastern New Mexico. N. M. Geol. 2003, 25, 63–74. [Google Scholar] [CrossRef]
  21. Debure, M.; Lassin, A.; Marty, N.C.; Claret, F.; Virgone, A.; Calassou, S.; Gaucher, E.C. Thermodynamic evidence of giant salt deposit formation by serpentinization: An alternative mechanism to solar evaporation. Nat. Sci. Rep. 2019, 9, 11720. [Google Scholar] [CrossRef] [PubMed]
  22. Scribano, V.; Carbone, S.; Manuella, F.C.; Hovland, M.; Rueslåtten, H.; Johnsen, H.K. Origin of salt giants in abyssal serpentinite systems. Int. J. Earth Sci. (Geol. Rundsch.) 2017, 106, 2595–2608. [Google Scholar] [CrossRef]
  23. Mart, Y.; Ross, D.A. Post-Miocene rifting and diapirism in the northern Red Sea. Mar. Geol. 1987, 74, 173–190. [Google Scholar] [CrossRef]
  24. Augustin, N.; van der Zwan, F.M.; Devey, C.W.; Brandsdóttir, B. 13 million years of seafloor spreading throughout the Red Sea Basin. Nat. Commun. 2021, 12, 2427. [Google Scholar] [CrossRef] [PubMed]
  25. Ligi, M.; Bonatti, E.; Bosworth, W.; Ronca, S. Oceanization Starts at Depth During Continental Rupturing in the Northern Red Sea. In Geological Setting, Palaeoenvironment and Archaeology of the Red Sea; Rasul, N.M.A., Stewart, I.C.F., Eds.; Springer Nature: Cham, Switzerland, 2019; ISBN 978-3-319-99407-9. [Google Scholar]
  26. Ali, M.; Koyi, H.; Bosworth, W.; Ligi, M.; Ball, P.J.; Decarlis, A. Geometry and kinematics of the Middle to Late Miocene salt tectonics, central Egyptian Red Sea margin. J. Struct. Geol. 2023, 176, 104955. [Google Scholar] [CrossRef]
  27. Van den Belt, F.J.G.; De Boer, P.L. A shallow-basin model for ‘saline giants’ based on isostasy-driven subsidence. Spec. Publ. Int. Assoc. Sedimentol. 2007, 38, 241–252. [Google Scholar]
  28. Heida, H.; Raad, F.; Garcia-Castellanos, D.; Jiménez- Munt, I.; Maillard, A.; Lofi, J. Flexural-isostatic reconstruction of the Western Mediterranean during the Messinian Salinity Crisis: Implications for water level and basin connectivity. Basin Res. 2022, 34, 50–80. [Google Scholar] [CrossRef]
  29. Rowan, M.G. The South atlantic and Gulf of Mexico salt basims: Crustal thinning, subsidence and accomodation for salts and presalt strata. Geol. Soc. Lond. Spec. Publ. 2018, 476, 333–363. [Google Scholar] [CrossRef]
  30. Epin, M.-A.; Manatschal, G.; Sapin, F.; Rowan, M.G. The tectono-magmatic and subsidence evolution during lithospheric breakup in a salt-rich rifted margin: Insights from a 3D seismic survey from southern Gabon. Mar. Pet. Geol. 2021, 128, 105005. [Google Scholar] [CrossRef]
  31. Esedo, R.; Van Wijk, J.; Coblentz, D.; Meyer, R. Uplift prior to continental breakup: Indication for removal of mantle lithosphere? Geosphere 2012, 8, 1078–1085. [Google Scholar] [CrossRef]
  32. Ginzburg, A.I.; Kostianoy, A.G.; Sheremet, N.A. On the Dynamics of Waters in Kara-Bogaz-Gol (Satellite Information). Cosmic Res. 2022, 60 (Suppl. S1), S27–S37. [Google Scholar] [CrossRef]
  33. Bottomley, D.J.; Clark, I.D.; Battye, N.; Kotzer, T. Geochemical and isotopic evidence for a genetic link between Canadian Shield brines, dolomitization in the Western Canada Sedimentary Basin, and Devonian calcium-chloridic seawater. Can. J. Earth Sci. 2005, 42, 2059–2071. [Google Scholar] [CrossRef]
  34. Stotler, R.L.; Frape, S.K.; Ruskeeniemi, T.; Pitkanen, P.; Blowes, D.W. The interglacial–glacial cycle and geochemical evolution of Canadian and Fennoscandian Shield groundwaters. Geochim. Cosmochim. Acta 2012, 76, 45–67. [Google Scholar] [CrossRef]
  35. Stober, I.; Bucher, K. Origin of salinity of deep groundwater in crystalline rocks. Terra Nova 1999, 11, 181–185. [Google Scholar] [CrossRef]
  36. Svensen, H.; Jamtveit, B.; Banks, D.A.; Austrheim, H. Halogen contents of eclogite facies fluid inclusions and minerals: Caledonides, western Norway. J. Metamorphic Geol. 2001, 19, 165–178. [Google Scholar] [CrossRef]
  37. Glassley, W.E. Elemental composition of concentrated brines in subduction zones and the deep continental crust. Precambrian Res. 2001, 105, 371–383. [Google Scholar] [CrossRef]
  38. Emmermann, R.; Lauterjung, J. The German Continental Deep Drilling Program KTB: Overview and major results. J. Geophys. Res. 1997, 102, 18179–18201. [Google Scholar] [CrossRef]
  39. Kozlovsky, Y.A. The Superdeep Well of the Kola Peninsula; Springer: New York, NY, USA, 1987; ISBN 0-387-16416-2. [Google Scholar]
  40. NurmiIlmo, P.A.; Kukkonen Pertti, T.; Lahermo, W. Geochemistry and origin of saline groundwaters in the Fennoscandian Shield. Appl. Geochem. 1988, 3, 185–203. [Google Scholar]
  41. Kietäväinen, R. Deep Groundwater Evolution at Outokumpu, Eastern Finland: From Meteoric Water to Saline Gas-Rich Fluid. Ph.D. Thesis, University of Helsinki, Helsinki, Finland, 2017. [Google Scholar]
  42. Scambelluri, M.; Piccardo, G.B.; Philippot, P.; Robbiano, A.; Negretti, L. High salinity fluid inclusions formed from recycled seawater in deeply subducted alpine serpentinite. Earth Planet. Sci. Lett. 1997, 148, 485–499. [Google Scholar] [CrossRef]
  43. Mukherjee, B.K.; Sachan, H.K. Fluids in coesite-bearing rocks of the Tso Morari Complex, NW Himalaya: Evidence for entrapment during peak metamorphism and subsequent uplift. Geol. Mag. 2009, 146, 876–889. [Google Scholar] [CrossRef]
  44. Harlaux, M.; Mercadier, J.; Bonzi, W.M.-E.; Kremer, V.; Marignac, C.; Cuney, M. Geochemical Signature of Magmatic-Hydrothermal Fluids Exsolved from the Beauvoir Rare-Metal Granite (Massif Central, France): Insights from LA-ICPMS Analysis of Primary Fluid Inclusions. Geofluids 2017, 2017, 1925817. [Google Scholar] [CrossRef]
  45. Touret, J. Fluid regime during the formation of continental crust. Acad. Lett. 2021, 2, 655. [Google Scholar] [CrossRef]
  46. Zedgenizov, D.A.; Ragozin, A.L.; Shatsky, V.S. Chloride–Carbonate Fluid in Diamonds from the Eclogite Xenolith. Doklady Akademii Nauk 2007, 415–416, 800–803. [Google Scholar] [CrossRef]
  47. Wannamaker, P.E.; Evans, R.L.; Bedrosian, P.A.; Unsworth, M.J.; Maris, V.; McGary, R.S. Segmentation of plate coupling, fate of subduction fluids, and modes of arc magmatism in Cascadia, inferred from magnetotelluric resistivity. Geochem. Geophys. Geosyst. 2014, 15, 4230–4253. [Google Scholar] [CrossRef]
  48. Huang, R.; Ding, X.; Lin, C.-T.; Zhan, W.; Ling, M. Effect of saline fluids on chlorine incorporation in serpentine. Solid Earth Sci. 2018, 3, 61–66. [Google Scholar] [CrossRef]
  49. McGary, R.S.; Evans, R.L.; Wanamaker, P.E.; Elsenbeck, J.; Rodenay, S. Pathway from subducting slab to surface for melt and fluids beneath Mount Rainier. Nat. Res. Lett. 2014, 511, 338–340. [Google Scholar] [CrossRef] [PubMed]
  50. McGary, R.S. The CAFE Experiment: A Joint Seismic and MT Investigation of the Cascadia Subduction System. Ph.D. Thesis, Massachusetts Institute of Technology, Cambridge, MA, USA, 2013. [Google Scholar]
  51. Kühn, C.; Küster, J.; Brasse, H. Three-dimensional inversion of magnetotelluric data from the Central Andean continental margin. Earth Planets Space 2014, 66, 112. [Google Scholar] [CrossRef]
  52. Bedrosian, P.A. MT+, Integrating Magnetotellurics to Determine Earth Structure, Physical State, and Processes. Surv. Geophys. 2007, 28, 121–167. [Google Scholar] [CrossRef]
  53. Brasse, H.; Lezaeta, P.; Rath, V.; Schwalenberg, K.; Soyer, W.; Haak, V. The Bolivian Altiplano conductivity anomaly. J. Geophys. Res. 2002, 107, 2096. [Google Scholar] [CrossRef]
  54. Schwalenberg, K.; Rath, V.; Haak, V. Sensitivity studies applied to a two-dimensional resistivity model from the Central Andes. Geophys. J. Int. 2002, 150, 673–686. [Google Scholar] [CrossRef]
  55. Schilling, F.R.; Trumbull, R.B.; Brasse, H.; Haberland, C.; Asch, G.; Bruhn, D.; Mai, K.; Haak, V.; Giese, P.; Muoz, M.; et al. Chapter 22—Partial melting in the Central Andean crust: A review of geophysical, petrophysical, and petrologic evidence. In The Andes: Active Subduction Orogeny, Frontiers in Earth Sciences; Oncken, O., Chong, G., Franz, G., Giese, P., GÃutze, H.J., Ramos, V.A., Strecker, M.R., Wigger, P., Eds.; Springer: Berlin/Heidelberg, Germany, 2006; pp. 459–474. ISBN 978-3-540-48684-8. [Google Scholar]
  56. Araya Vargas, J.; Meqbel, N.; Ritter, O.; Brasse, H.; Weckmann, U.; Yáñez, G.; Godoy, B. Fluid Distribution in the Central Andes Subduction Zone Imaged with Magnetotellurics. J. Geophys. Res. 2019, 124, 4017–4034. [Google Scholar] [CrossRef]
  57. Samrock, F.; Grayver, A.V.; Bachmann, O.; Karakas, Ö.; Saar, M.O. Integrated magnetotelluric and petrological analysis of felsic magma reservoirs: Insights from Ethiopian rift volcanoes. Earth Planet. Sci. Lett. 2021, 559, 116765. [Google Scholar] [CrossRef]
  58. Kawamoto, T.; Kanzakib, M.; Mibec, K.; Matsukage, K.N.; Ono, S. Separation of supercritical slab-fluids to form aqueous fluid and melt components in subduction zone magmatism. Proc. Natl. Acad. Sci. USA 2012, 109, 18695–18700. [Google Scholar] [CrossRef]
  59. Laumonier, M.; Gaillard, F.; Muir, D.; Blundy, J.; Unsworth, M. Giant magmatic water reservoirs at mid-crustal depth inferred from electrical conductivity and the growth of the continental crust. Earth Planet. Sci. Lett. 2017, 457, 173–180. [Google Scholar] [CrossRef]
  60. Comeau, M.J.; Unsworth, M.J.; Ticona, F.; Sunagua, M. Magnetotelluric images of magma distribution beneath Volcán Uturuncu, Bolivia: Implications for magma dynamics. Geology 2015, 43, 243–246. [Google Scholar] [CrossRef]
  61. Weis, P. The dynamic interplay between saline fluid flow and rock permeability in magmatic-hydrothermal systems. Geofluids 2015, 15, 350–371. [Google Scholar] [CrossRef]
  62. Wei, W.-B.; Jin, S.; Ye, G.-F.; Deng, M.; Tan, H.-D.; Unsworth, M.; Jones, A.G.; Booker, J.; Li, S. Coductivity Structure of Crust and upper Mantle beneath the Northern Tibetan Platau: Results of Super-Wide Band Magnetotelluric Sounding. Chin. J. Geophys. 2006, 49, 1098–1110. [Google Scholar]
  63. Zhang, L.; Wei, W.-B.; Jin, S.; Ye, G.; Dong, H.; Zhang, F.; Xie, C.; Wang, H. Structure of the Eastern Margin of the Tibetan Plateau from Magnetotelluric Studies. In Proceedings of the Near Surface Geophysics Asia Pacific Conference, Beijing, China, 17–19 July 2013. [Google Scholar] [CrossRef]
  64. Li, X.; Ma, X.; Chen, Y.; Xue, S.; Varentsov, I.M.; Bai, D. A plume-modified lithospheric barrier to the southeastward flow of partially molten Tibetan crust inferred from magnetotelluric data. Earth Planet. Sci. Lett. 2020, 548, 116493. [Google Scholar] [CrossRef]
  65. Xu, Y.; Yang, B.; Zhang, S.; Liu, Y.; Zhu, L.; Huang, R.; Chen, C.; Li, Y.; Luo, Y. Magnetotelluric imaging of a fossil paleozoic intraoceanic subduction zone in western Junggar, NW China. J. Geophys. Res. Solid Earth 2016, 121, 4103–4117. [Google Scholar] [CrossRef]
  66. Hill, G.J.; Roots, E.A.; Frieman, B.M.; Haugaard, R.; Craven, J.A.; Smith, R.S.; Snyder, D.B.; Zhou, X.; Sherlock, R. On Archean craton growth and stabilisation: Insights from lithospheric resistivity structure of the Superior Province. Earth Planet. Sci. Lett. 2021, 562, 116853. [Google Scholar] [CrossRef]
Figure 1. Seismic section from the Red Sea, west of Brothers Island, showing diapiric structures and bedded salt formed independently of tectonic movements or sediment loading (modified from [25]. Encircled area shows a diapiric structure below the point of higher sediment loading, inconsistent with the formation of diapiric salt structures due to sediment loading. The interpreted features (faults, etc.) are all by [25] They might indicate pathways for precipitating brines.
Minerals 14 00527 g001
Figure 2. Conductive zones around the Cascadia subduction zone near Mount Rainier. Warm colours indicate high conductivity. Conductive fluids and melts are seen rising from above the cold, non-conducting, subducting, slab. Observed earthquakes around 20 km depth are indicated by black circles. Modified from [50].
Minerals 14 00527 g002
Figure 3. Seismic image from the Cascadia region. Horizontal distance from the US east coast is shown. Blue colours represent fast propagating seismic waves and red colours represent slower propagating waves. Earthquake regions are indicated with black circles. A zone of lower seismic velocity is observed above the zone where the earthquakes are located. Mount Rainier volcano is indicated with a red triangle. Modified from [50].
Minerals 14 00527 g003
Figure 4. Magneto-telluric (MT) networks in the Altiplano, Lake Uyuni area (modified from [53]). The red rectangle shows the location of Figure 5.
Minerals 14 00527 g004
Figure 5. Measured electric conductivity below the Altiplano along the ANCORP network. Warm colours indicate zones of high electric conductivity (low resistivity). Seismic activity is indicated by black dots (Earthquakes). White, dotted lines indicate the zone of diverging seismic velocity (ALVZ) (modified from [53]).
Minerals 14 00527 g005
Figure 6. (a) Section of Lake Uyuni, Bolivia, showing numerous pockmark-like, saline springs on the surface. Central pockmark is located at 20°17′40.78″ S, 67°38′09.28″ W. (b) Enlarged view of the central pockmark. Yellow line is 180 metres long. Images obtained from Google Earth 2024.
Minerals 14 00527 g006
Figure 7. Image from the Uturuncu volcano in Bolivia (22°17′24.27″ S, 64°04′39.10″ W) above the APMB (Altiplano-Puna Magma Body). Salt lakes are observed to the east and south of the volcanic centre. Pockmarks, indicating fluid flow from below, are observed in the image (upper right corner). Yellow line represents 10 km (Image obtained from Google Earth 2024).
Minerals 14 00527 g007
Figure 8. Simulation of the saline fluid system around a volcanic magma chamber after 30,000 years. Saline fluids (green arrows) are directed laterally by precipitating solids in the flow path due to mixing with colder meteoric water (blue arrows) from above. Modified from [61].
Minerals 14 00527 g008
Figure 9. MT image of the fossil subduction zone (Neoproterozoic to the end of the Paleozoic) in western Junggar, China. Numbers indicate distance in km on both axes. Solute-rich fluids are observed at ca. 20 km depth around deep fault zones (red). Regions with confirmed serpentinisation at/near the surface have low conductivity (blue). Modified from [65] Text in the figure has been enlarged for clarity.
Minerals 14 00527 g009
Figure 10. Conductivity measurements in ca. 2.7 Ga old craton in the Superior Province of Eastern Canada. The depicted section is located in the Malartic region of the Abitibi sub-province. Deep crustal conductivity is observed in zones below 20 km depth. Sub-vertical, conductive zones extend all the way to the surface, along major fault zones. LCC: lower crustal conductive zone. VC4, VC5, and VC6 indicate sub-vertical conductive zones. Modified from [66]. Ref. [66] conclude that the preserved high-conductivity anomalies in the mid-lower crust represent an amalgamation of magmatic-hydrothermal and deformational processes that occurred during construction, peak orogenesis, and collapse in the Archean. Conductive zones, extending all the way to the surface, are very likely caused by brines like those sampled by [33] from the Canadian Shield.
Minerals 14 00527 g010
Disclaimer/Publisher’s Note: The statements, opinions and data contained in all publications are solely those of the individual author(s) and contributor(s) and not of MDPI and/or the editor(s). MDPI and/or the editor(s) disclaim responsibility for any injury to people or property resulting from any ideas, methods, instructions or products referred to in the content.