Abstract
Fluid inclusions in stalagmites are becoming increasingly important for paleoclimate research. Within this framework, noble gas thermometry, based on noble gases dissolved in water from fluid inclusions, provides quantitative estimations of cave air paleotemperature. Two major issues of Noble Gas Temperature (NGT) determination on speleothems are (1) the potential lack of enough water for the analysis and (2) the presence of trapped gas not dissolved in water that can be released during the analysis from biphasic or all-gas fluid inclusions, as its contribution to the bulk noble gas signal can hinder NGT results. Although the step-crushing method helps to reduce the second issue, it also decreases the amount of water available for the calculations. In order to obtain reliable NGT results with low uncertainties, a major challenge is still to reach a balance between sufficient water for analysis and a small amount of “atmospheric” gas. The difficulty is that the extraction process cannot be standardized since it strongly depends on the type of sample. The objective of this work is to investigate how the characteristics of the speleothem can determine the adequacy of the extraction process. For this purpose, we consider a stalagmite from a Mediterranean cave that consists of columnar elongated calcite and contains a significant quantity of fluid inclusions, which suggests good potential for NGT analysis. Results, however, were poorly satisfactory. Trying to understand the source of the problems, an integrated study of petrography and petrophysical features was performed. The samples were found to be different depending on the stage of coalescence of crystals and thus separated into “open” and “closed” fabrics. Classic petrographic analysis and non-destructive (nuclear magnetic resonance) techniques were used to characterize the type and amount of fluid inclusions present in both types of fabrics. The study indicates that the closed fabric (total coalescence of calcite crystals) has most water trapped in water-filled, small intracrystalline fluid inclusions that usually contain very little gas. This fabric is very suitable for NGT determination, but since the amount of water is quite small, the sample should be crushed in only one step with a large number of beats to break all the inclusions. In contrast, samples with open fabric (partial coalescence of calcite crystals) contain a higher amount of water and, also, gas-filled large intercrystalline fluid inclusions. For this fabric, step-crushing of the sample is necessary. However, the low amount of water left for the second and third crushings could lead to flawed NGT results. Thus, we suggest modifying the method to get rid of part of the gas in the first crushing while leaving enough water for the following steps. This work shows the importance of characterizing speleothems and fluid inclusions, including their petrography and petrophysical characteristics, before starting NGT analysis, allowing the selection of the most favorable samples and the customization of the step-crushing procedure.
1. Introduction
The geochemical characterization of fluid inclusions in speleothems is a rapidly rising research field because of its usefulness for paleo-climate reconstruction. Within that field, Noble Gas Temperature (NGT) reconstruction is a developing technique that can be capable of providing reasonable results in the determination of absolute paleotemperatures [1,2,3,4,5,6,7]. The NGT method is based on the strong temperature dependence of the noble gas solubility in water. Because fluid inclusions are expected to contain the original water dripping from the cave ceiling and because the noble gas concentrations in that water can be assumed to correspond closely to air-equilibrated water concentrations, the noble gas composition of trapped water can be used to quantitatively calculate the cave air temperature at the time of entrapment. It is possible to use the noble gas data to reconstruct past surface temperatures, as the cave air temperature in many cases approximately corresponds to the local annual mean temperature outside the cave.
The measurement of noble gases dissolved in the water of the fluid inclusions is not a straightforward task. Fluid inclusions trapped in the speleothem calcite may contain water (water-filled monophasic fluid inclusions), cave air (gas-filled monophasic fluid inclusions), or both (biphasic gas inclusions). The proportion of fluid inclusions in a stalagmite, as well as the volumetric ratio of air to water (A ratio) within them, can strongly differ from stalagmite to stalagmite and also within a single stalagmite [1]. The reason is that the number, shape, and type of inclusions depend strongly on the processes controlling speleothem growth. These processes and their controlling parameters (drip rates, dripping patterns, supersaturation, etc.) determine the characteristics and arrangement of calcite crystals within the stalagmite, i.e., the speleothem fabric. There are three main requirements for NGT studies: (1) the analysis of only primary fluid inclusions that contain an aliquot of the seepage water that covered the surface of the stalagmite during its growth; (2) the extraction of water amounts that are large enough to derive reliable paleotemperature results; and (3) the absence of fluid inclusions containing air. In order to select suitable samples and preparation methods, the precise understanding of the fabric-fluid inclusion relationship appears as an important task in NGT determination and in all geochemical research that applies crushing methodology, for example, in stable isotope analysis of fluid inclusions [8,9].
Several analytical procedures have been proposed for noble gas measurement in fluid-inclusion water. Kluge [10] discussed a series of extraction and separation techniques for water and noble gases for speleothems with different amounts of gas-filled and water-filled fluid inclusions. Unfractionated atmospheric air trapped in gas-filled fluid inclusions is considered the origin of this component, referred to as “excess air” in groundwater literature [11]. Since the noble gas composition of the gas-filled fluid inclusions differs from that of the air-equilibrated water (water-filled fluid inclusions), its imprint needs to be eliminated during the analytical process to calculate precise NGTs. To address this issue, Kluge [10] proposed a combination of a stepwise procedure (step-crushing and step-heating), which progressively reduced the abundance of gas-filled fluid inclusions and enabled the calculation of temperatures with low uncertainties. Scheidegger et al. [12] proposed an alternative extraction procedure to minimize the effect of gas-filled inclusions, which consisted of pre-crushing and sieving the calcite sample to a convenient size (“optimal grain size” defined by the authors [12], which can be different depending on the sample) before noble gas measurements. Vogel et al. [5] presented a combined vacuum crushing and sieving (CVCS) method to reduce the contribution of noble gases from gas-filled fluid inclusions. According to the authors, the key point of the CVCS system is to pre-crush the samples to defined grain sizes, which were determined in a previous petrographic study.
Those approaches yielded positive results for different stalagmites [1,5,6,7,10,12]. However, the number of successful projects is relatively small considering the scientific effort invested and the potential of the NGT technique. Two aspects that could undoubtedly contribute to the advancement of this frontier research are: (1) a better knowledge of the speleothems more suitable for NGT analysis; and (2) the optimization of extraction techniques for the different types of speleothem fabrics. For both, the characterization of the stalagmite fabrics and fluid inclusions by means of petrographic [12,13] and petrophysical studies can provide essential information.
This paper evaluates the suitability of a stalagmite retrieved in Cueva del Tortero (Tous, Valencia) for step-crushing-based NGT analysis, studying its petrography as well as its petrophysical features by means of non-destructive techniques, and analyzing noble gases from selected samples covering its petrological variability. In this sense, we evaluate the step-crushing methodology, a procedure used for noble gas measurements, commenting on the advantages and disadvantages of the technique for the different types of speleothem fabrics and suggesting possible alternatives in the extraction methods to improve the quality of the final data. For speleothem characterization, which includes speleothem fabrics and fluid inclusions, a combination of petrographic microscope observations and nuclear magnetic resonance techniques has been accomplished. Additionally, we discuss the possible sources of the so-called “excess air” in the studied samples. The aim of the work is not to obtain precise paleotemperature results from the stalagmite but to investigate the dependence of the quality of the results on (1) the technical procedures and (2) the petrographic features of the speleothem, in particular its calcite fabrics and the distribution of water- and gas-filled inclusions. This paper can contribute to better understanding the reasons for the high uncertainty often associated with NGT research in speleothems.
2. Cave and Material
As part of a more extensive paleoclimate project, stalagmite Tortero-4 was retrieved from Tortero Cave, located in Tous (Valencia, Spain). The cave is a small (~90 m length) and relatively shallow (~25 m below the surface) cavity developed on Upper Cretaceous limestones (Sierra de Utiel Formation). The mean annual temperature in the cave is 17.2 ± 0.5 °C, and the relative humidity is almost 100% in the inner parts. The studied stalagmite was retrieved from the lower part of the cave, and it was broken at the time of sampling. The stalagmite is 610 mm long and has a quite constant diameter of approximately 140 mm (Figure 1). The stalagmite mostly consists of calcite and shows two main growth phases (sixth-order architectural elements or unconformity bounded units, in the sense of Martín-Chivelet et al. [14]) separated by an unconformity that is clearly visible as a white micrite layer (Figure 1). This surface corresponds to a non-deposition and condensation hiatus that bounds the main growth interval of the stalagmite (the main stalagmite, without the lateral part), and a later secondary growth phase that took place only on the lateral part of the stalagmite (Figure 1), probably controlled by the same dripping point. The lower unit, which grew continuously during part of the Eemian (120.6 ± 0.7 to 108.9 ± 0.8 Ka BP; unpublished data), is used in this research. The studied interval consists of an alternation of whitish laminated and brownish non-laminated calcite. Where lamination is visible, the rimmed, flat-topped, and globular shapes of the growth layers (according to Martín-Chivelet et al. [14]) define different fifth-order architectural elements, most of them with constant aggradational stacking patterns (Figure 1). Overall, the stalagmite is formed by large crystals that grew with their longest axes aligned parallel to the growth axis of the stalagmite, defining a pattern that could be described as columnar elongated fabric [15]. Apart from this fabric, only three minor micrite layers are observable in the upper part of the studied interval (green lines in Figure 1). Interconnected pores in the axial zone are common in the lower part of the stalagmite and were avoided for NGT measurements.
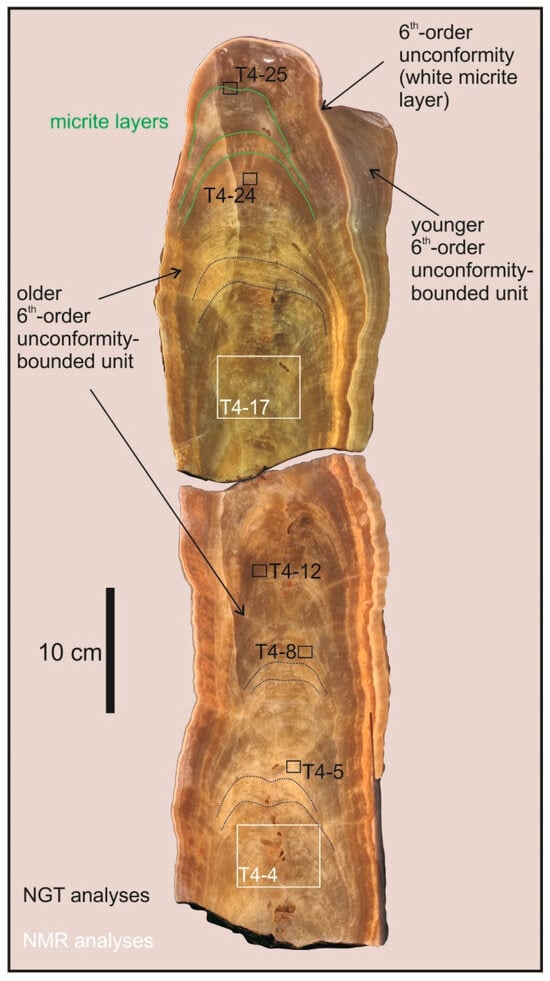
Figure 1.
Longitudinal section of the Tortero-4 stalagmite. The white squares indicate the samples chosen for NMR analyses. The black squares indicate the samples chosen for NGT measurements. Green lines indicate minor micrite layers. Dotted lines highlight the rimmed, top-shaped, and globular shapes of some growth layers that define a dominant aggradation pattern with minor intervals of progradational or retractional patterns [14]. Both 6th-order architectural units [14] are marked in the photo, separated by a white micrite layer.
3. Methods
3.1. Petrographic Analysis: Calcite Fabrics and Fluid Inclusions
Twenty-seven petrographic sections were prepared following specific procedures to ensure the preservation of fluid inclusions in their original state. The stalagmite was cut into twenty-seven (4.5 × 7.5 × 2.5 cm) slabs following the method proposed by Muñoz-García et al. [16] to avoid material loss. In order to minimize thermal and mechanical alteration of fluid inclusions [17], the slabs were pasted to 5 × 8 cm sample carriers with cyanoacrylate at a cold temperature (~10 °C). The petrographic sections were prepared at 350 µm of thickness with a single cut in a low-speed saw ISOMET1000. Grinding and polishing of the sections were also avoided, and instead, they were covered with lacquer, minimizing the risk of significant mechanical stress during the preparation [17]. It should be noted that conventional procedures for thin section preparation can lead to an unwanted alteration of the characteristics of fluid inclusions. For example, mechanical or thermal stresses can lead to changes in fluid inclusion volume and bubble nucleation.
The petrographic sections were studied with an optical microscope (Nikon Eclipse VL100N POL) with polarized transmitted light at the Complutense University of Madrid. Fabrics have been described, according to Frisia [15]. The origin of the fluid inclusions (primary or secondary) was determined according to Lopez-Elorza et al. [18], taking into account their position with respect to calcite crystals, external morphology, position along the stalagmite, and their relationship with fabrics.
3.2. Nuclear Magnetic Resonance (NMR): Relaxometry and Imaging (MRI)
Nuclear Magnetic Resonance (NMR) is a non-destructive technique that exposes the sample to a natural or artificial static magnetic field to measure the decay of the nuclear magnetization of water 1H. NMR is herein used for estimating the amount of water present in the speleothem and also for characterizing the size and distribution of water-filled inclusions in the sample slabs that were later analyzed for NGT.
The analyses were carried out in the Nuclear Magnetic Resonance and Electronic Spin Research Center of Complutense University. Observations were performed using a BIOSPEC BMT 47/40 spectrometer (Bruker, Germany), operated at 4.7 T. All measurements and the quasicontinuous relaxation time distribution curves have been acquired by Paravision© software Version 3.0.1.
The preparation of the samples and the interpretation of the results were done following the indications proposed by Muñoz-García et al. [19] for speleothem samples. Two speleothem slabs of a size of 4.5 × 7.5 × 2.5 cm were selected for NMR analysis. These, labeled respectively T4-4 and T4-17 (Figure 1), were considered representative of the stalagmite Tortero-4 (Figure 1). Prior to NMR analysis and in order to remove all the surface moisture, the two slabs were dried in a desiccator at room temperature and at atmospheric pressure until they reached a constant weight (4–5 days). Then, two measurements were done: (1) NMR relaxation analysis, and (2) 2D spin echo magnetic resonance image (MRI) acquisition.
NMR relaxation is the process by which an excited magnetic state returns to its equilibrium distribution. Therefore, 1H relaxometry allows observation of the size and distribution of water-filled fluid inclusions in the slab. The echo time was 5 ms, and the repetition time was 10,317.5 and 20,002.5 ms.
In speleothems, 2D magnetic resonance images (MRI) display high-intensity pixels (bright areas) related to water-filled fluid inclusions. Low-intensity pixels (black areas) are usually associated with calcite, or, much less commonly, they might correspond to gas-filled inclusions. Four images were obtained for each slab, each of which corresponded to a 5 mm thick layer or slice located at a specific depth within the slab. The volume of the slices is settled before the analysis, depending on the amount of water present in each sample. The resolution used for measurements was 312.5 µm × 312.5 µm (field-of-view, FOV = 10 cm × 5 cm; matrix = 256 × 128 pixels).
3.3. Noble Gas Measurements in Fluid Inclusions
Five slabs of stalagmite Tortero-4 were selected for NGT analysis (labeled T4-5, T4-8, T4-12, T4-24, and T4-25). Measurements of noble gases were performed at the Institute of Environmental Physics (Heidelberg University, Germany) using a specialized line of crushing under vacuum attached to a gas purification line (Prepline), which leads to a GV5400 noble gas mass spectrometer (Figure 2a). Measurements were carried out using the step-crushing technique as described in Kluge [10]. The crushing line is under high vacuum (10−7–10−8 mbar) and constantly heated at 70 °C to avoid water loss by adsorption onto the metal surfaces of the line. Each slab was crushed in a series of three subsequent crushings (1st, 2nd, and 3rd crushing steps) with a magnetic steel ball and heated (150 °C) in a stainless cylinder (33 cm length and 2.6 cm inner diameter). Released amounts of noble gases and water were measured for each crushing step. The number of hits was adjusted to reach a certain vapor pressure in the line, which is controlled by the H2O manometer (Figure 2b). The water vapor pressure provides information about the fluid inclusions opened during the crushing hits. The released water is frozen into a cold finger cooled by liquid nitrogen to prevent the condensation of noble gases. Once the cold finger is separated from the extraction line, closing a valve, the water trapped in it is warmed to room temperature, and the vapor is transferred to Vol. 1 and Vol. 2 (Figure 2a) for the determination of the water amount. Vol. 1 and Vol. 2 contain a compact capacitance pressure sensor for water amount determination. Meanwhile, the gases are transferred to the purification line (Prepline). Five background tests and five blank measurements were performed to correct for the background signal originating from the crushers and the preparation line. The background pressure in the line was 3.3 × 10⁻⁸ mbar. A blank was performed before analyzing each sample (speleothem slab).
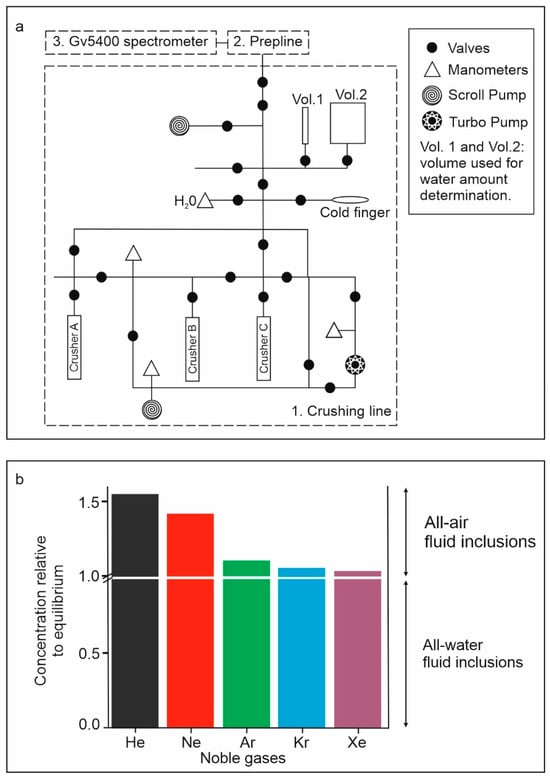
Figure 2.
(a) Schematic representation of the extraction line (adapted from Sander [20]). Three main parts are distinguished in the extraction line (each of them marked by dotted lines): the crushing line (1), Prepline: gas separation and purification (2), and the Gv5400 spectrometer (3). (b) Schematic representation of the Unfractionated Excess-Air Model (UA-model) for speleothems (adapted from Sander [20]).
In the Prepline noble gases are separated from each other in the cryogenic unit depending on the different absorption and desorption temperatures [21]. After noble gas separation, they are measured with a GV5400 mass spectrometer. The recorded signal of each noble gas is background-corrected and transformed to noble gas amounts via known calibration gases. Noble gas concentrations of Ne, He, Ar, Kr, and Xe (given in cm3 STP/g) were determined by dividing the gas amount by the measured water amount. The final temperature values (NGTs), which represent the equilibration temperature of water with cave air before fluid inclusions were closed, were subsequently obtained by fitting the unfractioned excess-air model (UA-model) to the measured noble gas concentrations [22]. The unfractioned excess-air model, proposed by Heaton and Vogel [11], explains the concept of “excess-air” in groundwater: those authors found that the concentrations of some dissolved gases in groundwater from some areas of South Africa were higher than the concentrations to be expected for atmospheric equilibrium. These unexpectedly high concentrations were attributed to atmospheric air bubbles trapped in water, which were completely dissolved, according to the authors. In the case of speleothems, the high concentrations of atmosphere-linked noble gases (excess air) can be related to gas-filled fluid inclusions, while the noble gases dissolved in water-filled fluid inclusions can be seen as the equilibrium component of noble gases dissolved in groundwater (Figure 2b). The air/water volume (A) is a model parameter used to evaluate the possible influence of noble gases from the cave air in the final results [1]. It was calculated for all step-crushing measurements when the noble gas and water content data were high enough.
The validity of the measurements was checked by analyzing air-equilibrated water (AEW, ideal samples with no atmospheric signal, noble gases) standards at known temperatures. Different samples of one microliter of AEW were taken from various water reservoirs (at 25, 20, and 15 °C) and introduced into small copper drill electrodes with a syringe following the method proposed by Sander [20].
Five samples were chosen for noble gas analysis along the Tortero-4 stalagmite (Figure 1). Each sample was split into two subsamples (named A and B) in order to perform duplicate measurements.
3.4. Calcite Powder Size Analysis by Laser Diffraction
The particle size of the calcite powder resulting from crushing was measured by laser diffraction in order to estimate the efficiency of crushing in breaking fluid inclusions. For eight samples, approximately 300 mg of calcite powder were recovered from the crushing cell and sieved to separate the fraction larger than 704 μm. The finer portion was analyzed by a Honeywell-Microtrac × 100 ASVR laser granulometer that measures powder from 0.01 to 704 μm. The results are summarized relative to the particle size (%) as detected by the laser and include differential and cumulative graphical data.
3.5. Scanning Electron Microscopy
Scanning electron microscopy was used to acquire high-resolution images of two calcite powders derived from step-crushing. The morphology of residual calcite and broken inclusions was studied using a JEOL JSM-820 scanning electron microscope in the CAI de Técnicas Geológicas (Complutense University of Madrid). Images were processed with the software IncaSuite18© Version 4.1.1.
4. Results
4.1. Petrography
Stalagmite Tortero-4 is mainly composed of columnar, elongated calcite. According to the classification by Frisia [15], this fabric consists of large crystals (mm-cm, crystal length to width ratios greater than 6:1) with elongated calcite columns parallel to the c-axis. Within this main fabric, two subtypes are differentiated on the basis of the degree of coalescence shown by adjacent calcite crystallites: (1) open fabric, characterized by the partial coalescence of calcite crystals and the resulting abundance of intercrystalline fluid inclusions, which mainly appear concentrated in bands parallel to growth layers (Figure 3a–d,g,h); and (2) closed fabric, defined by the complete coalescence of adjacent calcite crystals and thus by the scarcity of intercrystalline fluid inclusions (Figure 3e–j). Furthermore, but very subordinately, micritic fabric is present in the speleothem, mostly associated with internal unconformities.
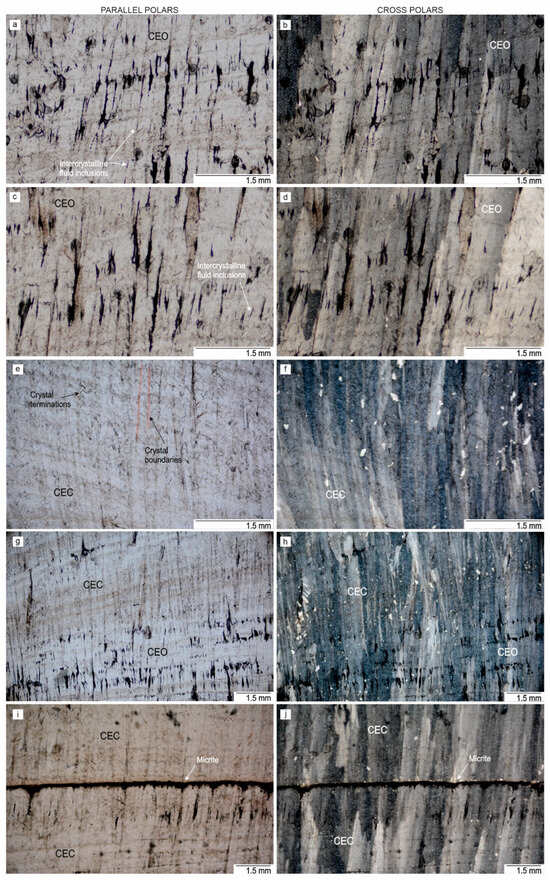
Figure 3.
Calcite fabrics of the five samples analyzed for NGTs (CEO: columnar elongated open fabric; CEC: columnar elongated closed fabric). Large intercrystalline fluid inclusions can be seen in columnar elongated open fabrics in microphotographs (a–d) and some parts of (g–h). The rest of the images correspond to CEC or micrite that contain only small intracrystalline fluid inclusions (<20 µm), not visible at this magnification. For more information, see the main text and Figure 4. Sample T4-5 ((a), parallel polar photo; (b), cross polar photo). Intercrystalline fluid inclusions marked by white arrows in (a), T4-8 ((c), parallel polars photo; (d), cross polars photo). Intercrystalline fluid inclusions marked by white arrows in figure (c), T4-12 ((e), parallel polars photo; (f), cross polars photo). Crystal terminations marked by dashed black lines and crystal boundaries marked by dashed red lines in figure (e), T4-24 ((g), parallel polars photo; (h), cross polars photo), T4-25 ((i), parallel polars photo; (j), cross polars photo). Micrite (marked by a white arrow).
The main petrographic features of the samples selected for NGT (T4-5, T4-8, T4-12, T4-24, and T4-25) are the following (Figure 1):
Sample T4-5: Whitish columnar elongated calcite. Well-defined lamination marked by pseudopleochroic calcite (sensu Kendall and Broughton [23]) and the presence of large fluid inclusions (>20 µm) aligned with the main crystal growth direction, mainly located at the crystal borders (Figure 3a,b). Open fabric.
Sample T4-8: Whitish columnar elongate calcite. Lamination, fluid inclusions, and crystals are similar to those in the T4-5 sample (Figure 3c,d). Open fabric.
Sample T4-12: brownish columnar elongated calcite. Fine lamination defined by pseudopleochroic calcite with multiple crystal terminations (Figure 3e,f) and by the alignment of abundant small (2–5 µm) rounded fluid inclusions (not observable in the photographs in Figure 3 because of their size). Closed fabric.
Sample T4-24: This sample consists of columnar, elongated calcite but includes two well-differentiated parts. The lower part is whitish in color and shows large fluid inclusions and open fabric, and the upper part is brownish and displays concentrations of small fluid inclusions, typical of closed fabric (Figure 3g,h). Due to the coexistence of open and closed fabrics, we will refer to this sample as mixed open/closed.
Sample T4-25: The sample mostly consists of brownish columnar elongated calcite with abundant small fluid inclusions and closed fabric. It also includes a discontinuity (Figure 3i,j) that, at higher magnification, is found to be formed by columnar calcite interbedded with three very fine micrite layers.
4.2. Fluid Inclusions Petrography
4.2.1. Primary Fluid Inclusions
Primary fluid inclusions of stalagmite Tortero-4 were classified using two complementary approaches: their position relative to crystal boundaries and their morphological features. The basic criteria for speleothem fluid inclusion description and classification can be found in [18].
According to their relation to the host crystal, stalagmite Tortero-4 includes both intercrystalline (located between calcite crystals and crystallites), defined by Kendall and Broughton [23] as the smallest units that grow below the seepage water and create the surface of the speleothems, and intracrystalline fluid inclusions (located within the crystals and crystallites). The definition of these two types implies that any fluid inclusion generated between crystallites that later coalesced to form a large crystal should always be considered intercrystalline, despite its location within the large crystal.
According to the morphological classification proposed by Lopez-Elorza et al. [18], Tortero-4 has a notable variety of fluid inclusions, including the following types: elongate, thorn-shaped, down-arrow shaped, pyriform and boudin fluid inclusions (for a description, see below). The petrographic study reveals that all these types, except boudin fluid inclusions, are present in open fabrics and that only pyriform and boudin occur in closed fabrics.
Intercrystalline Fluid Inclusions
Intercrystalline fluid inclusions in stalagmite Tortero-4 are abundant, particularly in open fabrics. They are usually grouped in narrow bands parallel to growth layers (Figure 3a,c,g) and are more common in the axial part of the speleothem. In relation to their filling, these fluid inclusions are mostly monophasic (i.e., filled only by water or, less commonly, only by gas), whereas biphasic ones (filled by water with a gas bubble) are very rare in our samples. And from a morphological perspective, they include abundant elongate, thorn-shaped, and down-arrow fluid inclusions.
Elongate fluid inclusions (as defined in Kendall and Broughton [23]) have the shape of a pod and are characterized by the presence of a large main axis (Figure 4a), oriented parallel to the crystal growth direction. Their size ranges from 15 to >100 µm, being the larger inclusions in zones with larger columnar crystals.
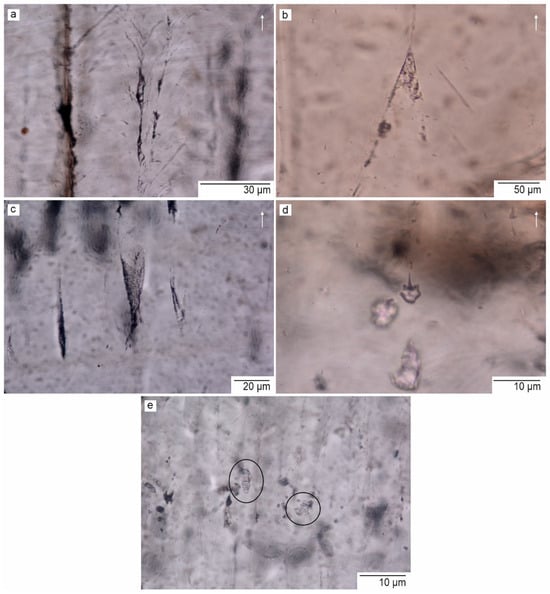
Figure 4.
Five types of fluid inclusions observed in Tortero-4 stalagmite. (a) Elongate intercrystalline fluid inclusion. (b) Thorn-shaped intercrystalline fluid inclusion. (c) Down-arrow intercrystalline fluid inclusion. (d) Pyriform intracrystalline fluid inclusion close to the micrite layer. (e) Boudin intracrystalline fluid inclusions (black circles) in thin columnar calcite layers interbedded with micrite layers. In all photos, the white arrow indicates the growth direction of the stalagmite. All fluid inclusions are water-filled.
Thorn-shaped fluid inclusions (as defined in Kendall and Broughton [23]) show similar sizes, orientations, and distributions that elongate fluid inclusions, but they show a distinctively wider basal part (Figure 4b).
Down-arrow fluid inclusions (as defined in Lopez-Elorza et al. [18]) are morphologically quite similar to thorn-shaped but oriented in the opposite direction, i.e., they have a wider upper part (Figure 4c). Also, these are usually smaller (10–50 µm) than elongated and thorn-shaped ones.
Intracrystalline Fluid Inclusions
Intracrystalline fluid inclusions observed in stalagmite Tortero-4 are mostly monophasicd and usually all-water. All-gas inclusions are a minority, and biphasic ones are very unusual. From a morphological point of view, two types, pyriform and boudin, were recognized.
Pyriform inclusions (as defined in Lopez-Elorza et al. [18]) have a rounded head and a tail aligned parallel to the crystal growth axis (Figure 4d). Their size varies between 3 and 10 µm. These are the dominant intracrystalline fluid inclusions, both in open and closed fabrics, and particularly near crystal terminations (Figure 5a,b).
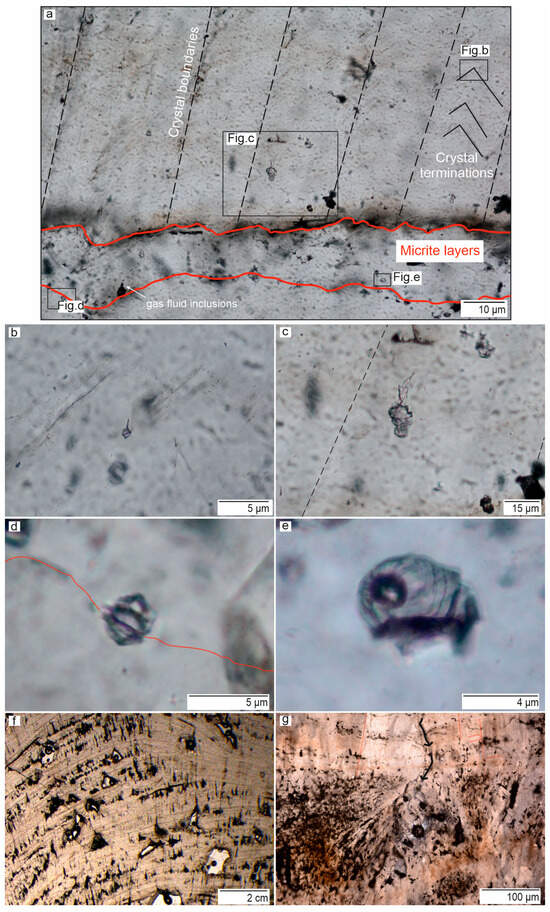
Figure 5.
(a–e) Primary fluid inclusions. (a) Distribution of different intracrystalline fluid inclusions within calcite crystals and in thin columnar calcite layers interbedded with micrite layers (red lines). Crystal boundaries are indicated by black dashed lines. Crystal terminations are visible throughout the image, and some of them are marked by solid black lines. (b) Water-filled pyriform fluid inclusion within the calcite crystal and close to the crystal termination. (c) Boudin water-filled fluid inclusion within the calcite crystal. (d) Water-filled boudin fluid inclusion in thin columnar calcite layers interbedded with micrite layers (red solid line). (e) Biphasic (gas+water) boudin fluid inclusion in the micrite layer. (f,g) Secondary fluid inclusions formed by dissolution-precipitation processes related to the percolation of younger waters through the speleothem. (f) Triangular and round fluid inclusions formed by the enlargement of primary fluid inclusions located parallel to growth layers. Many of these enlarged inclusions are interconnected, although this can only be detected by petrophysical procedures. (g) Intracrystalline fluid inclusions (black spots) in blurred lamination. See Lopez-Elorza et al. [18] for more information. Crystal boundaries are marked by dashed red lines.
Boudin fluid inclusions (as defined in Lopez-Elorza et al. [18]) show a tubular morphology with narrowings along their main axis (Figure 4e). In most cases, they are not oriented parallel to the crystal growth direction and are bigger than other intracrystalline fluid inclusions (5–20 µm). They are restricted to thin layers of columnar calcite that are interbedded with micrite layers along the discontinuity of sample T4-25 (Figure 5a,c). It should be noted that some of them are biphasic (Figure 5e) or all-gas inclusions.
4.2.2. Secondary Fluid Inclusions
Secondary fluid inclusions in speleothem calcite are those filled by fluids whose origin is unrelated to the growth of the surrounding crystals and are commonly generated by the percolation of younger waters through the speleothem, a process that is frequently related to micro-stratigraphic disruptions or unconformities (for details, see [18]). Recognition of these inclusions is essential to discarding samples that may contain them since they would lead to flawed NGT results. In stalagmite Tortero-4, secondary fluid inclusions have been recognized in some zones of its axial part. These frequently show triangular shapes and have very large sizes. In fact, their diameter very often exceeds the thickness of a petrographic section and thus appears broken and looks like big open pores (Figure 5f). Possibly, these triangular pores are interconnected, forming nets similar to those described in [24]. In other cases, the growth lamination is blurred by aligned intracrystalline fluid inclusions, whose orientation seems to be related to later water-leaking processes along the intercrystalline spaces (Figure 5g). These inclusions have also been classified as secondary and discarded for noble gas analysis.
4.3. Nuclear Magnetic Resonance (NMR)
Slabs T4-4 and T4-17 were chosen for nuclear magnetic resonance. They were considered representative of the main types of fabrics of stalagmite Tortero-4. The slab T4-4 consists of open fabric, and the slab T4-17 displays alternating open and closed fabric.
4.3.1. Magnetic Resonance Image (MRI)
2D nuclear magnetic spin echo images of T4-4 and T4-17 were obtained to determine the location of water-filled fluid inclusions in the stalagmite. More specifically, the central slices S2 and S3 of each slab were considered for the analysis, while the other two (S1 and S4), which correspond to the outer faces of the slab, were discarded due to potential leaking during slab preparation (Figure 6). The applied resolution in NMR measurements is 312.5 µm × 312.5 µm. Because the size of fluid inclusions is, according to the petrographic study, commonly below 100 µm, high-intensity signal spots, formed by more than one pixel, would represent groups of water-filled fluid inclusions.
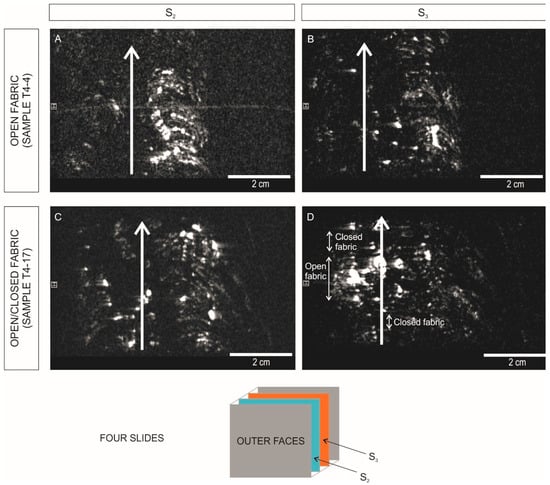
Figure 6.
MRI images from the inner parts (S2 and S3) of T4-4 and T4-17 slabs. The white arrow in all photos indicates the growth direction of the stalagmite and the axial zone in each sample. (A) Image of S2 slide in T4-4. (B) Image of S3 slide in T4–4. (C) Image of S2 slide in T4–17. (D) Image of S3 slide in T4-17. Open and closed fabrics are marked in the photo. In all images H refers to “Horizontal position”.
The MRIs of T4-4 (open fabric) are shown in Figure 6A,B. The white arrow indicates the position of the axis of the stalagmite and the direction of growth. The bright spots, which represent the volume of calcite with a high concentration of water-filled fluid inclusions, are concentrated towards the sides of the stalagmite. In contrast, the axial zone is very dark, indicating very low water content, although small or isolated fluid inclusions, not detectable with the applied resolution, could be present. Most bright spots are aligned following the growth layers (Figure 6A,B), although other bright areas do not seem to display any clear orientation.
The MRIs of slab T4-17 (open and closed fabric) are shown in Figure 6C,D. The alternance of open and closed fabrics is defined by respectively brighter and darker growth layers. In this case, no differences between the axial and lateral areas of the stalagmite are observable.
4.3.2. Relaxometry
In NMR, the distribution of the surface-to-volume ratio of rock pores (the “surface effect”) is associated with the distribution of relaxation times. The magnetic resonance instrument measures two relaxation times, T1 (spin lattice relaxation time) and T2 (spin-spin relaxation time), and results are presented graphically in relaxation curves (Figure 7). T1 and T2 relaxation curves are associated with the size distribution of water-filled pores in a sample: shorter relaxation times are induced by smaller pores, and larger relaxation times are caused by larger pores. Times equal to 3 s are induced by bulk water.
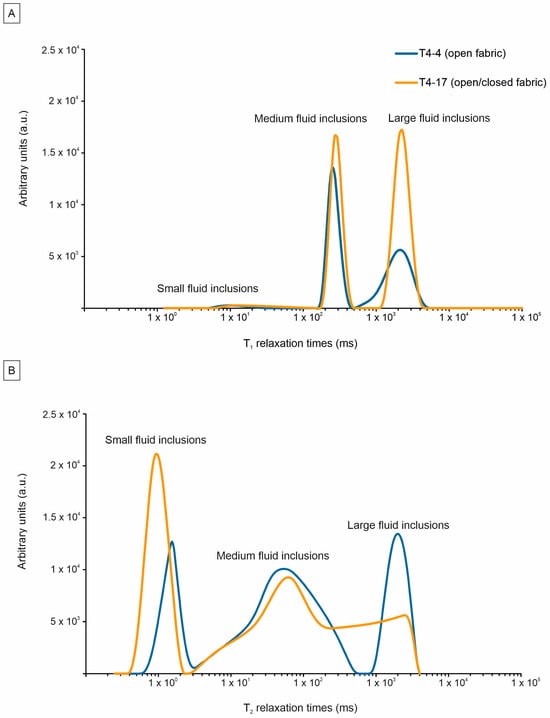
Figure 7.
Time (ms) relaxometry curves (T1 and T2) of open and open/closed fabrics in the stalagmite. Both relaxometry curves show a size distribution of fluid inclusions (small, medium, and large). (A) T1 relaxation times. (B) T2 relaxation times. Note that the simplified method of NMR data integration provides the results in arbitrary units (y axis), allowing us to compare the area of different peaks.
Relaxation curves of T4-4 and T4-17 show similar patterns (Figure 7), allowing both samples to group the fluid inclusions into three families: small fluid inclusions (T1 relaxation times between 5 and 100 ms; T2 relaxation times between 0.4 and 2 ms), medium fluid inclusions (T1 relaxation times between 170 and 500 ms; T2 relaxation times between 2 and 500 ms), and large fluid inclusions (T1 and T2 relaxation times between 500 and 4000 ms).
4.4. Noble Gas Temperatures in Fluid Inclusions
4.4.1. Measurements of Noble Gases
Noble gas amounts in ten sub-samples of the stalagmite Tortero-4 were measured following the step-crushing method proposed by Kluge et al. [1]. These sub-samples correspond to duplicates (A and B) of the five samples selected for the study (T4-5, T4-8, T4-12, T4-24, and T4-25) (Figure 1). The noble gases and water content of each sub-sample were measured three times (after the first, second, and third crushings), as detailed in Table 1. Two sub-samples, T4-25B and T4-12A, did not yield results for the third step-crushing measurement.

Table 1.
Results of noble gas measurements and corresponding fits of the UA model for all crushing steps performed on stalagmite samples. Basic characteristics of each sample are indicated together with the measured parameters: water content (µL/g) and noble gas concentration (cm3 STP/g). The calculated air/water volume ratio (A) and the final modeled NGT temperatures are also included. Uncertainties stated for NGT and A are derived in the fitting procedure and correspond to an error propagation of the 1σ analytical errors of the concentrations to the estimated model parameters. Some crushing steps show very low water amounts (negative values indicate negligible water amounts). Such low water amounts lead to high uncertainties of the noble gas concentrations; therefore, these steps are not considered for the NGT fitting.
The total water content released per weight of sample (considering the three measurements of each sub-sample) has values between 0.01 µL/g and 1.7 µL/g (Table 1 and Figure 8). Sub-samples corresponding to closed fabrics generated the lowest values of water per sample weight (always below 0.2 µL/g), while open and mixed fabrics yielded significantly higher values, although with notable variability (0.3–1.7 µL/g). As could be expected, the released water per sample weight decreases from the first to the third step of crushing (Figure 8 and Table 1). In some cases, the water content is very low during the second and third crushings.
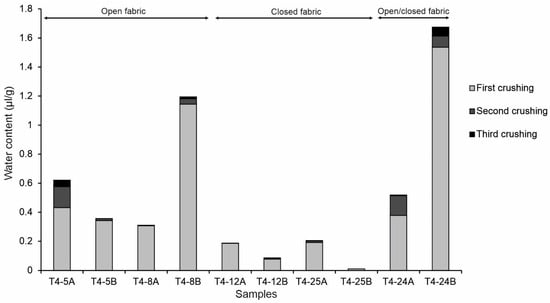
Figure 8.
Measured water content (µL/g) in the first, second, and third crushings for each sample. In all samples, the highest water content was measured in the first crushing. Overall, samples with open fabrics contain a higher water content, and samples with closed fabrics contain the lowest water content. Samples with open/closed fabric display erratic behavior.
Table 1 also displays the noble gas (He, Ne, Kr, Ar, and Xe) concentrations measured in each crushing step. These data were used to obtain the best estimates of the noble gas temperature NGT and air/water volume ratio A by fitting the unfractionated excess air (UA) model (Figure 2b) to the noble gas concentrations (see Kluge et al. [1] and Sander et al. [22] for details). Since the results of He and Ne, the light noble gases that are most strongly affected by atmospheric air contributions, showed high variability and often poor fits to the UA model, only the concentrations of the heavy noble gases Ar, Kr, and Xe were used in the fit procedure to constrain the model parameters NGT and A.
The results show that the A value decreases significantly from the first to the third crushing (Figure 9). In the first crushing, open fabrics (circles in Figure 9) have the highest values (0.120 ± 0.018 to 0.721 ± 0.056), and closed fabrics (squares in Figure 9) have the lowest values (0.029 ± 0.037 to 0.080 ± 0.019). Open/closed fabric (circle inside a square in Figure 9) (T4-24A) has A values (0.167 ± 0.019) in the lower part of the open fabric range.
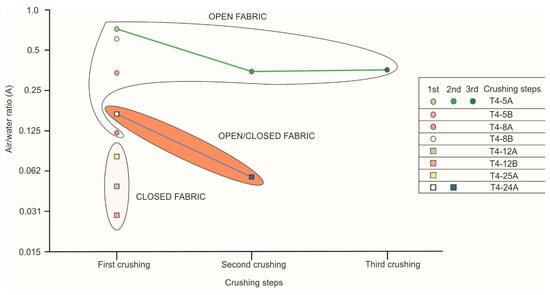
Figure 9.
Evolution of air/water volume ratio A from the first to the third crushing step for each sample. Open fabrics have the highest A ratio, and closed fabrics have the lowest A ratio. Open/closed fabrics have intermediate values.
The elemental ratios Xe/Ar and Kr/Ar were used to evaluate the influence of cave air noble gases (gas-filled fluid inclusions) in the final NGT fitting process. Results are plotted in Figure 10a, where the ideal air-equilibrated water (iAEW) represents the concentration of dissolved noble gases in air-saturated water at 20 °C. Different standards from various water reservoirs at different temperatures were tested to be used as AEW references for this study. Finally, the 20 °C AEW standards were more consistent than the others, and they will be the only ones displayed in the graphics. AEW batches at other temperatures showed some deviation despite meticulous preparation. The line that emerges from the iAEW at the 20 °C point towards atmospheric air composition defines the increase in the proportion of noble gases derived from gas-filled fluid inclusions, i.e., the evolution of “excess air”. Those values that approach the atmospheric air point are considered to be highly influenced by gas-filled fluid inclusions (T4-5A and T4-5B). It should be noted that the influence of the cave air component decreases from the first to the third crushing. For example, T4-5A displays a step evolution from high atmospheric influence in noble gas concentration in the first crushing to lower atmospheric influence in the third crushing (Figure 9). Open fabrics (circles in Figure 10) are closer to the air atmospheric point, and closed fabrics (squares in Figure 10) are closer to the iAEW point. As could be expected, mixed open/closed fabrics are in the middle part of the line (circle inside a square in Figure 10).
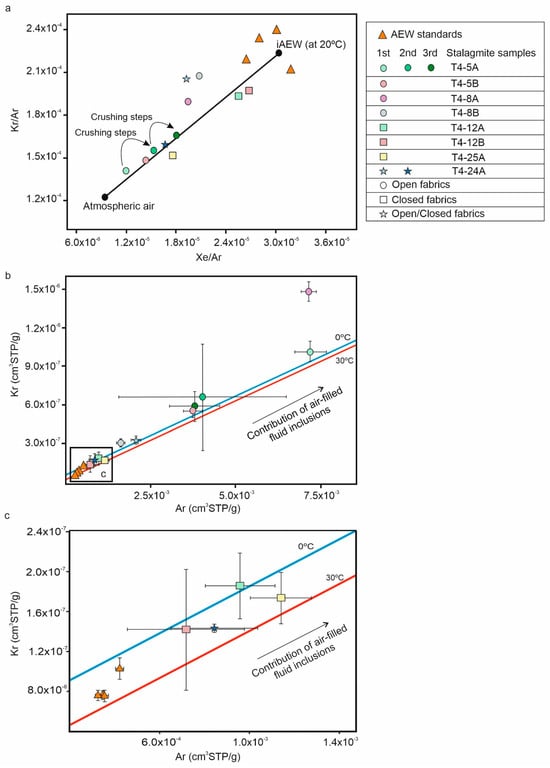
Figure 10.
Noble gas signatures (Kr, Ar, and Xe) in elemental ratios and concentrations (given in cm3 STP/g, i.e., gas volume at standard conditions for pressure and temperature per gram of water) extracted from stalagmite samples. For a better overview, the data obtained in the first crushing (lighter colors), second crushing, and third crushing (darker colors) are shown separately. Open fabrics are represented by circles, closed fabrics are represented by squares, and open/closed fabrics are represented by a star. AEW (air-equilibrated water) standards are indicated by triangles. (a) Xe/Ar vs. Kr/Ar plot. The solid line represents the decrease in gas-filled fluid inclusions in samples. The curved arrows indicate the evolution of the noble gas signature from the first to the third step of crushing. (b) Ar and Kr concentrations measured in the stalagmite samples. Solid lines represent the modeled concentrations for 0 °C (blue line) and 30 °C (red line) with different amounts of atmospheric air. The black arrow indicates the expected contribution of air-filled fluid inclusions. (c) Results of closed and open/closed samples near AEW standards.
The contribution of gas-filled fluid inclusions can also be estimated by means of an Ar vs. Kr plot (Figure 10b,c). In these graphics, the blue and red lines represent the expected values of speleothem samples with variable influences of gas-filled fluid inclusions at 0 °C and 30 °C, respectively. Gas contribution increases from the lower left corner (where the AEW standards are located) to the upper right corner of the plot.
Our data show that the step-crushing methodology helped to decrease the amount of air excess from the first to the last crushing (see, for example, T4-5A). Results of closed and mixed open/closed fabrics (T4-12A, T4-12B, T4-25A, and T4-24A) are very close to AEW standards and lie between the blue (0 °C) and the red (30 °C) lines (Figure 10b,c). On the contrary, open fabrics (T4-5A, T4-5B, and T4-8B) usually show a high influence of noble gases from gas-filled fluid inclusions. As they are below the blue line, NGT calculations will yield negative values. Only one sub-sample of open fabric (T4-8A) yields low amounts of air excess.
NGT were estimated from Ar, Kr, and Xe concentrations by fitting the UA model (Table 1). Ne and He were discarded for the inverse modeling process because the gas signature was dominant in these noble gases, and they overlapped the signal from water-filled fluid inclusions. The most consistent values correspond to first and second crushing in closed (12.1 ± 27.9 °C and 12.5 ± 10.2 °C) and mixed open/closed samples (19.0 ± 23.0 °C). Results of open fabrics cover a wider range of temperatures and yield apparent NGTs below 0 °C.
4.4.2. Applied Hits to Crush Calcite Samples
Calcite samples were crushed with a magnetic steel ball during the step-crushing procedure. The total number of hits applied in the three crushing steps of our experiment varied from 64 to 190 per step, depending on the amount of water present in the crushing line (Figure 11a). The pressure in the line is measured by the H2O manometer (Figure 2a). Further hits were applied until the pressure reached 1–2 mbar, which is considered the optimum pressure to obtain the best water and noble gas results. In general, fewer hits were necessary to extract the target amount of water in open fabrics than in closed ones, whereas the mixed open/closed fabric shows an intermediate behavior (Figure 11a).
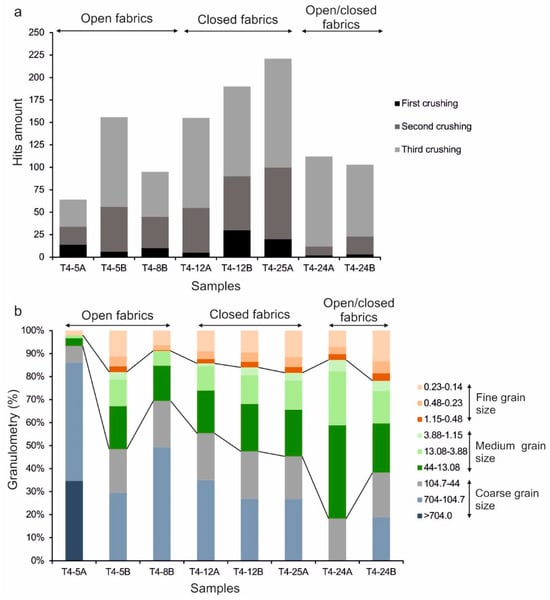
Figure 11.
(a) Number of hits applied. (b) Granulometry results of most samples used for NGT analysis. The calcite powder was sorted into three categories: fine (0.23–1.15 µm), medium (1.15–44 µm), and coarse grain size (44 µm—more than 704 µm).
4.4.3. Analysis of Remaining Calcite Powder
The calcite powder derived from crushing was analyzed for grain size distribution in order to compare with the sizes of the fluid inclusions (characterized by petrography and relaxometry). Because powder size varies from 0.14 µm to more than 1 mm, we defined three classes: coarse (>44 µm), medium (44–1.15 µm), and fine (1.15–0.14 µm) (Figure 11b). The analysis reveals that open fabrics generated the largest amounts of coarse grains, while mixed open/closed fabrics gave the highest amounts of medium grains, and closed fabrics yielded more fine grains than the other two.
The calcite powder of T4-5A (a sample with a large fraction of coarse grains) was characterized by SEM. Figure 12a illustrates the preference of calcite to break along crystal boundaries, which confirms that the fluid trapped in intercrystalline fluid inclusions was released early in the crushing measurements, even with few hits and a large resulting coarse powder fraction. Interestingly, we observed that some of the tiniest (<6 µm) intracrystalline fluid inclusions were also broken in this sample after only 64 hits (Figure 12b).
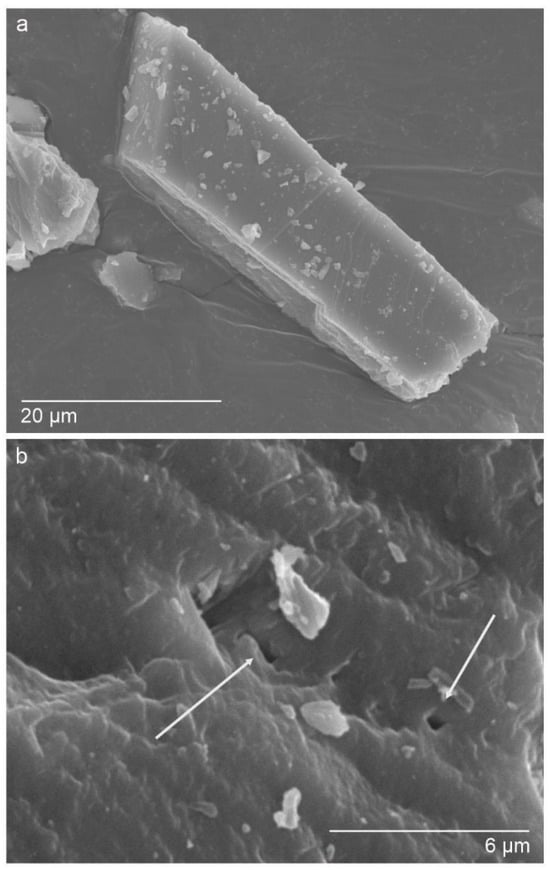
Figure 12.
SEM photos of the remaining calcite powder (T4-5 sample). (a) Calcite cleavage-bound fragment. (b) Opened intracrystalline fluid inclusions (marked by white arrows).
5. Interpretation
5.1. Growth Conditions of Tortero-4
Columnar elongated is the main fabric in all the considered samples. According to Frisia [15], it implies that the stalagmite grew under relatively constant drip conditions and that its surface was continuously covered by seepage water. Although these general conditions were never greatly disturbed, the occurrence of open and closed fabrics suggests that minor changes happened during the growth of the stalagmite (changes in drip rate or degassing). Also, the three thin micrite layers observed in the stalagmite (Figure 3i and Figure 5a) could be related to drier periods [25], probably of relatively short duration, that punctuated the dominant, relatively homogeneous conditions of the stalagmite growth.
5.2. Fluid Inclusion Characterization
According to the relaxometry results, there are a few sizes of fluid inclusions that are much more abundant than the others. This allows for the definition of three families of fluid inclusions according to their surface-to-volume ratio. These three families deduced from relaxometry (that we could simplify to “small”, “medium”, and “large” fluid inclusions) (Figure 7) can be compared with the types of fluid inclusions defined by petrography. The family that causes shorter relaxation times in NMR must correspond to the smallest fluid inclusions in all samples. These are primary intracrystalline fluid inclusions, whose sizes range between 3 and 20 µm (Figure 4d,e). Medium fluid inclusions should correspond to intercrystalline fluid inclusions (from 10 to, usually, more than 100 µm) (Figure 4a–c). Finally, larger relaxation times are provoked by water trapped in fluid inclusions that behave in a similar way to bulk water (T1 and T2 = 3s). Consequently, the larger relaxation times in all samples could be associated with enlarged fluid inclusions (for example, those fluid inclusions that show rounded morphologies due to aging effects [18]) or interconnected fluid inclusions (Figure 5f). Relaxometry does not show relevant differences between open and open/closed fabrics. In the two cases, T1 and T2 relaxometry curves are distributed in three main peak signals that confirm that the same types of fluid inclusions are found in both fabrics, as also observed through the petrographic analysis. Only the amount of fluid inclusions and the percentage of the three types are different in open and open/closed fabrics, as reflected by the diverse relative importance of each peak in the relaxometry curves (Figure 7a,b).
5.3. Distribution and Amount of Water in Stalagmites
Open fabrics contain more water than closed fabrics according to the petrographic study (Figure 3a,c), MRI images (Figure 6A,B), and NGT results (Table 1 and Figure 8). Most water is trapped in intercrystalline fluid inclusions (10 to >100 µm) that are usually grouped along parallel to growth layers (Figure 3a,c and Figure 6).
Closed fabrics contain much less water (Table 1 and Figure 8) than open fabrics. In this case, most of the water is in intracrystalline fluid inclusions (3–20 µm; Figure 4d,e), located within crystals and crystallites. The size of intracrystalline fluid inclusions is so small that they are not detected in MRI images at this resolution.
5.4. Air-Excess in Samples
According to NGT results, the air content is in general very high in open fabrics (mean value A = 0.343 ± 0.215) and notably lower in closed fabrics (mean value A = 0.048 ± 0.025) (Table 1, Figure 9 and Figure 10a,b). The large intercrystalline fluid inclusions that characterize the open fabrics can, in some cases, be partially or totally filled by gas (Figure 3a,c). Since these large inclusions are absent in closed fabrics, the presence of gas in these fabrics is very low, and it is restricted to scarce gas-filled and biphasic (gas and water) intracrystalline fluid inclusions located in the thin columnar calcite layers interbedded with the micrite layers associated with the growth discontinuity (Figure 5a,e).
5.5. Suitability of Fabric and Fluid Inclusions for NGT Fitting
According to Figure 10a–c, closed and open/closed fabrics can be considered more suitable for NGT determination because their noble gas signal is not fully overlapped by the atmospheric (cave air) signal. Results of open fabrics show that the step-crushing methodology is helpful to reduce the influence of atmospheric air in successive measurements, but the uncertainty of water and noble gas amounts is often too high in the second and third crushings to obtain sufficiently precise temperatures (Table 1, Figure 10a,b).
Closed fabrics show the most favorable balance between gas-filled and water-filled fluid inclusions, according to NGT results (Table 1). The best paleotemperature estimates were obtained with the samples of this fabric (Figure 10a–c), although uncertainties are still too large. They are associated with the low water content obtained in all crushing steps. On the other hand, open fabric samples did not yield reliable temperature data in our experiment (they were highly variable and, in some cases, unreasonably low). In these samples, the water amount was high enough already in the first crushing, but the gas content was too high for accurate NGT fitting. In the second and third crushing steps, the gas content was lower, but the water amount could not be determined precisely, making it impossible to fit reliable temperatures.
The results in open/closed fabrics were different depending on the sample (A and B) and illustrate the strong heterogeneity of this fabric. One sample (T4-24A) showed water content and noble gas concentrations similar to the closed fabric and allowed the calculation of a reasonable temperature. Its duplicate (T4-24B), however, had a larger amount of water but a too low concentration of noble gases (close to zero or, in a few cases, negative after subtraction of the system blank), hampering the calculation of paleotemperatures (Table 1). Although it was already known that the proportion of fluid inclusions as well as the volumetric ratio of air to water (A) can show strong differences among similar samples [1], our results show that this variability is enhanced in samples that contain open/closed fabrics.
5.6. Crushed Fluid Inclusions
Calcite powder granulometry data were compared with the size of intercrystalline (10 to >100 µm) and intracrystalline (3–20 µm) fluid inclusions. Figure 11b shows that the calcite powder derived from crushing ranges from 0.14 to more than 1 mm. SEM images confirm that some of the tiniest intracrystalline fluid inclusions were opened at the end of the step-crushing, even in the samples characterized by coarse grains (Figure 12a,b). Since the defined class of fine grains (0.14–1.15 µm) (Figure 11b) is smaller than all intercrystalline and most intracrystalline fluid inclusions, the presence of a relatively high percentage of fine (at least 15%–20%) and medium grains (at least 40%) allows us to conclude that all types of fluid inclusions were broken in these samples. In the samples that display less than 20% of fine grains and less than 40% of medium grains, it can be assumed that most of the water released by the crushing came from large intercrystalline fluid inclusions.
In addition, there is a rough relationship between the calcite powder size distribution and the number of applied hits in the crusher (Figure 11b). In general, in open fabrics, the goal pressure in the line was reached with much fewer hits than in other fabrics, and, thus, coarser grains were obtained (Figure 11a,b). For instance, the T4-5A sample yielded the largest proportion of coarse grains (more than 90%) because the goal pressure was reached with only 64 hits distributed in three steps (Table 1). In this sample, the high percentage (more than 80%) of grains larger than 104.7 µm (Figure 11b) suggests that lots of intercrystalline fluid inclusions (averaging 100 µm) may still be preserved in the resulting powder, and that a 4th crushing measurement could have been made in order to break most intercrystalline fluid inclusions as well as an important fraction of the intracrystalline ones.
Samples with closed fabrics were beaten more times than the other samples, and as a whole, they show the largest percentage (10%–20%) of fine grains (0.14–1.15 µm) (Figure 12a,b). This means that many pyriform (3–10 µm) and boudin (5–20 µm) fluid inclusions were crushed and opened during the extraction. Although the fine and medium grain percentages are high in closed fabrics, the quantity of coarse grains is still significant (45%–55%) (Figure 12b). This implies that calcite powder coarser than 20 µm (the size of the biggest intracrystalline fluid inclusions) could host intracrystalline fluid inclusions, which remain intact after crushing. To avoid that and to benefit from most of the water-filled intracrystalline fluid inclusions, closed fabrics must be beaten more times.
Open/closed fabrics were beaten between 100 and 115 times, and they show the largest percentage (20%–42%) of medium grains (1.15–44 µm), which implies that most of the large intracrystalline fluid inclusions (5–20 µm) were opened in these samples.
6. Discussion
This integrative study combines the characterization of speleothem fabrics (by petrography) and fluid inclusions (by petrography, relaxometry, and SEM imaging) with noble gas analysis. Our results show that the characterization of the speleothem fabrics and fluid inclusions could be an important task for achieving precise and meaningful NGTs. This approach has the following benefits: (1) The petrographic and NMR analyses can yield a good estimate of the amount of water trapped in the fluid inclusions prior to any NGT analysis, allowing the selection of the most favorable samples; and (2) they allow for the adaptation of the noble gas measurement procedure to each sample in order to improve the extraction process and thus the quality of results. The crushing procedure could be customized and improved for each type of sample if the amount, type, and air-to-water ratio of fluid inclusions were known beforehand. It should be noted that the air-to-water ratio of fluid inclusions can be pre-estimated by petrographic analysis. Lopez-Elorza et al. [26] proposed a simple method based on point counting on petrographic sections that allows for reasonable estimations of the amount of gas-filled fluid inclusions and water-filled fluid inclusions in a sample.
6.1. Water in Fluid Inclusions
The amount of water released from fluid inclusions during crushing is fundamental for noble gas measurements and accurate paleotemperature calculations. According to our results, water is present in both intercrystalline and intracrystalline fluid inclusions, consistent with observations of other petrographic studies [27,28], but discordant to others, which described that only intracrystalline fluid inclusions are filled by water [12,29]. In fact, in our samples, most water was found in intercrystalline fluid inclusions grouped in narrow bands parallel to growth layers, as deduced by NMR imaging and the petrographic study. Comparing open and closed fabrics, the water content is notably higher in open ones due to the existence of more water-filled intercrystalline inclusions.
6.2. Air-Excess
The second fundamental aspect of accurate NGT modeling is the presence of a low atmospheric air/water ratio in the analyzed fluid. This ratio depends not only on the relative content of water and gas in the analyzed sample but also on the crushing procedure, which should be capable of partially separating both components. The step-crushing methodology has been proven to help in reducing the proportion of gas in the analyzed sample from the first to the third crushing stage [1]. Our results confirm this point and show that, in all crushing steps, open fabrics contain higher amounts of air excess (with a noble gas composition that is assumed to be the atmospheric one) than closed fabrics.
The presence of noble gases of air-like composition in speleothems has been reported in previous papers [1,12], in amounts that vary over more than two orders of magnitude and are considered to be “unexpectedly high” [1].
The source of that air with noble gases and the atmospheric composition inside the speleothems is a controversial issue. Gas-filled and biphasic (gas and water) fluid inclusions trapped during the growth of the stalagmite could be considered the most obvious primary origin for that air. The amount of air in fluid inclusions is difficult to estimate. Scheidegger et al. [12] estimated a total air volume of 2–3 vol% in their samples. Other authors [30,31] considered that most fluid inclusions are biphasic in speleothems, as would correspond to vadose entrapment [32], while Krüger et al. [33] suggest that all fluid inclusions in stalagmites are always monophase liquid at room temperature.
Our petrographic study shows that some air was in large intercrystalline fluid inclusions in open fabric as well as in small biphasic intracrystalline fluid inclusions in closed fabric (only found in the micritic layer). However, most of our fluid inclusions were only filled by water (water monophasic), as would be expected in a speleothem formed under continuous seepage flow. Gas-filled and biphasic fluid inclusions probably formed only during drier periods when the surface of the speleothem was in contact with both dripping water and cave air. This “biphasic” speleothem surface allows calcite to trap gas or a mixture of gas and water during growth.
A primary origin for the atmospheric composition of noble gases in calcite was proposed by Scheidegger et al. [12]. They argued that some noble gases (Ne and He) could be trapped in the calcite crystal lattice during the growth of the stalagmite and that they could be released during the heating and crushing measurements. This could explain the strong enrichment of excess air and the relative enrichment of light noble gases in some noble gas fitting results.
Another possible mechanism for the presence of gas-filled fluid inclusions could be the leaking and drying of primary water-filled intercrystalline fluid inclusions. Leaking is a post-entrapment process, and it happens when inclusions lose water through microfractures or crystal boundaries [34]. Experimental data show that re-equilibration processes are more common in large fluid inclusions than in small ones [35]. Moreover, flat-shaped inclusions, such as the intercrystalline fluid inclusions in this study, tend to re-equilibrate (leak) more easily than spherical or negative crystal-shaped inclusions [36]. Leaking processes in stalagmite fluid inclusions can also be related to temperature changes, as demonstrated by experimental work consisting of subjecting fluid inclusions to cyclical temperature changes in a climatic chamber [37]. Temperature changes in the range of those that can occur during speleothem sampling, transport, and storage can cause changes in the volume of inclusion bubbles. Strict protocols for sampling, handling, and storage must be adopted to minimize the occurrence of those alterations. The drying process of water-filled fluid inclusions was also reported by Genty et al. [38], who observed that initial small bubbles of fluid inclusions increased a few weeks after sawing, and they linked this process to the loss of water. However, a simple leaking process such as this would probably produce an open gas inclusion that would be emptied during the pumping stage prior to the crushing in the noble gas line. Smaller micro-cracks may only allow for limited diffusive gas loss that systematically alters the noble gas composition. In a diffusive regime, light noble gases are lost preferentially, leading to low or even negative apparent noble gas temperatures. This pattern has been observed in our study for most crushing steps in open and open/closed fabric, indicating that diffusive leakage processes are relevant.
6.3. Some Clues for Future NGT Analyses
Our study shows the high potential of elongated columnar fabrics for NGT determination, but also that crushing procedures should be improved to increase the quality of results. Suggested modifications in the methodology are the following:
- In closed fabrics, if the amount of gas-filled fluid inclusions observed under the microscope is not too high, the gas contribution is probably not a significant problem, and thus step-crushing might not be necessary. Enough water will be obtained by opening all fluid inclusions in one step. In our study, an average of 190 hits were applied to closed fabrics. In order to increase the water content and reduce the uncertainty of the NGTs, at least 200 hits should be applied in a single crushing step.
- In open fabrics, the main concern is the high fraction of noble gases from the cave air component in the first crushing step and the low water amount in subsequent crushings. Therefore, the paleotemperatures fitted in all crushing steps display large errors. The effectiveness of the method for open fabrics could be improved by applying fewer (2 or 3) hits in the first crushing. This would preferentially break a portion of gas-filled intercrystalline inclusions because of their larger size, and it would keep more water-filled fluid inclusions for the second crushing. Although some gas-filled fluid inclusions would be preserved in the second and third crushings, the ratio between gas-filled and water-filled fluid inclusions would decrease proportionally by step-crushing, thus improving the final NGT results.
The speleothem growth history determines the amount of gas trapped in monophasic, biphasic, intercrystalline, or intracrystalline fluid inclusions. Consequently, the heterogeneity of the samples demands a detailed petrographic study that allows for the selection of the most suitable samples for NGT analyses. The suggestions exposed above should not be applied without a prior petrographic study.
Although in this work fluid inclusions were crushed only for NGT analyses, previous fabric and fluid inclusion characterization must be essential for other geochemical studies that also apply crushing techniques, such as stable isotope measurements in fluid inclusions [39,40].
7. Conclusions
A combination of classic petrography with non-destructive nuclear magnetic resonance analyses has been used to characterize the most appropriate fabrics of calcite stalagmite for noble gas measurements. The studied stalagmite is formed by two types of elongated columnar fabric: open fabric contains higher amounts of water in large intercrystalline fluid inclusions formed by the incomplete coalescence of adjacent calcite crystals. On the other hand, closed fabric is generated by the total coalescence of adjacent calcite crystals. In this case, water is only present in small intracrystalline fluid inclusions. The following conclusions of importance for future NGT studies were obtained for these fabrics of calcite:
- Relaxometry results allow us to define three families (small, medium, and large) of voids filled with water. These families can be correlated with the types of fluid inclusions described under the microscope: intracrystalline fluid inclusions would correspond to the family of small voids filled with water defined by relaxometry; intercrystalline fluid inclusions correlate with the medium size family; and secondary enlarged fluid inclusions must be the origin of the larger relaxometry times that correspond with bulk water. The three families are usually present in both open and closed samples, but the size distribution is different enough to distinguish them.
- Petrographic observations are consistent with the amount of water obtained in the crushing line, which is usually lower in closed fabrics. In open fabrics, the water is mainly placed in large intercystalline inclusions that usually appear as groups following the growth layers. On the other hand, in closed fabrics, water is trapped in small intracrystalline fluid inclusions, which are dispersed within the crystals or near crystal terminations.
- Open and closed elongated fabrics also have different amounts of gas-filled fluid inclusions. Under the microscope, some large intercrystalline gas-filled fluid inclusions have been observed in open fabrics. Although the proportion of gas-filled inclusions is low, it is high enough to dominate the noble gas signal of water-filled fluid inclusions. Gas-filled fluid inclusions are much less common in closed fabrics. They are smaller and occur locally in thin columnar calcite layers interbedded with micrite layers. The influence of these inclusions on the final noble gas signal is very low.
- The most reliable NGT results have been obtained for closed fabrics in the first crushing step. Uncertainties were increased because the first crushing, intended to release some gas, yielded low amounts of water content in closed fabrics. For open fabrics, the step-crushing methodology has proven to be suitable for reducing the influence of gas-filled fluid inclusions from the first to the third crushing step. However, too low water amounts were measured in the second and third crushings, and this also hampered the NGT fitting to obtain reliable paleotemperatures.
- All types of fluid inclusions were opened during the step-crushing procedure. In general, open fabrics need to be crushed with a lower number of hits than closed fabrics to break both intercrystalline and intracrystalline fluid inclusions.
- The combination of techniques used in this work should be useful to improve future results. NMR allows choosing the areas of the stalagmite with higher amounts of water even before sawing it. Relaxometry times also allow for estimating the distribution size of the different types of fluid inclusions. After selecting the area of interest, classic petrographic observations are needed to confirm the data obtained by NMR and estimate the number of gas-filled fluid inclusions. With these data in mind, the step crushing methodology should be adapted depending on the fabric of the specimens, and some clues are given to improve it: If a closed fabric is free of gas-filled fluid inclusion, step crushing should be avoided, and at least 200 hits should be applied in a single crushing step to maximize the amount of water. On the other hand, step-crushing is needed for most open fabrics. If gas is present just in the largest intercrystalline fluid inclusions, only two or three hits should be applied during the first crushing step in order to keep more water for the second and third steps.
Author Contributions
Conceptualization, M.L.-E., M.B.M.-G., T.K., W.A. and J.M.-C.; methodology, M.L.-E., T.W., T.K. and W.A.; investigation, M.L.-E. and T.W.; validation, M.L.-E. and T.K.; writing—original draft preparation, M.L.-E. and M.B.M.-G.; writing—review and editing, M.L.-E., M.B.M.-G., T.K., W.A. and J.M.-C.; project administration and funding acquisition, W.A. and J.M.-C. All authors have read and agreed to the published version of the manuscript.
Funding
This research was funded by the R+D+i Program of Spain [research projects CGL2013-43257-R, CGL2017-83287-R, PID2021-122854OB-I00, Predoctoral Contract BES-2014-068614 to MLE] and DFG Grant KL 2391/2-1 from Germany in the context of GSC 129 grant. It is a contribution to Research Group 910198 (UCM).
Data Availability Statement
Data are contained within the article.
Acknowledgments
The authors gratefully thank Y. Krüger (Univ. Bergen), L. González-Acebrón (U. Complutense), M. Fernández-Valle (U. Complutense), A.I. Ortega (Cenieh), M.J. Turrero (Ciemat), and P. Garay (Generalitat Valenciana) for their help, advice, and suggestions during the different stages of the research. The technicians of Complutense University (J.C. Salamanca, A. Antón, and B. Moral) are thanked for the careful preparation of speleothem petrographic samples and those of Heidelberg University for their attention and help during the measurements. We appreciate permissions and help from the Direcció General de Medi Natural I d’Avaluació Ambiental of the Generalitat Valenciana (Spain) for accessing and working in Cueva del Tortero.
Conflicts of Interest
The authors declare no conflicts of interest.
References
- Kluge, T.; Marx, T.; Scholz, D.; Niggemann, S.; Mangini, A.; Aeschbach-Hertig, W. A new tool for palaeoclimate reconstruction: Noble gas temperatures from fluid inclusions in speleothems. Earth Planet. Sci. Lett. 2008, 269, 408–415. [Google Scholar] [CrossRef]
- Scheidegger, Y.; Kipfer, R.; Wieler, R.; Fleitmann, D.; Trösch, M. A step to noble gas temperatures from fluid inclusions in stalagmites. Geophys. Res. Abstr. 2008, 10, 03793. [Google Scholar]
- Scheidegger, Y.; Brennwald, M.S.; Fleitmann, D.; Jeannin, P.Y.; Wieler, R.; Kipfer, R. Determination of Holocene cave temperatures from Kr and Xe concentrations in stalagmite fluid inclusions. Chem. Geol. 2011, 288, 61–66. [Google Scholar] [CrossRef]
- Brennwald, M.S.; Vogel, N.; Scheidegger, Y.; Tomonaga, Y.; Livingstone, D.M.; Kipfer, R. Noble gases as environmental tracers in sediment porewaters and stalagmite fluid inclusions. In The Noble Gases as Geochemical Tracers. Advances in Isotope Geochemistry; Burnard, P., Ed.; Springer: Heidelberg/Berlin, Germany, 2013; pp. 123–153. [Google Scholar]
- Vogel, N.; Brennwald, M.S.; Fleitmann, D.; Wieler, R.; Maden, C.; Süsli, A.; Kipfer, R. A combined vacuum crushing and sieving (CVCS) system designed to determine noble gas paleotemperatures from stalagmite samples. Geochem. Geophys. Geosystems 2013, 14, 2432–2444. [Google Scholar] [CrossRef]
- Meckler, A.N.; Affolter, S.; Dublyansky, Y.V.; Krüger, Y.; Vogel, N.; Bernasconi, S.M.; Frenz, M.; Kipfer, R.; Leuenberger, M.; Spötl, C.; et al. Glacial-interglacial temperature change in the tropical West Pacific: A comparison of stalagmite-based paleo-thermometers. Quat. Sci. Rev. 2015, 127, 90–116. [Google Scholar] [CrossRef]
- Ghadiri, E.; Vogel, N.; Brennwald, M.S.; Maden, C.; Häuselmann, A.D.; Fleitmann, D.; Cheng, H.; Kipfer, R. Noble gas-based temperature reconstruction on a Swiss stalagmite from the last glacial–interglacial transition and its comparison with other climate records. Earth Planet. Sci. Lett. 2018, 495, 192–201. [Google Scholar] [CrossRef]
- Fleitmann, D.; Burns, S.J.; Neff, U.; Mangini, A.; Matter, A. Changing moisture sources over the last 330,000 years in Northern Oman from fluid-inclusion evidence in speleothems. Quat. Res. 2003, 30, 223–232. [Google Scholar] [CrossRef]
- Zhang, R.; Schwarcz, H.P.; Ford, D.C.; Schroeder, F.S.; Beddows, P.A. An absolute paleotemperature record from 10 to 6 Ka inferred from fluid inclusion D/H ratios of a stalagmite from Vancouver Island, British Columbia, Canada. Geochim. Cosmochim. Acta 2008, 72, 1014–1026. [Google Scholar] [CrossRef]
- Kluge, T. Fluid Inclusions in Speleothems as a New Archive for the Noble Gas Palaeothermometer. Doctoral Thesis, Universität Heidelberg, Heidelberg, Germany, 2008. [Google Scholar]
- Heaton, T.H.E.; Vogel, J.C. “Excess air” in groundwater. J. Hydrol. 1981, 50, 201–216. [Google Scholar] [CrossRef]
- Scheidegger, Y.; Baur, H.; Brennwald, M.S.; Fleitmann, D.; Wieler, R.; Kipfer, R. Accurate analysis of noble gas concentrations in small water samples and its application to fluid inclusions in stalagmites. Chem. Geol. 2010, 272, 31–39. [Google Scholar] [CrossRef]
- Vogel, N.; Scheidegger, Y.; Brennwald, M.S.; Fleitmann, D.; Figura, S.; Wieler, R.; Kipfer, R. Stalagmite water content as a proxy for drip water supply in tropical and subtropical areas. Clim. Past 2013, 9, 1–12. [Google Scholar] [CrossRef]
- Martín-Chivelet, J.; Muñoz-García, M.B.; Cruz, J.A.; Ortega, A.I.; Turrero, M.J. Speleothem Architectural Analysis: Integrated approach for stalagmite-based paleoclimate research. Sediment. Geol. 2017, 353, 28–45. [Google Scholar] [CrossRef]
- Frisia, S. Microstratigraphic logging of calcite fabrics in speleothems as tool for palaeoclimate studies. Int. J. Speleol. 2015, 44, 1–16. [Google Scholar]
- Muñoz-García, M.B.; Cruz, J.; Martín-Chivelet, J.; Ortega, A.I.; Turrero, M.J.; López-Elorza, M. Comparison of speleothem fabrics and microstratigraphic stacking patterns in calcite stalagmites as indicators of paleoenvironmental change. Quat. Int. 2016, 407, 74–85. [Google Scholar] [CrossRef]
- Krüger, Y.; Marti, D.; Staub, R.H.; Fleitmann, D.; Frenz, M. Liquid–vapour homogenisation of fluid inclusions in stalagmites: Evaluation of a new thermometer for palaeoclimate research. Chem. Geol. 2011, 289, 39–47. [Google Scholar] [CrossRef]
- Lopez-Elorza, M.; Muñoz-García, M.B.; González-Acebrón, L.; Martín-Chivelet, J. Fluid inclusión petrography in calcite stalagmites: Implications for entrapment processes. J. Sediment. Res. 2021, 91, 1206–1226. [Google Scholar] [CrossRef]
- Muñoz-García, M.B.; López-Arce, P.; Fernández-Valle, M.E.; Martín-Chivelet, J.; Fort, R. Porosity and hydric behavior of typical calcite microfabrics in stalagmites. Sediment. Geol. 2012, 265–266, 72–86. [Google Scholar] [CrossRef][Green Version]
- Sander, T.; Marx, T.; Engel, J.; Aeschbach-Hertig, W. Reproducibility and accuracy of noble gas measurements on water samples in the microlite range. Rapid Commun. Mass Spectrom. 2014, 28, 42–48. [Google Scholar] [CrossRef]
- Wieser, M. Imprints of Climatic And Environmental Change in a Regional Aquifer System in an Arid Part of India Using Noble Gases and Other Environmental Tracers. Ph.D. Dissertation, Universität Heidelberg, Heidelberg, Germany, 2011. [Google Scholar]
- Aeschbach-Hertig, W.; El-Gamal, H.; Wieser, M.; Palcsu, L. Modeling excess air and degassing in groundwater by equilibrium partitioning with a gas phase. Water Resour. Res. 2008, 44, W08449. [Google Scholar] [CrossRef]
- Kendall, A.C.; Broughton, P.L. Origin of fabrics in speleothems composed of columnar calcite crystals. J. Sediment. Petrol. 1978, 48, 519–538. [Google Scholar]
- Muñoz-García, M.B.; López-Arce, P.; Fernández-Valle, M.E.; Dewanckele, J.; Martín-Chivelet, J.; Fort, R.; Cnudde, V. Weathering of speleothems: Study of diagenesis with non-destructive techniques. In EGU General Assembly Conference Abstracts, Proceedings of the EGU General Assembly 2012, Vienna, Austria, 22–27 April 2012; European Geoscience Union: Vienna, Austria, 2012; p. 9016. [Google Scholar]
- Frisia, S.; Borsato, A.; Drysdale, R.N.; Paul, B.; Greig, A.; Cotte, M. A re-evaluation of the palaeoclimatic significance of phosphorus variability in speleothems revealed by high-resolution synchrotron micro XRF mapping. Clim. Past 2012, 8, 2039–2051. [Google Scholar] [CrossRef]
- Lopez-Elorza, M.; Muñoz-García, M.B.; González-Acebrón, L.; Martín-Chivelet, J. Petrografía de inclusiones fluidas en espeleotemas: Comparación con calcitas no espeleotémicas. Geotemas 2016, 16, 625–628. [Google Scholar]
- Schwarcz, H.P.; Harmon, R.S.; Thompson, P.; Ford, D.C. Stable isotope studies of fluid inclusions in speleothems and their paleoclimatic significance. Geochim. Cosmochim. 1976, 40, 657–665. [Google Scholar] [CrossRef]
- Verheyden, S.; Genty, D.; Cattani, O.; Van Breukelen, M.R. Water release patterns of heated speleothem calcite and hydrogen isotope composition of fluid inclusions. Chem. Geol. 2008, 247, 266–281. [Google Scholar] [CrossRef]
- Scheidegger, Y.; Badertscher, S.V.; Driesner Th Wieler, R.; Heber, V.S.; Kipfer, R. Microscopical speleothem calcite investigations proofing the existence of two different types of fluid inclusions. Geophys. Res. Abstr. 2007, 9, 06374. [Google Scholar]
- Gyóri, O.; Orbán, R.; Mindszenty, A.; Fodor, L.; Poros, Z.; Eróss, A.; Benkó; Zs Molnár, F. Red calcites: An indicator of paleo-karst system associated with bauxitic unconformities. Geofluids 2014, 14, 459–480. [Google Scholar] [CrossRef]
- Labuhn, I.; Genty, D.; Vonhof, H.; Boudin, C.; Blamart, D.; Douville, E.; Ruan, J.; Cheng, H.; Edwards, R.L.; Pons-Branchu, E.; et al. A high-resolution fluid inclusion δ18O record from a stalagmite in SW France: Modern calibration and comparison with multiple proxies. Quat. Sci. Rev. 2015, 110, 152–165. [Google Scholar] [CrossRef]
- Goldstein, R.H. Reequilibration of fluid inclusions in low-temperature calcium-carbonate cemente. Geology 1986, 14, 792–795. [Google Scholar] [CrossRef]
- Krüger, Y.; Fleitmann, D.; Frenz, M. Paleotemperatures from fluid inclusions liquid-vapor homogenization in speleothems. PAGES New 2008, 16, 13–14. [Google Scholar] [CrossRef]
- Bodnar, R. Reequilibration of fluid inclusions. In Fluid Inclusions: Analysis and Interpretation; Samson, I., Anderson, A., Marshall, D., Eds.; Mineralogical Association of Canada: Québec, QC, Canada, 2003; pp. 213–230. [Google Scholar]
- Goldstein, R.H.; Reynolds, T.J. Systematics of fluid inclusions in diagenetic minerals. In SEPM Short Course Notes; Society for Sedimentary Geology: Tulsa, OK, USA, 1994. [Google Scholar]
- McLimans, R.K. The application of fluid inclusions to migration of oil and diagenesis in petroleum reservoirs. Appl. Geochem. 1987, 2, 585–603. [Google Scholar] [CrossRef]
- Lopez-Elorza, M. Microestratigrafía de Inclusiones Fluidas en Espeleotemas Pleistocenos de la Cueva de Tortero (Valencia) y su Uso en Paleoclimatología. Ph.D. Dissertation, Complutense University, Madrid, Spain, 2019. [Google Scholar]
- Genty, D.; Plagnes, V.; Causse, C.; Cattani, O.; Stievenard, M.; Falourd, S.; Blamart, D.; Ouhadi, R.; Van-Exter, S. Fossil water in large stalagmite voids as a tool for paleoprecipitation stable isotope composition reconstitution and paleotemperature calculation. Chem. Geol. 2002, 184, 83–95. [Google Scholar] [CrossRef]
- Dennis, P.F.; Rowe, J.P.; Atkinson, C.T. The recovery and isotopic measurement of water from fluid inclusions in speleothems. Geochim. Cosmochim. Acta 2001, 65, 871–884. [Google Scholar] [CrossRef]
- Vonhof, H.B.; Van Breukelen, M.R.; Postman, O.; Rowe, P.J.; Atkinson, T.C.; Kroon, D. A continuous-flow crushing device for on-line δ2H analysis of fluid inclusion water in speleothems. Rapid Commun. Mass Spectrom. 2006, 20, 2553–2558. [Google Scholar] [CrossRef] [PubMed]
Disclaimer/Publisher’s Note: The statements, opinions and data contained in all publications are solely those of the individual author(s) and contributor(s) and not of MDPI and/or the editor(s). MDPI and/or the editor(s) disclaim responsibility for any injury to people or property resulting from any ideas, methods, instructions or products referred to in the content. |
© 2024 by the authors. Licensee MDPI, Basel, Switzerland. This article is an open access article distributed under the terms and conditions of the Creative Commons Attribution (CC BY) license (https://creativecommons.org/licenses/by/4.0/).