
Preconcentrating Ultrafine Ilmenite Tailings Using a Laboratory-Scale Reflux Classifier

 ,
, 
Abstract
1. Introduction
2. Theory
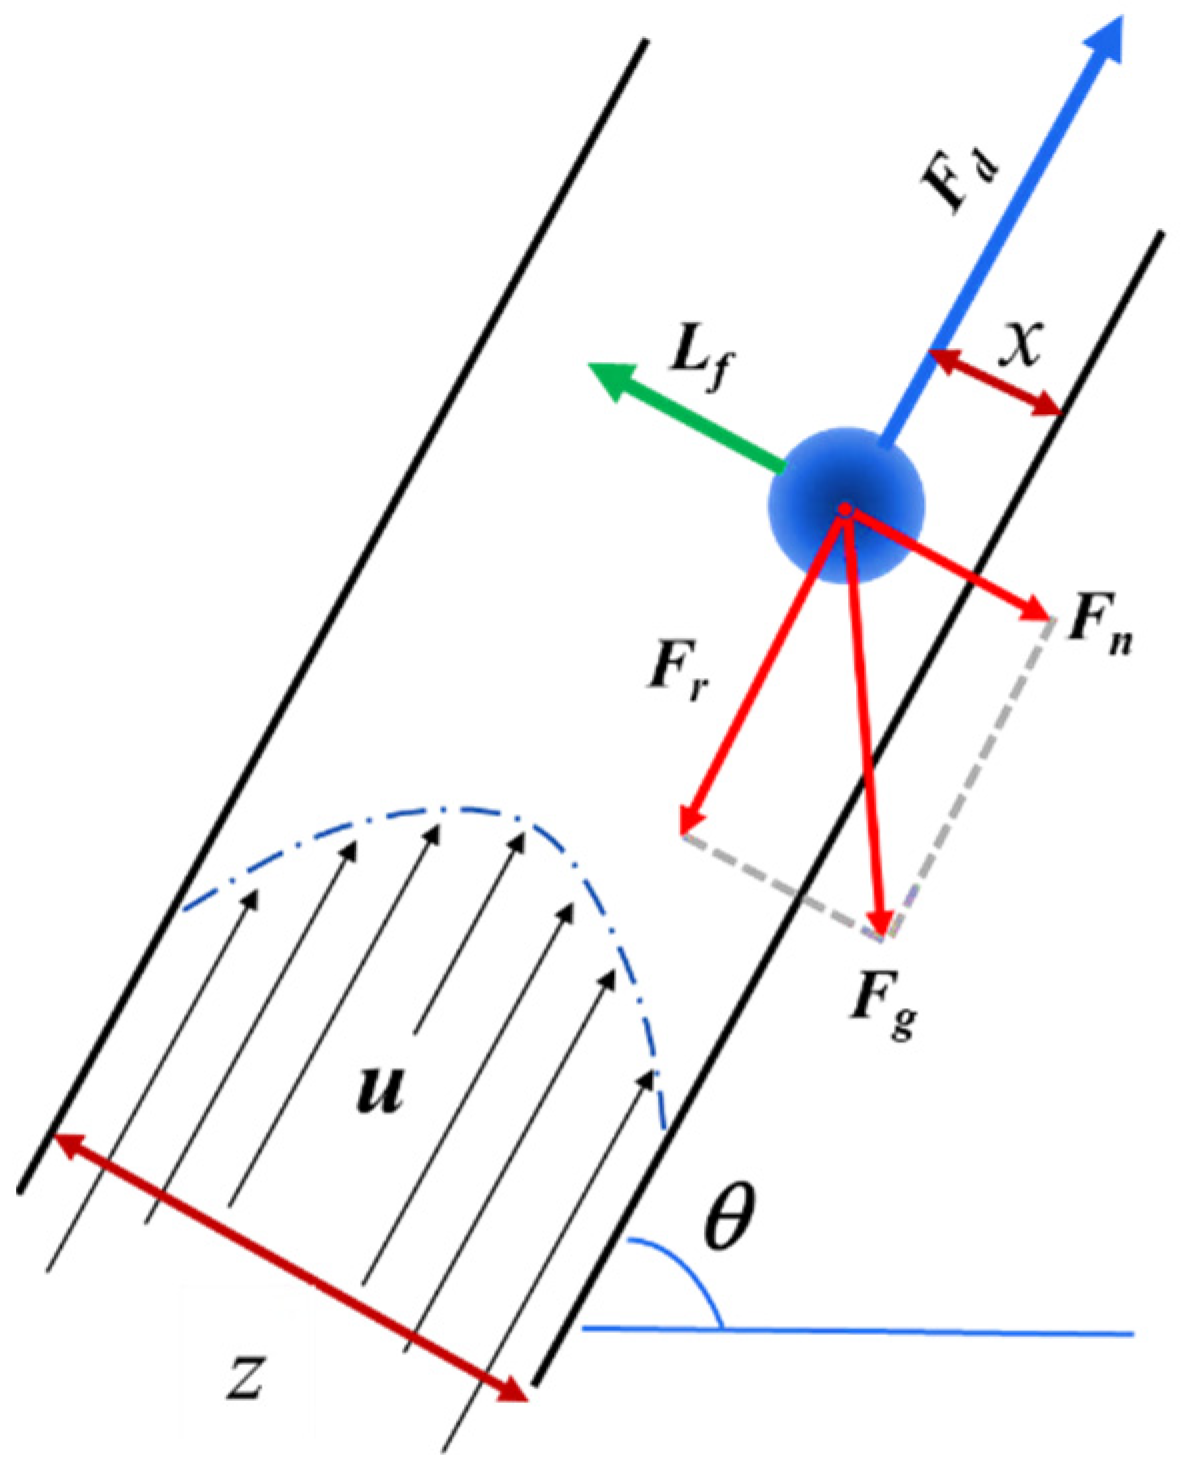
2.1. Hydrodynamic Model in the Fluidized Bed
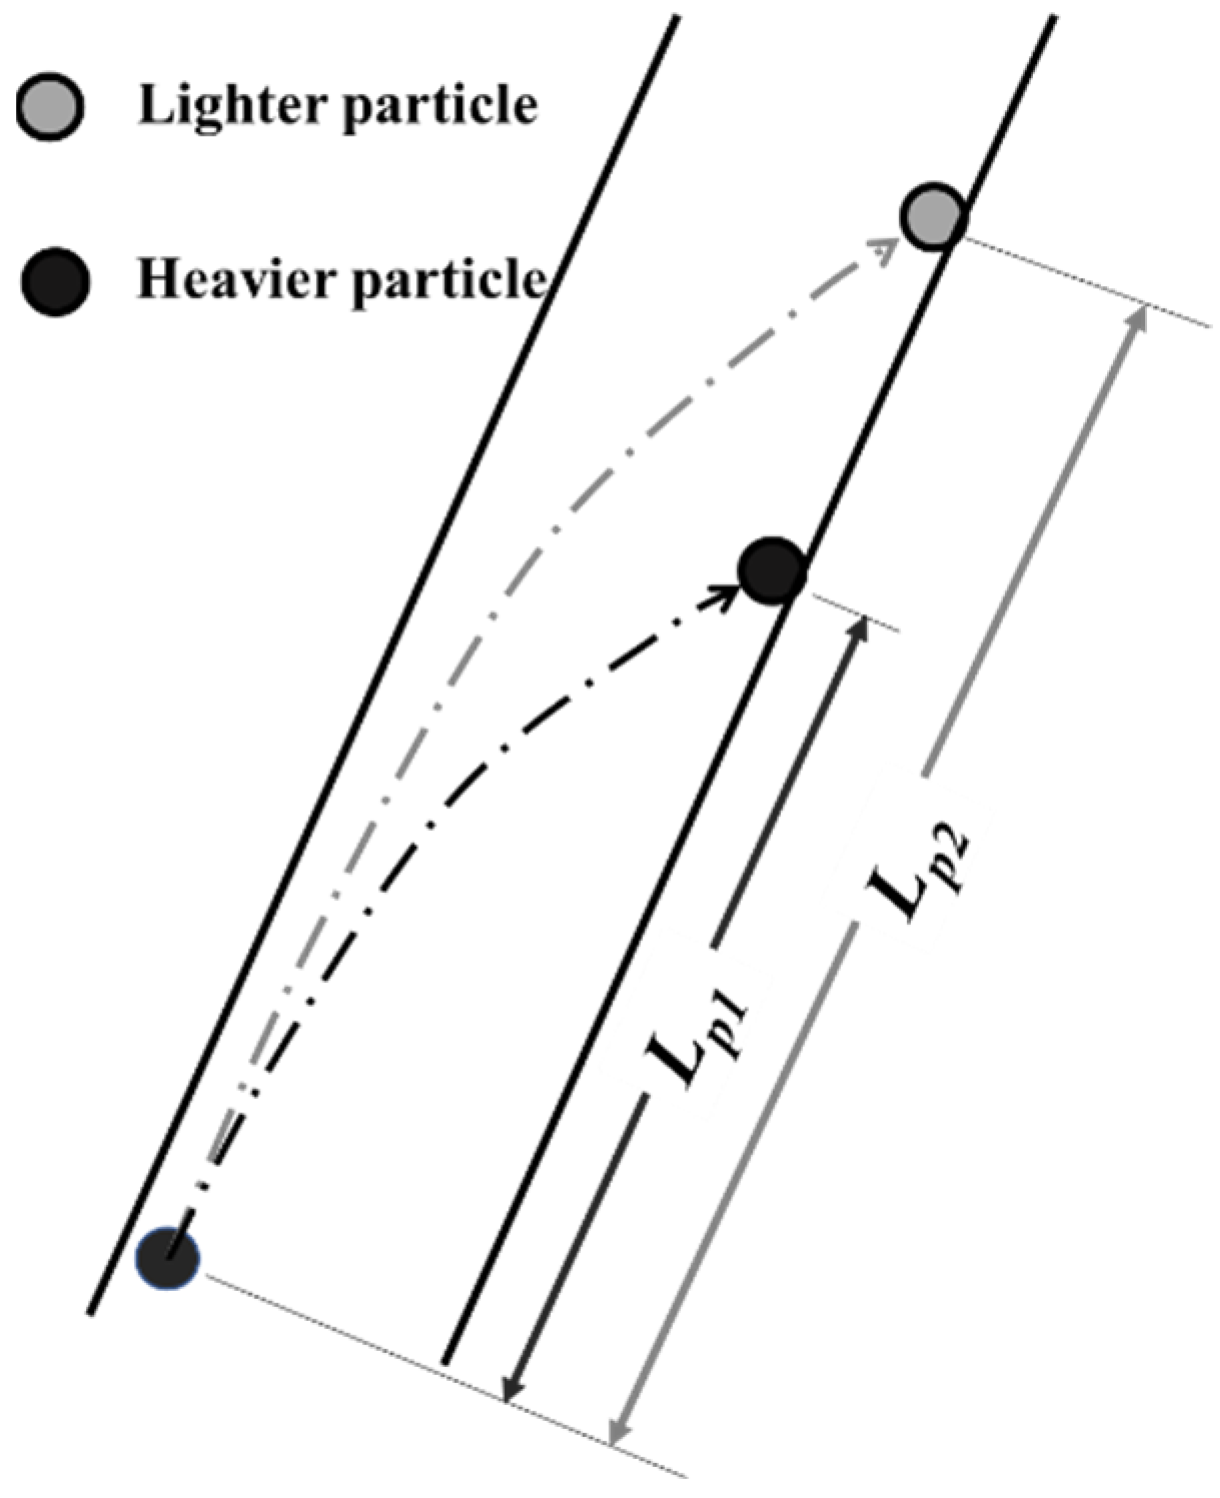
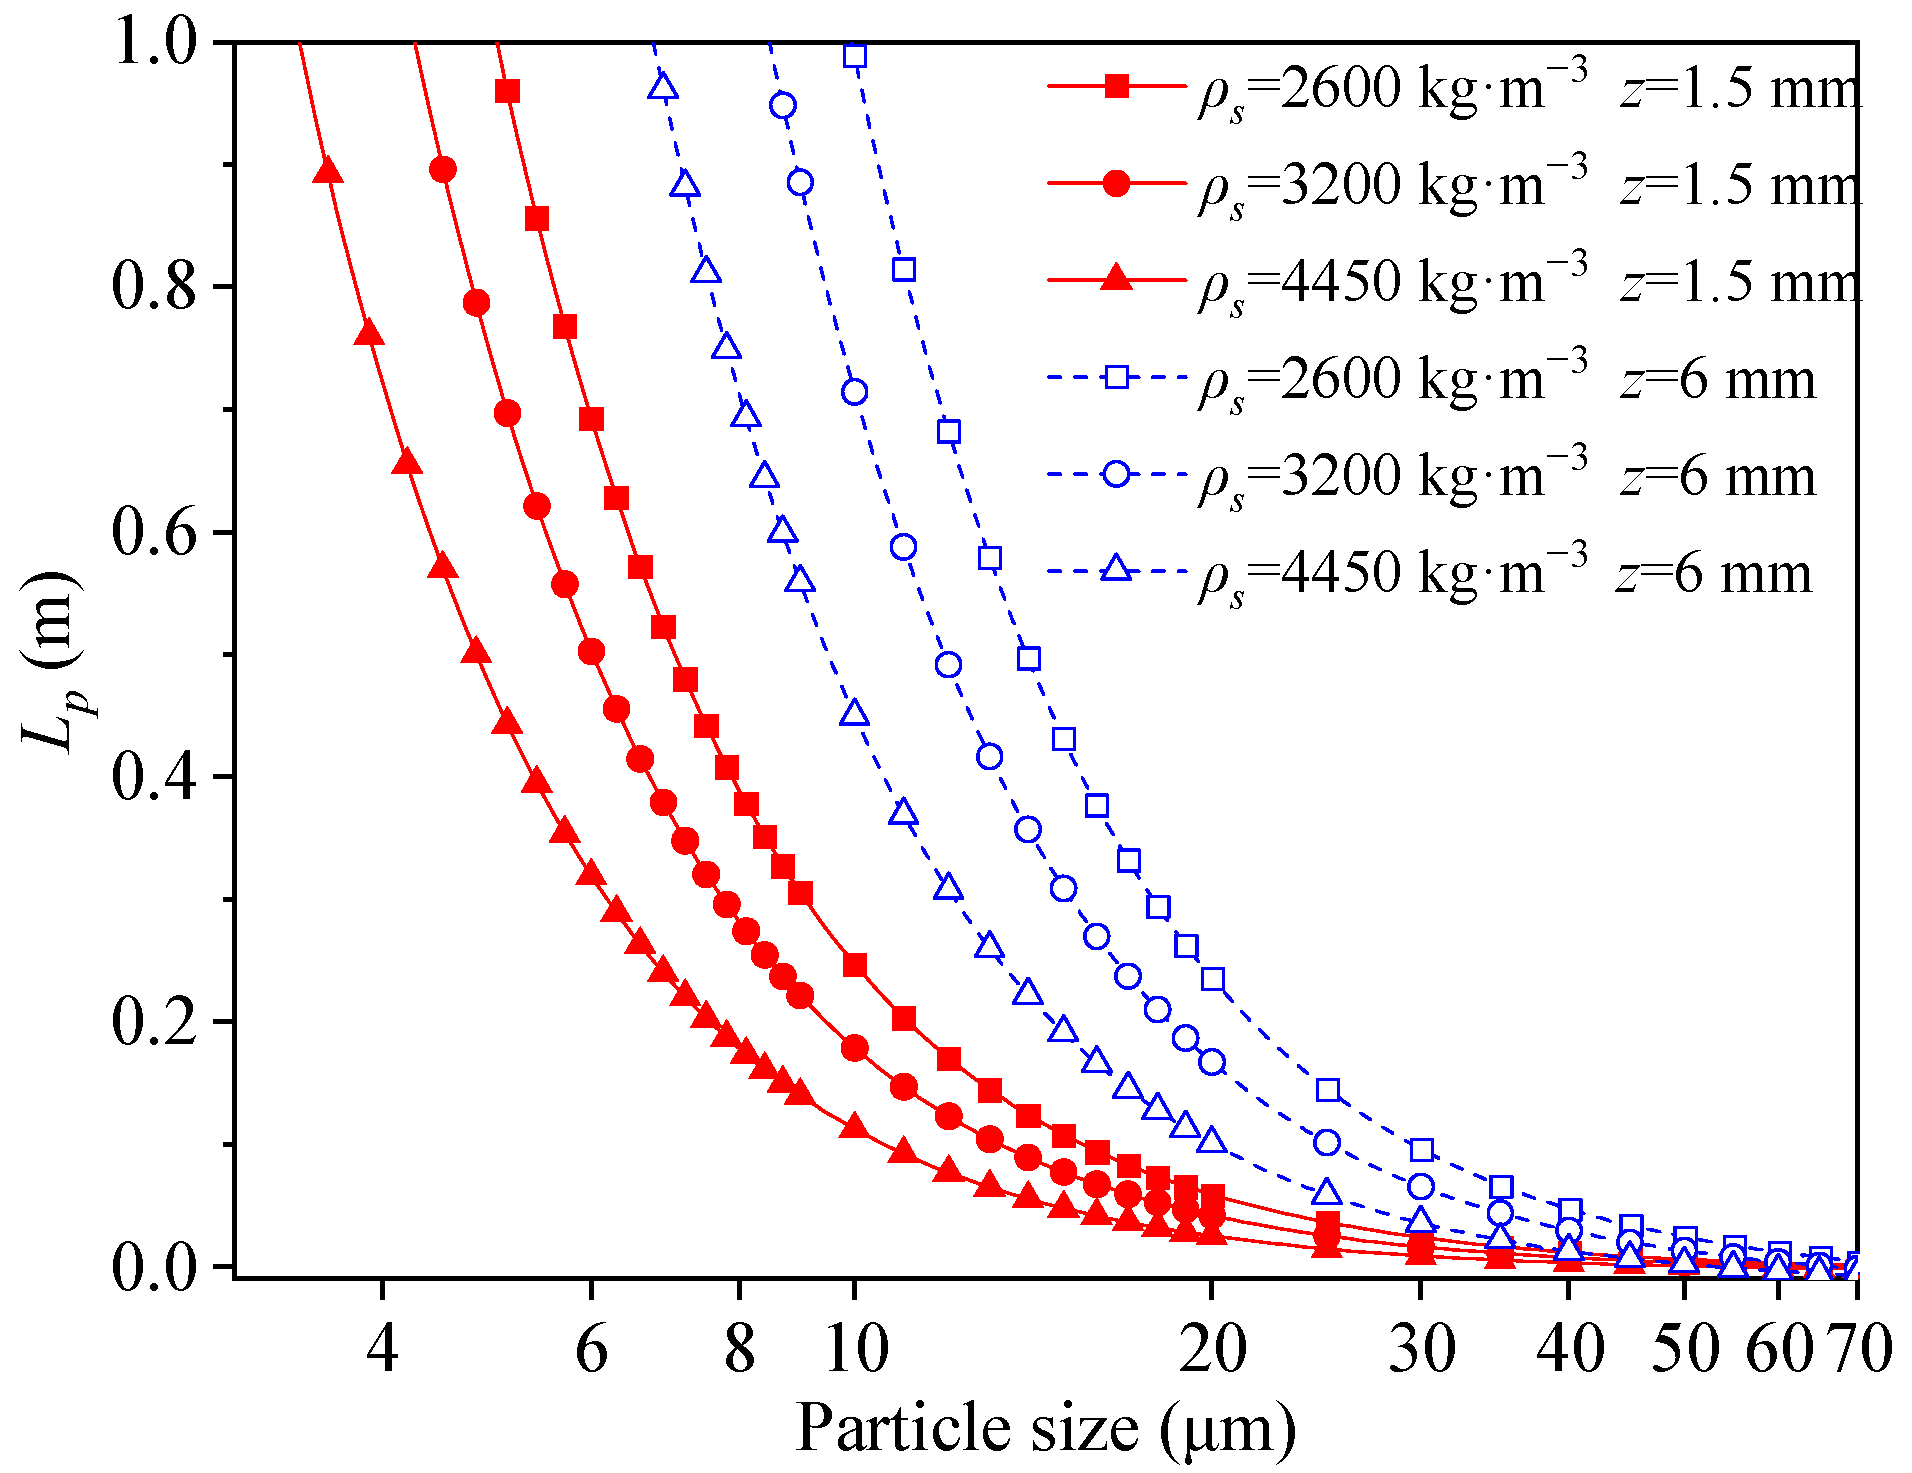
2.2. Hydrodynamic Model in the Inclined Channel
3. Experiment Design
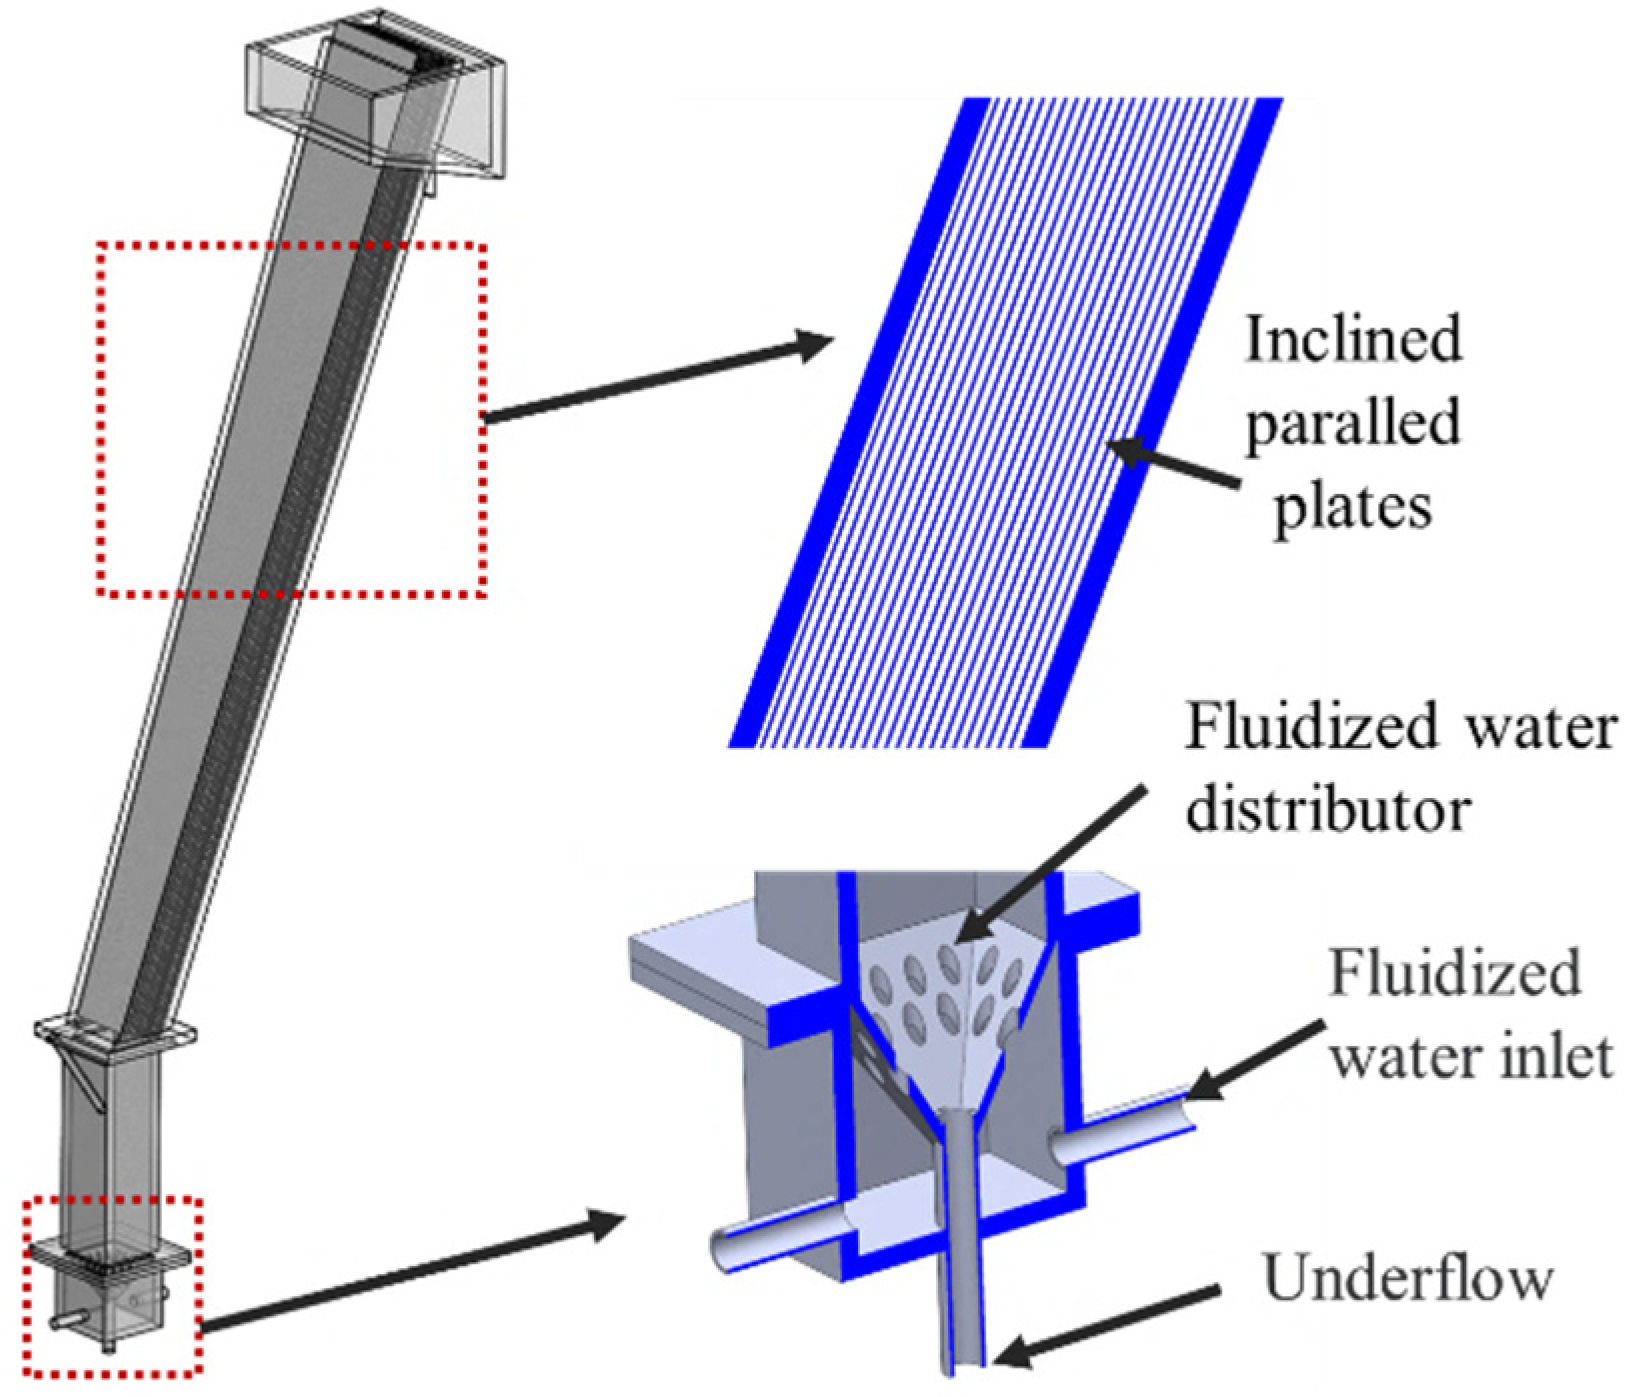
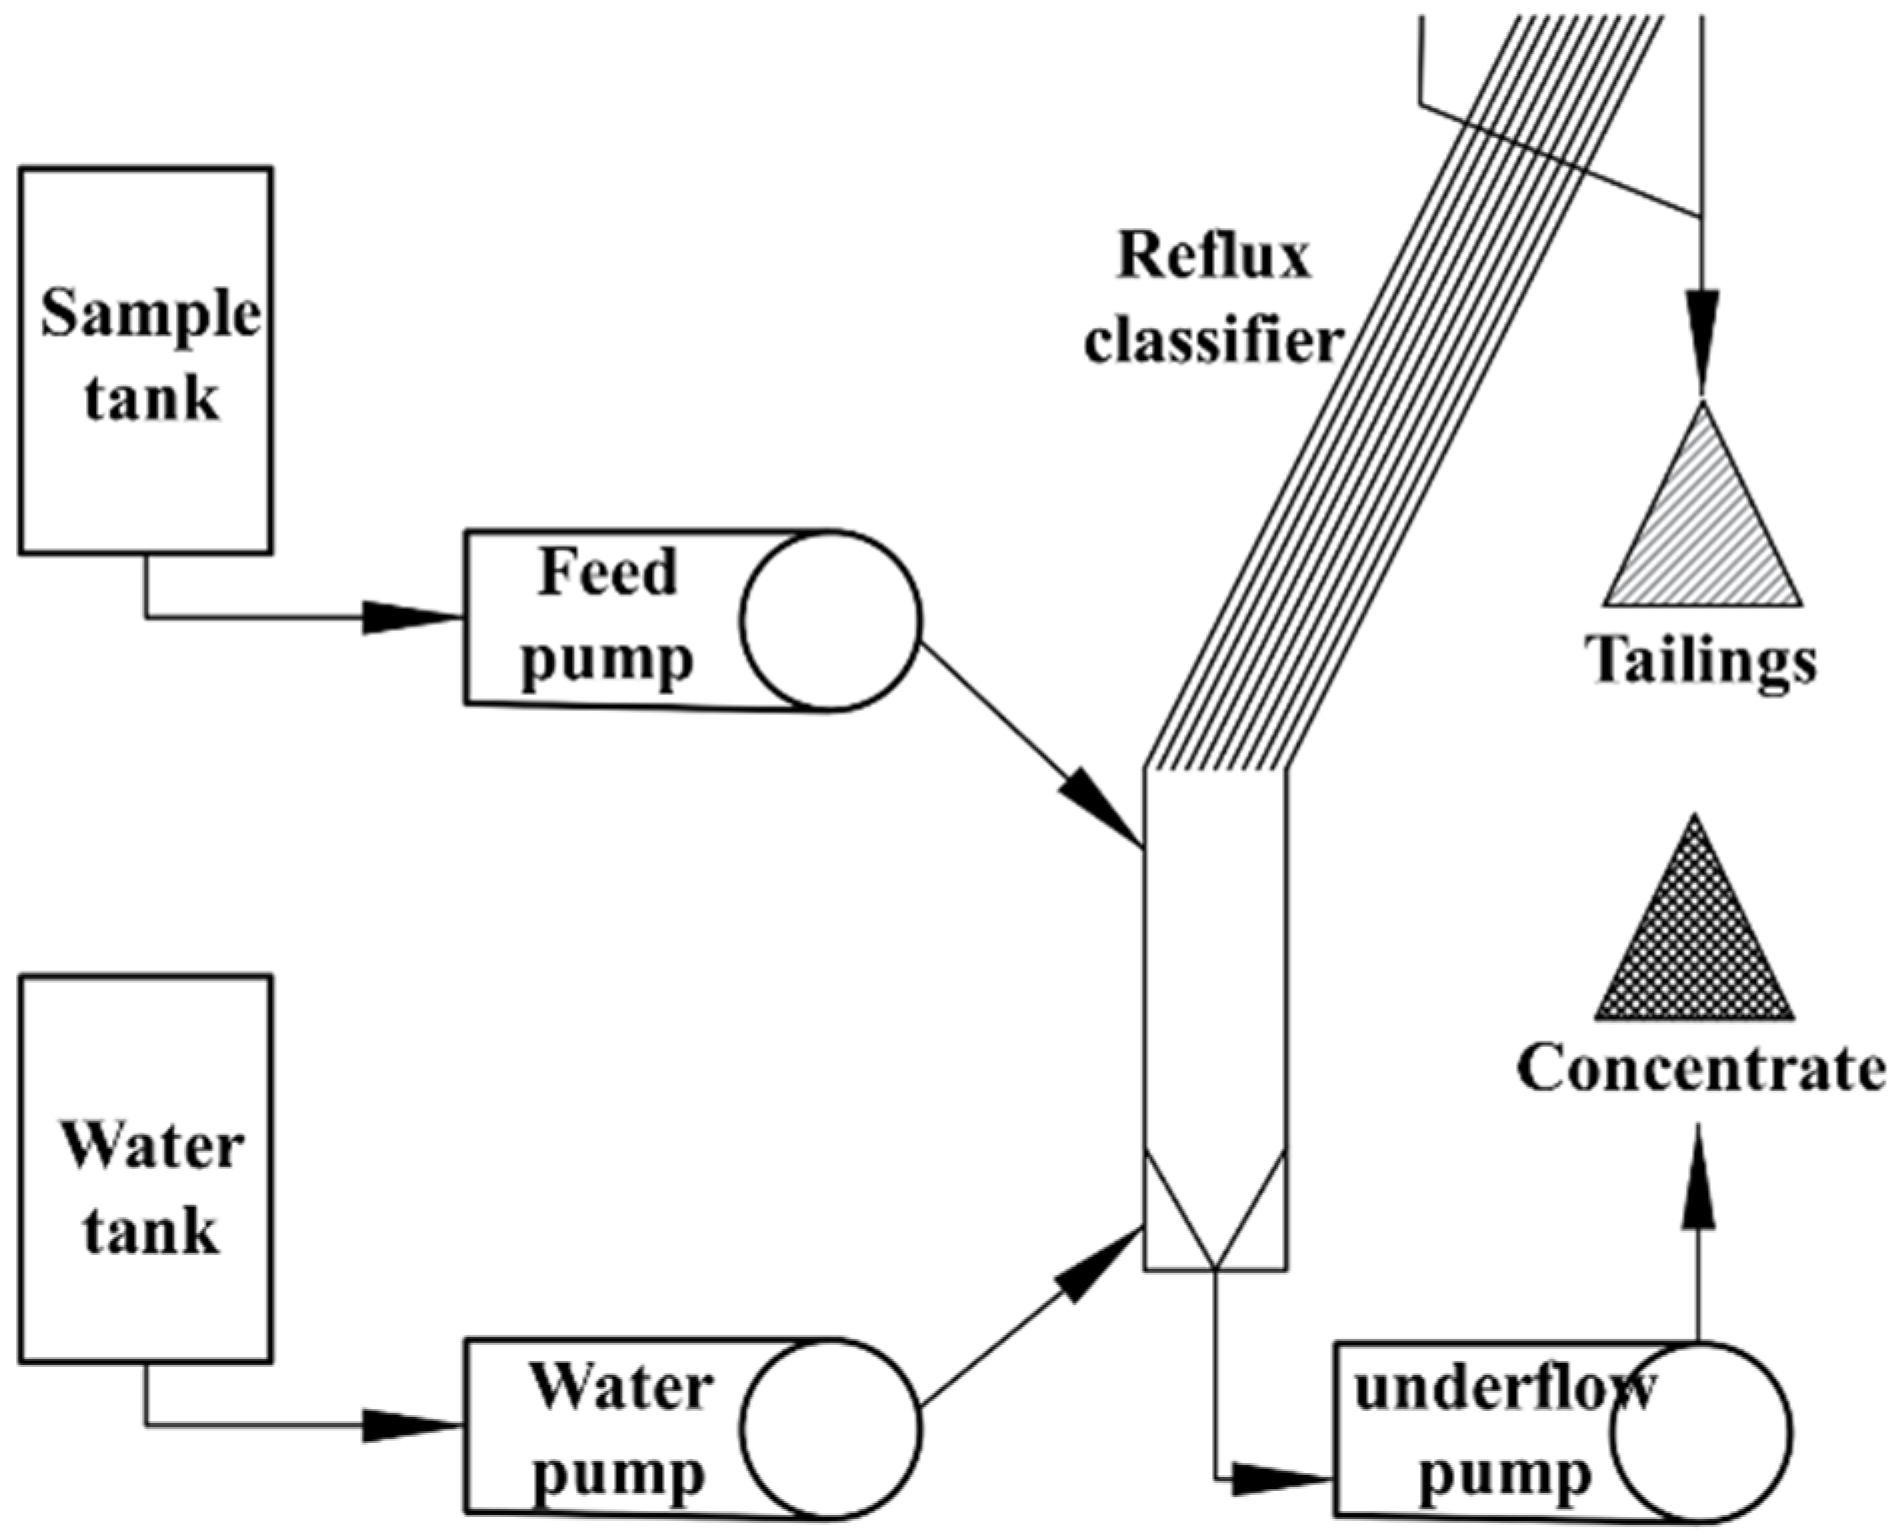
3.1. Equipment
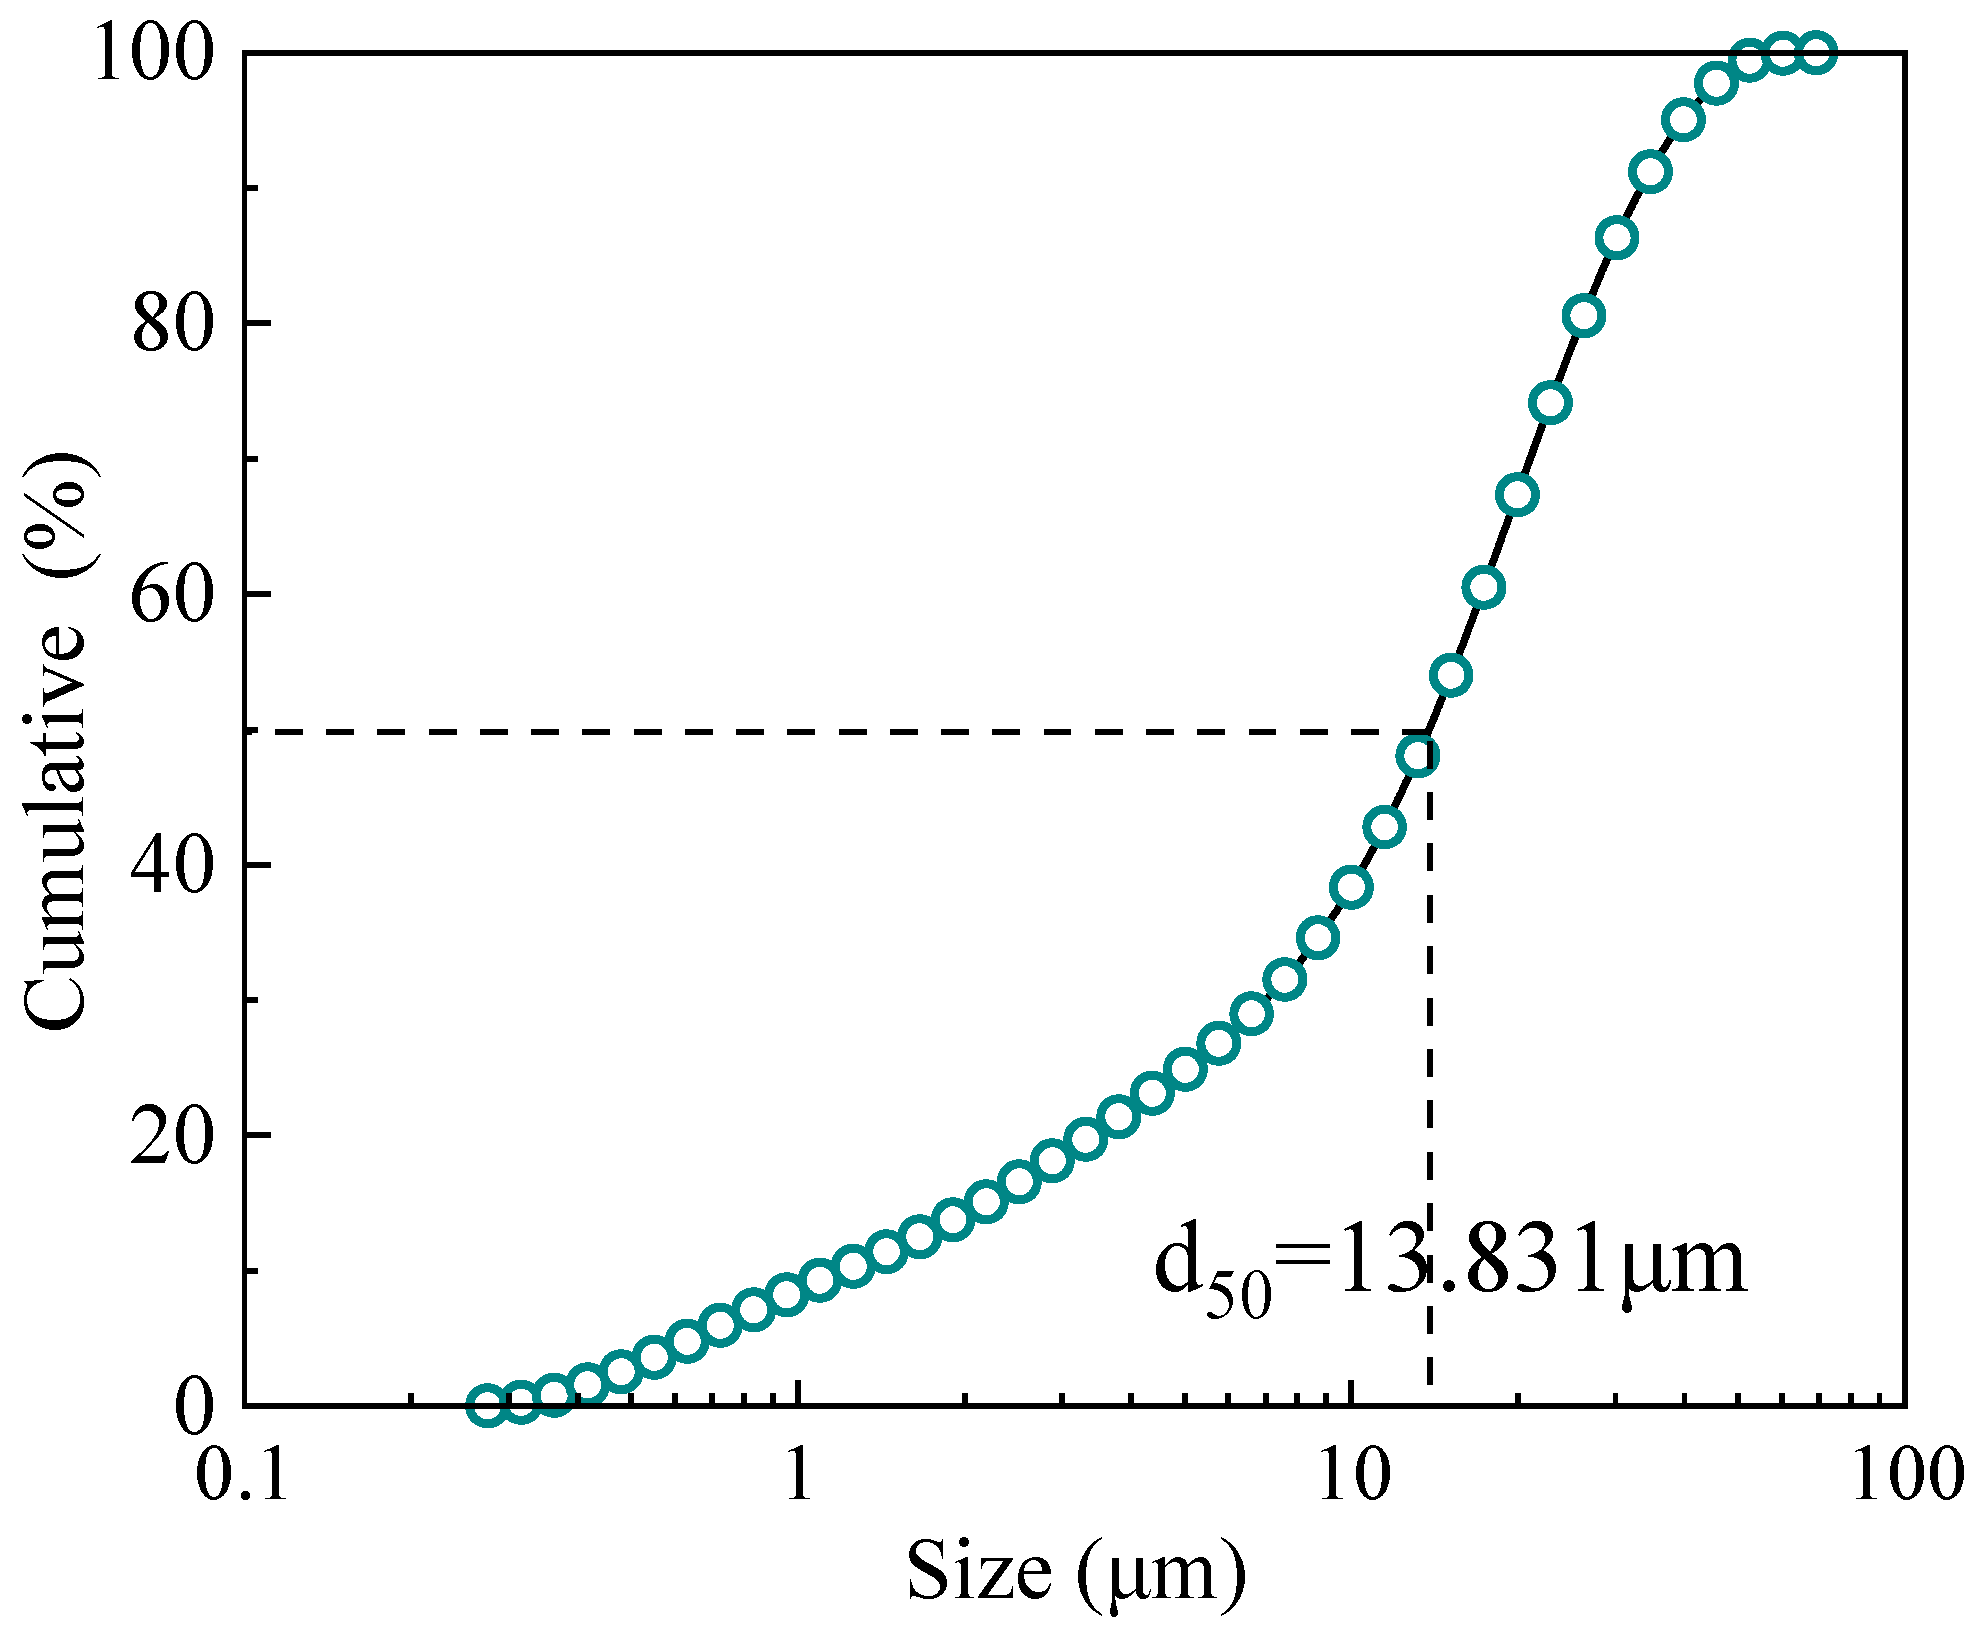
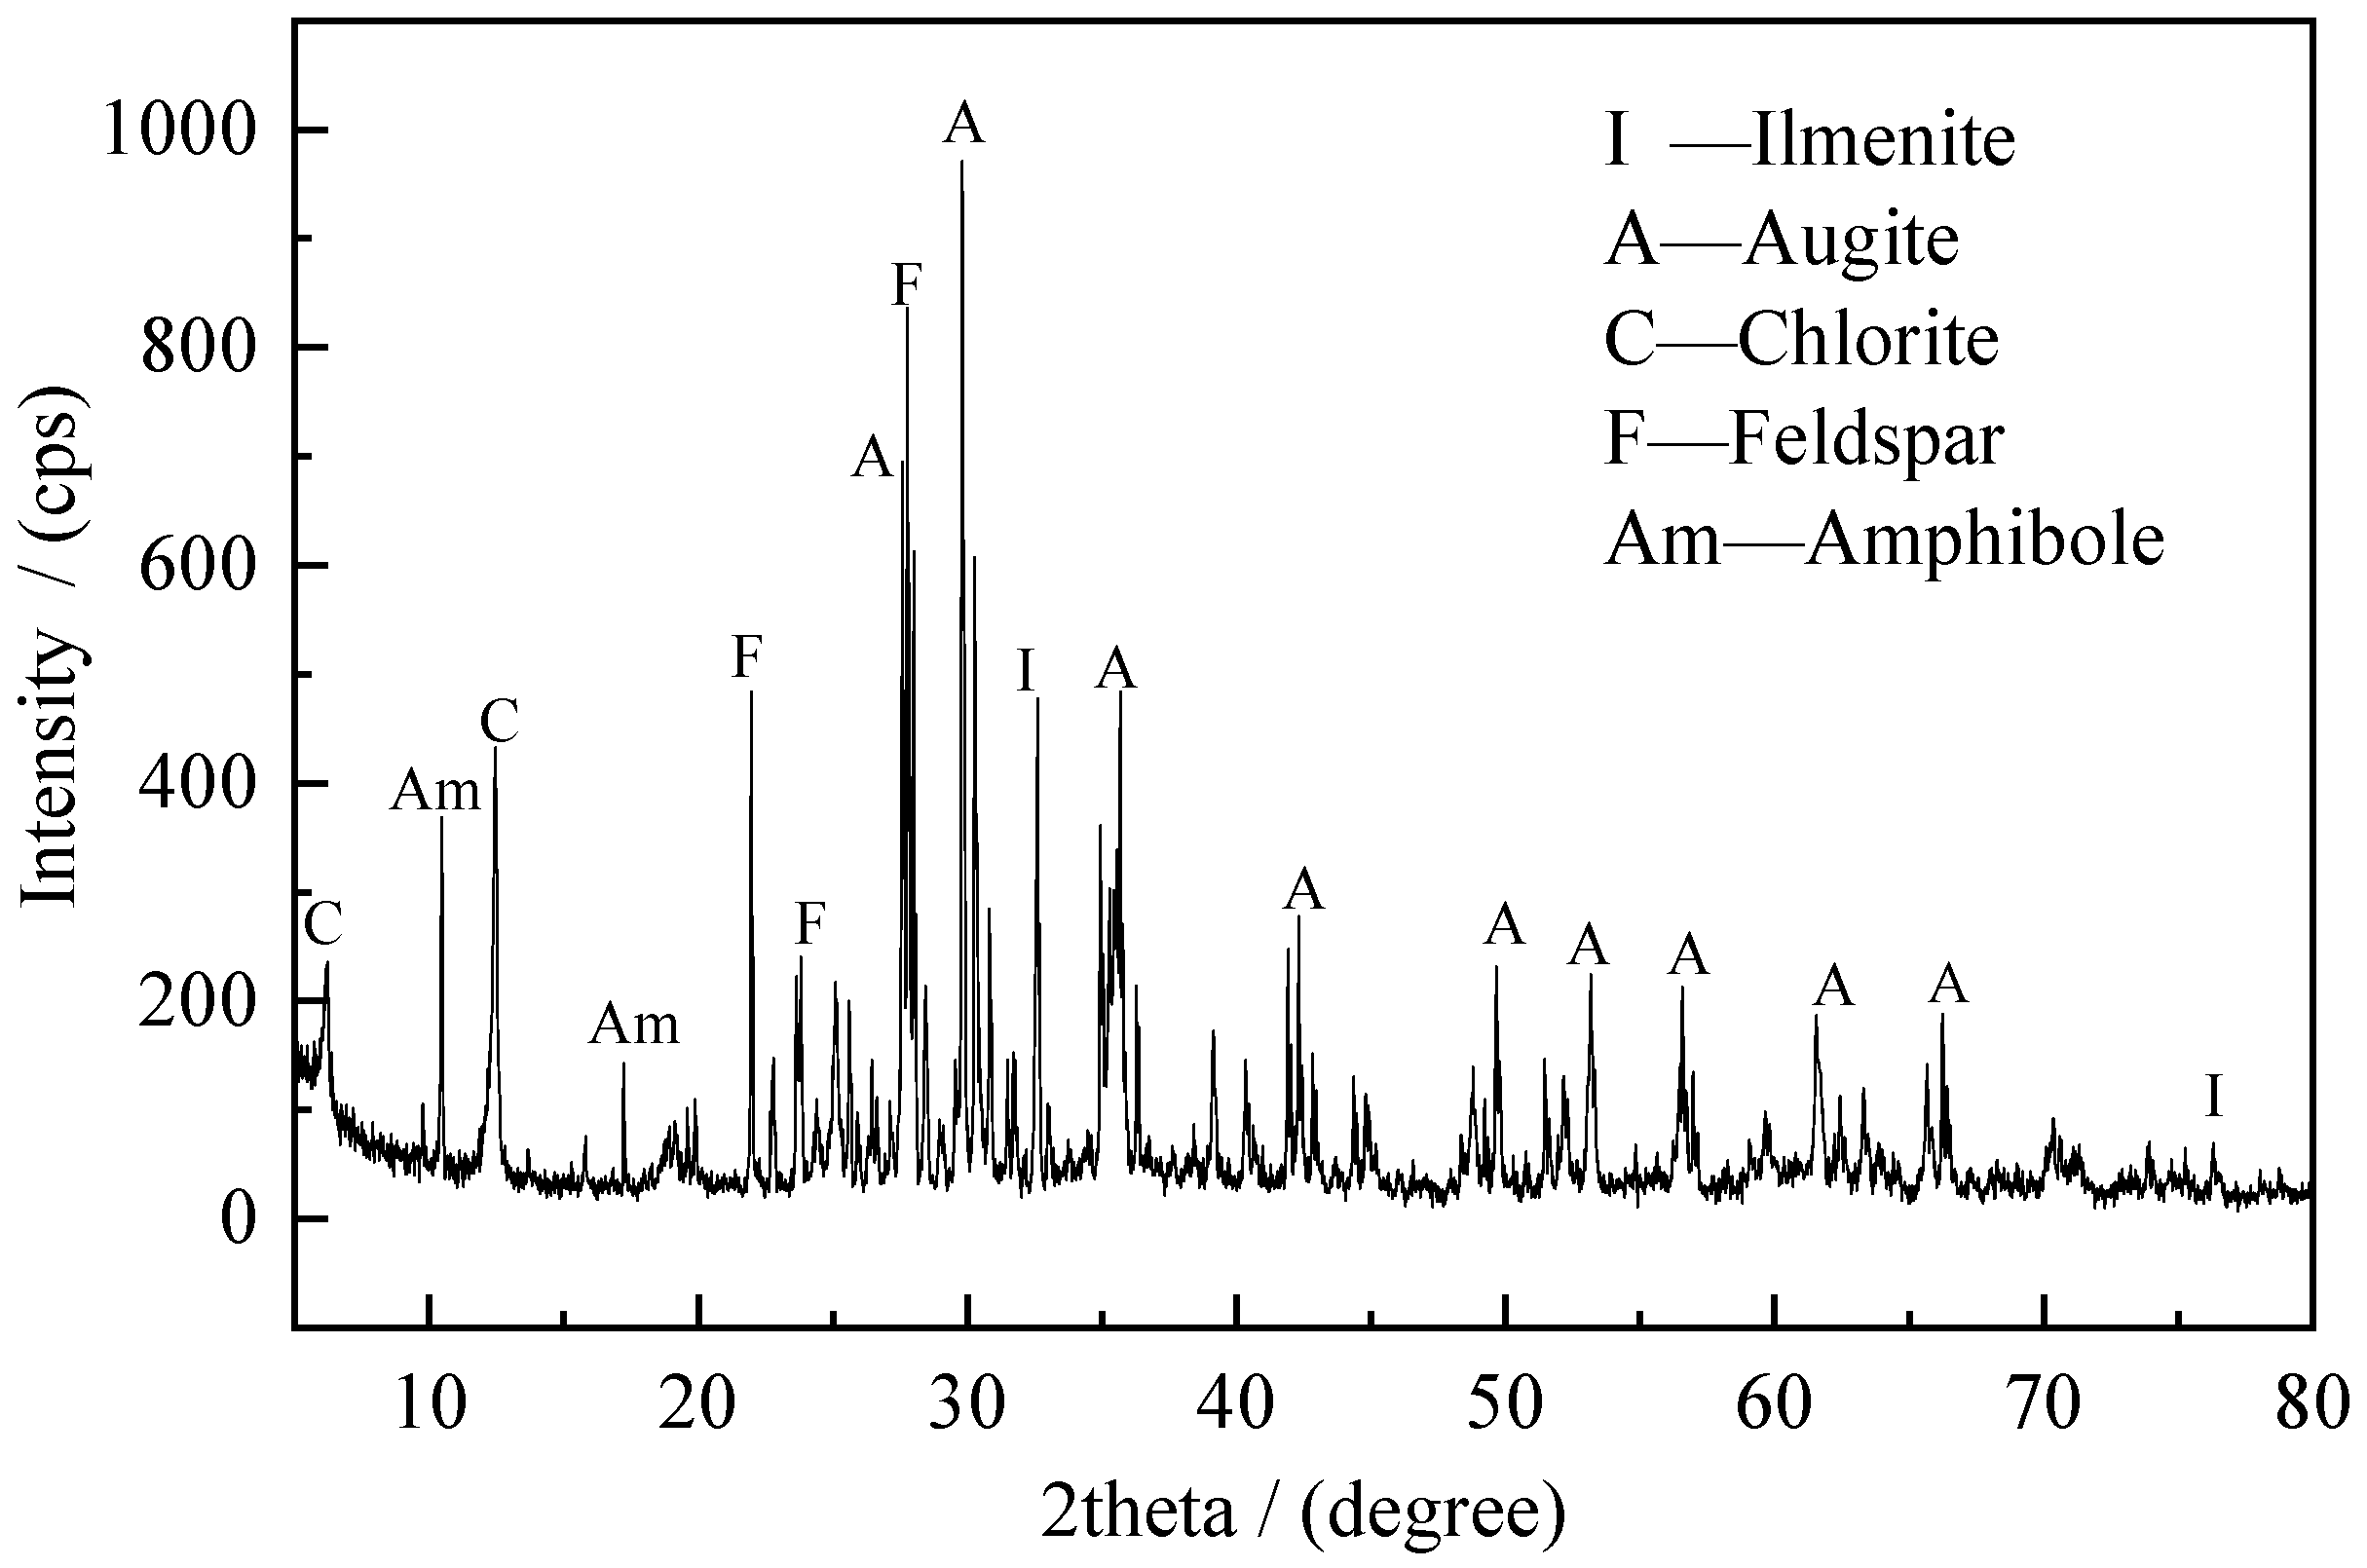
3.2. Sample
3.3. Method
4. Results
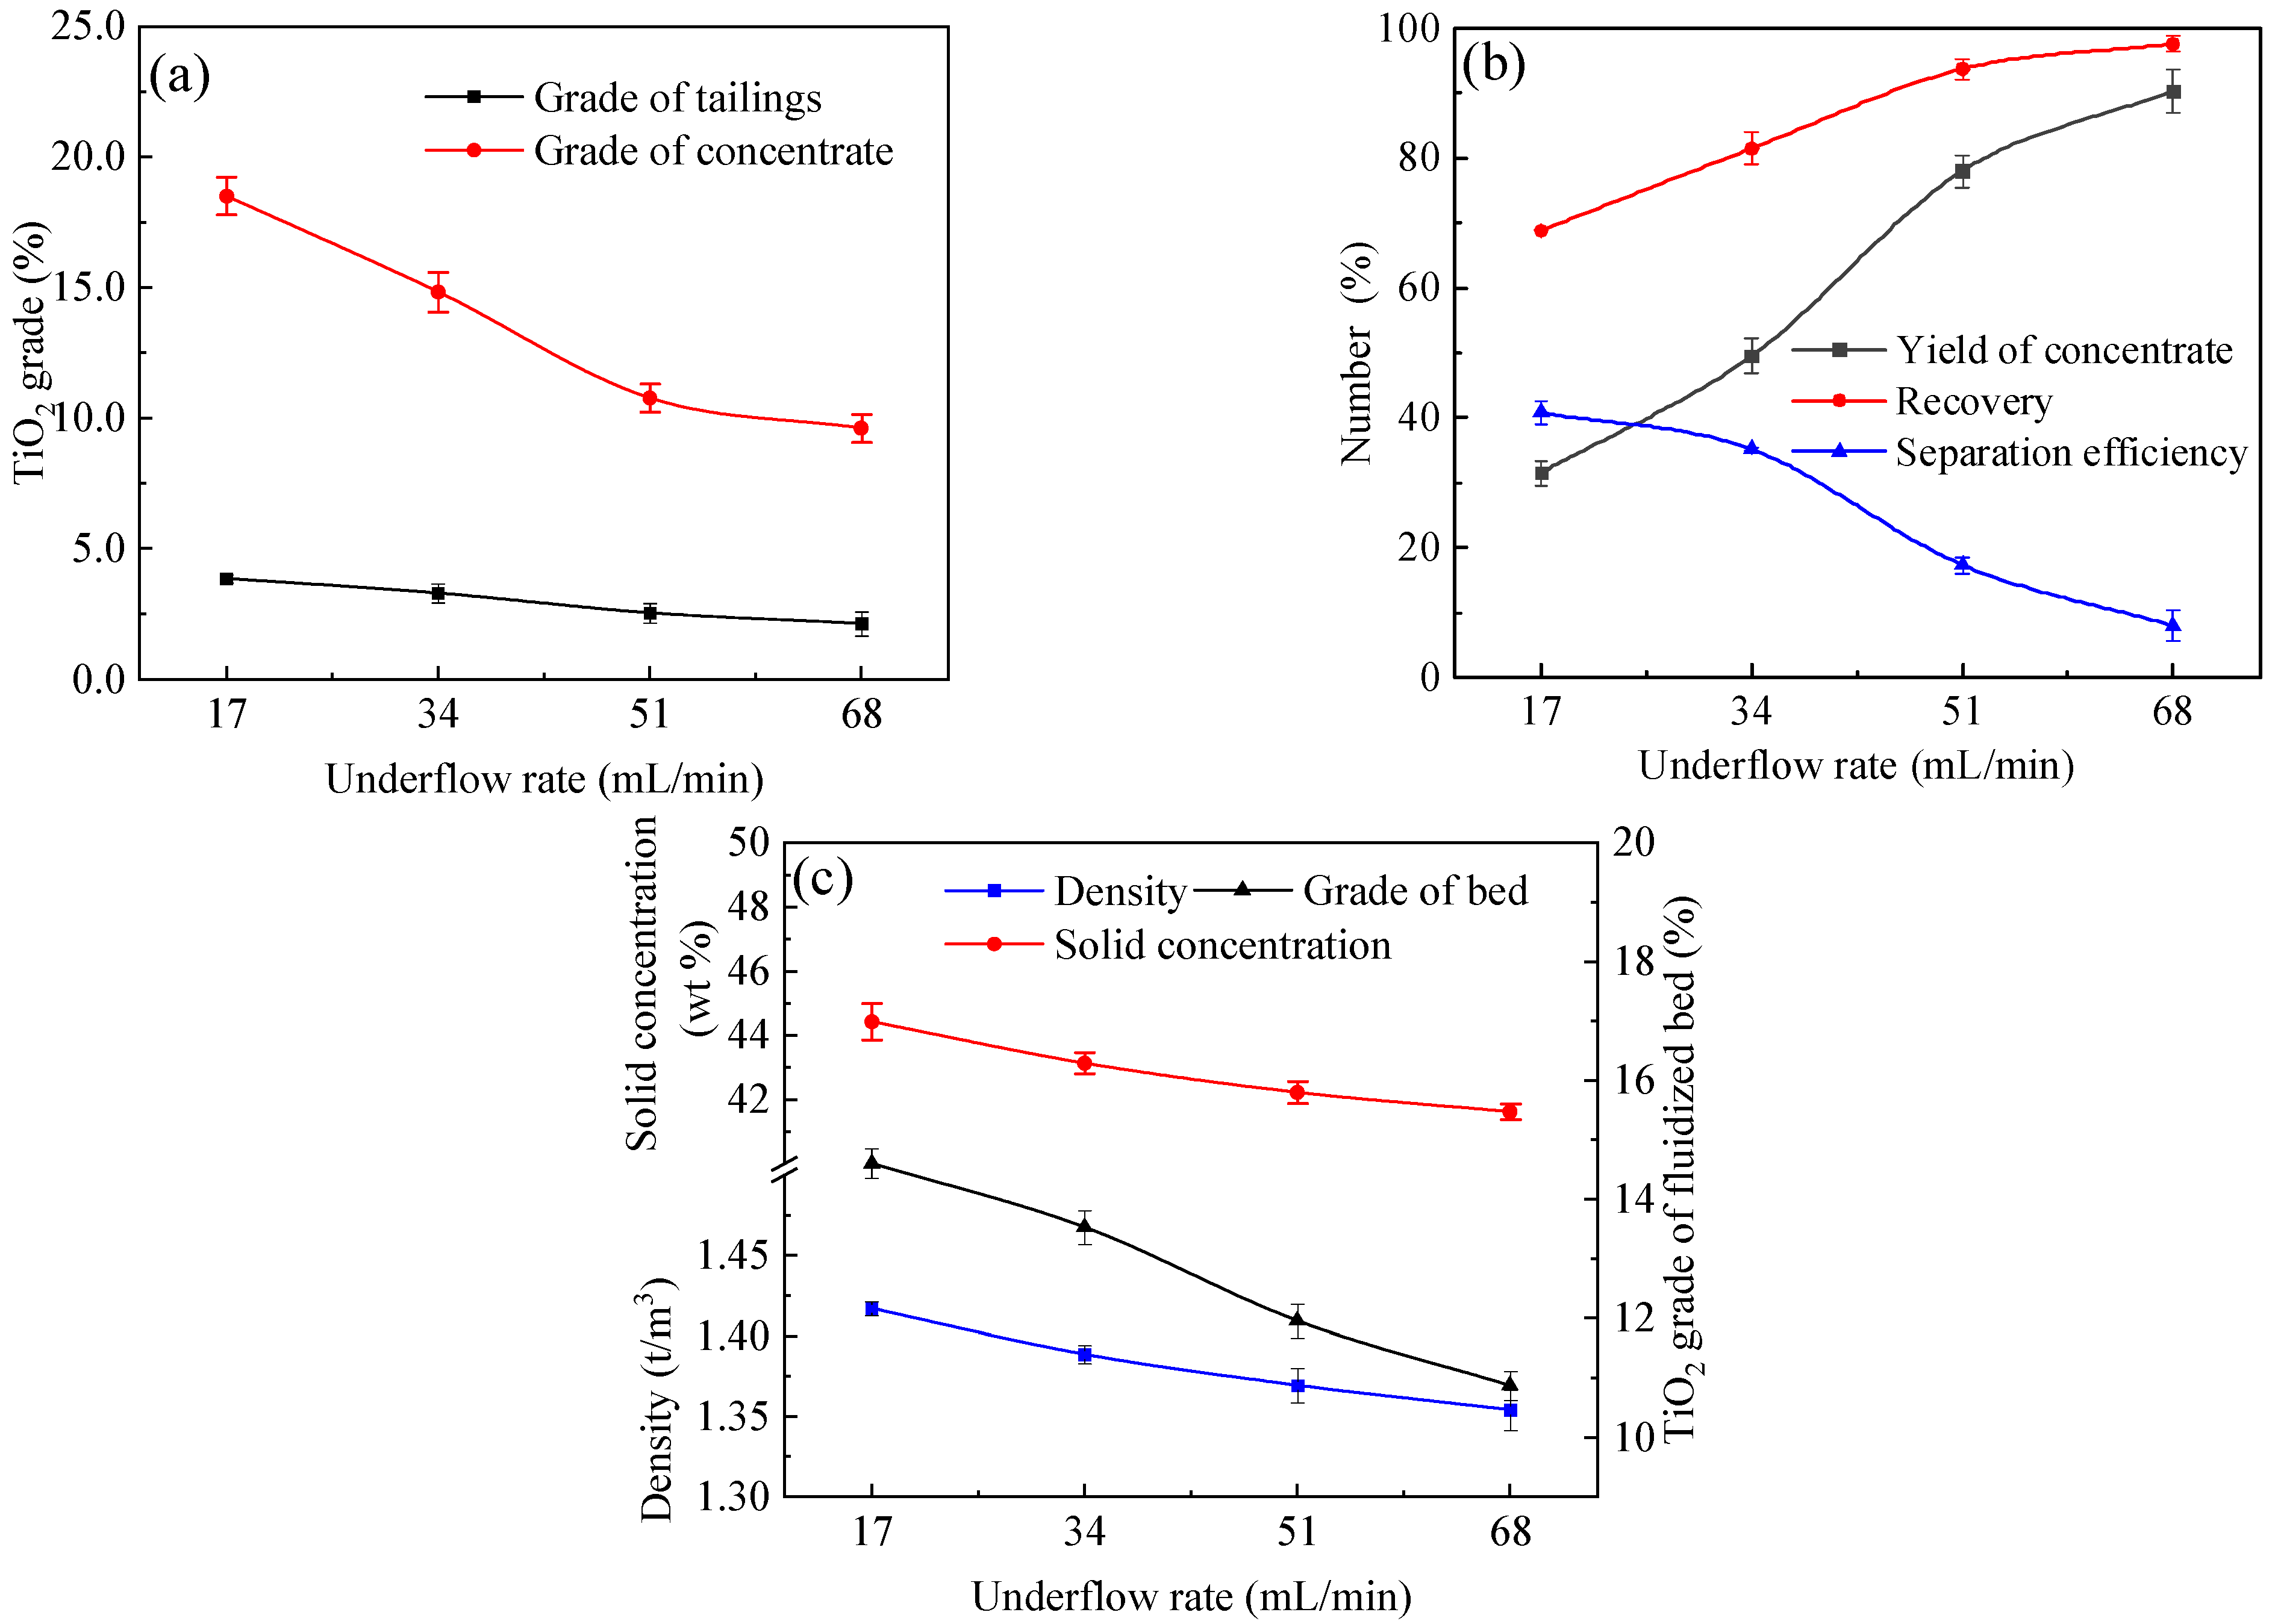
4.1. Effects of Underflow Rate
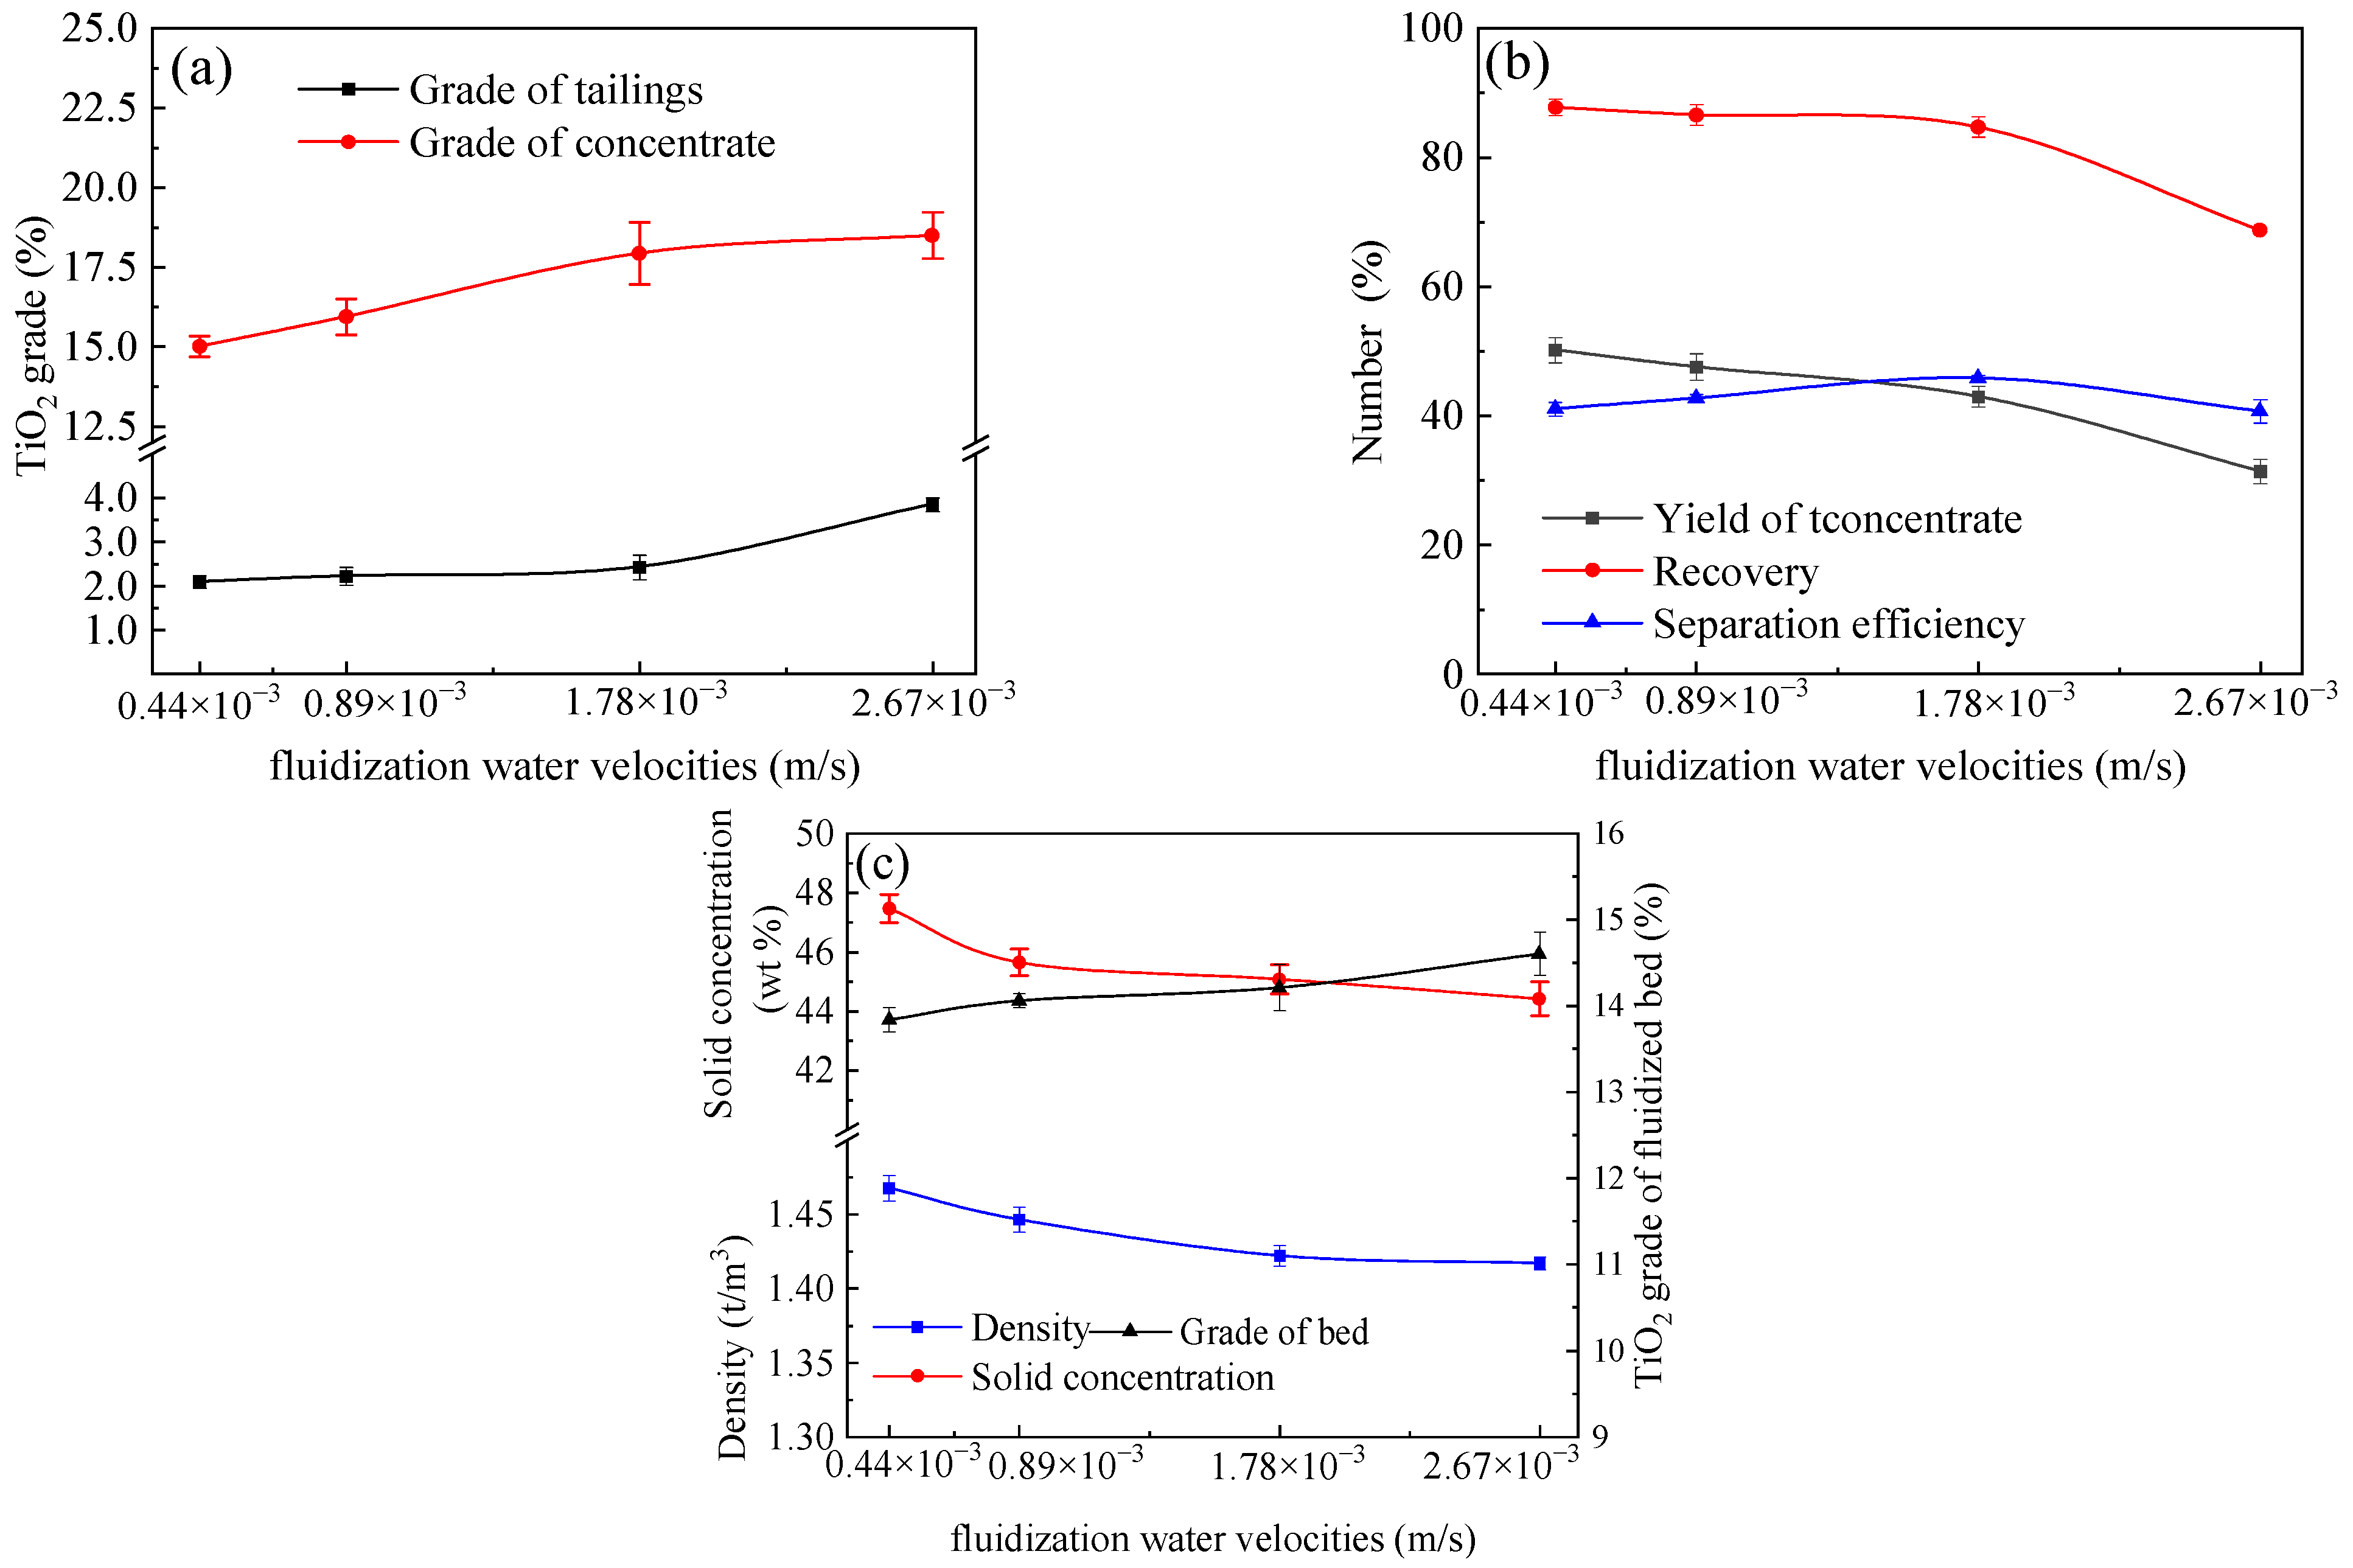
4.2. Effects of Fluidization Water Velocity
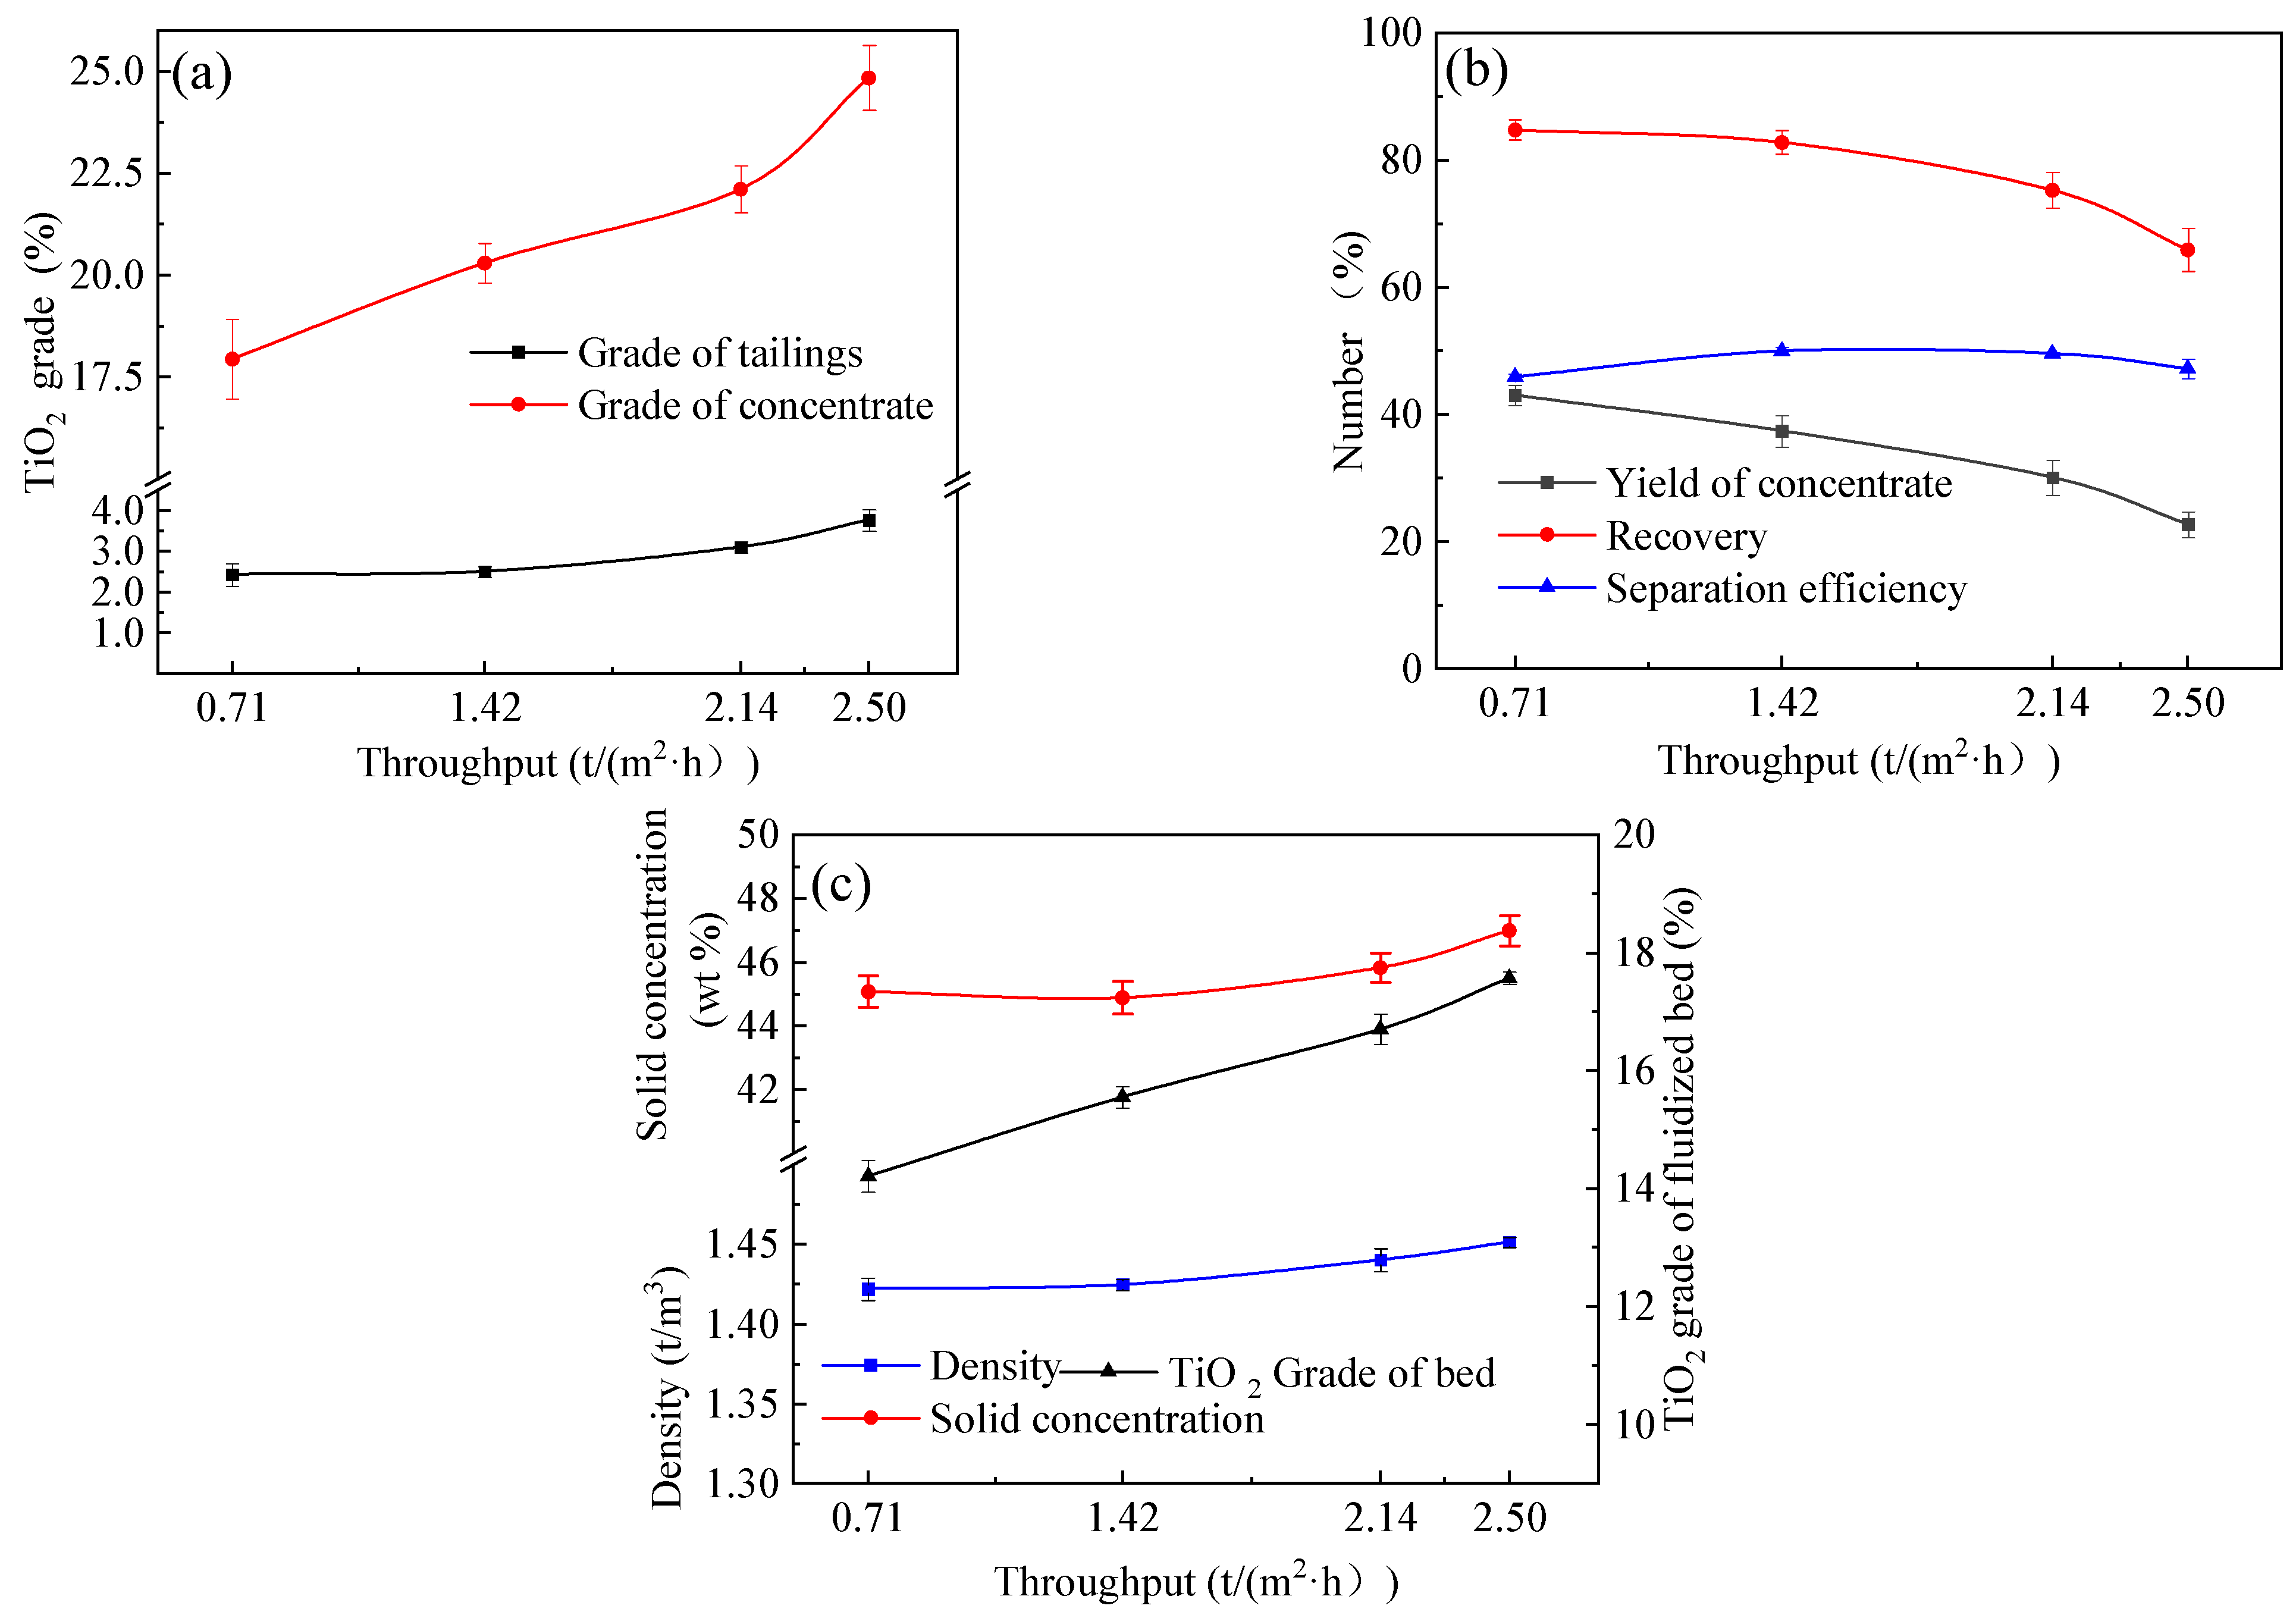
4.3. Effects of Throughput
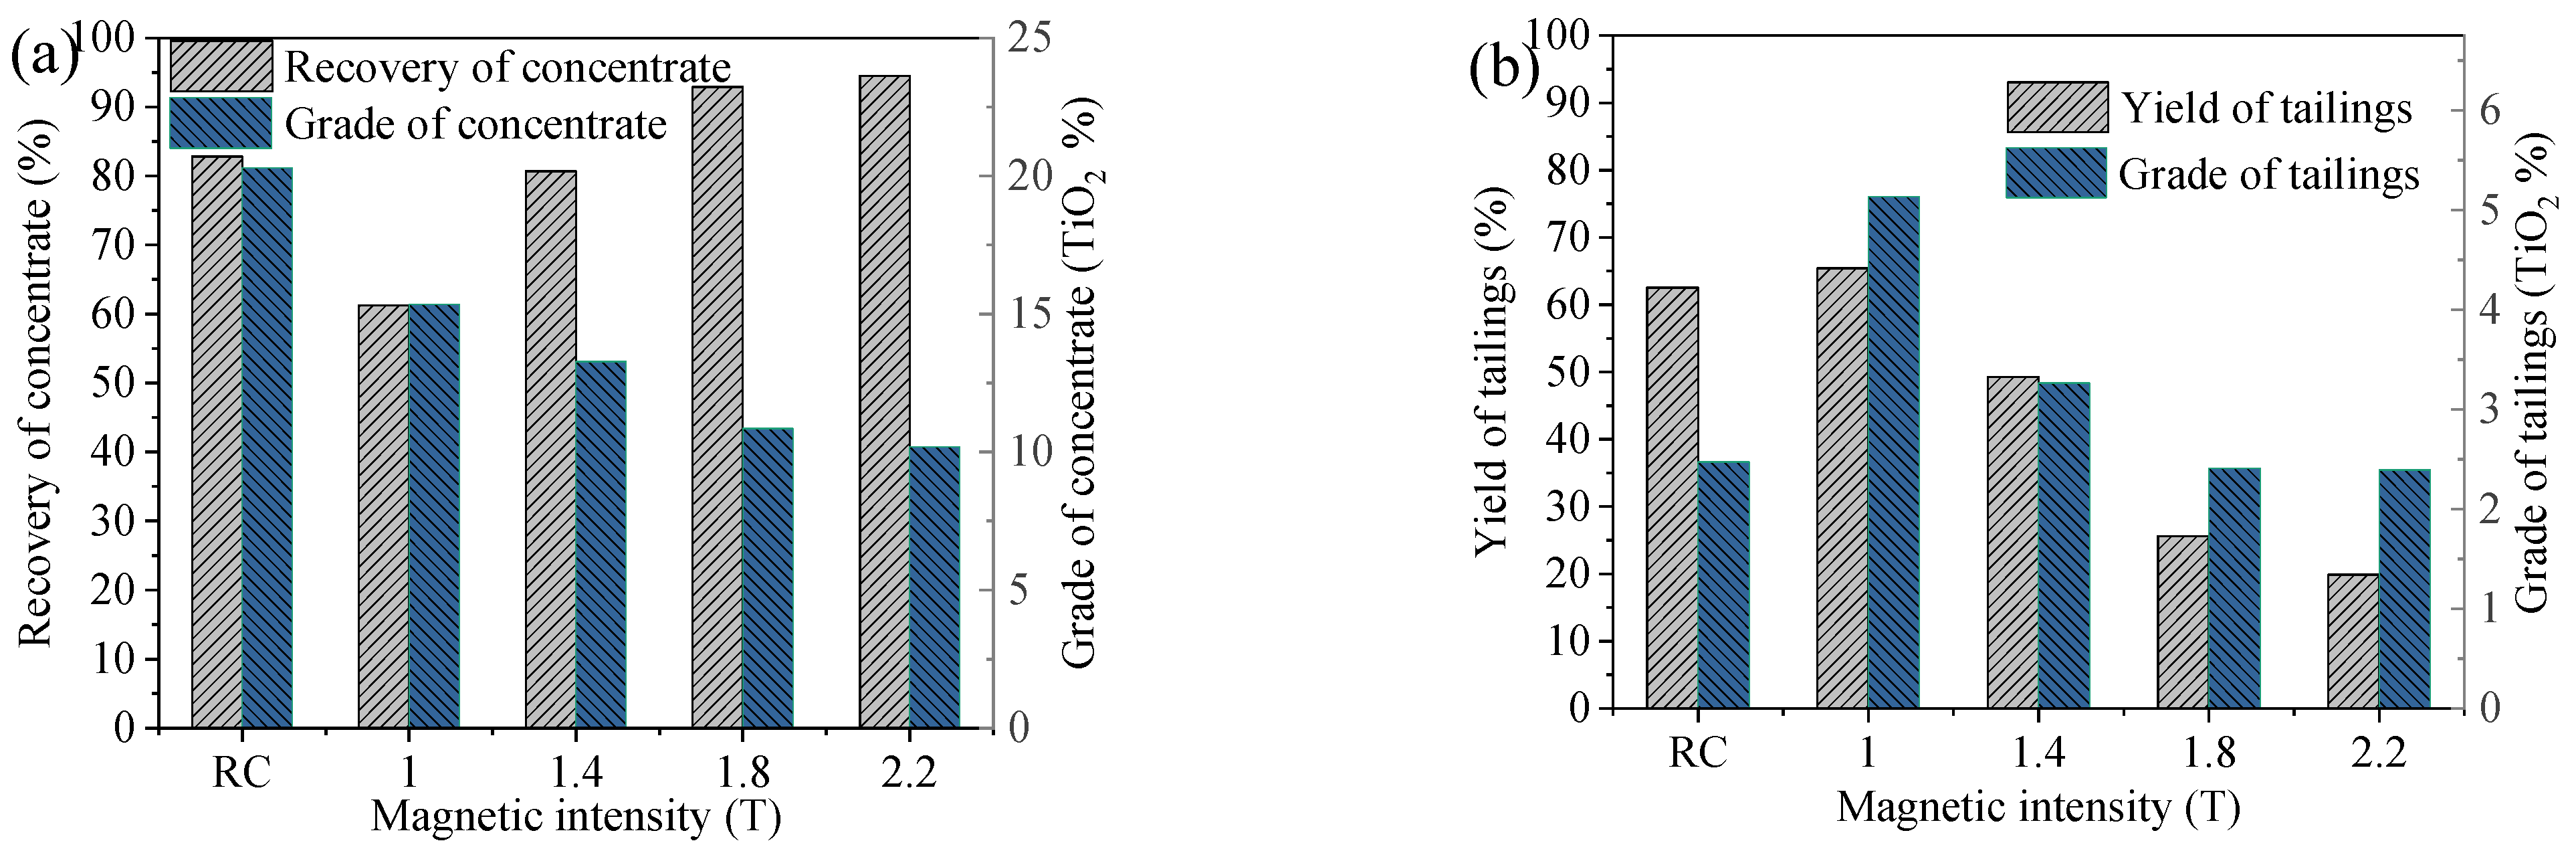
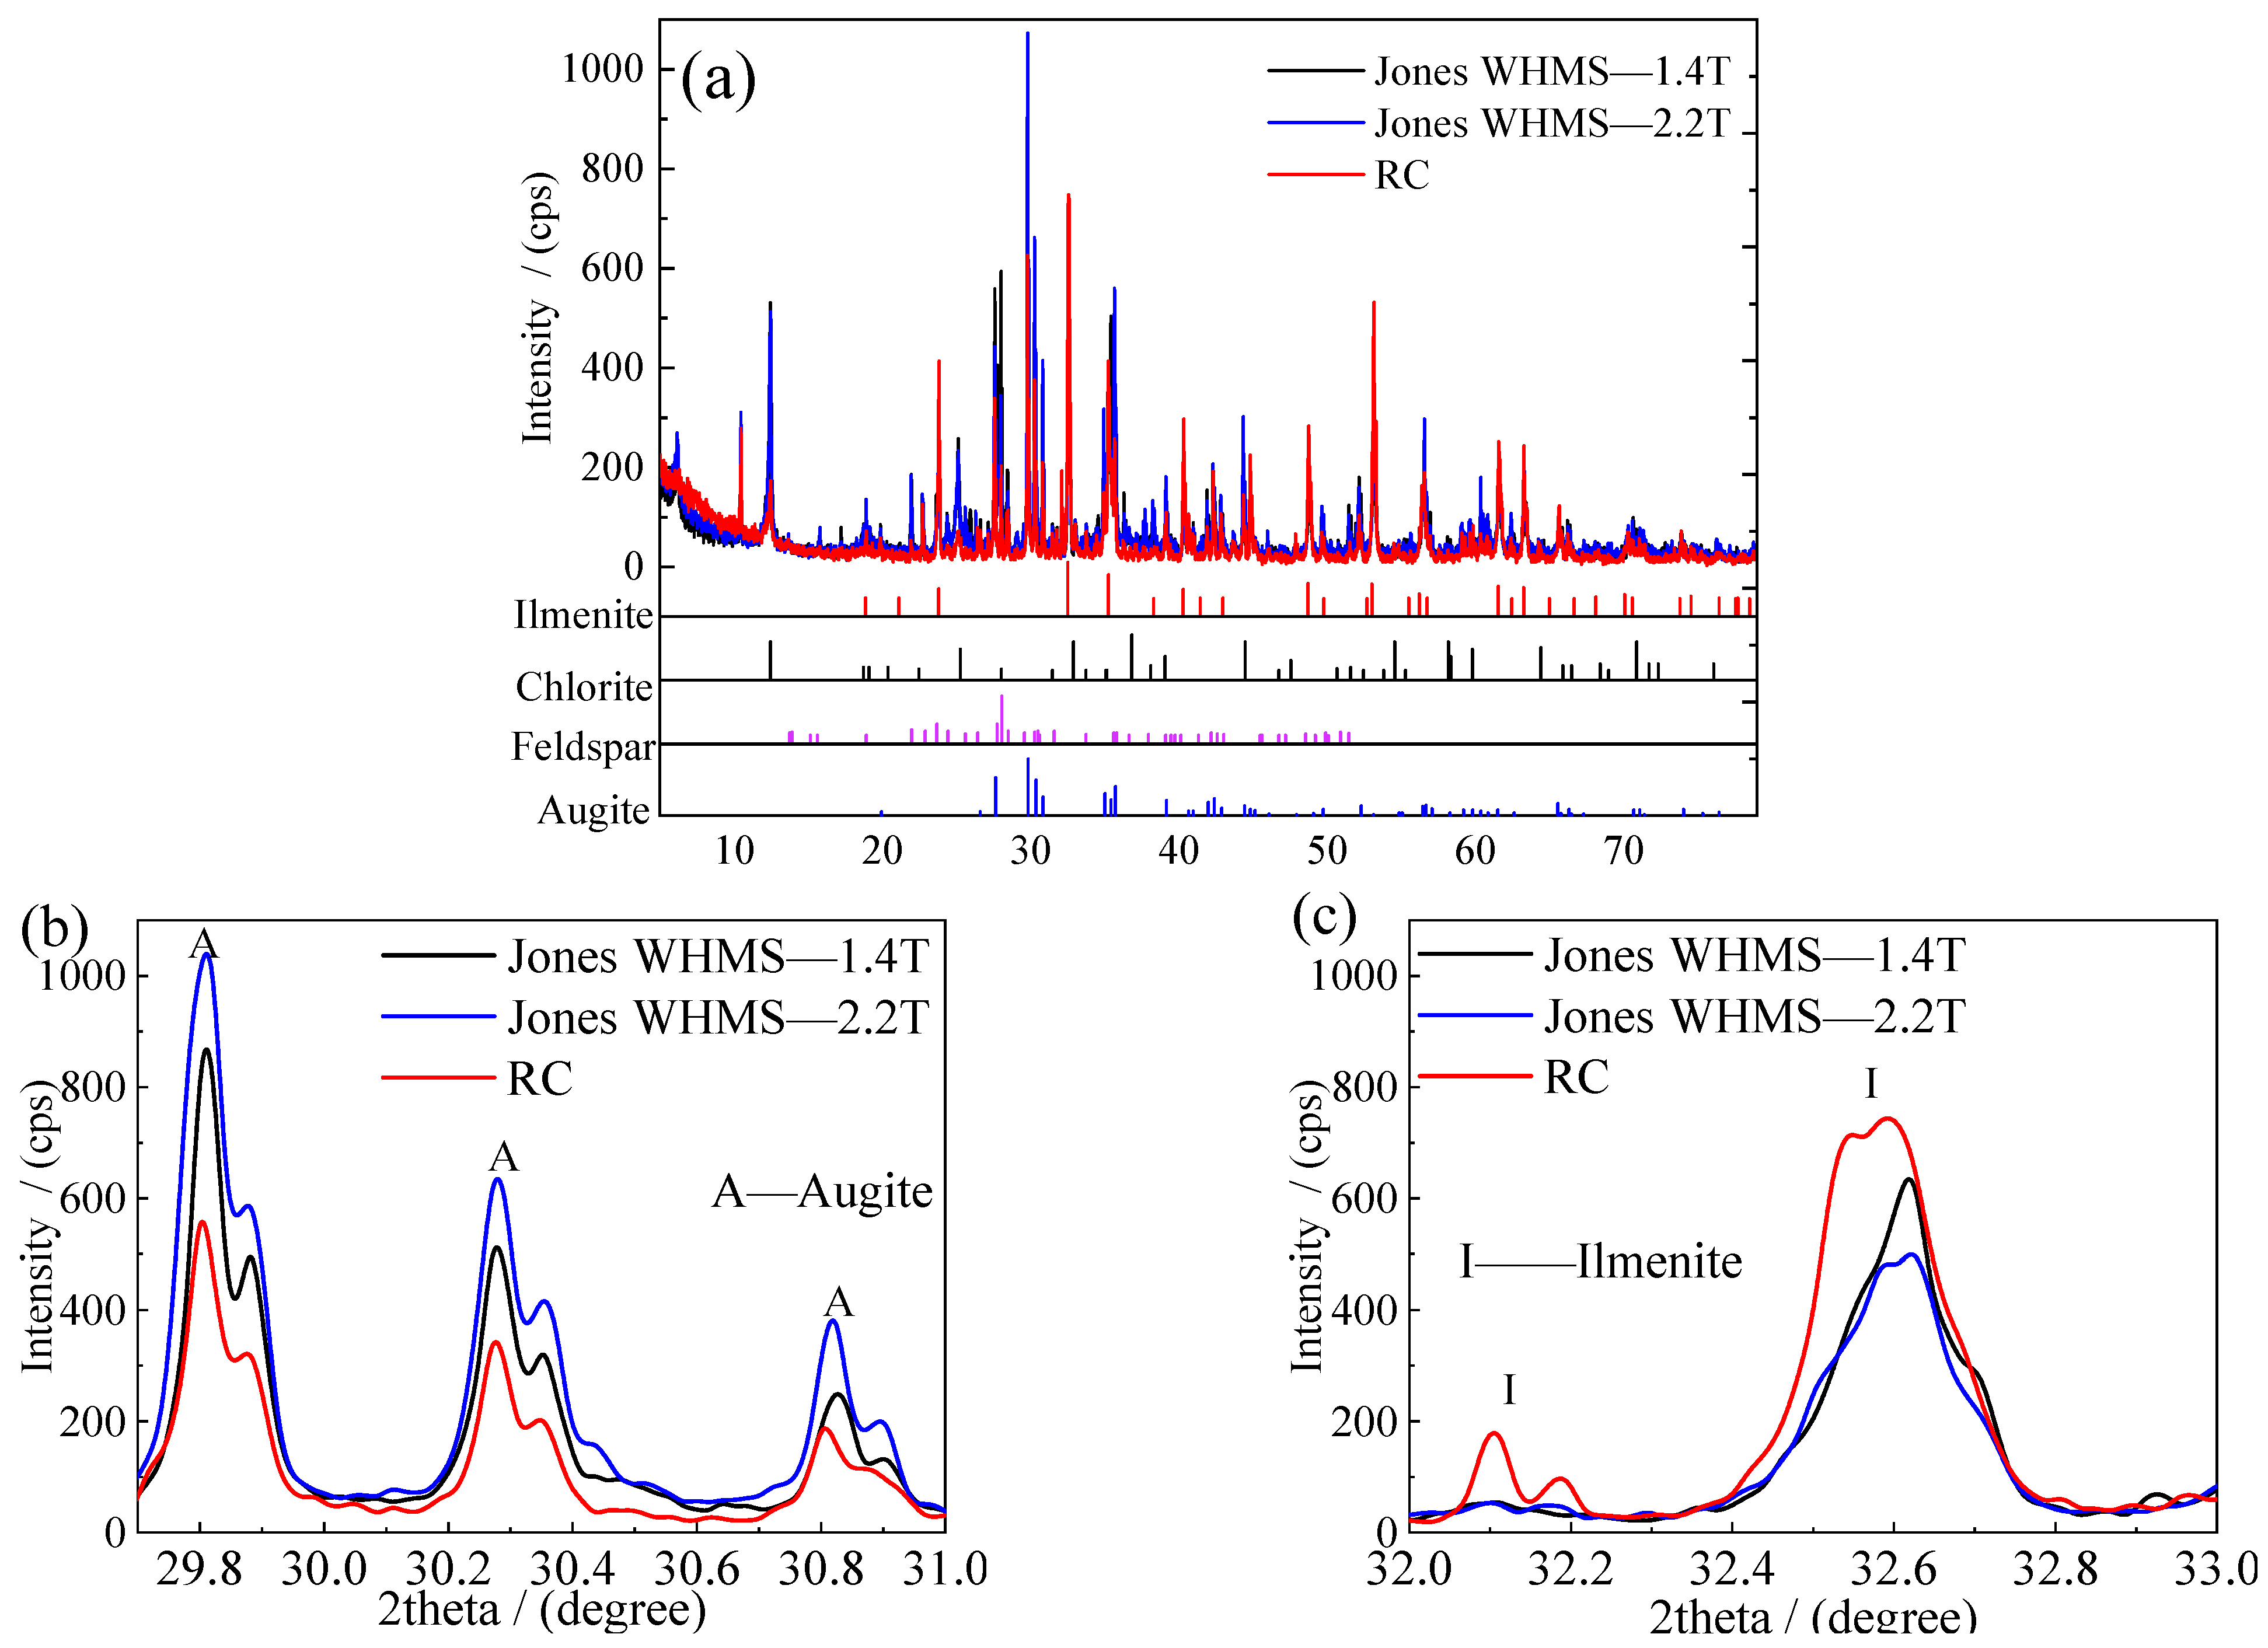
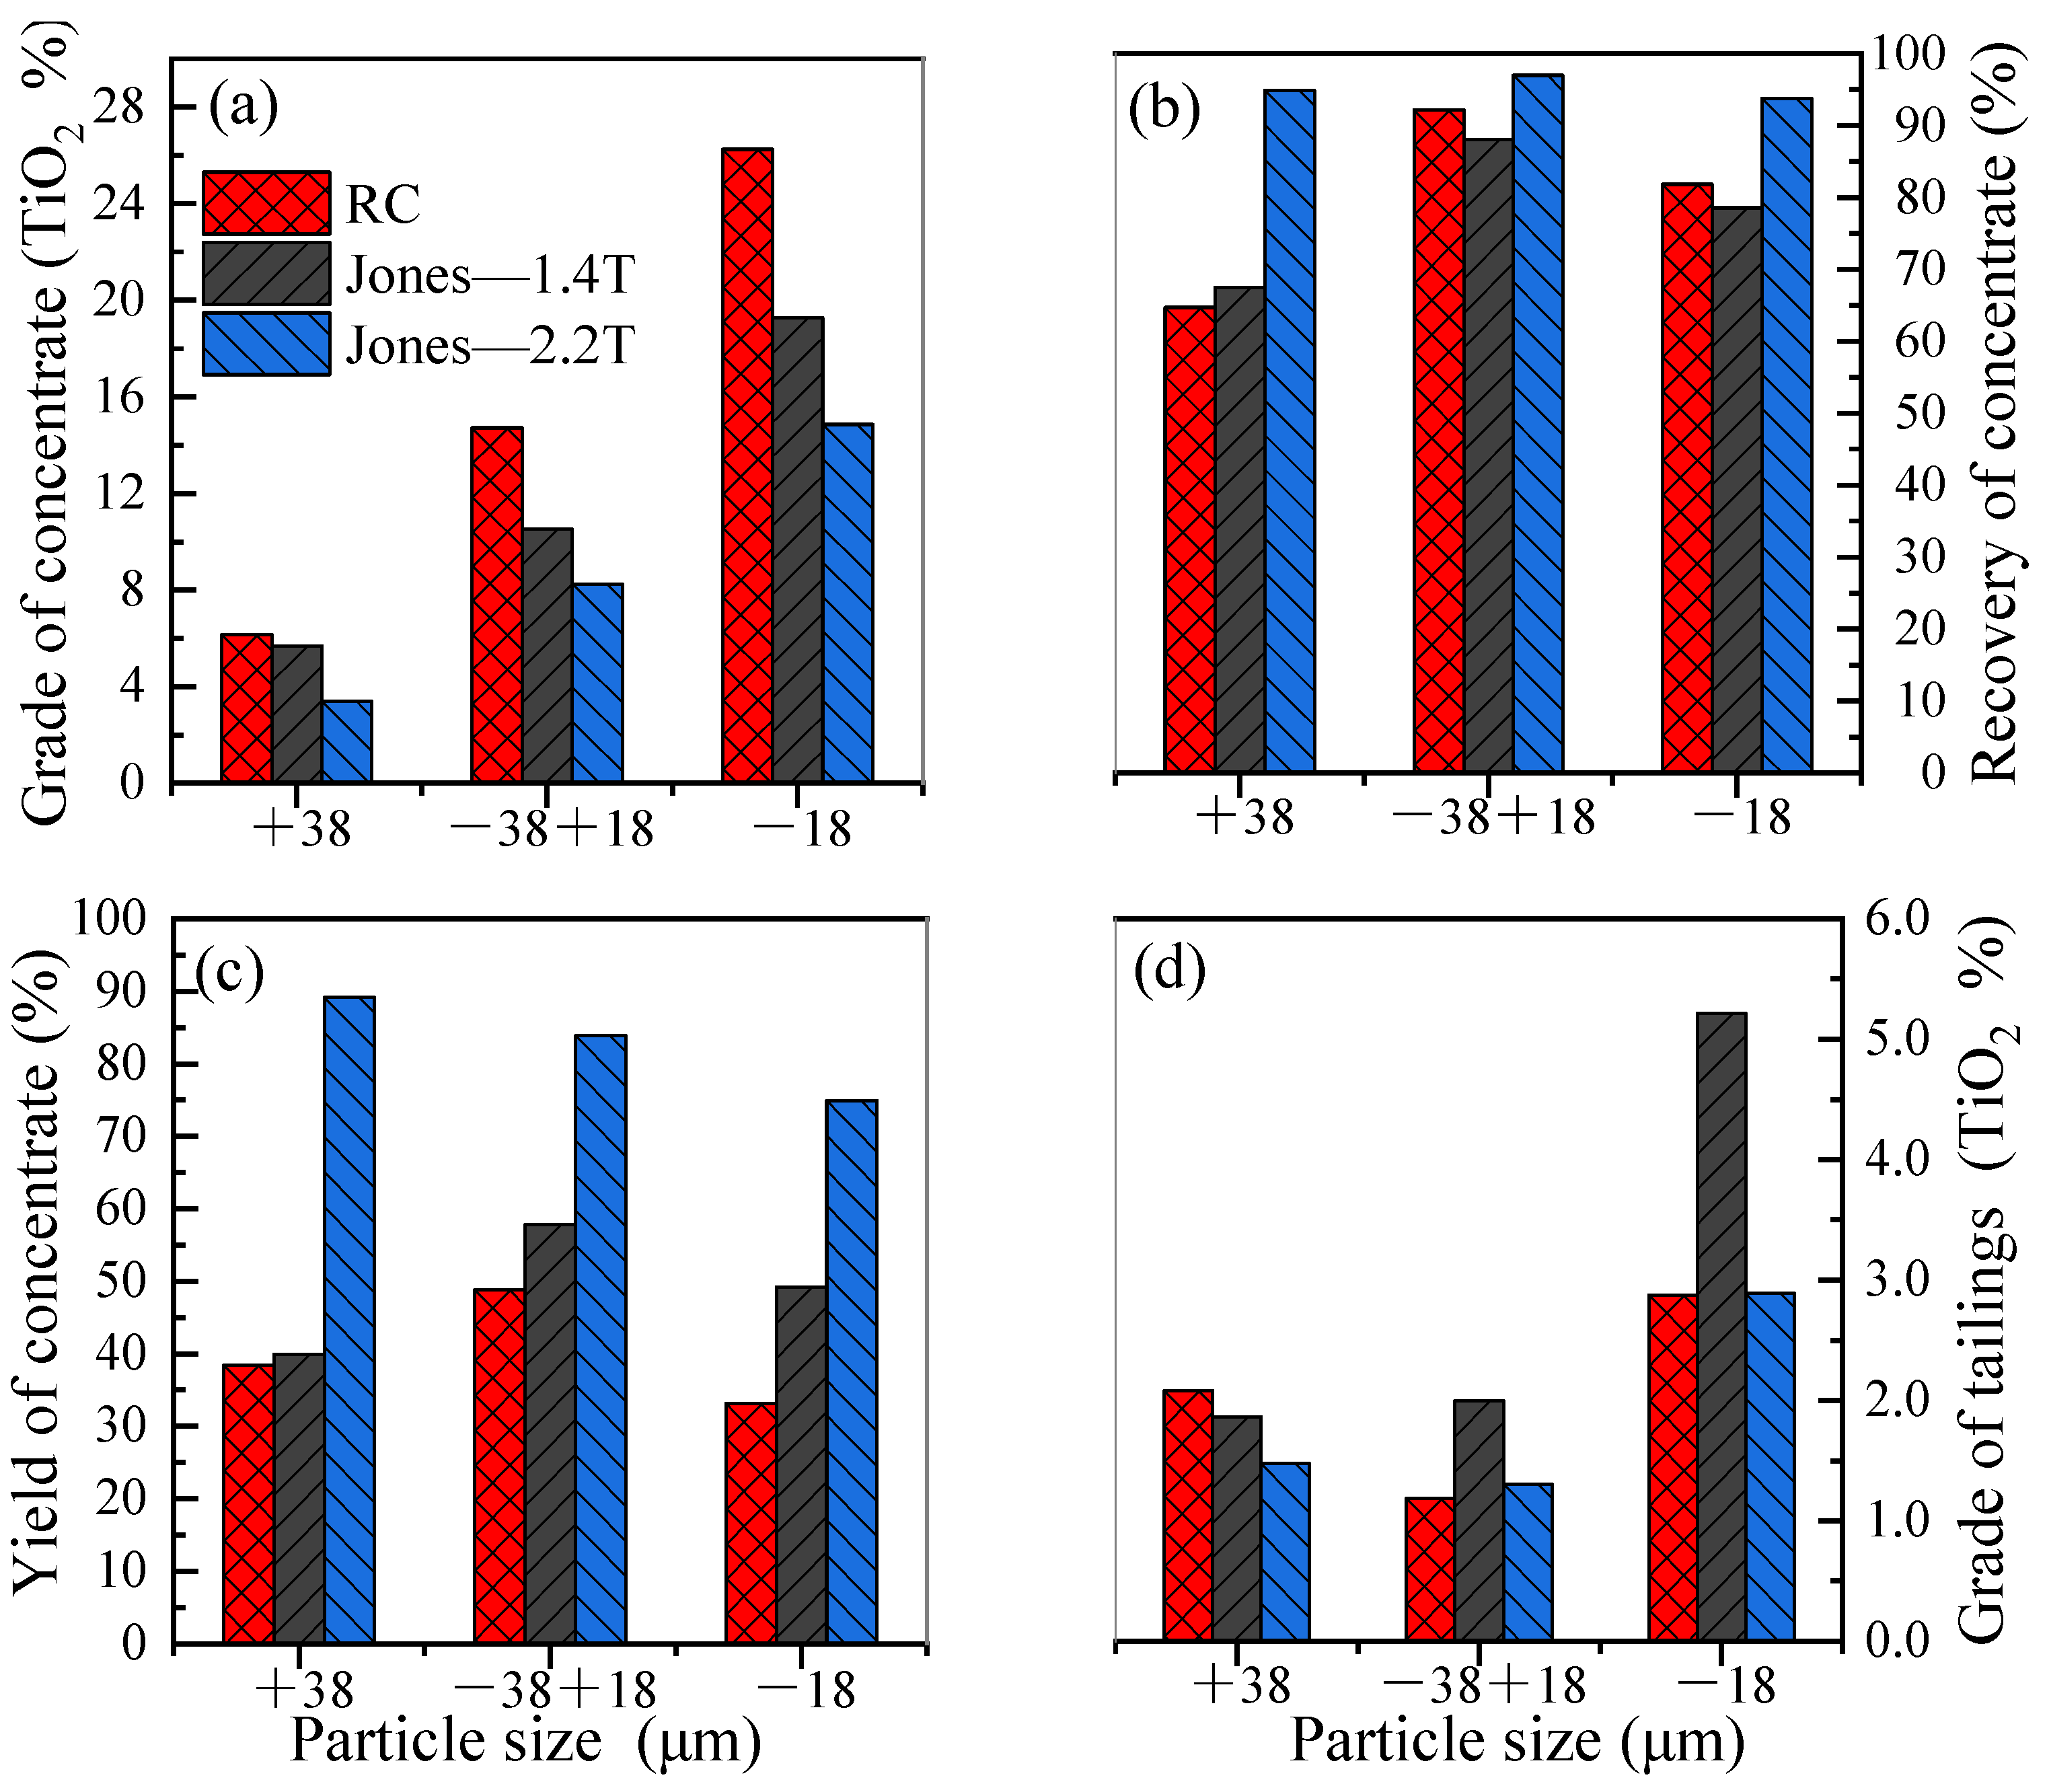
4.4. Comparison Between Magnetic Separator and RC
5. Conclusions
- The results indicate that using the reflux classifier for the preconcentration of ultrafine ilmenite ore, with an underflow rate of 17 mL/min, a fluidization water velocity of 1.78 × 10⁻3 m/s, and a throughput of 1.42 t/(m2·h), yields a maximum achievable separation efficiency of 50.0%. Under these conditions, the concentrate grade of TiO2 is 20.3%, with a recovery rate of 82.8%. The tailings yield is 62.6%, with a tailings TiO2 grade of 2.44%.
- A comparative analysis of the beneficiation results between magnetic separation and the reflux classifier reveals that certain gangue minerals in the ore, such as augite and chlorite, exhibit some degree of magnetism and can be captured by the magnetic medium due to increased magnetic intensity. This negatively impacts the quality of the concentrate product. However, the magnetic properties of the gangue do not affect the efficiency of the gravity process. For this specific material, magnetic separation was ineffective, while the reflux classifier achieved favorable results.
- It is noteworthy that the ore sample used in the experiment was exceptionally fine-grained, with 50% of the material having particle sizes finer than 13.8 μm. Despite this, the reflux classifier demonstrated commendable performance, highlighting the significant potential of this technology for the cost-effective and efficient preconcentration of ultrafine ilmenite ore.
Author Contributions
Funding
Data Availability Statement
Conflicts of Interest
Appendix A

| Run | Underflow Rate (mL/min) | Fluidization Water Velocity (m/s) | Throughput (t/(m2·h)) | Concentration of Feed (%) |
|---|---|---|---|---|
| 1 | 17.00 | 2.67 × 10⁻³ | 0.71 | 30.00 |
| 2 | 34.00 | 2.67 × 10⁻³ | 0.71 | 30.00 |
| 3 | 51.00 | 2.67 × 10⁻³ | 0.71 | 30.00 |
| 4 | 68.00 | 2.67 × 10⁻³ | 0.71 | 30.00 |
| 5 | 17.00 | 4.44 × 10⁻⁴ | 0.71 | 30.00 |
| 6 | 17.00 | 8.89 × 10⁻⁴ | 0.71 | 30.00 |
| 7 | 17.00 | 1.78 × 10⁻³ | 0.71 | 30.00 |
| 8 | 17.00 | 1.78 × 10⁻³ | 1.42 | 30.00 |
| 9 | 17.00 | 1.78 × 10⁻³ | 2.14 | 30.00 |
| 10 | 17.00 | 1.78 × 10⁻³ | 2.50 | 30.00 |
| Run | Grade of Tailings (%) | Grade of Concentrate (%) | Yield of Concentrate (%) | Recovery (%) | Separation Efficiency (%) |
|---|---|---|---|---|---|
| 1 | 3.85 | 18.51 | 31.47 | 68.78 | 40.76 |
| 2 | 3.30 | 14.83 | 49.50 | 81.47 | 35.12 |
| 3 | 2.54 | 10.78 | 77.98 | 93.71 | 17.28 |
| 4 | 2.13 | 9.61 | 90.34 | 97.59 | 7.96 |
| 5 | 2.10 | 15.03 | 50.23 | 87.80 | 41.10 |
| 6 | 2.23 | 15.96 | 47.61 | 86.61 | 42.75 |
| 7 | 2.44 | 17.94 | 43.02 | 84.75 | 45.90 |
| 8 | 2.51 | 20.29 | 37.39 | 82.80 | 49.98 |
| 9 | 3.11 | 22.11 | 30.06 | 75.26 | 49.57 |
| 10 | 3.77 | 24.84 | 22.72 | 65.89 | 47.21 |
| Run | Density (t/m3) | Solid Concentration (wt %) | TiO2 Grade of Bed (%) |
|---|---|---|---|
| 1 | 1.42 | 44.43 | 14.60 |
| 2 | 1.39 | 43.14 | 13.53 |
| 3 | 1.37 | 42.23 | 11.96 |
| 4 | 1.35 | 41.62 | 10.87 |
| 5 | 1.47 | 47.47 | 13.84 |
| 6 | 1.45 | 45.65 | 14.06 |
| 7 | 1.42 | 45.08 | 14.21 |
| 8 | 1.42 | 44.89 | 15.55 |
| 9 | 1.44 | 45.83 | 16.70 |
| 10 | 1.45 | 47.00 | 17.57 |
References
- Wu, F.; Li, X.; Wang, Z.; Wu, L.; Guo, H.J.; Xiong, X.H.; Zhang, X.P.; Wang, X.J. Hydrogen peroxide leaching of hydrolyzed titania residue prepared from mechanically activated Panzhihua ilmenite leached by hydrochloric acid. Int. J. Miner. Process. 2011, 98, 106–112. [Google Scholar] [CrossRef]
- Liu, S.-s.; Guo, Y.-f.; Qiu, G.-z.; Jiang, T.; Chen, F. Solid-state reduction kinetics and mechanism of pre-oxidized vanadium-titanium magnetite concentrate. Trans. Nonferrous Met. Soc. China 2014, 24, 3372–3377. [Google Scholar] [CrossRef]
- Yang, Y.; Xu, L.; Deng, J.; Liu, S. Influence of particle size on flotation separation of ilmenite, olivine, and pyroxene. Politech. Wroc. Oficyna Wydawnicza 2021, 57, 106–117. [Google Scholar] [CrossRef]
- Lin, L.I. Experimental Research on Comprehensive Recovery of Iron and Titanium from the Low Grade Vanadium Titanium Magnetite Ore in Panzhihua. Conserv. Util. Miner. Resour. 2015, 2, 27–32. [Google Scholar] [CrossRef]
- Liu, W.; Zhang, J.; Wang, W.; Deng, J.; Chen, B.; Yan, W.; Xiong, S.; Huang, Y.; Liu, J. Flotation behaviors of ilmenite, titanaugite, and forsterite using sodium oleate as the collector. Miner. Eng. 2015, 72, 1–9. [Google Scholar] [CrossRef]
- Zhang, H.; Zeng, J.; Xie, H.; Guan, C.; Chen, L. Enhanced separation for ilmenite tailings with a novel HGMS-flotation process. Sep. Sci. Technol. 2020, 55, 752–760. [Google Scholar] [CrossRef]
- Shen, S.P.; Yuan, Z.T.; Liu, J.T.; Meng, Q.Y.; Hao, H.Q. Preconcentration of ultrafine ilmenite ore using a superconducting magnetic separator. Powder Technol. 2020, 360, 1–9. [Google Scholar] [CrossRef]
- Xu, C.; Zhang, Y.; Liu, T.; Huang, J. Characterization and Pre-Concentration of Low-Grade Vanadium-Titanium Magnetite Ore. Minerals 2017, 7, 137. [Google Scholar] [CrossRef]
- Laxmi, T.; Satya Sai, S.; Rao, D.S.; Rao, R.B. Beneficiation studies on recovery and in-depth characterization of ilmenite from red sediments of badlands topography of Ganjam District, Odisha, India. Int. J. Min. Sci. Technol. 2013, 23, 725–731. [Google Scholar] [CrossRef]
- Chen, L.; Yang, R.; Zeng, J.; Shao, Y.; Xiao, Q.; Guo, S. A wet belt permanent high gradient magnetic separator for purification of non-metallic ores. Int. J. Miner. Process. 2016, 153, 66–70. [Google Scholar] [CrossRef]
- Svoboda, J. The effect of magnetic field strenght on the efficiency of magnetic separation. Miner. Eng. 1994, 7, 747–757. [Google Scholar] [CrossRef]
- Ge, W.; Encinas, A.; Araujo, E.; Song, S. Magnetic matrices used in high gradient magnetic separation (HGMS): A review. Results Phys. 2017, 7, 4278–4286. [Google Scholar] [CrossRef]
- Li, L.; Shen, S.; Yuan, Z.; Wang, H. Loss mechanism of fine-grainedilmenite in magnetic separation. China Min. Mag. 2018, 27, 138–144. (In Chinese) [Google Scholar] [CrossRef]
- Fan, G.; Zhang, C.; Wang, T.; Deng, J.; Cao, Y.; Chang, L.; Zhou, G.; Wu, Y.; Li, P. New insight into surface adsorption thermodynamic, kinetic properties and adsorption mechanisms of sodium oleate on ilmenite and titanaugite. Adv. Powder Technol. 2020, 31, 3628–3639. [Google Scholar] [CrossRef]
- Fan, X.; Rowson, N.A. The effect of Pb(NO3)2 on ilmenite flotation. Miner. Eng. 2000, 13, S0892–S6875. [Google Scholar] [CrossRef]
- Miettinen, T.; Ralston, J.; Fornasiero, D. The limits of fine particle flotation. Miner. Eng. 2010, 23, 420–437. [Google Scholar] [CrossRef]
- Liu, G.Z.; Dai, S.J.; Bai, L.M.; Ma, Y.X.; Zhang, Y. Experimental Studies on a Mineral Containing Titanium in Baoding Area. Adv. Mater. Res. 2013, 826, 34–37. [Google Scholar] [CrossRef]
- Galvin, K.P.; Zhou, J.; Walton, K. Application of closely spaced inclined channels in gravity separation of fine particles. Miner. Eng. 2010, 23, 326–338. [Google Scholar] [CrossRef]
- Galvin, K.P.; Doroodchi, E.; Callen, A.M.; Lambert, N.; Pratten, S.J. Pilot plant trial of the reflux classifier. Miner. Eng. 2002, 15, 19–25. [Google Scholar] [CrossRef]
- Galvin, K.P.; Callen, A.; Zhou, J.; Doroodchi, E. Performance of the reflux classifier for gravity separation at full scale. Miner. Eng. 2005, 18, 19–24. [Google Scholar] [CrossRef]
- Nguyentranlam, G.; Galvin, K.P. Applications of the Reflux Classifier in solid-liquid operations. Int. J. Miner. Process. 2004, 73, 83–89. [Google Scholar] [CrossRef]
- Galvin, K.P.; Callen, A.M.; Spear, S. Gravity separation of coarse particles using the Reflux Classifier. Miner. Eng. 2010, 23, 339–349. [Google Scholar] [CrossRef]
- Amariei, D.; Michaud, D.; Paquet, G.; Lindsay, M. The use of a Reflux Classifier for iron ores: Assessment of fine particles recovery at pilot scale. Miner. Eng. 2014, 62, 66–73. [Google Scholar] [CrossRef]
- Hunter, D.M.; Iveson, S.M.; Galvin, K.P. A batch elutriation technique for the density-based fractionation of iron ore. In Proceedings of the Iron Ore 2017, Perth, Australia, 24–26 July 2017. [Google Scholar]
- Rodrigues, A.F.d.V.; Delboni Junior, H.; Rodrigues, O.M.S.; Zhou, J.; Galvin, K.P. Gravity separation of fine itabirite iron ore using the Reflux Classifier-Part I-Investigation of continuous steady state separations across a wide range of parameters. Miner. Eng. 2023, 201, 108187. [Google Scholar] [CrossRef]
- Richardson, J.F.; Zaki, W.N. Sedimentation and fluidisation: Part I. Chem. Eng. Res. Des. 1997, 75, S0263–S8762. [Google Scholar] [CrossRef]
- Xie, G. Mineral Processing; University of Mining and Technology Press: Xuzhou, China, 2016. [Google Scholar]
- Galvin, K.P.; Liu, H. Role of inertial lift in elutriating particles according to their density. Chem. Eng. Sci. 2011, 66, 3687–3691. [Google Scholar] [CrossRef]
- King, M.R.; Leighton, J.D.T. Measurement of the inertial lift on a moving sphere in contact with a plane wall in a shear flow. Phys. Fluids 1997, 9, 1248–1255. [Google Scholar] [CrossRef]
- Vance, W.H.; Moulton, R.W. A study of slip ratios for the flow of steam-water mixtures at high void fractions. AIChE J. 1965, 11, 1114–1124. [Google Scholar] [CrossRef]
- Li, Y.; Li, Y.; Xia, W.; He, C.Y.; Zhu, R.T. A novel particulate sedimentation model in inclined channels of liquid-solid fluidized bed. Powder Technol. 2017, 305, 764–770. [Google Scholar] [CrossRef]
| Size (μm) | Mass Fraction (%) | TiO2 Grade (%) | TiO2 Distribution (%) |
|---|---|---|---|
| +38 | 11.58 | 2.43 | 3.21 |
| −38 + 18 | 31.46 | 5.94 | 21.32 |
| −18 | 56.96 | 11.62 | 75.46 |
| Total | 100 | 8.77 | 100 |
Disclaimer/Publisher’s Note: The statements, opinions and data contained in all publications are solely those of the individual author(s) and contributor(s) and not of MDPI and/or the editor(s). MDPI and/or the editor(s) disclaim responsibility for any injury to people or property resulting from any ideas, methods, instructions or products referred to in the content. |
© 2024 by the authors. Licensee MDPI, Basel, Switzerland. This article is an open access article distributed under the terms and conditions of the Creative Commons Attribution (CC BY) license (https://creativecommons.org/licenses/by/4.0/).
Share and Cite
Liu, Z.; Su, Z.; Liu, B.; Wang, Y.; Zhang, Y.; Zhong, X.; Chen, K.; Hu, X.; Lu, D. Preconcentrating Ultrafine Ilmenite Tailings Using a Laboratory-Scale Reflux Classifier. Minerals 2024, 14, 1125. https://doi.org/10.3390/min14111125
Liu Z, Su Z, Liu B, Wang Y, Zhang Y, Zhong X, Chen K, Hu X, Lu D. Preconcentrating Ultrafine Ilmenite Tailings Using a Laboratory-Scale Reflux Classifier. Minerals. 2024; 14(11):1125. https://doi.org/10.3390/min14111125
Chicago/Turabian StyleLiu, Zhenqiang, Zhenhua Su, Bing Liu, Yuhua Wang, Yuxin Zhang, Xuqun Zhong, Kangkang Chen, Xiaoxing Hu, and Dongfang Lu. 2024. "Preconcentrating Ultrafine Ilmenite Tailings Using a Laboratory-Scale Reflux Classifier" Minerals 14, no. 11: 1125. https://doi.org/10.3390/min14111125
APA StyleLiu, Z., Su, Z., Liu, B., Wang, Y., Zhang, Y., Zhong, X., Chen, K., Hu, X., & Lu, D. (2024). Preconcentrating Ultrafine Ilmenite Tailings Using a Laboratory-Scale Reflux Classifier. Minerals, 14(11), 1125. https://doi.org/10.3390/min14111125