Author Contributions
Conceptualization, M.C. and A.B.; methodology, M.C., P.L., K.K., H.Ś. and A.B.; software, M.C. and K.K.; validation, P.L., A.P. and K.K.; formal analysis, M.C., P.L. and K.K.; investigation, M.C., P.L., K.K., A.P., H.Ś. and A.B.; resources, A.B.; data curation, M.C. and P.L.; writing—original draft preparation, M.C.; writing—review and editing, M.C., P.L., K.K., A.P., H.Ś. and A.B.; visualisation, M.C. and A.B.; supervision, A.B.; project administration, A.B.; funding acquisition, A.B. All authors have read and agreed to the published version of the manuscript.
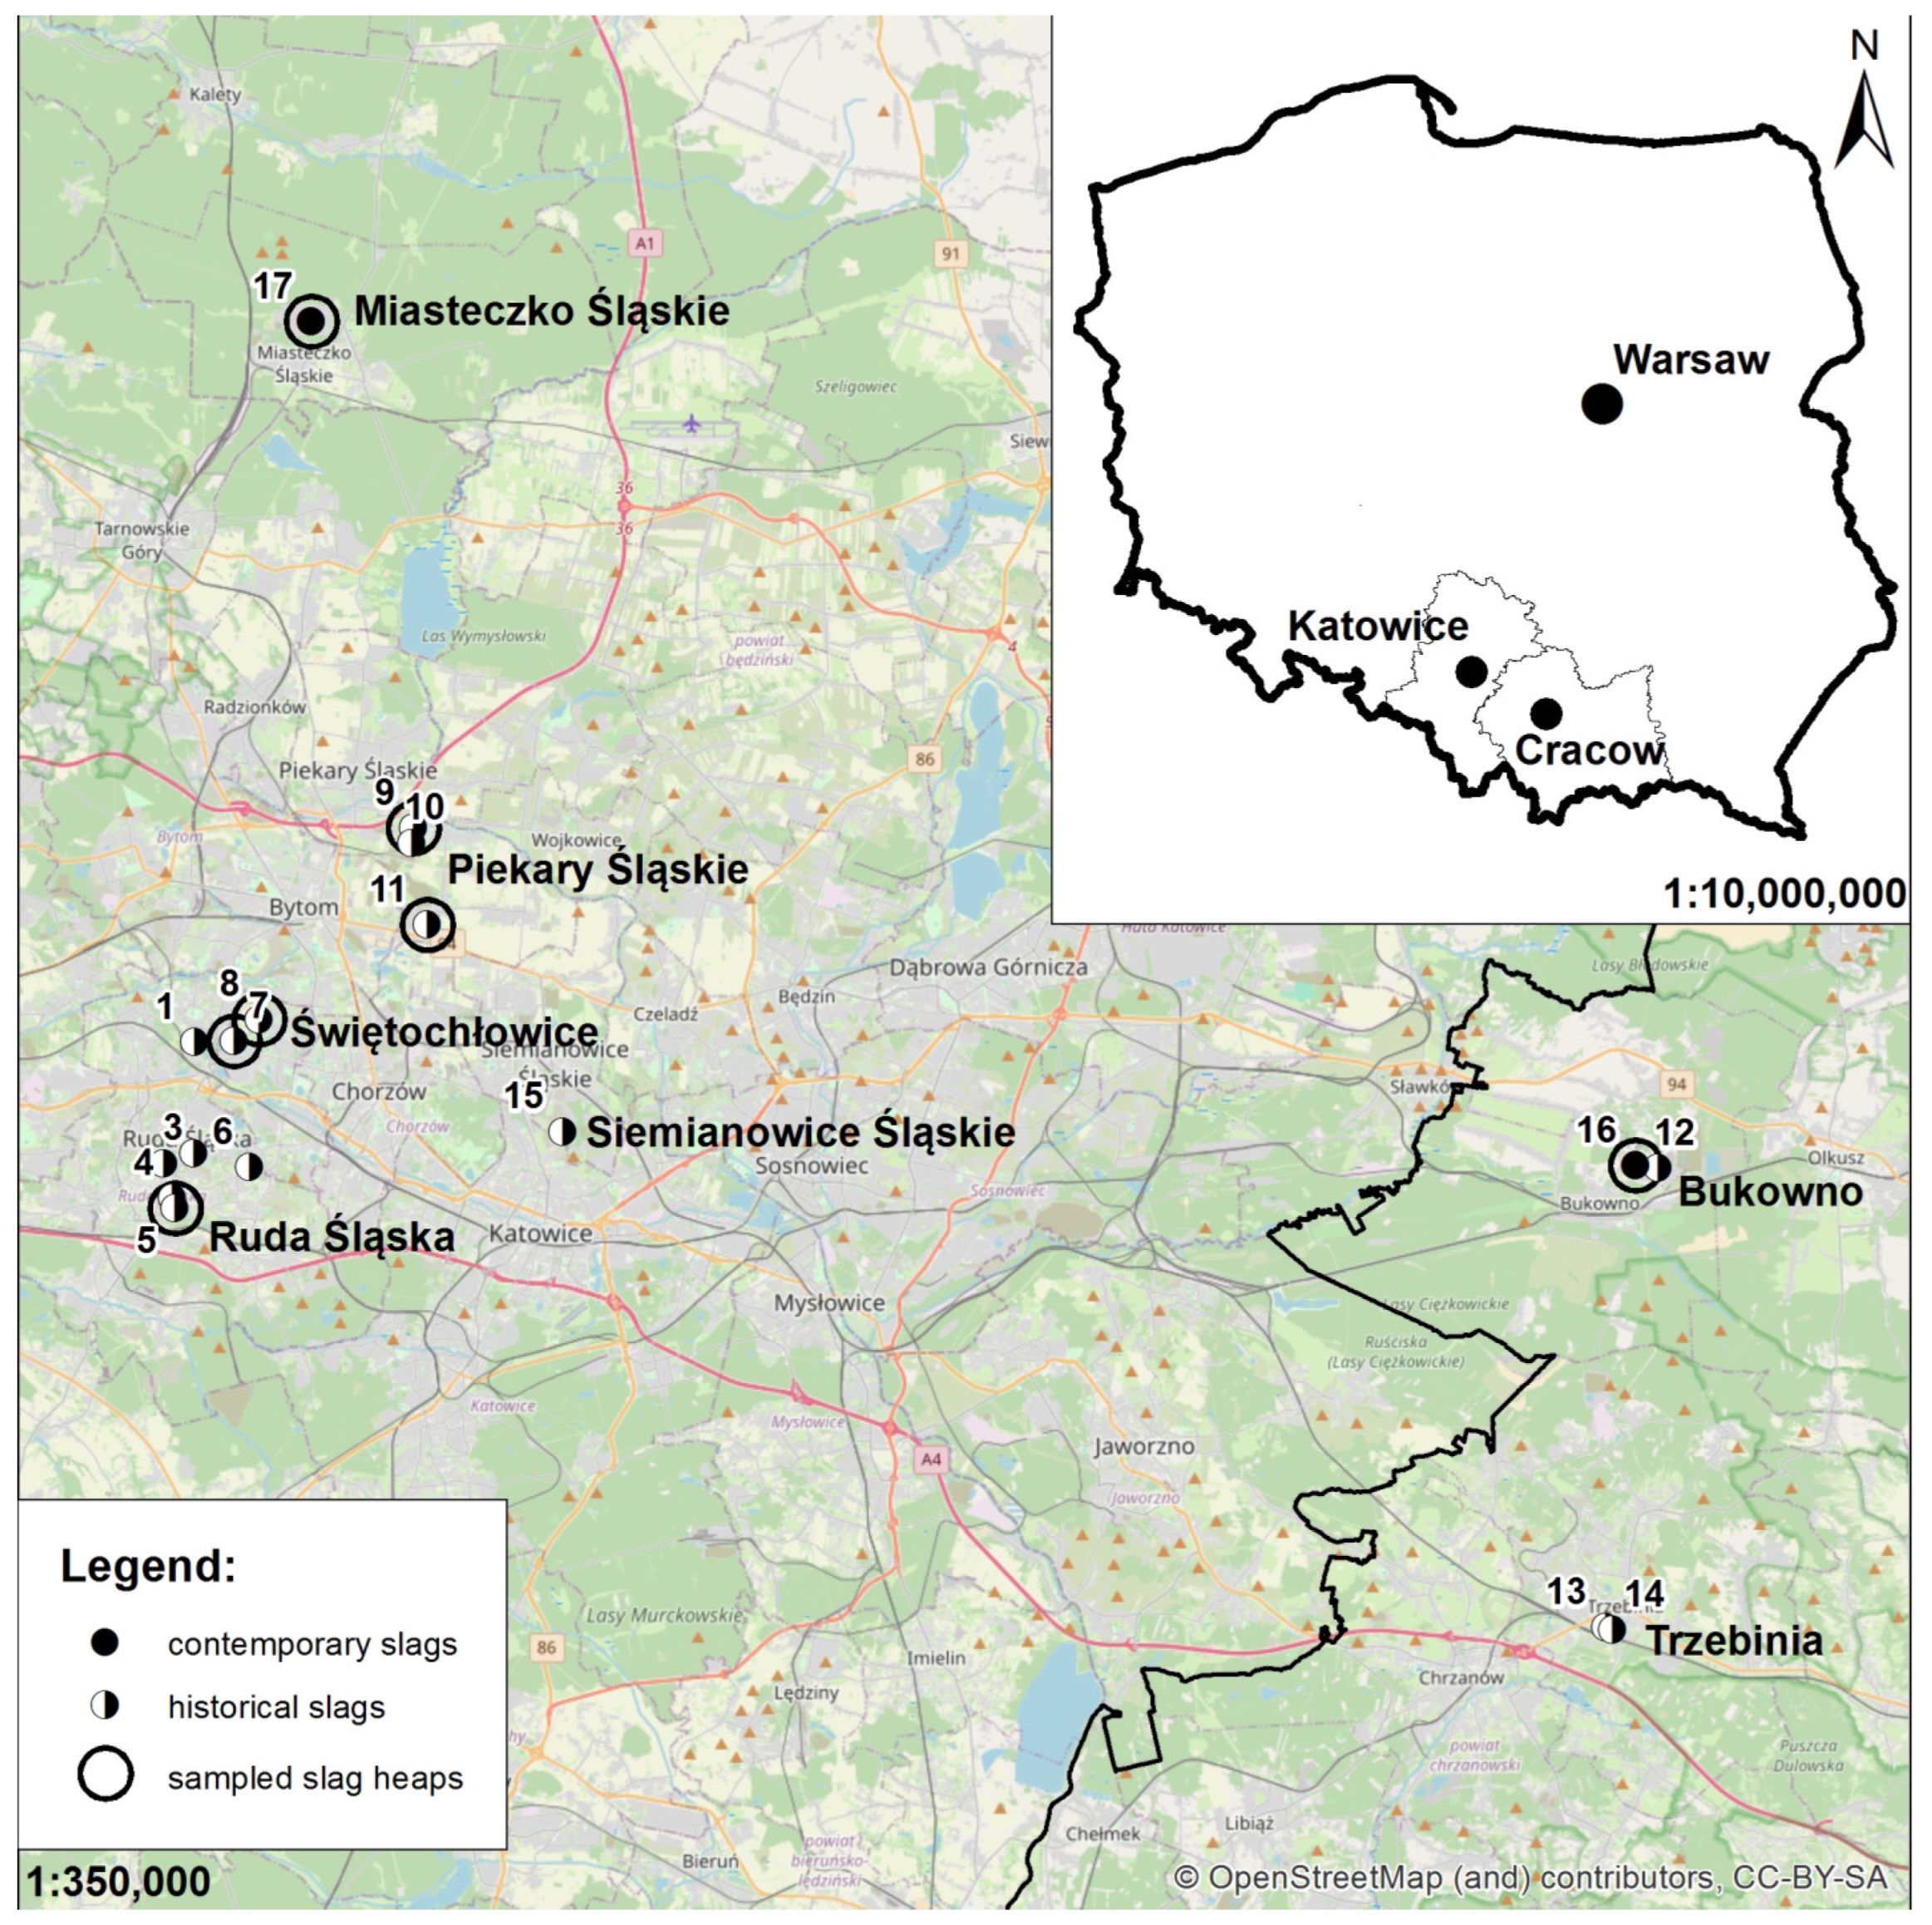
Figure 1.
Locations of existing waste dumps/plants with slags from Zn–Pb metallurgy in the Silesia–Cracow Upland.
Figure 1.
Locations of existing waste dumps/plants with slags from Zn–Pb metallurgy in the Silesia–Cracow Upland.
Figure 2.
Sampled historical slag dumps: (a) Metallurgical Plant “Hugo” in Ruda Śląska, (b) ZM “Silesia” in Świętochłowice, (c) Metallurgical Plant “Guidotto” in Świętochłowice, (d) KH “Waryński” in Piekary Śląskie, and (e) ZGH “Orzeł Biały” in Piekary Śląskie.
Figure 2.
Sampled historical slag dumps: (a) Metallurgical Plant “Hugo” in Ruda Śląska, (b) ZM “Silesia” in Świętochłowice, (c) Metallurgical Plant “Guidotto” in Świętochłowice, (d) KH “Waryński” in Piekary Śląskie, and (e) ZGH “Orzeł Biały” in Piekary Śląskie.
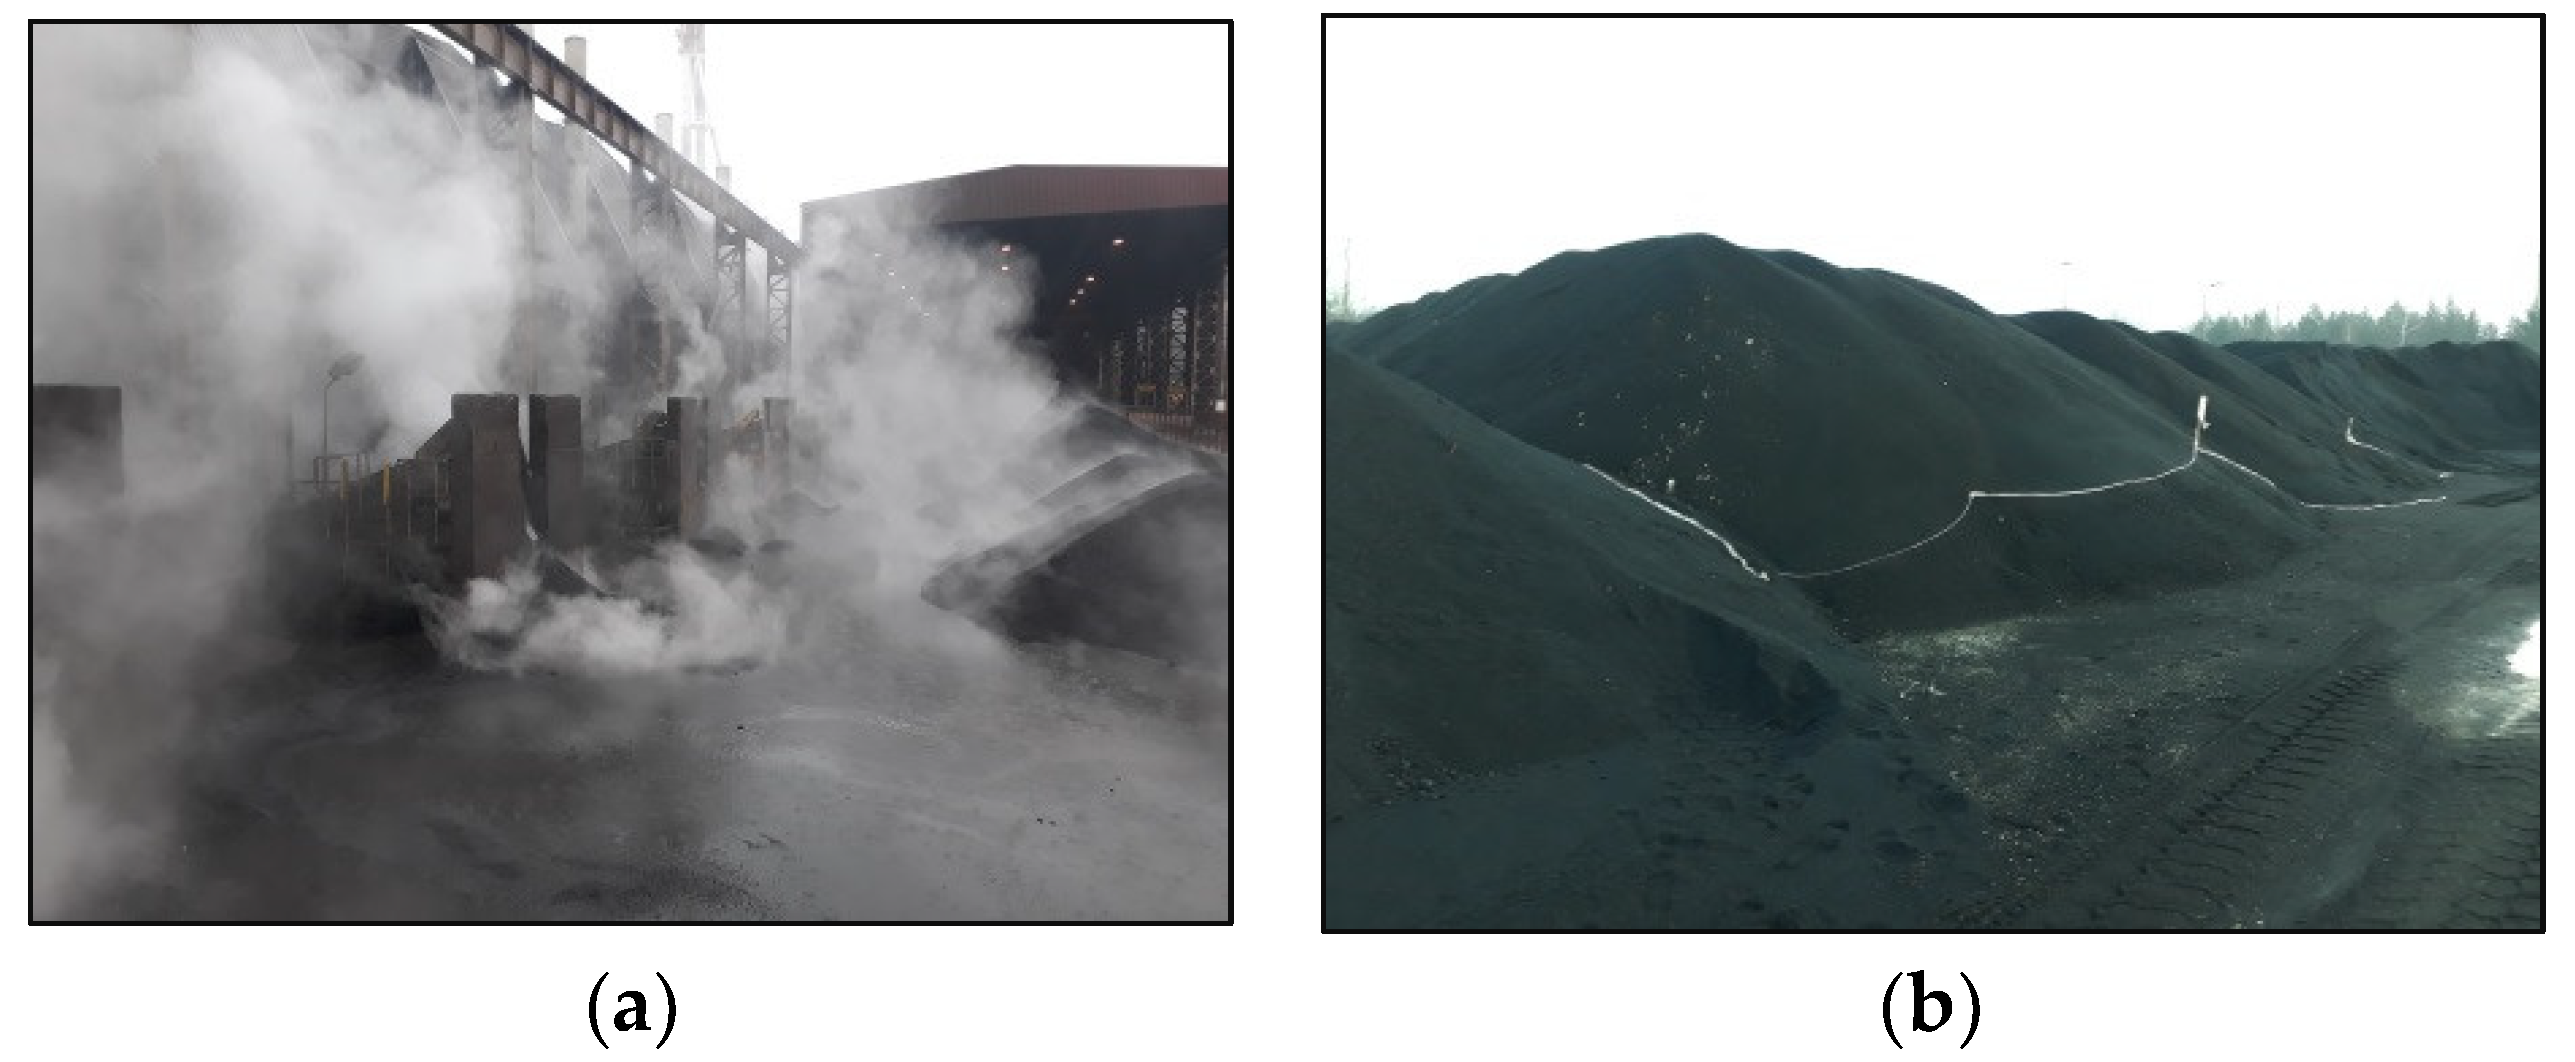
Figure 3.
Sampled sites of contemporary slag production: (a) slag outlet from the Zinc Oxide Rotary Kiln of ZGH “Bolesław” S.A. in Bukowno and (b) slag dumps from the Imperial Smelting Furnace HC “Miasteczko Śląskie” S.A. in Miasteczko Śląskie.
Figure 3.
Sampled sites of contemporary slag production: (a) slag outlet from the Zinc Oxide Rotary Kiln of ZGH “Bolesław” S.A. in Bukowno and (b) slag dumps from the Imperial Smelting Furnace HC “Miasteczko Śląskie” S.A. in Miasteczko Śląskie.
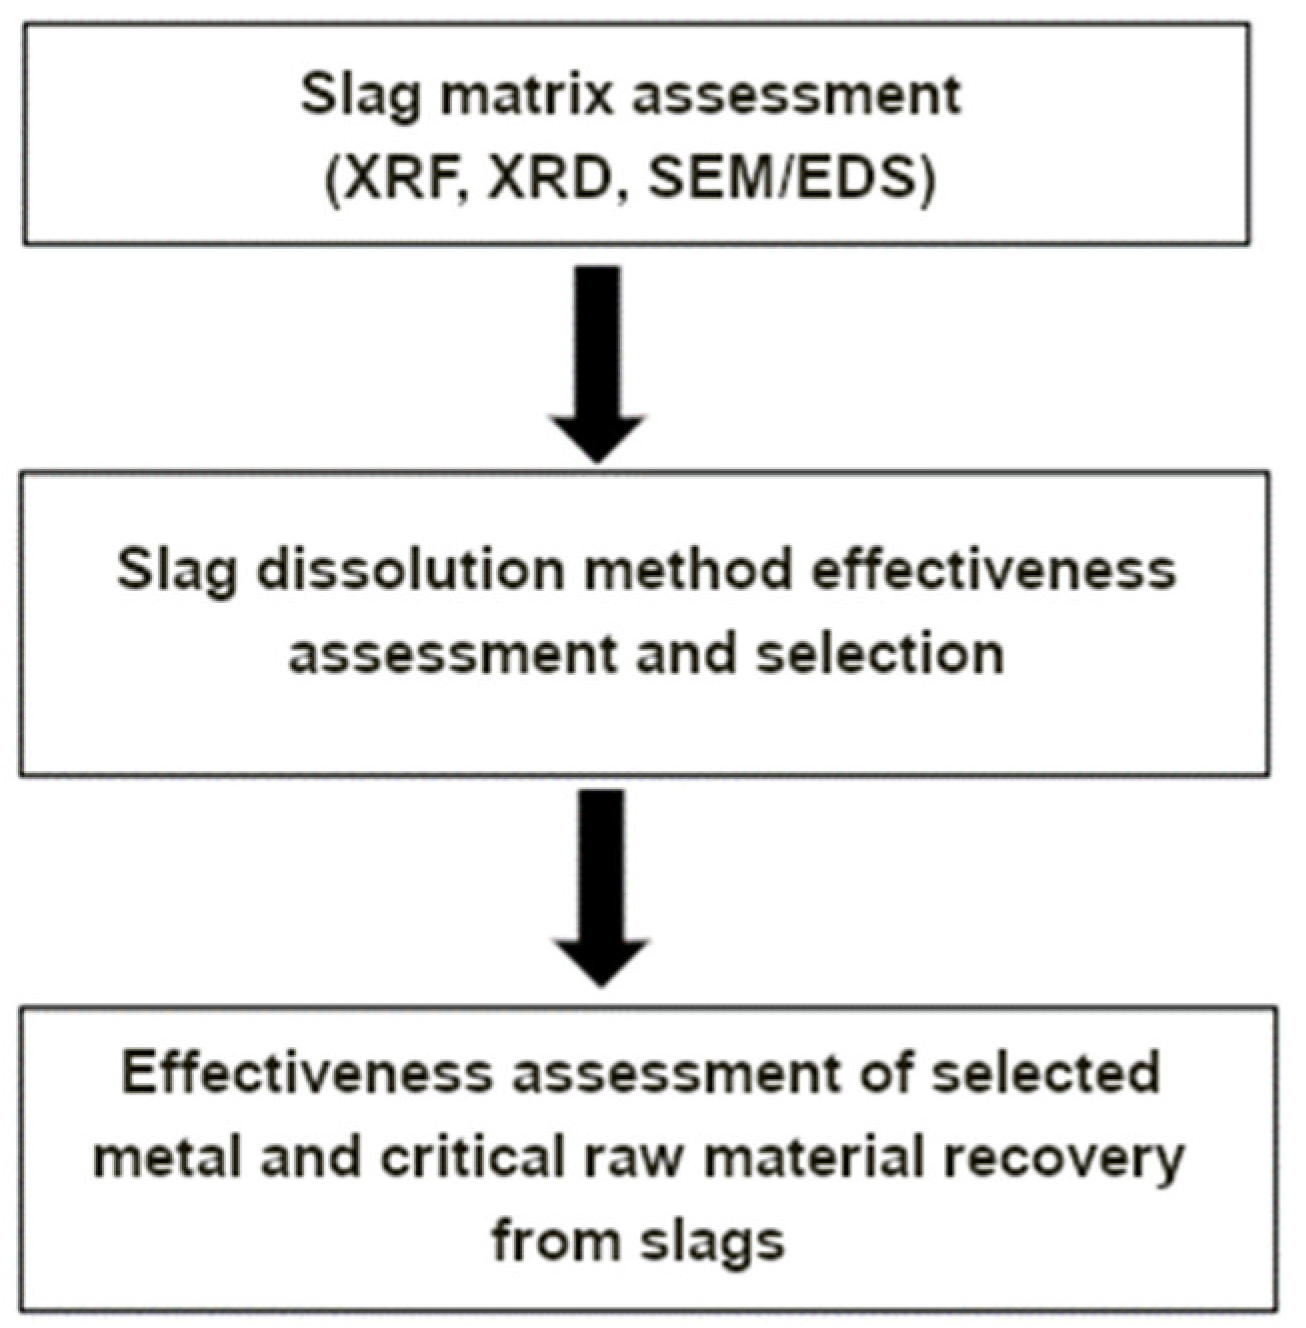
Figure 4.
Method for assessing the content of zinc, lead and selected critical raw materials in slags.
Figure 4.
Method for assessing the content of zinc, lead and selected critical raw materials in slags.
Figure 5.
Major component contents in the analysed slag samples (XRF): (a) silicon, (b) aluminium, (c) calcium, (d) magnesium, and (e) iron. Legend: HS—historical slag samples; CS—contemporary slag samples; light blue bar—sample with fine grains; dark blue bar—sample with coarse grains; grey bar—no grain size data available for the sample.
Figure 6.
Example XRD spectra: (a) historical slag (sample H2), identified phases: A—anorthite, G—gypsum, H—hematite, L—melanterite, M—magnetite, Q—quartz, U—augite; (b) contemporary slag (sample B2), identified phases: A—augite, C—zincite, E—hematite, F—fluorite, Fe—iron, G—gehlenite, H—hardystonite, L—melanterite, M—magnetite, N—Na2SiO5 substance, P—plagioclase, Q—quartz, U—wüstite, W—wollastonite, X—maghemite, and Z—FeSiO3 substance.
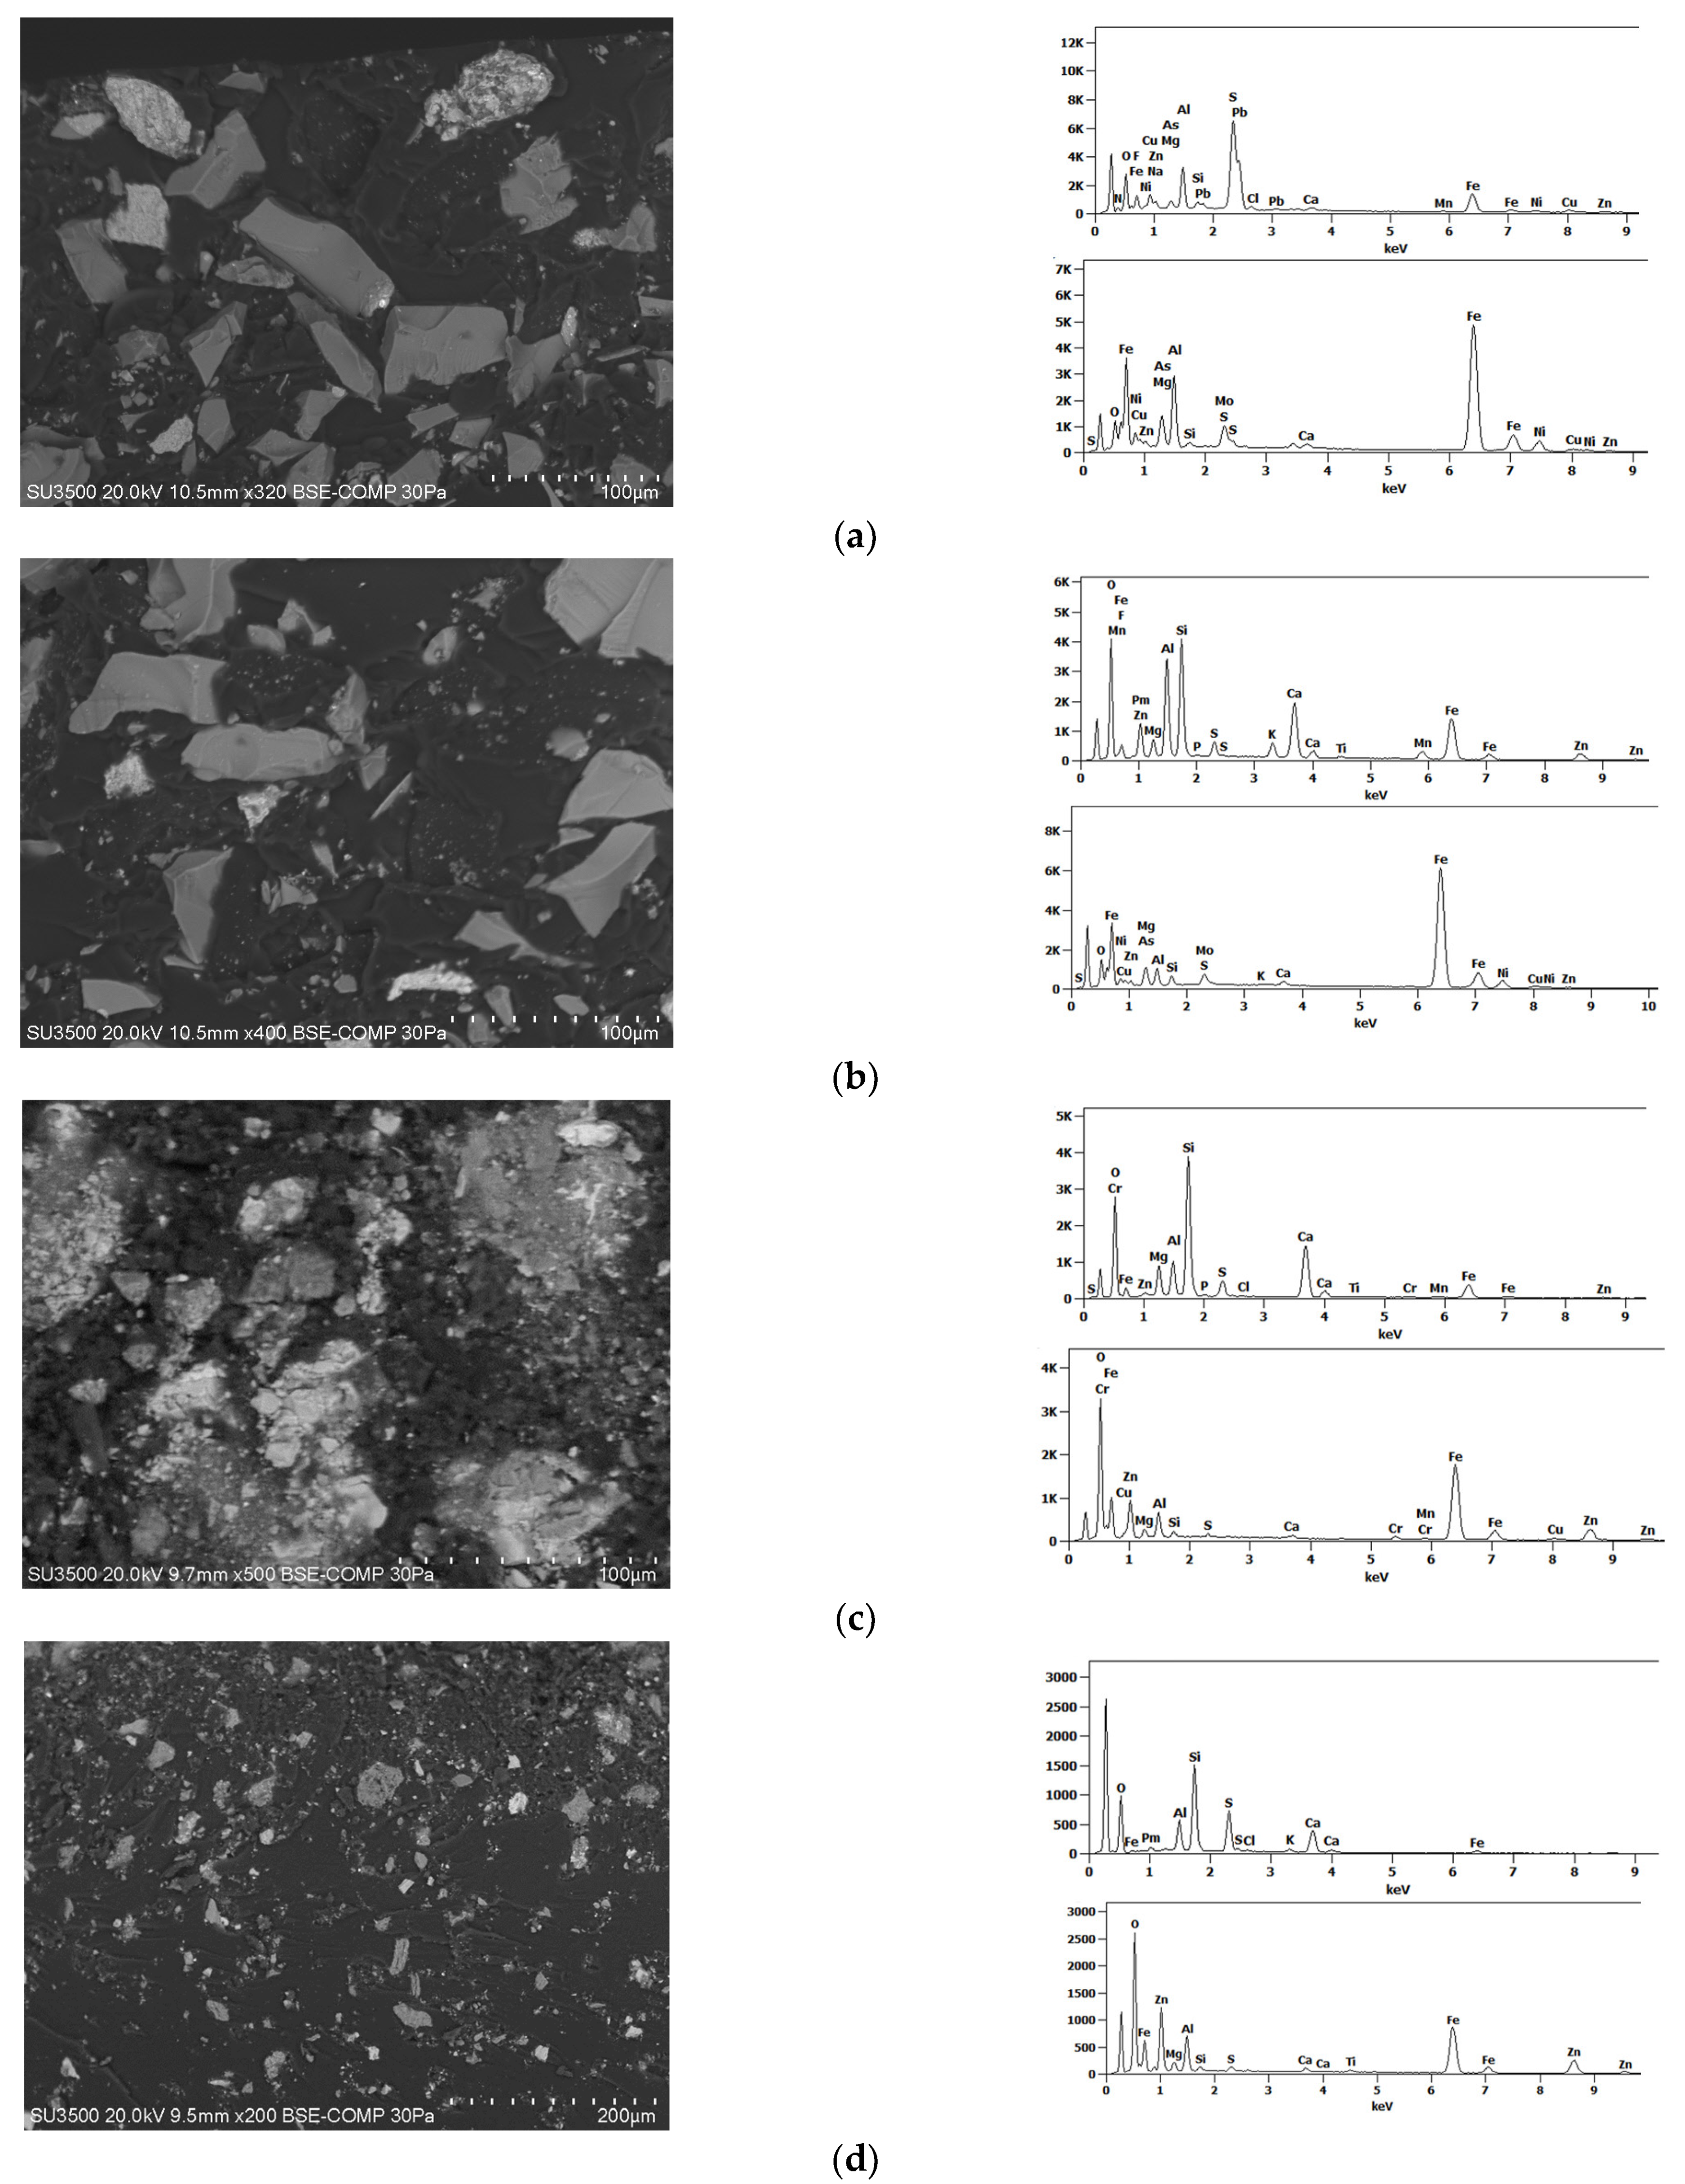
Figure 7.
Example SEM images with EDS spectra of selected microarea of slag grains containing selected metals and critical raw materials: (a,b) historical slag (sample H1); (c,d) contemporary slags (sample M1).
Figure 7.
Example SEM images with EDS spectra of selected microarea of slag grains containing selected metals and critical raw materials: (a,b) historical slag (sample H1); (c,d) contemporary slags (sample M1).
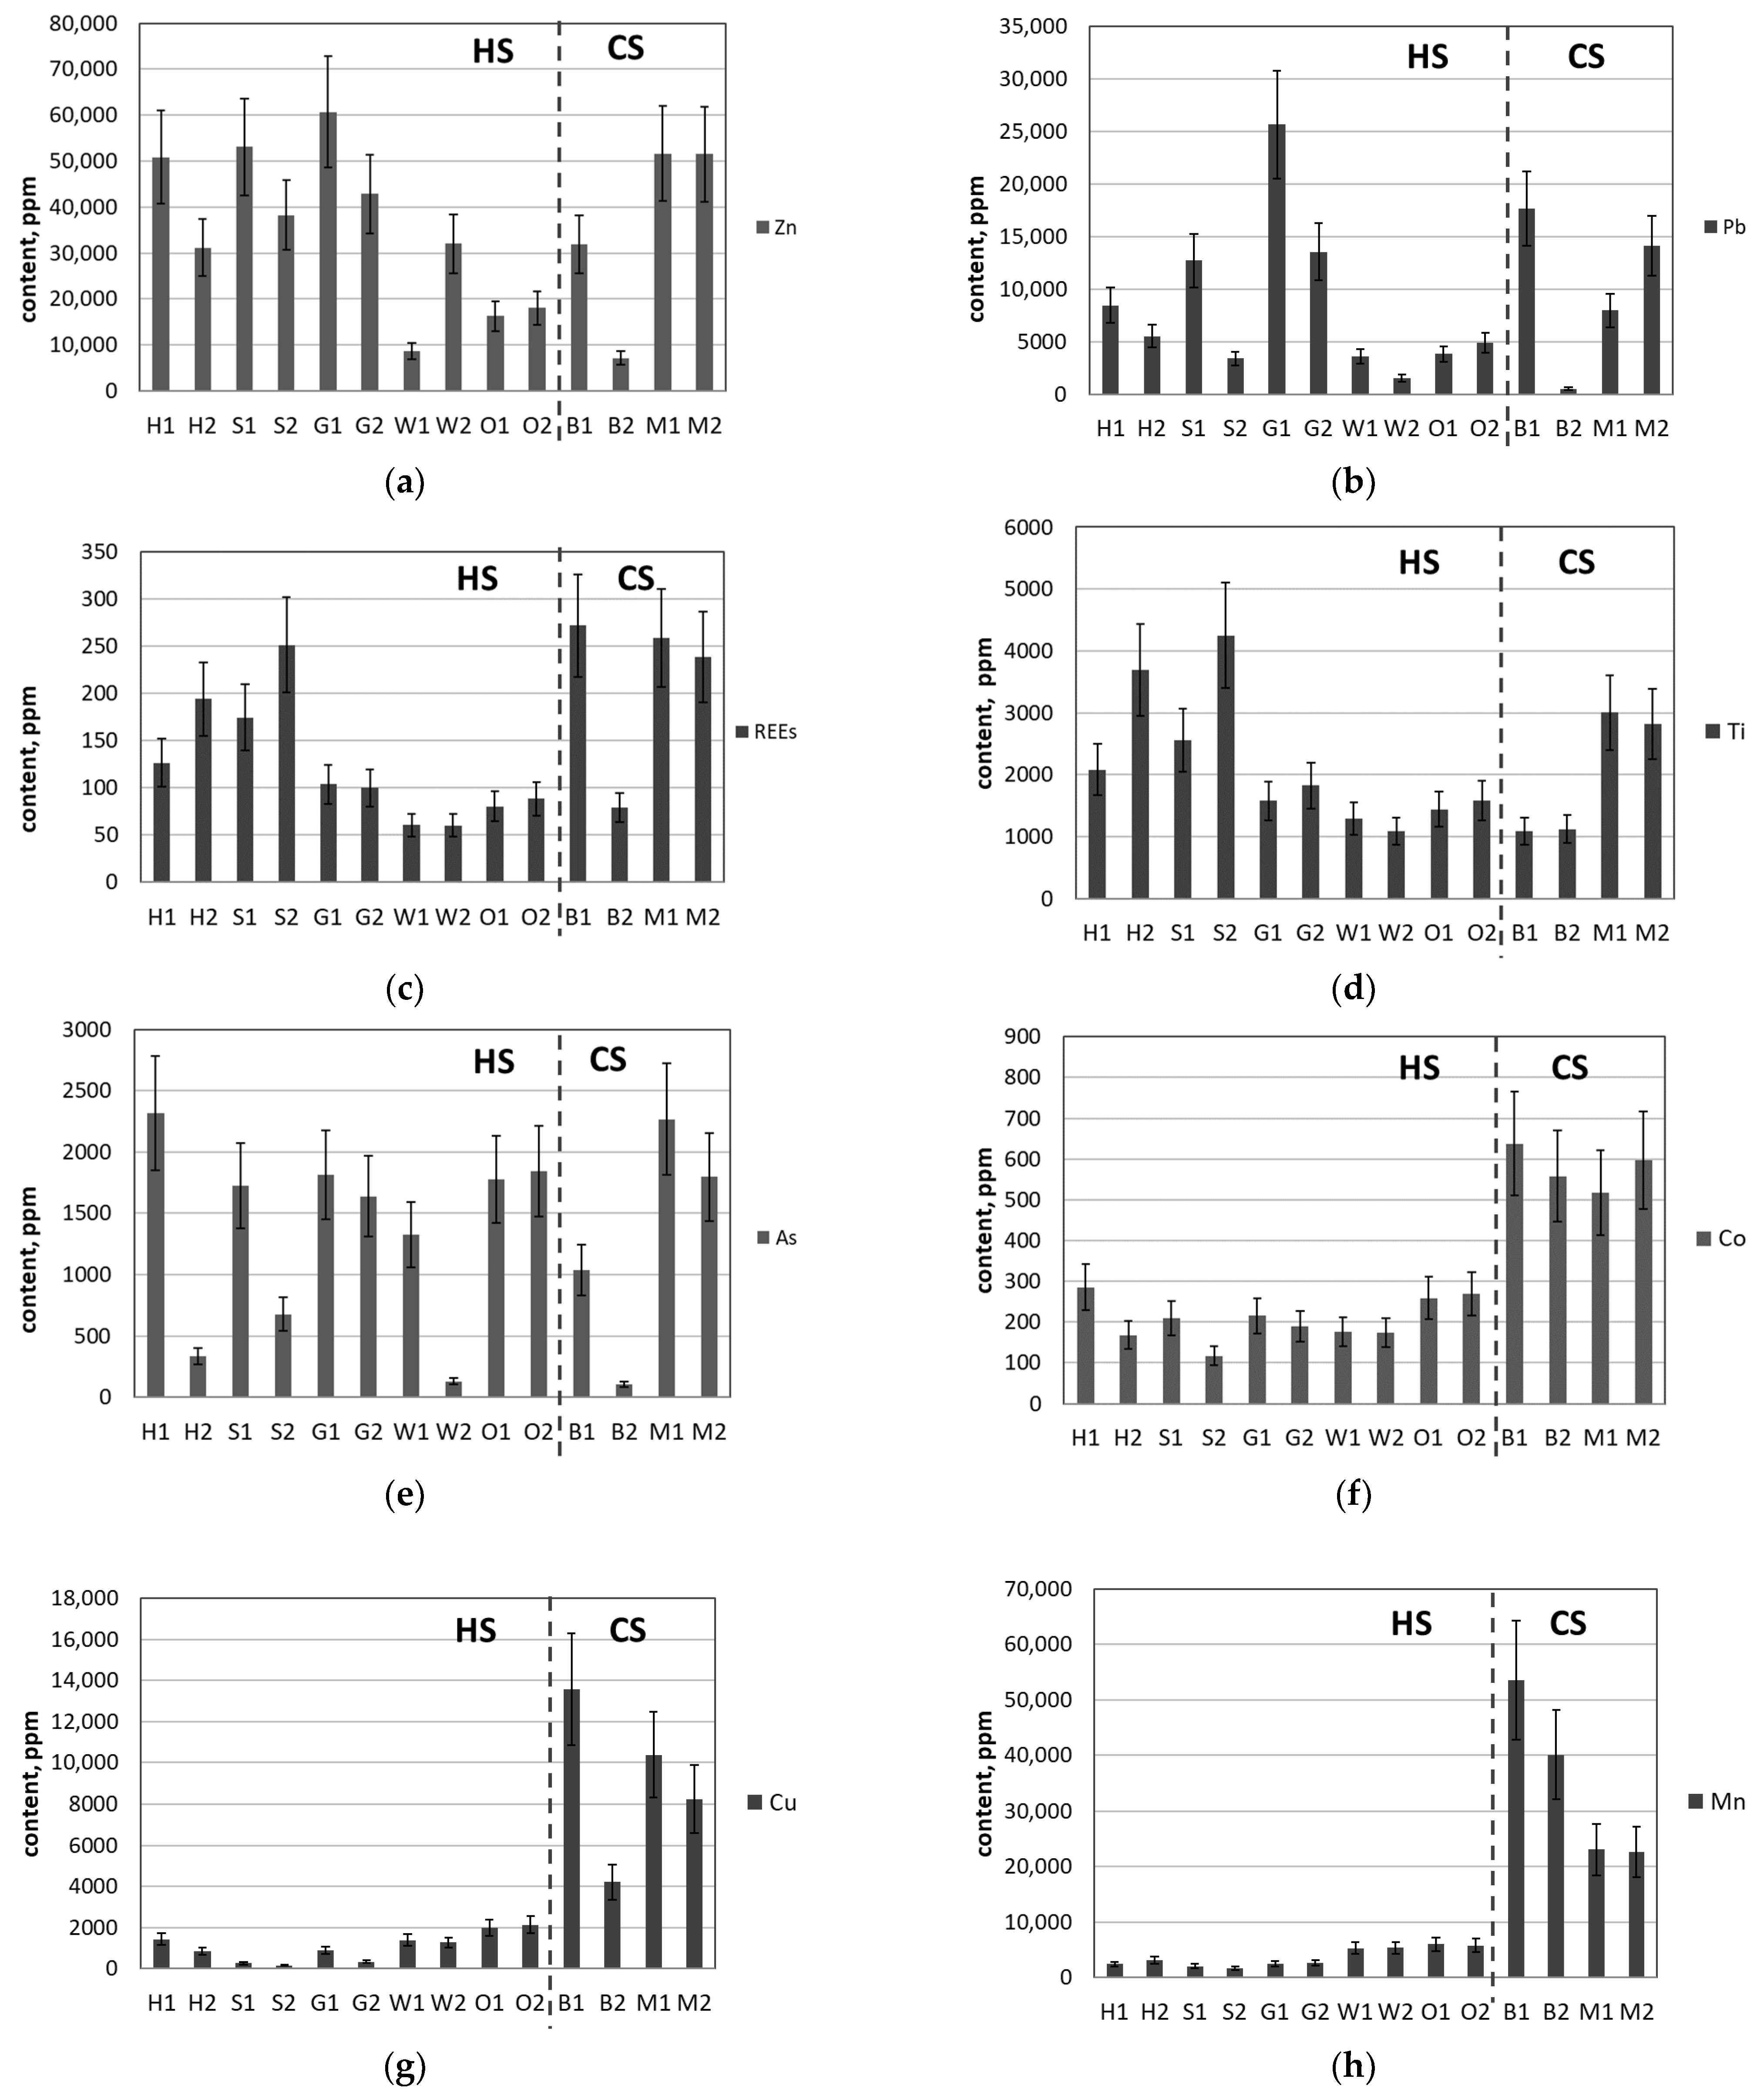
Figure 8.
Content of selected elements in the analysed slags: (a) Zn, (b) Pb, (c) REEs, (d) Ti, (e) As, (f) Co, (g) Cu, (h) Mn, (i) Ni, (j) Sb and (k) V. Legend: HS—historical slag samples and CS—contemporary slag samples. Expanded uncertainty of ± 20%, coverage factor of 2 and significance level of 95%.
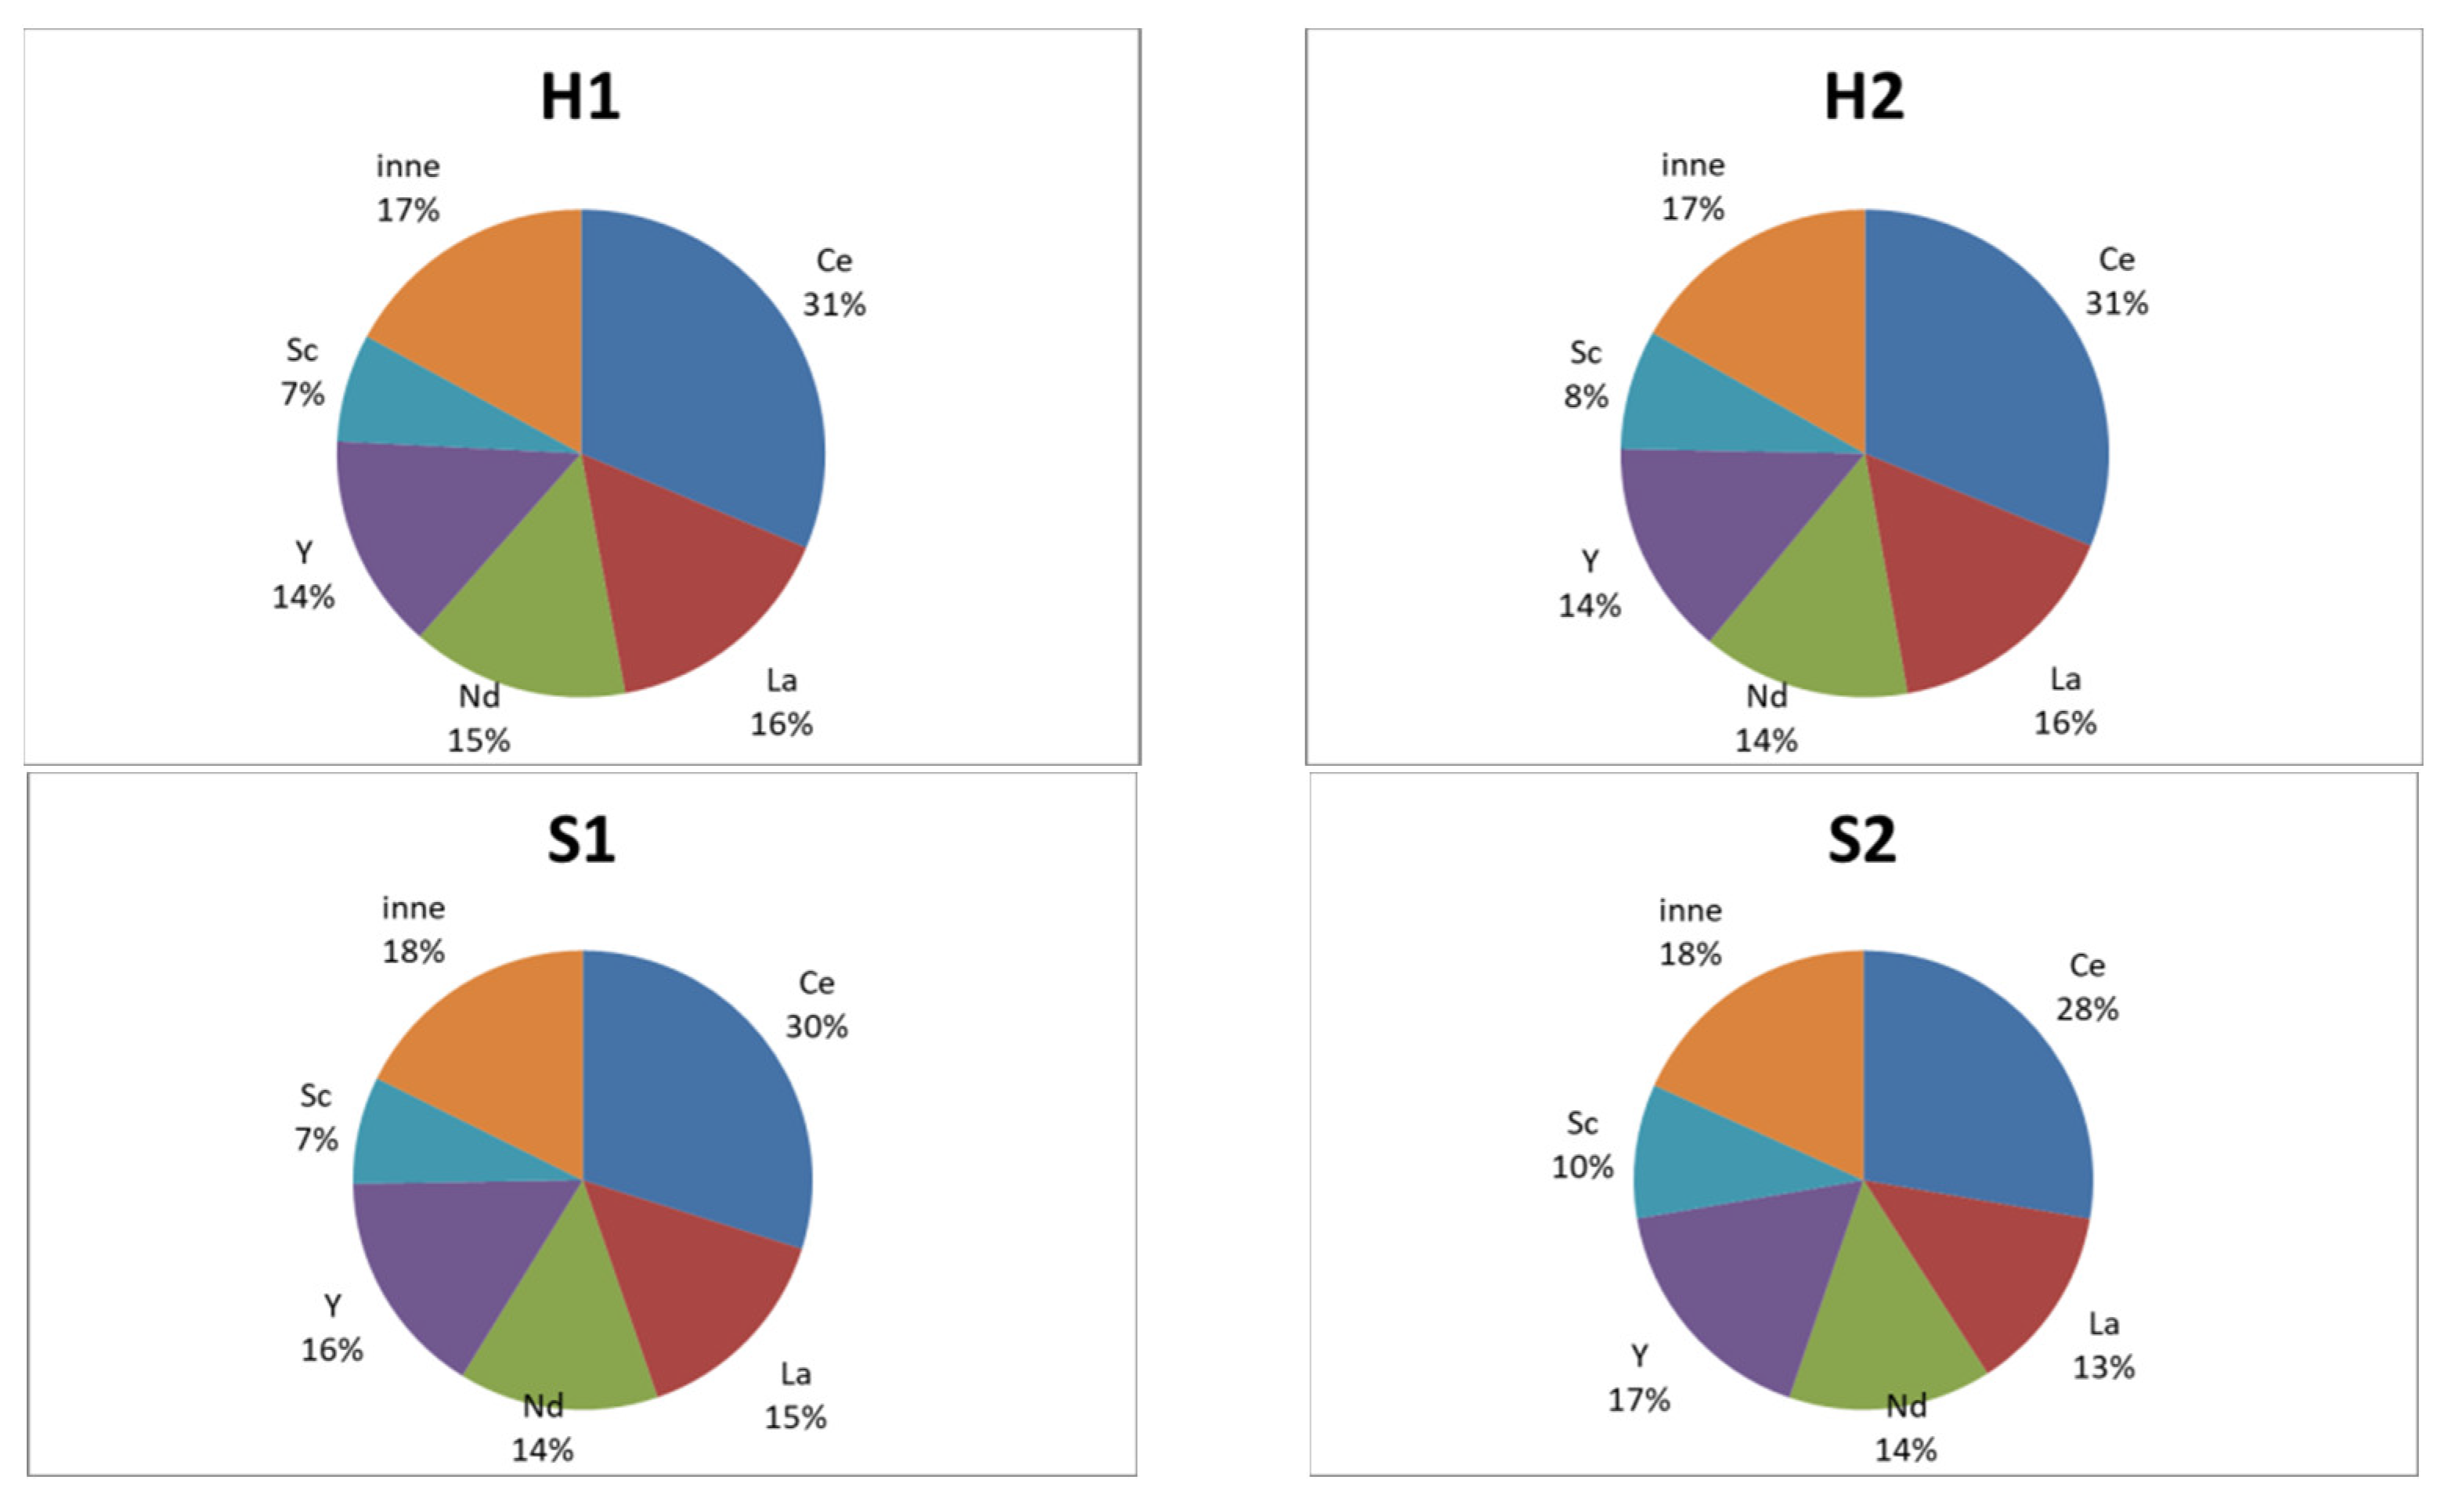
Figure 9.
Proportions of Ce, La, Nd, Y and Sc in the total rare earth element mass in the tested historical slags. Legend: inne is contribution of sum of Pr, Gd, Sm, Dy, Er, Yb, Eu, Ho, Lu, Tb, and Tm.
Figure 9.
Proportions of Ce, La, Nd, Y and Sc in the total rare earth element mass in the tested historical slags. Legend: inne is contribution of sum of Pr, Gd, Sm, Dy, Er, Yb, Eu, Ho, Lu, Tb, and Tm.
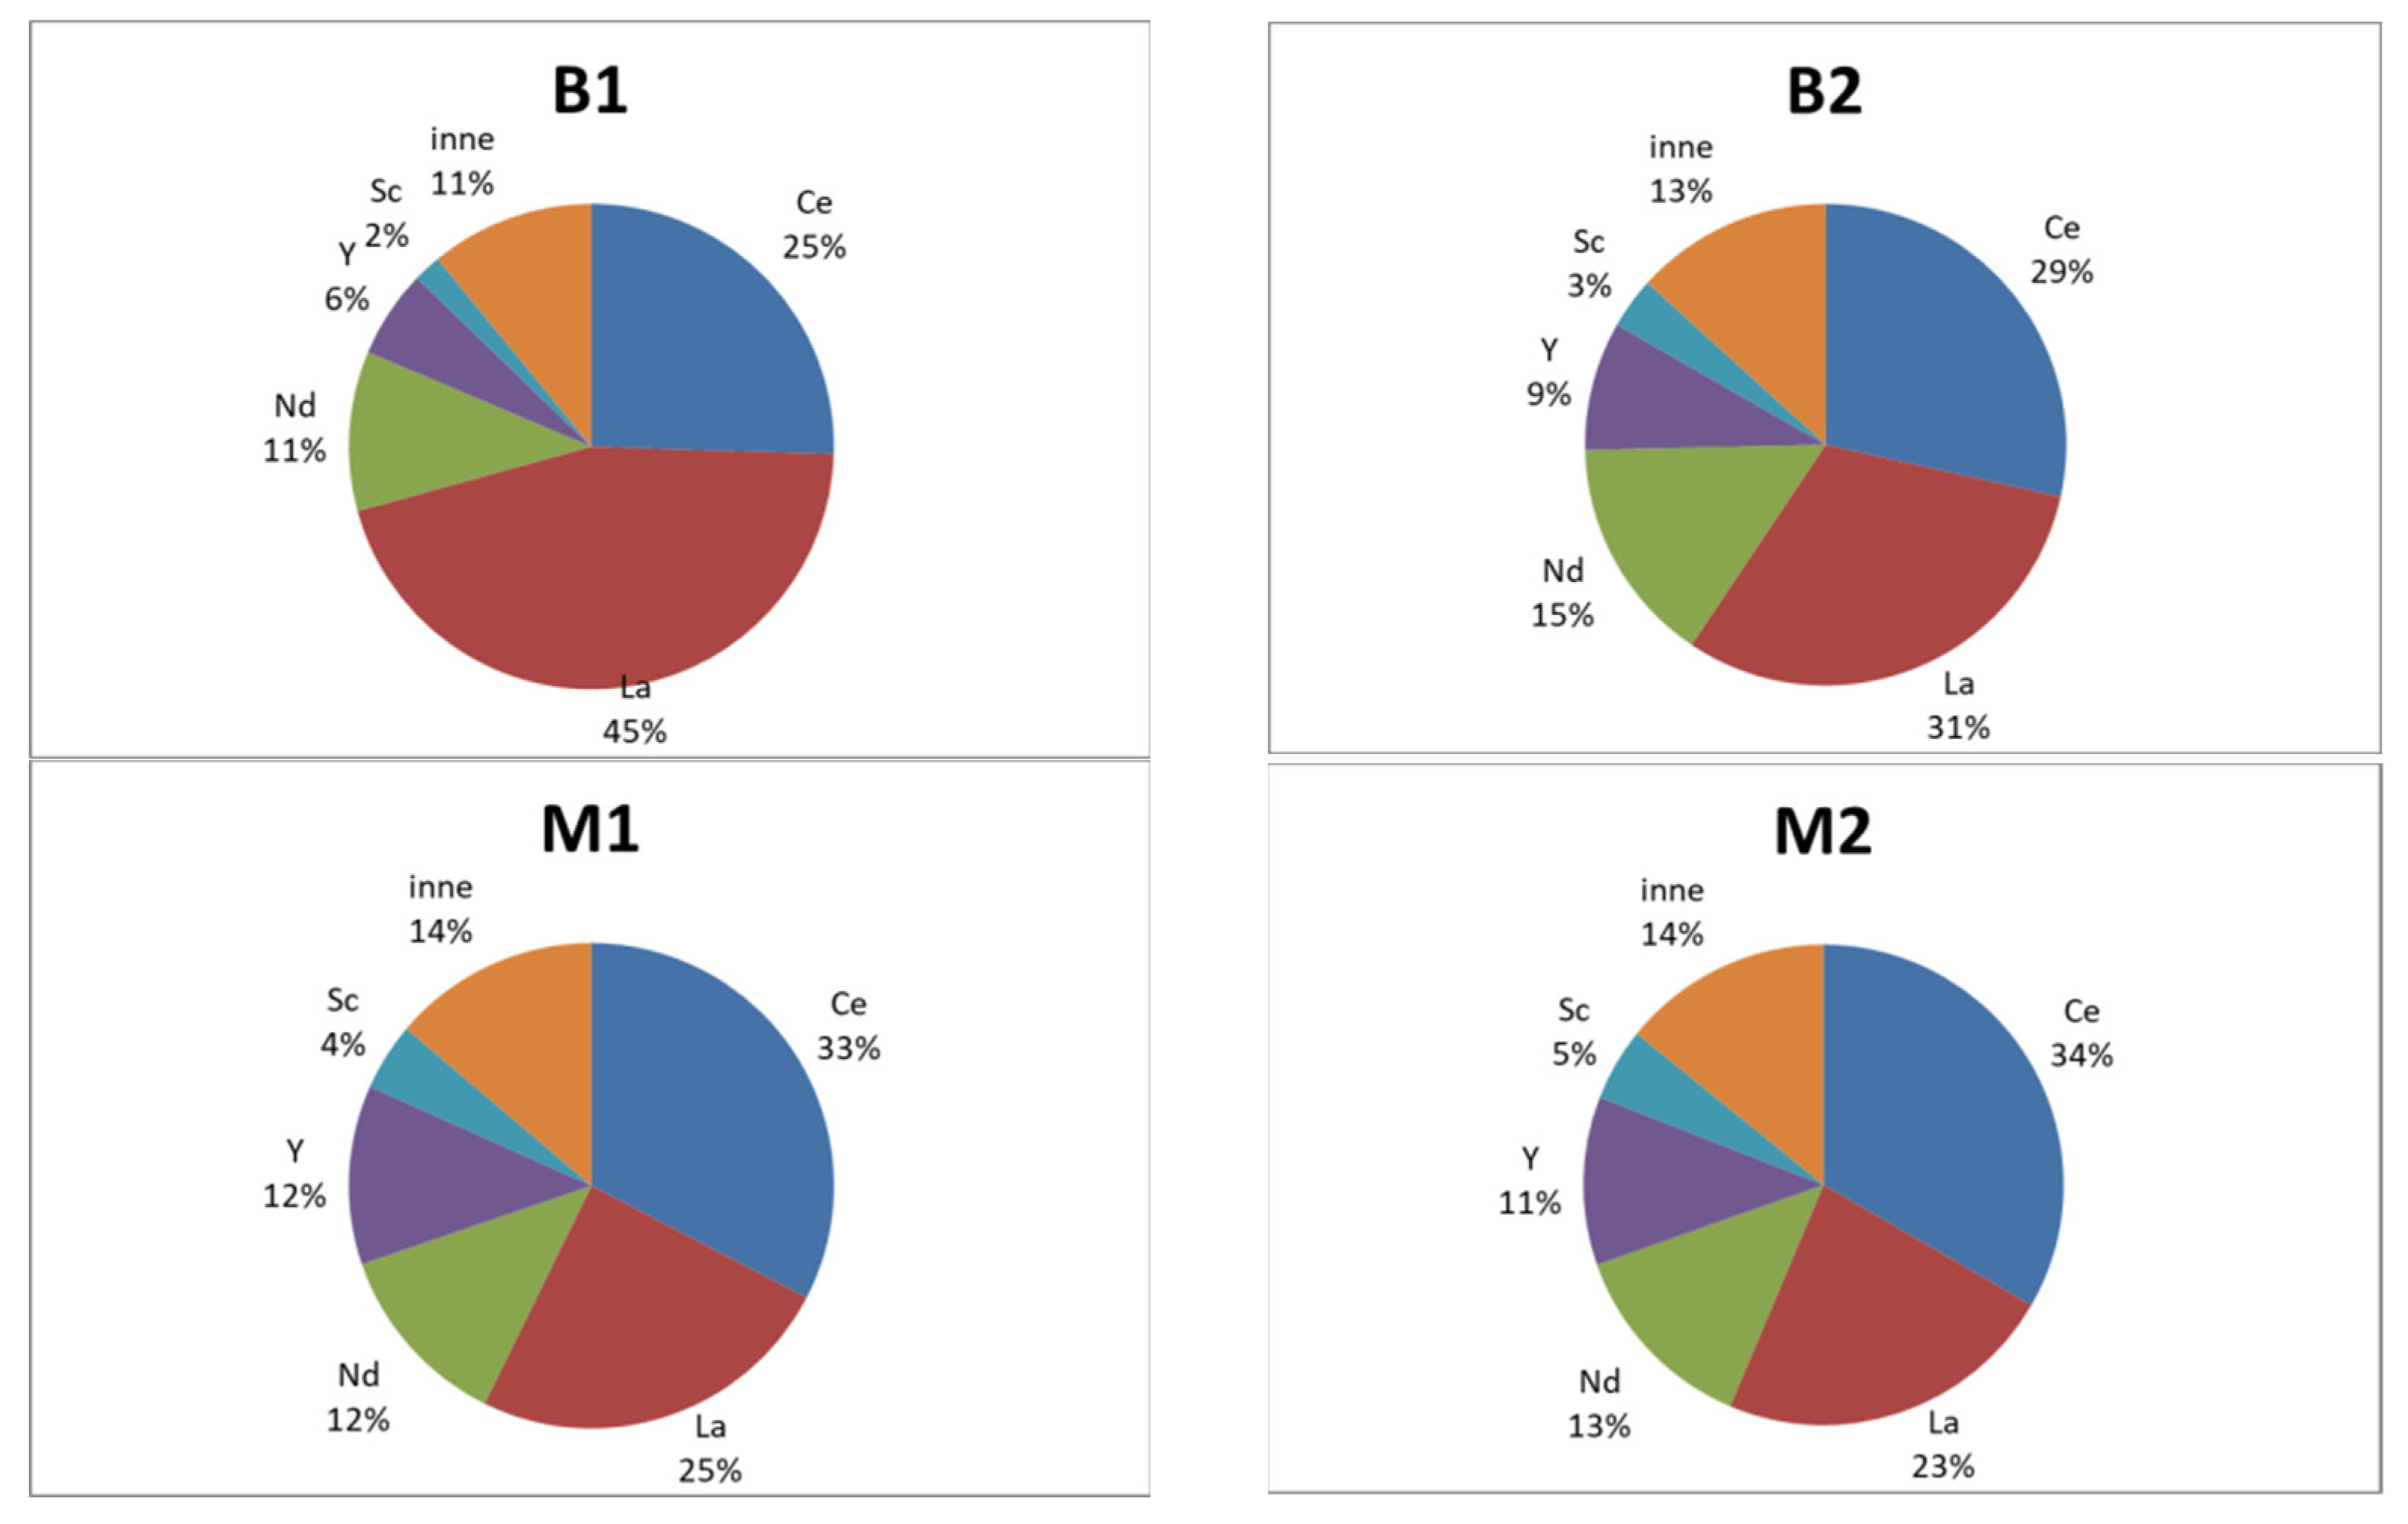
Figure 10.
Proportions of Ce, La, Nd, Y and Sc in the total rare earth element mass in the tested contemporary slags. Legend: inne is contribution of sum of Pr, Gd, Sm, Dy, Er, Yb, Eu, Ho, Lu, Tb, and Tm.
Figure 10.
Proportions of Ce, La, Nd, Y and Sc in the total rare earth element mass in the tested contemporary slags. Legend: inne is contribution of sum of Pr, Gd, Sm, Dy, Er, Yb, Eu, Ho, Lu, Tb, and Tm.
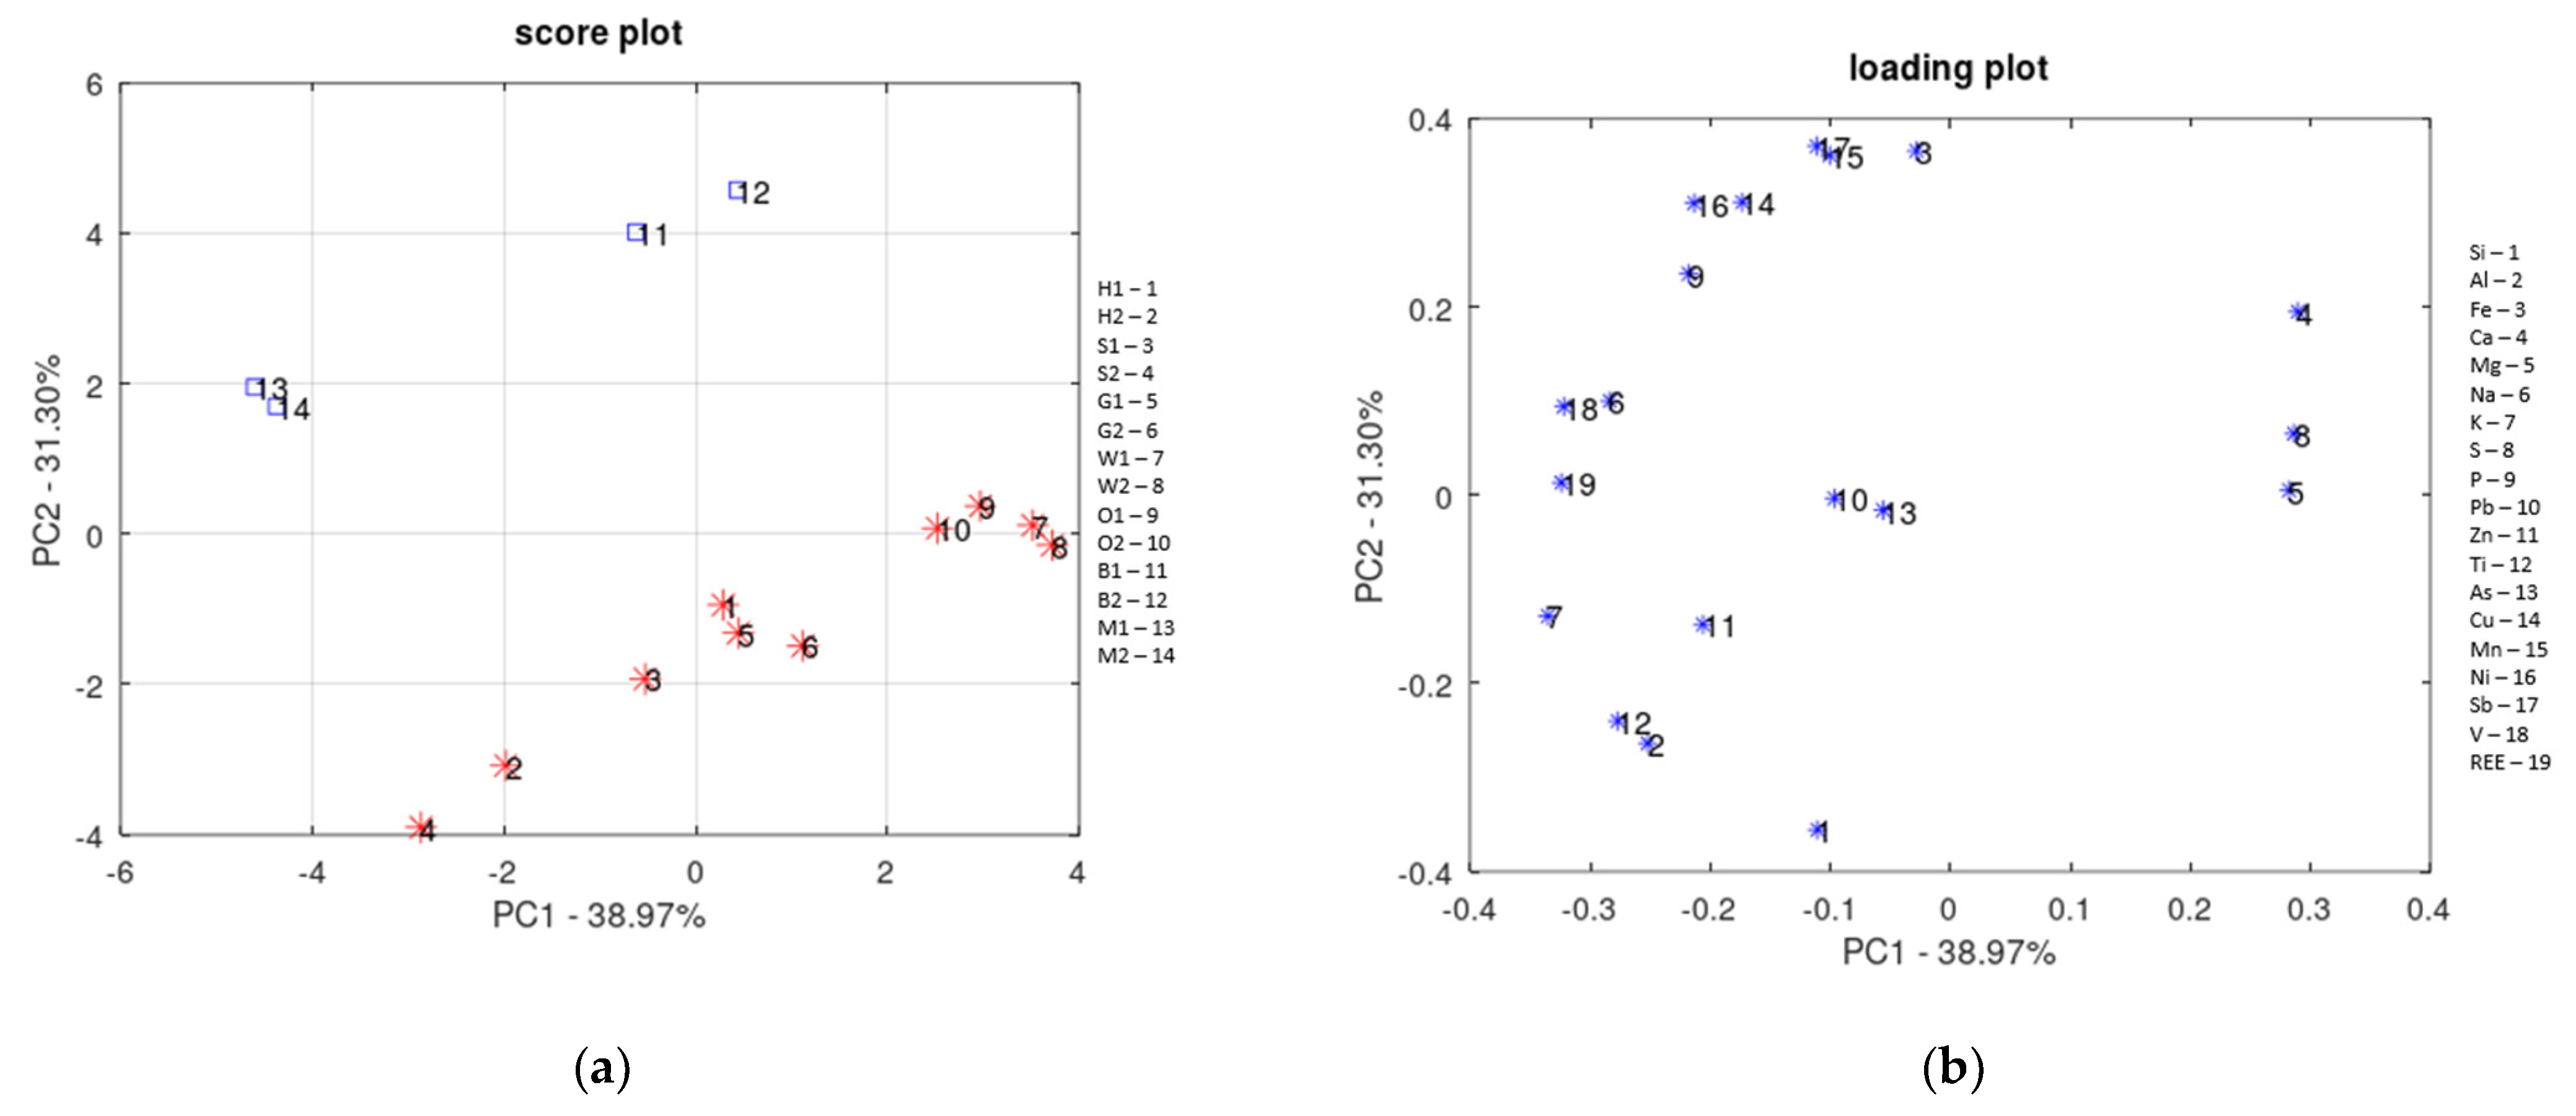
Figure 11.
PCA results for Xc (14 × 19) data: (a) object projections and (b) parameter projections onto the planes determined by particular principal component pairs.
Figure 11.
PCA results for Xc (14 × 19) data: (a) object projections and (b) parameter projections onto the planes determined by particular principal component pairs.
Table 1.
Current list of critical raw materials divided into groups (authors’ own review based on [
6]).
Table 1.
Current list of critical raw materials divided into groups (authors’ own review based on [
6]).
| METALS | METALLOIDS |
|---|
| heavy rare earth elements (HREEs) | germanium |
| light rare earth elements (LREEs) | silicon metal |
| platinum-group metals (PGMs) | arsenic |
| antimony | |
| beryllium | NON-METALS |
| bismuth | helium |
| gallium | phosphorus |
| hafnium | |
| cobalt | MINERALS AND OTHERS |
| lithium | barite |
| magnesium | borate |
| manganese | aluminium/bauxite |
| copper | phosphate rock |
| nickel | fluorspar |
| niobium | natural graphite |
| scandium | feldspar |
| strontium | coking coal |
| tantalum | |
| titanium metal | |
| vanadium |
| tungsten |
Table 2.
Locations and descriptions of sampling sites for slag testing.
Table 2.
Locations and descriptions of sampling sites for slag testing.
| Location No. | Coordinates | City | Smelter | Sample Name | Period | Technology |
|---|
| N | E |
|---|
| Historical slags |
| 5 | 50°15′59″ | 18°52′10″ | Ruda Śląska | Hugo | H1 | H2 | 1812–1933 | B/S |
| 7 | 50°18′39″ | 18°53′38″ | Świętochłowice | ZM Silesia | S1 | S2 | 1847–1998 | B/S |
| 8 | 50°19′00″ | 18°54′15″ | Świętochłowice | Guidotto | G1 | G2 | 1887–1937 | B/S |
| 9 | 50°22′04″ | 18°58′07″ | Piekary Śląskie | KH Waryński | W1 | W2 | 1926–1990 | ZORK |
| 11 | 50°20′31″ | 18°58′27″ | Piekary Śląskie | ZGH Orzeł Biały | O1 | O2 | 1924–1991 | ZORK |
| Contemporary slags |
| 16 | 50°16′36″ | 19°28′33″ | Bukowno | ZGH Bolesław S.A. | B1 | B2 | 1955–present | ZORK |
| 17 | 50°30′10″ | 18°55′33″ | Miasteczko Śląskie | HC Miasteczko Śląskie S.A. | M1 | M2 | 1960–present | ISF |
Table 3.
Characteristics of the collected slag samples.
Table 3.
Characteristics of the collected slag samples.
| Historical Slags | Contemporary Slags |
|---|
| Sample | Description | Sample | Description | Sample | Description |
|---|
| H1 | grains of 0–10 mm | W1 | fine grains | B1 | zinc-bearing sludge charge |
| H2 | grains over 20 mm | W2 | cemented grains | B2 | zinc-bearing dust charge |
| S1 | grains of 0–10 mm | O1 | grains of 0–10 mm | M1 | oxide charge |
| S2 | grains over 20 mm | O2 | grains over 10 mm | M2 | sulphide charge |
| G1 | red-coloured grains | | | | |
| G2 | red-coloured grains | | | | |
Table 4.
Content of the primary components (XRF) and LOI in the tested slag samples.
Table 4.
Content of the primary components (XRF) and LOI in the tested slag samples.
| Sample | SiO2 | Al2O3 | Fe2O3 | CaO | MgO | Na2O | K2O | TiO2 | P2O5 | LOI |
|---|
| wt% |
|---|
| H1 | 23.01 | 6.07 | 26.14 | 10.38 | 2.88 | 0.35 | 0.46 | 0.32 | 0.20 | 7.47 |
| H2 | 43.74 | 11.54 | 14.42 | 7.29 | 2.57 | 0.49 | 1.37 | 0.56 | 0.23 | 2.58 |
| S1 | 24.80 | 7.78 | 20.90 | 8.95 | 2.46 | 0.36 | 0.72 | 0.38 | 0.12 | 9.85 |
| S2 | 41.75 | 14.68 | 13.94 | 5.97 | 2.49 | 0.37 | 1.50 | 0.69 | 0.09 | 4.44 |
| G1 | 25.26 | 4.44 | 21.47 | 8.67 | 1.76 | 0.42 | 0.40 | 0.23 | 0.05 | 4.68 |
| G2 | 21.10 | 5.18 | 18.80 | 10.30 | 2.56 | 0.38 | 0.50 | 0.25 | 0.05 | 15.94 |
| W1 | 13.49 | 4.12 | 21.78 | 20.22 | 7.75 | 0.14 | 0.15 | 0.17 | 0.10 | 13.06 |
| W2 | 14.45 | 2.75 | 17.02 | 25.71 | 7.79 | 0.18 | 0.02 | 0.14 | 0.10 | 12.45 |
| O1 | 15.80 | 4.00 | 22.10 | 20.27 | 8.25 | 0.19 | 0.22 | 0.18 | 0.13 | 8.83 |
| O2 | 20.80 | 4.60 | 22.56 | 19.76 | 8.07 | 0.26 | 0.26 | 0.21 | 0.13 | 6.54 |
| B1 | 9.74 | 2.65 | 33.55 | 16.09 | 1.50 | 0.39 | 0.44 | 0.17 | 0.18 | 6.29 |
| B2 | 8.76 | 2.50 | 45.63 | 19.95 | 3.16 | 0.24 | 0.06 | 0.19 | 0.31 | 6.22 |
| M1 | 14.92 | 8.36 | 26.86 | 8.88 | 2.54 | 2.24 | 1.56 | 0.47 | 0.29 | 5.28 |
| M2 | 14.55 | 8.22 | 26.88 | 8.73 | 1.99 | 1.49 | 1.39 | 0.47 | 0.33 | 5.46 |
Table 5.
Phase compositions of the investigated historical slag samples (XRD).
Table 5.
Phase compositions of the investigated historical slag samples (XRD).
| Phase | H1 | H2 | S1 | S2 | G2 | W1 | O2 |
|---|
| wt% |
|---|
| Gypsum (CaSO4 × 2H2O) | 68.0 | 56.0 | 69.0 | 26.0 | 38.0 | 77.0 | 46.0 |
| Quartz (SiO2) | 4.5 | 11.5 | 6.5 | 19.5 | 6.5 | 0.5 | 2.5 |
| Hematite (Fe2O3) | 4.0 | 2.0 | 3.0 | 2.0 | 1.0 | 3.0 | 6.0 |
| Magnetite (FeFe2O4) | 2.0 | 2.0 | 3.0 | 2.0 | 4.0 | 3.0 | 2.0 |
| Calcite (CaCO3) | no | no | no | 1.5 | 6.5 | 1.5 | 5.5 |
| Tridymite (SiO2) | no | no | no | 4.0 | 6.0 | no | 5.0 |
| Augite (Ca, Mg, Fe, Ti, Al)2[Si2O6]) | 2.0 | 3.0 | no | 3.0 | 2.0 | 1.0 | 4.0 |
| Plagioclase * | 1.0 | 3.0 | 1.0 | 4.0 | 3.0 | 1.0 | 2.0 |
| Anhydrite (CaSO4) | 1.0 | no | no | 3.0 | 1.0 | no | 3.0 |
| Dolomite (CaMg(CO3)2) | no | no | no | 1.0 | 3.0 | 1.0 | 1.0 |
| Ankerite (CaFe(CO3)2 | no | no | no | no | 2.0 | no | 3.0 |
| Ferro-actinolite (Ca2Fe5[Si4O11(OH)]2) | no | no | no | 4.0 | no | no | no |
| Cristobalite (SiO2) | 1.0 | no | 1.0 | 2.0 | no | no | no |
| Mullite (3Al2O3 × 2SiO2) | no | no | no | 2.0 | 2.0 | no | no |
| Melanterite (FeSO4 × 7H2O) | 1.0 | 1.0 | <1.0 | no | no | no | no |
| Illite (KAl2[AlSi3O10(OH)2]) | no | no | no | 1.0 | no | no | no |
| Zincite (ZnO) | no | no | no | 1.0 | no | no | no |
| Bassanite (CaSO4 × 0.5H2O) | no | no | no | 1.0 | no | no | no |
| Sphalerite (ZnS) | no | no | no | <1.0 | no | no | no |
| Anglesite (PbSO4) | no | no | no | <1.0 | no | <1.0 | no |
| Amorphous substance | 14.5 | 19.5 | 15.5 | 20.5 | 24.5 | 10.5 | 18.5 |
Table 6.
Phase compositions of the investigated contemporary slag samples (XRD).
Table 6.
Phase compositions of the investigated contemporary slag samples (XRD).
| Phase | B1 | B2 | M1 | M2 |
|---|
| wt% |
|---|
| Spinel (MgAl2O4) | no | no | 24.0 | 26.0 |
| Wüstite (FeO) | 5.0 | 21.0 | 2.0 | 2.0 |
| Magnetite (FeFe2O4) | 11.0 | 8.0 | 2.0 | 2.0 |
| Quartz (SiO2) | 9.5 | 9.5 | 1.5 | 1.5 |
| Fluorite (CaF2) | 8.5 | <1.0 | 6.5 | 5.5 |
| Augite (Ca, Mg, Fe, Ti, Al)2[Si2O6]) | 7.0 | 3.0 | 3.0 | 2.0 |
| Gehlenite (Ca2Al[(Si, Al)2O7]) | 5.0 | 2.0 | 2.0 | 2.0 |
| Wollastonite (CaSiO3) | 6.0 | 2.0 | 2.0 | no |
| Hardystonite (Ca2Zn[Si2O7]) | 6.0 | 3.0 | no | no |
| Plagioclase * | 3.0 | 3.0 | 3.0 | 3.0 |
| Hematite (Fe2O3) | 1.0 | 2.0 | 1.0 | 2.0 |
| Na2Si2O5 substance | 2.0 | 3.0 | no | no |
| FeSiO3 substance | <1.0 | 4.0 | 1.0 | no |
| Iron (Fe) | no | 5.0 | no | no |
| Melanterite (FeSO4 ×7H2O) | no | 5.0 | no | no |
| Maghemite (Fe2O3) | <1.0 | 2.0 | no | no |
| Zincite (ZnO) | no | 2.0 | <1.0 | no |
| Na2CaSi2O6 substance | <1.0 | no | no | no |
| Amorphous substance | 34.5 | 24.5 | 50.5 | 52.5 |
Table 7.
Slag dissolution efficiency assessment.
Table 7.
Slag dissolution efficiency assessment.
| Sample | Slag Dissolution Efficiency, SR |
|---|
| Procedure A * | Procedure B * |
|---|
| % |
|---|
| H1 | 84.4 | 99.4 |
| M1 | 83.2 | 99.0 |
Table 8.
Efficiency assessment of rare earth element recovery from the CRM.
Table 8.
Efficiency assessment of rare earth element recovery from the CRM.
| Element | REE Content | Recovery Efficiency, SR |
|---|
| Certified (In CRM) | Detection Limit | Measured (In Solution) |
|---|
| ppm | ppm | ppm | % |
|---|
| La | 23.7 ± 0.2 | <0.01 | 23.1 ± 4.6 | 97.5 |
| Ce | 60.3 ±1.8 | <0.01 | 67.1 ± 13.4 | 111.3 |
| Pr | 7.9 ± 0.6 | <0.01 | 7.9 ± 1.6 | 100.0 |
| Nd | 32.9 ± 2.2 | <0.01 | 32.0 ± 6.4 | 97.3 |
| Sm | 12.5 ± 0.8 | <0.01 | 12.5 ± 2.5 | 100.0 |
| Eu | 0.16 ± 0.03 | <0.01 | 0.15 ± 0.03 | 93.8 |
| Gd | 14.8 ± 0.3 | <0.01 | 15.3 ± 3.1 | 103.4 |
| Tb | 3.3 ± 0.2 | <0.01 | 3.2 ± 0.6 | 97.0 |
| Dy | 20.7 ± 1.1 | <0.01 | 21.7 ± 4.3 | 104.8 |
| Ho | 4.5 ± 0.2 | <0.01 | 4.6 ± 0.9 | 102.2 |
| Er | 13.1 ± 0.9 | <0.01 | 14.4 ± 2.9 | 109.9 |
| Tm | 2.2 ± 0.2 | <0.01 | 2.3 ± 0.5 | 104.5 |
| Yb | 14.9 ± 1.0 | <0.01 | 16.8 ± 3.4 | 112.8 |
| Lu | 2.4 ± 0.2 | <0.01 | 2.5 ± 0.5 | 104.2 |
| Sc | 5.4 ± 0.5 | <5 | 7.3 ± 1.5 | 135.2 |
| Y | 128 ± 25 | <0.01 | 141 ± 28 | 110.2 |
Table 9.
Pearson correlation coefficients between the results obtained by XRF and ICP-OES.
Table 9.
Pearson correlation coefficients between the results obtained by XRF and ICP-OES.
| Element | Pearson Correlation Coefficients, R2 | Element | Pearson Correlation Coefficients, R2 |
|---|
| Pb | 0.86 | Mn | 0.99 |
| Zn | 0.87 | Ni | 0.95 |
| Ti | 0.97 | Sb | 0.73 |
| As | 0.94 | V | 0.77 |
| Cu | 0.98 | Co | 0.78 |
Table 10.
Minimum and maximum contents of selected elements in the analysed slag samples.
Table 10.
Minimum and maximum contents of selected elements in the analysed slag samples.
| Element | Content |
|---|
| Min. | Max. |
|---|
| ppm |
|---|
| Li | 27 ± 6 | 427 ± 85 |
| Sr | 125 ± 25 | 622 ± 124 |
| Bi | 0.0 | 160 ± 32 |
| W | 1.4 ± 0.3 | 61 ± 12 |
| Ge | 3.5 ± 0.7 | 51 ± 10 |
| Ta | 0.3 ± 0.1 | 1.1 ± 0.2 |
Table 11.
Statistical analysis of the selected element contents in analysed samples of historical and contemporary slags.
Table 11.
Statistical analysis of the selected element contents in analysed samples of historical and contemporary slags.
| Element | Historical Slags | Contemporary Slags |
|---|
| Content |
|---|
| Minimum | Maximum | Average | Minimum | Maximum | Average |
|---|
| ppm |
|---|
| Zn | 8643 | 60,676 | 35,195 | 7174 | 51,626 | 35,550 |
| Pb | 1524 | 25,663 | 8310 | 520 | 17,631 | 10,056 |
| REEs | 60 | 251 | 124 | 79 | 272 | 212 |
| Ti | 1093 | 4253 | 2141 | 1085 | 3005 | 2009 |
| As | 129 | 2318 | 1359 | 106 | 2268 | 1302 |
| Co | 117 | 286 | 206 | 518 | 637 | 578 |
| Mn | 1609 | 5991 | 3648 | 22,615 | 53,590 | 34,848 |
| Cu | 167 | 2138 | 1069 | 4213 | 13,572 | 9097 |
| Ni | 63 | 117 | 99 | 1611 | 3498 | 2715 |
| Sb | 8 | 164 | 60 | 276 | 375 | 321 |
| V | 29 | 161 | 68 | 79 | 241 | 163 |
Table 12.
Potential for using Polish slags from Pb-Zn metallurgy as a source of selected metals and critical raw materials.
Table 12.
Potential for using Polish slags from Pb-Zn metallurgy as a source of selected metals and critical raw materials.
| Sample | Content |
|---|
| Zn + Pb | REE | Ti + As +
Mn + Cu | Co + Ni +
Sb + V |
|---|
| wt% | ppm | wt% | ppm |
|---|
| H1 | 5.93 | 126 | 0.82 | 496 |
| H2 | 3.67 | 194 | 0.80 | 365 |
| S1 | 6.58 | 174 | 0.66 | 427 |
| S2 | 4.17 | 251 | 0.67 | 402 |
| G1 | 8.63 | 104 | 0.67 | 472 |
| G2 | 5.64 | 100 | 0.64 | 354 |
| W1 | 1.22 | 60 | 0.93 | 370 |
| W2 | 3.36 | 60 | 0.78 | 278 |
| O1 | 2.01 | 80 | 1.12 | 587 |
| O2 | 2.29 | 88 | 1.14 | 585 |
| B1 | 4.95 | 272 | 6.93 | 2702 |
| B2 | 0.77 | 79 | 4.55 | 4180 |
| M1 | 5.96 | 258 | 3.87 | 4482 |
| M2 | 6.56 | 238 | 3.55 | 3740 |
Table 13.
PCA parameters (19 parameters).
Table 13.
PCA parameters (19 parameters).
| Item | Parameter | Unit | Item | Parameter | Unit |
|---|
| 1 | Si content | ppm | 10 | Pb content | ppm |
| 2 | Al content | ppm | 11 | Zn content | ppm |
| 3 | Fe content | ppm | 12 | Ti content | ppm |
| 4 | Ca content | ppm | 13 | As content | ppm |
| 5 | Mg content | ppm | 14 | Cu content | ppm |
| 6 | Na content | ppm | 15 | Mn content | ppm |
| 7 | K content | ppm | 16 | Ni content | ppm |
| 8 | S content | ppm | 17 | Sb content | ppm |
| 9 | P content | ppm | 18 | V content | ppm |
| | | | 19 | REE content | ppm |


 ,
, 


