Article

Lake-Level-Fluctuation Control on Shale Oil Enrichment of the Salinized Lacustrine Organic-Rich Shale in the Paleogene Biyang Depression, East China

1
State Key Laboratory of Shale Oil and Gas Enrichment Mechanisms and Efficient Development, Beijing 100083, China
2
Sinopec Key Laboratory of Shale Oil/Gas Exploration and Production Technology, Beijing 100083, China
3
School of Earth Resources, China University of Geosciences, Wuhan 430074, China
4
Sinopec Petroleum Exploration and Production Research Institute, Beijing 100083, China
*
Authors to whom correspondence should be addressed.
Minerals 2024, 14(1), 94; https://doi.org/10.3390/min14010094
Submission received: 24 October 2023 / Revised: 22 November 2023 / Accepted: 5 December 2023 / Published: 14 January 2024

Abstract

:
The paleolake level, which is controlled by the moisture balance (precipitation minus evaporation) within the lake basin, is a significant factor in determining the deposition of lacustrine organic-rich shale (LORS) across geological time, and hence influences shale oil enrichment. However, the impact of lake-level-fluctuations on shale oil enrichment of LORS is not well understood. Based on an integration of bulk geochemistry, organic petrography, pyrolysis gas chromatography, and element compositions, we address this issue using the Paleogene Biyang Depression in East China as an example. High lake levels, combined with anoxic–suboxic conditions, brackish–saline water, high productivity, and low detrital influx, are favorable for LORS deposition, which is characterized by a large distribution area and thickness, a high potential for oil generation and emplacement, and a high free shale oil content. In contrast, LORS deposited during low lake levels, with suboxic–dysoxic conditions, fresh–brackish water, low productivity, and high detrital influx, has a small distribution area and thickness, a low potential for oil generation and emplacement, and a low free shale oil content (a comparable maturity was present in all the studied LORS). Our data suggests that the elevated lake level led to higher salinity, stronger reduction conditions, higher productivity, and lower clastic inflow in the paleolake, forming LORS with higher shale oil potential. It has a positive effect on shale oil enrichment of LORS. The findings are also applicable to regional shale oil exploration.

Graphical Abstract

1. Introduction

Shale oil is a type of unconventional resource found in fine-grained sedimentary rocks that must be hydraulically fractured to extract the oil. Shale oil was discovered and developed first in North America; since then, other successful shale oil plays have been reported in Russia, Argentina, and China [1,2,3,4]. Shale oil is produced in continental strata in China, although marine strata are common in other regions [4]. The proven geological reserves of medium-to-high maturity (Ro > 0.7%) continental shale oil in China has reached 1.5 billion tons by the end of 2022, and achieved an annual production of 3.2 million tons [5].
One of the foundations for shale oil enrichment is the deposition of organic-rich shale, which commonly refers to fine-grained sedimentary rocks with elevated total organic carbon (TOC) contents, consisting primarily of clay-sized particles (<4 μm), with variable amounts of silt-sized floating grains (up to 62.5 μm) of biogenic and detrital origin [6]. Given the shallow water depth, restricted area, and often rapid sedimentation rates, lacustrine organic-rich shale (LORS) exhibits greater heterogeneity in organic and inorganic components than that in marine settings [7]. Because of the high heterogeneity, considerable swings in shale oil enrichment will occur even at short depth intervals (meter- to decimeter-scale), making identifying the sweet spot of shale oil in LORS particularly difficult. Although environmental variations in paleolakes can influence the shale oil enrichment of LORS, how they do so is not well understood.
Recent studies have shown that the accumulation of organic matter in the shale sequence is controlled by a complex non-linear interaction between three factors: productivity, preservation conditions, and sedimentation rates. Preliminary studies of the marine environment indicate that sea level change plays a fundamental controlling role in all three factors, which in turn affects the pattern of organic matter enrichment [8]. For example, relative sea level rise may result in fewer detrital inputs and enhanced reduction conditions. Relative sea level fall may have the opposite effect. Compared to marine shale, lacustrine shale is usually deposited in a more restricted but variable environment. Relative lake-level variation influences primary productivity, detrital input, and benthic redox conditions [9].
The Biyang Depression was the first continental shale oil breakthrough in China. The horizontal well, BYHF-1, was drilled in the central deep sag of the depression in 2012, with a maximum daily production of 24.2 tons [10]. The third member of the Paleogene Hetaoyuan Formation (Eh3) was the primary target for shale oil exploration in the Biyang Depression, in which thick LORS with varying organic matter content and kerogen type was deposited [11]. Previous studies have linked the LORS variance to lacustrine environmental changes [12]. For example, Song et al. discussed the influence of paleoclimate and transgression on organic-rich shale deposits in saline lacustrine facies [12,13]. He et al. discussed the influence of salinity on the formation of source rocks and its effect on the oil content of shale [14]. Li et al. discussed the influence of the paleoenvironment on the enrichment and productivity of continental shale oil [15]. These studies provide an excellent model for researching the effect of lake-level-fluctuations on shale oil enrichment.
The goal of this research is to reconstruct the lake-level-fluctuations and reveal their effect on shale oil enrichment in the Paleogene Biyang Depression. To meet this goal, organic petrography, bulk geochemistry, pyrolysis gas-chromatography (Py-GC), and element geochemistry analyses were performed on LORS from eight wells in the Biyang Depression.
Upon the integration of the results of organic petrology and elemental geochemistry, the paleolacustrine conditions, including paleosalinity, redox conditions, paleoproductivity, and clastic flow are revealed, and the relative lake level is reconstructed. Combined with lake-level-fluctuation and shale oil enrichment, the influence is discussed. The findings provide additional constraints regarding the effect of lacustrine environmental changes on shale oil enrichment, as well as provide further knowledge for regional shale oil exploration.

2. Geological Setting

The Biyang Depression is a non-marine faulted depression located in the eastern Nanxiang Basin in East China (Figure 1A,B). Despite the fact that the depression only covers about 1000 km2, it has been discovered to hold 240 and 285 million tons of conventional oil and shale oil, respectively [10]. The depression is divided into three sections: the northern slope belt, the central deep sag, and the southern steep slope belt, with the central deep sag serving as the key location for shale oil exploration and development (Figure 1C). The depression is shaped as a half-graben, and the strata thicken gradually from southwest to northeast (Figure 1D).
Paleogene strata, with a maximum thickness of 7700 m, are the primary depression fill. The structural evolution of the Paleogene Biyang Depression is split into four stages: the early initial rifting stage, the late initial rifting stage, the maximum rifting stage, and the late rifting stage (Figure 1E) [16]. During the maximum rifting stage, the lake level in the depression was relatively high, forming a semi-deep-to-deep lake that was conducive to LORS deposition [17]. The third member of Paleogene Hetaoyuan Formation (Eh3) is separated into eight units based on lithological assemblage; from bottom to top are Units VIII to Unit I, and the LORS was largely deposited within Units V to II (Figure 1E). As a result, these units were chosen as the study’s goal intervals.

3. Samples and Methods

A total of 245 LORS samples were collected from Units V to II (abbreviated as Eh35, Eh34, Eh33, and Eh32) from eight wells in the Biyang Depression, which are located in the central deep sag and the southern steep slope belt (Figure 1C). Table 1 contains detailed information about the samples and analytical methods used in the investigation. Because Eh34 and Eh35 have similar lithological, petrophysical, and geochemical features, the two units were discussed together and referred to as Eh34+5 in the study. All samples underwent bulk (TOC, S, and Rock-Eval pyrolysis) and element geochemistry (major and trace elements) analysis. Based on the findings, 47, 17, and 53 samples from three groups (Eh32, Eh33, and Eh34+5) were chosen for organic petrography, vitrinite reflectance (Ro), and pyrolysis gas chromatography (Py-GC), respectively.
To achieve a flat surface for organic petrographic examination, samples were polished. No oxidative reagents or ultra-sonication were used during the pre-treatment. The residues were sieved using a 10 μm nylon mesh and mounted on slides with Canada Balsam, then a Nikon microscope was used with reflected and fluorescent light and an oil-immersion objective to observe the polished samples. Ro was evaluated on polished samples using standard methods [18]. Each polished block had at least 20 telovitrinite points measured.
The shale samples were ground; TOC analysis is a commonly used method to determine the organic content in shale. The shale samples were ground into a powder with a particle size of 200 mesh and soaked in hydrochloric acid to remove carbonate minerals present in the samples. After acidifying samples to remove carbonate, total organic carbon (TOC) and total sulfur (S) values were analyzed using a Leco CS-200 (LECO, Laboratory Equipment Corporation, St. Joseph, MI, USA). A Rock-Eval 6 was used to perform pyrolysis, with the aim of determining the free hydrocarbons (S1), the hydrocarbon generated from hydrocarbon cracking (S2), and the temperature of maximum hydrocarbon generation (Tmax).
For Py-GC, thermally pre-treated samples (~300 °C for 5 min to liberate volatile compounds) were pyrolyzed in a Quantum MSSV-2 (GEOS4 GMBH, Michendorf, Germany) thermal analyzer from 300 °C to 600 °C at 50 °C/min followed by a 2-min isothermal phase. Pyrolysis products were injected onto a 50 m × 0.32 mm dimethylpolysiloxane HP-Ultra 1 capillary column (0.52 μm film thickness) and evaluated online using an Agilent 6890a GC equipped with a flame ionization detector (FID). The GC oven temperature was set to rise from 30 °C to 320 °C at a rate of 5 °C/min.
A Shimadzu XRF-1800 (Shimazu, Kyoto, Japan) was used to determine major element oxides in the samples. To calculate the percentage of loss on ignition (LOI), pulverized samples (<200 mesh) were heated to 815 °C in a muffle furnace until the weights were stable. The residuals were combined with lithium tetraborate before being pressed into powder mounts for XRF analysis. After preparing them with a 2-mL HNO3 (65% v/v) and 5-mL HF (40% v/v) mixture, samples were examined using a Thermo Fisher Scientific Element XR (Waltham, MA, USA) series HR-ICP-MS to obtain selected trace element concentrations. Opting for both standard materials (e.g., AGV-2 [19]) and a duplicate analysis of the chosen samples ensured analytical reliability.

4. Results

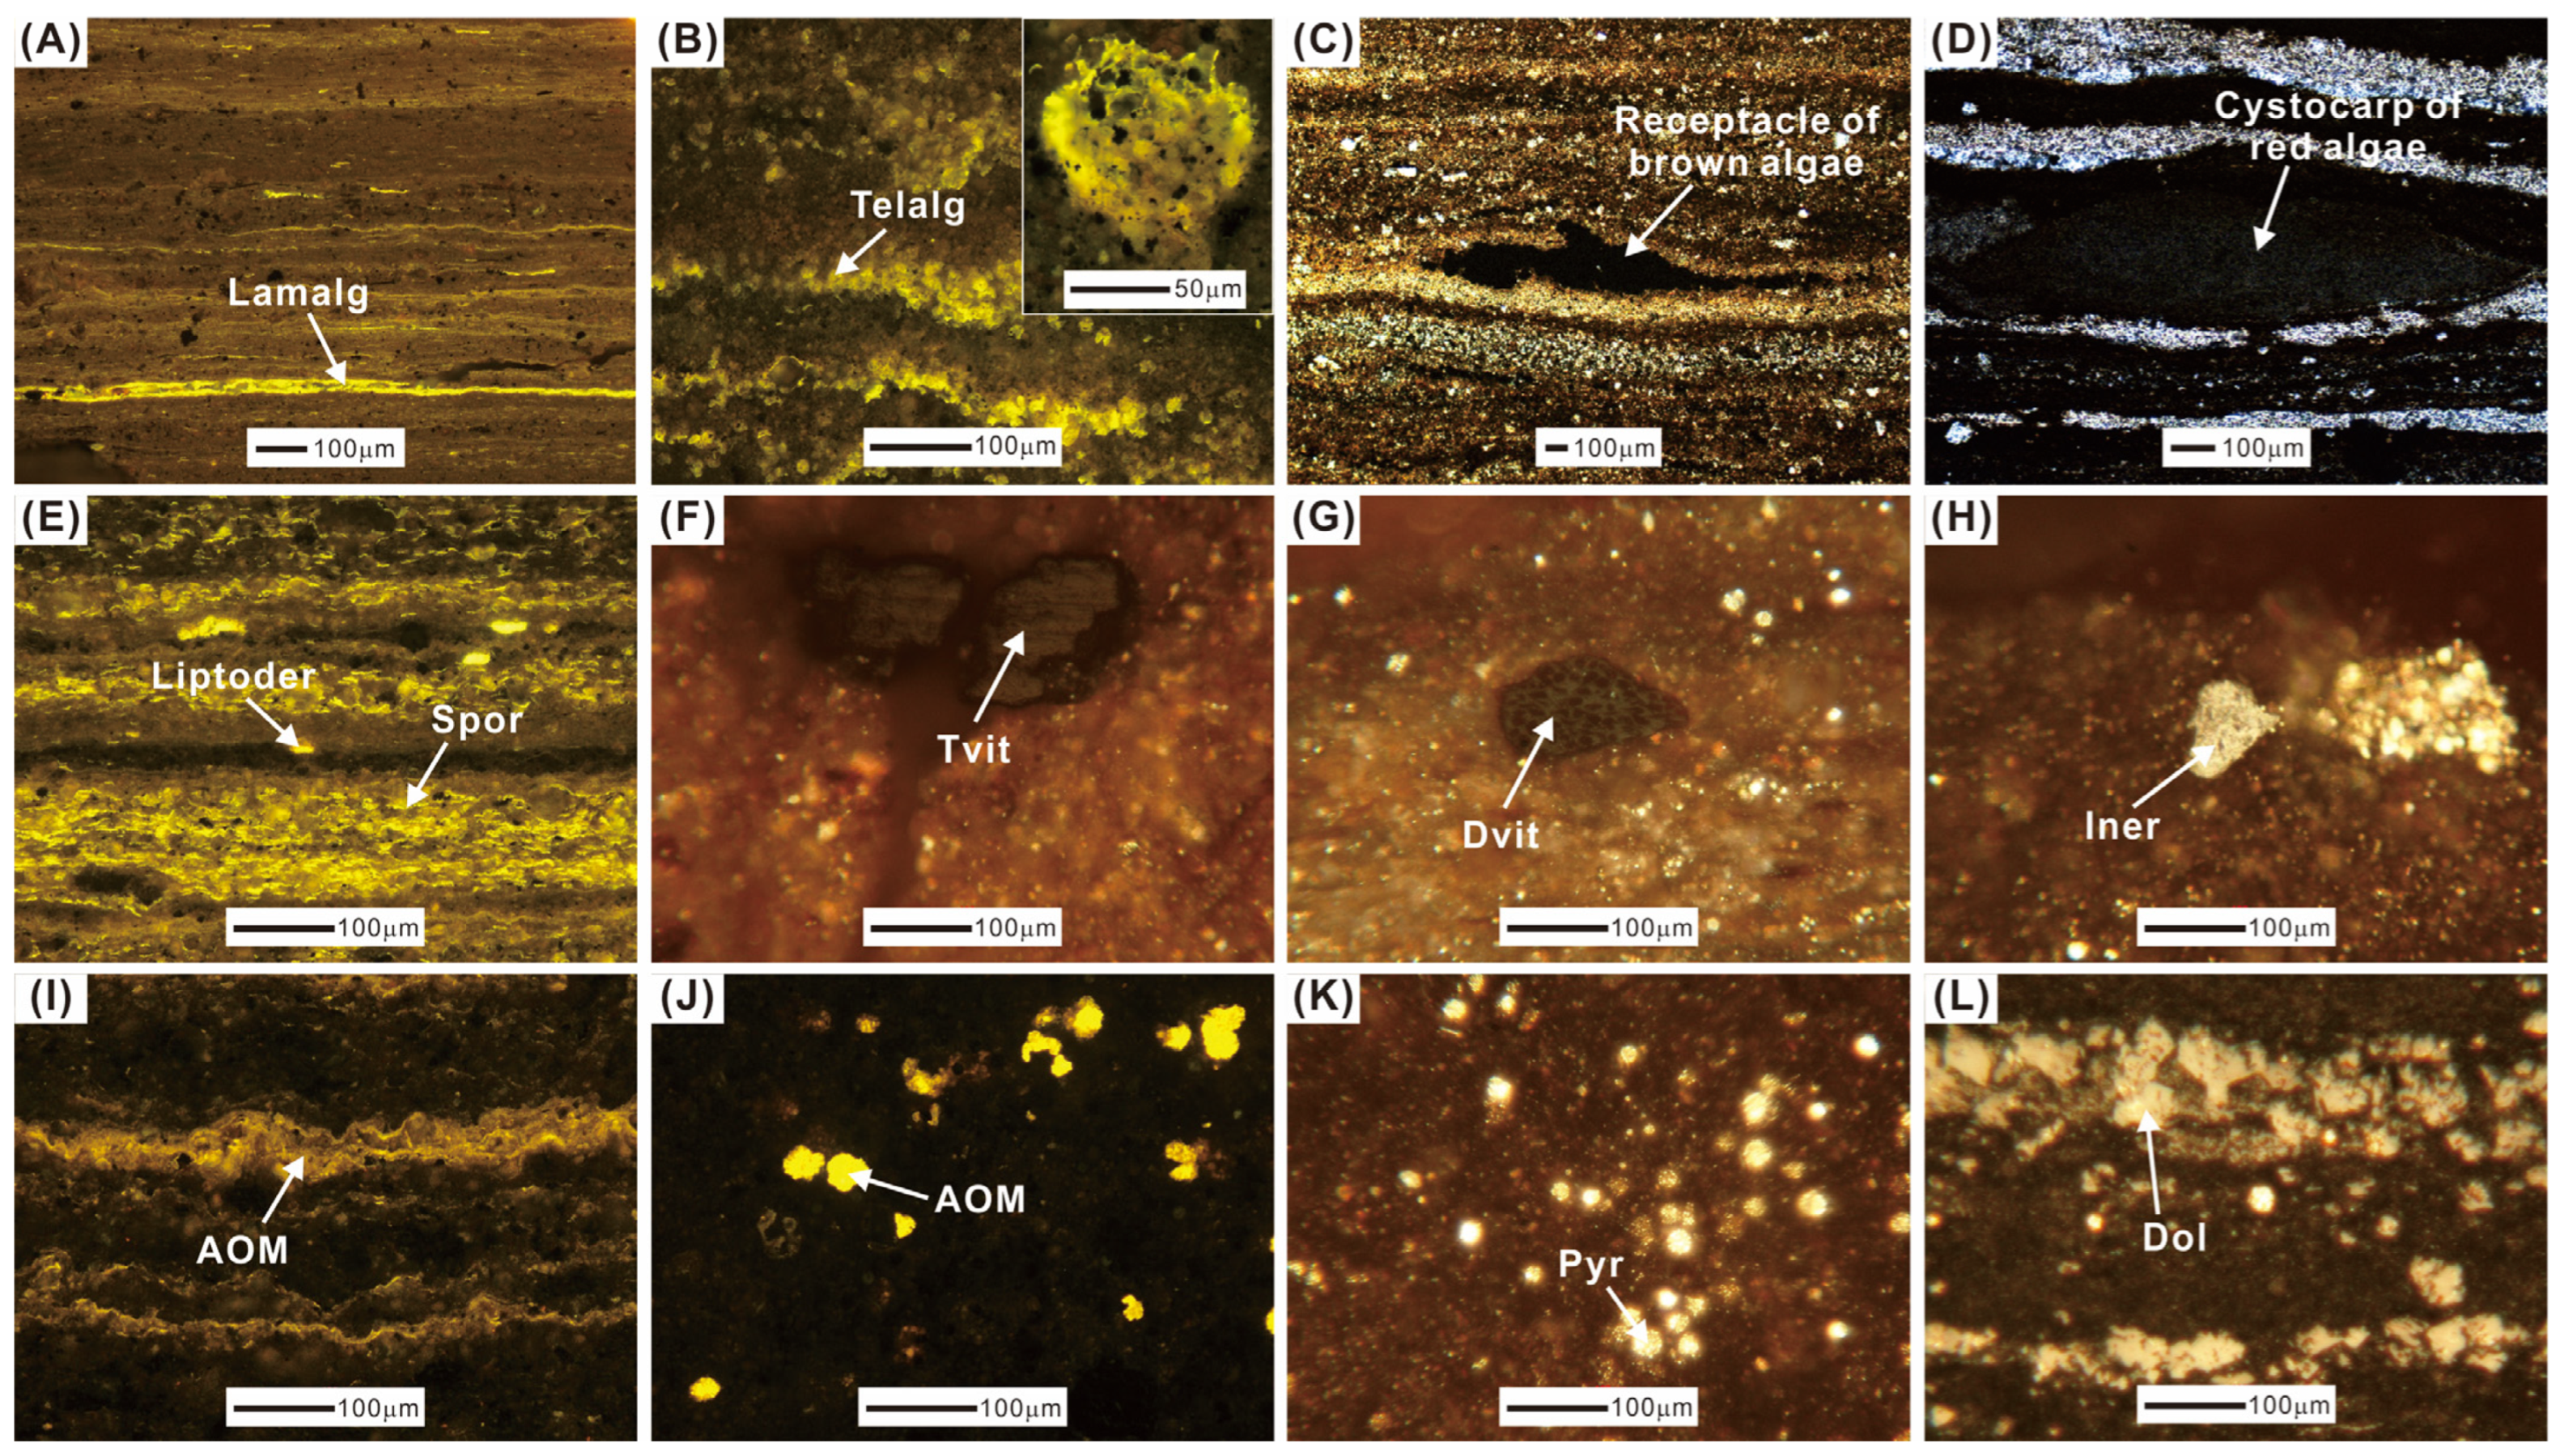
4.1. Organic Petrography and Vitrinite Reflectance

Alginite, which consists of lamalginite and telalginite, is abundant in LORS (Figure 2A,B). Under reflected light, the receptacle of brown algae and the cystocarp of red algae are recognized. Generally, the fluorescence in the outer wall is strong, and the fluorescence in the cell cavity is weak (Figure 2C,D), indicating the existence of benthic algae during LORS deposition. Sporinite and liptodetrinite are the most common terrigenous liptinite macerals (Figure 2E). Vitrinite, which includes telovitrinite and detrovitrinite, has plant tissue structure. It appears dark gray or gray in reflected light (Figure 2F,G), whereas inertinite has no structure and is commonly found with pyrite (Figure 2H). Amorphous organic matter (AOM) is amorphous in shape and size (Figure 2I,J), and it is likely to be a product of liptinite degradation during early diagenesis [20]. Framboidal pyrite (Figure 2K) and euhedral dolomite (Figure 2L) are found on occasion, implying syngenetic origins. Alginite is more abundant in the Eh32 and Eh33 LORS, but terrigenous maceral, comprising sporinite, vitrinite, and inertinite, is more enriched in the Eh34+5 LORS. AOM is found mostly in the Eh33 and Eh34+5 LORS. Ro values in the Eh32, Eh33, and Eh34+5 LORS vary from 0.56% to 0.60%, 0.59% to 0.75%, and 0.90% to 0.92%, respectively.

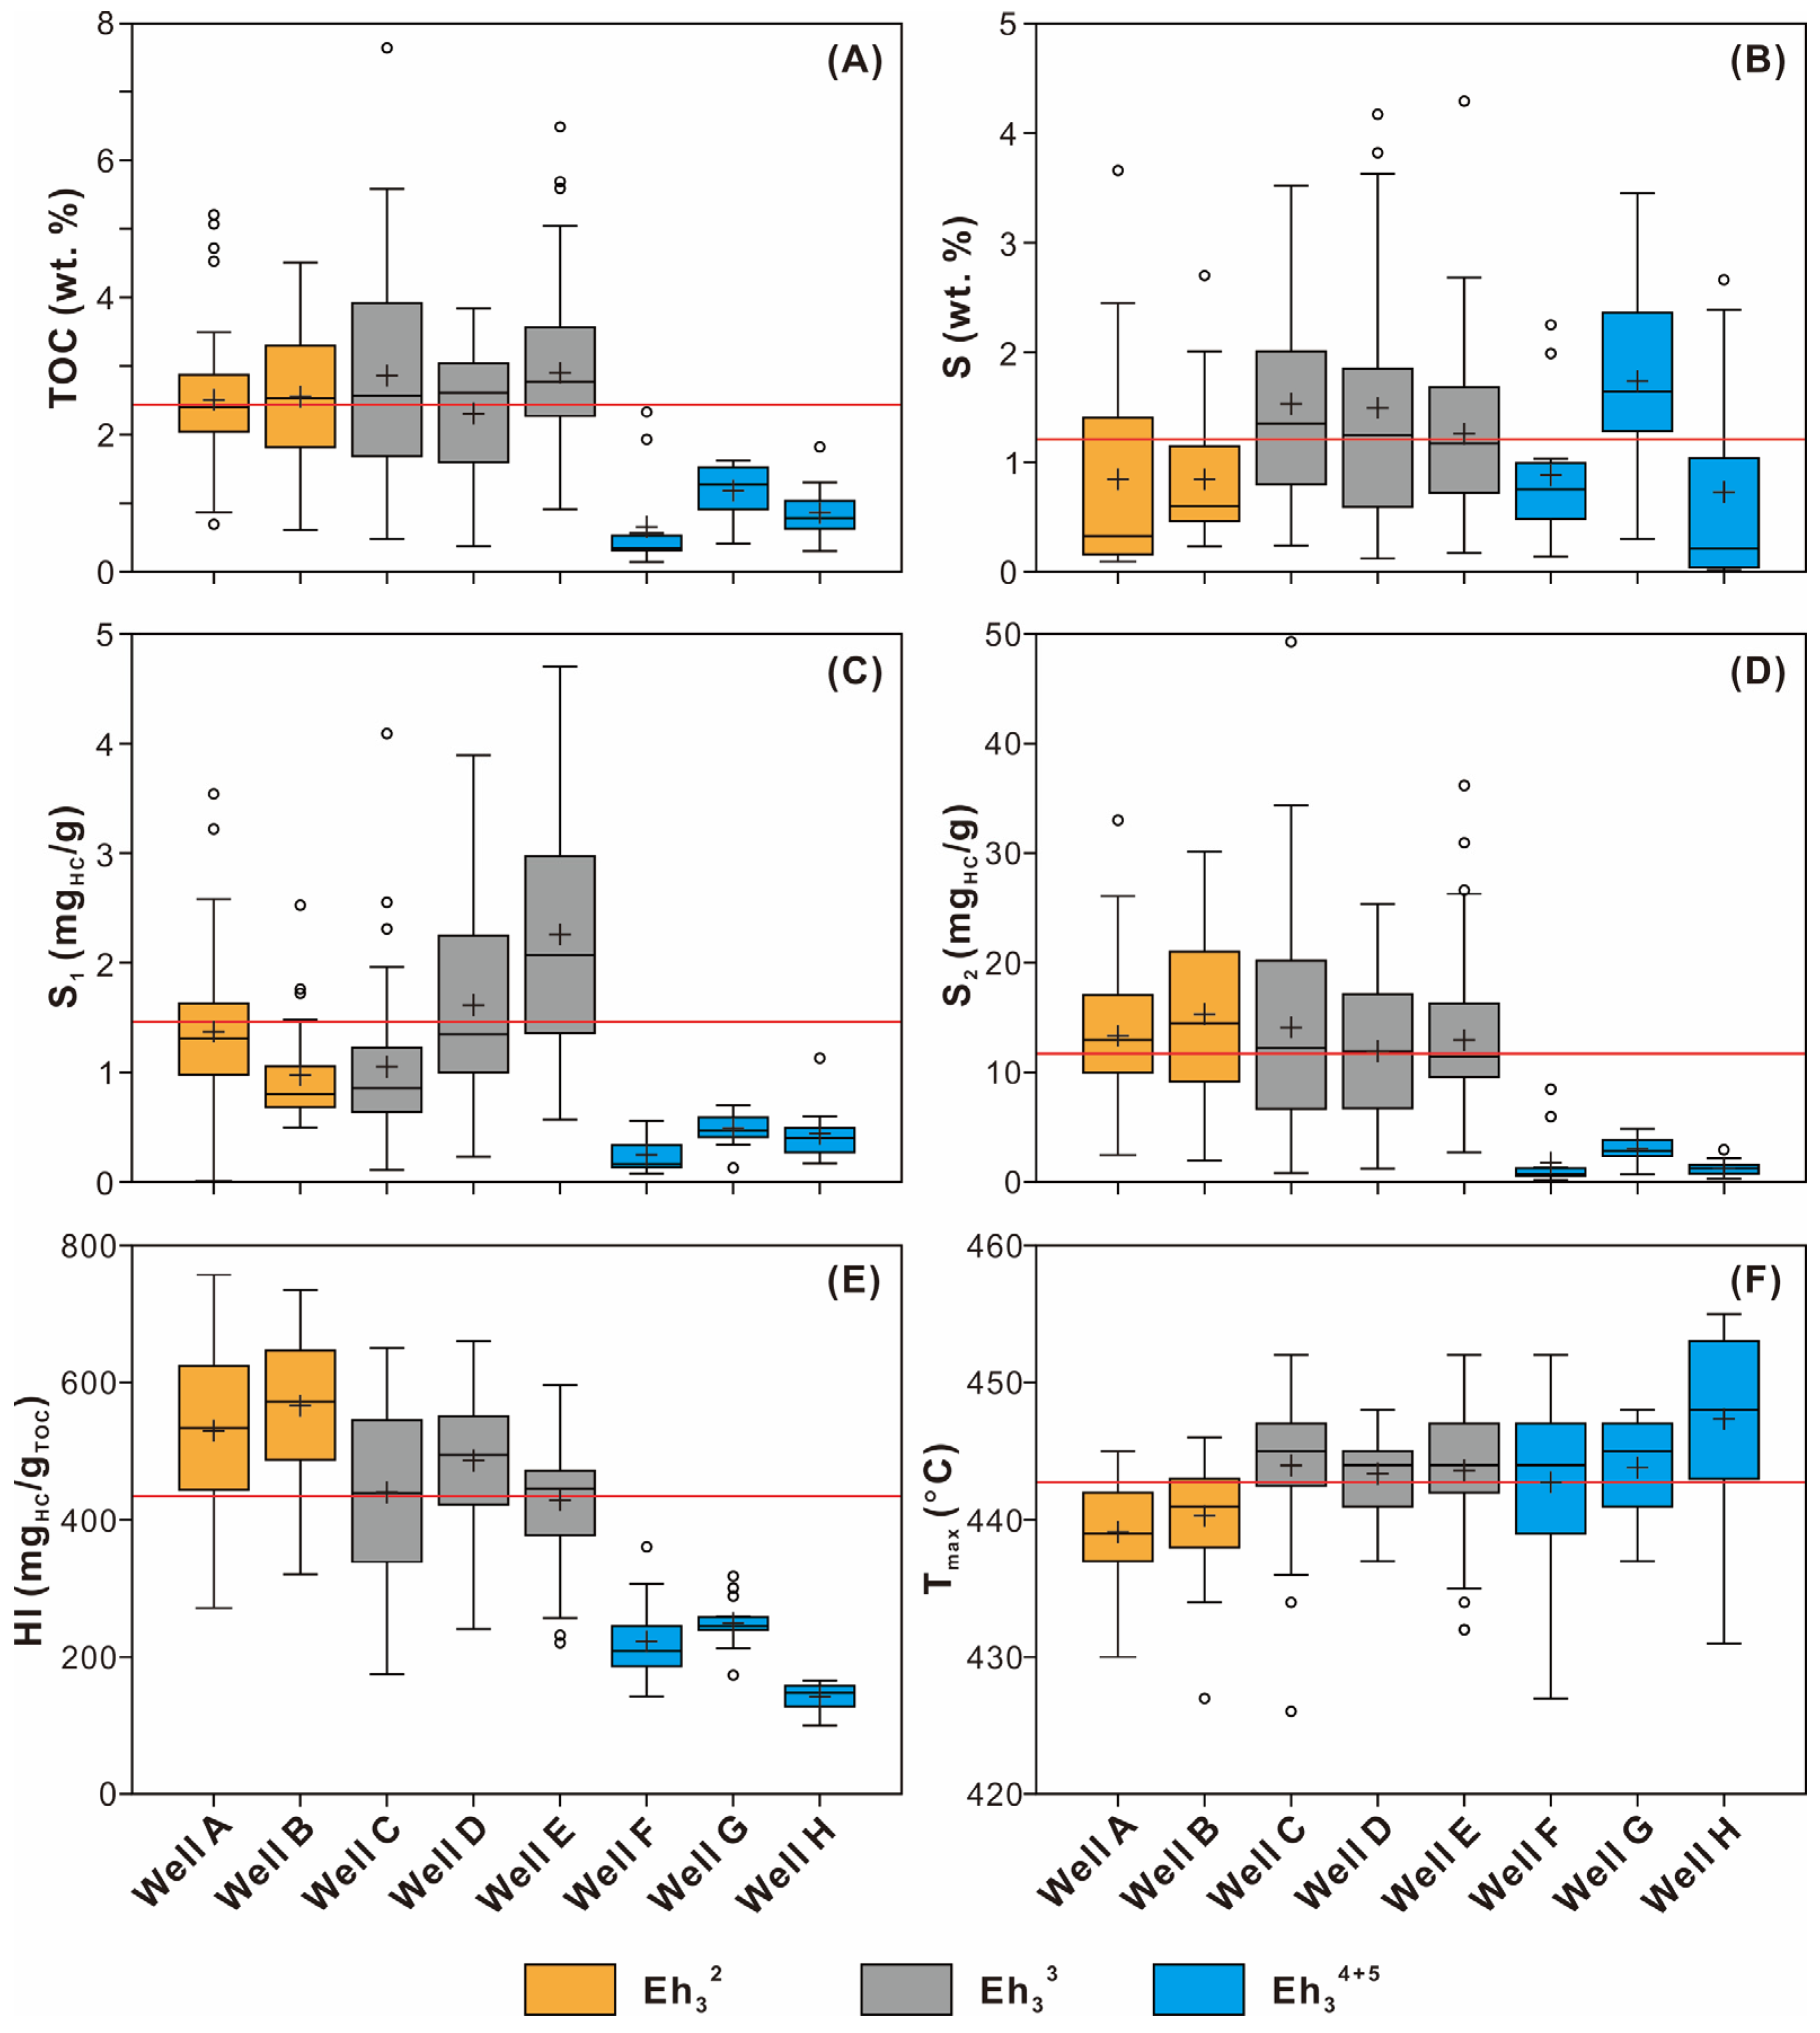
4.2. Bulk Geochemistry

The TOC contents of the Eh33 LORS are the highest (avg. 2.78 wt.%), followed by the Eh32 (avg. 2.53 wt.%), and the Eh34+5 LORS (avg. 0.91 wt.%; Figure 3A). The Eh34+5 LORS from Well G has slightly greater S contents (avg. 1.74 wt.%) than the Eh33 LORS (avg. 1.38 wt.%). The S contents of the Eh34+5 LORS from Well F, H (avg. 0.81 wt.%) and the Eh32 LORS (avg. 0.85 wt.%) are low in contrast (Figure 3B). The Eh33 LORS has high S1 values (avg. 1.83 mg/g), followed by the Eh32 (avg. 1.22 mg/g), and the Eh34+5 LORS (avg. 0.39 mg/g; Figure 3C). The S2 values for the Eh32 and Eh33 LORS are comparable, with averages of 14.12 mg/g and 13.06 mg/g, respectively (Figure 3D). In contrast, low S2 levels are detected in the Eh34+5 LORS (avg. 2.10 mg/g). The Eh32 LORS has the highest hydrogen index (HI = 100 × S2/TOC) values (avg. 544 mg/g TOC), followed by the Eh33 (avg. 444 mg/g TOC) and the Eh34+5 LORS (avg. 208 mg/g TOC; Figure 3E). Tmax values steadily increase from the Eh32 to the Eh33 and the Eh34+5 LORS, with average values of 440 °C, 444 °C and 445 °C, respectively (Figure 3F).
In the HI versus Tmax, and the TOC versus S2 diagrams, the Eh32 LORS mainly plots into the fields indicating the presence of type I and II1 kerogens (Figure 4A,D), and the Eh33 LORS are dominated by type II1 and II2 kerogens (Figure 4B,E), whereas type II2 kerogen is suggested for the Eh34+5 LORS (Figure 4C,F).

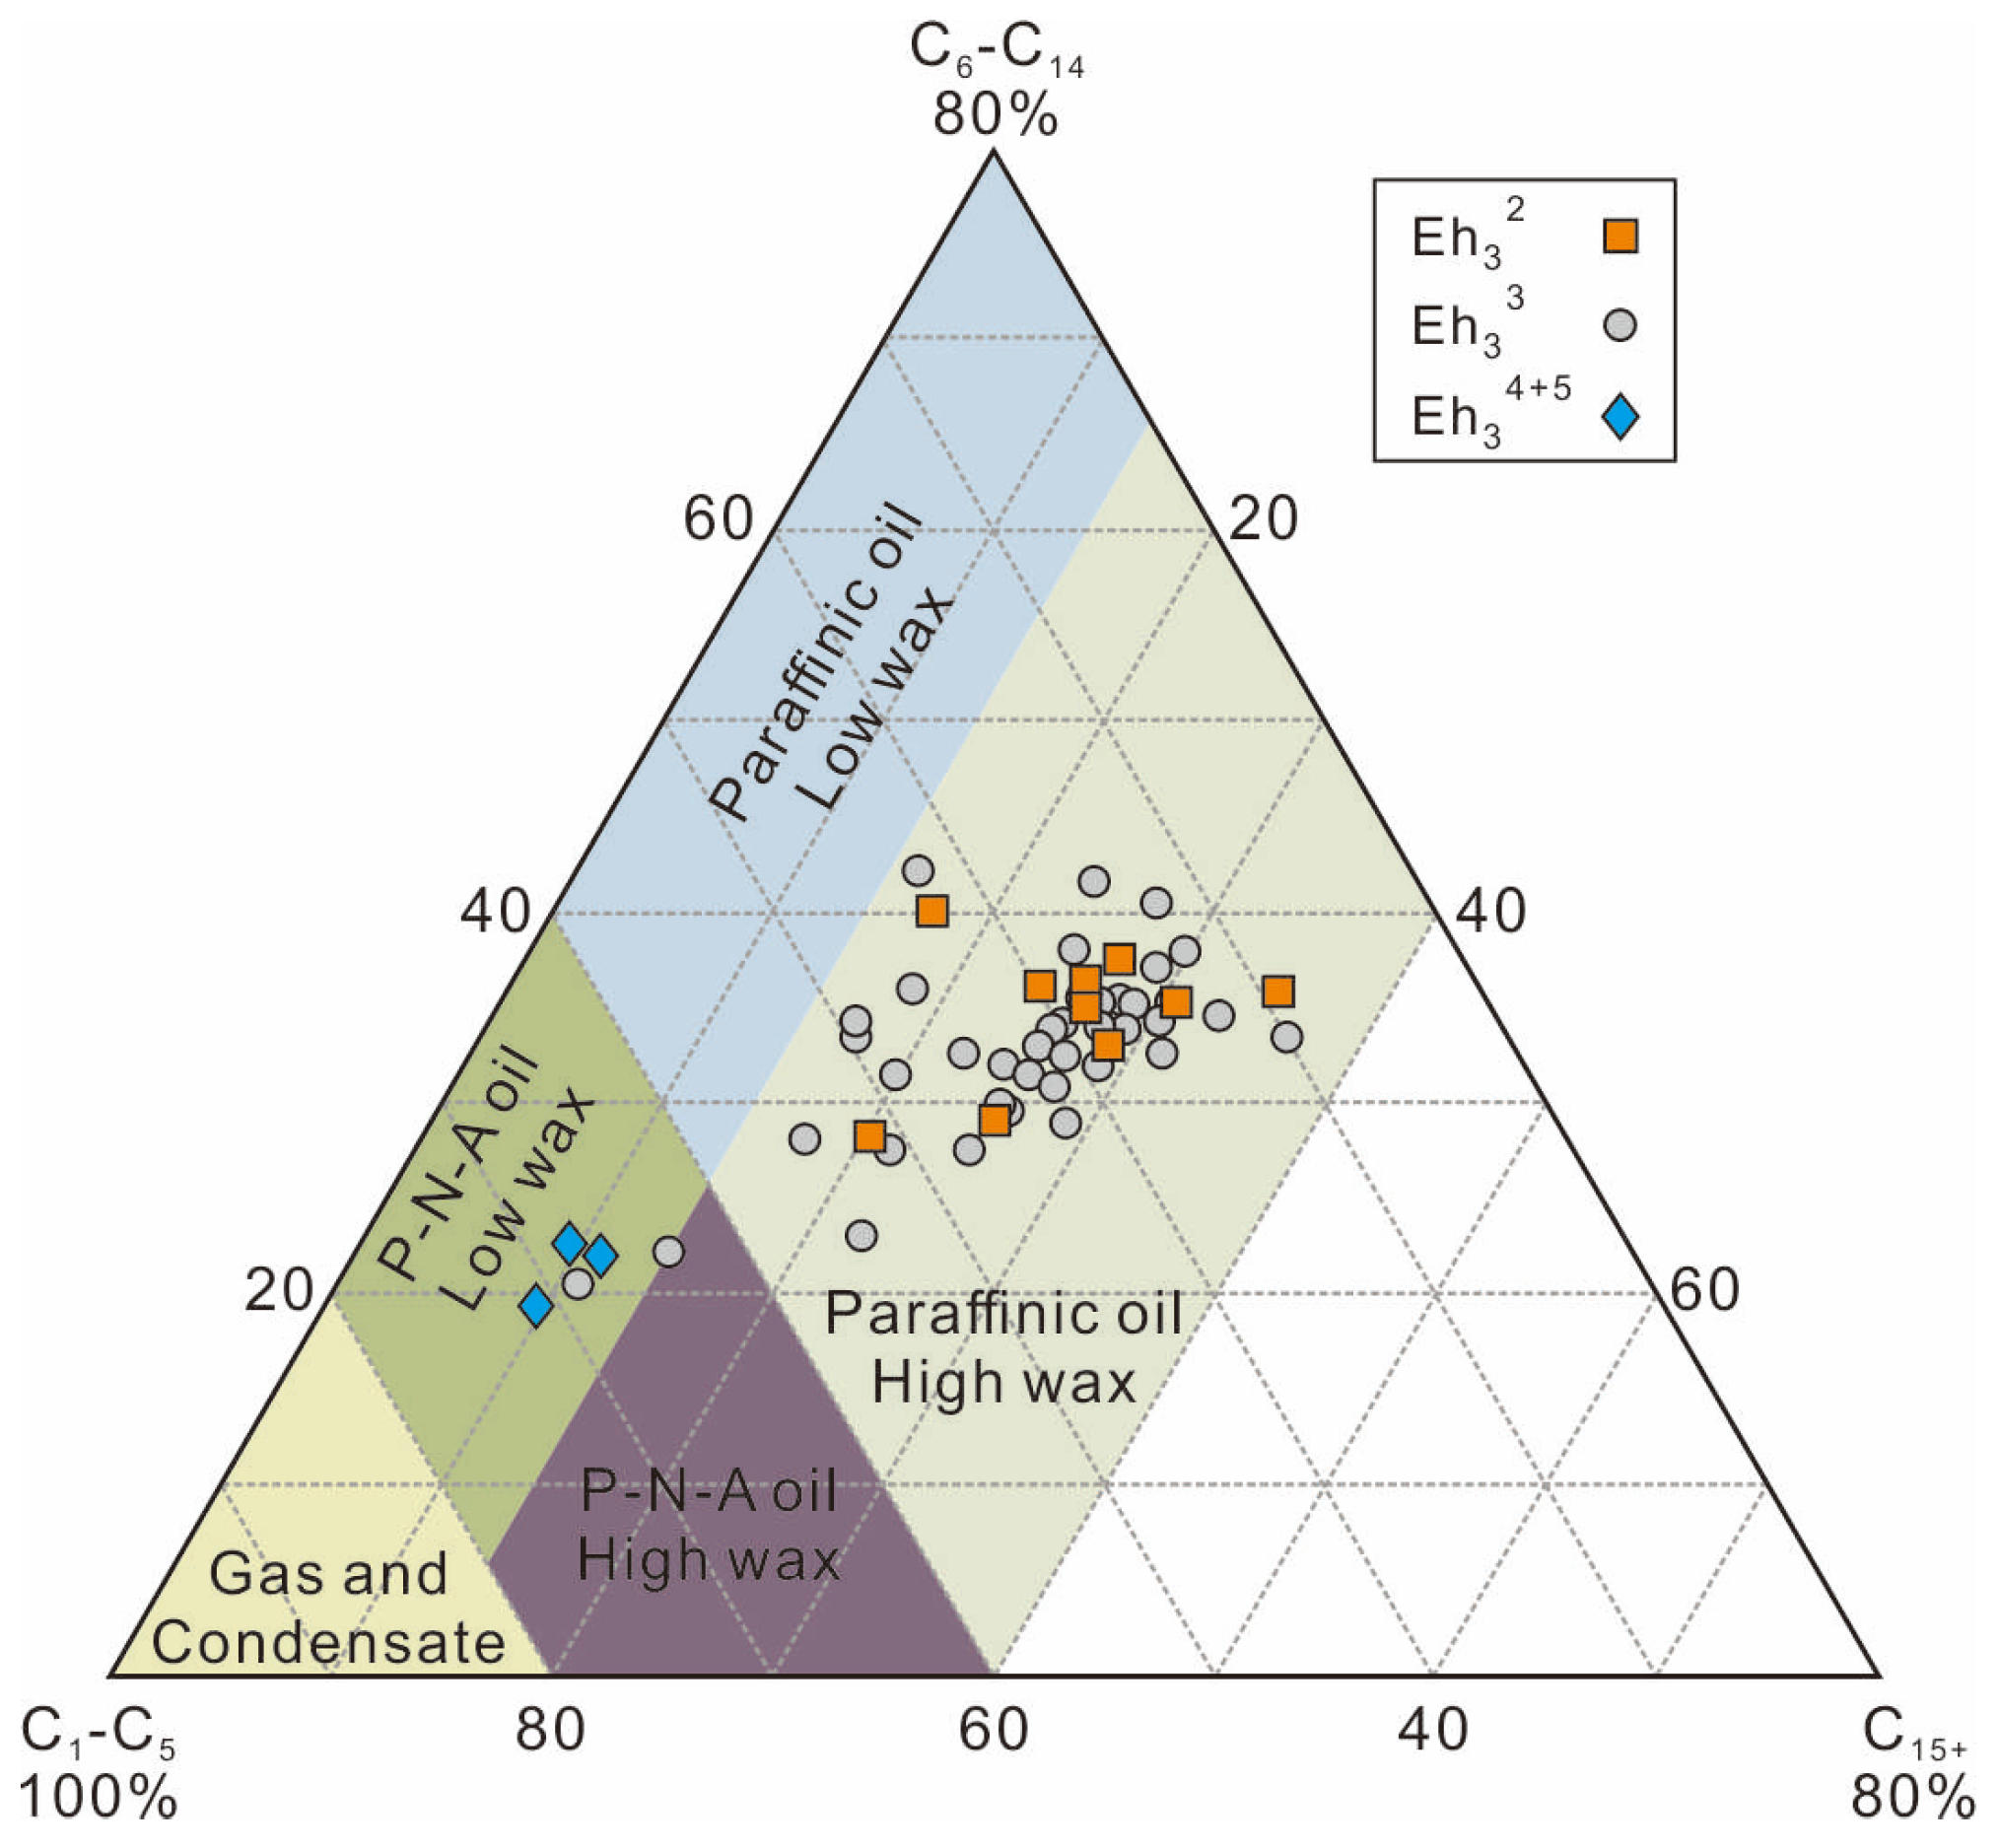
4.3. Pyrolysis Gas Chromatography

The n-alkane/n-alkene doublets that extend to around n-C27 are dominated in pyrolysates of the Eh32, Eh33, and Eh34+5 LORS. Aromatic hydrocarbons such as benzene, toluene, C2 alkylbenzenes (e.g., ethylbenzene, ortho-xylene, styrene) and sulfur-bearing compounds (e.g., thiophene) are frequently detected. The petroleum type organofacies were identified using ternary diagrams of C1–C5, C6–C14 and C15+ [21]. The diagram indicates that paraffinic high wax oil generation occurs in the Eh32 and Eh33 LORS, but paraffinic-naphthenic-aromatic (PNA) low wax oil generation appears in the Eh34+5 LORS (Figure 5).

4.4. Elemental Compositions

The Eh33 LORS has the highest B/Ga ratios (avg. 6.01), followed by the Eh32 (avg. 3.50) and the Eh34+5 LORS (avg. 2.57; Figure 6A). In the Eh32, Eh33 and Eh34+5 LORS, the average Sr/Ba ratios are 0.86, 1.03, and 1.16, respectively (Figure 6B). The distribution of UEF and MoEF values among groups is similar, with high average values in the Eh33 LORS (UEF: 3.16; MoEF: 15.93), moderate values in the Eh32 LORS (UEF: 2.75; MoEF: 10.14), and low values in the Eh34+5 LORS (UEF: 1.89; MoEF: 6.50; Figure 6C,D). The Eh33 LORS contains the highest average Babio (Babio × 10−2: 6.45 ppm) and P/Al ratios (P/Al × 102: avg. 1.90), and the Eh32 LORS have moderate ratios (Babio × 10−2: 5.51 ppm; P/Al × 102: avg. 1.37), whereas the ratios of Eh34+5 LORS are low (Babio × 10−2: 5.07 ppm; P/Al × 102: avg. 1.01; Figure 6E,F). Ti/Al and Zr/Al ratios are highest in the Eh34+5 LORS (Ti/Al × 102: avg. 4.22; Zr/Al: avg. 8.61), followed by the Eh32 (Ti/Al × 102: avg. 4.03; Zr/Al: avg. 7.93) and the Eh33 LORS (Ti/Al × 102: avg. 3.79; Zr/Al: avg. 6.94; Figure 6G,H).

5. Discussion

5.1. Reconstruction of Relative Lake-Level-Fluctuations

Paleolake conditions, including paleosalintiy, redox conditions, paleoproductivity, and detrital influx, were assessed by the integration of organic petrography and element geochemistry results in order to reconstruct the relative lake level. The B/Ga ratio is regarded as one of the most reliable paleosalinity proxies for fine-grained sedimentary rocks, with values of <3, 3–6, and >6 reflecting freshwater, brackish, and saline facies, respectively [22]. The B/Ga ratios of the Eh33 LORS indicate brackish to saline facies, however the ratios of Eh32 and Eh34+5 LORS imply freshwater to brackish facies (Figure 6A). Although the Sr/Ba ratio is a common proxy for paleosalinity, it is frequently altered by carbonate-hosted Sr [23]. A positive correlation between CaO and Sr was exhibited in all LORS (R2 = 0.58), restricting the capacity of Sr/Ba to assess paleosalinity.
The concentrations of U and Mo in sediments and sedimentary rocks are both susceptible to changes in redox conditions [24]. Low U and Mo concentrations are often related to oxic conditions and exhibit significant authigenic enrichment under more reducing conditions [25]. The Eh33 LORS has the largest U and Mo concentrations (expressed as UEF and MoEF), followed by the Eh32 and the Eh34+5 LORS (Figure 6C,D). Because semi-deep-to-deep lake environments prevailed in the southeastern depression during deposition of the Eh3 [17], large U and Mo concentrations in the Eh33 LORS most likely imply anoxic to suboxic facies, while relatively low concentrations in the Eh32 and the Eh34+5 LORS may reflect suboxic to dysoxic facies (terminology of redox classification is from [26]).
P and Ba are considered to be reliable paleoproductivity proxies as nutritional components for phytoplankton development, which is a key composition of aquatic primary producers [27]. A main aquatic organic matter (OM) supply, as well as appropriate preservation conditions, are required for the application of P and Ba to suggest paleoproductivity [28]. Because alginite is one of the most abundant macerals in the LORS and dyoxic to anoxic conditions are predictive of UEF and MoEF values, P and Ba can be used as paleoproductivity proxies in this case. During deposition of the Eh33 and the Eh32 LORS, high paleoproductivity along with a main aquatic OM input was observed, as shown by comparatively high Babio and P/Al ratios, as well as higher abundance of alginite. In contrast, low paleoproductivity was detected during deposition of the Eh34+5 LORS, together with enhanced input of terrigenous OM, as demonstrated by relatively low Babio and P/Al ratios, as well as higher abundance of terrigenous maceral.
Rutile and zircon have been discovered in the Eh3 LORS, which originated from terrigenous detrital minerals [13,15]. Ti and Zr concentrations in the LORS are thus employed in this case to suggest detrital influx. The Eh34+5 LORS has the greatest Ti/Al and Zr/Al ratios, indicating a somewhat larger detrital influx, whereas the Eh32 and the Eh33 LORS have moderate and low detrital influx, as evidenced by moderate and low Ti/Al and Zr/Al ratios.
In summary, brackish-saline water, anoxic–suboxic conditions, high productivity, and low detrital influx were present in the Eh33 Biyang paleolake, and these circumstances were generally related with a rising lake level. Previous research has indicated that marine incursions influenced the Eh33 Biyang paleolake, resulting in both enhanced paleosalinity and lowered oxygen levels in the lake water [13,29]. Little evidence of marine incursions was found in Eh32 and Eh34+5, leading to a relatively low lake level during these periods [13,15]. However, as higher productivity and lower detrital influx were present in Eh32 than in Eh34+5, a relatively high lake level (termed as moderate lake level) was speculated during the deposition of the Eh32 LORS.

5.2. Shale Oil Enrichment

The thickness and planar distribution of the LORS are fundamental to the enrichment of shale oil [6]. The Anpeng region, the sedimentary depocenter of the depression, typically has the largest thickness of LORS (Figure 7) [16]. The Eh32 LORS has a maximum thickness of >140 m, with a thickness of >100 m covering an area of roughly 20 km2 (Figure 7A). The southeast part of the depression, which is near the depocenter, hosts the majority of the LORS with a rather considerable thickness (>100 m). In Eh33, the LORS could be as thick as >180 m, and the >100 m thick LORS spans an area of around 38 km2 (Figure 7B). The Eh33 LORS distribution was perpendicular to the boundary faults and trending in a NW direction. Only >100 m of LORS might be present at its thickest, and it only covers an overall region of 12 km2 in Eh34+5 (Figure 7C).
Another important aspect impacting shale oil enrichment is the generation and retention of hydrocarbon volume [30]. The Ro and Tmax values of the LORS from three groups are comparable [10], both indicating an early oil window maturity [31]. Therefore, the effect of maturity on organic geochemical parameters (e.g., TOC, HI, S1) could be neglected. The cross-plot of S2 vs. TOC (after [31]) indicates that the Eh33 LORS has a good to excellent potential for oil generation and emplacement, whereas the Eh32 LORS exhibits a fair to very good potential, and the Eh34+5 LORS show a poor to good potential (Figure 8A). In the cross-plot of HI vs. TOC, when the TOC values of LORS are less than 2.0 wt.%, HI values are steady; whereas, if the TOC values are greater than 2.0 wt.%, HI values significantly increase (Figure 8B). According to this trend, LORS with TOC greater than 2.0 wt.% and corresponding HI larger than 400 mg/g TOC are considered to have good hydrocarbon generation potential. Similar categorization ratings are also found in other shale oil plays, such as the Mississippian Barnett [32] and the Songliao Qingshankou [8].
In the cross-plot of OSI (oil saturation index = 100 × S1/TOC; proposed by [33]) vs. HI, the LORS is located in the potential zone, which is characterized by an OSI > 100 mg/g TOC and HI > 400 mg/g TOC, which primarily belong to Eh33 (Figure 8C). Although the HI values of the Eh32 LORS are high, the corresponding OSI values are comparatively low (commonly less than 100 mg/g TOC). This conclusion is further supported by the cross-plot of DS1 (a new free hydrocarbon index; proposed by [10]) vs. PI, as high content of free shale oil is found in the Eh33 LORS, moderate and low contents are present in Eh32 and the Eh34+5 LORS, respectively (Figure 8D).

5.3. Control of Lake-Level-Fluctuations on Shale Oil Enrichment and Implications for Regional Shale Oil Exploration

Depositional models of the Eh32, the Eh33, and the Eh34+5 LORS are depicted in Figure 9. Low lake levels occurred during Eh34+5, corresponding to low productivity, freshwater to brackish water, suboxic to dysoxic conditions, and high detrital influx, all of which resulted in low shale oil enrichment of the LORS, as evidenced by a small area and low TOC and OSI values. An elevated lake level was recorded during Eh33, together with high productivity, brackish to saline water, anoxic to suboxic conditions, and minimal detrital influx, leading to high shale oil enrichment of the LORS, as demonstrated by a vast area and high TOC and OSI values. During Eh32, lake level was slightly reduced while high productivity, freshwater to brackish water, suboxic to dysoxic conditions, and moderate detrital influx were present, resulting in moderate shale oil enrichment of the LORS, as indicated by a moderate area and moderate TOC and OSI values. Therefore, high lake levels are favorable for the deposition of LORS, which has a significant thickness and a huge distribution area, as well as high volumes of hydrocarbon generation and retention. In addition, paraffinic high wax oil was commonly generated from the LORS.
The sweet spot of the Eh33 LORS with the highest shale oil enrichment is evaluated: Figure 10 illustrates the planar distribution of the oil saturation index (OSI), frequency of fracture development, and brittle minerals content of the Eh33 LORS. The highest OSI of the LORS was >200 mg/g TOC, mainly distributed in the southeastern part of the depression (around Well E; Figure 10A). The frequency of fracture development was predicted by 3D seismic data following the Ant Tracking process [34]. A high frequency of fracture development was observed in the southeastern part of the depression (around Well A, B, D–G), which was perpendicular to the boundary faults (Figure 10B). These fractures are probably tectonic fractures and relate to the activity of boundary faults [15]. The highest content of brittle minerals (>77 wt.%) was present in the middle of the depression, and the content gradually decreased northwestward and southeastward (Figure 10C). As discussed above, the Well E area is considered the most favorable exploration area for shale oil in Eh33.

6. Conclusions

Based on the combination of bulk geochemistry, organic petrography, Py-GC, and element compositions, the effect of lake-level-fluctuations on shale oil enrichment in lacustrine basins was investigated using the Paleogene Biyang Depression in East China as an example. The lake level was higher during the deposition of the Eh33 LORS than it was during both Eh32 and Eh34+5, as demonstrated by more reducing conditions, higher paleosalinity and productivity, and lower detrital influx. The raised lake level was most likely improved by the transgression of seawater to the Eh33 Biyang paleolake. Under the influence of a high lake level, the Eh33 LORS exhibits a larger area and thickness, greater potential for oil generation and emplacement, and higher contents of free shale oil, which are evidenced by multiple bulk geochemical parameters (e.g., TOC, S1, S2, OSI). Furthermore, a high lake level was beneficial for the production and preservation of lipid-rich organic materials, resulting in paraffinic high wax oil from the Eh33 LORS, as suggested by the Py-GC results. In conclusion, depositional models of the Eh32, the Eh33, and the Eh34+5 LORS were established, together with shale oil enrichment in each group. The sweet spot for the highly prospective Eh33 shale oil in the Biyang Depression was also identified. The findings are important to illustrate the effect of lacustrine environmental changes on shale oil enrichment in the lacustrine basins, while providing evidence for future shale oil exploration in comparable regions.

Author Contributions

Y.S.: Formal analysis, Writing—Review & Editing, Resources, Conceptualization, Writing—original draft, Funding acquisition. L.W.: Writing—Review & Editing, Methodology, Investigation, Data curation, Formal analysis, Investigation. S.X.: Investigation. B.G.: Investigation. C.L.: Investigation. Z.L.: Investigation. P.P.: Investigation. All authors have read and agreed to the published version of the manuscript.

Funding

This research was financially supported by the Open funding project of the Sinopec Key Laboratory of Shale Oil/Gas Exploration and Production Technology (Reconstruction of biological community structure of organic-rich shale in saline lake basins and its quantitative indication of paleoproductivity), and the National Natural Science Foundation of China (Grant No. 41902139).

Data Availability Statement

The data presented in this study are available on request from the corresponding author. The data are not publicly available due to some basic research involves confidentiality.

Conflicts of Interest

Yu Song, Shilin Xu, and Bo Gao are employees of Sinopec Key Laboratory of Shale Oil/Gas Exploration and Production Technology. Shilin Xu is an employee of Sinopec Petroleum Exploration and Production Research Institute. The paper reflects the views of the scientists and not the company.

References

  1. Soeder, D.J. The Successful Development of Gas and Oil Resources from Shales in North America. J. Pet. Sci. Eng. 2018, 163, 399–420. [Google Scholar] [CrossRef]
  2. Lopatin, N.V.; Zubairaev, S.; Kos, I.; Emets, T.P.; Romanov, E.; Mal’chikhina, O.V. Unconventional oil accumulations in the Upper Jurassic Bazhenov Black Shale Formation, West Siberian Basin: A self-sourced reservoir system. J. Pet. Geol. 2003, 26, 225–244. [Google Scholar] [CrossRef]
  3. Argentina Exports First Shale Oil and Liquefied Natural Gas Cargoes. Oil Energy Trends 2019, 44, 3–6. [CrossRef]
  4. Wang, M.; Guo, Z.; Jiao, C.; Lu, S.; Li, J.; Xue, H.; Li, J.; Li, J.; Chen, G. Exploration Progress and Geochemical Features of Lacustrine Shale Oils in China. J. Pet. Sci. Eng. 2019, 178, 975–986. [Google Scholar] [CrossRef]
  5. Hu, S.; Zhao, W.; Hou, L.; Yang, Z.; Zhu, R.; Wu, S.; Bai, B.; Jin, X. Development Potential and Technical Strategy of Continental Shale Oil in China. Petrol. Explor. Dev. 2020, 47, 877–887. [Google Scholar] [CrossRef]
  6. Liu, B.; Wang, H.; Fu, X.; Bai, Y.; Bai, L.; Jia, M.; He, B. Lithofacies and Depositional Setting of a Highly Prospective Lacustrine Shale Oil Succession from the Upper Cretaceous Qingshankou Formation in the Gulong Sag, Northern Songliao Basin, Northeast China. AAPG Bull. 2019, 103, 405–432. [Google Scholar] [CrossRef]
  7. Bohacs, K.M.; Carroll, A.R.; John, E.N.; Paul, J.M. Keys to Exploration; Lake-Basin Type, Source Potential, and Hydrocarbon Character within An Integrated Sequence-Stratigraphic/Geochemical Framework. Bull. Houst. Geol. Soc. 2000, 46, 3–34. [Google Scholar]
  8. Dong, T.; Harris, N.B.; Ayranci, K. Relative sea-level cycles and organic matter accumulation in shales of the Middle and Upper Devonian Horn River Group, northeastern British Columbia, Canada: Insights into sediment flux, redox conditions, and bioproductivity. GSA Bull. 2018, 130, 859–880. [Google Scholar] [CrossRef]
  9. Peng, J.; Hu, Z.; Feng, D.; Wang, Q. Variations of organic matter content and type within the sequence stratigraphic framework of the lacustrine deep-water Dongyuemiao formation, Sichuan Basin, Western China. Mar. Pet. Geol. 2023, 149, 106104. [Google Scholar] [CrossRef]
  10. Li, S.; Hu, S.; Xie, X.; Lv, Q.; Huang, X.; Ye, J. Assessment of Shale Oil Potential Using a New Free Hydrocarbon Index. Int. J. Coal Geol. 2016, 156, 74–85. [Google Scholar] [CrossRef]
  11. Xia, L.; Cao, J.; Hu, S.; Li, S.; Shi, C. Organic Geochemistry, Petrology, and Conventional and Unconventional Hydrocarbon Resource Potential of Paleogene Saline Source Rocks in Eastern China: The Biyang Sag of the Nanxiang Basin. Mar. Pet. Geol. 2019, 101, 343–354. [Google Scholar] [CrossRef]
  12. Song, Y.; Li, S.; Hu, S. Warm-Humid Paleoclimate Control of Salinized Lacustrine Organic-Rich Shale Deposition in the Oligocene Hetaoyuan Formation of the Biyang Depression, East China. Int. J. Coal Geol. 2019, 202, 69–84. [Google Scholar] [CrossRef]
  13. Song, Y.; Cao, Q.; Li, S.; Hu, S.; Zhu, K.; Ye, X.; Wan, L. Salinized Lacustrine Organic-Rich Shale Influenced by Marine Incursions: Algal-Microbial Community, Paleoenvironment and Shale Oil Potential in the Paleogene Biyang Depression, East China. Palaeogeogr. Palaeoclimatol. Palaeoecol. 2021, 580, 110621. [Google Scholar] [CrossRef]
  14. He, T.; Lu, S.; Li, W.; Tan, Z.; Zhang, X. Effect of Salinity on Source Rock Formation and Its Control on the Oil Content in Shales in the Hetaoyuan Formation from the Biyang Depression, Nanxiang Basin, Central China. Energy Fuels 2018, 32, 6698–6707. [Google Scholar] [CrossRef]
  15. Li, J.; Liu, Z.; Zhang, X.; Feng, G.; Liu, J.; Ma, Y.; Lu, S.; Li, W.; Zhou, N. Effects of Paleoenvironment on Continental Shale Oil Enrichment and Producibility in the Biyang Depression. AAPG Bull. 2022, 106, 2043–2071. [Google Scholar] [CrossRef]
  16. Xu, K.; Chen, H.; Huang, C.; Ogg, J.G.; Zhu, J.; Lin, S.; Yang, D.; Zhao, P.; Kong, L. Astronomical Time Scale of the Paleogene Lacustrine Paleoclimate Record from the Nanxiang Basin, Central China. Palaeogeogr. Palaeoclimatol. Palaeoecol. 2019, 532, 109253. [Google Scholar] [CrossRef]
  17. Dong, Y.; Zhu, X.; Xian, B.; Hu, T.; Geng, X.; Liao, J.; Luo, Q. Seismic Geomorphology Study of the Paleogene Hetaoyuan Formation, Central-South Biyang Sag, Nanxiang Basin, China. Mar. Pet. Geol. 2015, 64, 104–124. [Google Scholar] [CrossRef]
  18. Taylor, H.; Teichmuller, M.; Davis, A.; Diessel, C.F.K.; Littke, R.; Robert, P. Organic Petrology; Borntraeger: Berlin, Germany, 1998; p. 704. [Google Scholar]
  19. Schudel, G.; Lai, V.; Gordon, K.; Weis, D. Trace Element Characterization of USGS Reference Materials by HR-ICP-MS and Q-ICP-MS. Chem. Geol. 2015, 410, 223–236. [Google Scholar] [CrossRef]
  20. Teng, J.; Mastalerz, M.; Liu, B. Petrographic and chemical structure characteristics of amorphous organic matter in marine black shales: Insights from Pennsylvanian and Devonian black shales in the Illinois Basin. Int. J. Coal Geol. 2021, 235, 103676. [Google Scholar] [CrossRef]
  21. Horsfield, B. Practical Criteria for Classifying Kerogens: Some Observations from Pyrolysis-Gas Chromatography. Geochim. Cosmochim. Acta 1989, 53, 891–901. [Google Scholar] [CrossRef]
  22. Wei, W.; Algeo, T.J. Elemental Proxies for Paleosalinity Analysis of Ancient Shales and Mudrocks. Geochim. Cosmochim. Acta 2020, 287, 341–366. [Google Scholar] [CrossRef]
  23. Bathurst, R.G. Carbonate Sediments and Their Diagenesis; Developments in Sedimentology; Elsevier: Amsterdam, The Netherlands, 1972; Volume 12. [Google Scholar]
  24. Tribovillard, N.; Algeo, T.J.; Baudin, F.; Riboulleau, A. Analysis of Marine Environmental Conditions Based on Molybdenum–Uranium Covariation—Applications to Mesozoic Paleoceanography. Chem. Geol. 2012, 324–325, 46–58. [Google Scholar] [CrossRef]
  25. Algeo, T.J.; Li, C. Redox Classification and Calibration of Redox Thresholds in Sedimentary Systems. Geochim. Cosmochim. Acta 2020, 287, 8–26. [Google Scholar] [CrossRef]
  26. Tyson, R.V.; Pearson, T.H. Modern and ancient continental shelf anoxia: An overview. In Geological Society, London, Special Publications; Tyson, R.V., Pearson, T.H., Eds.; Geological Society: London, UK, 1991; Volume 58, pp. 1–24. [Google Scholar]
  27. Ingall, E.D.; Bustin, R.M.; Van Cappellen, P. Influence of water column anoxia on the burial and preservation of carbon and phosphorus in marine shales. GSA Bull. 1993, 57, 303–316. [Google Scholar] [CrossRef]
  28. Schoepfer, S.D.; Shen, J.; Wei, H.; Tyson, R.V.; Ingall, E.; Algeo, T.J. Total Organic Carbon, Organic Phosphorus, and Biogenic Barium Fluxes as Proxies for Paleomarine Productivity. Earth Sci. Rev. 2015, 149, 23–52. [Google Scholar] [CrossRef]
  29. Xia, L.; Cao, J.; Hu, S.; Li, S. How Marine Incursion Influences the Quality of Lacustrine Source Rocks: The Paleogene Nanxiang Basin, Eastern China. AAPG Bull. 2019, 103, 1071–1096. [Google Scholar] [CrossRef]
  30. Hu, S.; Li, S.; Xia, L.; Lv, Q.; Cao, J. On the Internal Oil Migration in Shale Systems and Implications for Shale Oil Accumulation: A Combined Petrological and Geochemical Investigation in the Eocene Nanxiang Basin, China. J. Pet. Sci. Eng. 2020, 184, 106493. [Google Scholar] [CrossRef]
  31. Espitalie, J.; Marquis, F.; Barsony, I. Geochemical logging. In Analytical Pyrolysis; Voorhess, K.J., Ed.; Butterworths: Boston, MA, USA, 1984; pp. 53–79. [Google Scholar]
  32. Jarvie, D.M.; Hill, R.J.; Ruble, T.E.; Pollastro, R.M. Unconventional Shale-Gas Systems: The Mississippian Barnett Shale of North-Central Texas as One Model for Thermogenic Shale-Gas Assessment. AAPG Bull. 2007, 91, 475–499. [Google Scholar] [CrossRef]
  33. Jarvie, D.M. Shale Resource Systems for Oil and Gas: Part 2—Shale-Oil Resource Systems, in J. A. Breyer, ed., Shale reservoirs—Giant resources for the 21st century. AAPG Mem. 2012, 97, 89–119. [Google Scholar]
  34. Admasu, F.; Back, S.; Toennies, K. Autotracking of faults on 3D seismic data. Geophysics 2006, 71, A49–A53. [Google Scholar] [CrossRef]
Figure 1. Study area with sampling locations. (A) Map showing the location of Nanxiang Basin in China. (B) Map showing the location of the Biyang Depression in the Nanxiang Basin. (C) Geological map of the Biyang Depression with the sampling wells A to H. (D) Cross-section profiles of the Biyang Depression. (E) Stratigraphic section, age, sedimentary facies, and structural evolution of the Upper Cretaceous−Neogene in the Biyang Depression. The target intervals of this study (sand units 2 to 5 [Eh32, Eh33, Eh34, and Eh35] of the third member of Hetaoyuan Formation) are marked by a dark grey background. Sys = system, Ser = series, Fm = formation, Mem = member, Thi = thickness.
Minerals 14 00094 g001
Figure 2. (A) Organic petrographic characteristics of LORS from Eh32, Eh33, and Eh34+5 in the Biyang Depression. (A) Lamalginite (Lamalg), fluorescent light, Eh32, Well B. (B) Telalginite (Telalg), fluorescent light, Eh33, Well C. (C) Receptacle of brown algae, plane-polarized light, Eh33, Well C. (D) Cystocarp of red algae, plane-polarized light, Eh33, Well C. (E) Sporinite (Spor) and liptodetrinite (Liptoder), fluorescent light, Eh33, Well C. (F) Telovitrinite (Tvit), reflected light, Eh33, Well C. (G) Detrovitrinite (Dvit), reflected light, Eh32, Well B. (H) Inertinite (Iner), reflected light, Eh34+5, Well H. (I) Amorphous organic matter (AOM), probably degraded from lamalginite, fluorescent light, Eh33, Well E. (J) Amorphous organic matter (AOM), probably degraded from telalginite, fluorescent light, Eh33, Well E. (K) Pyrite framboid aggregates (Pyr), reflected light, Eh33, Well C. (L) Euhedral dolomite (Dol), reflected light, Eh33, Well C.
Minerals 14 00094 g002
Figure 3. Bulk geochemical parameters of LORS from the Eh32, Eh33, and Eh34+5 in the Biyang Depression. (A) Total organic carbon (TOC). (B) Total sulfur (S). (C) Free hydrocarbons (S1). (D) Hydrocarbons cracked from kerogen (S2). (E) Hydrogen index (HI = S2 × 100/TOC). (F) Temperature of maximum hydrocarbon generation (Tmax). Boxes represent the interquartile range; whiskers represent the 5th and 95th percentiles; the black cross within the box represents the mean value of samples from a single well; and the red line represents the mean value of all samples. Data exceeding the 5th and 95th percentiles are presented as open circles.
Minerals 14 00094 g003
Figure 4. Cross-plots of HI vs. Tmax and S2 vs. TOC for LORS from the (A,D) Eh32, (B,E) Eh33 and (C,F) Eh34+5 in the Biyang Depression [12].
Minerals 14 00094 g004
Figure 5. Ternary diagram of C1–C5, C6–C14 and C15+ (number represents the pyrolysate chain length) compounds of LORS from Eh32, Eh33 and Eh34+5 in the Biyang Depression. Different colors represent different product characteristics.
Minerals 14 00094 g005
Figure 6. Elemental geochemical parameters of LORS from Eh32, Eh33, and Eh34+5 in the Biyang Depression. (A) Boron (Ba)/gallium (Ga) ratio. (B) Strontium (Sr)/barium (Ba) ratio. (C) Enrichment factor of uranium (UEF). (D) Enrichment factor of molybdenum (MoEF). (E) Biogenic Ba (Babio). (F) Phosphorous (P)/aluminum (Al) ratio. (G) Titanium (Ti)/Al ratio. (H) Zirconium (Zr)/Al ratio. Boxes represent the interquartile range; whiskers represent the 5th and 95th percentiles; the black cross within the box represents the mean value of samples from a single well; and the red line represents the mean value of all samples. Data exceeding the 5th and 95th percentiles are presented as open circles.
Minerals 14 00094 g006
Figure 7. Isopach maps showing the thickness and planar distribution of LORS from (A) Eh32, (B) Eh33, and (C) Eh34+5 in the Biyang Depression. Maps are based on 75 wells, and the location of all wells are shown only in (C). The scope of isopach map is provided in Figure 1C.
Minerals 14 00094 g007
Figure 8. Hydrocarbon generation potential of LORS from Eh32, Eh33, and Eh34+5 in the Biyang Depression. (A) Cross-plot of S2 vs. TOC. (B) Cross-plot of HI vs. TOC. (C) Cross-plot of OSI (oil saturation index) vs. HI. (D) Cross-plot of DS1 (a new free hydrocarbon index; proposed by 10) vs. OSI.
Minerals 14 00094 g008
Figure 9. Depositional models of the Eh32, Eh33, and Eh34+5 LORS in the Biyang Depression.
Minerals 14 00094 g009
Figure 10. Isopach maps showing the oil saturation index (OSI), fracture development, and brittle minerals content in Eh33 of the Biyang Depression. (A) Oil saturation index (OSI). (B) Fracture development. (C) Brittle minerals content. Maps are based on 75 wells, and the location of all wells are shown only in (C). The scope of the isopach map is provided in Figure 1C. A–E are well names.
Minerals 14 00094 g010
Table 1. Detailed information about samples and analytical methods used in the study.
WellNumberUnitDepth
(m)
Analytical Number of Samples
Organic
Petrography
Vitrinite
Reflectance
Bulk
Geochemistry
Pyrolysis
Gas Chromatography
Element
Geochemistry
A38Unit II2392–2409.4104381038
B24 2426.8–2437.5 24 24
C36Unit III2415.7–2450.2125361236
D30 2720.2–2751.2 30 30
E81 2771–2831.9185812881
F12Unit IV+V3122.4–3129.6 12 12
G13 3182.1–3186.6 13 13
H11 3196.2–3214.57311311
Disclaimer/Publisher’s Note: The statements, opinions and data contained in all publications are solely those of the individual author(s) and contributor(s) and not of MDPI and/or the editor(s). MDPI and/or the editor(s) disclaim responsibility for any injury to people or property resulting from any ideas, methods, instructions or products referred to in the content.

