
Hydrothermal Mineralization and Mineral Chemistry of Arsenides and Sulfarsenides in the Fe-Co-Ni-As-S System and Introduction of Three Unique Minerals, Port Radium Deposit, Canada

Abstract
1. Introduction
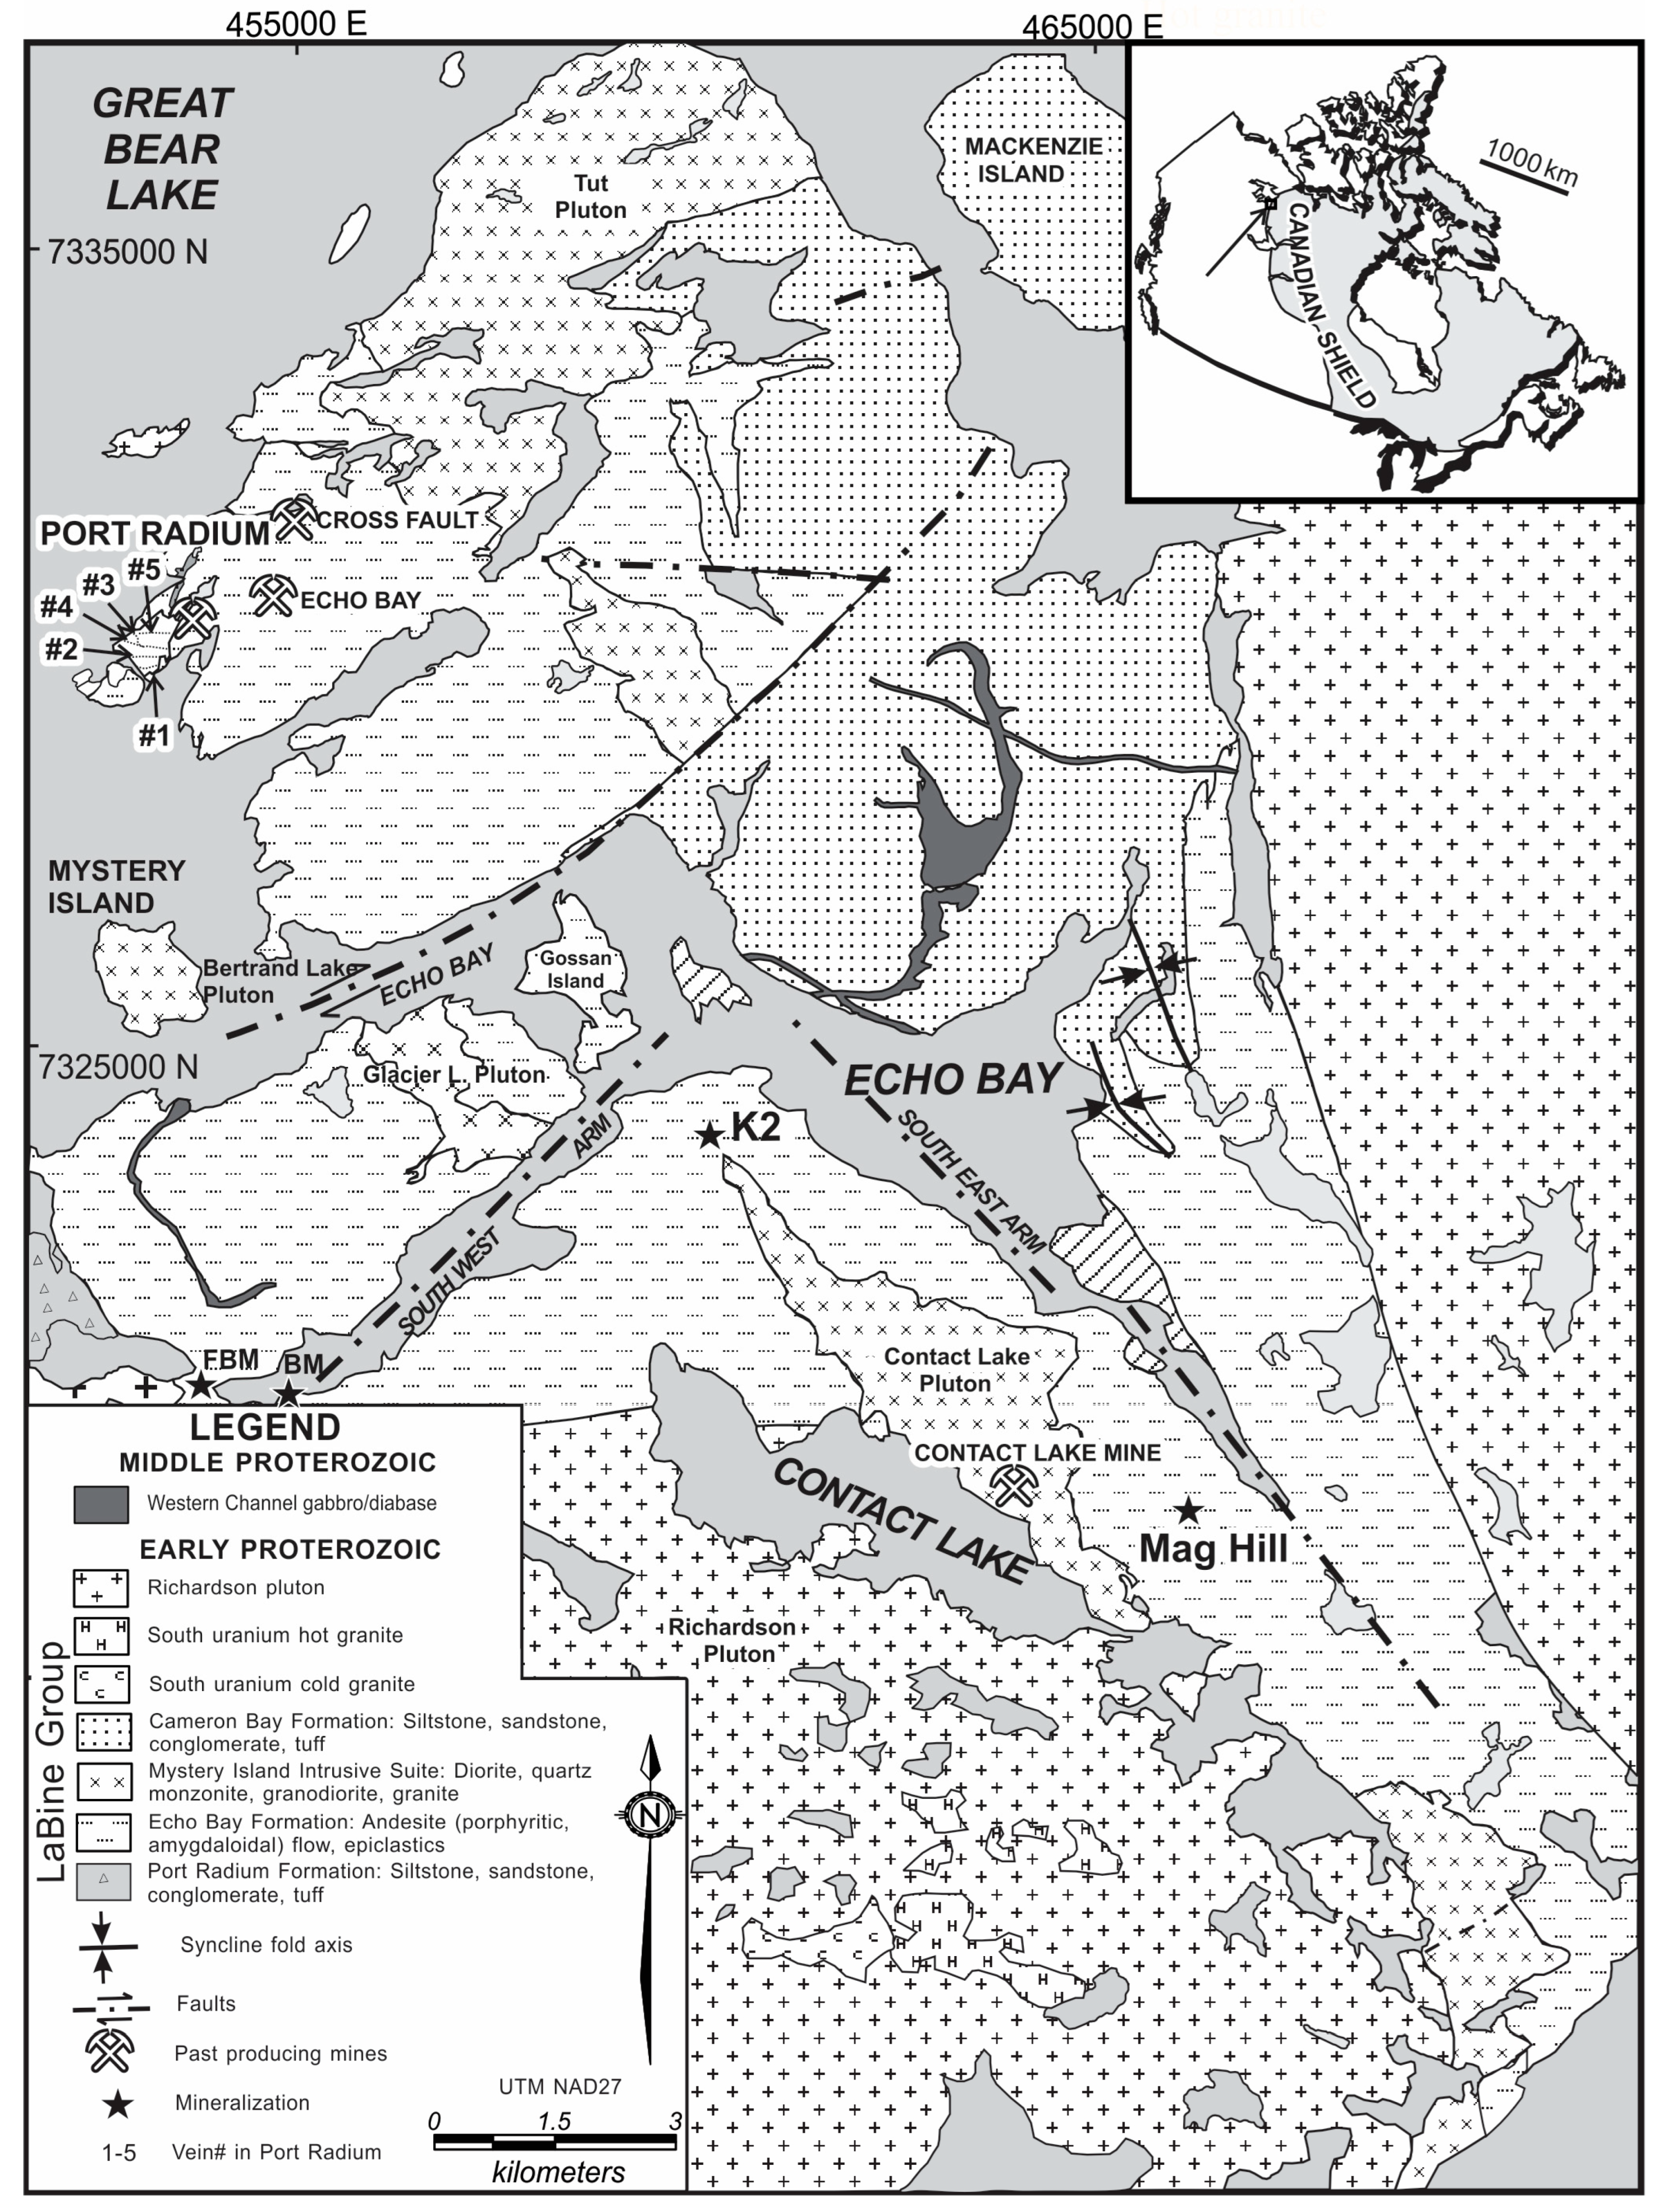
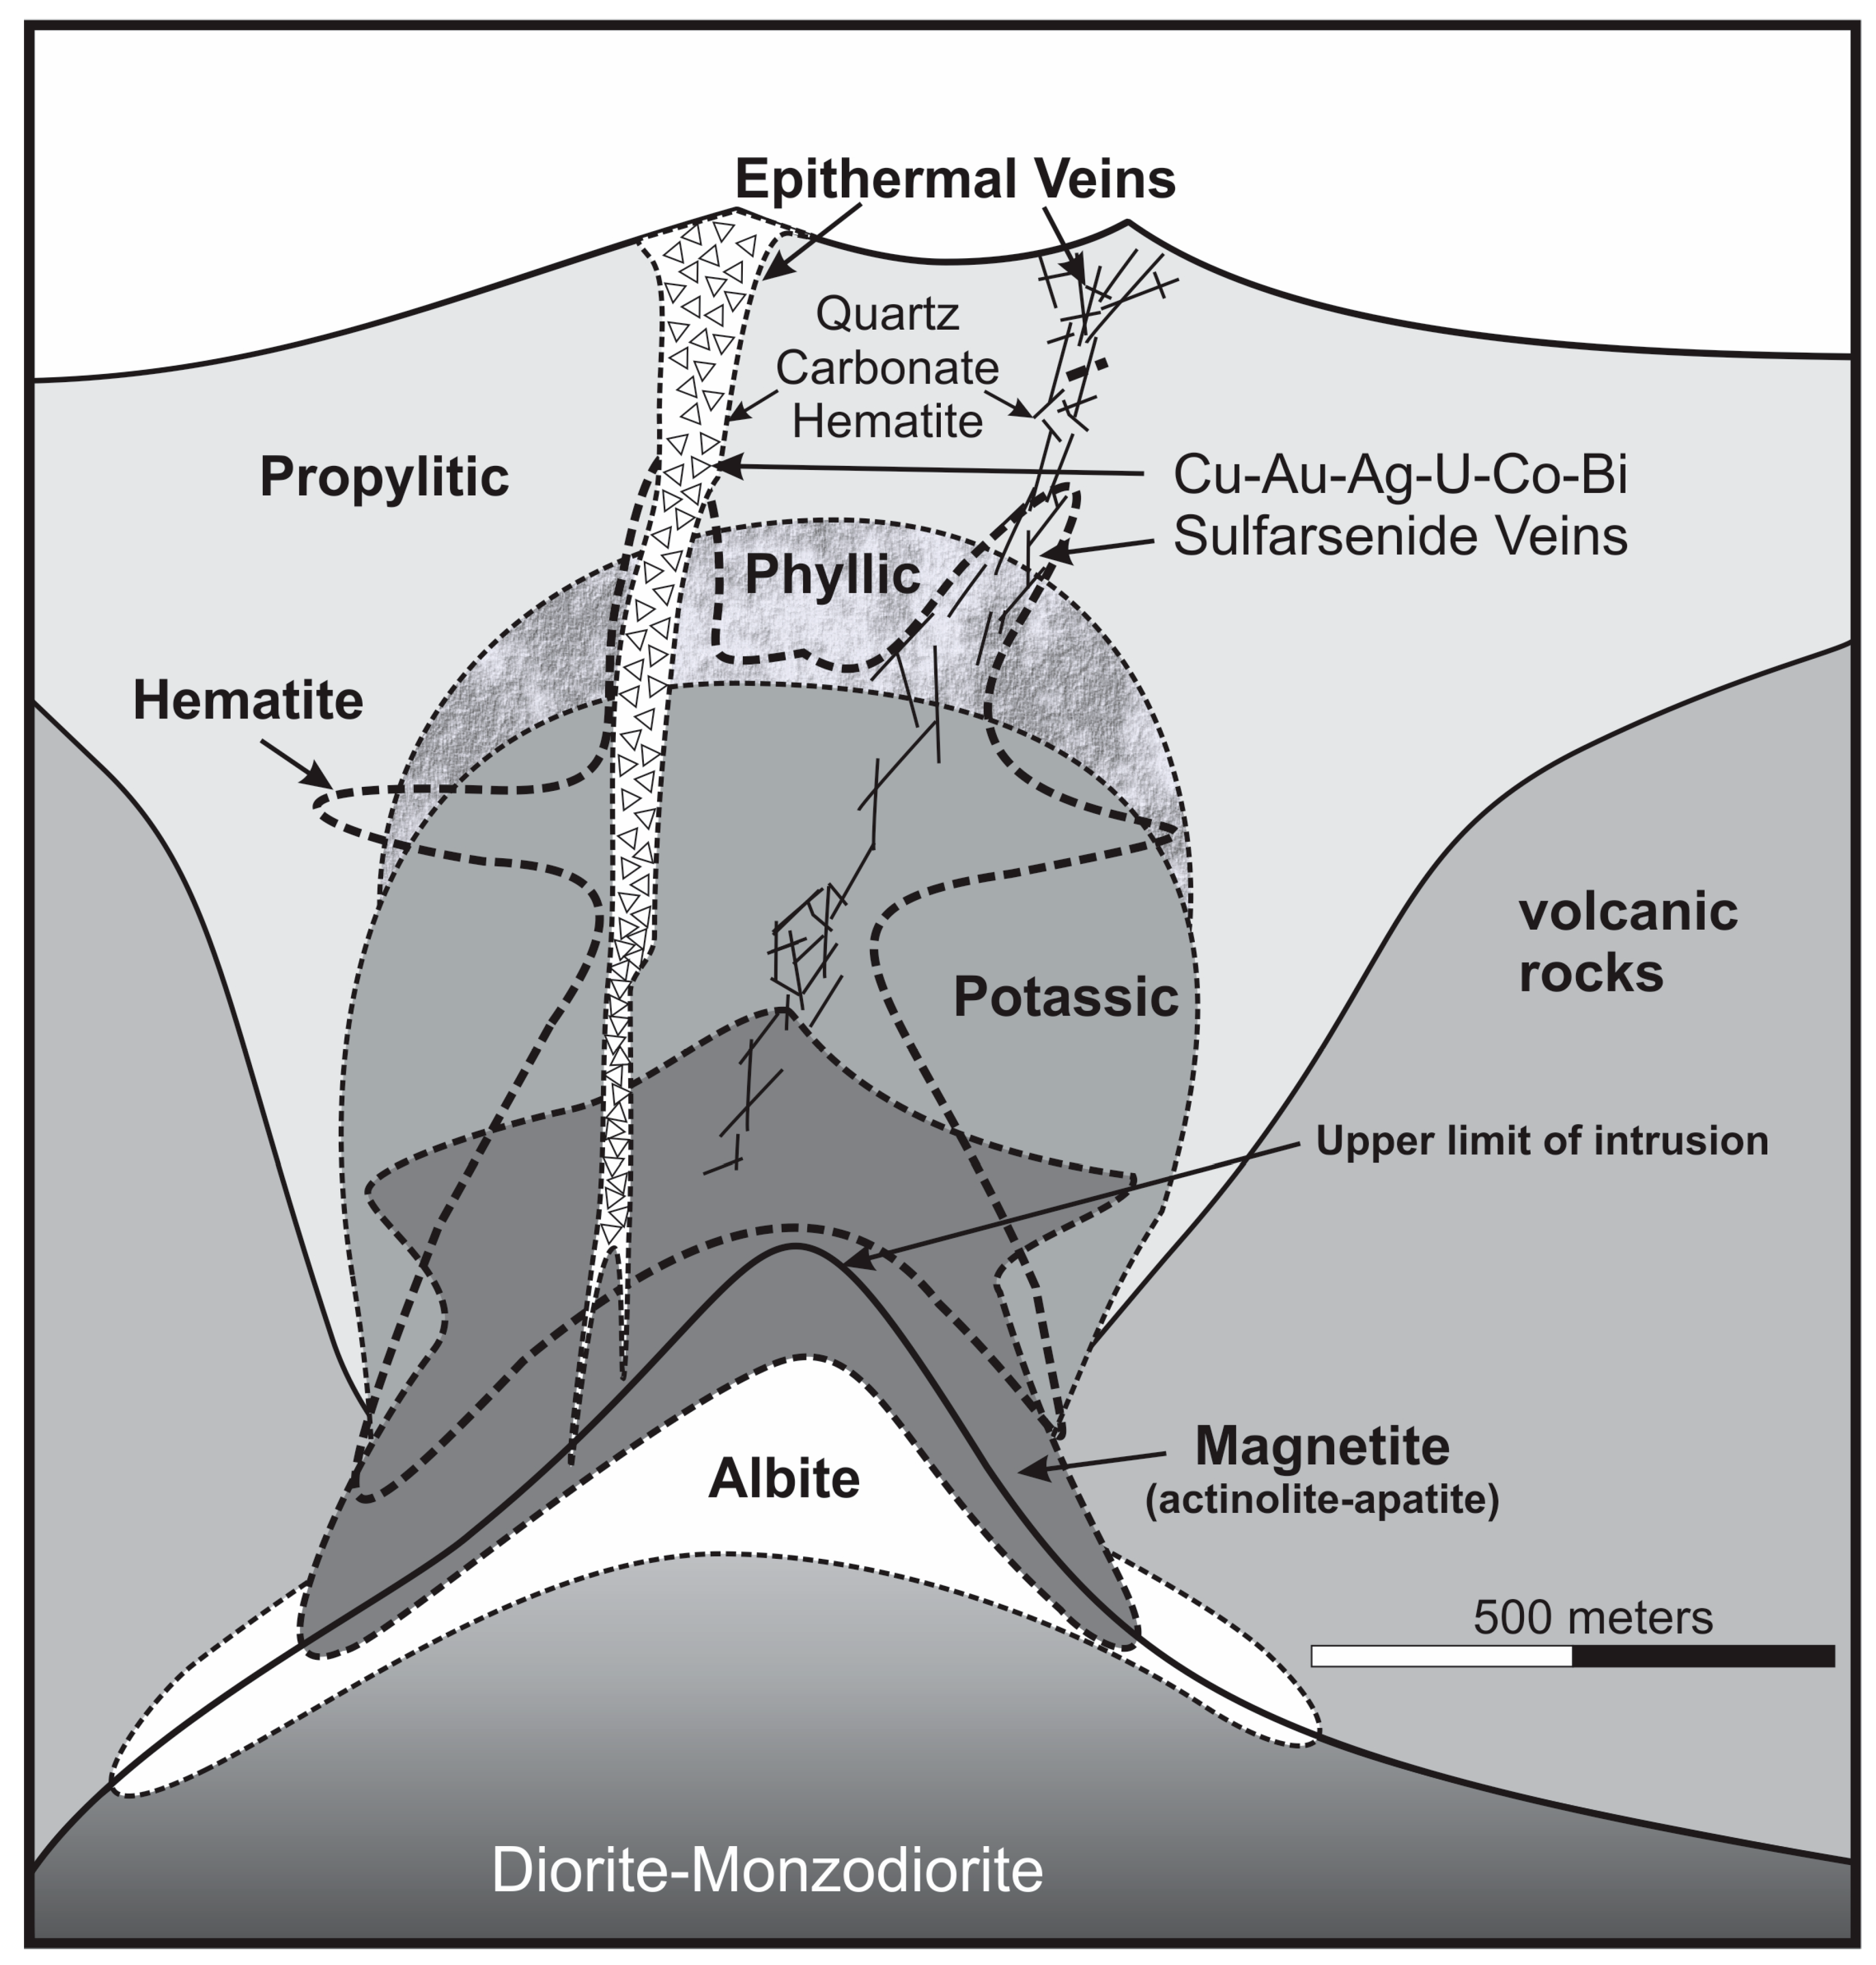
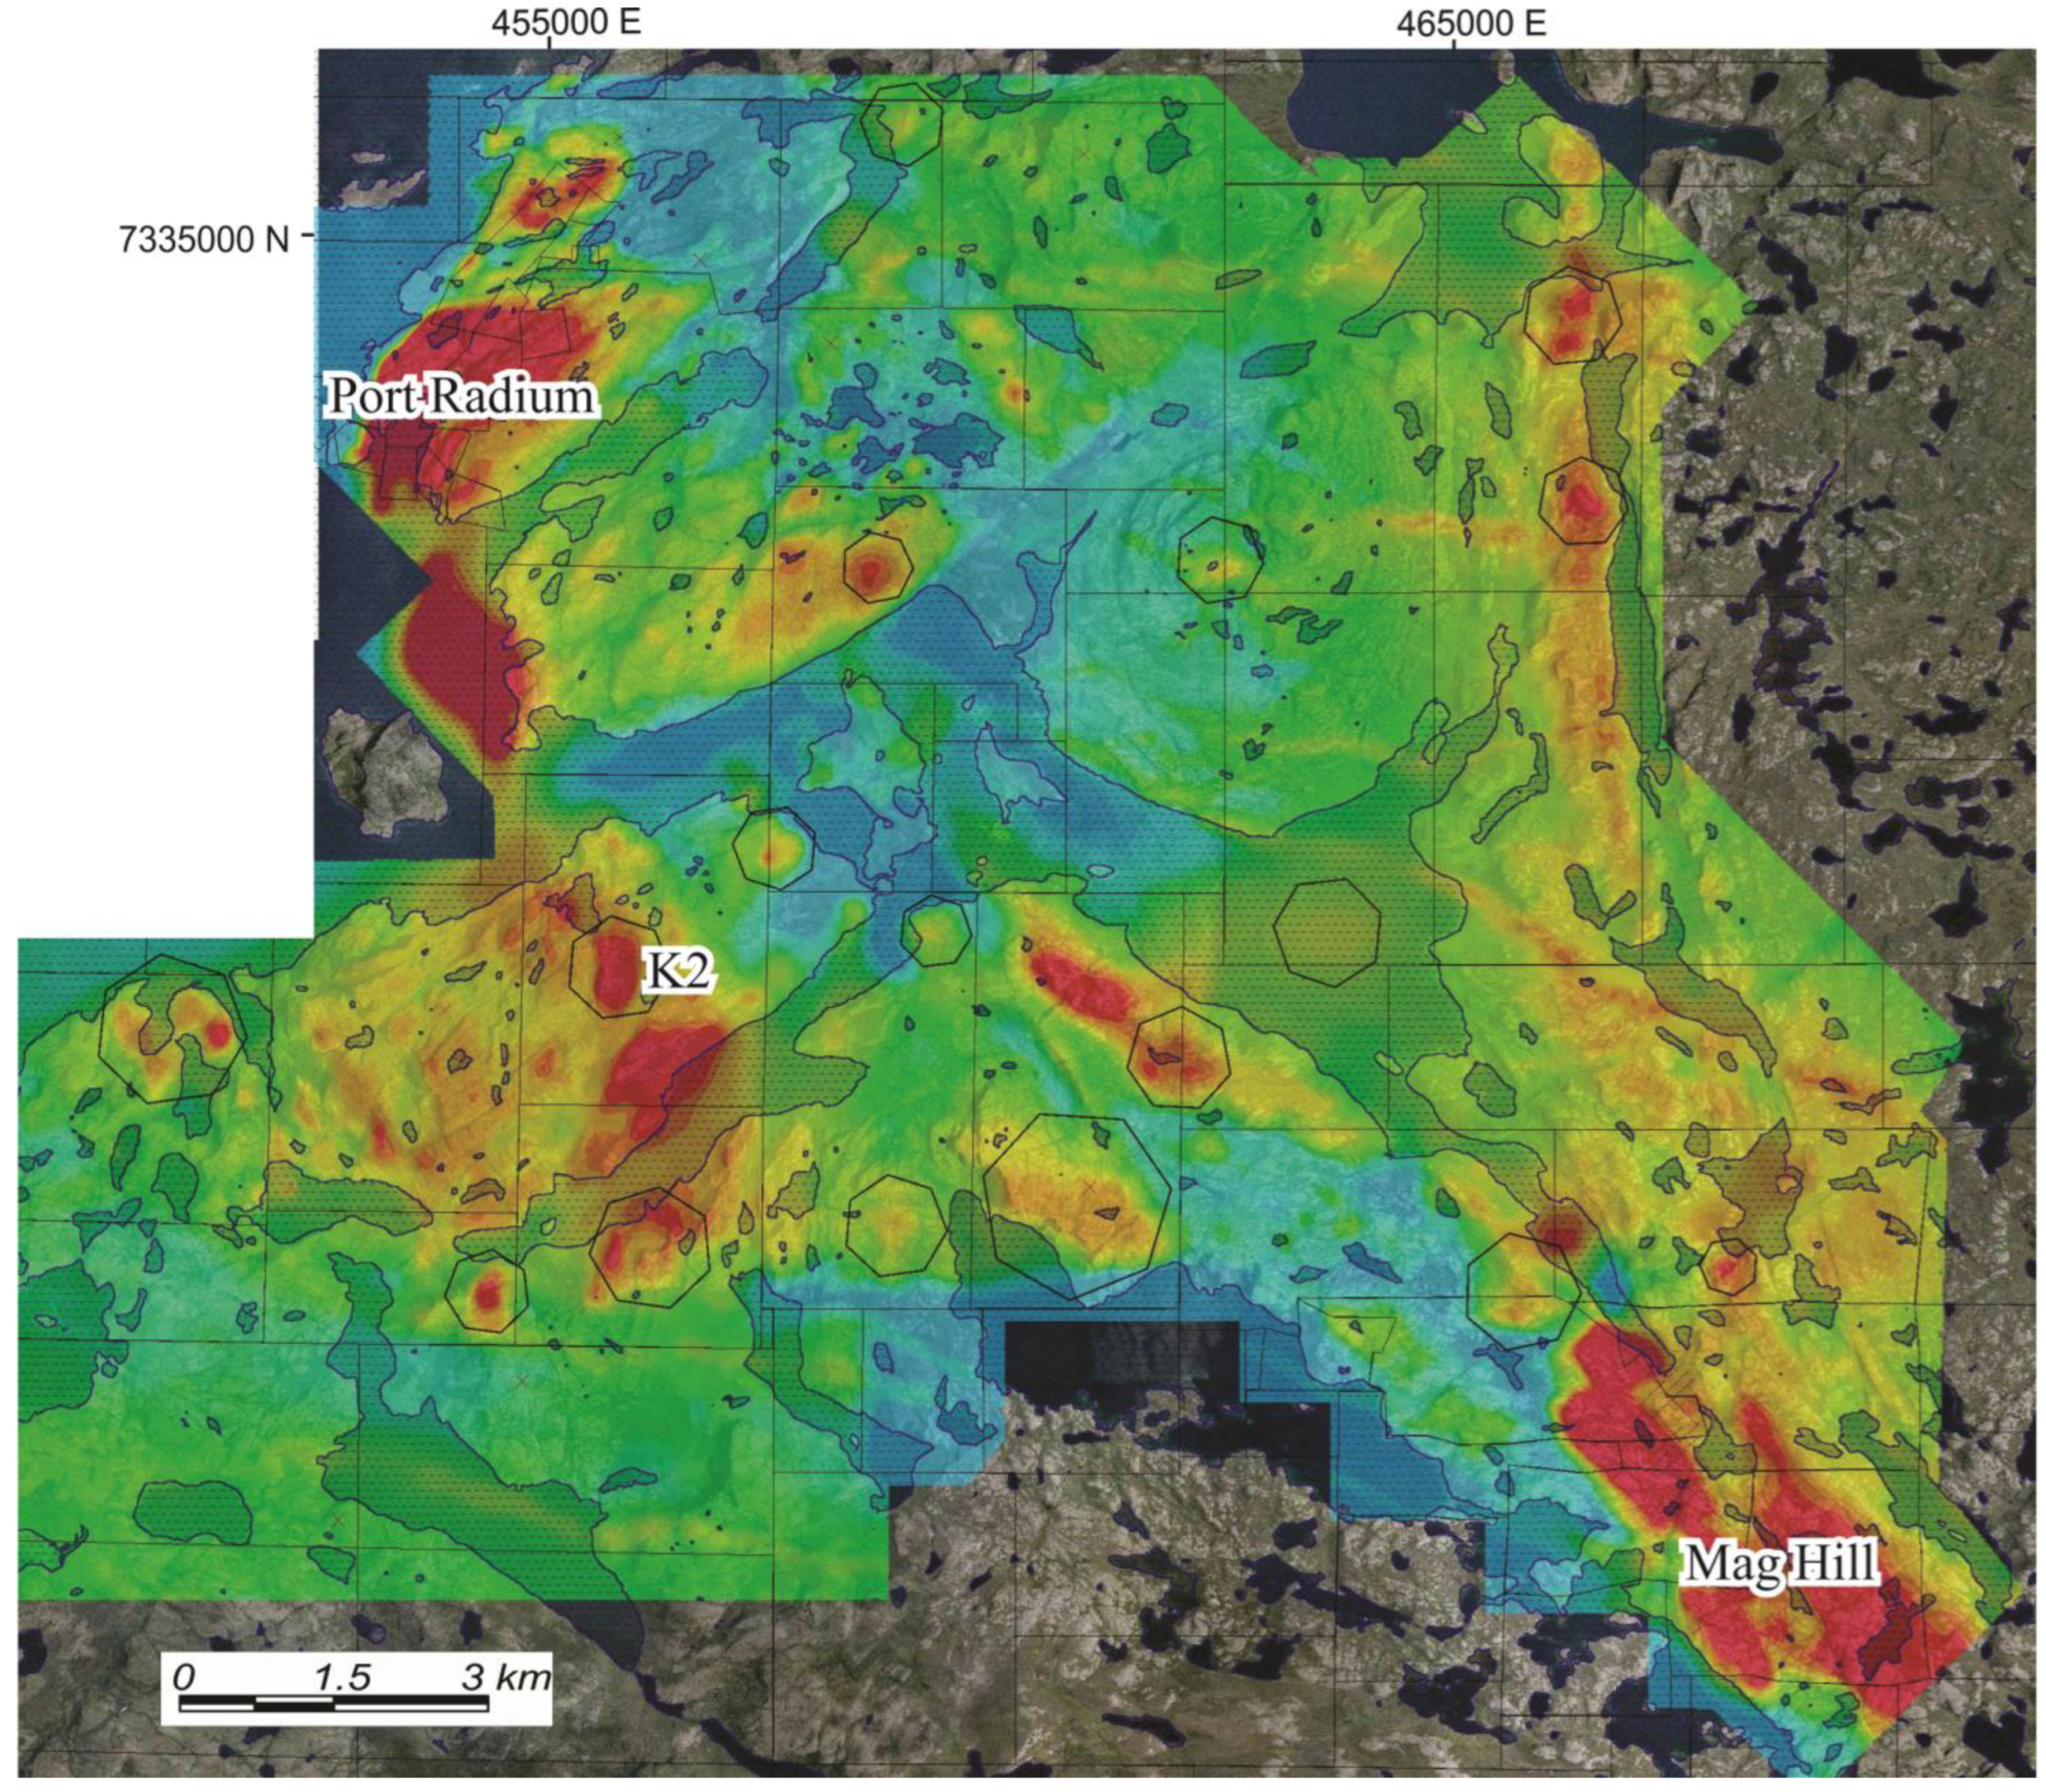
2. Geological Background
3. Materials and Methods
3.1. Sample Collection and Preparation
3.2. Analytical Method
4. Results
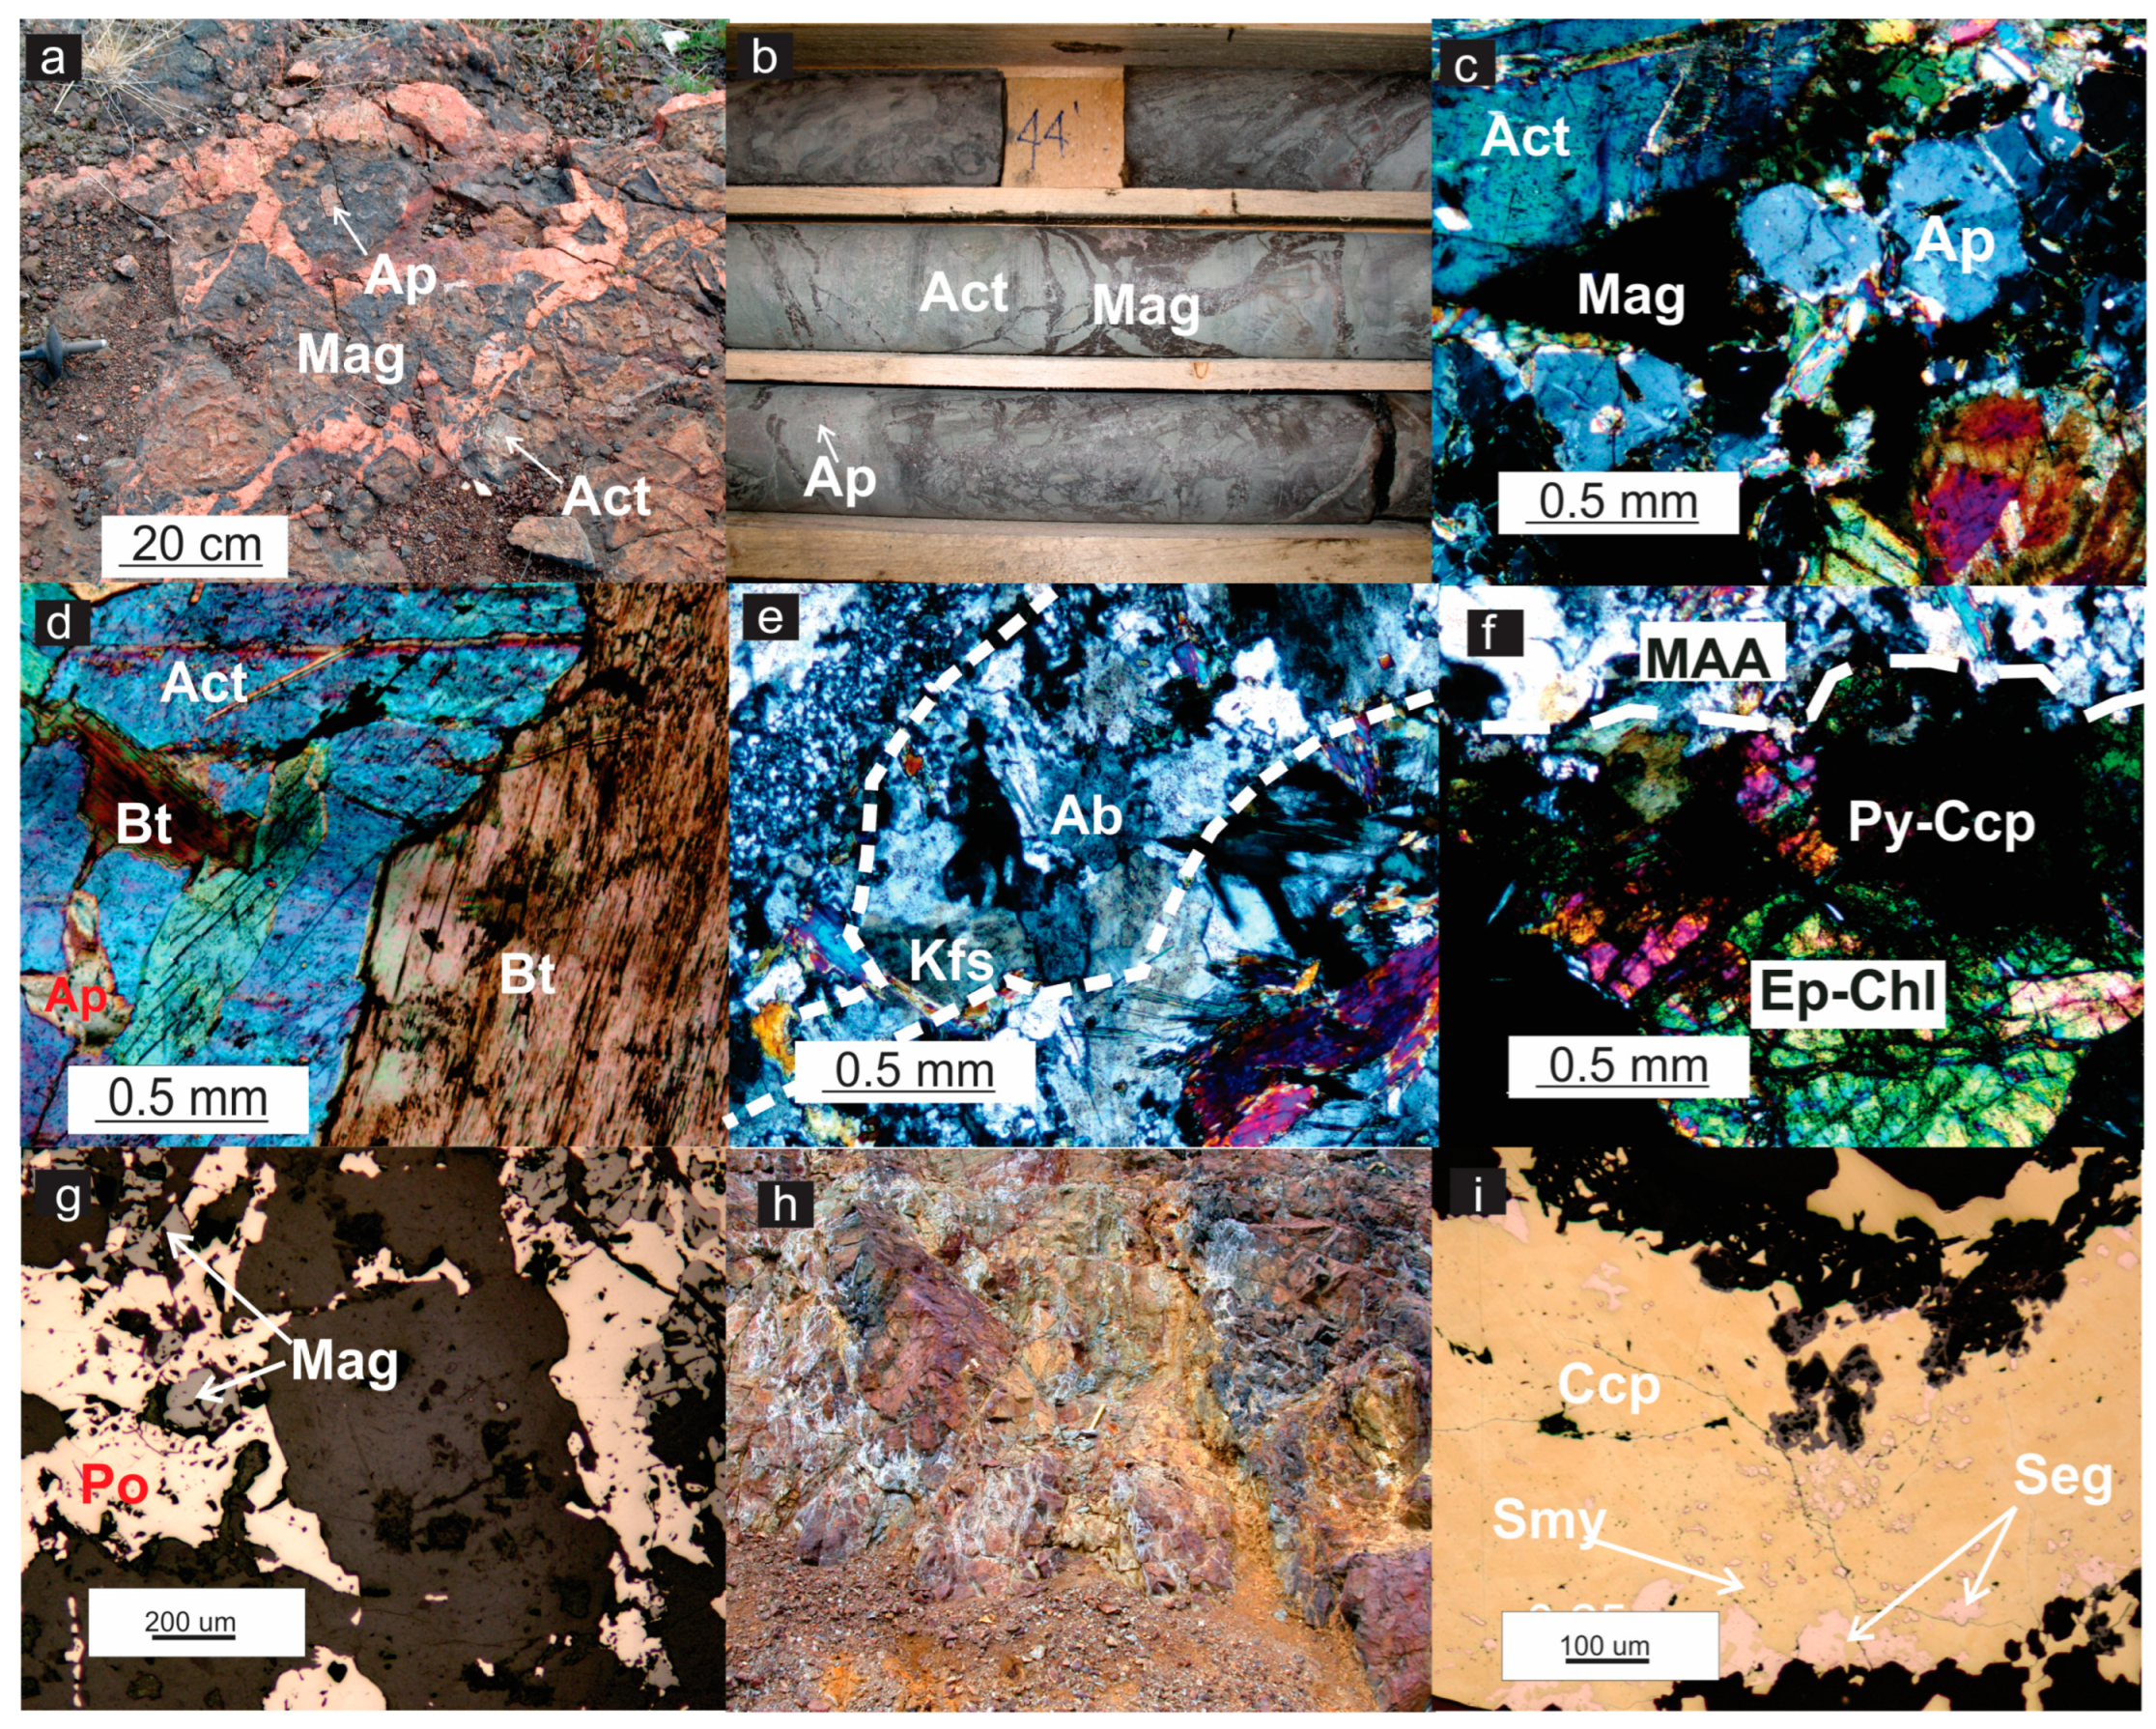
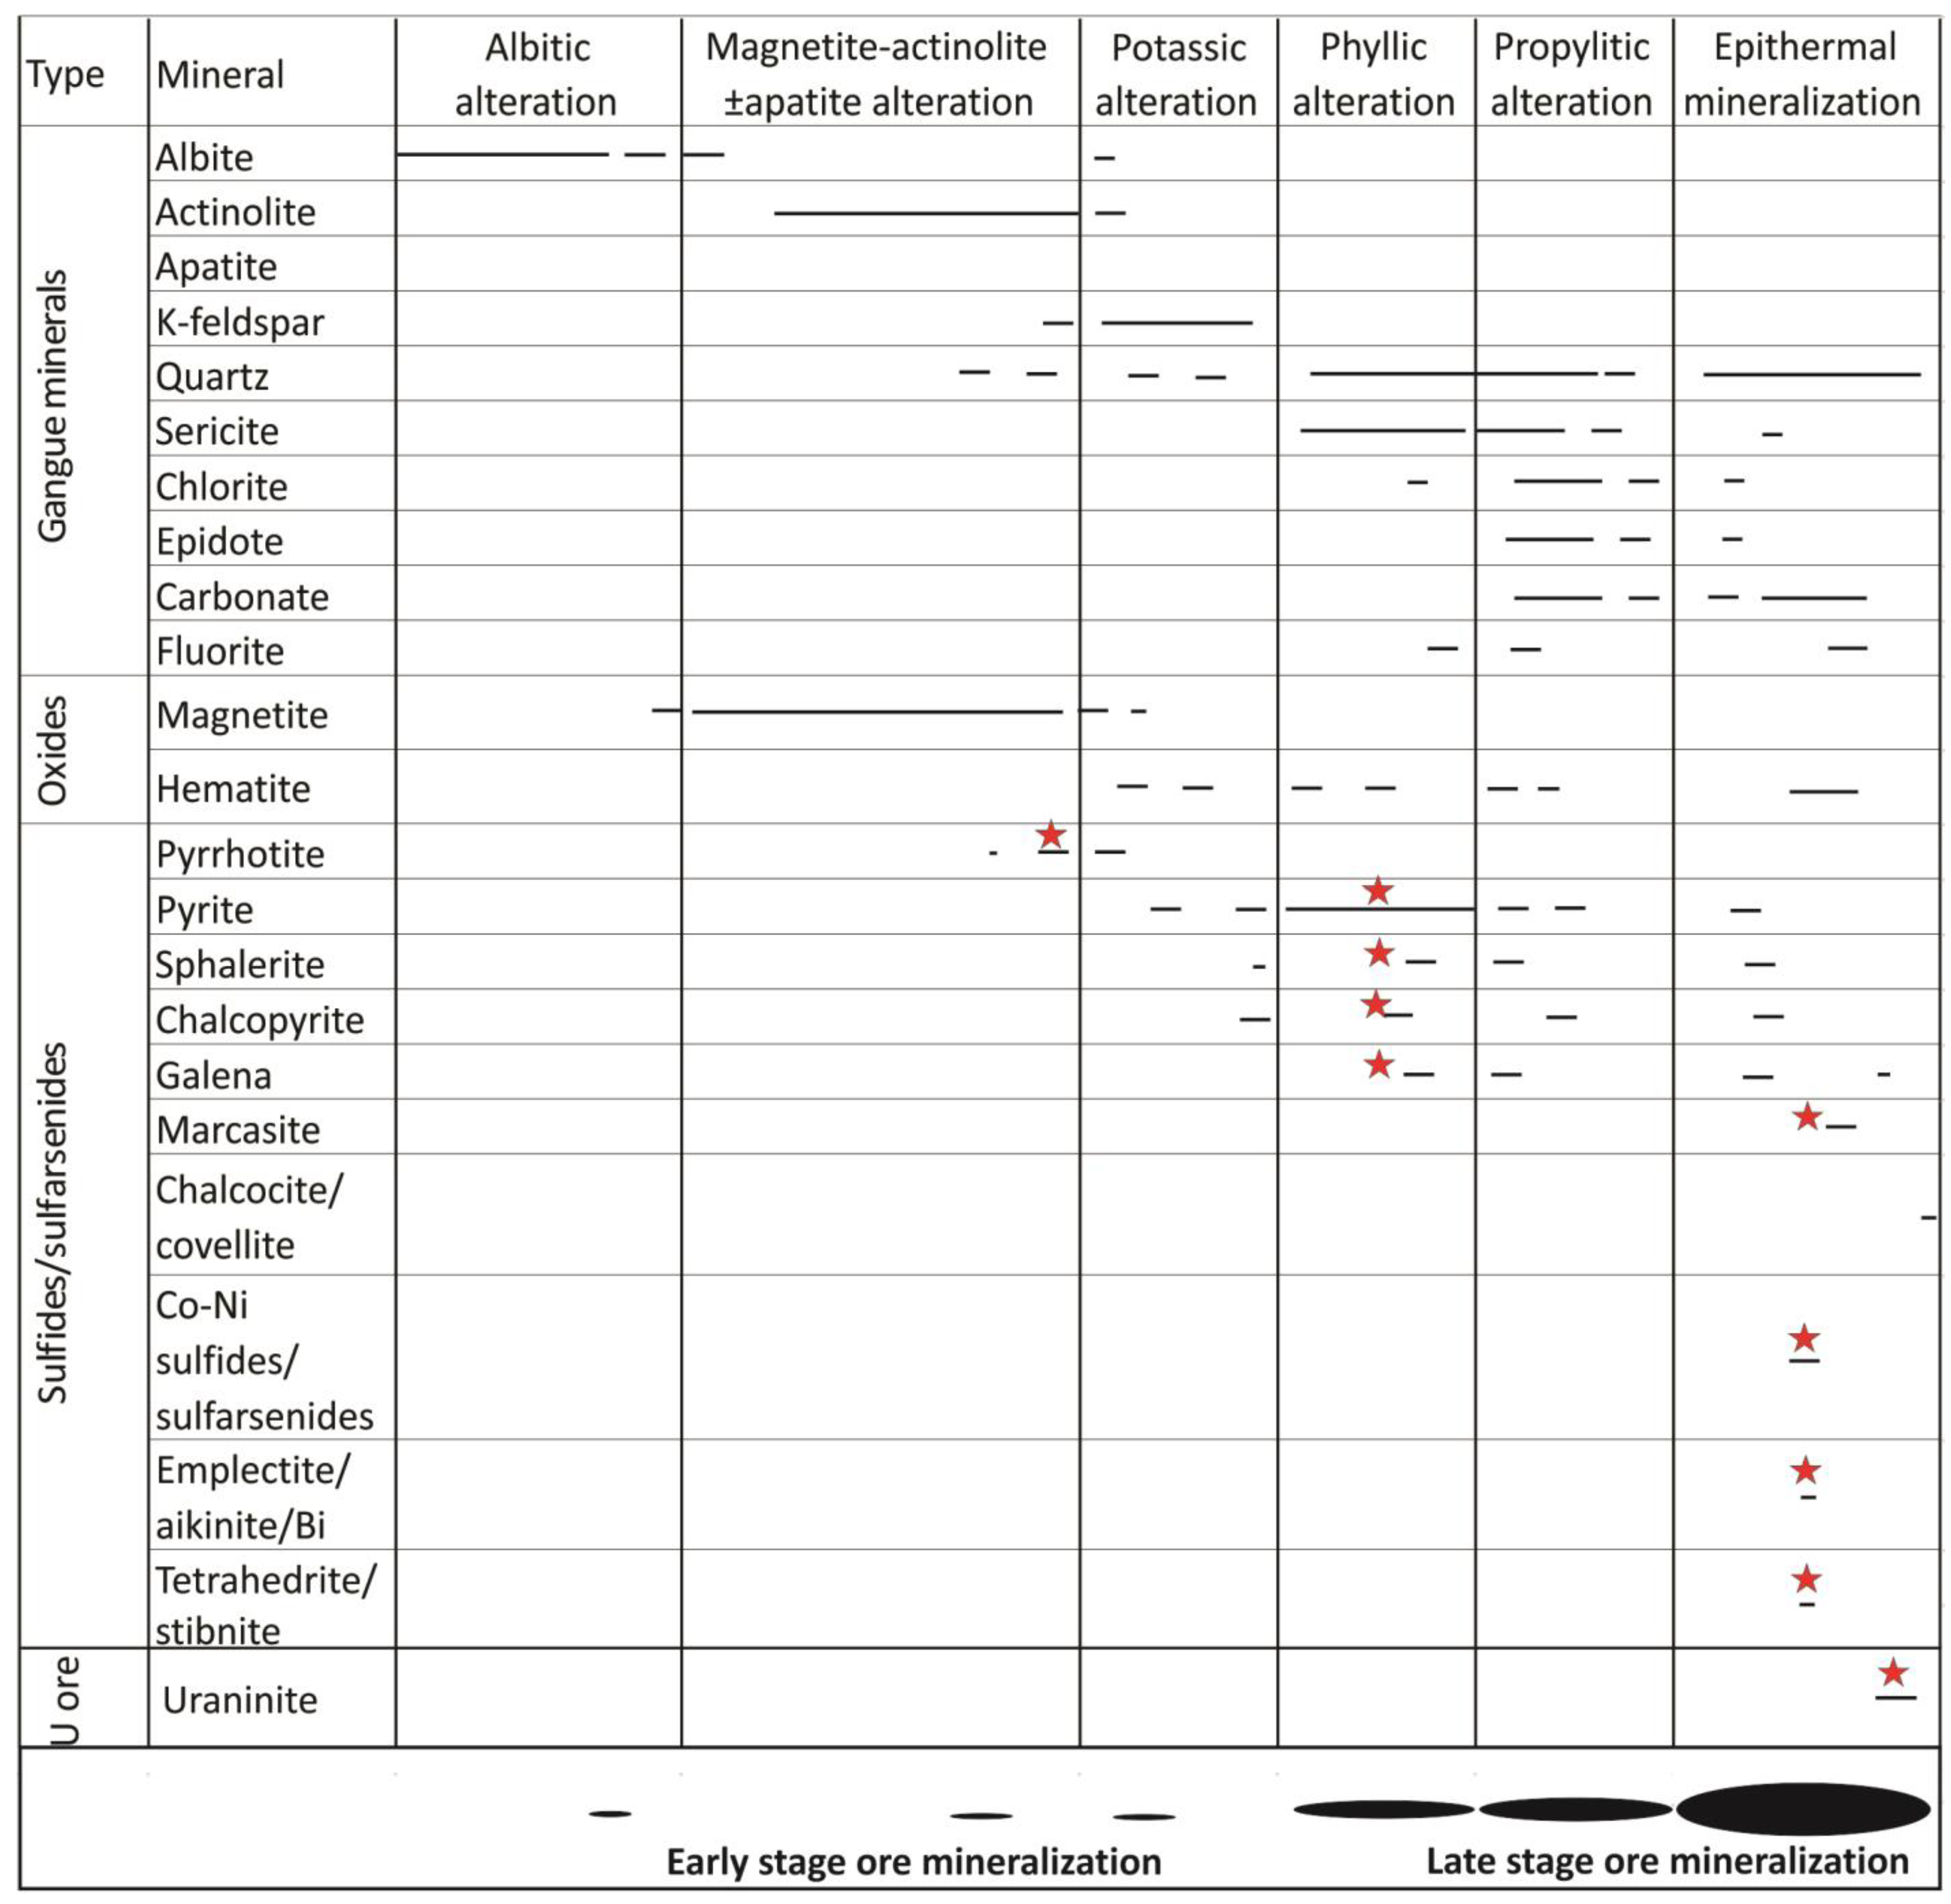
4.1. Hydrothermal Alteration Zones
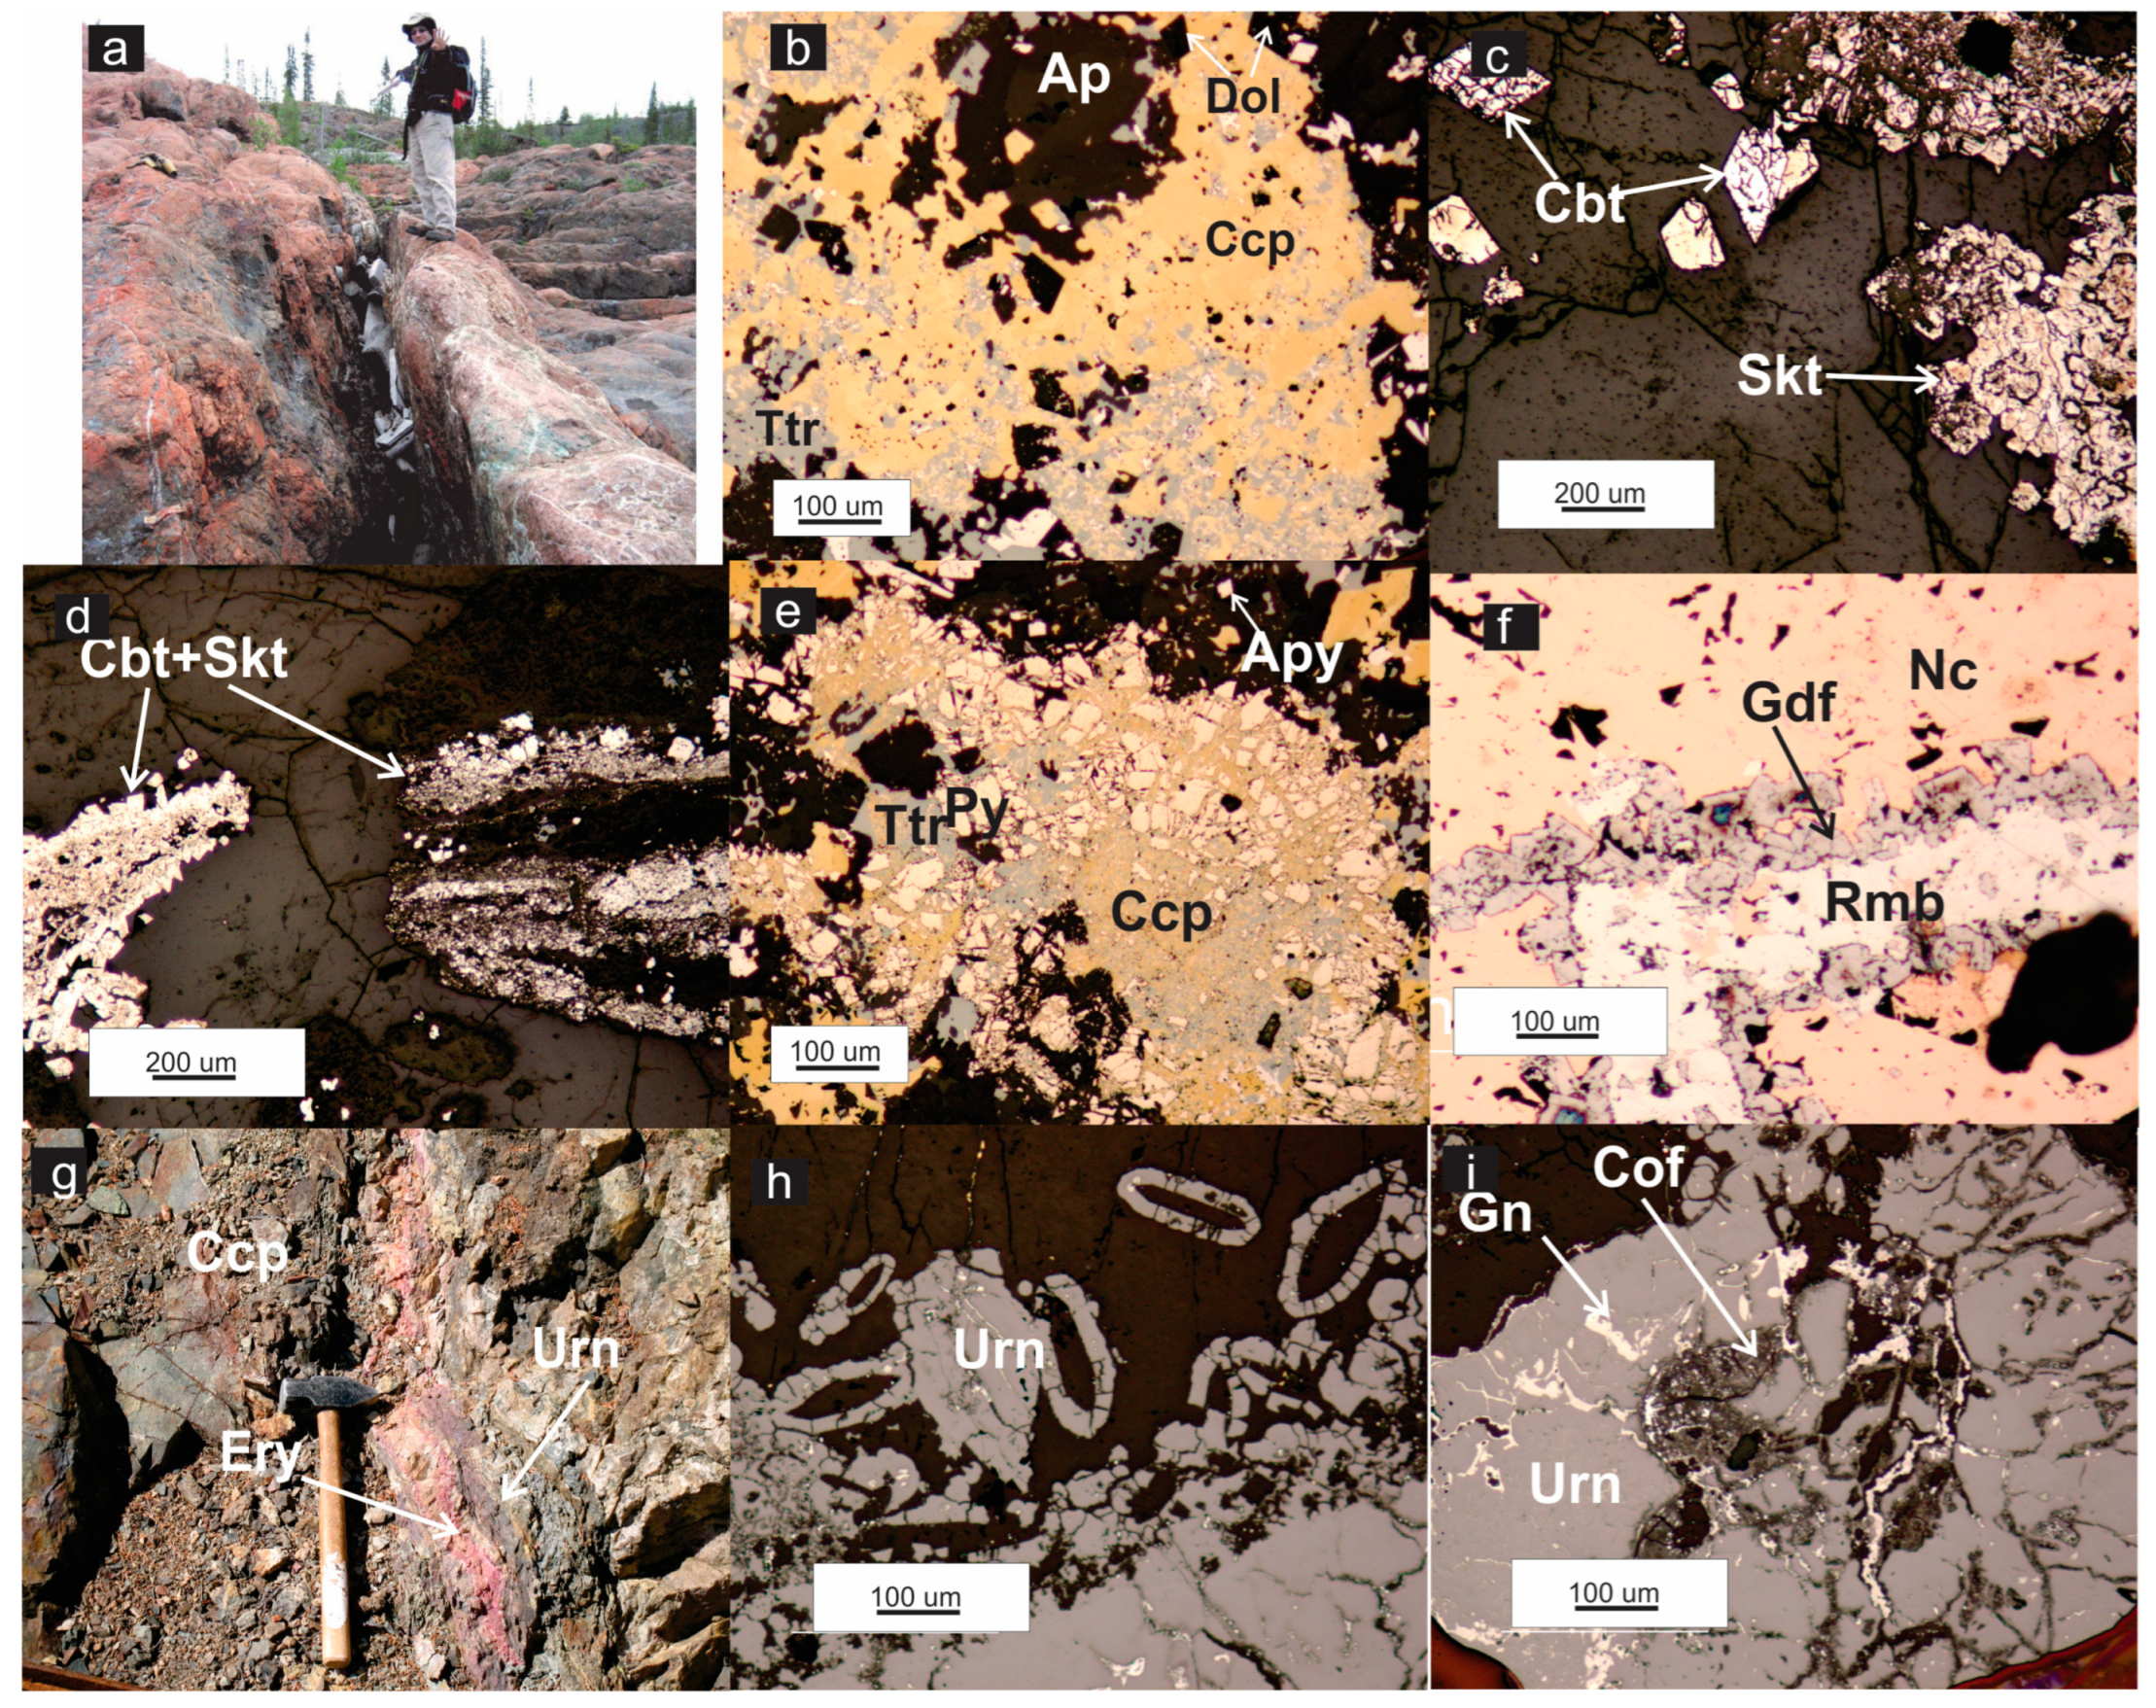
4.2. Ore Mineralization

| Mineral | Acronym | Formula | Mineral | Abbreviation | Formula |
|---|---|---|---|---|---|
| Actinolite | Act | Ca2(Mg4.5–2.5Fe0.5–2.5)Si8O22(OH)2 | Heterogenite | * Htg | CoO(OH) |
| Aikinite | * Akt | PbCuBiS3 | K-feldspar | Kfs | KAlSi3O8 |
| Albite | Ab | NaAlSi3O8 | Magnetite | Mag | Fe3O4 |
| Apatite | Ap | Ca5(PO4)3(Cl/F/OH) | Marcasite | Mrc | FeS2 |
| Arsenopyrite | Apy | FeAsS | Niccolite | * Nc | NiAs |
| Biotite | Bt | K(Fe2+/Mg)2(Al/Fe3+/Mg/Ti)([Si/Al/Fe]2Si2O10)(OH/F)2 | Pyrite | Py | FeS2 |
| Bismuth | Bi | Bi | Pyrrhotite | Po | FeS |
| Calcite | Cal | CaCO3 | Quartz | Qz | SiO2 |
| Chalcocite | Cct | Cu2S | Rammelsbergite | * Rmb | NiAs2 |
| Chalcopyrite | Ccp | CuFeS2 | Safflorite (and clinosafflorite) | * Saf | (Co0.8Ni0.2)As2 (and CoAs2) |
| Chlorite | Chl | (Mg,Fe2+,Fe3+,Mn,Al)12[(Si,Al)8O20](OH)16 | Sericite | Ser | KAl2(AlSi3O10)(OH)2 |
| Cobaltite | * Cbt | (Co,Fe)AsS | Siegenite | * Seg | (Ni,Co)3S4 |
| Coffinite | * Cof | UO2.nH2O | Skuterrudite | * Skt | (Co,Fe,Ni)As2-3 |
| Covellite | Cv | CuS | Sphalertite | Sp | ZnS |
| Dolomite | Dol | CaMg(CO3)2 | Stibnite | * Stb | Sb2S3 |
| Emplectite | * Emp | CuBiS2 | Stromeyerite | * Smy | AgCuS |
| Epidote | Ep | (CaCa)(AlAlFe3+)O[Si2O7][SiO4](OH) | Tetrahedrite | Ttr | (Cu,Fe,Ag,Zn)12Sb4S13 |
| Erythrite | * Ery | Co3(AsO4)2·8H2O | Mineral X1 | X1 | (Co0.96Ni0.45Fe0.03)S0.27As4 |
| Fluorite | Fl | CaF2 | Mineral X2 | X2 | (Ni2.13Co0.38)S0.97As4 |
| Galena | Gn | PbS | Mineral X3 | X3 | (Ni1.83Co0.83)S1.25As4 |
| Gersdorffite | * Gdf | NiAsS | Uraninite | Urrn | UO2 |
| Hematite | Hem | Fe2O3 | Uranophane | * Urf | Ca(UO2)2SiO3(OH)2.5(H2O) |
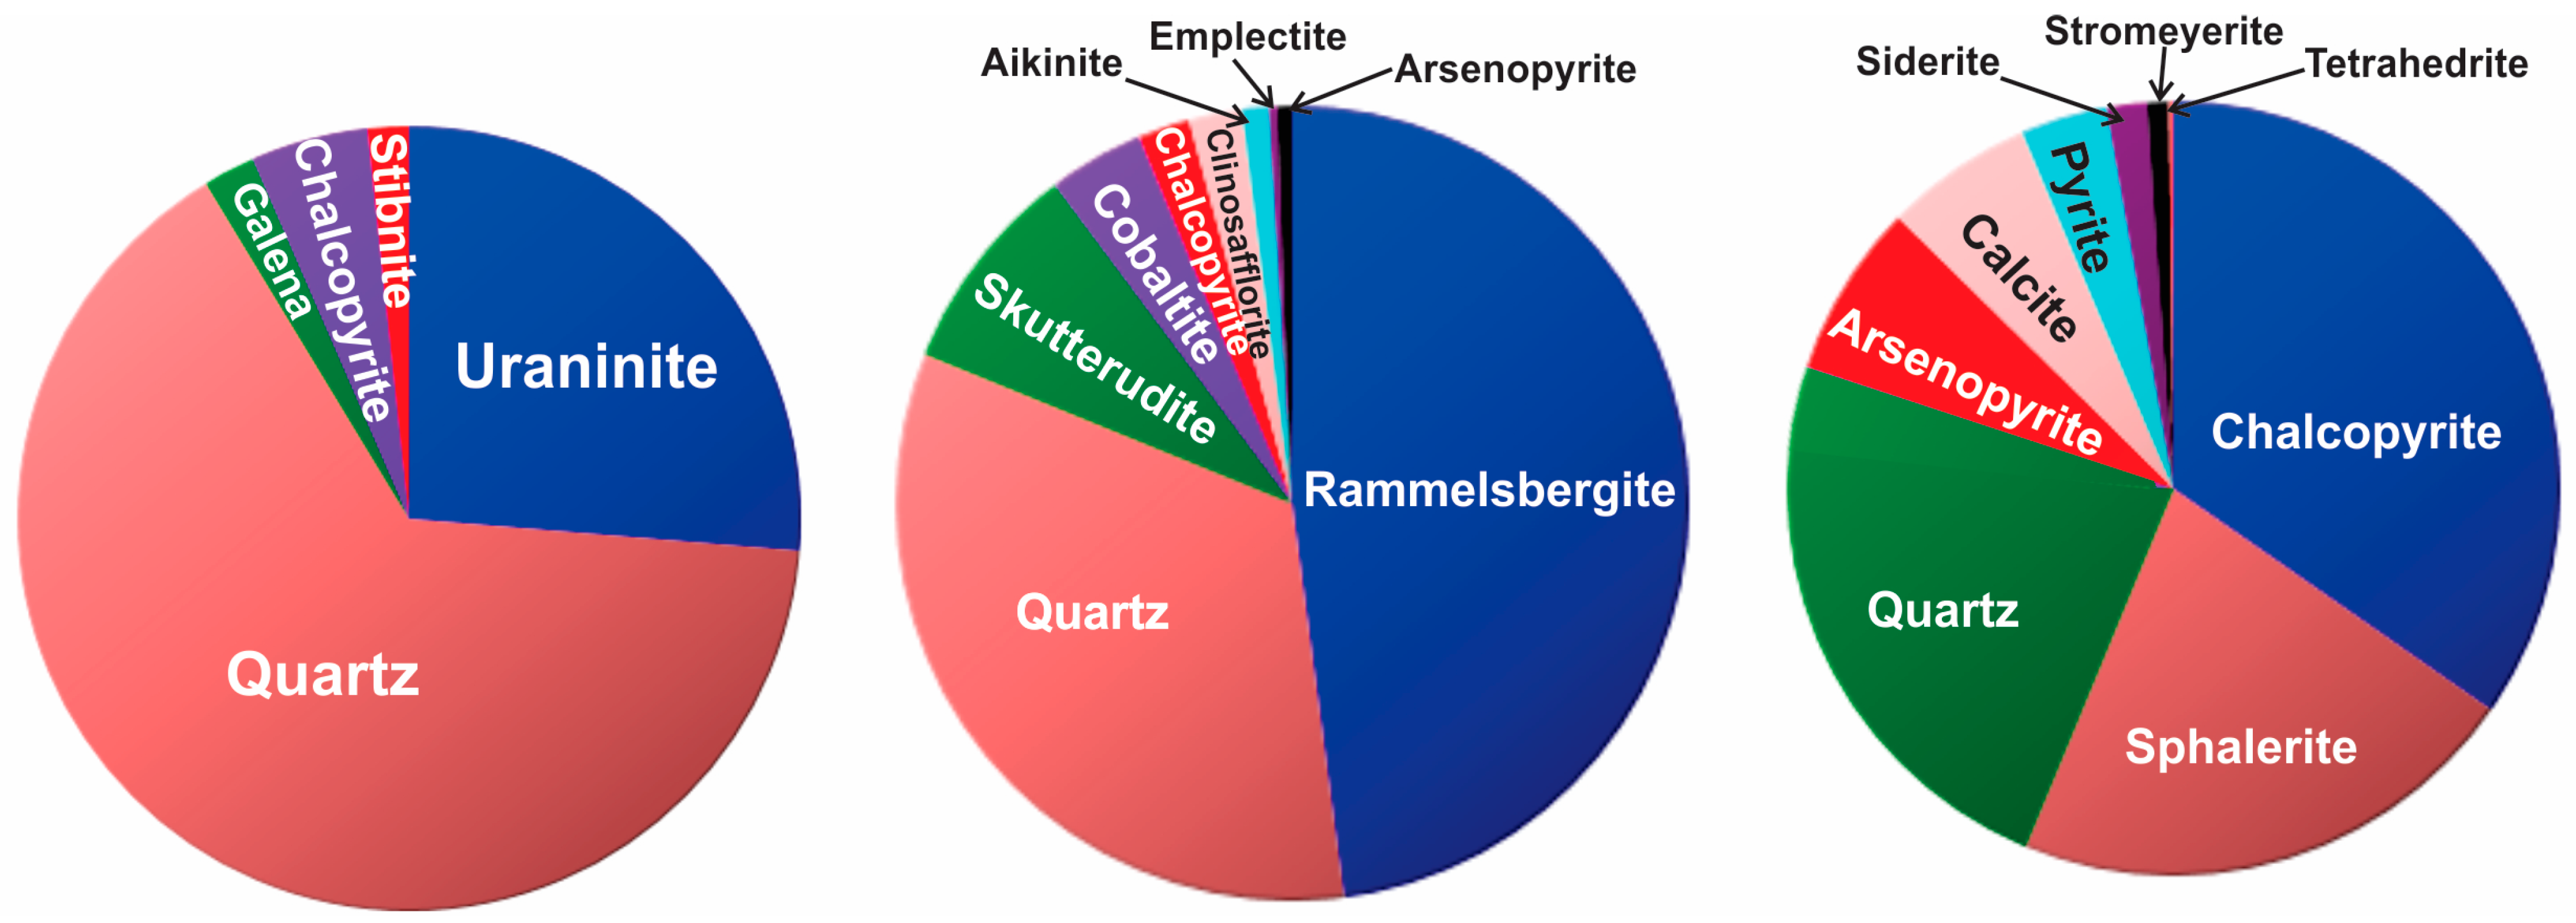
4.2.1. Early-Stage Ore Mineralization
4.2.2. Late-Stage Ore Mineralization
Epithermal Sulfide Assemblages
Epithermal Sulfarsenide Assemblages
Uranium-Sulfide-Sulfarsenide Assemblages
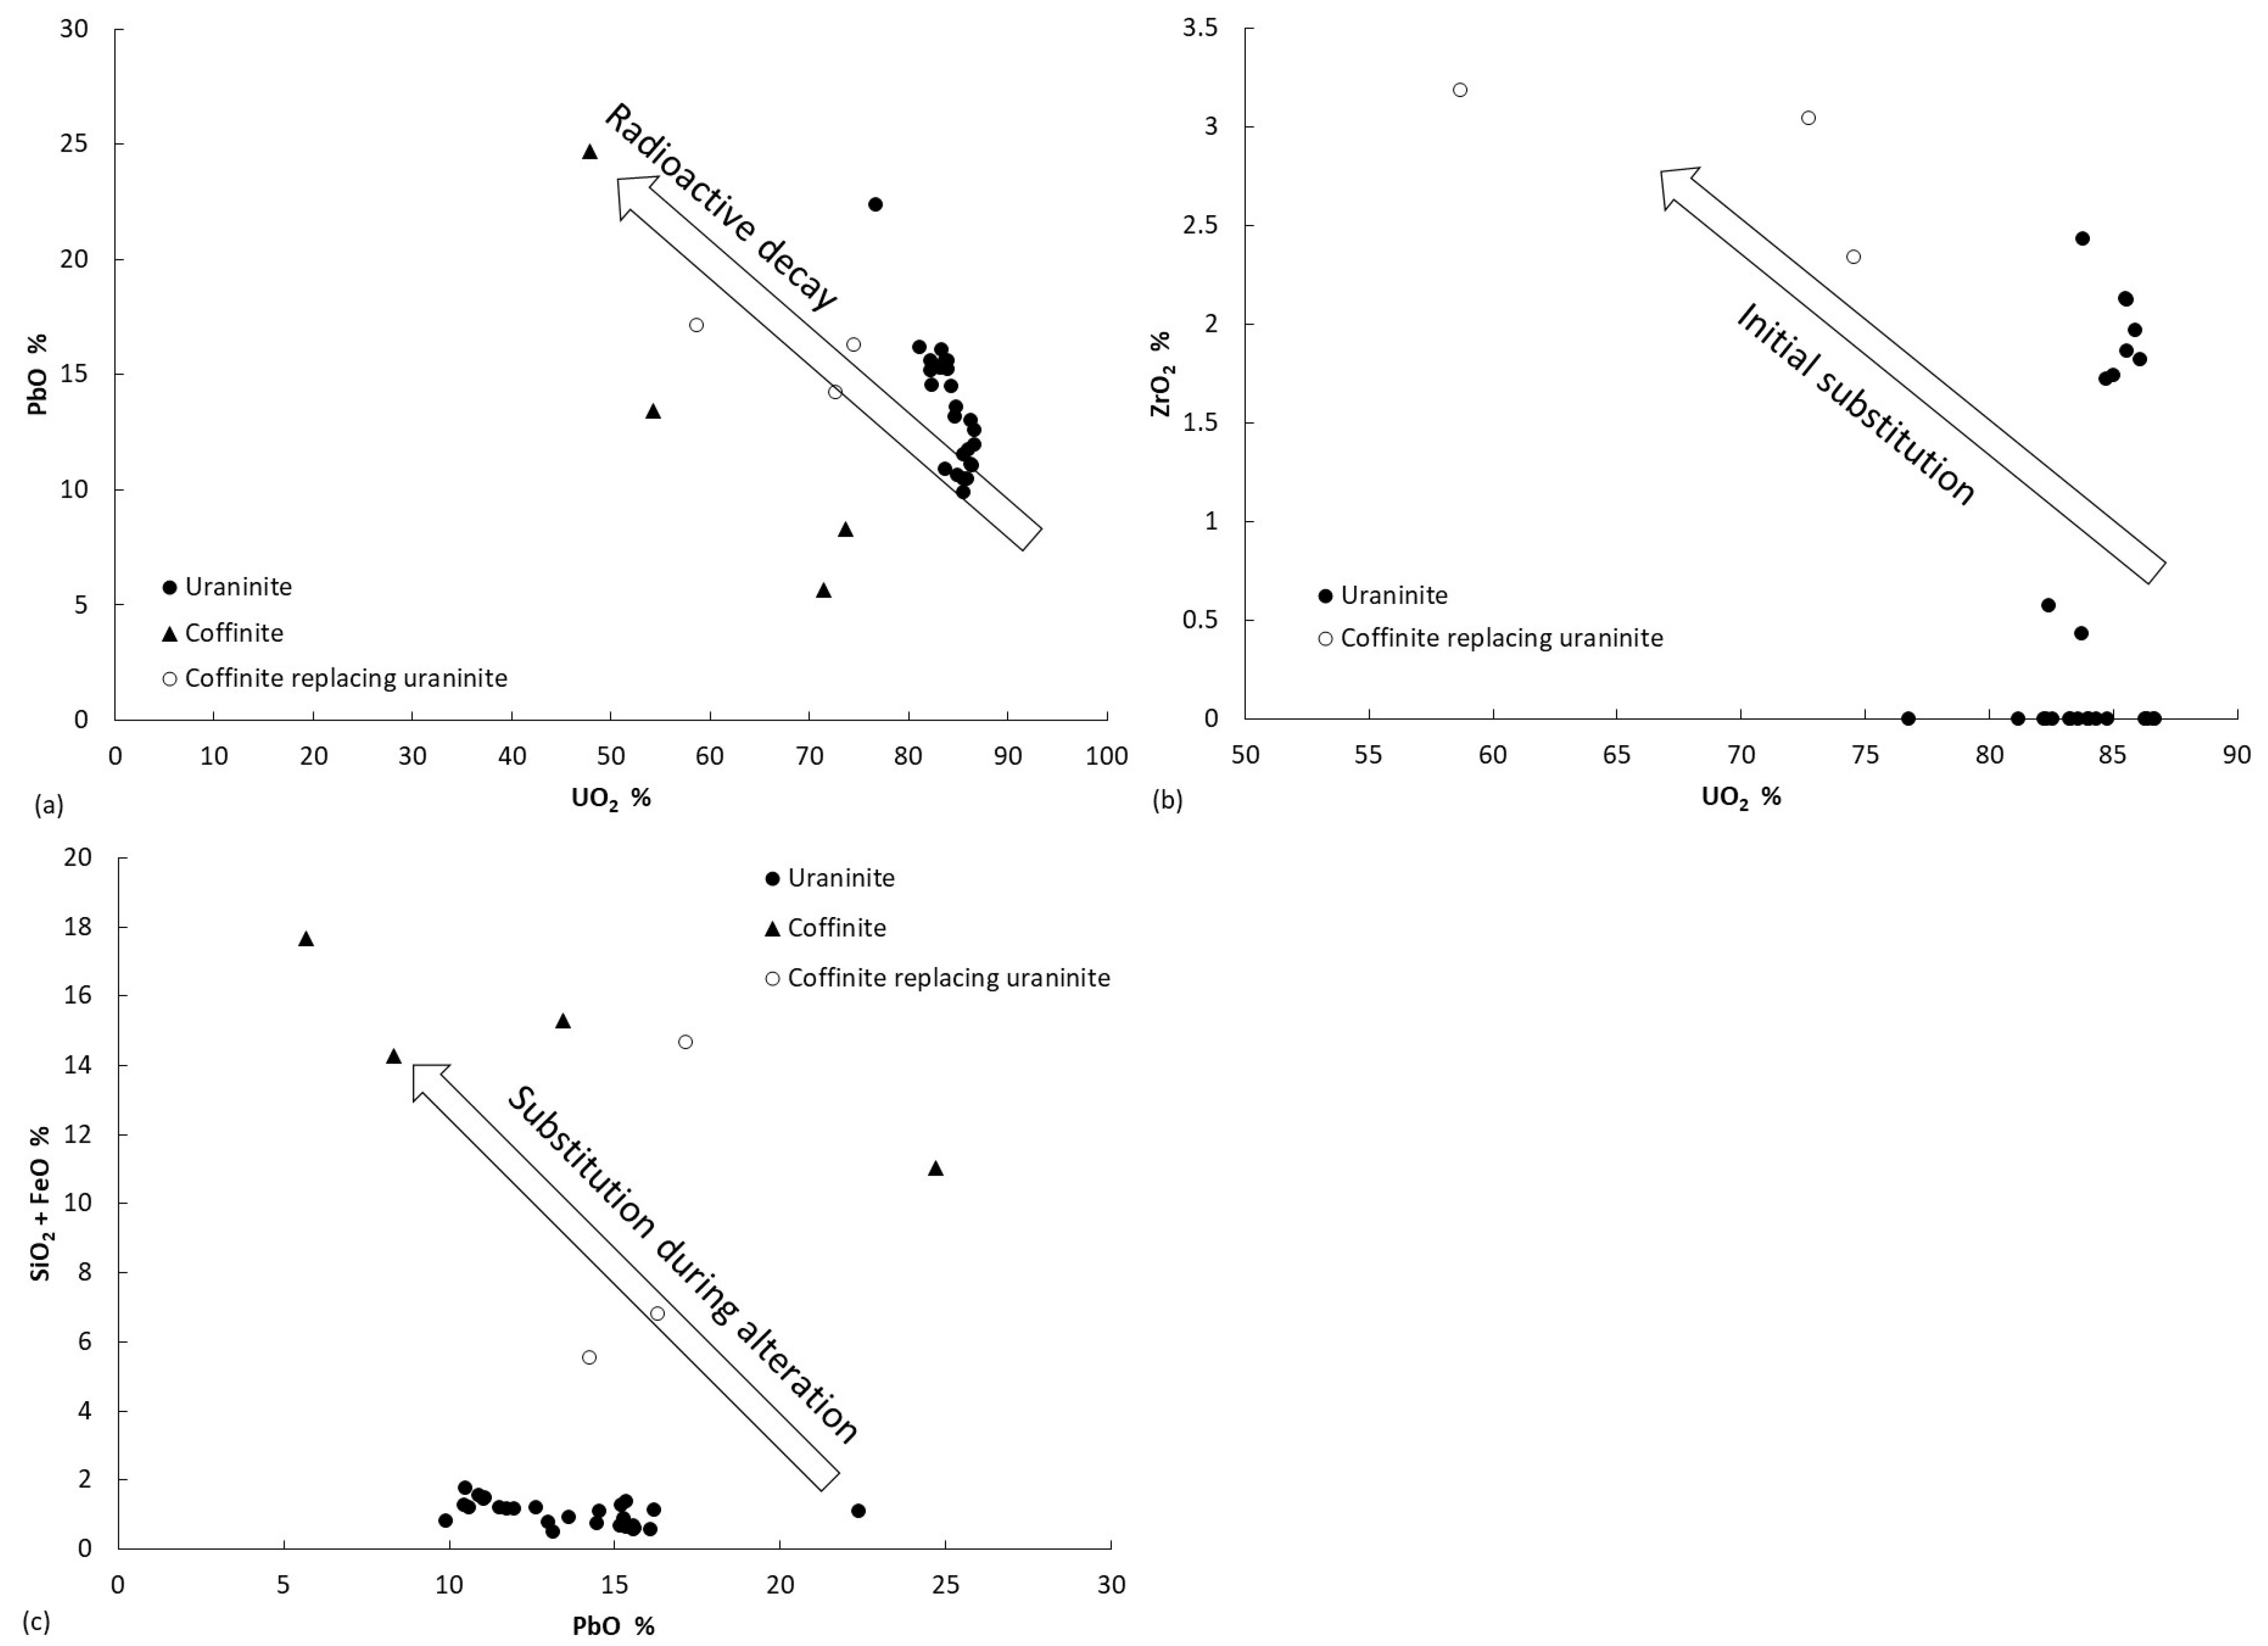
4.3. Mineral Chemistry
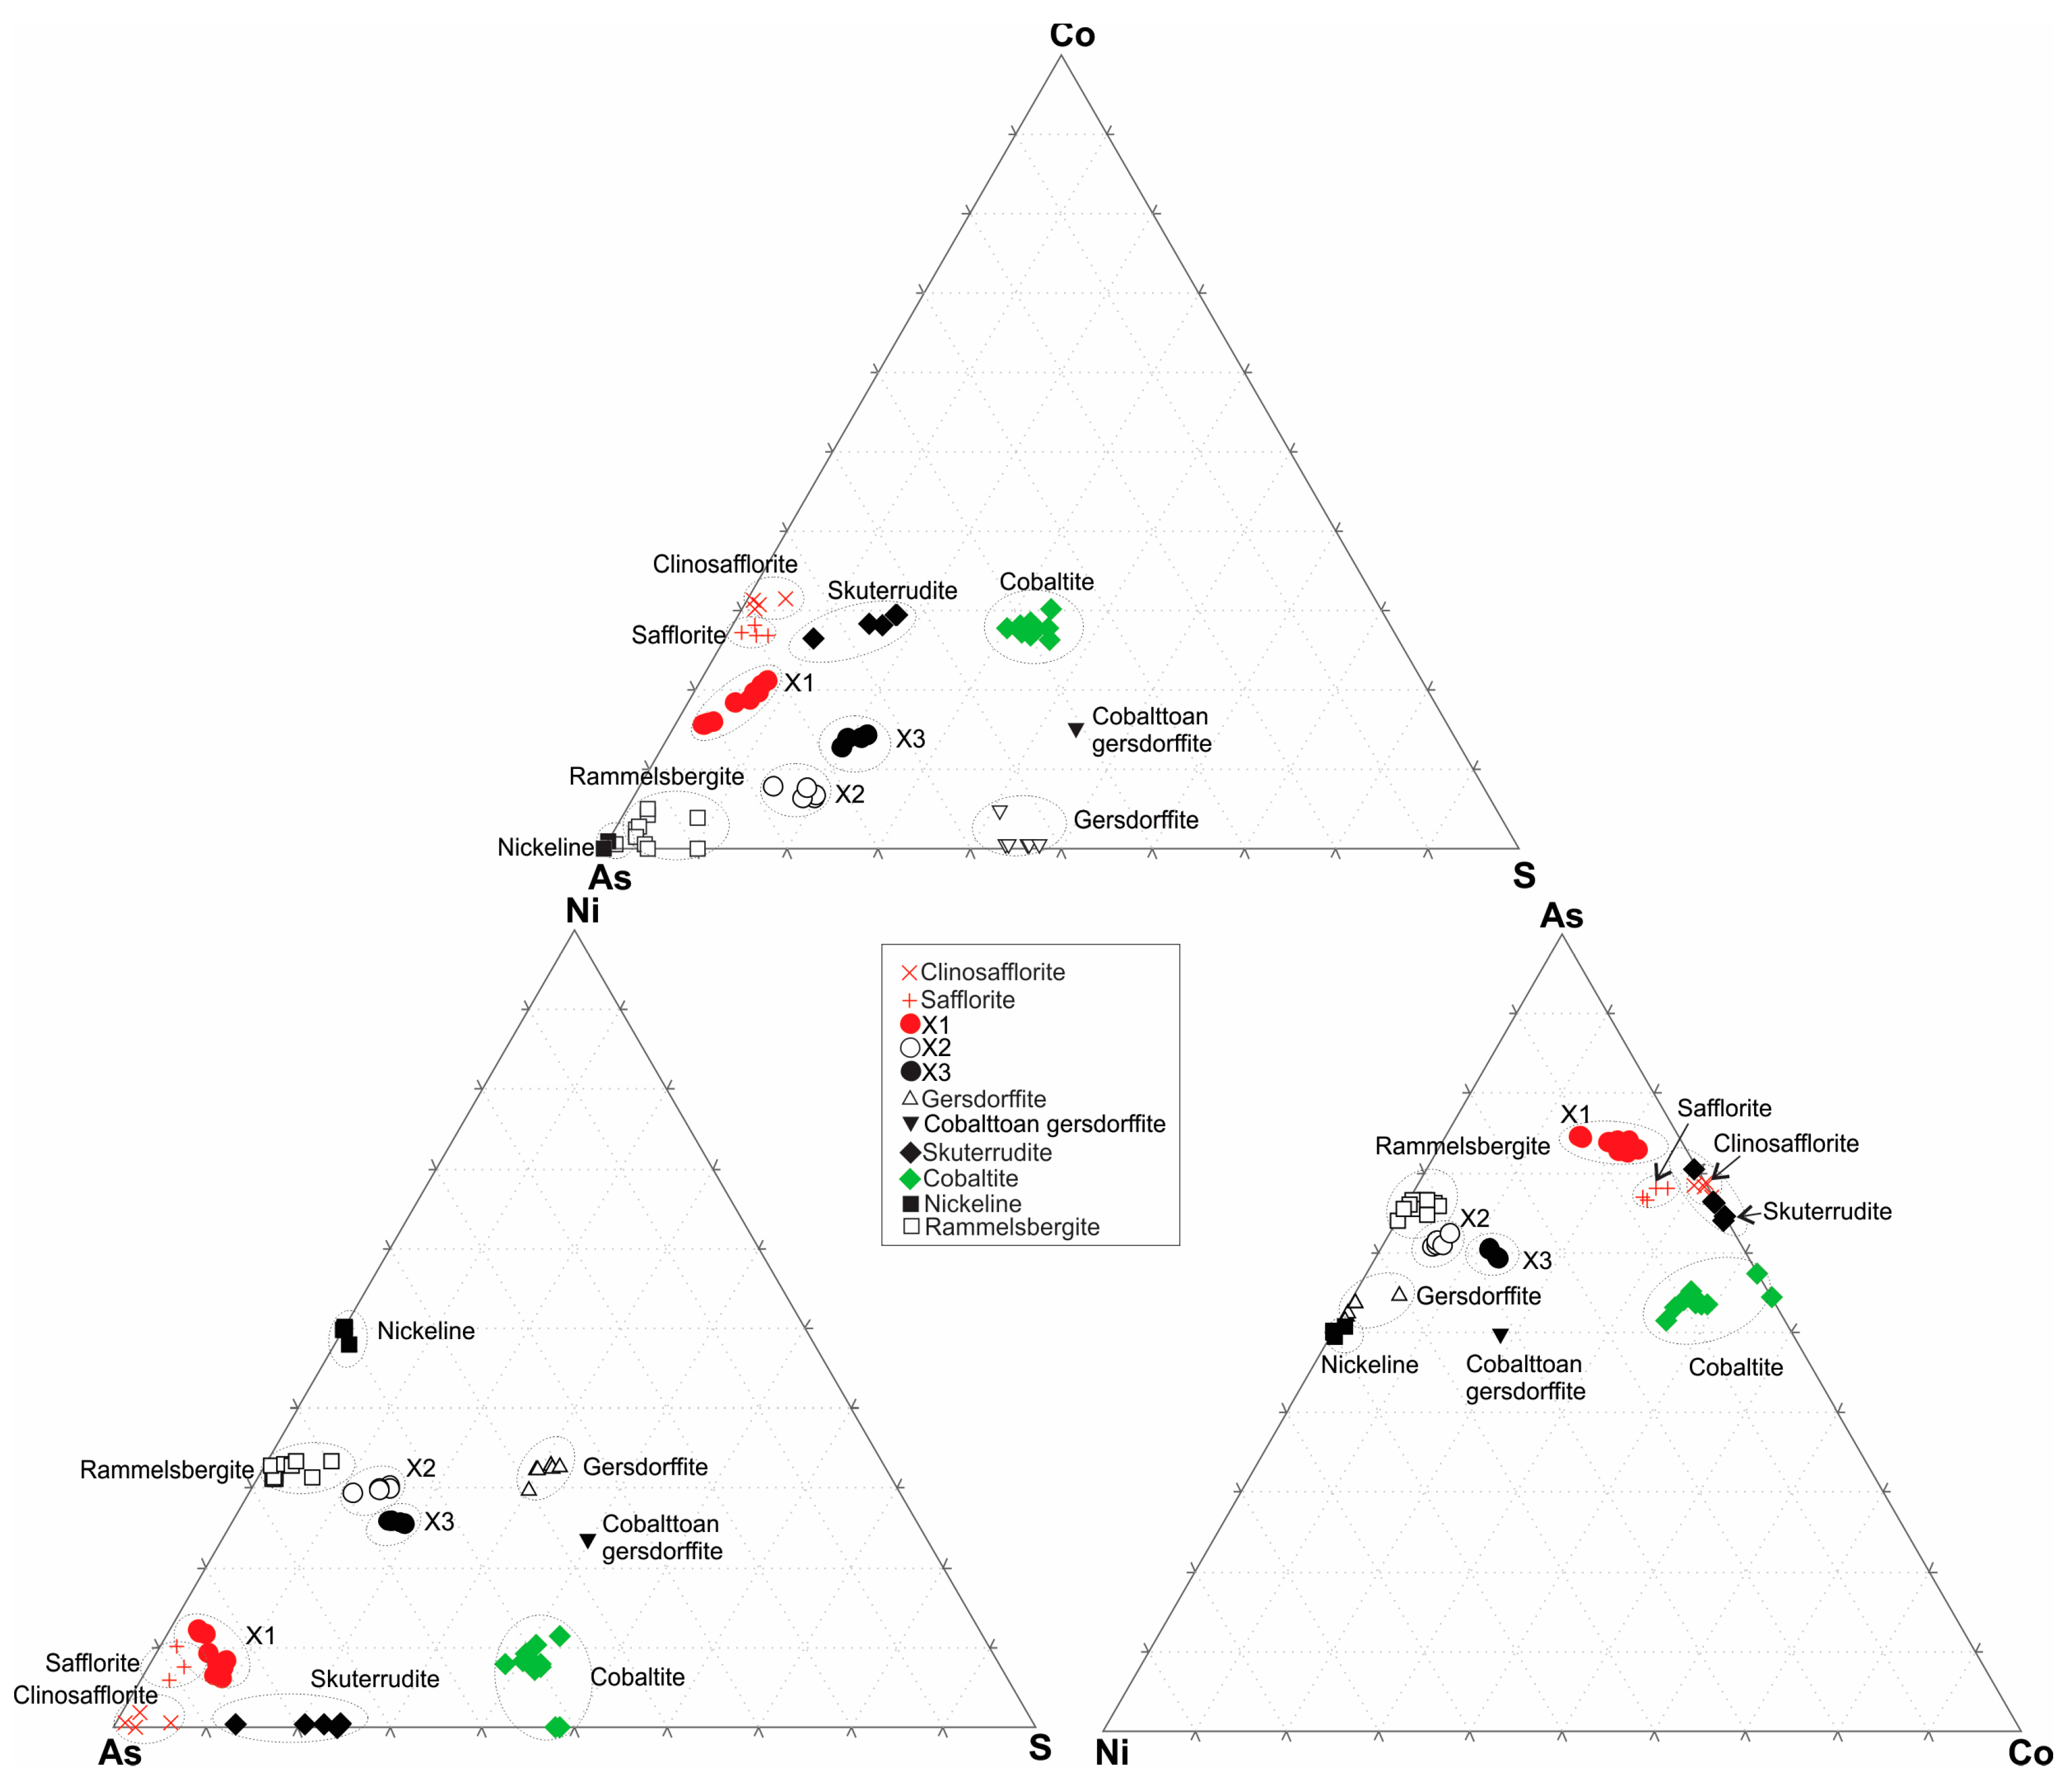
Fe-Co-Ni-As-S System
5. Discussion
6. Conclusions
Supplementary Materials
Author Contributions
Funding
Data Availability Statement
Acknowledgments
Conflicts of Interest
References
- Wagner, T.; Lorenz, J. Mineralogy of complex Co–Ni–Bi vein mineralization, Bieber deposit, Spessart, Germany. Mineral. Mag. 2002, 66, 385–407. [Google Scholar] [CrossRef]
- Melekestseva, I.Y.; Zaikov, V.V.; Tesalina, S.G. Sulfoarsenides and arsenides of Co, Fe and Ni in ores of Ishkininsk cobalt-copper massive sulfide deposit of southern Urals. Zap. Vserossiiskogo Mineral. Obs. 2003, 132, 66–77. [Google Scholar]
- Parviainen, A.; Gervilla, F.; Melgarejo, J.C.; Johanson, B. Low-temperature, platinum-group elements-bearing Ni arsenide assemblage from the Atrevida mine (Catalonian Coastal Ranges, NE Spain). Neues Jahrb. Für Mineral. Abh. 2008, 185, 33–49. [Google Scholar] [CrossRef]
- Gervilla, F.; Fanlo, I.; Colás, V.; Subías, I. Mineral compositions and phase relations of Ni-Co-Fe arsenide ores from the Aghbar Mine, Bou Azzer, Marocco. Can. Mineral. 2012, 50, 447–470. [Google Scholar] [CrossRef]
- Kiefer, S.; Majzlan, J.; Chovan, M.; Stevko, M. Mineral compositions and phase relations of the complex sulfarsenides and arsenides from Dobsina (Western Carpathians, Slovakia). Ore Geol. Rev. 2017, 89, 894–908. [Google Scholar] [CrossRef]
- Rezazadeh, S.; Hosseinzadeh, M.R.; Raith, J.G.; Moayyed, M. Mineral chemistry and phase relations of Co–Ni arsenides and sulfarsenides from the Baycheh-Bagh deposit, Zanjan province, Iran. Ore Geol. Rev. 2020, 127, 103836. [Google Scholar] [CrossRef]
- Tourneur, E.; Chauvet, A.; Kouzmanov, K.; Tuduri, J.; Paquez, C.; Sizaret, S.; Karfal, A.; Moundi, Y.; El Hassani, A. Co-Ni-arsenide mineralisation in the Bou Azzer district (Anti-Atlas, Morocco): Genetic model and tectonic implications. Ore Geol. Rev. 2021, 134, 104128. [Google Scholar] [CrossRef]
- Fuess, H.; Kratz, T.; Toepel-Schadt, J.; Miehe, G. Crystal structure refinement and electron microscopy of arsenopyrite. Z. Für Krist. 1987, 179, 335–346. [Google Scholar] [CrossRef]
- Fleet, M.E.; Burns, P.C. Structure and twinning of cobaltite. Can. Mineral. 1990, 28, 719–723. [Google Scholar]
- Posfai, M.; Sharp, T.G.; Kontny, A. Pyrrhotite varieties from the 9.1 km deep borehole of the KTB project. Am. Mineral. 2002, 85, 1406–1415. [Google Scholar] [CrossRef]
- Hem, S.R.; Makovicky, E. The system Fe–Co–Ni–As–S. II. Phase relations in the (FeCo, Ni)As1.5S0.5 section at 650° and 500 °C. Can. Mineral. 2004, 42, 63–86. [Google Scholar] [CrossRef]
- Hem, S.R. Solid solutions in the Fe–Co–Ni–As–S system. Chem. Geol. 2006, 225, 291–303. [Google Scholar] [CrossRef]
- Somarin, A.K.; Zhou, L. Hydrothermal Mineralization and Mineral Chemistry of Arsenides and Sulfarsenides in the Fe-Co-Ni-As-S System and Introduction of Three Unknown Minerals from the Port Radium IOCG Deposit, Northwest Territories, Canada. Research Square Preprint. 2022. Available online: https://www.researchsquare.com/article/rs-1551126/v1 (accessed on 1 November 2023).
- Hildebrand, R.S.; Hoffman, P.F.; Bowring, S.A. The Calderian orogeny in Wopmay orogen (1.9 Ga), northwestern Canadian Shield. Geol. Soc. Am. Bull. 2010, 122, 794–814. [Google Scholar] [CrossRef]
- Hildebrand, R.S.; Hoffman, P.F.; Bowring, S.A. Tectonomagmatic evolution of the 1.9 Ga Great Bear magmatic zone, Wopmay orogen, northwestern Canada. J. Volcan. Geoth. Res. 1987, 32, 99–118. [Google Scholar] [CrossRef]
- Gandhi, S.S.; Mortensen, J.K.; Prasad, N.; van Breemen, O. Magmatic evolution of the southern Great Bear continental arc, northwestern Canadian Shield: Geochronological constraints. Can. J. Earth Sci. 2001, 38, 767–785. [Google Scholar] [CrossRef]
- Ootes, L.; Davis, W.J.; Jackson, V.A.; van Breemen, O. Chronostratigraphy of the Hottah terrane and Great Bear magmatic zone of Wopmay Orogen, Canada, and exploration of a terrane translation model. Can. J. Earth Sci. 2015, 52, 1062–1092. [Google Scholar] [CrossRef]
- Ootes, L.; Snyder, D.; Davis, W.J.; Acosta-Góngora, P.; Corriveau, L.; Mumin, A.H.; Montreuil, J.F.; Gleeson, S.A.; Samson, I.A.; Jackson, V.A. A Paleoproterozoic Andean-type iron oxide copper-gold environment, the Great Bear magmatic zone, Northwest Canada. Ore Geol. Rev. 2017, 81, 123–139. [Google Scholar] [CrossRef]
- Montreuil, J.F.; Corriveau, L.; Davis, W.J. Tectonomagmatic Evolution of the Southern Great Bear Magmatic Zone (Northwest Territories, Canada): Implications for the Genesis of Iron Oxide-Alkali–Altered Hydrothermal Systems. Econ. Geol. 2016, 111, 2111–2138. [Google Scholar] [CrossRef]
- Mumin, A.H.; Somarin, A.K.; Jones, B.; Corriveau, L.; Ootes, L.; Camier, J. The IOCG-porphyry-epithermal continuum in the Great Bear Magmatic Zone, Northwest Territories, Canada. In Exploring for Iron Oxide Copper-Gold Deposits: Canada and Global Analogue; Corriveau, L., Mumin, A.H., Eds.; Short Course Notes; Geological Association of Canada: Toronto, ON, Canada, 2010; Volume 20, pp. 59–78. [Google Scholar]
- Montreuil, J.F.; Corriveau, L.; Potter, E.G. Formation of albitite-hosted uranium within IOCG systems: The Southern Breccia, Great Bear magmatic zone, Northwest Territories, Canada. Miner. Depos. 2015, 50, 293–325. [Google Scholar] [CrossRef]
- Corriveau, L.; Montreuil, J.F.; Potter, E.G. Alteration facies linkages among IOCG, IOA and affiliated deposits in the Great Bear magmatic zone, Canada. In Proterozoic Iron Oxide-Apatite (±REE) and Iron Oxide-Copper-Gold and Affiliated Deposits of Southeast Missouri, USA, and the Great Bear Magmatic Zone, Northwest Territories, Canada; Slack, J., Corriveau, L., Hitzman, M., Eds.; Economic Geology: Littleton, CO, USA, 2016; Volume 111, pp. 2045–2072. [Google Scholar]
- Corriveau, L.; Montreuil, J.F.; Potter, E.G.; Blein, O.; De Toni, A.F. Mineral systems with IOCG and affiliated deposits: Part 3—Metal pathways and ore deposit model. In Mineral Systems with Iron Oxide Copper-Gold (IOCG) and Affiliated Deposits; Corriveau, L., Potter, E.G., Mumin, A.H., Eds.; Special Paper; Geological Association of Canada: Toronto, ON, Canada, 2022; Volume 52, pp. 205–245. [Google Scholar]
- Mumin, A.H.; Corriveau, L.; Somarin, A.K.; Ootes, L. IOCG-type polymetallic mineralization in the Contact Lake Belt, Great Bear Magmatic Zone, Northwest Territories. Expl. Min. Geol. 2007, 16, 187–208. [Google Scholar] [CrossRef]
- Corriveau, L.; Williams, P.J.; Mumin, A.H. Alteration vectors to IOCG mineralization: From uncharted terranes to deposits. In Exploring for Iron Oxide Copper-Gold Deposits: Canada and Global Analogues; Corriveau, L., Mumin, A.H., Eds.; Short Course Notes; Geological Association of Canada: Toronto, ON, Canada, 2010; Volume 20, pp. 89–110. [Google Scholar]
- Corriveau, L.; Montreuil, J.F.; De Toni, A.F.; Potter, E.G.; Percival, J.B. Mapping mineral systems with IOCG and affiliated deposits: A facies approach. In Mineral Systems with Iron Oxide Copper-Gold (IOCG) and Affiliated Deposits; Corriveau, L., Potter, E.G., Mumin, A.H., Eds.; Special Paper; Geological Association of Canada: Toronto, ON, Canada, 2022; Volume 52, pp. 69–111. [Google Scholar]
- Gandhi, S.S.; Potter, E.G.; Fayek, M. New constraints on genesis of the polymetallic veins at Port Radium, Great Bear Lake, Northwest Canadian Shield. Ore Geol. Rev. 2018, 96, 28–47. [Google Scholar] [CrossRef]
- Badham, J.P.N. Mineralogy, paragenesis and origin of the Ag–Ni, Co arsenide mineralization, Camsell River, N.W.T., Canada. Miner. Depos. 1975, 10, 153–175. [Google Scholar] [CrossRef]
- Hoffman, P.F. Wopmay orogen: A Wilson cycle of early Proterozoic age in the northwest of the Canadian Shield. In The Continental Crust and Its Mineral Deposits; Strangway, D.W., Ed.; Special Paper; Geological Association of Canada: Toronto, ON, Canada, 1980; Volume 20, pp. 523–549. [Google Scholar]
- Hildebrand, R.S. Early Proterozoic LaBine Group of Wopmay orogen: Remnant of a continental volcanic arc developed during oblique convergence. In Proterozoic Basins in Canada; Campbell, F.H.A., Ed.; Geological Survey of Canada Paper; Geological Survey of Canada: Ottawa, ON, Canada, 1981; Volume 81, pp. 133–156. [Google Scholar]
- Hildebrand, R.S. Geology of the Echo Bay-MacAlpine Channel Area, District of Mackenzie. Geological Survey of Canada, Map 1546A, 1983, Scale 1:50,000. Available online: https://www.researchgate.net/profile/Robert-Hildebrand-2/publication/269633529_Geology_Calder_River_map_area/links/549087a60cf214269f26b017/Geology-Calder-River-map-area.pdf (accessed on 1 November 2023).
- Hildebrand, R.S. Kiruna-type deposits: Their origin and relationship to intermediate subvolcanic plutons in the Great Bear Magmatic Zone, northwest Canada. Econ. Geol. 1986, 81, 640–659. [Google Scholar] [CrossRef]
- Corriveau, L.; Montreuil, J.F.; Blein, O.; Ehrig, K.; Potter, E.G.; Fabris, A.; Clark, J. Mineral systems with IOCG and affiliated deposits: Part 2—Geochemical footprints. In Mineral Systems with Iron Oxide Copper-Gold (IOCG) and Affiliated Deposits; Corriveau, L., Potter, E.G., Mumin, A.H., Eds.; Special Paper; Geological Association of Canada: Toronto, ON, Canada, 2022; Volume 52, pp. 159–204. [Google Scholar]
- Corriveau, L.; Montreuil, J.F.; Potter, E.G.; Ehrig, K.; Clark, J.; Mumin, A.H.; Williams, P.J. Mineral systems with IOCG and affiliated deposits: Part 1–metasomatic footprints of alteration facies. In Mineral Systems with Iron Oxide Copper-Gold (IOCG) and Affiliated Deposits; Corriveau, L., Potter, E.G., Mumin, A.H., Eds.; Special Paper; Geological Association of Canada: Toronto, ON, Canada, 2022; Volume 52, pp. 113–158. [Google Scholar]
- Montreuil, J.F.; Corriveau, L.; Potter, E.G.; De Toni, A.F. On the relation between alteration facies and metal endowment of iron oxide–alkali-altered systems, southern Great Bear magmatic zone (Canada). In Proterozoic Iron Oxide-Apatite (±REE) and Iron Oxide-Copper-Gold and Affiliated Deposits of Southeast Missouri, USA, and the Great Bear Magmatic Zone, Northwest Territories, Canada; Slack, J., Corriveau, L., Hitzman, M., Eds.; Economic Geology: Littleton, CO, USA, 2016; Volume 111, pp. 2139–2168. [Google Scholar]
- Potter, E.G.; Montreuil, J.F.; Corriveau, L.; Davis, W. The Southern Breccia metasomatic uranium system of the Great Bear magmatic zone, Canada: Iron oxide-copper-gold (IOCG) and albitite-hosted uranium linkages. Geophys. Mono 2019, 242, 109–130. [Google Scholar]
- Potter, E.G.; Acosta-Góngora, P.; Corriveau, L.; Montreuil, J.F.; Yang, Z. Uranium enrichment processes in iron oxide and alkali-calcic alteration systems as revealed by uraninite trace element chemistry. In Mineral Systems with Iron Oxide Copper-Gold (IOCG) and Affiliated Deposits; Corriveau, L., Potter, E.G., Mumin, A.H., Eds.; Special Paper; Geological Association of Canada: Toronto, ON, Canada, 2022; Volume 52, pp. 325–345. [Google Scholar]
- Somarin, A.K.; Mumin, A.H. P-T-composition and evolution of paleofluids in the Precambrian Mag Hill volcano-plutonic system, Northwest Territories, Canada. Miner. Depos. 2014, 49, 199–215. [Google Scholar] [CrossRef]
- Kissin, S.A. Five-element (Ni-Co-As-Ag-Bi) Veins. J. Geol. Assoc. Can. 1992, 19, 113–124. [Google Scholar]
- Cathro, R.J. Uranium production from East Germany, Czeckoslovakia, and Eldorado, Northwest Territories, after 1945. Can. Inst. Min. Metal. 2005, 98, 67–69. [Google Scholar]
- Kidd, D.F.; Haycock, M.H. Mineragraphy of the ores of Great Bear Lake. Bull. Geol. Soci. Am. 1935, 46, 879–960. [Google Scholar] [CrossRef]
- Hayward, N. 3D magnetic inversion of mineral prospects in the Great Bear magmatic zone, NT, Canada. Geol. Surv. Can. Open File 2013, 7421. [Google Scholar] [CrossRef]
- Hayward, N.; Tschirhart, V. A comparison of 3-D inversion strategies in the investigation of the 3-D density and magnetic susceptibility distribution in the Great Bear Magmatic Zone, Northwest Territories. Geol. Surv. Can. Open File 2023, 8985. [Google Scholar] [CrossRef]
- Mumin, A.H.; Phillips, A.; Katsuragi, C.J.; Mumin, A.; Ivanov, G. Geotectonic interpretation of the Echo Bay stratovolcano complex, northern Great Bear magmatic zone, NWT, Canada. NWT Geosci. Off. Open File 2014, 2014–04, 44. [Google Scholar]
- Bailey, M. Ore Mineralogy and Uraninite Trace Element Chemistry of Hydrothermal Polymetallic U-Ag-(Co-Ni-As-Bi-Sb-Cu) Vein Deposits, Eldorado Mine, Port Radium, NWT. Unpublished Bachelor’s Thesis, Saint Mary’s University, Halifax, NS, Canada, 2017. [Google Scholar]
- Somarin, A.K.; Mumin, A.H.; Zhou, L.; Chen, W.; Baig, A. Geochemistry of ore minerals and evolution of the Port Radium IOCG hydrothermal system, Great Bear Magmatic Zone, NWT, Canada. In Proceedings of the 2022 Goldschmidt Conference, Goldschmidt, HI, USA, 10–15 July 2022. [Google Scholar]
- Whitney, D.A.; Bernard, W.; Evans, B.W. Abbreviations for names of rock-forming minerals. Am. Mineral. 2010, 95, 185–187. [Google Scholar] [CrossRef]
- Hem, S.R.; Makovicky, E.; Gervilla, F. Compositional trends in Fe, Co and Ni sulfarsenides and their crystal-chemical implications: Results from the Arroyo de la Cueva deposits, Ronda peridotite, Southern Spain. Can. Mineral. 2001, 39, 831–853. [Google Scholar] [CrossRef]
- Alexandre, P.; Kyser, K.; Layton-Matthews, D.; Brian, J. Chemical compositions of natural uraninite. Can. Mineral. 2016, 53, 595–622. [Google Scholar] [CrossRef]
- Somarin, A.K.; Mumin, A.H. The Paleo-Proterozoic high heat production Richardson Granite, Great Bear Magmatic Zone, Northwest Territories, Canada: Source of U for Port Radium? Res. Geol. 2012, 62, 227–242. [Google Scholar] [CrossRef]
- Trottier, C.R.M. Fluid Inclusion, Stable and Radiogenic Isotope, and Geochronological Investigation of the Polymetallic “Five-Element” Vein Deposit at the Eldorado Mine, Port Radium, Northwest Territories, Canada. Unpublished Master’s Thesis, Saint Mary’s University, Halifax, NS, Canada, 2019. [Google Scholar]
- Hofstra, A.; Lisitsin, V.; Corriveau, L.; Paradis, S.; Peter, J.; Lauzière, K.; Lawley, C.; Gadd, M.; Pilote, J.; Honsberger, I.; et al. Deposit Classification Scheme for the Critical Minerals Mapping Initiative Global Geochemical Database; U.S. Geological Survey Open-File Report; U.S. Geological Survey: Reston, VA, USA, 2021; pp. 1–43. [CrossRef]
- Williams, P.J.; Barton, M.D.; Fontboté, L.; de Haller, A.; Johnson, D.A.; Mark, G.; Marschik, R.; Oliver, N.H.S. Iron-oxide-copper-gold deposits: Geology, space-time distribution, and possible modes of origin. Econ. Geol. 2005, 100, 371–406. [Google Scholar]
- Skirrow, R.G. Iron oxide copper-gold (IOCG) deposits—A review (part 1): Settings, mineralogy, ore geochemistry and classification. Ore Geol. Rev. 2022, 140, 104569. [Google Scholar] [CrossRef]
- Somarin, A.K.; Mumin, A.H. Geochemistry and possible source of metals and alkalies for the Port Radium IOCG style hydrothermal system, Great Bear Magmatic Zone, Northwest Territories, Canada. In Proceedings of the Geological Association of Canada and Mineralogical Association of Canada Annual Meeting, Quebec City, QC, Canada, 19–23 May 2008. [Google Scholar]
- Klapheke, M. Comparison of the K2 IOCG-Type Deposit, Great Bear Magmatic Zone, NWT, with the Carmax Cu-Mo porphyry Deposit, BC’. Unpublished Master’s Thesis, Brandon University, Brandon, MB, Canada, 2019. [Google Scholar]


| Pyrite FeS2 | Marcasite FeS2 | Chalcopyrite CuFeS2 | ||||||||||
|---|---|---|---|---|---|---|---|---|---|---|---|---|
| Sample | 114A-PR-1-1 | 114A-PR-1-2 | 114A-PR-1-7 | 114A-PR-0-2 | 127 PR-1-16 | 127 PR-2-13 | 127 PR-2-15 | 127C PR-1-11 | 126-PR-1-2 | 126-PR-2-6 | 127C-PR-3-10 | 183C-PR-1-28 |
| S | 52.68 | 52.38 | 53.00 | 51.91 | 52.42 | 52.68 | 52.49 | 53.51 | 32.64 | 32.19 | 36.10 | 35.08 |
| Fe | 45.66 | 47.38 | 47.12 | 46.62 | 42.63 | 45.82 | 42.89 | 41.14 | 31.93 | 32.43 | 31.04 | 29.78 |
| Co | 0.28 | 0.34 | <0.20 | 0.48 | 0.50 | <0.20 | <0.20 | <0.20 | <0.20 | 0.30 | <0.20 | 0.36 |
| Ni | 2.09 | <0.20 | 0.87 | <0.20 | 4.45 | 1.77 | 4.44 | 5.02 | <0.20 | <0.20 | <0.20 | <0.20 |
| Cu | <0.20 | <0.20 | <0.20 | <0.20 | <0.20 | <0.20 | <0.20 | <0.20 | 35.70 | 35.33 | 33.54 | 34.13 |
| Sb | <0.25 | <0.25 | <0.25 | <0.25 | <0.25 | <0.25 | <0.25 | <0.25 | <0.25 | <0.25 | <0.25 | 0.39 |
| Total | 100.70 | 100.10 | 100.99 | 99.02 | 100.01 | 100.27 | 99.82 | 99.67 | 100.27 | 100.24 | 100.68 | 99.74 |
| Number of ions based on 3 atoms | Number of ions based on 4 atoms | |||||||||||
| S | 1.971 | 1.970 | 1.974 | 1.973 | 1.976 | 1.977 | 1.980 | 2.010 | 1.893 | 1.872 | 2.038 | 2.013 |
| Fe | 0.981 | 1.023 | 1.008 | 1.017 | 0.922 | 0.987 | 0.929 | 0.887 | 1.063 | 1.083 | 1.006 | 0.981 |
| Co | 0.006 | 0.007 | 0.000 | 0.010 | 0.010 | 0.000 | 0.000 | 0.000 | 0.000 | 0.009 | 0.000 | 0.011 |
| Ni | 0.043 | 0.000 | 0.018 | 0.000 | 0.092 | 0.036 | 0.091 | 0.103 | 0.000 | 0.000 | 0.000 | 0.000 |
| Cu | 0.000 | 0.000 | 0.000 | 0.000 | 0.000 | 0.000 | 0.000 | 0.000 | 1.044 | 1.036 | 0.956 | 0.988 |
| Sb | 0.000 | 0.000 | 0.000 | 0.000 | 0.000 | 0.000 | 0.000 | 0.000 | 0.000 | 0.000 | 0.000 | 0.006 |
| Arsenopyrite FeAsS | Sphalerite ZnS | Galena PbS | ||||||||||||
|---|---|---|---|---|---|---|---|---|---|---|---|---|---|---|
| Sample | 183A-PR-9 | 183A-PR-25 | 183A-PR-26 | 120 PR-2-17 | Sample | 127C-PR-1-3 | 127C-PR-1-10 | 127C-PR-4-5 | 127C-PR-4-7 | Sample | 114A-PR-1-13 | 114A-PR-1-14 | 127C-PR-3-3 | 182B PR-1-2 |
| As | 46.71 | 43.74 | 46.10 | 45.61 | S | 34.39 | 33.36 | 33.06 | 33.11 | S | 13.59 | 13.78 | 12.85 | 13.56 |
| S | 18.42 | 19.99 | 18.62 | 19.84 | Fe | 2.42 | 2.89 | 1.46 | 0.73 | Fe | 1.22 | 1.12 | 0.00 | 0.00 |
| Fe | 33.90 | 34.68 | 34.79 | 32.73 | Ni | <0.20 | <0.20 | <0.20 | <0.20 | Cu | <0.20 | <0.20 | <0.20 | 0.47 |
| Co | <0.20 | <0.20 | <0.20 | 2.23 | Cu | 1.68 | 1.87 | <0.20 | <0.20 | Zn | <0.20 | <0.20 | <0.20 | 0.41 |
| Ni | <0.20 | <0.20 | 0.28 | <0.20 | Zn | 62.57 | 62.54 | 65.14 | 64.79 | Ag | <0.35 | <0.35 | <0.35 | 0.64 |
| Cu | 0.50 | 0.41 | 0.63 | <0.20 | Total | 101.06 | 100.66 | 99.66 | 98.63 | Te | <0.35 | <0.35 | 0.41 | <0.35 |
| Sb | <0.25 | <0.25 | <0.25 | 0.61 | Pb | 85.23 | 85.16 | 86.71 | 84.97 | |||||
| Total | 99.53 | 98.82 | 100.43 | 101.01 | Total | 100.04 | 100.06 | 99.97 | 100.05 | |||||
| Number of ions based on 3 atoms | Number of ions based on 2 atoms | Number of ions based on 2 atoms | ||||||||||||
| As | 1.032 | 0.955 | 1.007 | 0.984 | S | 1.022 | 1.001 | 1.004 | 1.014 | S | 0.989 | 0.998 | 0.975 | 0.992 |
| S | 0.951 | 1.019 | 0.950 | 1.000 | Fe | 0.041 | 0.050 | 0.025 | 0.013 | Fe | 0.051 | 0.047 | 0.000 | 0.000 |
| Fe | 1.005 | 1.015 | 1.019 | 0.947 | Ni | 0.000 | 0.000 | 0.000 | 0.000 | Cu | 0.000 | 0.000 | 0.000 | 0.017 |
| Co | 0.000 | 0.000 | 0.000 | 0.061 | Cu | 0.025 | 0.028 | 0.000 | 0.000 | Zn | 0.000 | 0.000 | 0.000 | 0.015 |
| Ni | 0.000 | 0.000 | 0.008 | 0.000 | Zn | 0.912 | 0.921 | 0.970 | 0.973 | Ag | 0.000 | 0.000 | 0.000 | 0.014 |
| Cu | 0.013 | 0.011 | 0.016 | 0.000 | Te | 0.000 | 0.000 | 0.008 | 0.000 | |||||
| Sb | 0.000 | 0.000 | 0.000 | 0.008 | Pb | 0.960 | 0.955 | 1.018 | 0.962 | |||||
| Tetrahedrite (Cu,Fe,Ag,Zn)12(Sb,Bi,As)4S13 | Emplectite CuBiS2 | Aikinite PbCuBiS3 | ||||||||||||
|---|---|---|---|---|---|---|---|---|---|---|---|---|---|---|
| Sample | 183A-PR-16 | 183C-PR-1-22 | 183C-PR-1-23 | 183A-PR-28 | Sample | 183C-PR-1-18 | 183C-PR-1-19 | 183C-PR-1-25 | 183C-PR-3-14 | Sample | 183C-PR-1-17 | 183C-PR-3-10 | 183C-PR-3-11 | 183C-PR-4-11 |
| S | 24.10 | 25.07 | 24.99 | 23.83 | S | 18.66 | 19.52 | 18.97 | 18.53 | S | 16.94 | 16.85 | 17.42 | 16.90 |
| Fe | 3.41 | 1.38 | 1.69 | 3.40 | Co | <0.20 | <0.20 | 0.23 | <0.20 | Co | <0.20 | <0.20 | <0.20 | 0.31 |
| Cu | 32.53 | 37.76 | 38.17 | 32.42 | Ni | <0.20 | 0.35 | <0.20 | <0.20 | Cu | 11.22 | 10.91 | 11.49 | 11.48 |
| Zn | 4.39 | 6.32 | 5.66 | 4.48 | Cu | 18.90 | 19.40 | 19.90 | 18.63 | As | <0.25 | <0.25 | 0.40 | <0.25 |
| As | 1.05 | 3.76 | 6.61 | <0.20 | As | <0.25 | <0.25 | <0.25 | 0.42 | Pb | 35.93 | 34.40 | 34.18 | 35.59 |
| Ag | 6.98 | 0.52 | 0.44 | 6.55 | Sb | 0.56 | 0.72 | 0.44 | <0.25 | Bi | 36.65 | 37.56 | 37.10 | 35.38 |
| Sb | 26.43 | 21.23 | 16.69 | 28.12 | Bi | 60.51 | 60.60 | 60.51 | 60.87 | Total | 100.74 | 99.72 | 100.59 | 99.66 |
| Bi | <0.20 | 4.70 | 6.28 | <0.20 | Total | 98.63 | 100.59 | 100.06 | 98.45 | |||||
| Total | 98.90 | 100.73 | 100.54 | 98.79 | ||||||||||
| Number of ions based on 29 atoms | Number of ions based on 4 atoms | Number of ions based on 6 atoms | ||||||||||||
| S | 12.917 | 12.962 | 12.870 | 12.872 | S | 1.984 | 2.003 | 1.969 | 1.979 | S | 3.008 | 3.023 | 3.041 | 3.000 |
| Fe | 1.049 | 0.410 | 0.500 | 1.054 | Co | 0.000 | 0.000 | 0.013 | 0.000 | Co | 0.000 | 0.000 | 0.000 | 0.030 |
| Cu | 8.797 | 9.851 | 9.918 | 8.836 | Ni | 0.000 | 0.020 | 0.000 | 0.000 | Cu | 1.005 | 0.988 | 1.012 | 1.028 |
| Zn | 1.154 | 1.602 | 1.429 | 1.187 | Cu | 1.014 | 1.004 | 1.042 | 1.004 | As | 0.000 | 0.000 | 0.030 | 0.000 |
| As | 0.241 | 0.832 | 1.457 | 0.000 | As | 0.000 | 0.000 | 0.000 | 0.019 | Pb | 0.987 | 0.955 | 0.923 | 0.978 |
| Ag | 1.112 | 0.080 | 0.067 | 1.051 | Sb | 0.016 | 0.019 | 0.012 | 0.000 | Bi | 0.999 | 1.034 | 0.994 | 0.964 |
| Sb | 3.729 | 2.890 | 2.263 | 3.999 | Bi | 0.987 | 0.954 | 0.964 | 0.998 | |||||
| Bi | 0.000 | 0.373 | 0.496 | 0.000 | ||||||||||
| Stromeyerite AgCuS | Ag-Se-Te Phase | ||
|---|---|---|---|
| Fe0.19Cu0.49Ag3.31Se1.64S0.25Te0.13 | |||
| Sample | 126-PR-2-8 | Sample | 126-PR-2-7 |
| S | 24.01 | S | 1.45 |
| Fe | 1.02 | Fe | 1.95 |
| Cu | 45.10 | Cu | 5.65 |
| Ag | 30.23 | Ag | 65.14 |
| Total | 100.36 | Se | 23.65 |
| Te | 2.99 | ||
| Number of ions based on 3 atoms | Total | 100.83 | |
| Number of ions based on 6 atoms | |||
| S | 1.279 | S | 0.247 |
| Fe | 0.031 | Fe | 0.192 |
| Cu | 1.212 | Cu | 0.487 |
| Ag | 0.478 | Ag | 3.306 |
| Se | 1.640 | ||
| Te | 0.128 | ||
| Uraninite UO2 | Coffinite UO2.nH2O | Coffinite Replacing Uraninite | |||||||||
|---|---|---|---|---|---|---|---|---|---|---|---|
| Sample | 120 PR-2-1 | 120 PR-2-4 | 120 PR-4-2 | 120 PR-5-1 | 120 PR-2-9 | 120 PR-2-16 | 120 PR-2-10 | 120 PR-2-11 | 120 PR-2-7 | 120 PR-2-8 | 120 PR-2-6 |
| SiO2 | 1.07 | 0.5 | <0.20 | <0.20 | 11.05 | 15.29 | 17.17 | 13.96 | 6.51 | 14.30 | 5.01 |
| FeO | 0.71 | <0.20 | <0.20 | <0.20 | <0.20 | <0.20 | 0.48 | 0.32 | 0.31 | 0.36 | 0.52 |
| ZrO2 | 2.13 | 1.72 | <0.20 | <0.20 | 2.77 | 3.09 | 5.93 | 4.34 | 2.34 | 3.18 | 3.04 |
| PbO | 10.5 | 13.16 | 15.58 | 13 | 24.68 | 13.44 | 5.68 | 8.31 | 16.31 | 17.14 | 14.24 |
| UO2 | 85.51 | 84.71 | 84 | 86.27 | 47.86 | 54.32 | 71.46 | 73.67 | 74.55 | 58.71 | 72.73 |
| Total | 99.92 | 100.09 | 99.58 | 99.27 | 86.36 | 86.14 | 100.72 | 100.6 | 100.02 | 93.69 | 95.54 |
| Number of ions based on 2 O | Number of ions based on 4 O | ||||||||||
| Si | 0.050 | 0.020 | 0.030 | 0.040 | 0.840 | 1.040 | 0.960 | 0.860 | 0.500 | 0.920 | 0.400 |
| Fe | 0.030 | 0.000 | 0.000 | 0.000 | 0.000 | 0.000 | 0.020 | 0.020 | 0.020 | 0.020 | 0.040 |
| Zr | 0.050 | 0.040 | 0.000 | 0.000 | 0.100 | 0.100 | 0.160 | 0.120 | 0.080 | 0.100 | 0.120 |
| Pb | 0.120 | 0.160 | 0.210 | 0.160 | 0.500 | 0.060 | 0.080 | 0.140 | 0.340 | 0.300 | 0.300 |
| U | 0.830 | 0.860 | 0.870 | 0.880 | 0.800 | 0.820 | 0.840 | 0.940 | 1.220 | 0.840 | 1.300 |
| Siegenite (Ni,Co)3S4 | Nickeline NiAs | Rammelsbergite NiAs2 | Gersdorffite NiAsS | Cobaltoan Gersdorffite (NiCo)AsS | |||||||||||||
|---|---|---|---|---|---|---|---|---|---|---|---|---|---|---|---|---|---|
| Sample | 126-PR-1-5 | 126-PR-1-6 | 126-PR-2-1 | 126-PR-2-5 | 183B-PR-2-1 | 183B-PR-2-2 | 183B-PR-2-4 | 183B-PR-2-15 | 183B-PR-2-6 | 183C-PR-1-29 | 183B-PR-2-17 | 183B-PR-2-7 | 183B-PR-2-10 | 183B-PR-2-11 | 183B-PR-2-13 | 183B-PR-2-18 | 126-PR-3-3 |
| As | <0.25 | <0.25 | <0.25 | <0.25 | 55.65 | 55.36 | 55.26 | 55.61 | 71.35 | 69.83 | 69.83 | 70.1 | 47.56 | 47.6 | 49.45 | 46.92 | 42.88 |
| S | 39.58 | 39.05 | 38.98 | 42.68 | 0.65 | <0.20 | <0.20 | <0.20 | 0.69 | 1.31 | 0.89 | 0.91 | 17.49 | 17.5 | 16.57 | 18.28 | 19.74 |
| Fe | 2.19 | 2.23 | 1.67 | 1.56 | <0.20 | <0.20 | <0.20 | <0.20 | <0.20 | <0.20 | <0.20 | <0.20 | <0.20 | <0.20 | <0.20 | <0.20 | 2.58 |
| Co | 31.72 | 31.45 | 32.05 | 31.36 | 0.82 | 0.22 | <0.20 | <0.20 | 1.51 | 0.25 | 0.78 | 2.43 | 0.20 | 0.20 | 0.44 | 0.30 | 12.38 |
| Ni | 25.41 | 25.28 | 26.2 | 25.61 | 41.46 | 43.61 | 43.35 | 43.06 | 26.64 | 27.85 | 27.79 | 25.53 | 33.88 | 33.86 | 32.98 | 34.24 | 21.38 |
| Cu | 0.37 | 0.30 | <0.20 | <0.20 | <0.20 | <0.20 | <0.20 | <0.20 | <0.20 | <0.20 | <0.20 | <0.20 | <0.20 | <0.20 | <0.20 | <0.20 | 1.90 |
| Total | 99.28 | 98.31 | 98.89 | 101.21 | 98.58 | 99.19 | 98.61 | 98.67 | 100.19 | 99.24 | 99.29 | 98.97 | 99.13 | 99.16 | 99.44 | 99.74 | 100.86 |
| Number of ions based on 7 atoms | Number of ions based on 2 atoms | Number of ions based on 3 atoms | Number of ions based on 3 atoms | ||||||||||||||
| As | 0.000 | 0.000 | 0.000 | 0.000 | 1.001 | 0.995 | 0.999 | 1.006 | 1.966 | 1.926 | 1.933 | 1.949 | 1.081 | 1.082 | 1.134 | 1.053 | 0.934 |
| S | 3.839 | 3.828 | 3.806 | 4.003 | 0.027 | 0.000 | 0.000 | 0.000 | 0.044 | 0.084 | 0.058 | 0.059 | 0.929 | 0.930 | 0.888 | 0.958 | 1.005 |
| Fe | 0.122 | 0.126 | 0.094 | 0.084 | 0.000 | 0.000 | 0.000 | 0.000 | 0.000 | 0.000 | 0.000 | 0.000 | 0.000 | 0.000 | 0.000 | 0.000 | 0.075 |
| Co | 1.674 | 1.678 | 1.703 | 1.600 | 0.019 | 0.005 | 0.000 | 0.000 | 0.053 | 0.009 | 0.027 | 0.086 | 0.006 | 0.006 | 0.013 | 0.009 | 0.343 |
| Ni | 1.347 | 1.354 | 1.398 | 1.312 | 0.952 | 1.000 | 1.001 | 0.994 | 0.937 | 0.981 | 0.982 | 0.906 | 0.983 | 0.983 | 0.965 | 0.981 | 0.595 |
| Cu | 0.018 | 0.015 | 0.000 | 0.000 | 0.000 | 0.000 | 0.000 | 0.000 | 0.000 | 0.000 | 0.000 | 0.000 | 0.000 | 0.000 | 0.000 | 0.000 | 0.048 |
| Clinosafflorite CoAs2 | Safflorite (Co,Ni,Fe)As2 | |||||||
|---|---|---|---|---|---|---|---|---|
| Sample | 183B-PR-1-21 | 183B-PR-1-22 | 183B-PR-1-24 | 183B-PR-1-25 | 183C-PR-4-20 | 183C-PR-4-21 | 183C-PR-4-22 | 183C-PR-4-23 |
| As | 71.83 | 70.55 | 67.84 | 69.72 | 69.78 | 67.61 | 69.24 | 67.61 |
| S | 0.81 | 0.33 | 1.93 | 0.56 | 1.00 | 1.27 | 0.56 | 1.89 |
| Fe | 2.19 | 1.44 | 2.32 | 3.10 | 3.23 | 3.25 | 2.25 | 2.44 |
| Co | 25.57 | 25.53 | 26.28 | 24.21 | 22.13 | 20.59 | 20.61 | 20.52 |
| Ni | <0.20 | 0.25 | 0.26 | 1.20 | 3.52 | 4.50 | 6.14 | 5.75 |
| Cu | 0.36 | 0.30 | <0.20 | 0.48 | <0.20 | <0.20 | <0.20 | <0.20 |
| Sb | <0.25 | 0.52 | <0.25 | <0.25 | <0.25 | <0.25 | <0.25 | <0.25 |
| Au | <0.30 | <0.30 | <0.30 | <0.30 | <0.30 | 1.19 | <0.30 | <0.30 |
| Total | 100.76 | 98.94 | 98.62 | 99.26 | 99.69 | 98.40 | 98.80 | 98.21 |
| Number of ions based on 3 atoms | Number of ions based on 3 atoms | |||||||
| As | 1.966 | 1.984 | 1.864 | 1.936 | 1.919 | 1.890 | 1.930 | 1.865 |
| S | 0.052 | 0.022 | 0.124 | 0.036 | 0.064 | 0.083 | 0.036 | 0.122 |
| Fe | 0.080 | 0.054 | 0.085 | 0.115 | 0.120 | 0.122 | 0.084 | 0.090 |
| Co | 0.890 | 0.913 | 0.918 | 0.854 | 0.774 | 0.732 | 0.731 | 0.720 |
| Ni | 0.000 | 0.009 | 0.009 | 0.043 | 0.124 | 0.161 | 0.219 | 0.203 |
| Cu | 0.012 | 0.010 | 0.000 | 0.016 | 0.000 | 0.000 | 0.000 | 0.000 |
| Sb | 0.000 | 0.009 | 0.000 | 0.000 | 0.000 | 0.000 | 0.000 | 0.000 |
| Au | 0.000 | 0.000 | 0.000 | 0.000 | 0.000 | 0.013 | 0.000 | 0.000 |
| Skuterrudite (Co,Ni,Fe)As3-X | Cobaltite (Co,Ni,Fe)AsS | ||||||||
|---|---|---|---|---|---|---|---|---|---|
| Sample | 183C-PR-1-13 | 183C-PR-1-14 | 183C-PR-4-17 | 183C-PR-4-18 | 183C-PR-4-19 | 183C-PR-4-14 | 183C-PR-1-4 | 183C-PR-1-9 | 183C-PR-1-12 |
| As | 60.55 | 60.75 | 62.81 | 67.40 | 61.94 | 47.43 | 48.63 | 48.50 | 46.41 |
| S | 8.42 | 8.31 | 6.96 | 4.30 | 7.77 | 18.57 | 17.07 | 17.22 | 18.33 |
| Fe | 5.00 | 5.77 | 5.74 | 6.74 | 5.75 | 6.44 | 1.22 | 1.37 | 0.90 |
| Co | 26.39 | 26.37 | 24.59 | 21.88 | 24.68 | 27.76 | 26.72 | 27.13 | 25.09 |
| Ni | 0.28 | <0.20 | 0.34 | 0.35 | 0.25 | <0.20 | 6.17 | 5.85 | 8.94 |
| Cu | <0.20 | <0.20 | <0.20 | <0.20 | <0.20 | 0.36 | <0.20 | <0.20 | <0.20 |
| Sb | 0.29 | <0.25 | <0.25 | <0.25 | <0.25 | <0.25 | <0.25 | <0.25 | 0.38 |
| Total | 100.92 | 101.19 | 100.44 | 100.67 | 100.39 | 100.55 | 99.82 | 100.06 | 99.66 |
| Number of ions based on 4 atoms | Number of ions based on 4 atoms | ||||||||
| As | 2.002 | 2.001 | 2.121 | 2.349 | 2.073 | 1.404 | 1.474 | 1.464 | 1.386 |
| S | 0.650 | 0.640 | 0.549 | 0.351 | 0.608 | 1.284 | 1.209 | 1.214 | 1.279 |
| Fe | 0.222 | 0.255 | 0.260 | 0.315 | 0.258 | 0.256 | 0.050 | 0.055 | 0.036 |
| Co | 1.109 | 1.104 | 1.056 | 0.969 | 1.050 | 1.045 | 1.029 | 1.041 | 0.952 |
| Ni | 0.012 | 0.000 | 0.015 | 0.016 | 0.011 | 0.000 | 0.239 | 0.225 | 0.341 |
| Cu | 0.000 | 0.000 | 0.000 | 0.000 | 0.000 | 0.012 | 0.000 | 0.000 | 0.000 |
| Sb | 0.006 | 0.000 | 0.000 | 0.000 | 0.000 | 0.000 | 0.000 | 0.000 | 0.007 |
| Mineral X1 Co0.67Ni0.32Fe0.02S0.19As2.80 | ||||||||||
|---|---|---|---|---|---|---|---|---|---|---|
| Sample | 183C-PR-3-1 | 183C-PR-3-2 | 183C-PR-3-3 | 183C-PR-4-1 | 183C-PR-4-2 | 183C-PR-4-3 | 183C-PR-4-4 | 183C-PR-3-4 | 183C-PR-3-5 | 183C-PR-3-6 |
| As | 76.14 | 73.69 | 74.36 | 74.52 | 75.06 | 75.52 | 77.08 | 77.31 | 77.05 | 77.33 |
| S | 2.09 | 2.98 | 3.04 | 3.13 | 2.80 | 2.79 | 1.32 | 1.24 | 1.18 | 1.57 |
| Fe | 0.34 | 0.42 | 0.58 | 0.46 | 0.59 | 0.46 | 0.41 | 0.50 | 0.32 | 0.48 |
| Co | 14.47 | 15.67 | 16.62 | 17.50 | 15.98 | 15.00 | 11.94 | 11.92 | 11.74 | 12.38 |
| Ni | 6.53 | 5.92 | 5.24 | 4.30 | 4.61 | 5.63 | 8.59 | 8.70 | 8.75 | 8.43 |
| Sb | <0.25 | 0.35 | <0.25 | <0.25 | <0.25 | <0.25 | <0.25 | <0.25 | <0.25 | <0.25 |
| Totals | 99.57 | 99.04 | 99.84 | 99.90 | 99.04 | 99.40 | 99.34 | 99.68 | 99.04 | 100.19 |
| Number of ions based on 4 atoms | ||||||||||
| As | 2.814 | 2.706 | 2.703 | 2.705 | 2.765 | 2.774 | 2.885 | 2.886 | 2.898 | 2.860 |
| S | 0.181 | 0.256 | 0.258 | 0.265 | 0.241 | 0.239 | 0.116 | 0.109 | 0.104 | 0.136 |
| Fe | 0.017 | 0.021 | 0.028 | 0.023 | 0.029 | 0.023 | 0.020 | 0.025 | 0.016 | 0.024 |
| Co | 0.680 | 0.732 | 0.768 | 0.808 | 0.748 | 0.700 | 0.568 | 0.566 | 0.562 | 0.582 |
| Ni | 0.308 | 0.278 | 0.243 | 0.199 | 0.217 | 0.264 | 0.410 | 0.415 | 0.420 | 0.398 |
| Sb | 0.000 | 0.008 | 0.000 | 0.000 | 0.000 | 0.000 | 0.000 | 0.000 | 0.000 | 0.000 |
| As + S | 2.995 | 2.962 | 2.961 | 2.971 | 3.006 | 3.013 | 3.001 | 2.995 | 3.002 | 2.996 |
| Fe + Co + Ni + Sb | 1.005 | 1.038 | 1.039 | 1.029 | 0.994 | 0.987 | 0.999 | 1.005 | 0.998 | 1.004 |
| Mineral X2 Ni0.85Co0.15S0.39As1.60 | Mineral X3 Ni0.69Co0.31S0.47As1.52 | |||||||||
| Sample | 183C-PR-1-32 | 183C-PR-1-1 | 183C-PR-1-20 | 183C-PR-1-31 | 183C-PR-1-6 | 183C-PR-1-30 | 183C-PR-1-2 | 183C-PR-1-2A | 183C-PR-1-2B | |
| As | 61.47 | 62.25 | 62.51 | 61.69 | 63.51 | 59.10 | 61.16 | 61.23 | 59.57 | |
| S | 7.04 | 7.11 | 6.56 | 6.49 | 5.10 | 8.46 | 7.76 | 7.65 | 8.24 | |
| Fe | bdl | bdl | bdl | bdl | bdl | bdl | bdl | bdl | bdl | |
| Co | 4.19 | 4.55 | 4.36 | 5.04 | 5.17 | 10.49 | 9.41 | 9.30 | 10.15 | |
| Ni | 26.60 | 26.61 | 26.20 | 25.70 | 24.78 | 21.31 | 21.89 | 21.79 | 21.45 | |
| Sb | <0.25 | <0.25 | <0.25 | <0.25 | <0.25 | 0.33 | <0.25 | <0.25 | <0.25 | |
| Totals | 99.30 | 100.52 | 99.63 | 98.92 | 98.56 | 99.68 | 100.22 | 99.97 | 99.41 | |
| Number of ions based on 3 atoms | Number of ions based on 3 atoms | |||||||||
| As | 1.573 | 1.574 | 1.605 | 1.595 | 1.677 | 1.482 | 1.539 | 1.547 | 1.500 | |
| S | 0.421 | 0.420 | 0.394 | 0.392 | 0.315 | 0.496 | 0.456 | 0.452 | 0.485 | |
| Fe | 0.000 | 0.000 | 0.000 | 0.000 | 0.000 | 0.000 | 0.000 | 0.000 | 0.000 | |
| Co | 0.136 | 0.146 | 0.142 | 0.166 | 0.174 | 0.335 | 0.301 | 0.299 | 0.325 | |
| Ni | 0.869 | 0.859 | 0.859 | 0.848 | 0.835 | 0.682 | 0.703 | 0.703 | 0.690 | |
| Sb | 0.000 | 0.000 | 0.000 | 0.000 | 0.000 | 0.005 | 0.000 | 0.000 | 0.000 | |
| As + S | 1.995 | 1.995 | 1.999 | 1.986 | 1.991 | 1.978 | 1.996 | 1.999 | 1.985 | |
| Fe + Co + Ni + Sb | 1.005 | 1.005 | 1.001 | 1.014 | 1.009 | 1.022 | 1.004 | 1.001 | 1.015 | |
Disclaimer/Publisher’s Note: The statements, opinions and data contained in all publications are solely those of the individual author(s) and contributor(s) and not of MDPI and/or the editor(s). MDPI and/or the editor(s) disclaim responsibility for any injury to people or property resulting from any ideas, methods, instructions or products referred to in the content. |
© 2024 by the authors. Licensee MDPI, Basel, Switzerland. This article is an open access article distributed under the terms and conditions of the Creative Commons Attribution (CC BY) license (https://creativecommons.org/licenses/by/4.0/).
Share and Cite
Somarin, A.K.; Zhou, L.; Zheng, G.; Ma, X. Hydrothermal Mineralization and Mineral Chemistry of Arsenides and Sulfarsenides in the Fe-Co-Ni-As-S System and Introduction of Three Unique Minerals, Port Radium Deposit, Canada. Minerals 2024, 14, 85. https://doi.org/10.3390/min14010085
Somarin AK, Zhou L, Zheng G, Ma X. Hydrothermal Mineralization and Mineral Chemistry of Arsenides and Sulfarsenides in the Fe-Co-Ni-As-S System and Introduction of Three Unique Minerals, Port Radium Deposit, Canada. Minerals. 2024; 14(1):85. https://doi.org/10.3390/min14010085
Chicago/Turabian StyleSomarin, Alireza K., Li Zhou, Guodong Zheng, and Xiangxian Ma. 2024. "Hydrothermal Mineralization and Mineral Chemistry of Arsenides and Sulfarsenides in the Fe-Co-Ni-As-S System and Introduction of Three Unique Minerals, Port Radium Deposit, Canada" Minerals 14, no. 1: 85. https://doi.org/10.3390/min14010085
APA StyleSomarin, A. K., Zhou, L., Zheng, G., & Ma, X. (2024). Hydrothermal Mineralization and Mineral Chemistry of Arsenides and Sulfarsenides in the Fe-Co-Ni-As-S System and Introduction of Three Unique Minerals, Port Radium Deposit, Canada. Minerals, 14(1), 85. https://doi.org/10.3390/min14010085