Article

Pore Structure and Fractal Characteristics of the Middle and Upper Permian Dalong and Gufeng Shale Reservoirs, Western Hubei Province, South China

1
Hubei Geological Survey, Wuhan 430034, China
2
Key Laboratory of Tectonics and Petroleum Resources, Ministry of Education, China University of Geosciences, Wuhan 430074, China
3
Hubei Coal Geological Exploration Institute, Wuhan 430034, China
*
Authors to whom correspondence should be addressed.
Minerals 2024, 14(1), 10; https://doi.org/10.3390/min14010010
Submission received: 4 November 2023 / Revised: 7 December 2023 / Accepted: 16 December 2023 / Published: 20 December 2023

Abstract

:
The Middle and Upper Permian Dalong and Gufeng Formations in South China have recently been considered as potential gas-producing shales. However, their pore structure characteristics remain poorly understood. To investigate the pore structure and fractal characteristics of the pores in these two formations, a suite of shale samples from the Dalong and Gufeng Formations in the western Hubei Province, South China were analyzed by multiple techniques, namely, TOC content, X-ray diffraction (XRD) mineralogy analysis, optical microscopy observations, major elemental analysis, field emission-scanning electron microscopy (FE-SEM), and low-pressure gas adsorption measurements (N2 and CO2). The identified major shale lithofacies include siliceous mudstone, carbonaceous mudstone, argillaceous-siliceous mixed mudstone, and calcareous-siliceous mixed mudstone. SEM images show that the dominant pore types include the pores between brittle minerals, slit-shaped pores between clay sheets, and secondary organic matter (OM) pores within solid bitumen. The pore size distribution is dominated by micropores and mesopores (<30 nm), which are the major contributors to total pore volume and surface area for the Dalong and Gufeng Formations. Based on the Frenkel–Halsey–Hill (FHH) method, fractal dimensions (D1, D2) calculated from the nitrogen adsorption data have a range of from 2.489 to 2.772 (D1) and from 2.658 to 2.963 (D2), and are higher in the Gufeng Formation (average TOC = 8.3 wt.%) due to a higher TOC content comparing to the Dalong Formation (average TOC = 6.2 wt.%). The pore development and fractal characteristics are primarily controlled by organic matter (OM), carbonate minerals, and clay minerals for both the Dalong and Gufeng Formations. Shale samples with high TOC content, low carbonate content, and high clay content tend to develop more heterogeneous micropores and mesopores, which is ascribed to the generation of clay-related and OM-hosted pores, along with the destruction of primary pores by pore-filling carbonate cements.

1. Introduction

Over the past few decades, shale or mudstone has been exploited as hydrocarbon reservoirs within unconventional plays worldwide, primarily in North America, Europe, and China [1,2,3]. Shale gas exploration and development in China has achieved great success in several shale plays, such as the Lower Silurian Longmaxi Formation and the Lower Cambrian Qiongzhusi Formation in the Sichuan Basin [4]. Recently, the Permian shales in South China have attracted great attention as potential gas-producing shales, including the Dalong and Wujiaping Formations. It is well known that pore structure and porosity exert significant control on gas storage capacity and, ultimately, producibility in shale or mudstone reservoirs. Therefore, pore structure characterization is of great significance for the successful evaluation and exploitation of the Permian shale gas reservoirs.
The pore systems of shale reservoirs have been well documented by multiple analytical techniques in previous studies, including pore morphology, type, pore size distribution, and pore evolution pathways [5,6,7,8,9]. Shale pore types are predominantly mineral matrix pores, organic matter (OM) pores, and fracture pores [6]. In particular, organic matter pores were considered an extremely crucial part of shale pore systems, especially for high-maturity marine-facies shales [6,8,10]. Pore structures in shale or mudstone reservoirs are influenced by many factors, including fabric, texture, organic matter (OM) properties (OM content, macerals, and thermal maturity), bulk mineralogical composition, and diagenetic alterations [6,8,9,10]. The properties of the organic matter are recognized as one of the most important controls on pore systems in gas shale reservoirs. Secondary OM pores are generally observed within bitumen/pyrobitumen in shales with thermal maturities generally greater than Ro∼0.6%–0.7%, at the onset of peak oil generation stage [6,7,9,11]. The relationship between TOC content and organic porosity is relatively complex. High TOC samples generally display increasing OM–hosted pores at the lower end of the TOC range, whereas, the higher TOC content may not influence the total pore volume at a low level of maturity [7]. Furthermore, intergranular and intercrystalline pores can also be filled with solid bitumen, resulting in a weak or even negative correlation between TOC content and porosity. Organic porosity development is also influenced by OM type and macerals [12]. When transformed into hydrocarbons and bitumen with increased thermal maturity, the oil-prone kerogens (e.g., alginite and AOM) tend to develop secondary organic pores within solid bitumen more easily than hydrogen-poor kerogens (e.g., inertinite, zooclasts) [13,14] (In addition to OM properties, bulk mineralogy and rock fabric also exert a significant influence on porosity in shale reservoirs For example, the presence of rigid matrix framework minerals (e.g., the microcrystalline quartz aggregates) is considered to reduce the effective stress on OM particles, helping to preserve organic pores from compactional collapse [15,16]. Fractal geometry theory can be used to characterize special structures [17,18]. In recent years, it has been widely used in the shale pore structure field [19,20,21]. Researchers have used different models such as the Frenkel–Halsey–Hill (FHH) model, the Newton–Kantorovich (NK) model, and the Neimark model to conduct fractal studies on different shale pore structures [22,23]. The FHH fractal model is widely used in determining shale pore structure, as it can not only describe the fractal characteristics of macropores but also effectively evaluate that of mesopores and micropores [20,24].
The Middle and Upper Permian Dalong and Gufeng Formations have received much attention as potential gas-producing shales in South China. It was reported that the Upper Permian Dalong Formation is characterized by high TOC content (averaging = 7.0%), high brittle mineral content (averaging > 60%), moderate to high thermal maturities (averaging Ro > 1.8%), and high gas content in the western Hubei area and the northeast Sichuan Basin [25,26,27]. A few studies have documented the pore structure characteristics and main factors controlling pore development within the Permian shales in South China. However, these previous studies have mainly focused on the Upper Permian shales in the Lower Yangtze region. Although some attention has been paid to the pore characteristics of Perima shales in the Middle Yangtze area, the pore formation mechanism remains relatively poorly understood. By integrating geochemical data and petrophysical data for the Dalong and Gufeng Formations, the primary goals of this study are to (1) decipher the pore structure of different shale lithofacies, including pore morphology and pore size distribution; (2) understand the major controlling factors on pore development in the Permian Gufeng and Dalong Formations; and (3) investigate the fractal dimension of pores.

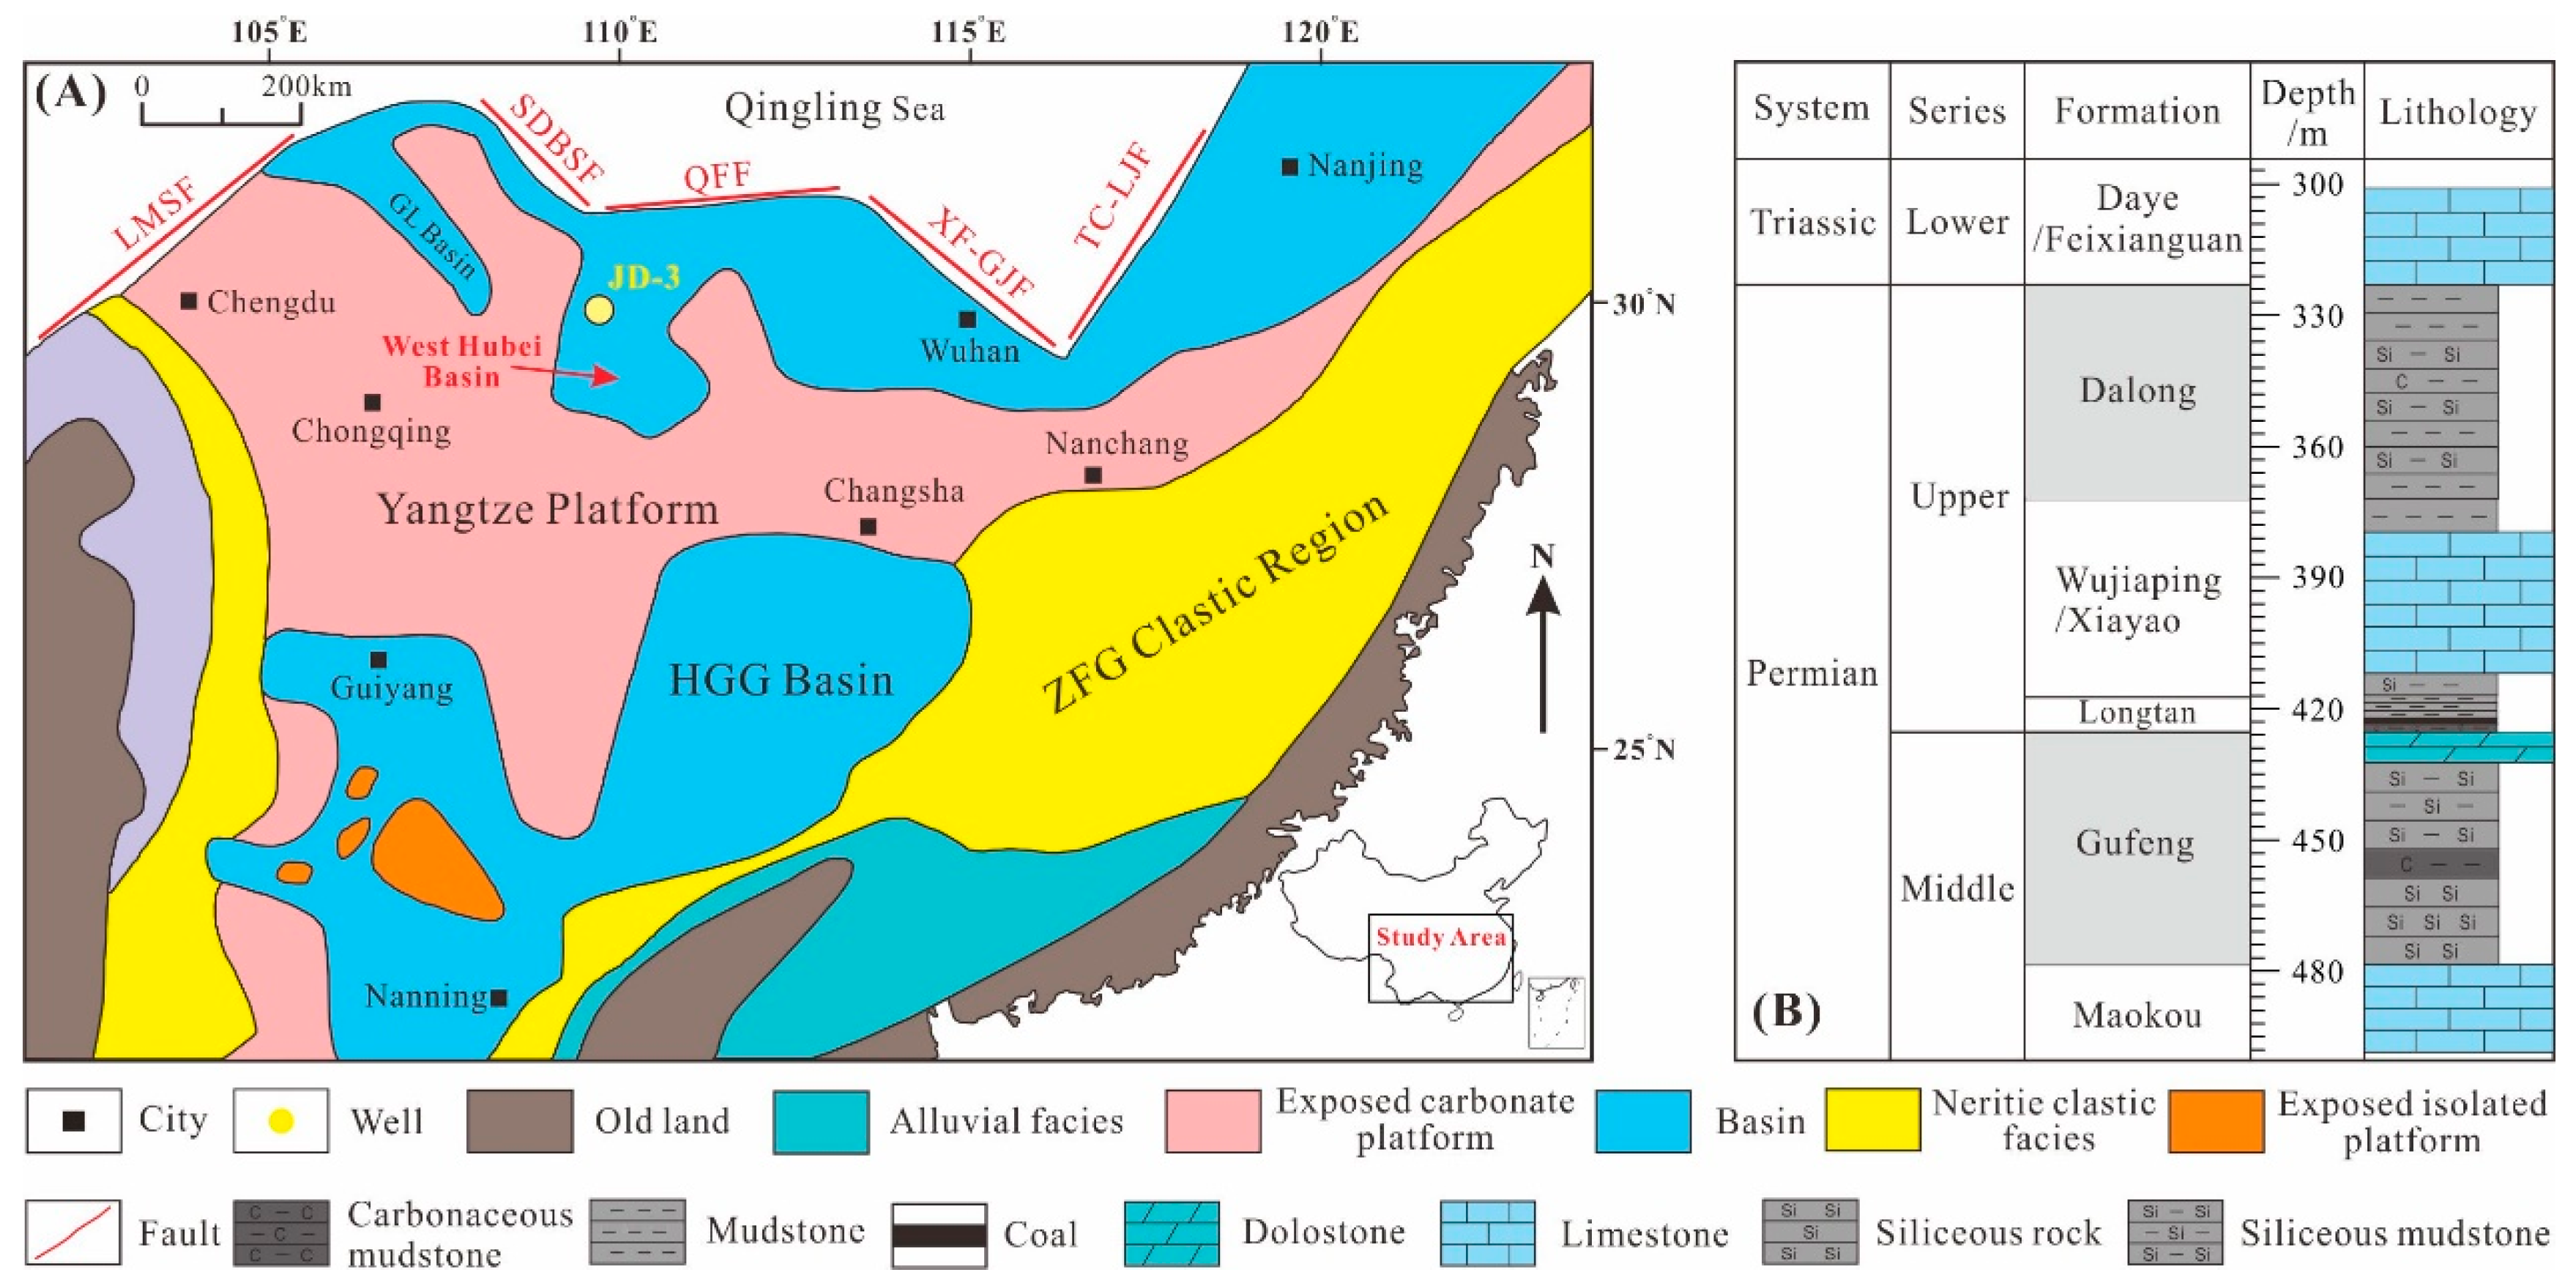
2. Geological Setting

The study area is located on the northwestern margin of the Middle Yangtze platform in South China (Figure 1A). During the late Middle Permian, tectonic uplift and the large-scale eruption of the Emeishan mantle plume occurred in the western Yangtze block [28,29]. Due to the tensile stress related to the tectonic uplift and Emeishan mantle plume, the northern Yangtze platform subsided and a series of basins were formed, including the Guanyuan–Liangping basin and the western Hubei basin [29]. The western Hubei basin was characterized by deep-water depositional facies and connected to the open sea northward through a narrow bay during the late Permian [30].
The Middle Permian successions in the western Hubei basin consist of the Maokou Formation and Gufeng Formation (Figure 1B). The Gufeng Formation is dominated by black siliceous mudstones, cherts, and calcareous mudstones with minor interbeds of limestones. The Gufeng Formation is usually underlain by carbonate platform facies of the Maokou Formation in South China. The Late Permian successions in the western Hubei Basin are dominated by the Longtan, Wujiaping, and Dalong Formations (Figure 1B). Overlying the limestone successions of the Wujiaping Formation, the Dalong Formation is composed of organic-rich black shales and cherts with interbeds of limestones in the western Hubei Basin. The occurrence of black shales and cherts in the Dalong Formations is ascribed to marine transgressions during the Changhsingian movement [31]. Previous studies suggest a high TOC content (average TOC > 5%), dominant type II kerogen, and high thermal maturity (Ro > 2%) for the Permian shales in south China [32,33].

3. Methodology

3.1. Samples

Forty-six core samples of the Dalong and Gufeng Formations were obtained from well JD-3, which is located in the western Hubei province (see well location in Figure 1). The samples from the JY-3 well have a depth range from 320 m to 480 m and consist of 19 samples from the Upper Permian Dalong Formation and 27 samples from the Middle Permian Gufeng Formation (Figure 2). Detailed core description, total organic carbon (TOC) contents measurements, and whole-rock elemental analyses were conducted on all 46 samples.

3.2. Analytical Methods

The TOC content of all 46 samples was determined using an Elementary Rapid CS elemental analyzer. After removing carbonate minerals, the sample powder residue was combusted to calculate organic carbon content.
The concentrations of major elements for all 46 samples were measured by X-ray fluorescence spectrometry (XRF). The powdered samples were first dried at 105 °C for 12 h and then heated at 1000 °C for 2 h to estimate the loss on ignition (LOI). The dried sample was treated with lithium tetraborate and subsequently analyzed using an XRF instrument to measure the concentrations of major elements.
A total of 15 representative samples from the Dalong Formation and 15 representative samples from the Gufeng Formation were selected for X-ray diffraction (XRD; X’Pert PRO MPD X-ray diffractometer) analysis to determine the bulk mineralogical compositions. Identification of minerals was performed by comparison with reference mineral patterns. The TOC content and XRD results are given as weight percentages.
A total of 30 polished thin sections were examined with a Zeiss microscope under transmitted light to identify the minerals, fossils, texture, and fabric features. Among these samples, 10 samples were selected to be polished by argon-ion milling technique, including five Dalong mudstones and five Gufeng mudstones. After being coated with conductive carbon, ion-milled samples were imaged by field-emission scanning electron microscopy (FE-SEM) under secondary electron (SE) and backscattered electron (BSE) modes. SE mode was used to image pores clearly, and BSE mode was applied to image organic matter and minerals. Energy dispersive spectroscopy (EDS) was used to identify mineral composition. SEM and EDS imaging were performed with an accelerating voltage of 5–10 kV and a working distance of approximately 8–10 mm.
Gas adsorption analysis, including nitrogen (N2) and carbon dioxide (CO2), was conducted on 30 samples using a Quantachrome Autosorb-iQ3 analyzer. Approximately 1~2 g of ground sample (60~80 mesh) was degassed at 80 °C for approximately 10 h prior to analysis. CO2 adsorption analysis was applied to examine the micropore size fraction (<2 nm) at a temperature of 273.1 K. N2 adsorption analysis was used to characterize mesopores (2–50 nm) and macropores (>50 nm) at a temperature of 77.4 K. The adsorption and desorption isotherms of CO2 and N2 were used to calculate pore structure parameters, including pore volume, specific surface area, and pore size distribution. The pore volumes and surface areas of micropores were determined by CO2 adsorption using the DFT method. The pore volumes of mesopores and macropores were calculated from the adsorption isotherm using the Barrett–Joyner–Halenda (BJH) model [34].

4. Results

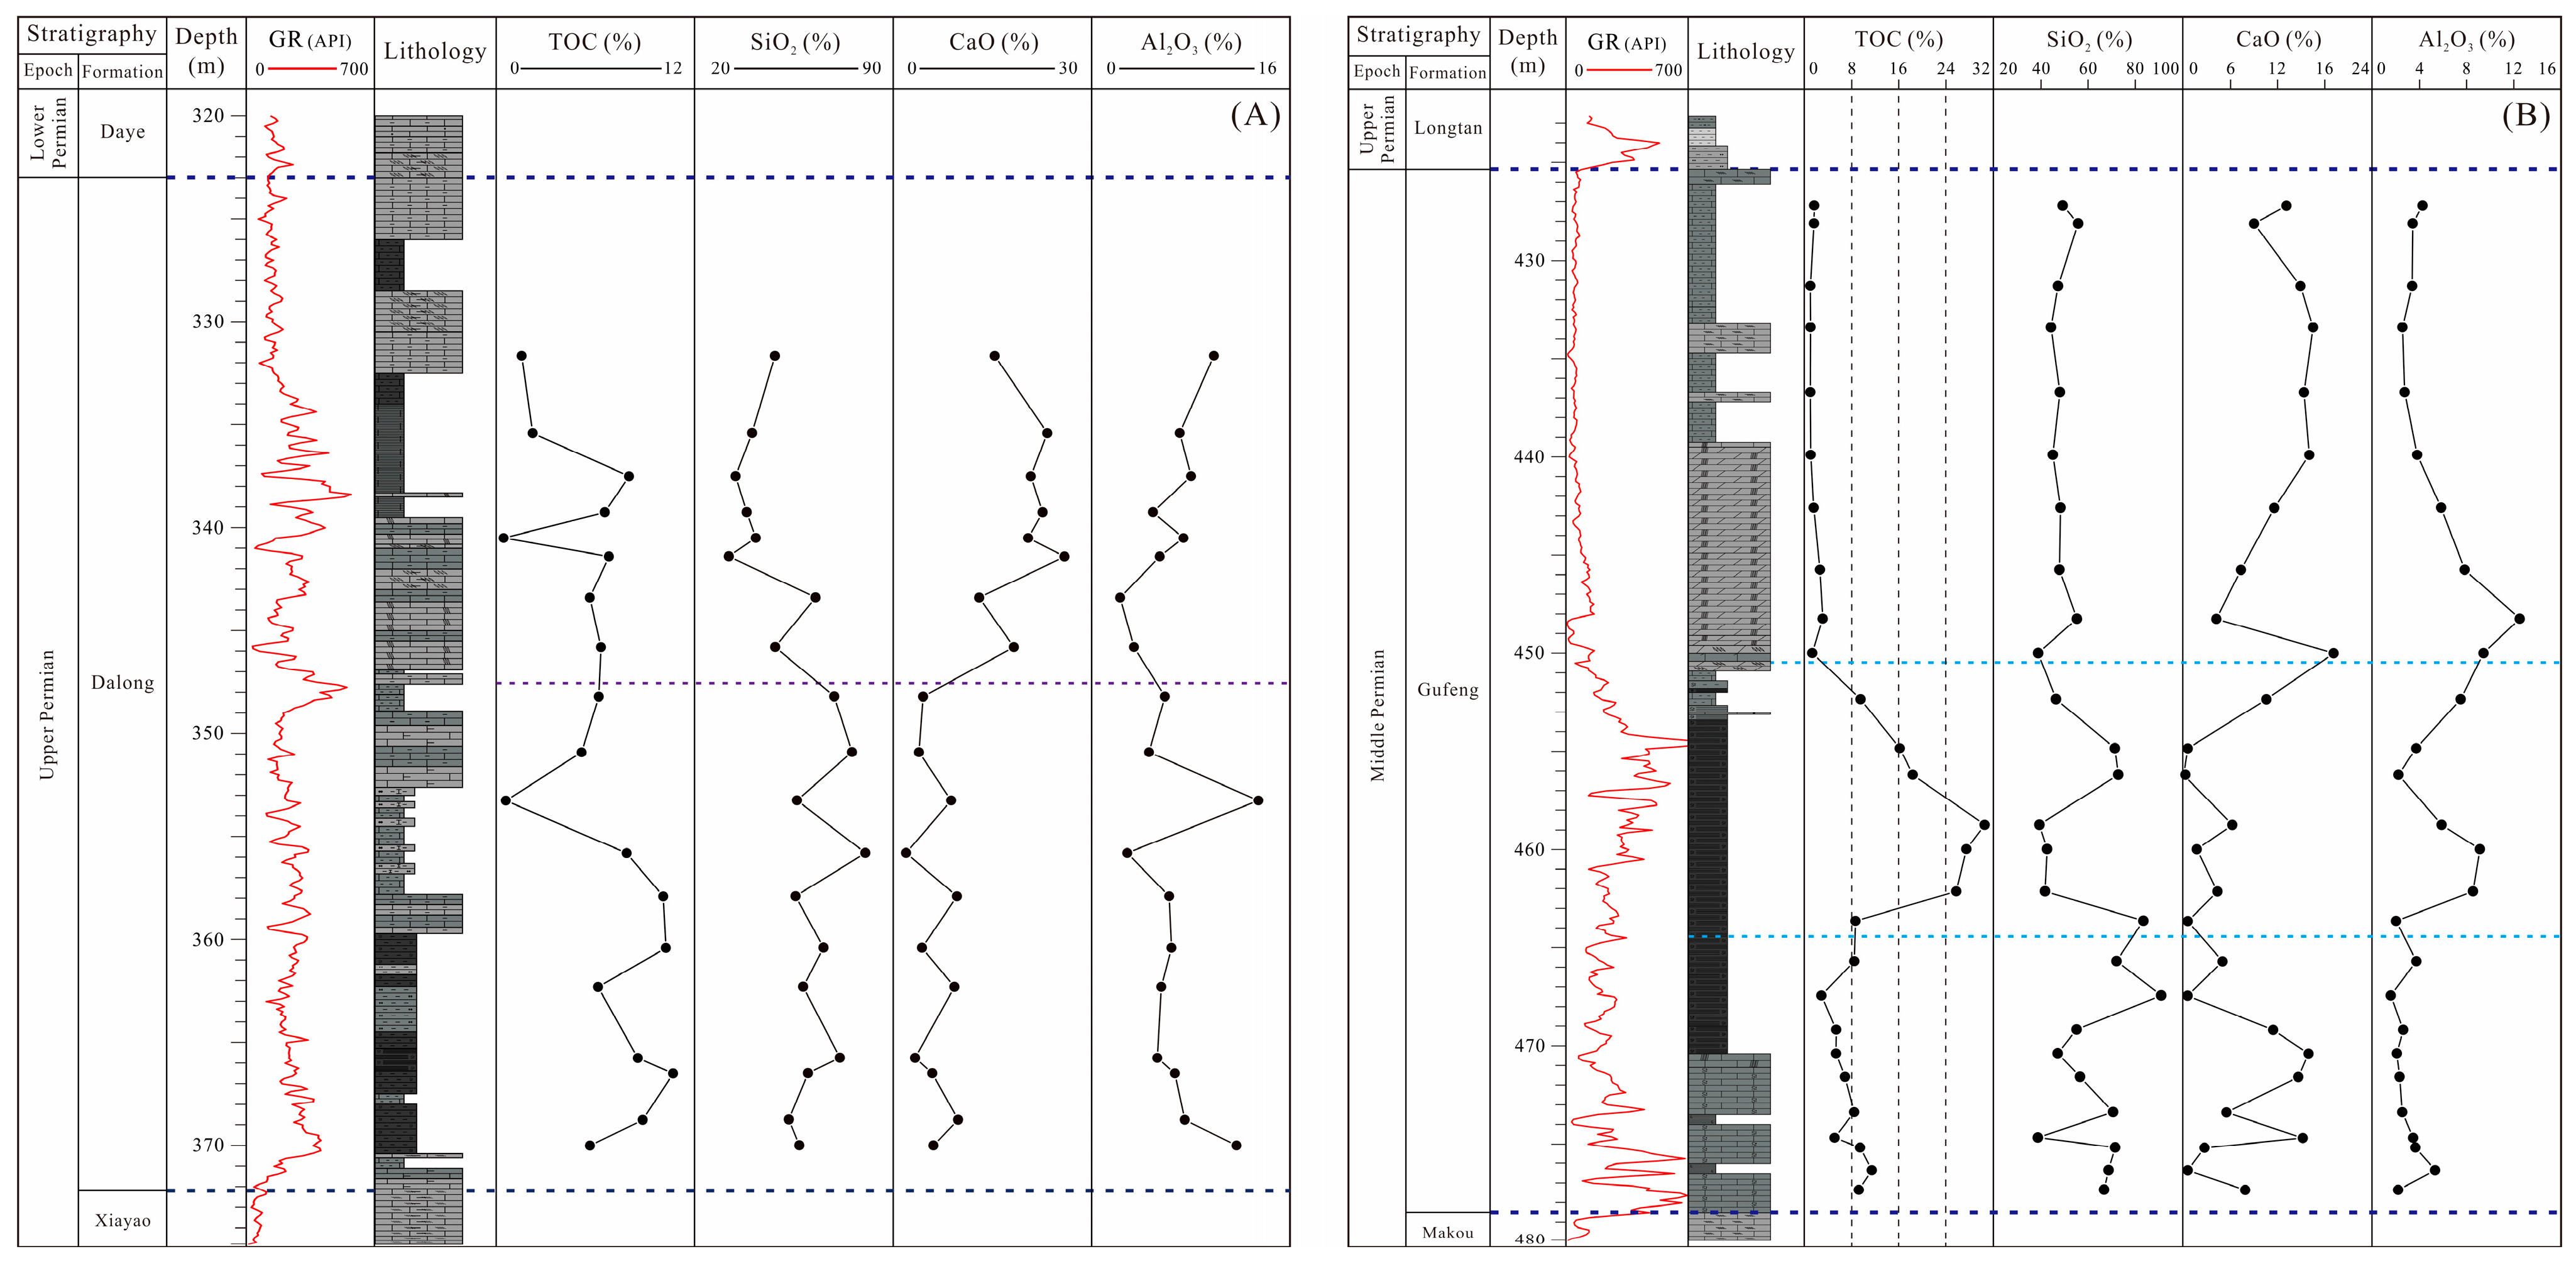
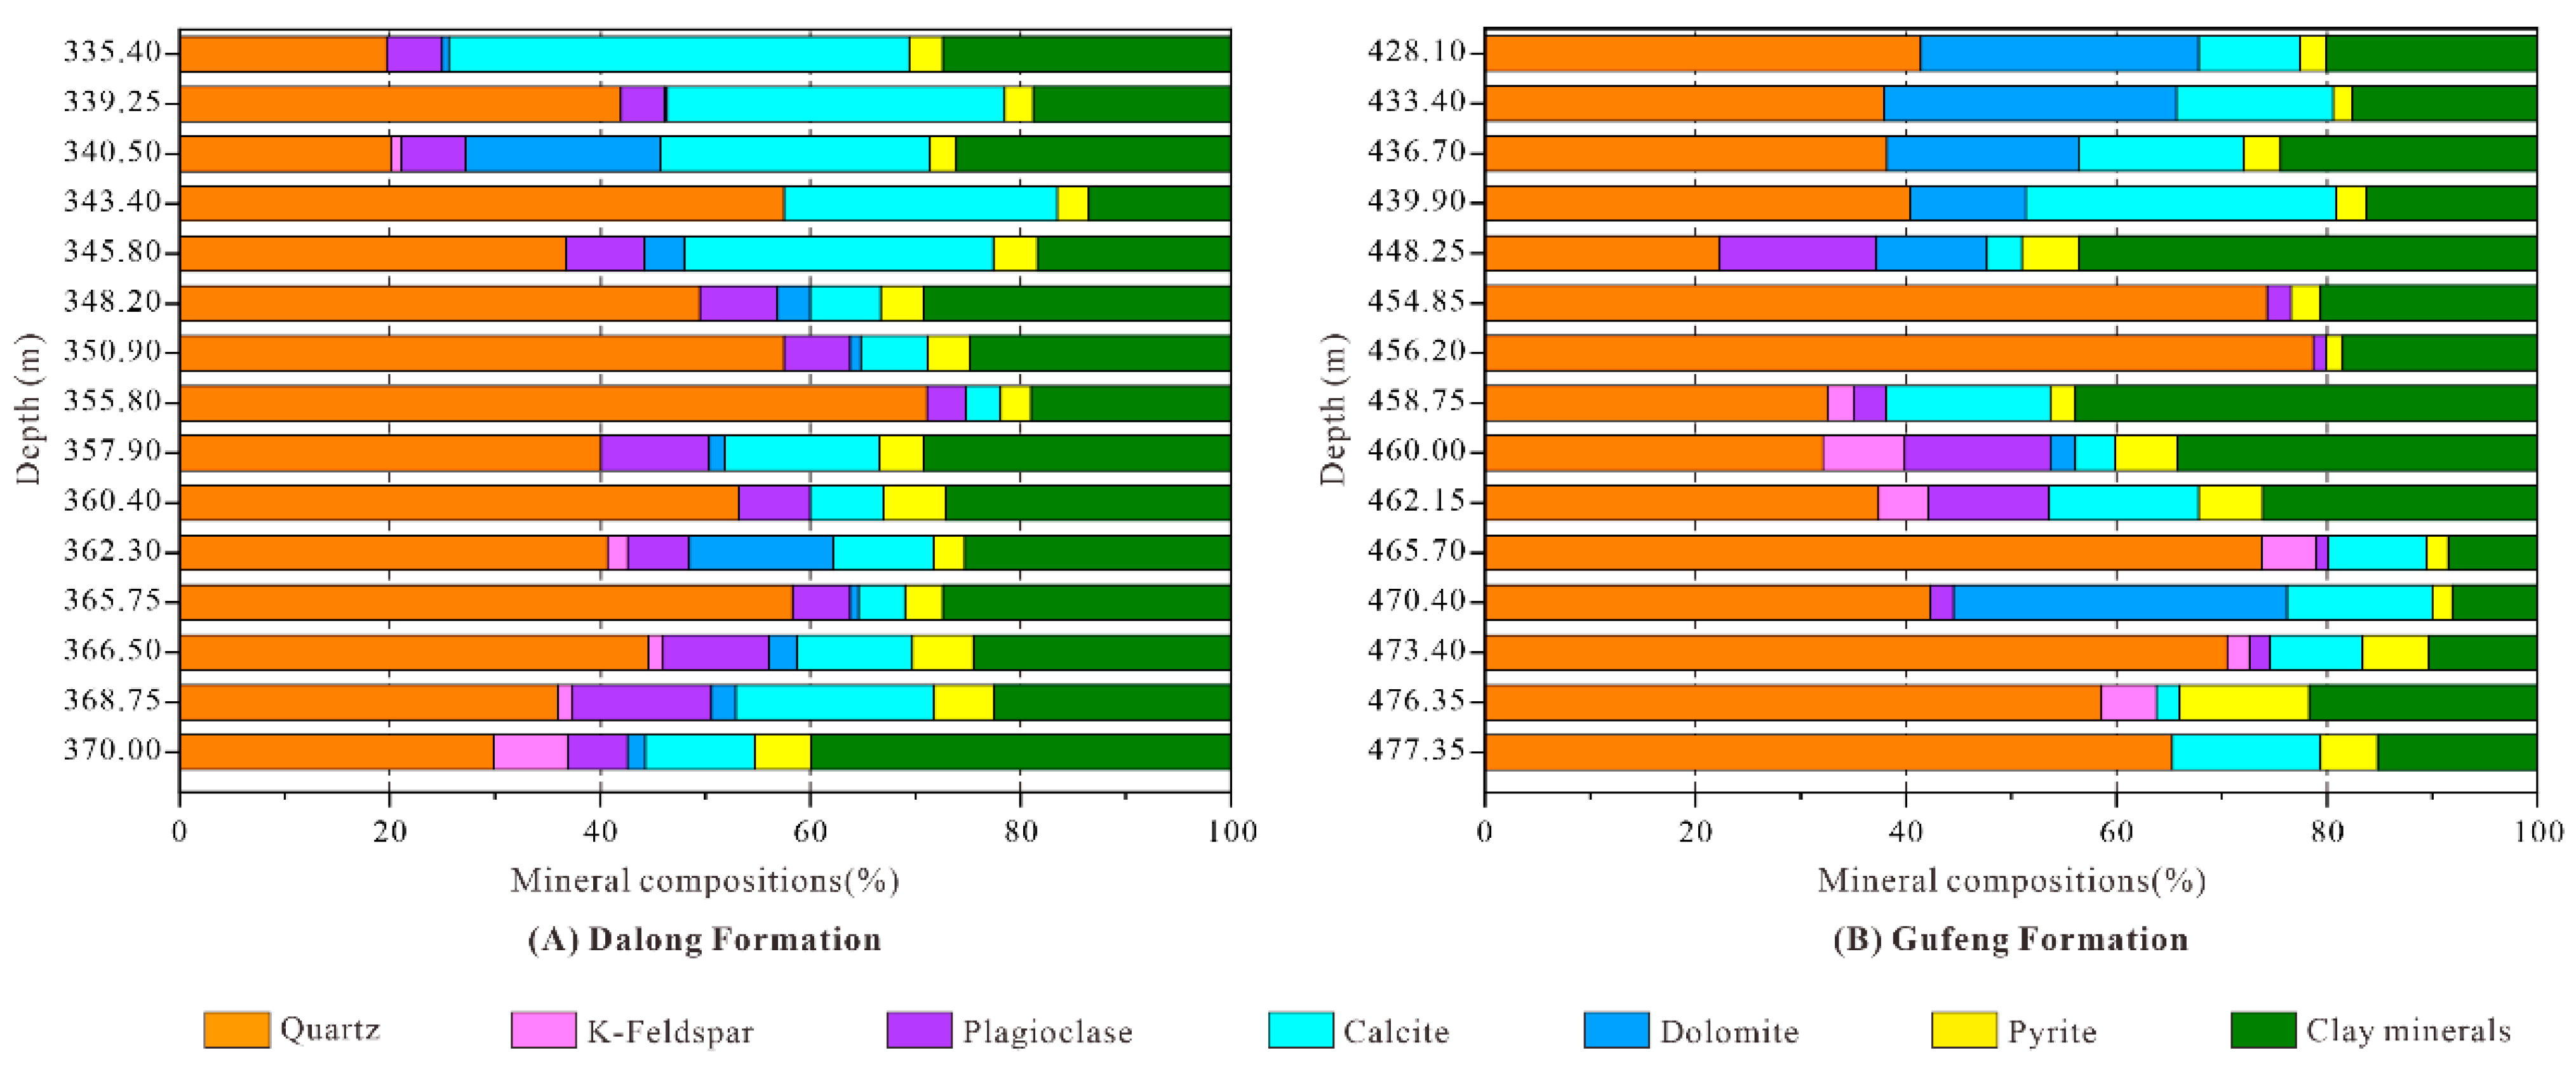
4.1. TOC Content and Bulk Mineralogy

The TOC content of the Dalong Formation ranges from 0.5 wt.% to 10.7 wt.% with a mean value of 6.2 wt.%, displaying a generally decreasing trend upward (Figure 2A). The Gufeng Formation samples show high TOC values in the range of 1.0 wt.% to 30.6 wt.%, averaging 8.3 wt.%. Stratigraphically, the TOC content is highest in the middle part of the Gufeng Formation (Figure 2B).
The X-ray diffraction (XRD) results show that the mineralogy is dominated by quartz, carbonates, and clay minerals in both the Dalong and Gufeng Formations. For the Dalong Formation, the quartz content ranges from 19.7 wt.% to 71.1 wt.% (average = 43.8 wt.%), showing higher values in the lower part than in the upper part. The clay content ranges from 13.5 wt.% to 39.9 wt.%, with a mean value of 24.9 wt.%. Carbonate minerals are dominated by calcite with a range of 3.3 wt.% to 43.8 wt.% (average = 16.6 wt.%), displaying a general increasing trend upward (Figure 3A). For the Gufeng Formation, the samples have higher quartz content (average = 49.7 wt.%) than the Dalong Formation. The clay minerals range from 8.1 wt.% to 43.9 wt.% with an average of 21.9 wt.% and are highest in the middle part of the Gufeng Formation. The carbonate minerals are primarily composed of dolomite and calcite and are higher in content in the upper part than in the lower part. The dolomite content ranges from 2.4 wt.% to 31.7 wt.% (average = 18.3%), and the calcite content ranges from 2.2 wt.% to 29.5 wt.% (average = 11.9 wt.%).

4.2. Lithofacies Classification

Based on textural variation, TOC contents, and mineralogical composition, four major lithofacies are identified in the Dalong and Gufeng Formations. The four mudstone lithofacies identified, consisting of siliceous mudstone, calcareous–siliceous mixed mudstone, argillaceous–siliceous mixed mudstone, and carbonaceous mudstone, are described in detail below.

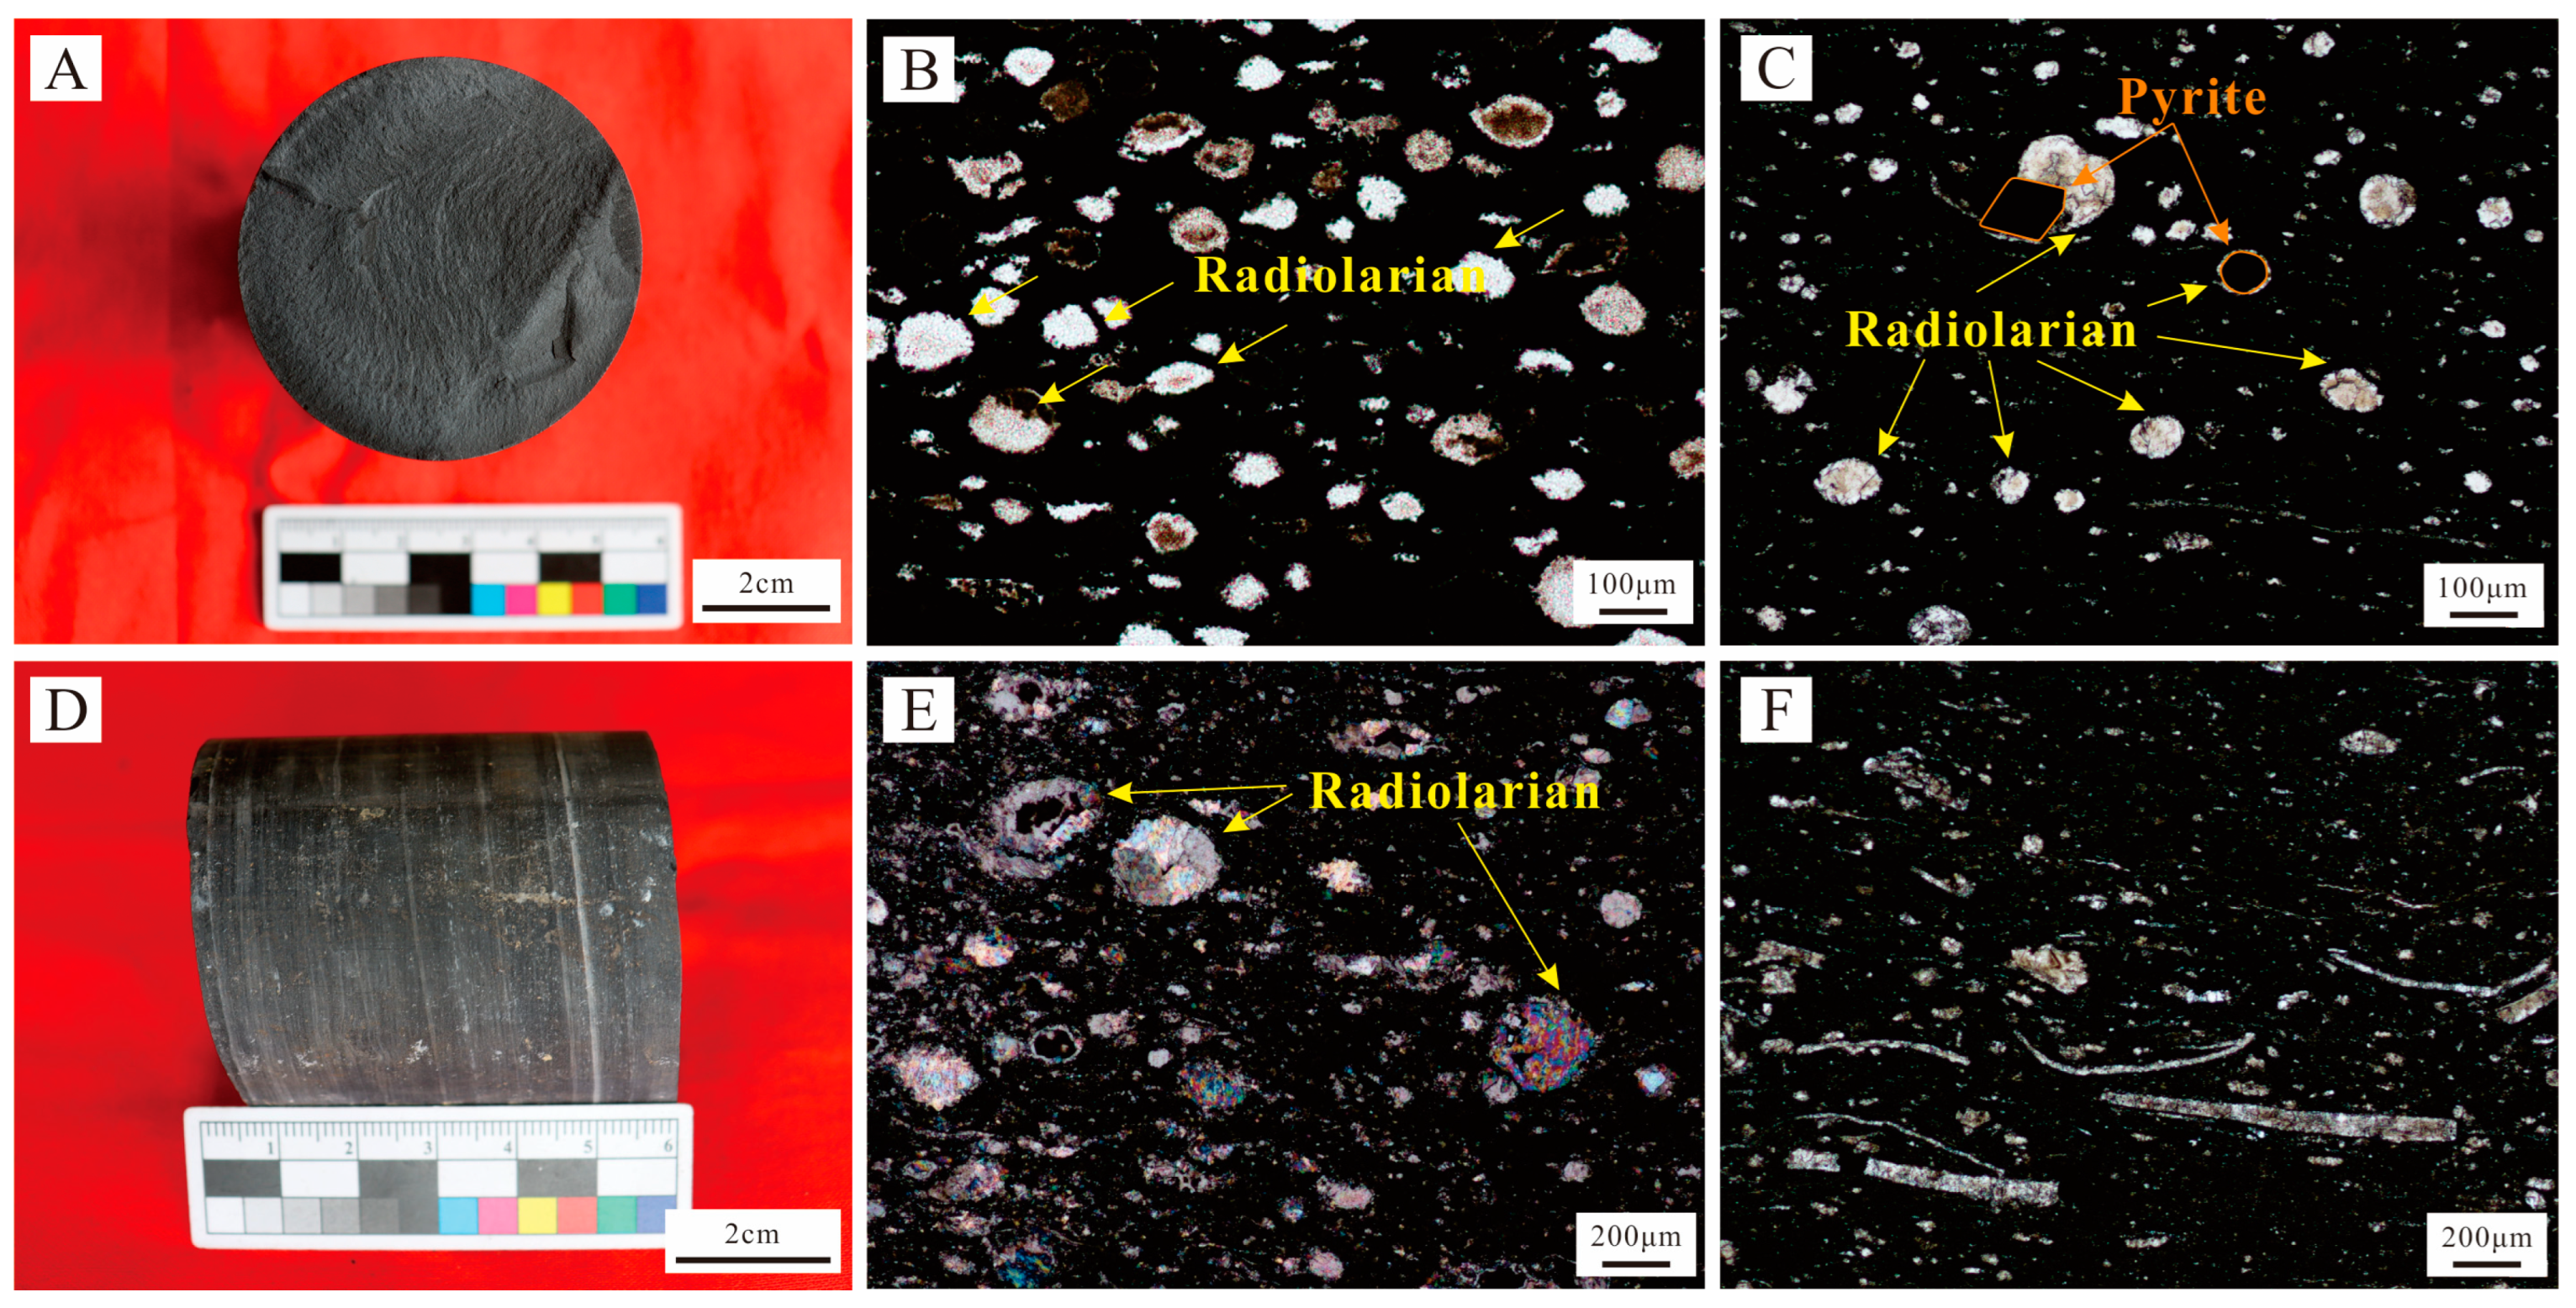
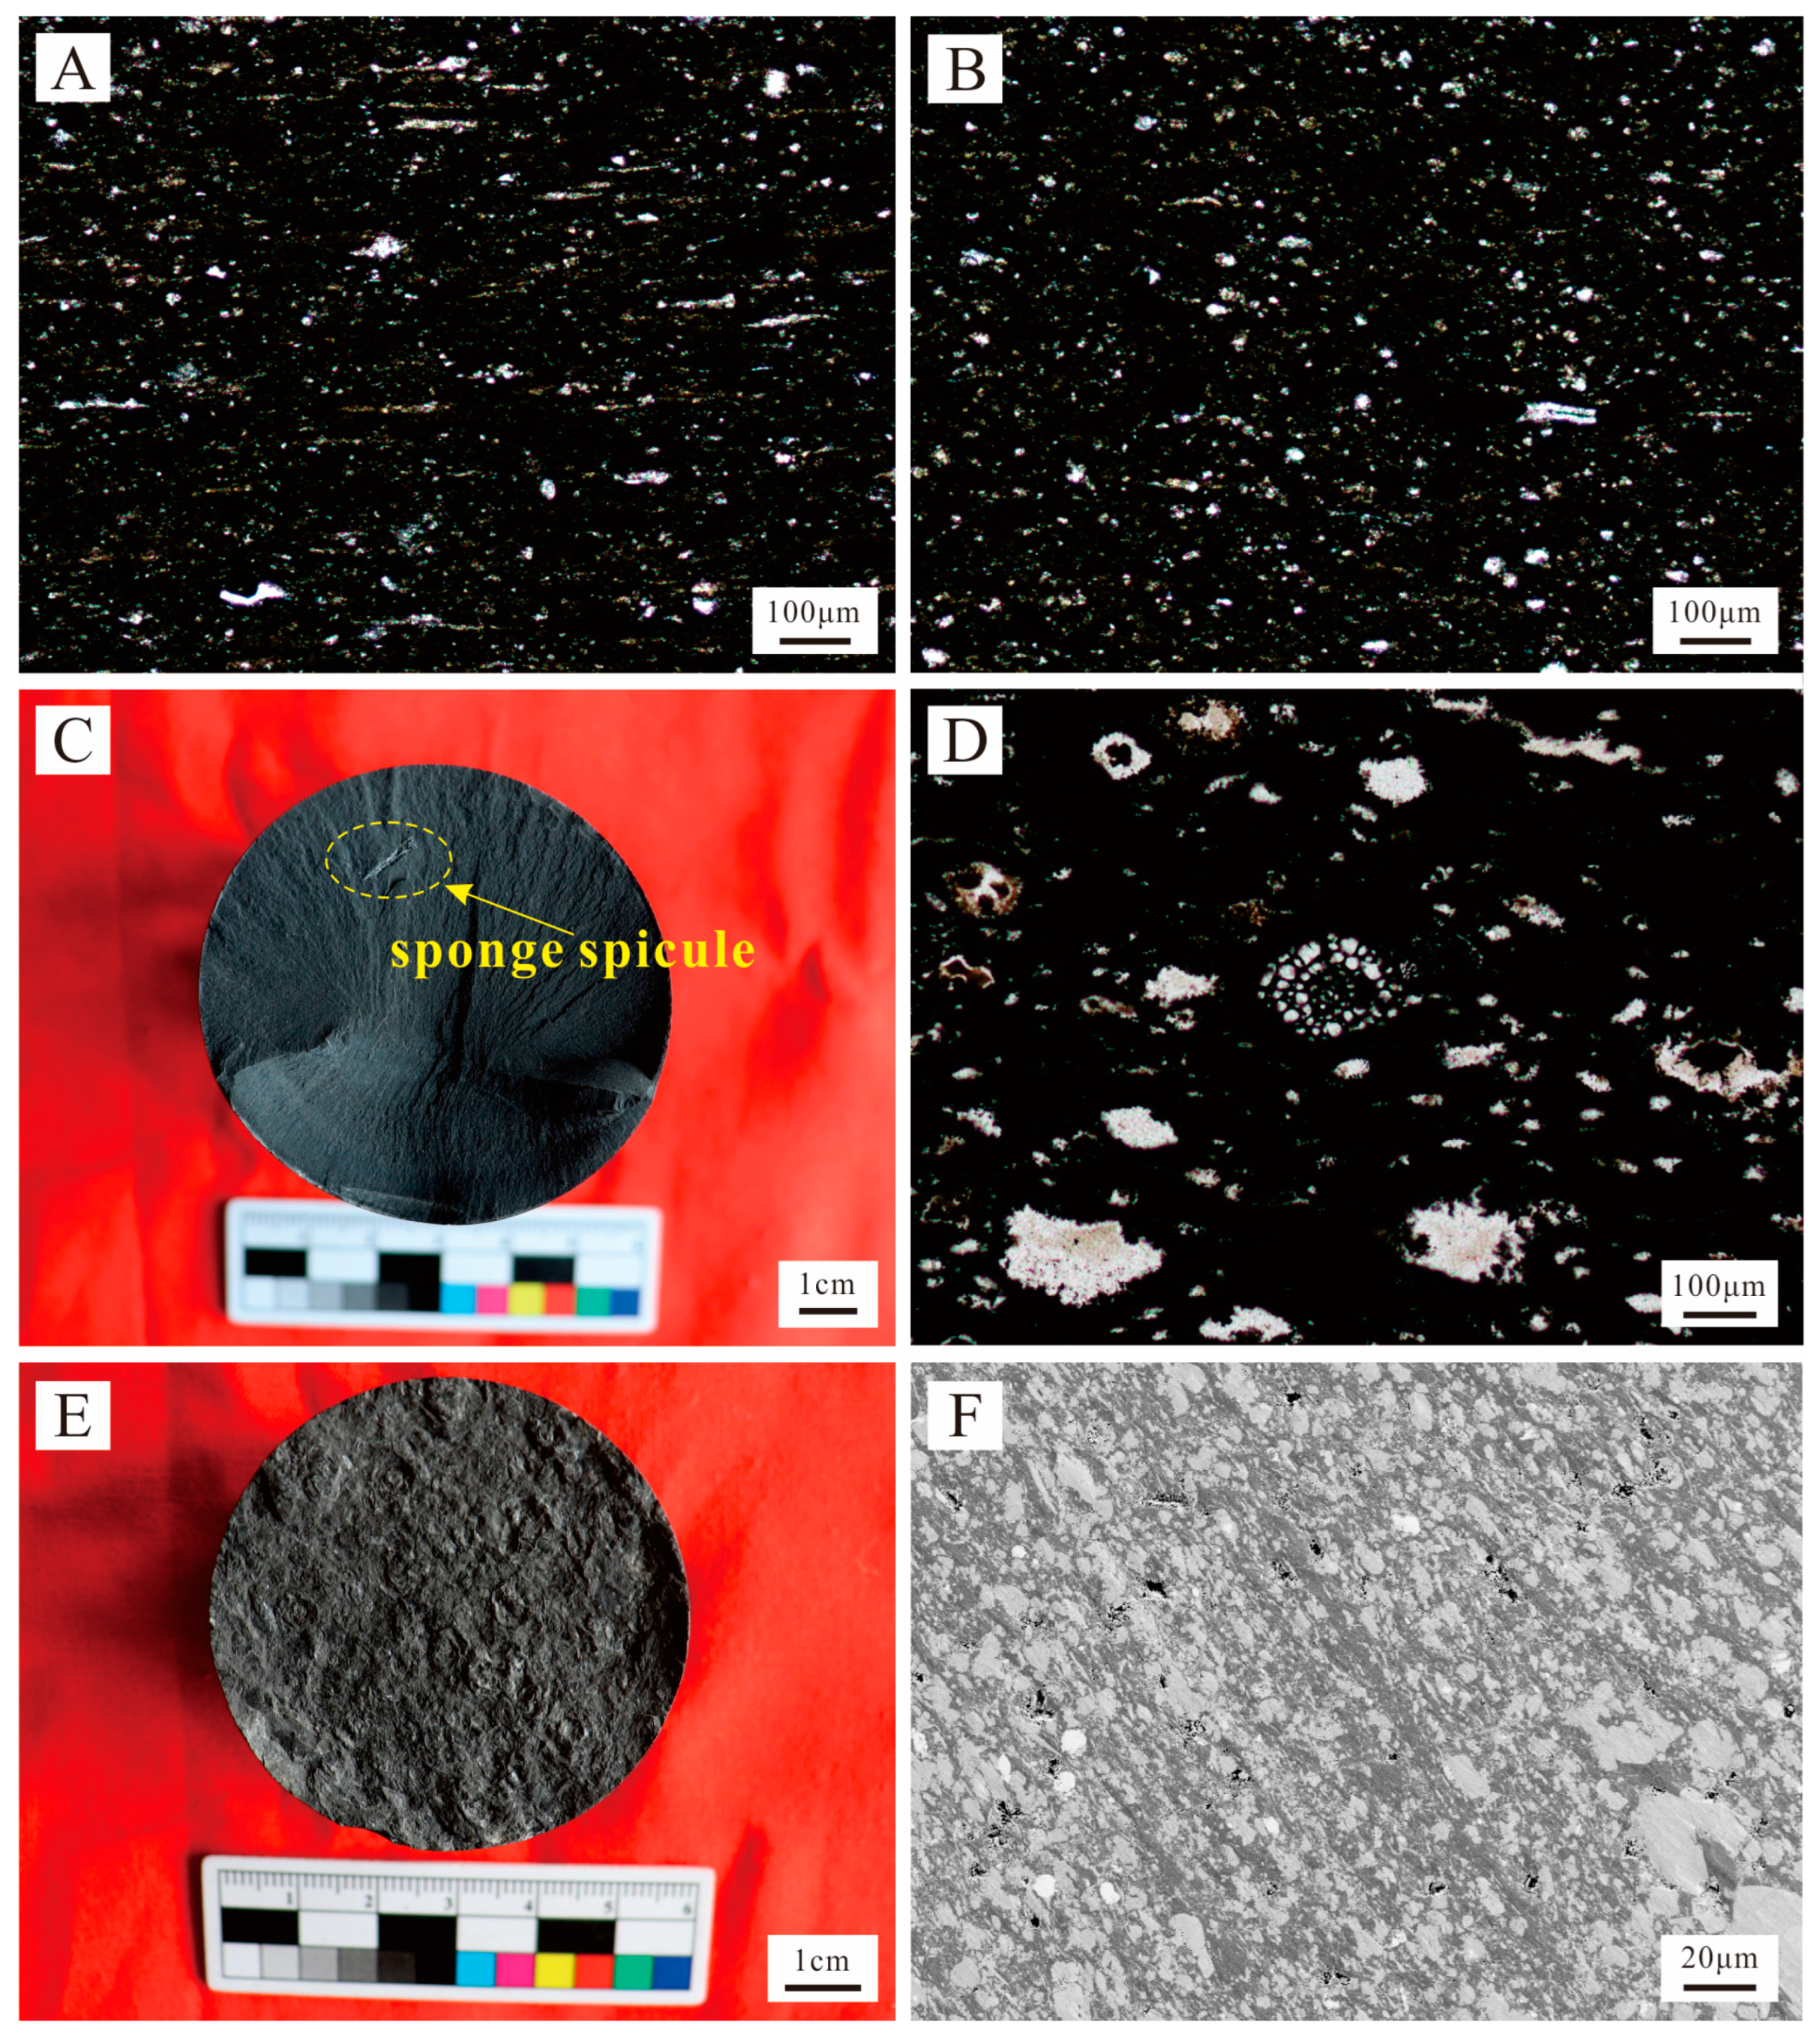
4.2.1. Siliceous Mudstone

The siliceous mudstone is primarily distributed in the lower-to-middle part of the Dalong Formation, and the lower part of the Gufeng Formation (Figure 2). This lithofacies has the highest quartz content, ranging from 36.0 wt.% to 73.8 wt.% (average = 55.5 wt.%), and relatively low carbonate content, ranging from 2.2 wt.% to 26.0 wt.% (average = 11.9 wt.%). In addition, the siliceous mudstone is rich in organic matter and has a high TOC content, ranging from 5.2 wt.% to 11.4 wt.%, with an average of 8.4 wt.%. Petrographic examination suggests that siliceous mudstone is characterized by gray-black/black color, high silica content, and abundant fossils (e.g., radiolarians, cephalopods) (Figure 4A–C and Figure 5A,B). Some of the siliceous radiolarians were replaced by euhedral pyrite crystals (Figure 4C).

4.2.2. Calcareous–Siliceous Mixed Mudstone

The calcareous-siliceous mixed mudstone is primarily distributed in the upper part of the Dalong Formation, and the upper part of the Gufeng Formation (Figure 2). This lithofacies contains high contents of quartz and carbonate minerals (Figure 5C,D). The quartz content ranges from 36.8 wt.% to 42.3 wt.% (average = 40.1 wt.%) and the carbonate content ranges from 32.4 wt.% to 45.5 wt.% (average = 38.4 wt.%). The lithofacies has moderate to high TOC content ranging from 1.0 wt.% to 6.6 wt.% (average = 3.7 wt.%). The calcareous–siliceous mixed mudstone comprises faint carbonate-rich laminae, high carbonate content, and abundant calcareous fossils (e.g., shell or mollusk skeletal fragments) (Figure 4E,F and Figure 5C,D). Notably, most of the radiolarian skeletal fragments were replaced by carbonate minerals in this lithofacies (an example is shown in Figure 4E).

4.2.3. Argillaceous–Siliceous Mixed Mudstone

The argillaceous–siliceous mixed mudstone occurs primarily in the middle part of the Gufeng Formation. This lithofacies comprises high contents of detrital quartz and clay minerals (Figure 6A,B). The XRD analysis indicates that the average content of quartz and clay minerals is 42.2 wt.% and 44.1 wt.%, respectively. Microscopic observation shows that most quartz grains are present as silt-sized particles floating among the clay matrix (Figure 6B). In addition, the TOC content of this lithofacies ranges from 3.1 wt.% to 5.7 wt.% with a mean value of 4.3 wt.%.

4.2.4. Carbonaceous Mudstone

The carbonaceous mudstone lithofacies occurs mainly in the middle part of the Gufeng Formation. This lithofacies is characterized by the highest OM content, ranging from 16.2 wt.% to 30.6 wt.%, and abundant fossils including sponge spicules (Figure 6C–E). OM is present as elongated laminae in the carbonaceous mudstone (Figure 6F). This lithofacies is predominantly composed of quartz and clay minerals, averaging 51.0 wt.% and 28.7 wt.%, respectively. The carbonate content is relatively low and ranges from 0 to 15.6 wt.% with an average of 7.2 wt.%.

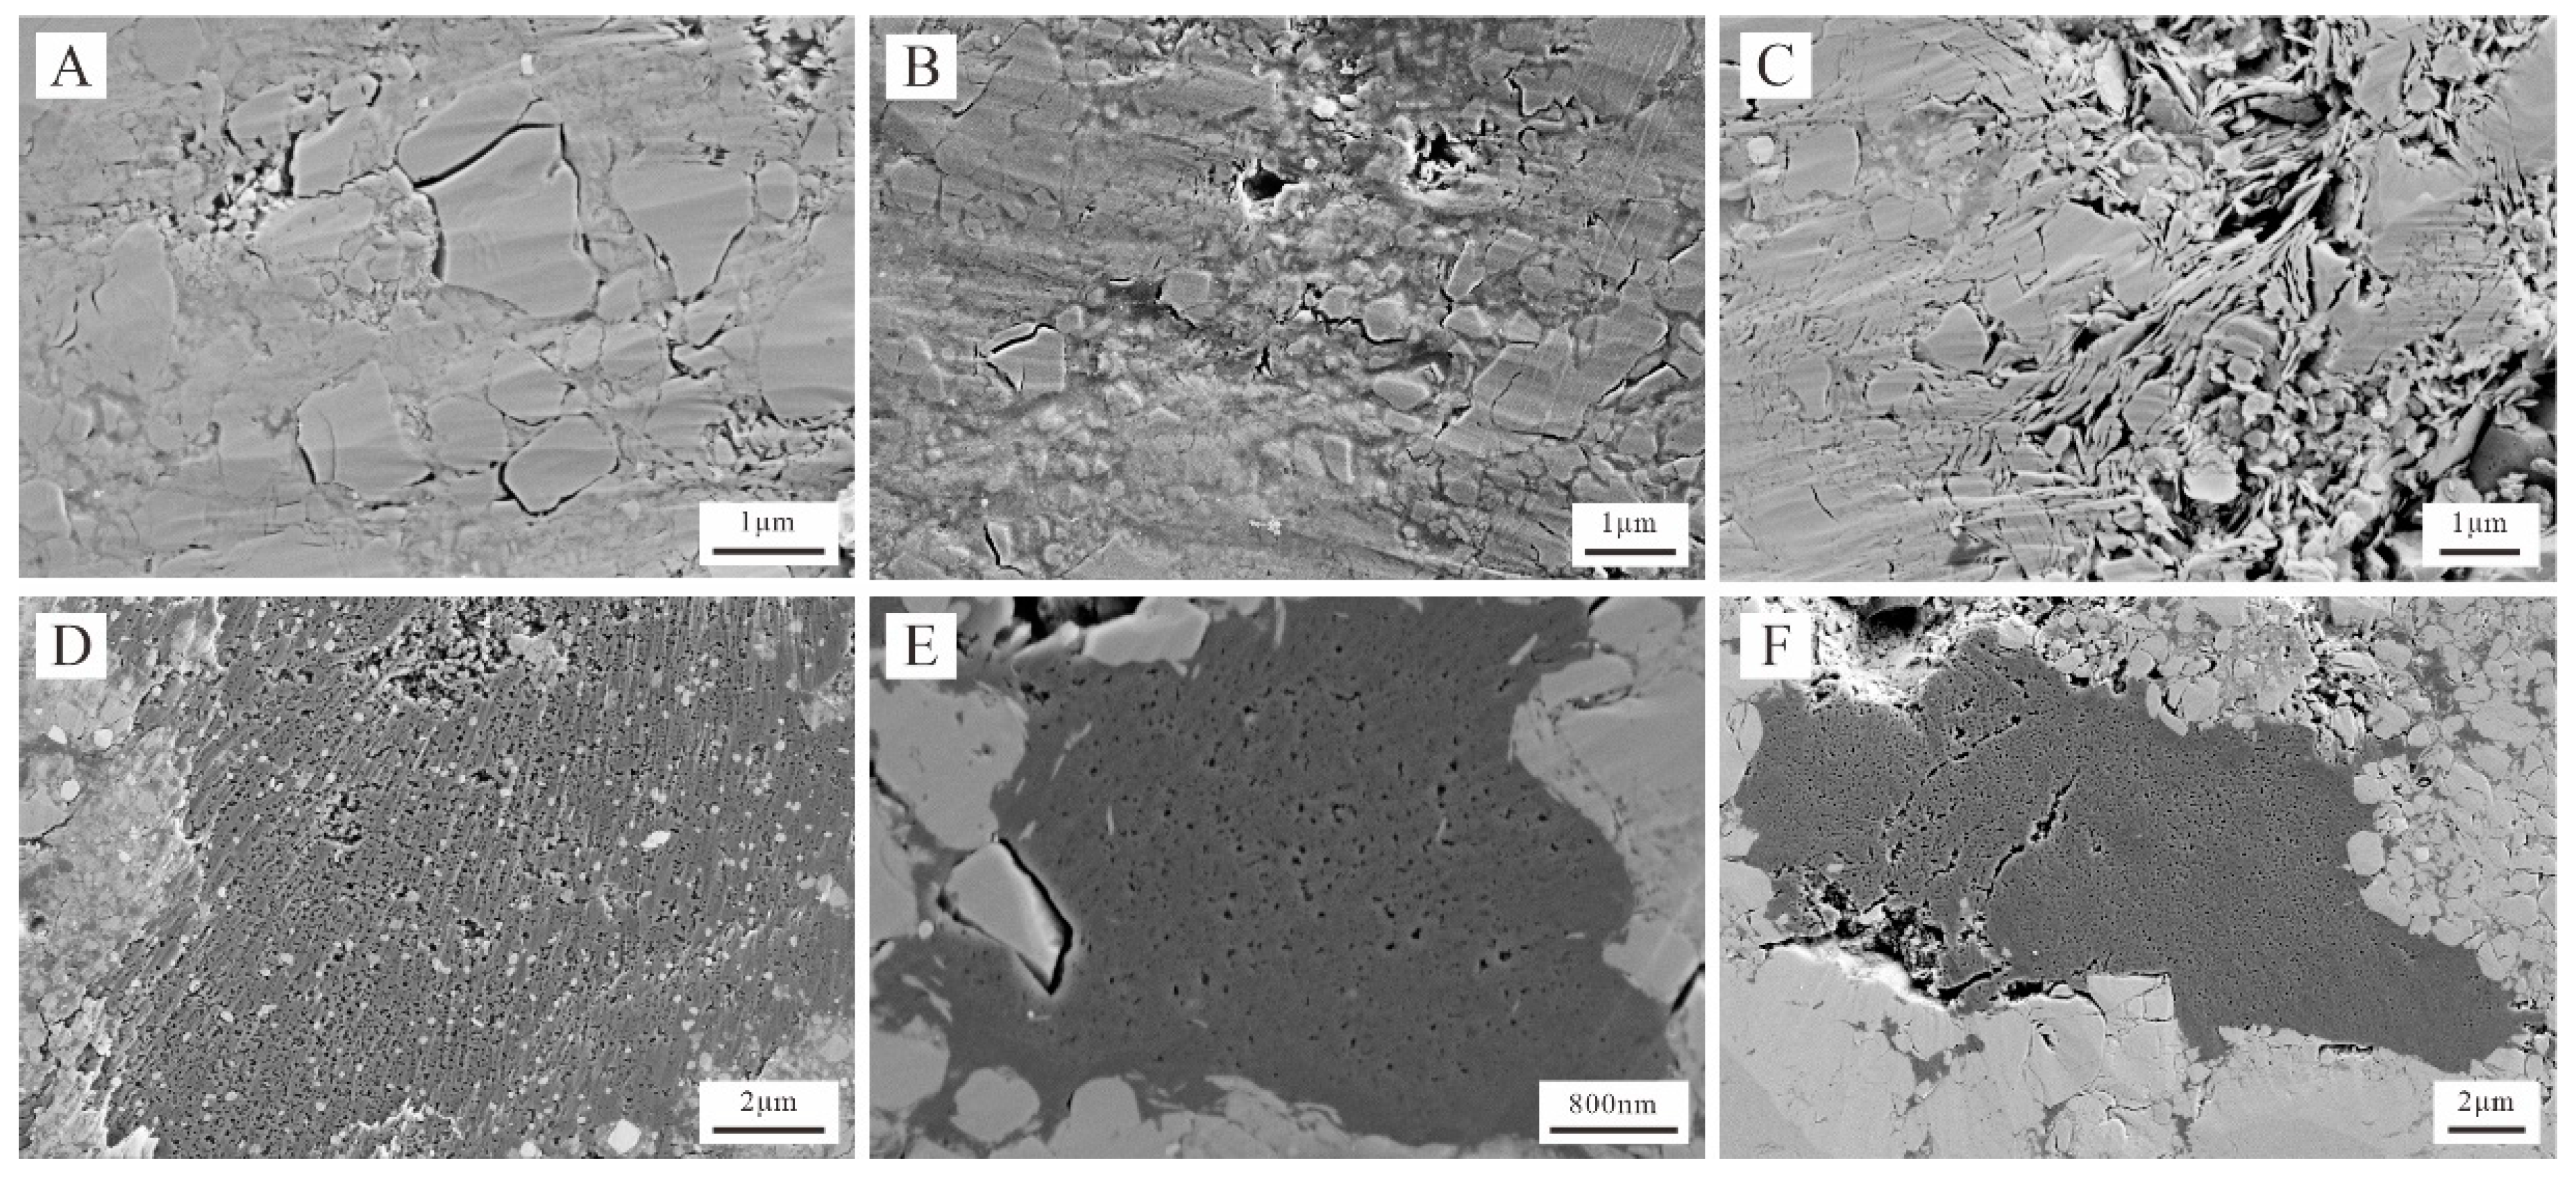
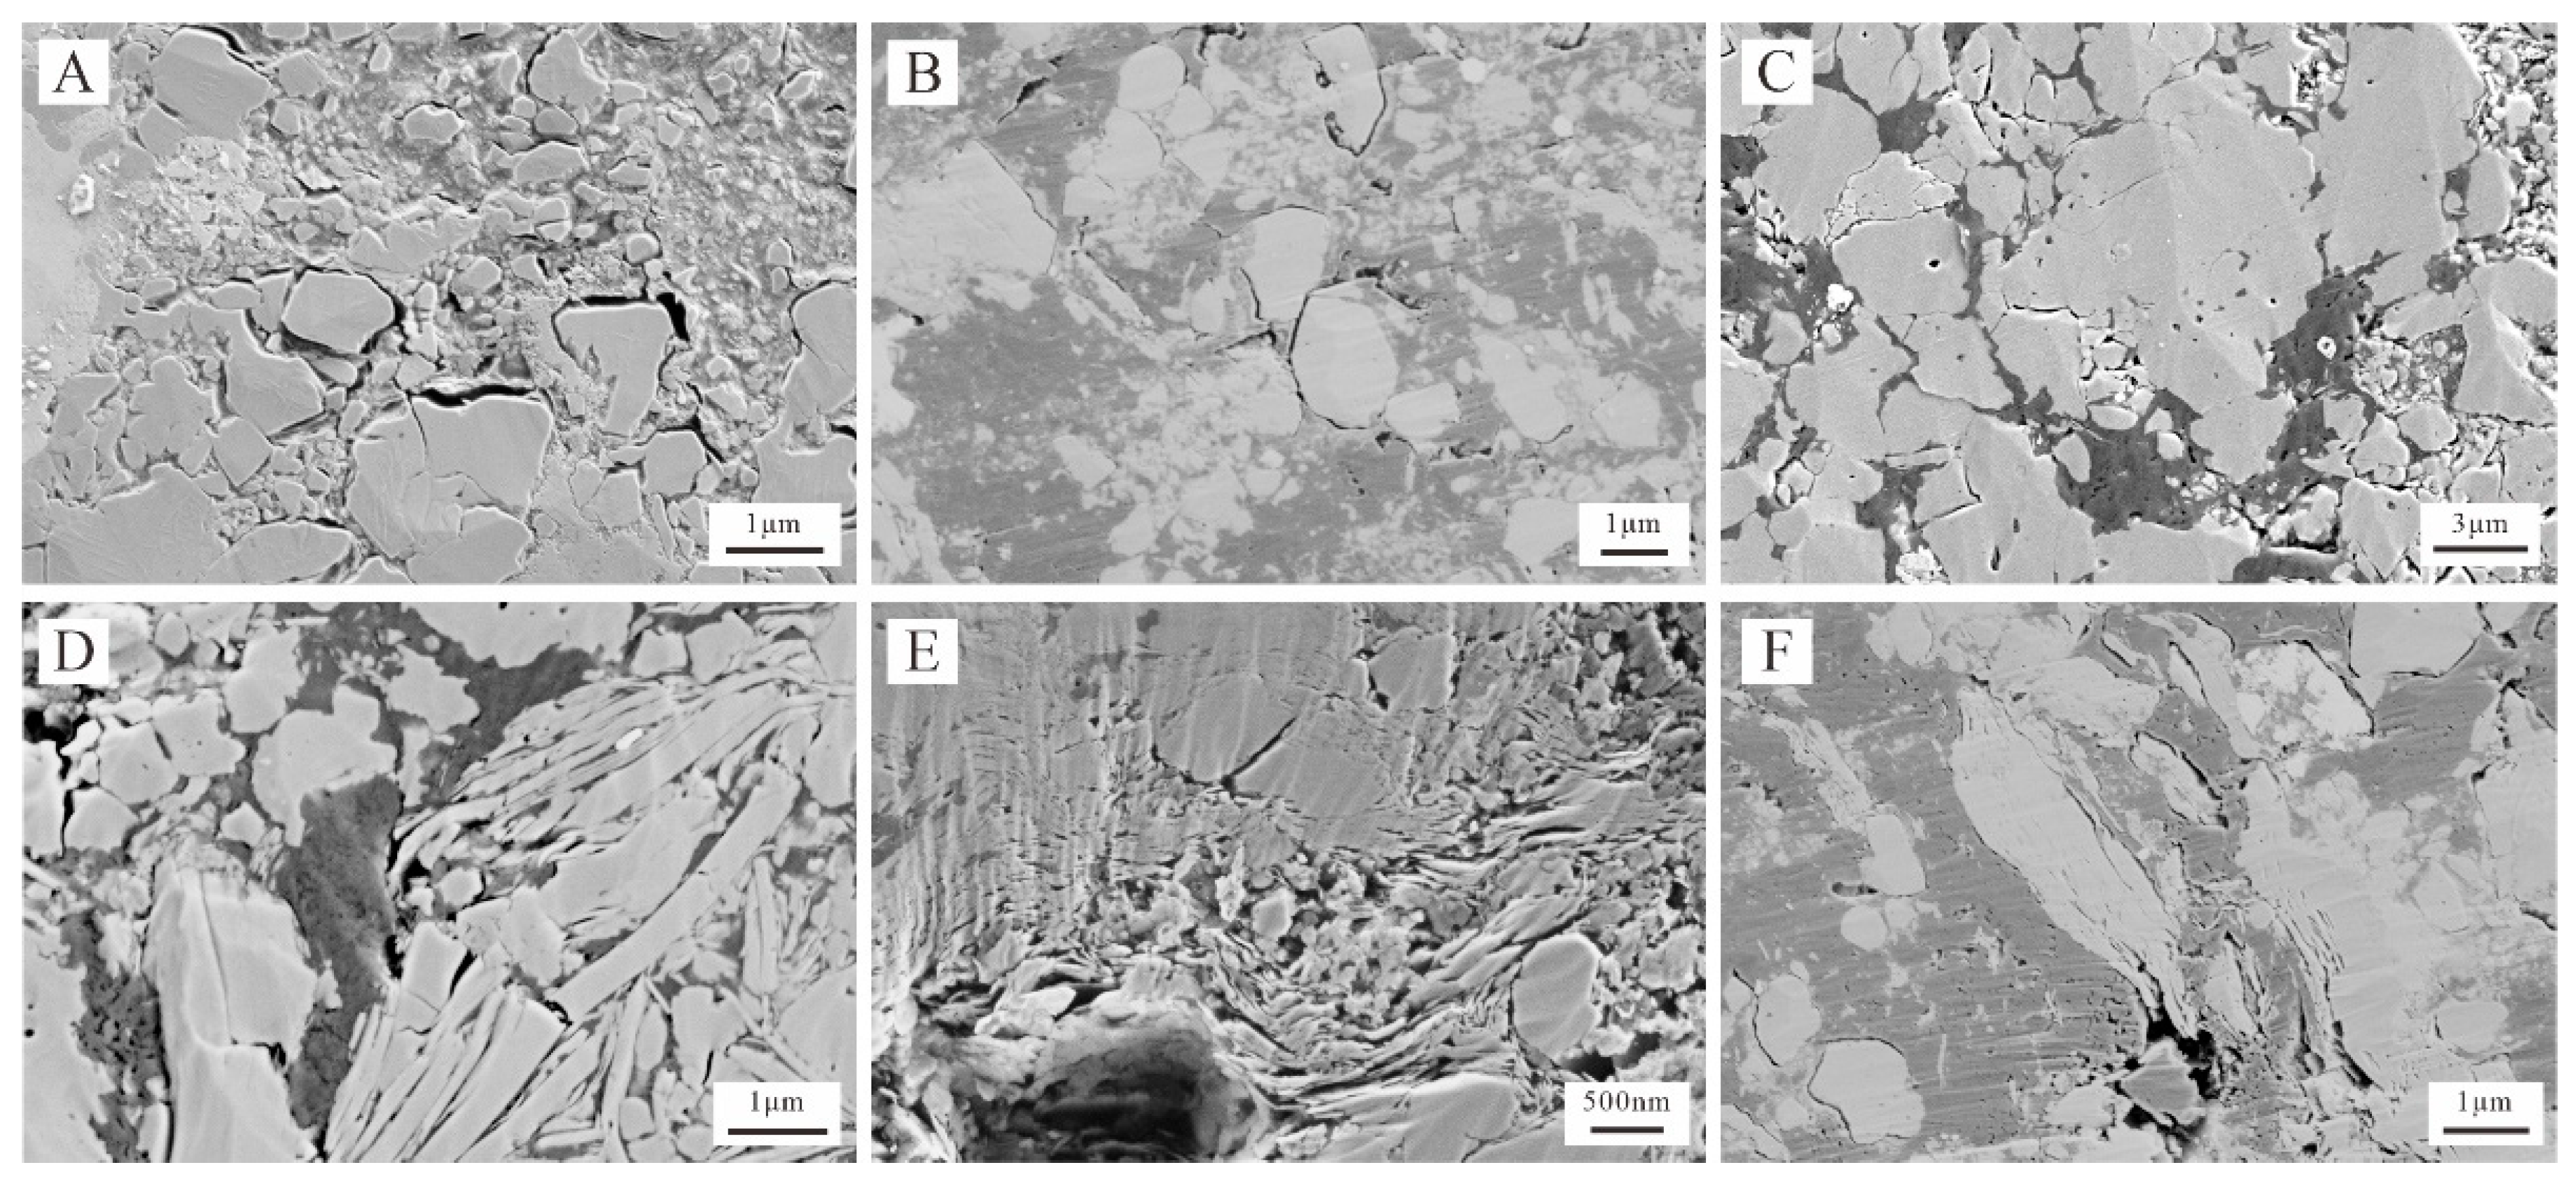
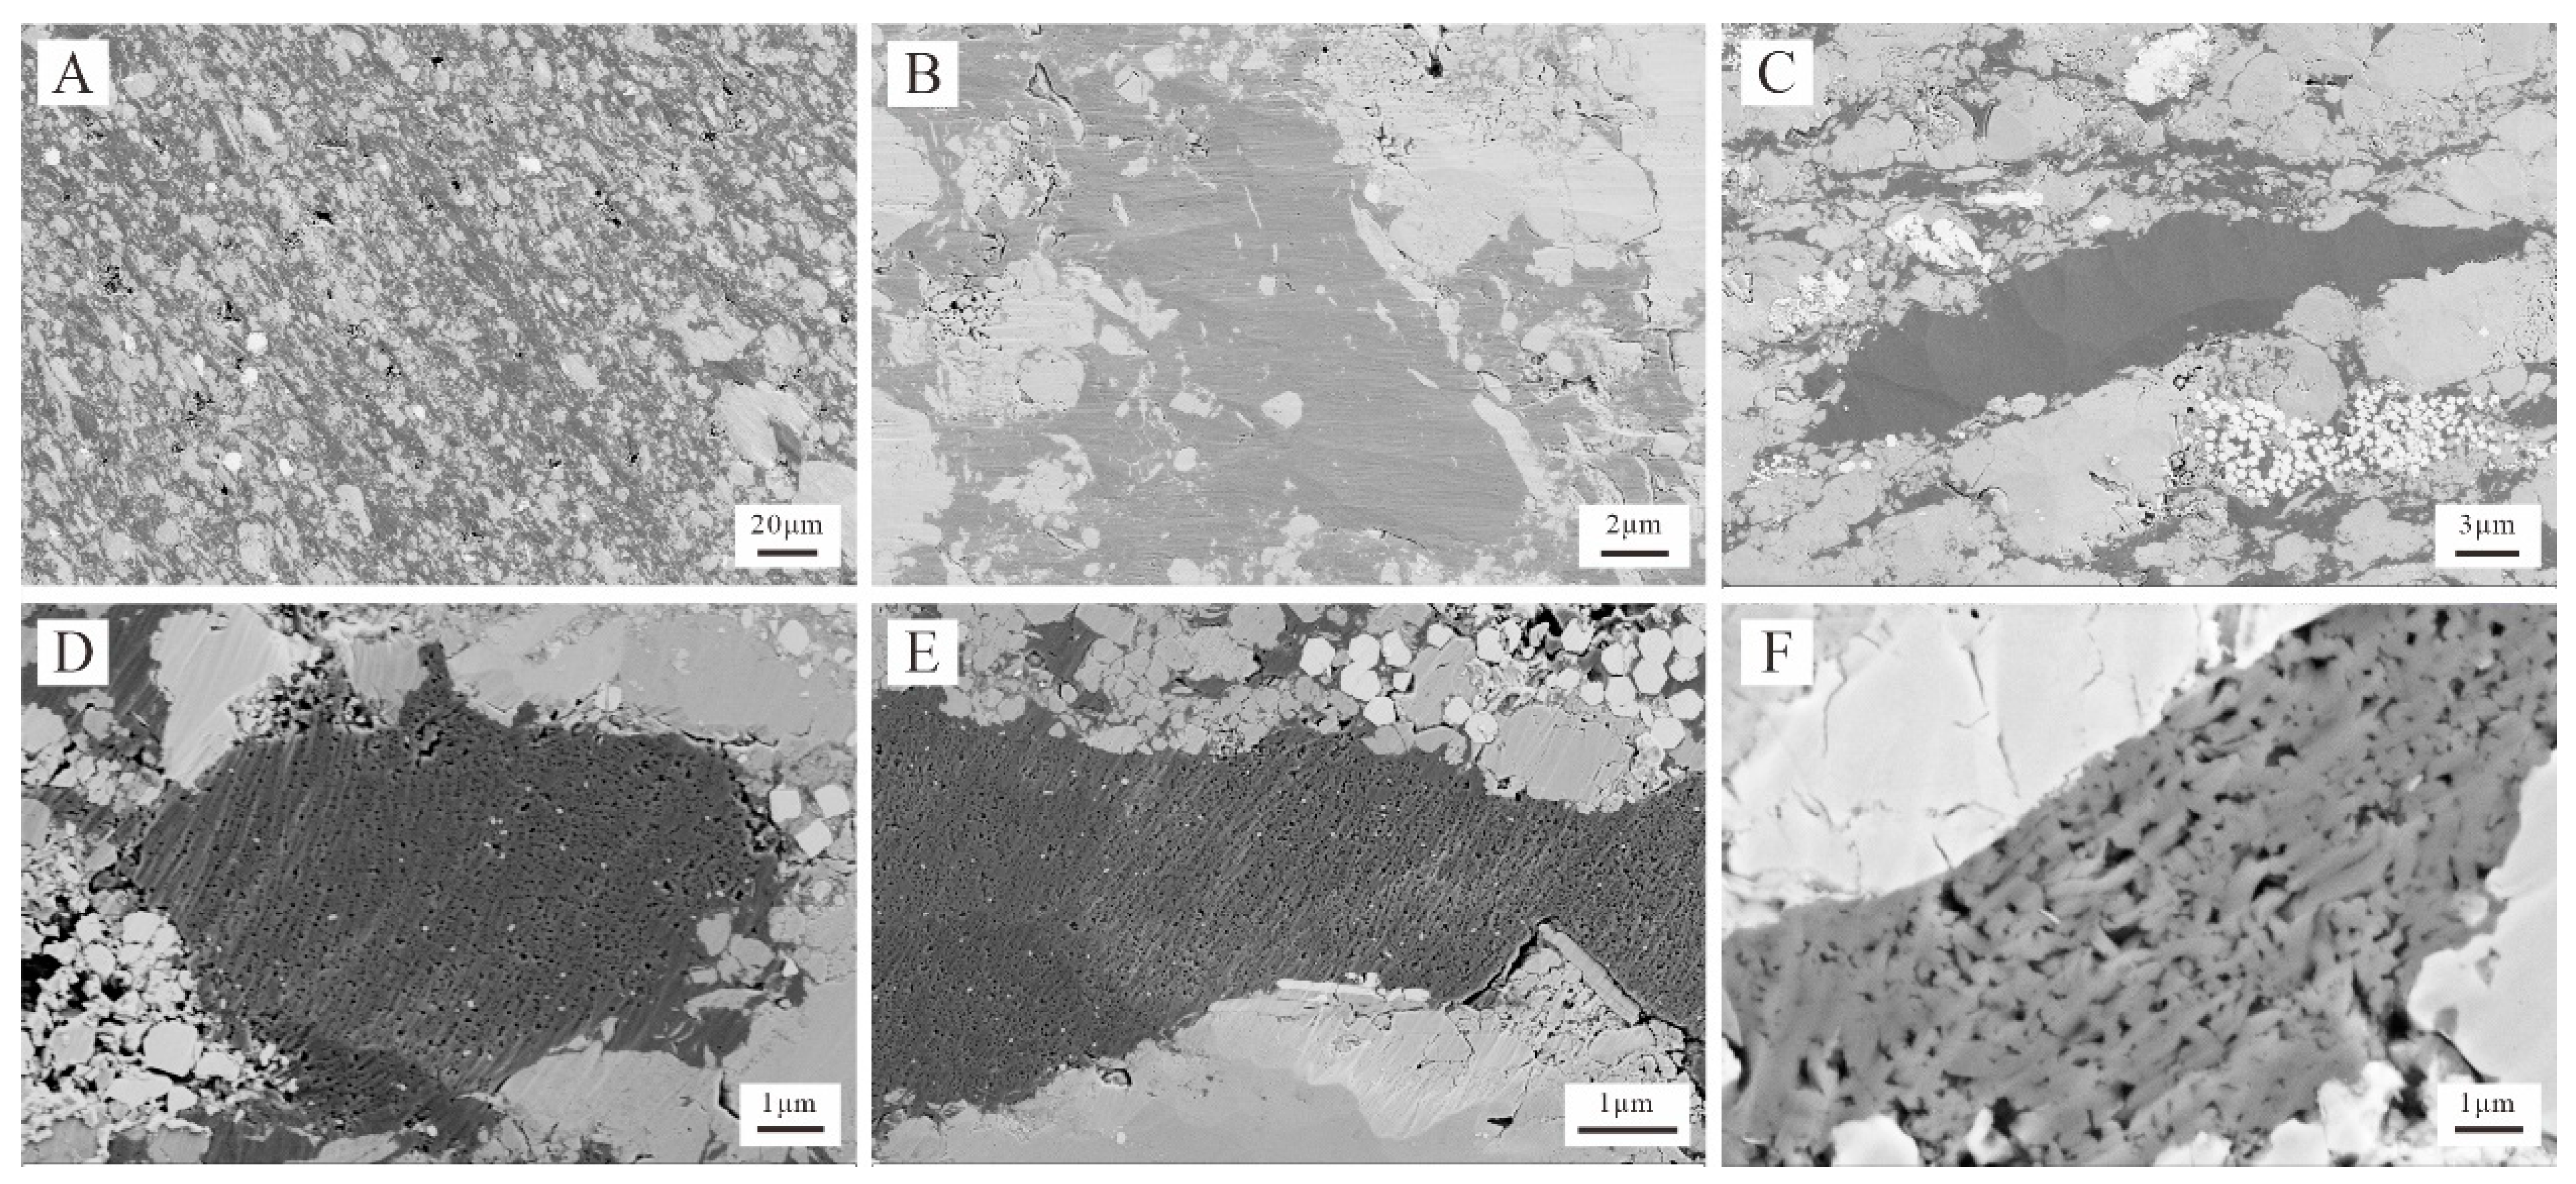
4.3. Pore Types from FE-SEM Observations

The pore-type classification proposed by Loucks et al. (2012) [6] was adopted in this study. Both matrix-related and OM-hosted pores were observed in SEM images for the Dalong and Gufeng samples, including interparticle (interP) pores, intraparticle (intraP) pores, and organic matter (OM) pores.
Matrix-related pores show similar characteristics in both the Dalong and Gufeng Formations and occur primarily as interparticle pores between rigid grains, such as quartz and calcite (Figure 7A,B and Figure 8A,B), interparticle pores between matrix minerals and OM (Figure 7E,F and Figure 8D), and intraparticle pores between clay flakes (Figure 7C and Figure 8E,F). The InterP pores generally display silt-like, wedged, or irregular shapes with a large size (Figure 8A,B). The IntraP pores were mainly developed within clay platelets (Figure 7C and Figure 8E,F), and there were minor pores within pyrite framboids and dissolution pores within calcite grains (Figure 8C).
OM-hosted pores show some differences between the Dalong and Gufeng Formations. For the Dalong Formation, organic matter consists of abundant solid bitumen and minor vitrinite, along with inertinite. OM-hosted pores are primarily present as sponge-like pores within solid bitumen (pyrobitumen), with a size range of 50–150 nm in pore diameter (Figure 7D–F). For the Gufeng Formation, the average OM content (average = 8.3 wt.%) is greater than that of the Dalong Formation (average = 6.2 wt.%). The organic matter is primarily present as solid bitumen, vitrinite, and inertinite in the Gufeng Formation (Figure 9). However, SEM observation suggests that the OM pores are less abundant in the Gufeng Formation than in the Dalong Formation. The OM pores are dominated by sponge-like and wedge-shaped pores within solid bitumen/pyrobitumen in the Gufeng Formation, showing a diameter range from tens to hundreds of nanometers (Figure 9D–F). The vitrinite and inertinite macerals show no SEM-visible secondary OM pores (Figure 9C).

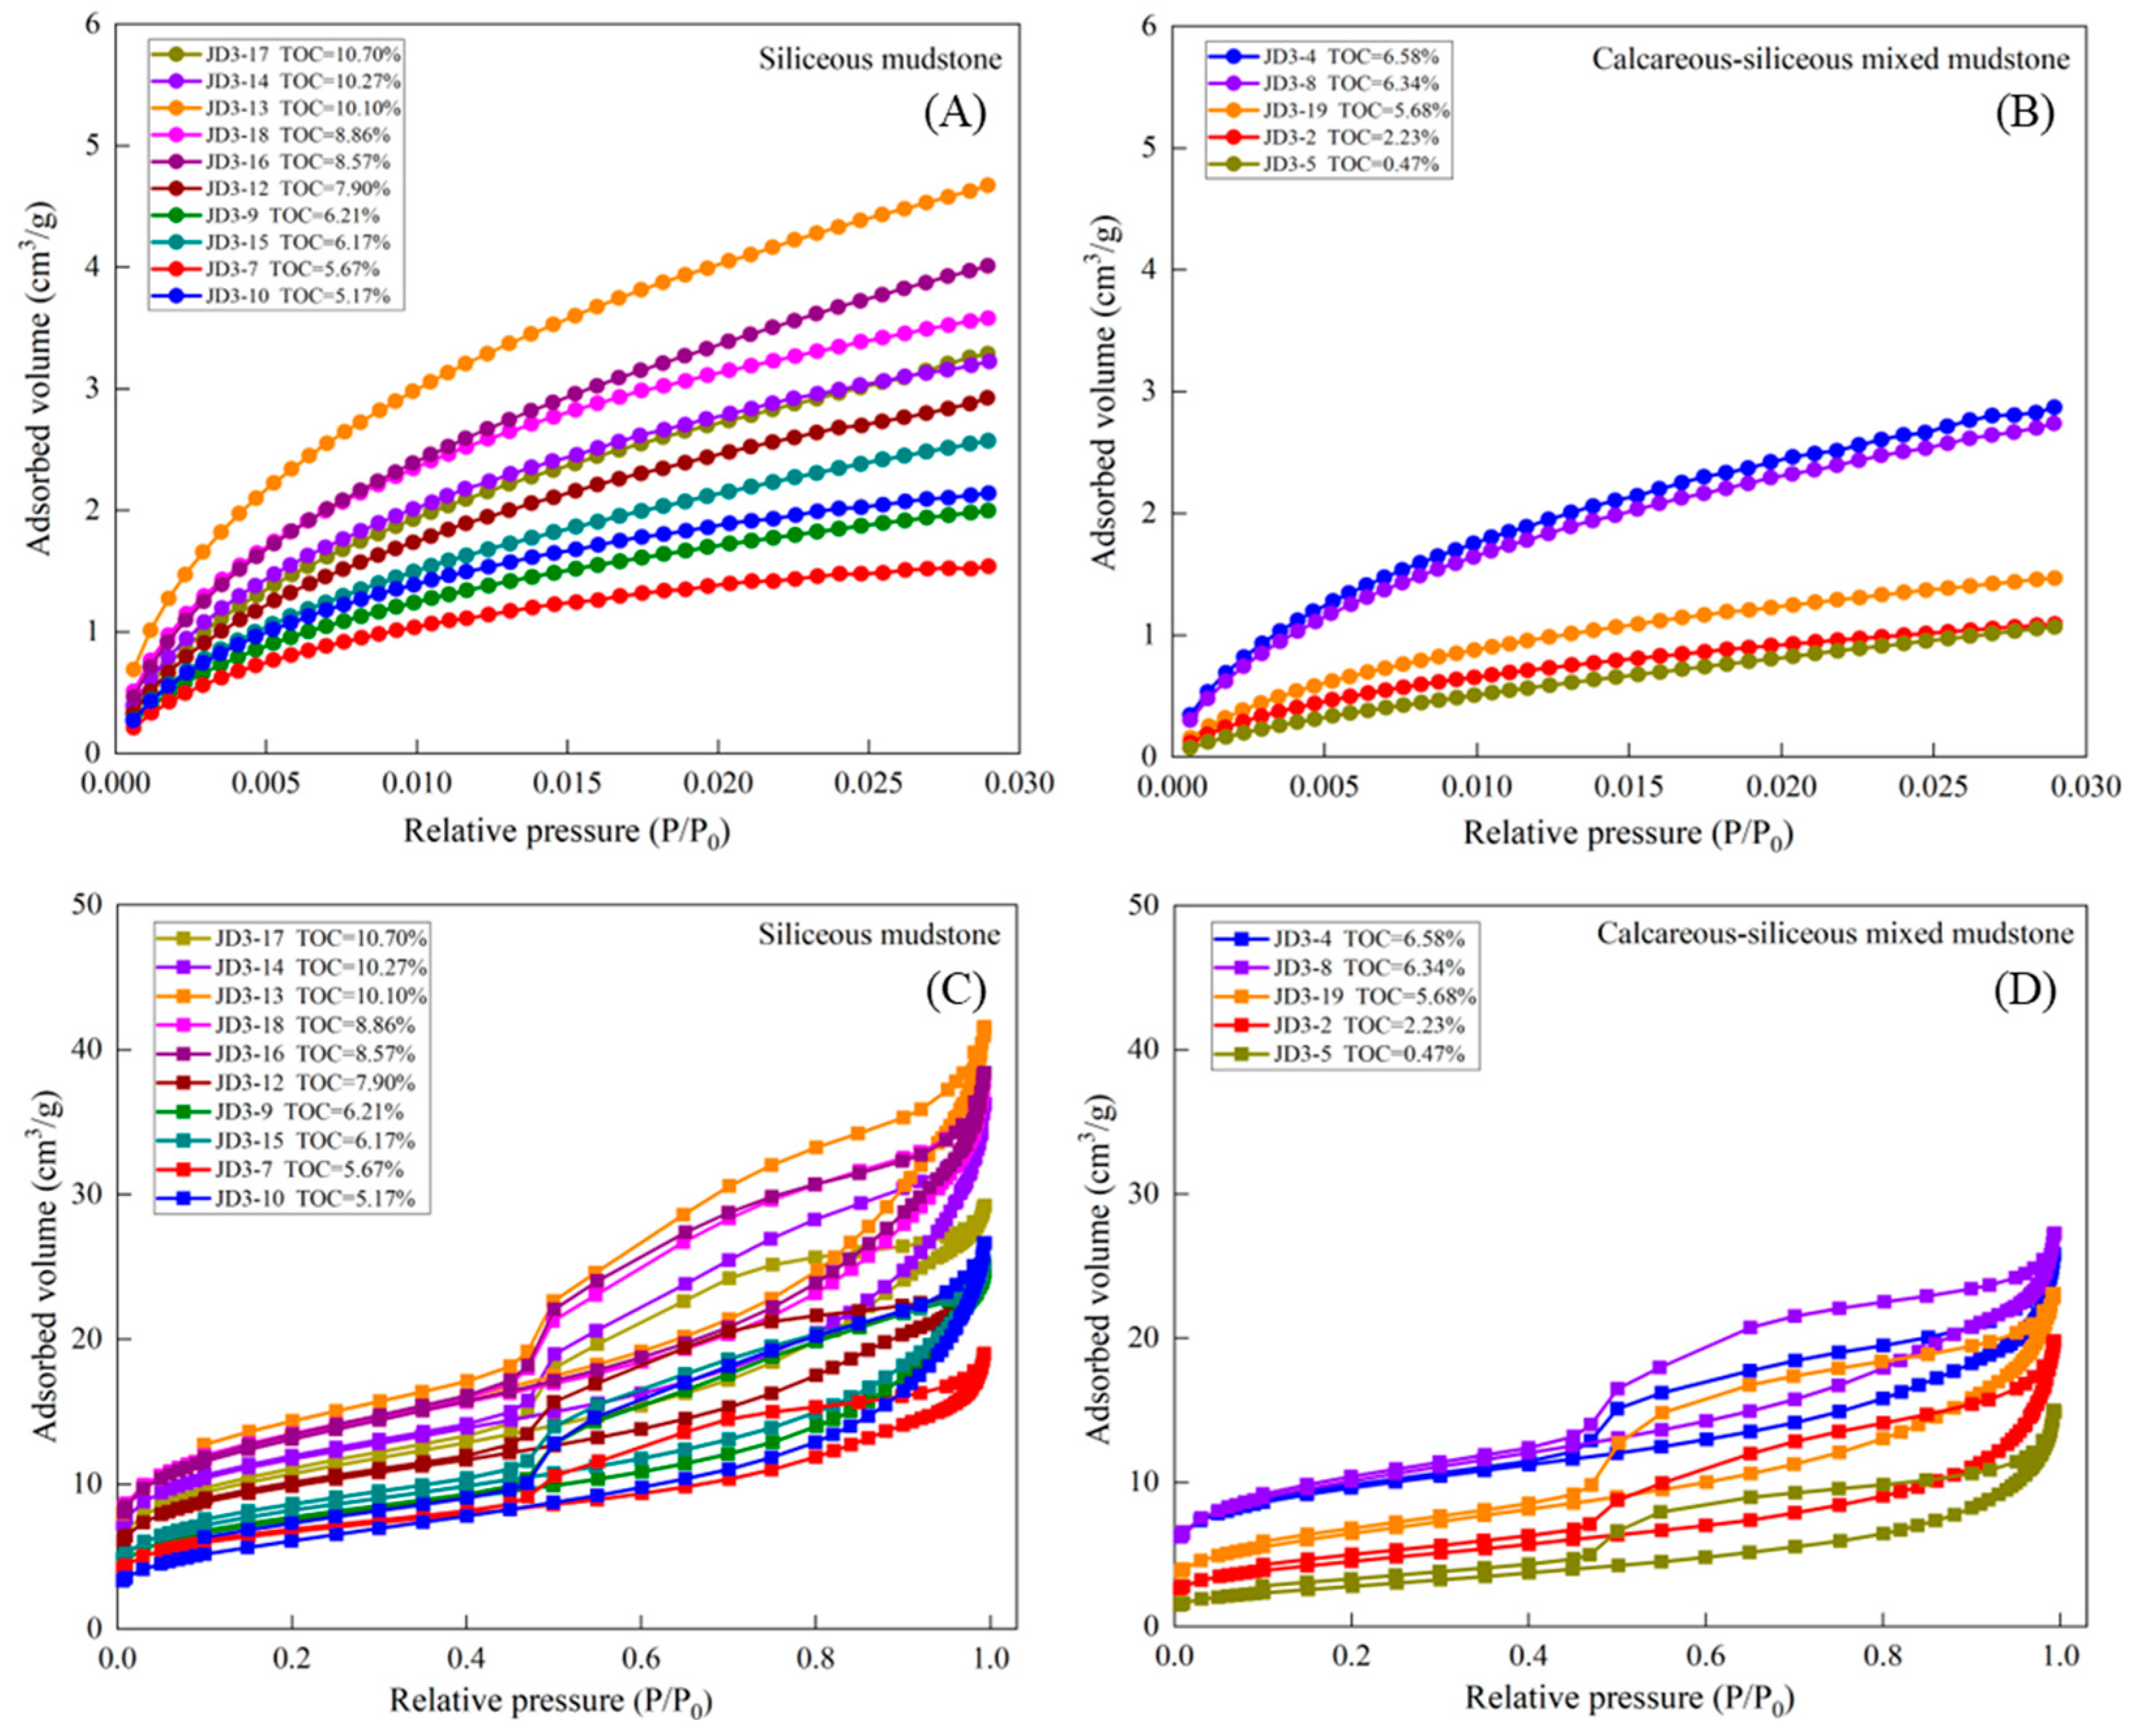
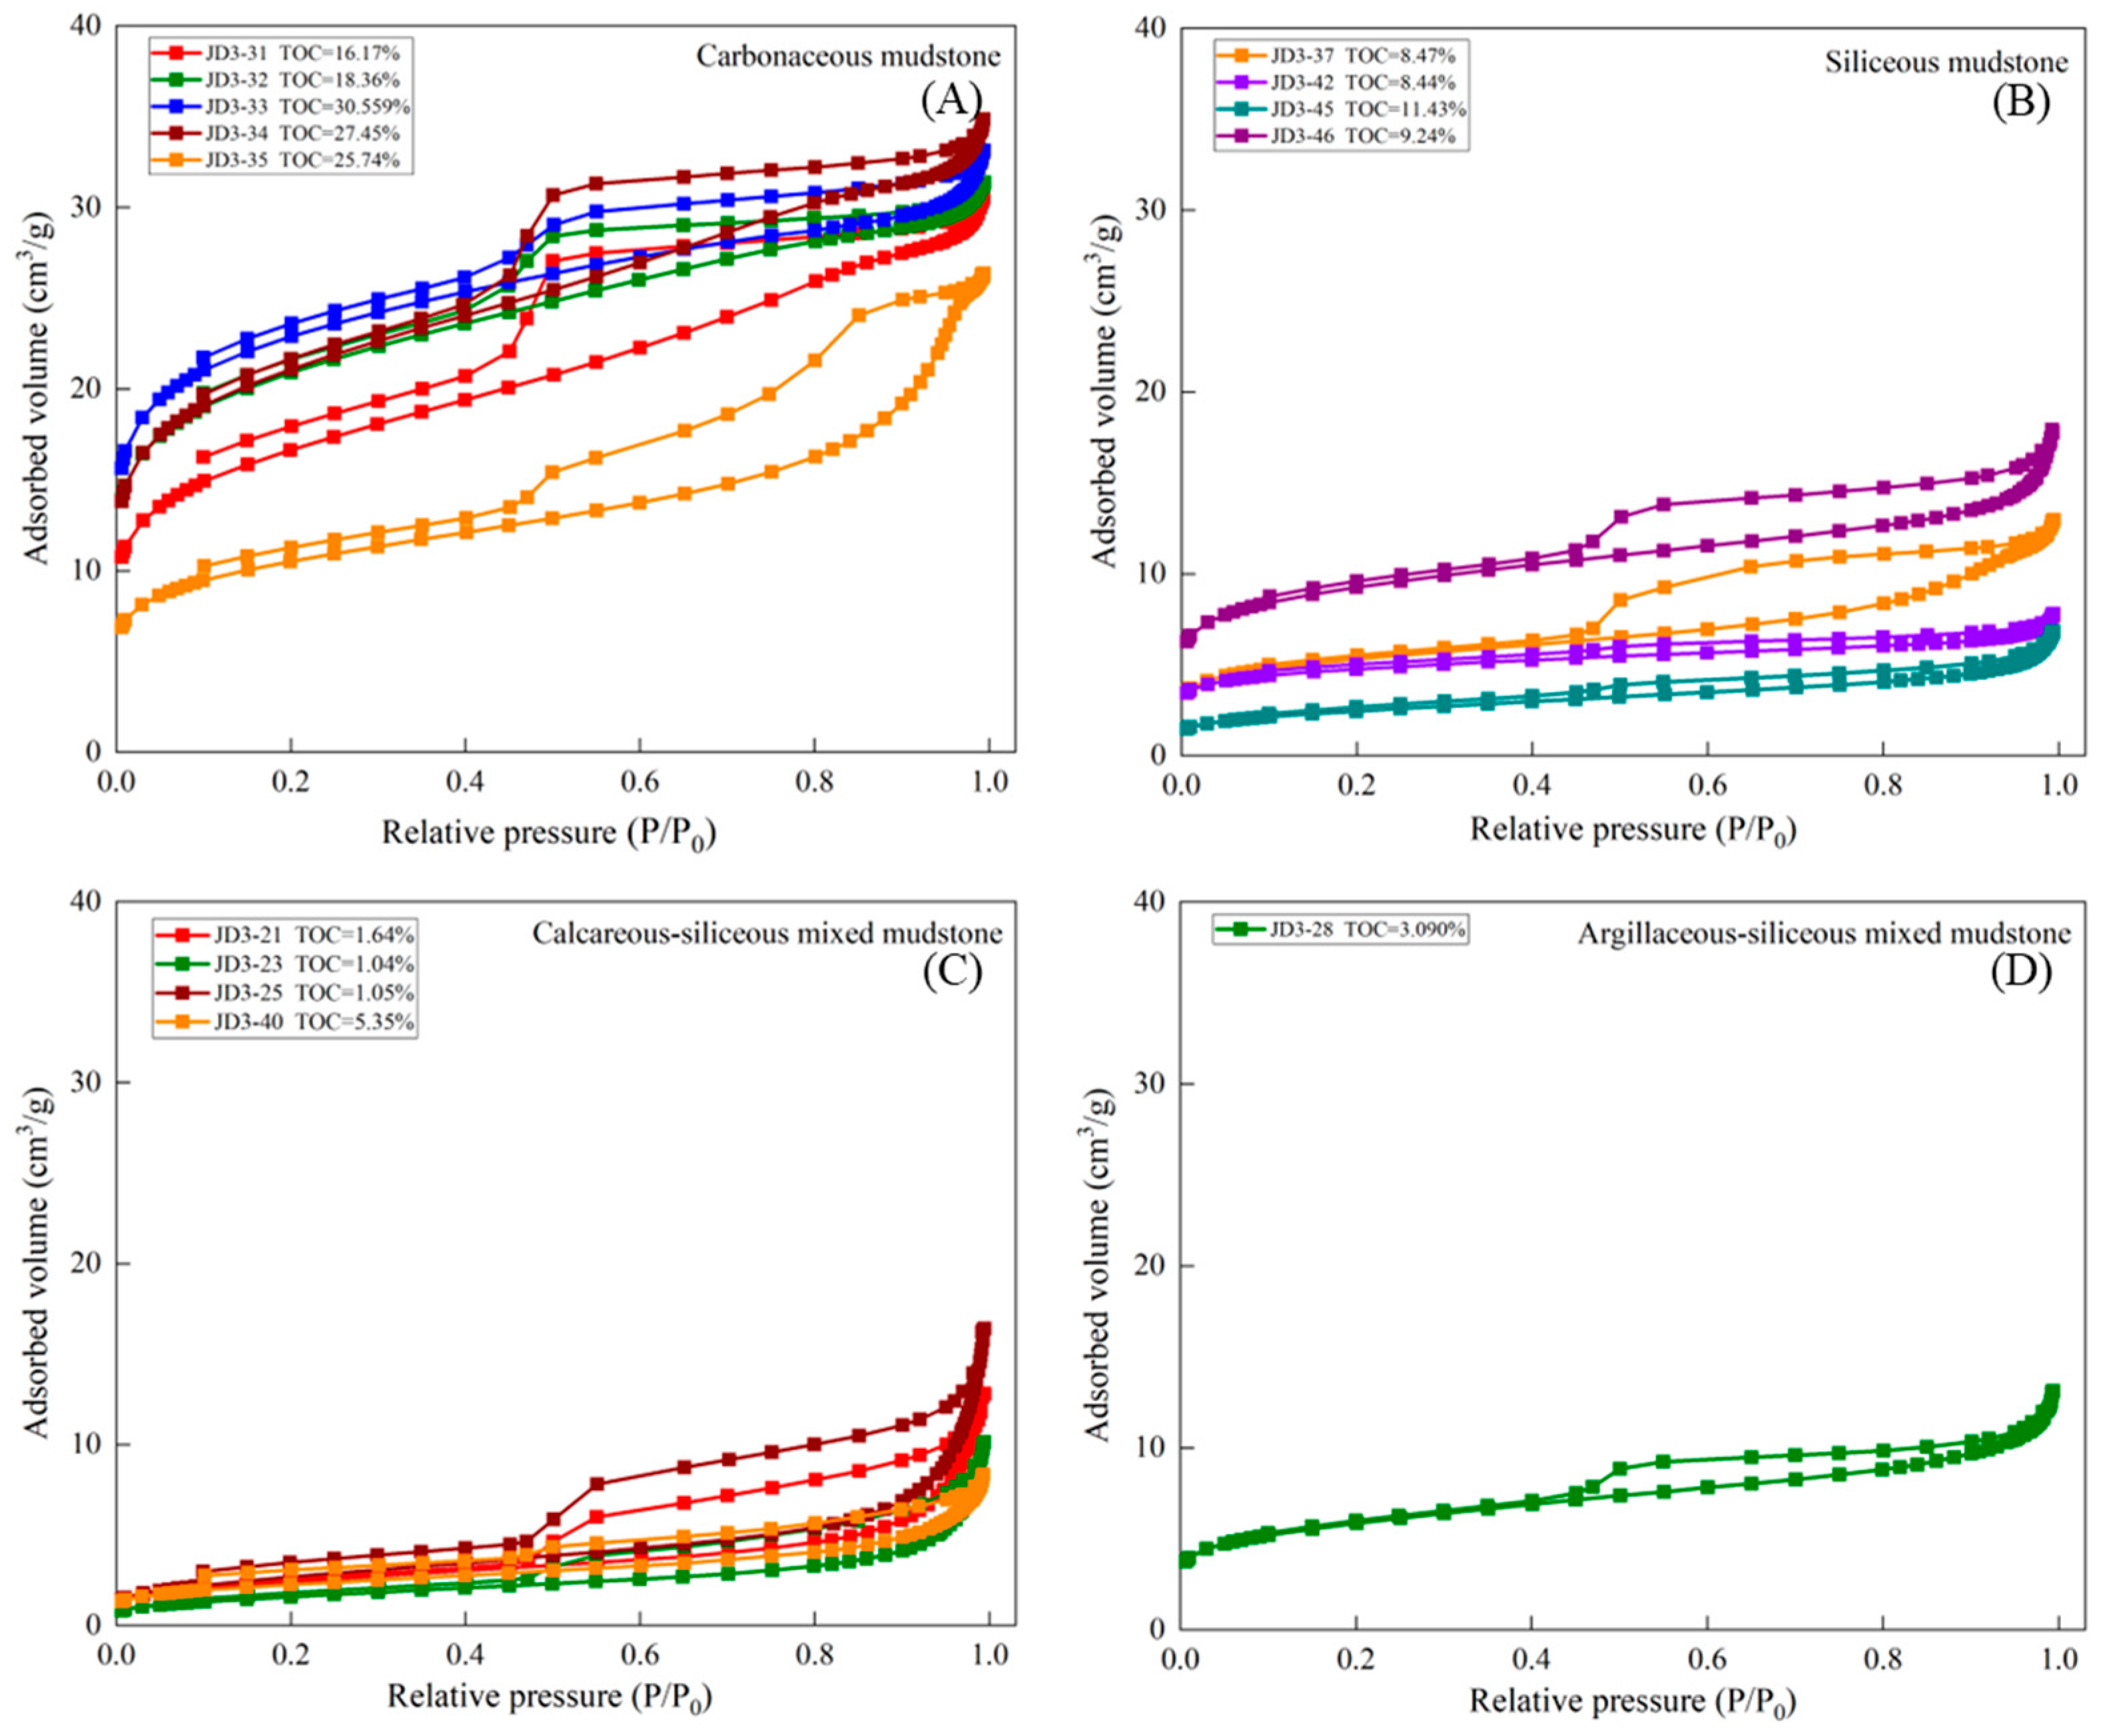
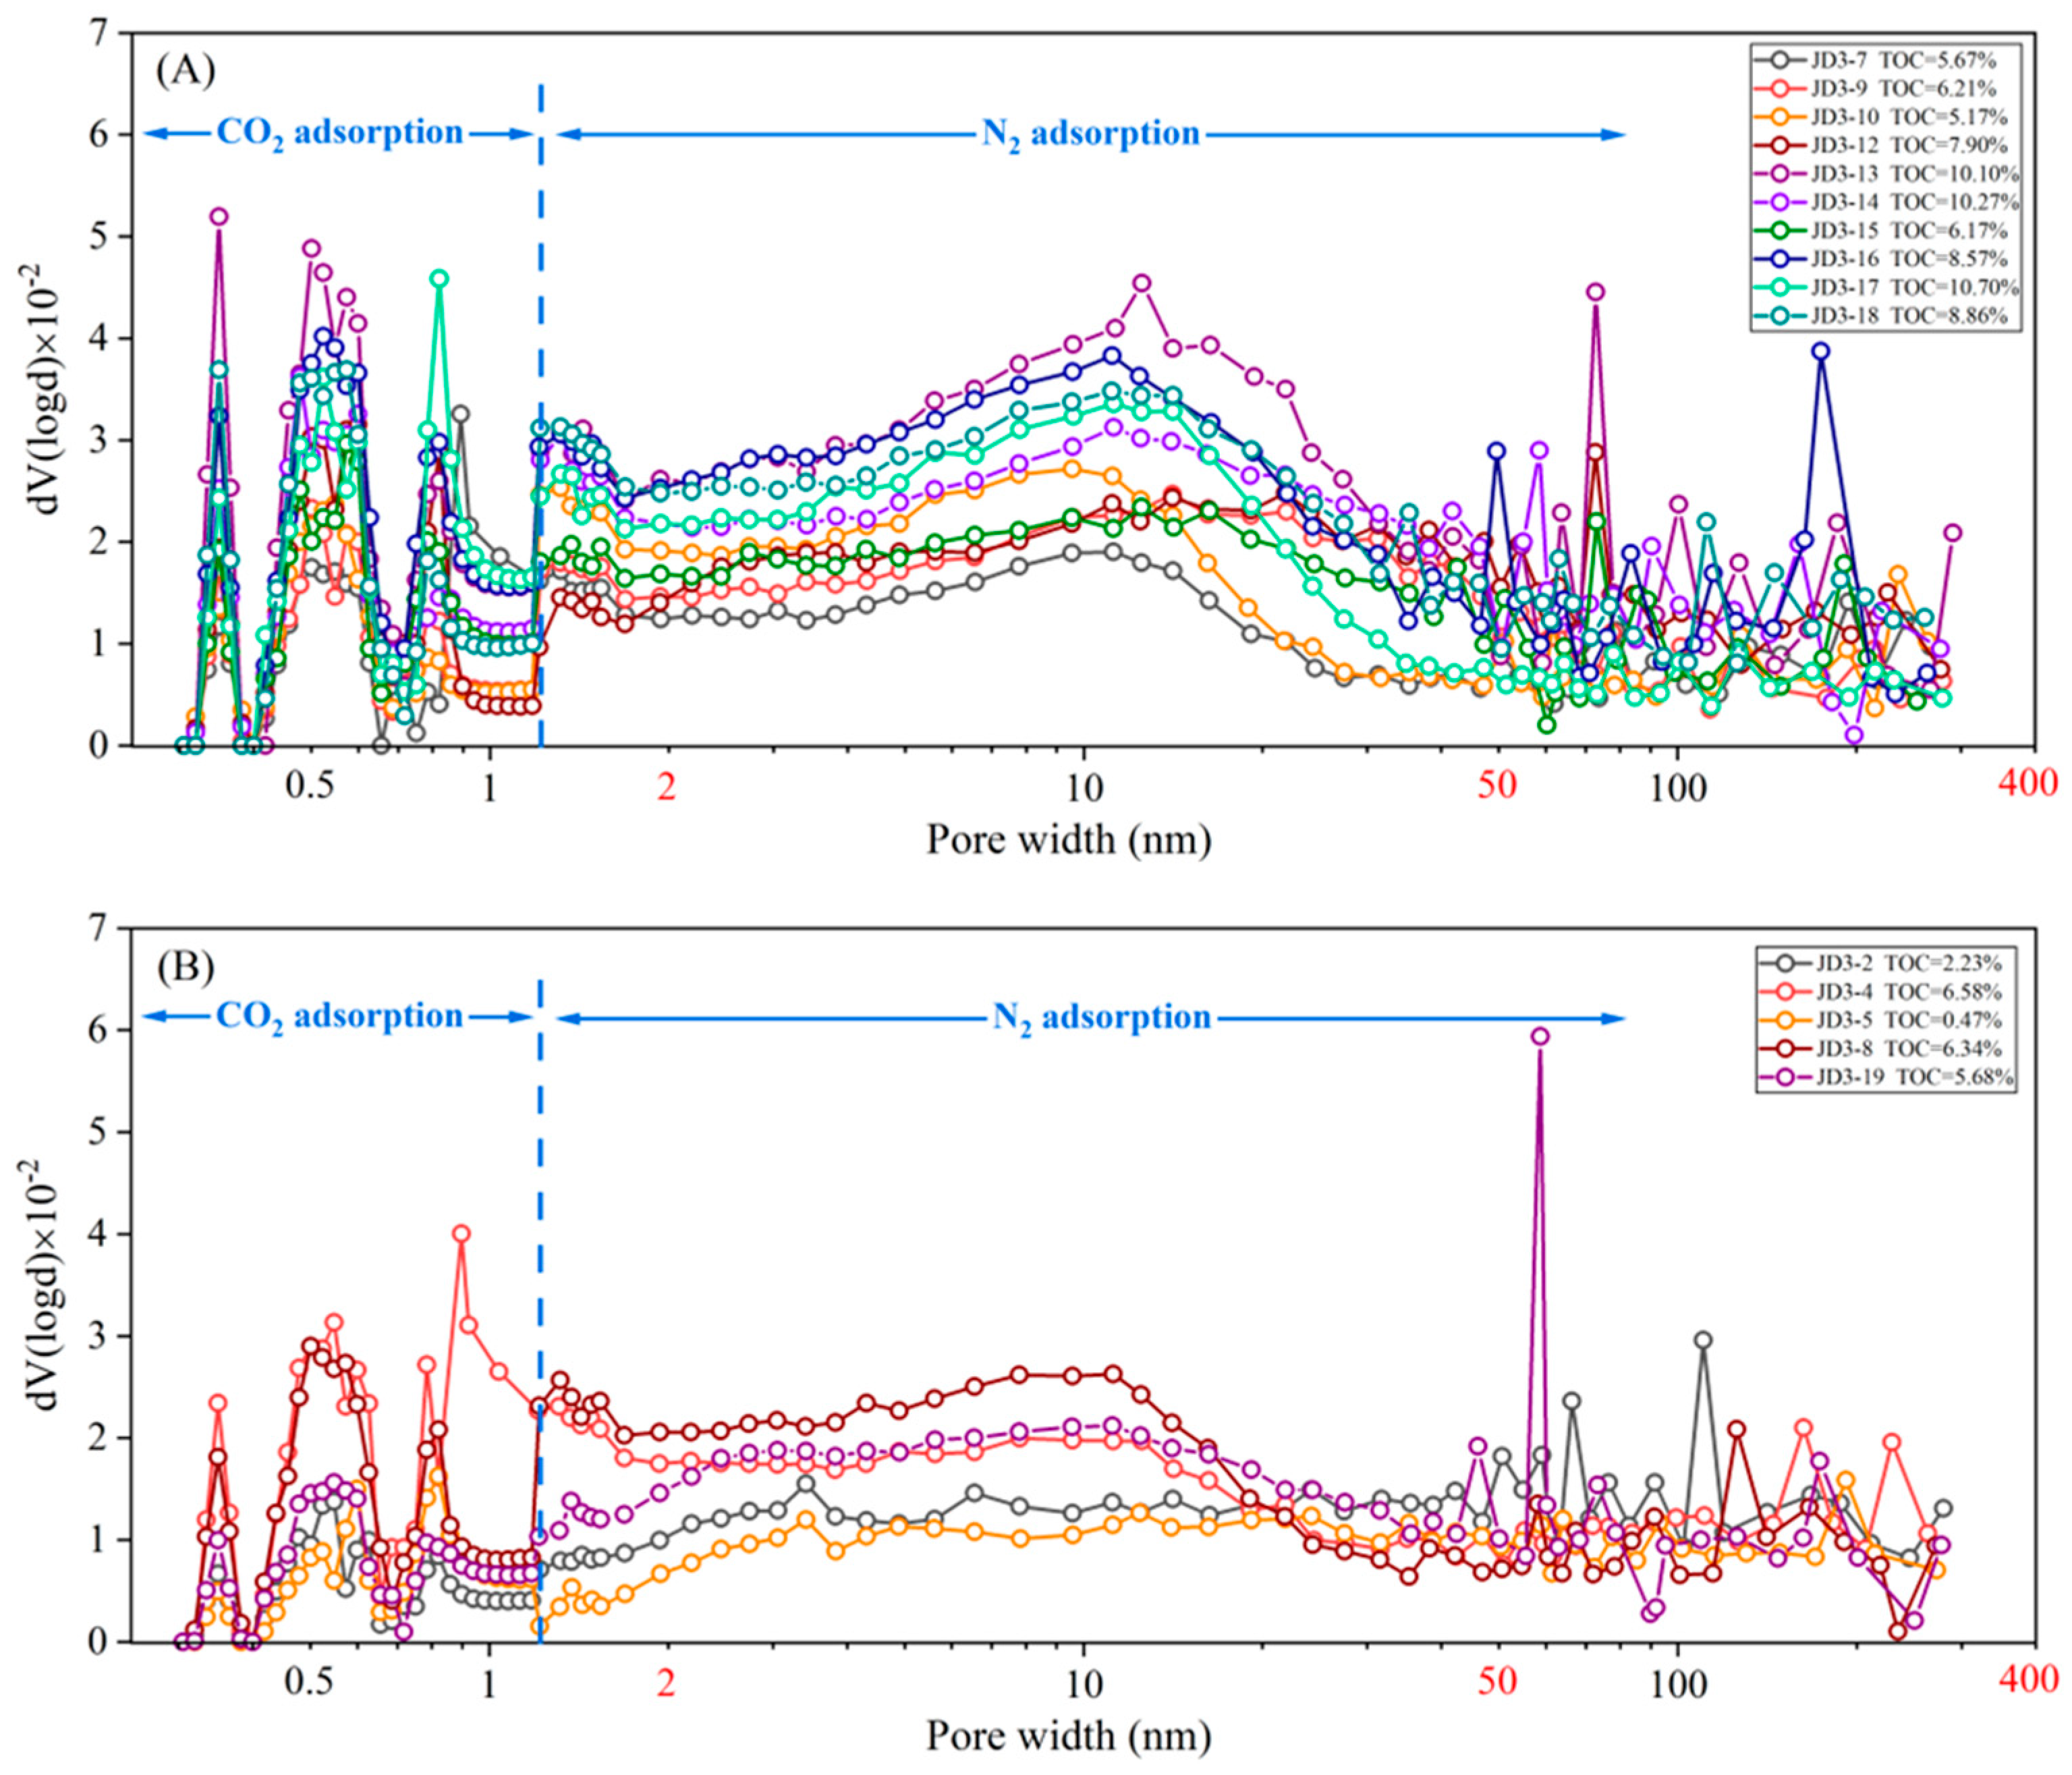
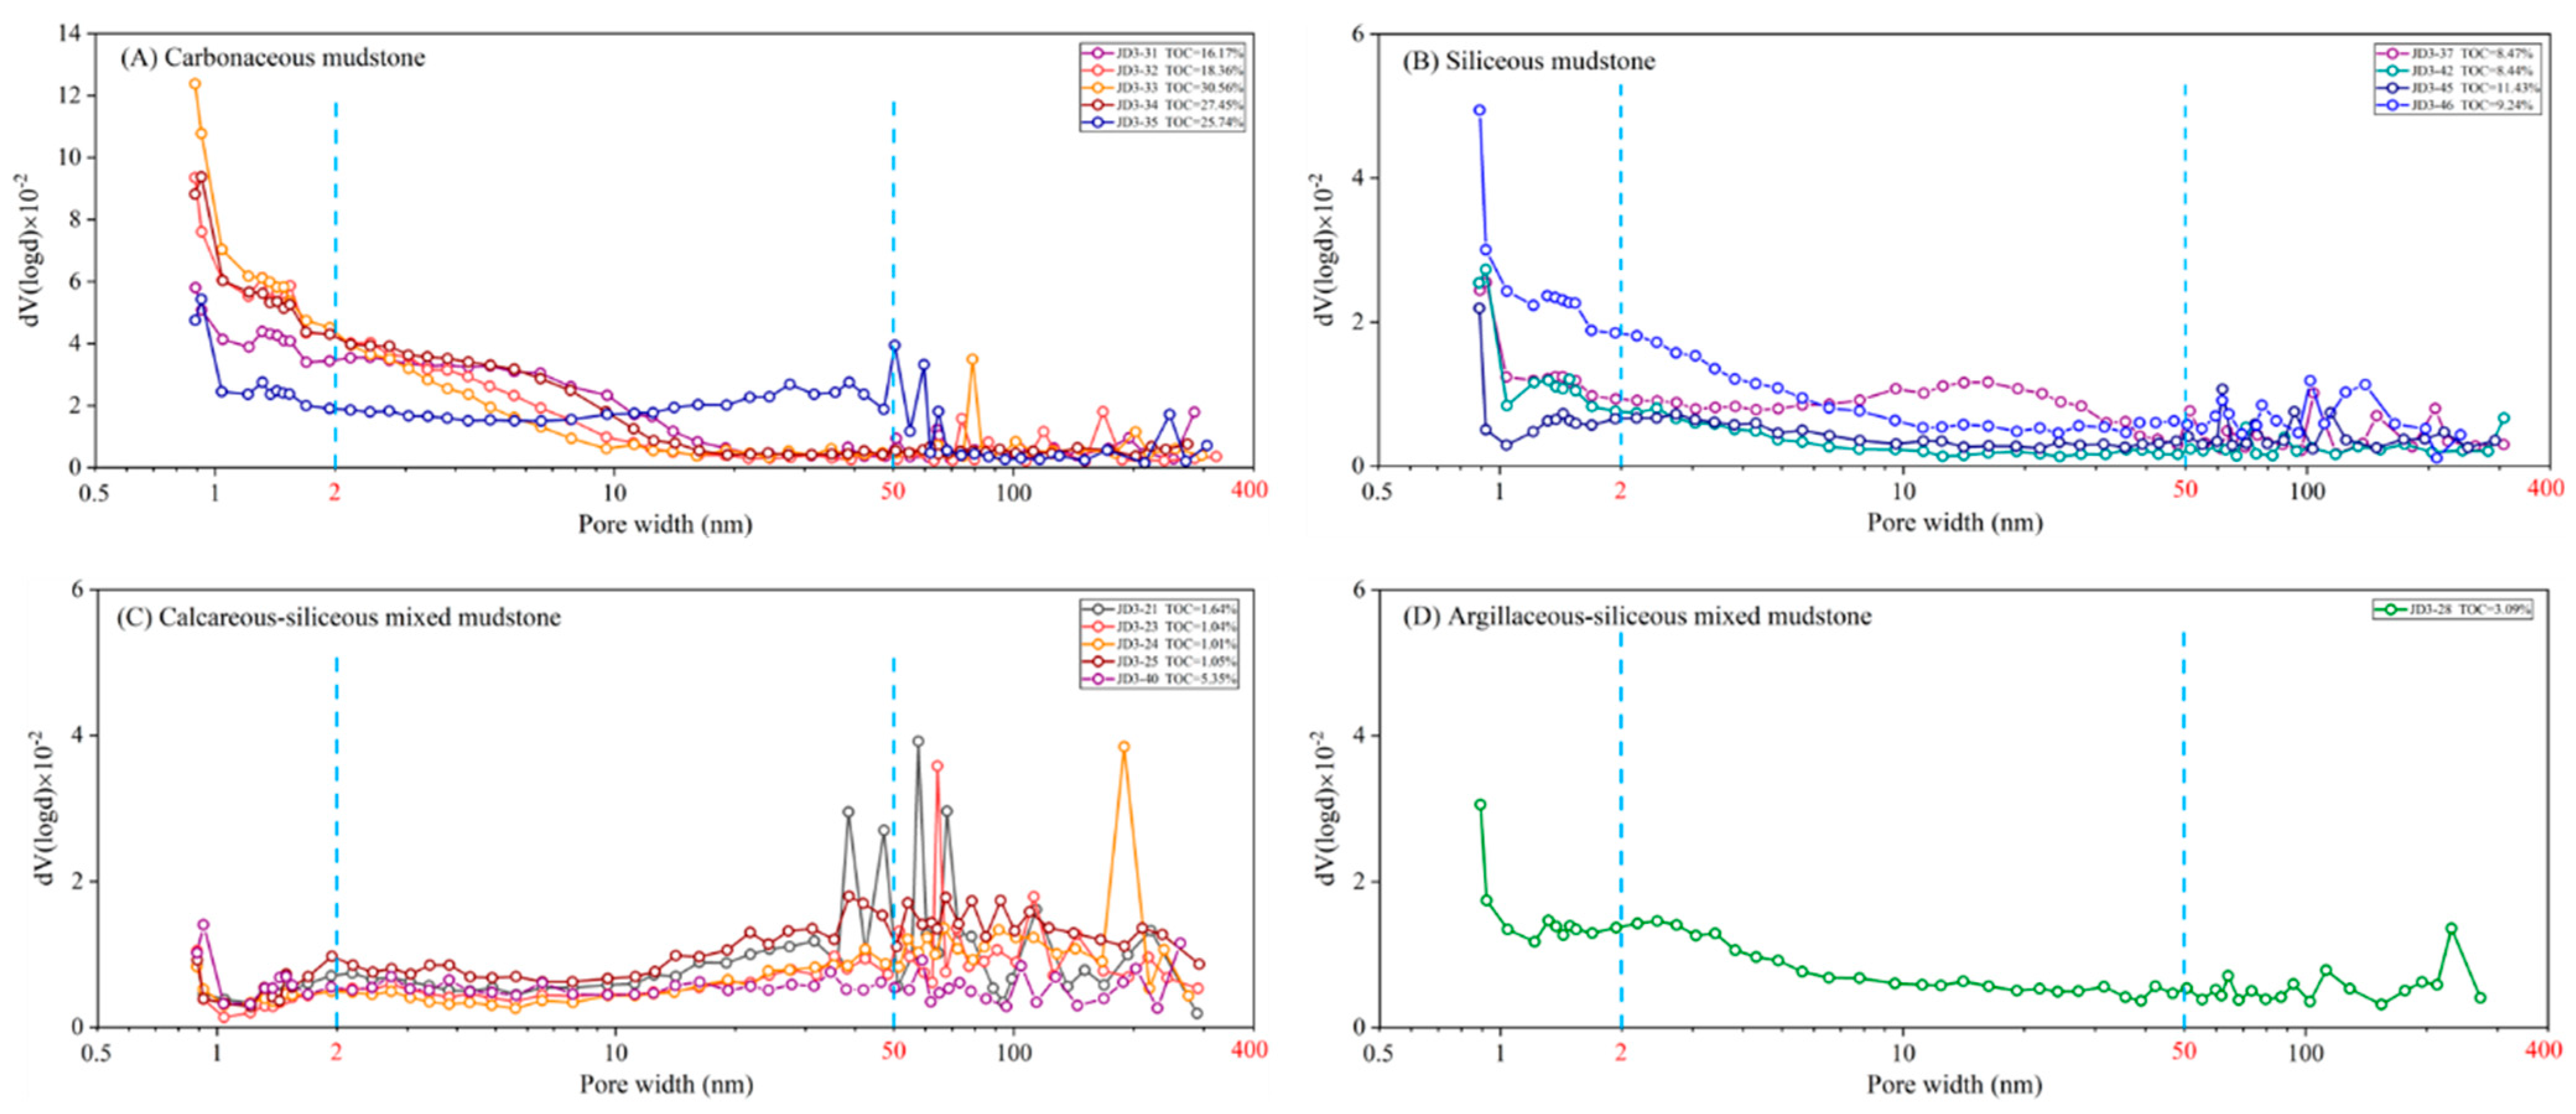
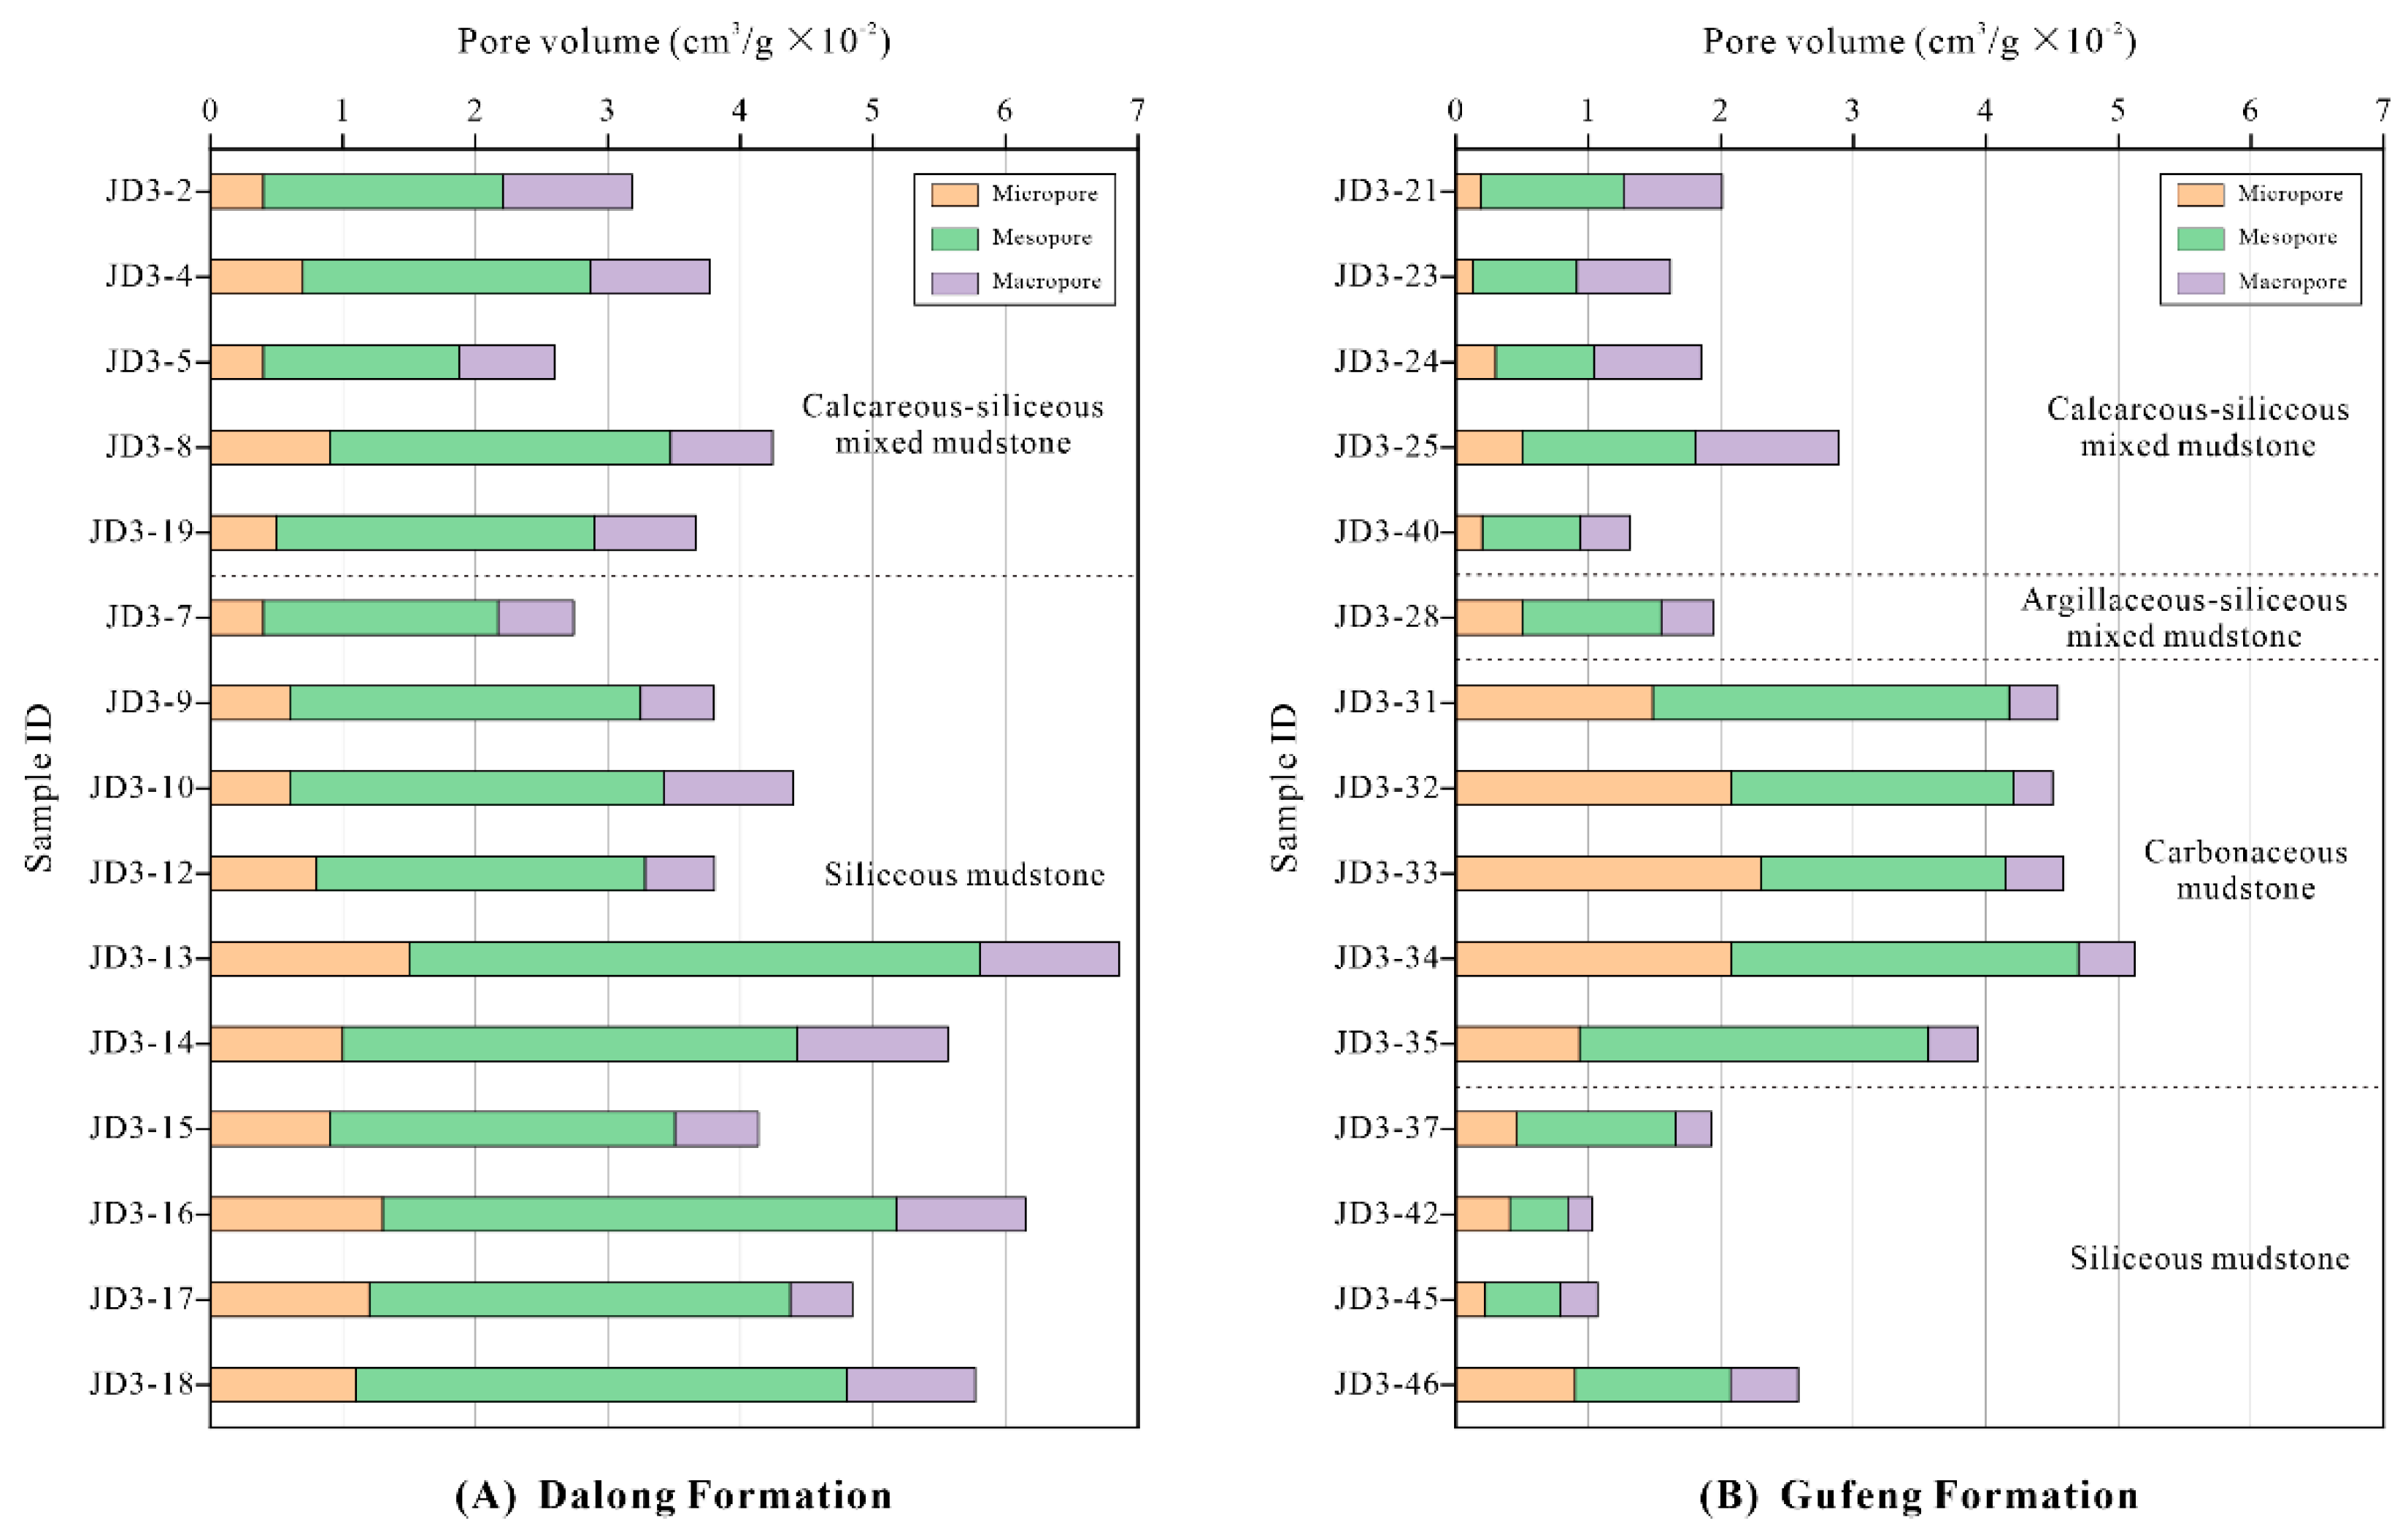
4.4. Pore Structure Parameters Obtained from Gas Adsorption Analysis

According to the IUPAC classification of physisorption isotherms [34] (Thommes et al., 2015), the CO2 adsorption isotherms can be grouped into type I for the Dalong and Gufeng Formations (Figure 10A,B), indicative of micropores development. The hysteresis loops of N2 adsorption isotherms can be classified as type H3 and type H4 (Figure 10C,D and Figure 11), suggesting the predominance of plate-like and slit-like pores. The N2 and CO2 adsorption capacities show significant variations in different lithofacies (Figure 10 and Figure 11). In general, the siliceous mudstone rich in organic matter has a relatively high adsorption volume.
Pore size distributions calculated from the low-pressure N2 and CO2 adsorptions are shown in Figure 12 and Figure 13 and Table 1. The dominant pore diameter ranges show subtle differences between the Dalong and Gufeng Formations. For the Dalong Formation, micropore size distributions based on the DFT model display three volumetric peaks at the pore sizes of approximately 0.35 nm, 0.55 nm, and 0.85 nm for the two mudstone lithofacies (Figure 12). The mesopore and macropore size distributions show slight differences in the siliceous mudstone and calcareous–siliceous mixed mudstone marked by the peaks in the range of 2–30 nm and 2–20 nm, respectively. In comparison with calcareous–siliceous mixed mudstone, the siliceous mudstone generally has a broader size range of mesopore. For the Gufeng Formation, the mesopore and macropore diameter distributions of the calcareous–siliceous mixed mudstone are significantly different from that of the other three lithofacies (Figure 13). Compared with carbonaceous, siliceous, and argillaceous–siliceous mudstones, the pore size for calcareous–siliceous mixed mudstone generally displays few mesopores and relatively more abundant macropores (Figure 13C). The calculated pore size distributions are generally consistent with the SEM observations.
The relative proportion of micro-, meso-, and macropore volumes in total pore volume shows subtle variations in different lithofacies (Figure 14). The siliceous mudstone and carbonaceous mudstone have a high pore volume, and relative contributions of micropores and mesopores to total pore volume in both the Gufeng and Dalong Formations. In contrast, the calcareous–siliceous mixed mudstone is characterized by high mesopores and macropores, the largest contribution to the total pore volume (Figure 14B).

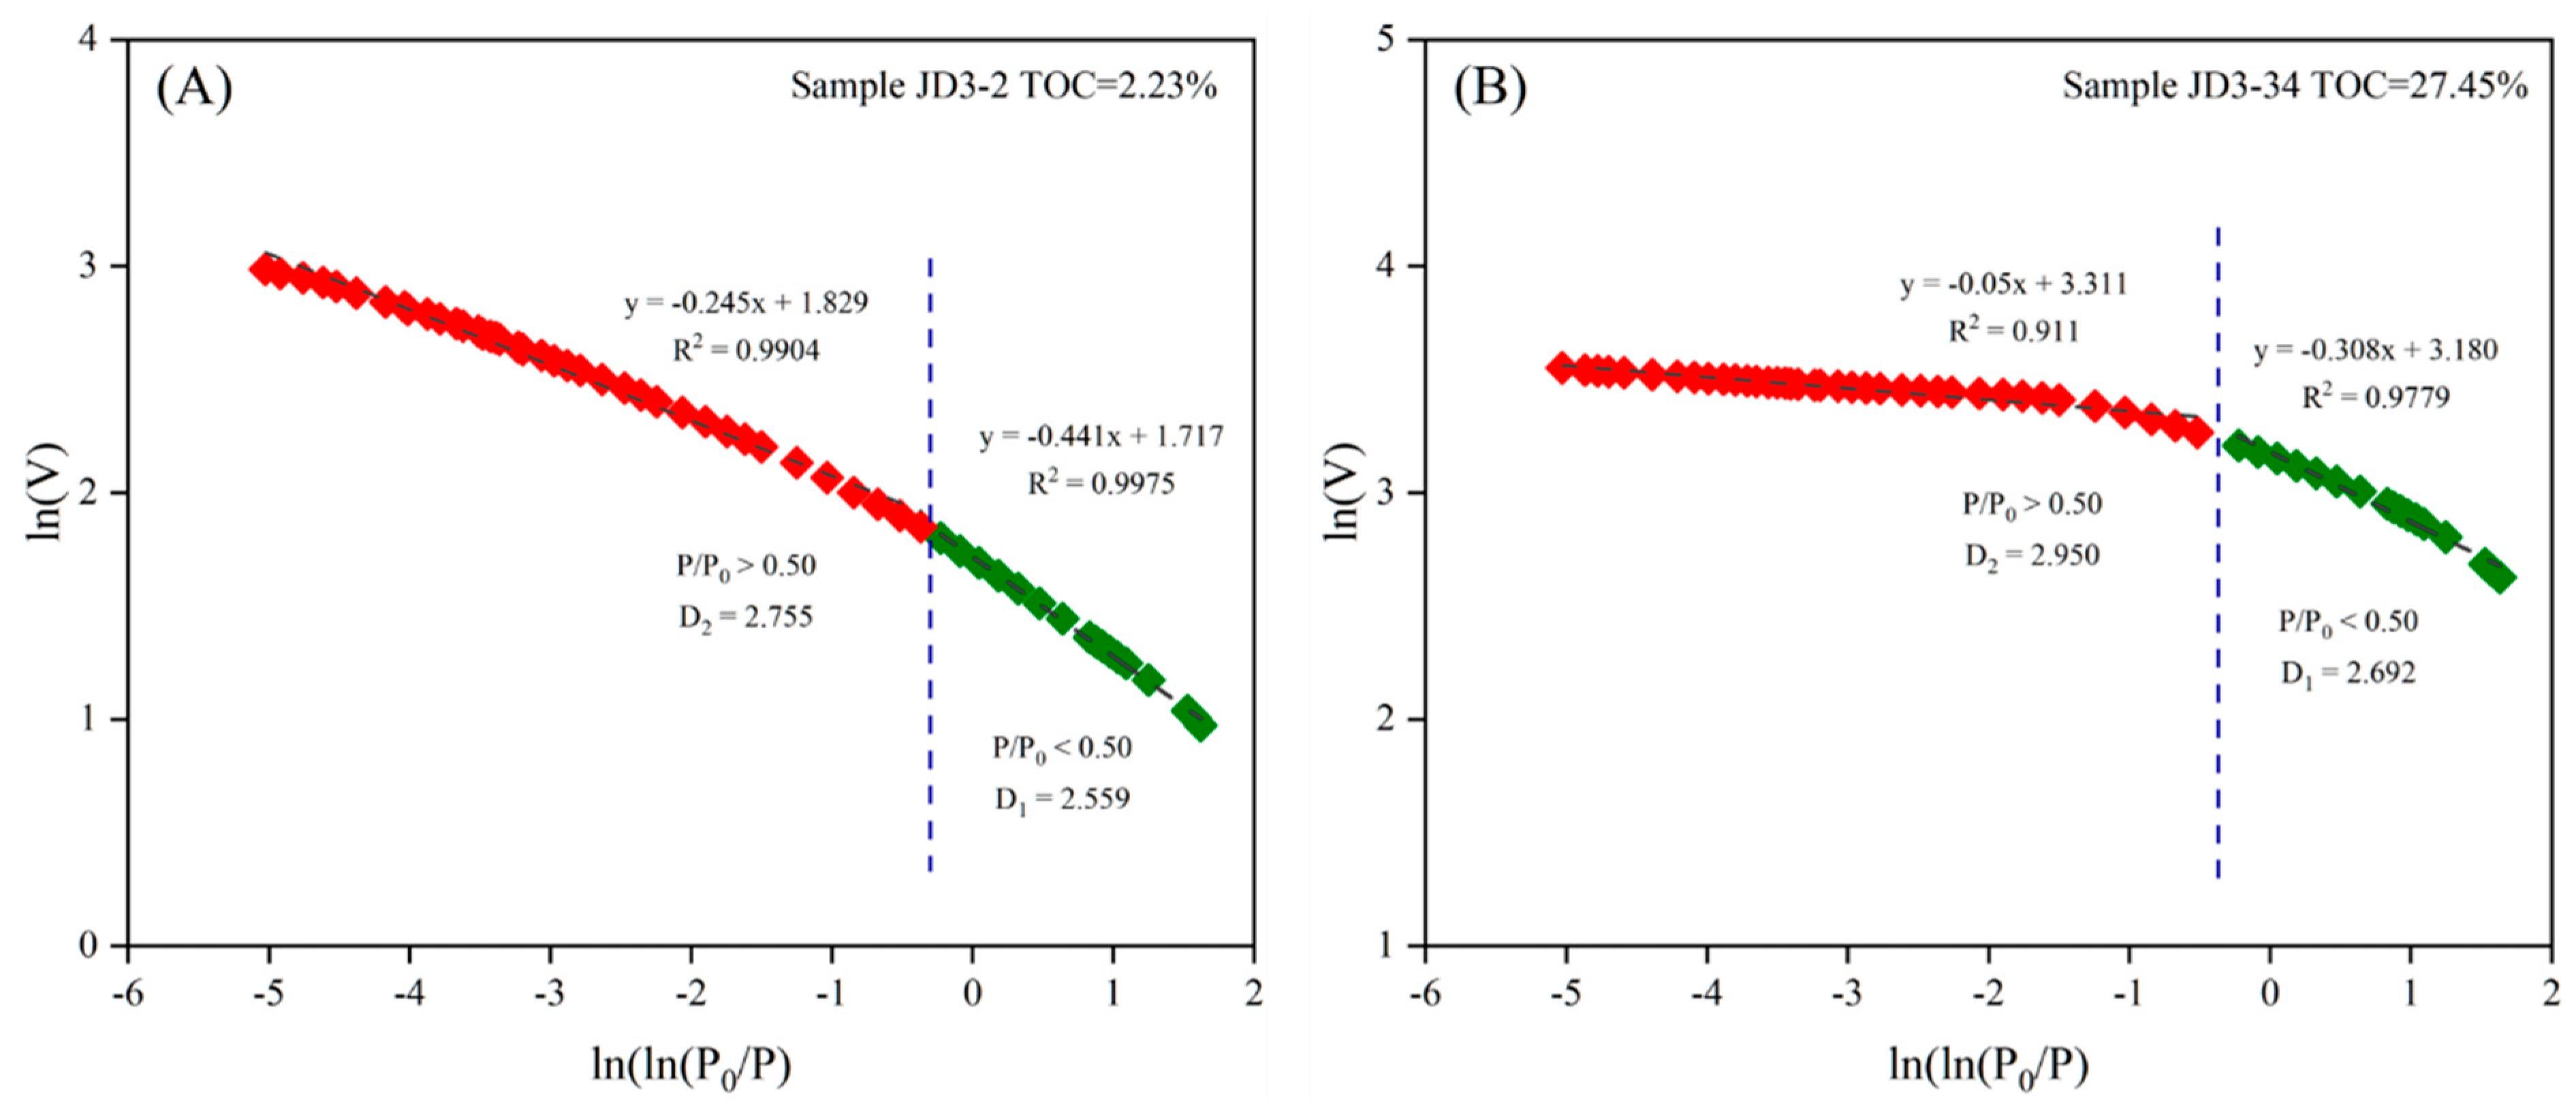
4.5. Fractal Dimensions from N2 Adsorption Isotherms

Fractal dimensions were applied to evaluate the irregularity and complexity of the pore structure, and further assess the adsorption capacity of the shales [35,36]. In this study, fractal dimensions were calculated using the commonly used Frenkel–Halsey–Hill (FHH) model based on the N2 adsorption isotherm data [23,35]. The FHH model can be described by the following equation:
ln V / V 0 = c o n s t a n t + K [ l n ( ln ( P P 0 ) ]
where V is the volume of adsorbed gas volume at the equilibrium pressure P, V0 is the monolayer coverage volume, P0 represents the saturation pressure, and K is a constant associated with the fractal dimension (D) and can be calculated by the slope of the plot of ln (V) versus ln (ln(P/P0)). The fractal dimension (D) can then be obtained by the following equation: D = K + 3 [23,34,35].
In our samples, the plots of ln (V) vs. ln [ln (P0/P)] show two distinct linear segments and display a good correlation at the relative pressures of 0–0.5 and 0.5–1 (Figure 15; Table 2). Two fractal dimensions are calculated in this study: D1 calculated from the isotherm data at the relative pressure of 0–0.5, and D2 calculated from the isotherm data at the relative pressure of 0.5–1.
For the Dalong Formation, the D1 values range from 2.489 to 2.673 (average = 2.604), and the D2 values range from 2.737 to 2.859 (average = 2.8129) (Table 2), suggesting a more complex pore surface at the relatively large pore sizes. The D1 and D2 values generally have a relatively high value in the lower part of the Dalong Formation. For the Gufeng Formation, the D1 values range from 2.493 to 2.772 (average = 2.644), and the D2 values range from 2.658 to 2.963 (average = 2.831) (Table 2).

5. Discussion

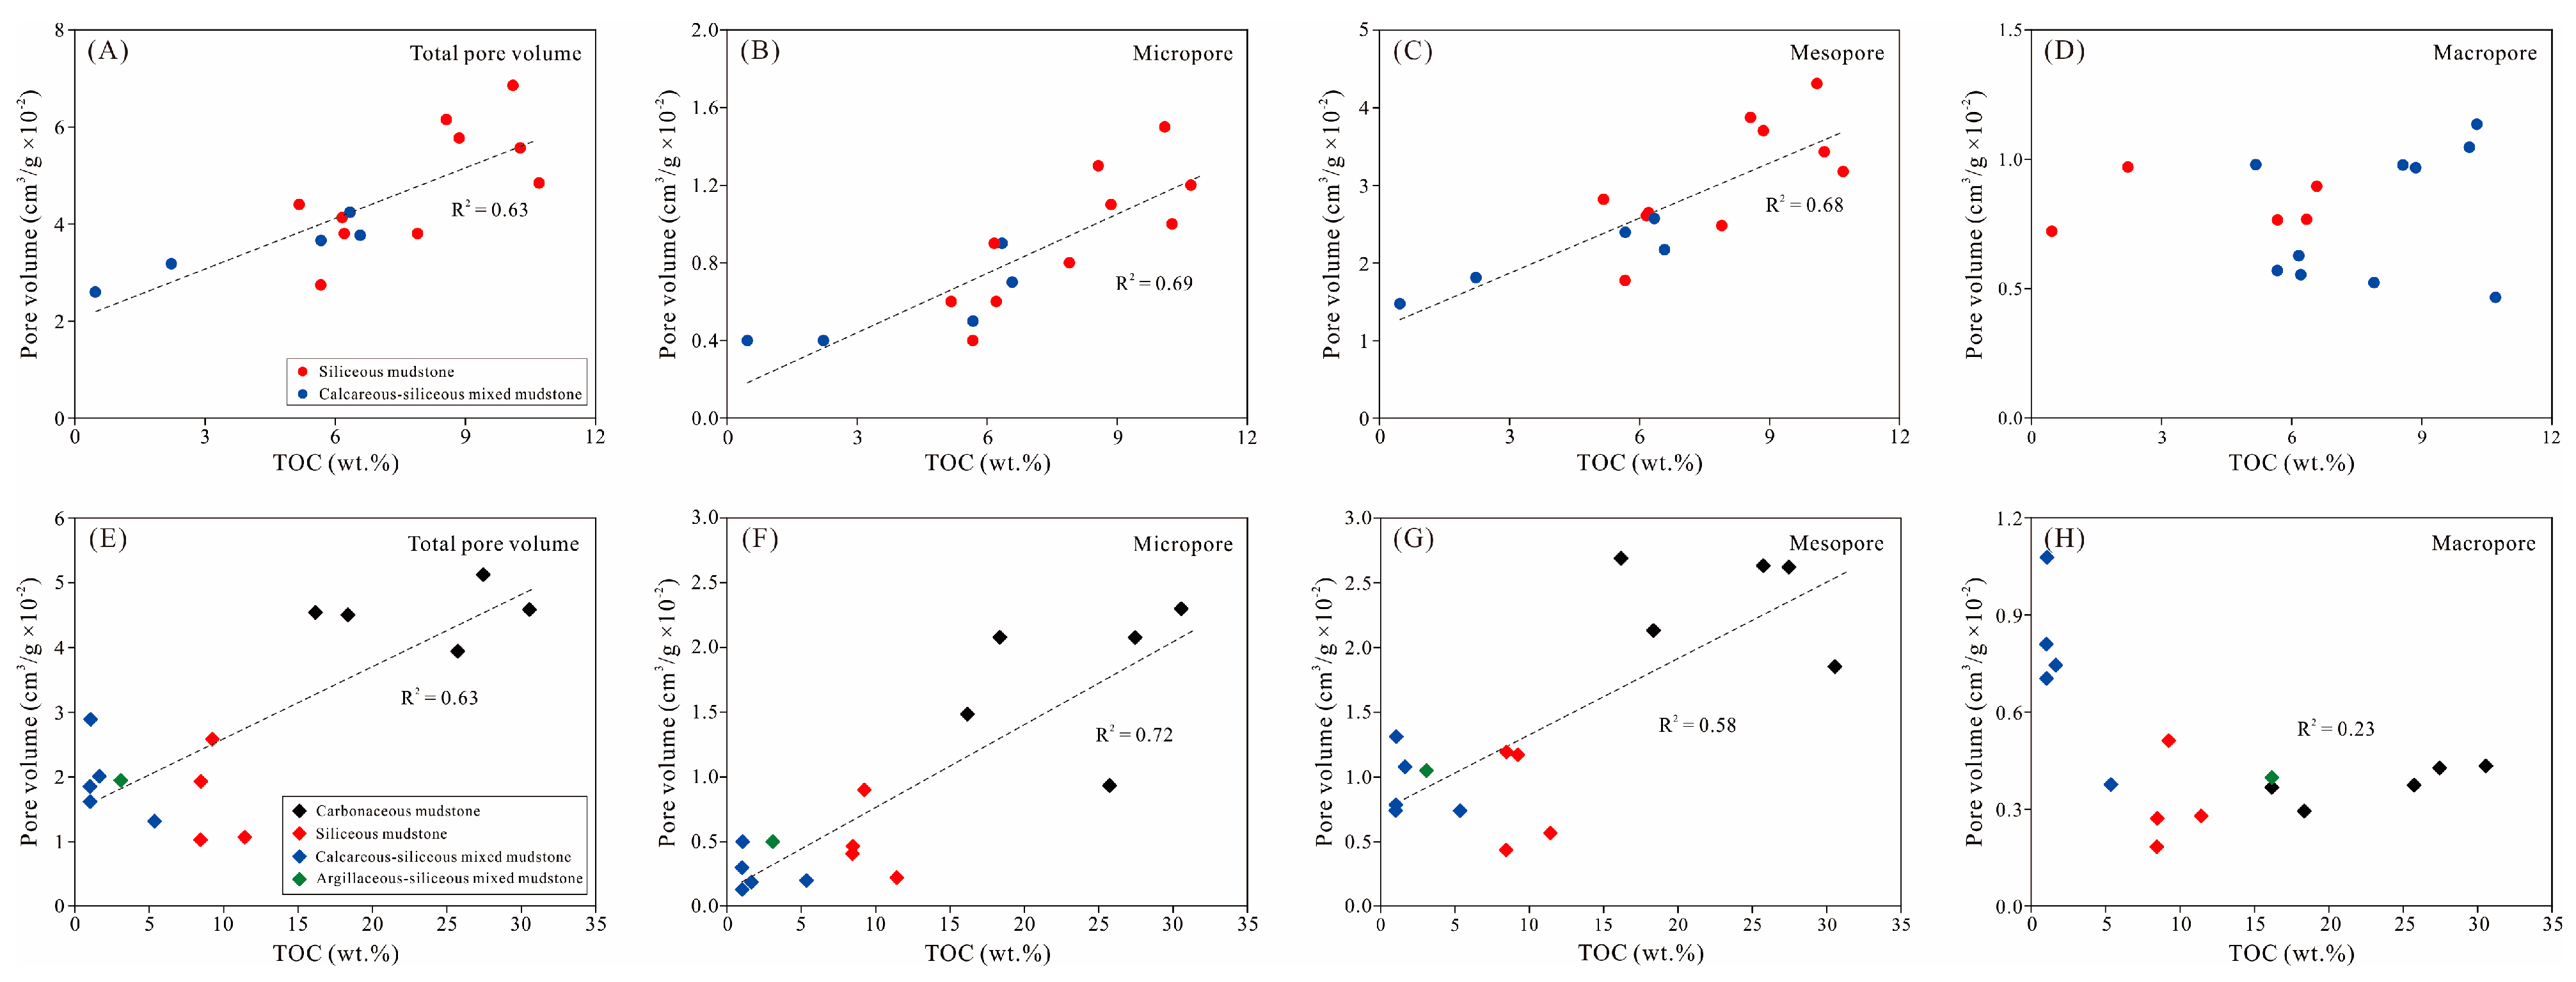
5.1. The Influence of OM on Pore Structure

The secondary OM pores are considered a significant component of pore systems in overmature marine-facies shale reservoirs [8,9,11,37,38] The organic porosity development in mudstone or shale is the combined effect of many factors, including the thermal maturity [9,11,39], initial kerogen type (organic macerals) [13,40], TOC contents [7,8], and diagenetic alterations [37,41,42,43].
In this study, the thermal maturation levels in the Dalong and Gufeng Formations generally reach the dry gas window, with a vitrinite reflectance (Ro) of >2.0% in the study area [44]. OM-hosted pores are present as nanometer-sized spongy pores and show substantial heterogeneity in different OM macerals (Figure 7D–F, Figure 9 and Figure 16). The major OM components are solid bitumen, vitrinite, alginate, and minor zooclast macerals in the Dalong and Gufeng Formations (Figure 4, Figure 6 and Figure 16). The different organic macerals show different hydrocarbon generation potentials, leading to notable discrepancies in OM pore development [9,45]. SEM images reveal that OM pores are generally limited to pores developed within post-oil solid bitumen (pyrobitumen) void-fillings (Figure 7D–F and Figure 9D–F). In contrast, some macerals (i.e., vitrinite, inertinite) show only a rare development of sponge-like pores even at dry gas window maturity (Figure 9C), although contributing to total organic carbon (TOC) content.
The moderate positive correlations between TOC content and total pore volume are found in both the Dalong and Gufeng Formations (Figure 17A,E), indicating the important control of OM content on total porosity in these two shale successions. Specifically, the OM-hosed pores are likely dominated by micropores and mesopores in both two sets of shales, as suggested by the positive relationships between micropore, mesopore, and TOC content, along with the insignificant correlation between macropore and TOC content (Figure 17). This result is verified by the SEM observations where OM pores occur primarily as micropores and mesopores (Figure 7D–F and Figure 9D–F). The positive relationships between OM content and total pore volume demonstrate that higher TOC content samples generally have greater total pore volume. However, the organic matter in the highest TOC samples (carbonaceous mudstone) contains rare nanometer-sized spongy pores (Figure 9A–C and Figure 16C,D). The absence of organic pores in the highest TOC samples is probably caused by enhanced compaction resulting from the high volume of ductile OM relative to rigid matrix minerals, and limited thermal transformation into liquid hydrocarbons of some macerals.

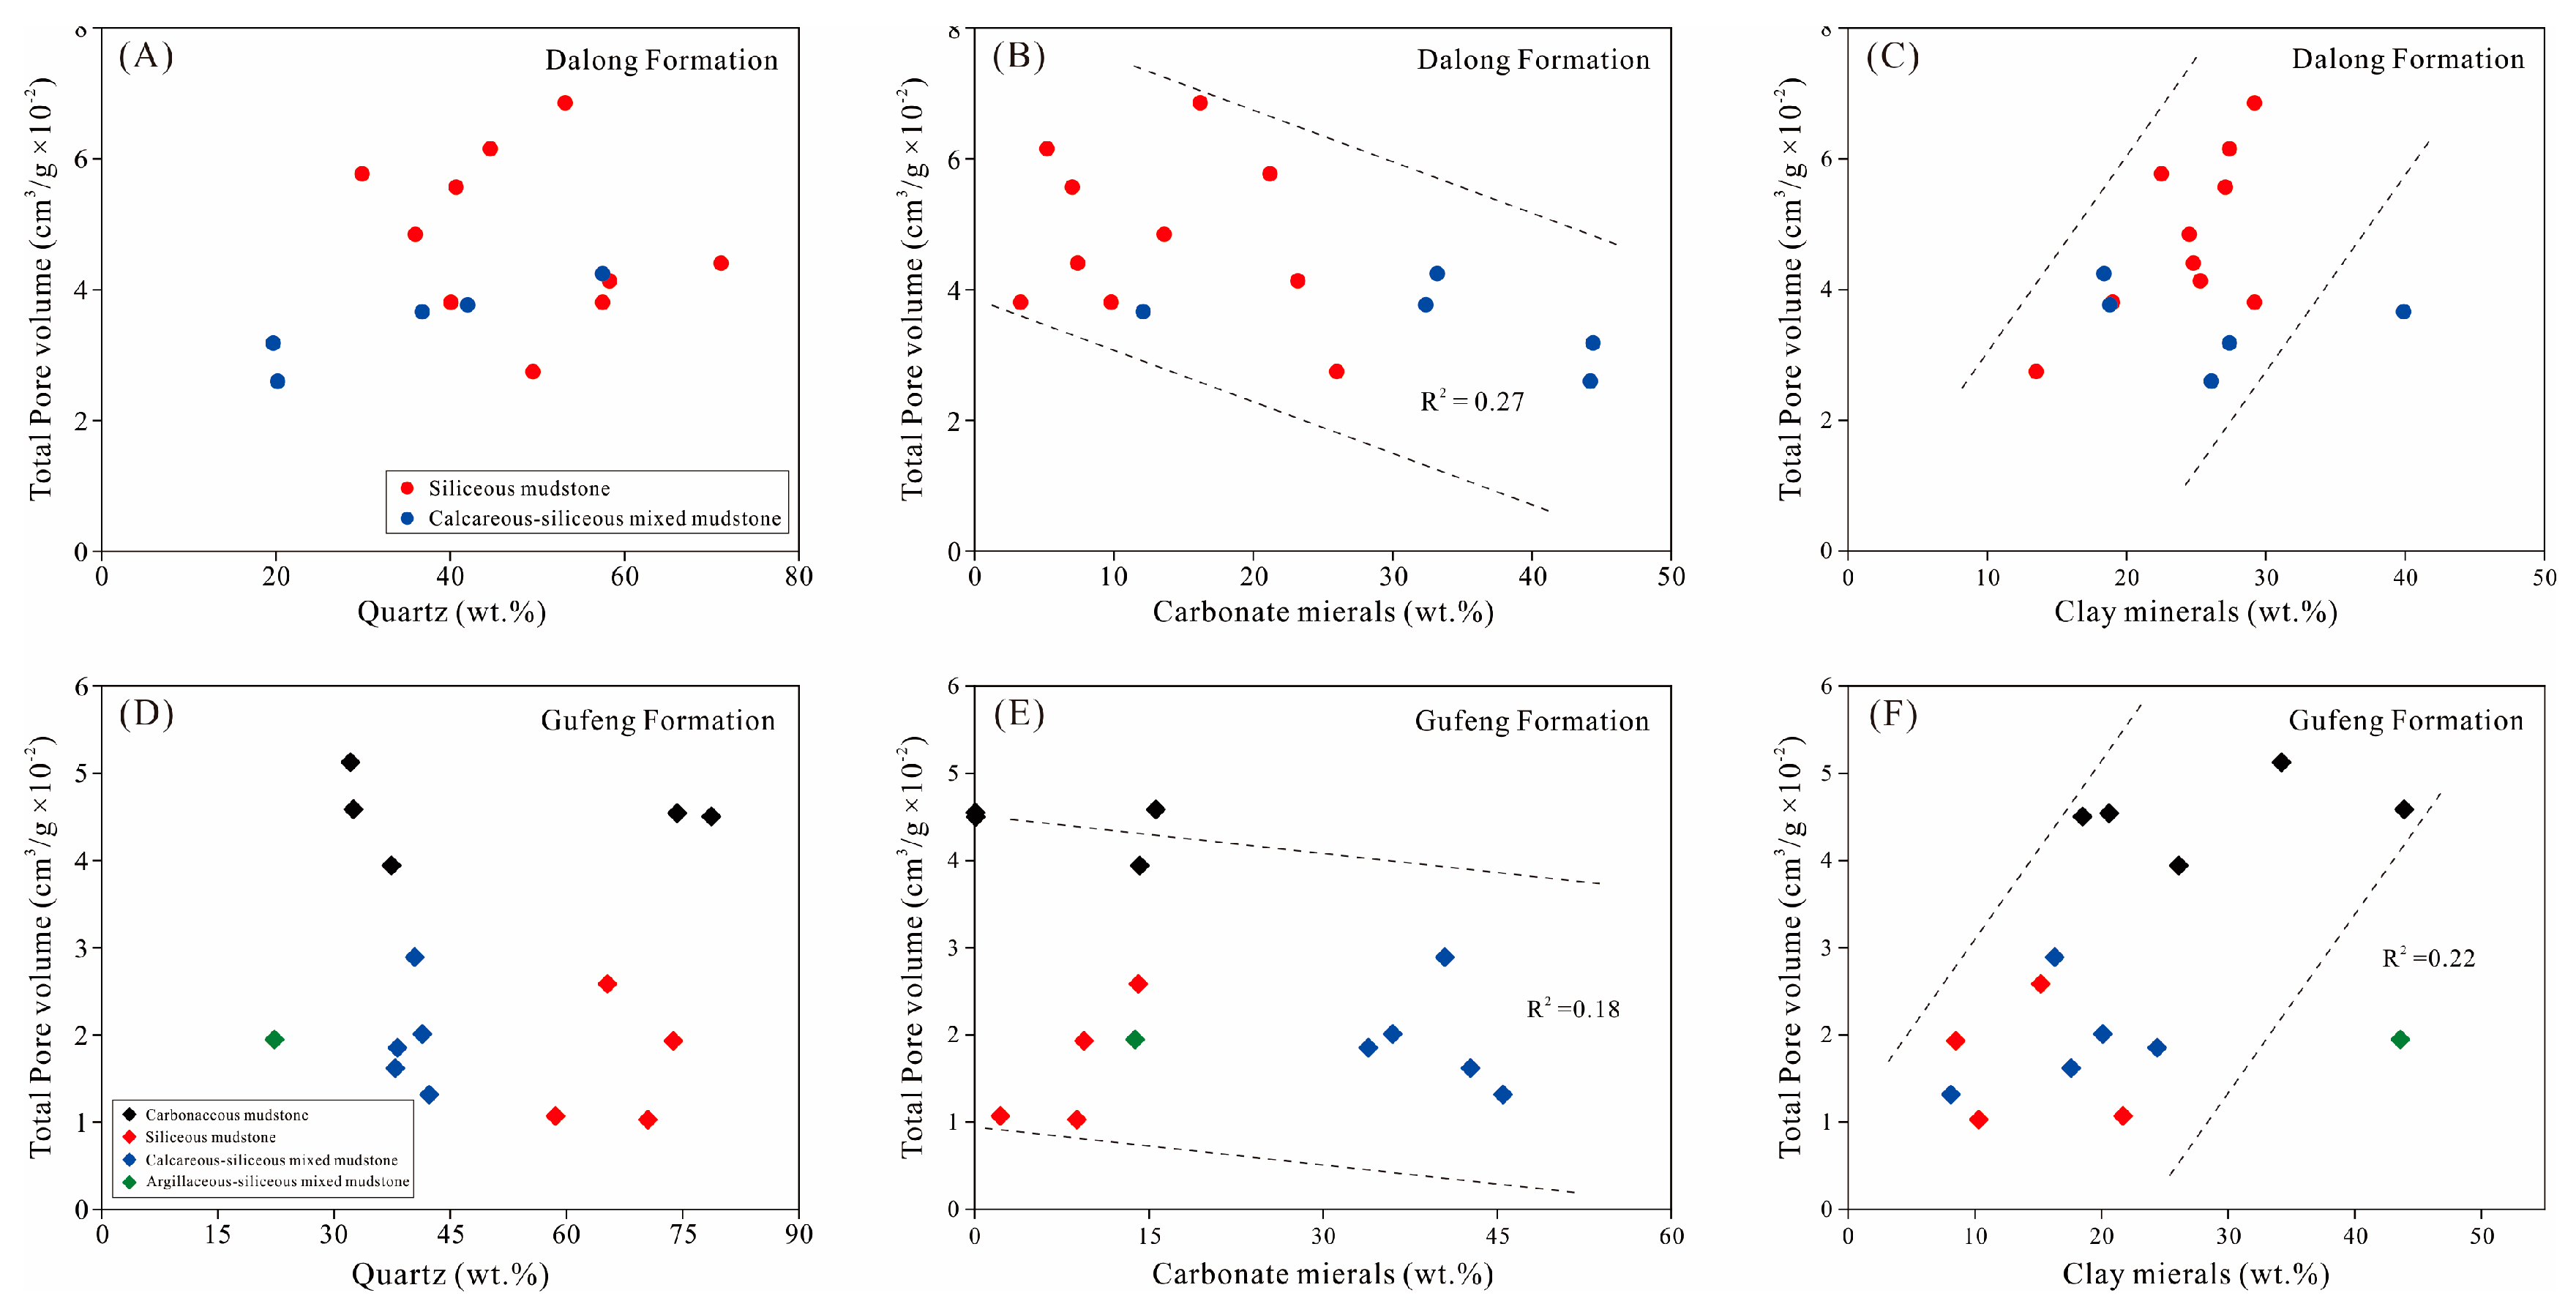
5.2. The Control of Mineralogy on Pore Structure

In addition to OM type and content, the pore development is also controlled by major mineralogical compositions (quartz, carbonate, and clay minerals) in our sample sets. The correlation between major components and total pore volume indicates that clay and carbonate minerals exert the dominant control on total porosity in the Dalong and Gufeng Formations (Figure 18). For the Dalong Formation, there is a weakly positive relationship between total pore volume and quartz content (Figure 18A), suggesting the possible positive effect of quartz content on total porosity. For the Gufeng Formation, however, no relationships were observed between pore volume and quartz content (Figure 18D), or between total pore volume and biogenic SiO2 (the correlation coefficient R2 = 0.084), suggesting that quartz contents have no impact on the pore system, although there are abundant siliceous fossil fragments and a high excess of SiO2 content. This result appears to be in conflict with the accelerative effect of biogenic silica on total porosity in many siliceous shales [16,38,46,47,48]. However, the extremely biogenic silica-rich mudstones (almost close to chert beds) may display low porosity due to strong cementation [49,50], which may explain why some high-silica samples (SiO2 content >70 wt.%) have a low total pore volume in the Gufeng Formation (Figure 18D).
Although dissolution pores within carbonate minerals were observed in some samples, these pores are not a dominant fraction of the pore system. Negative correlations between total pore volume and carbonate content were observed in both the Dalong and Gufeng Formations (Figure 18B,D), suggesting that carbonate minerals have a negative effect on total porosity. Previous studies reported similar negative correlations between total porosity and carbonate content [38,40,43], largely due to carbonate cementation. The adverse impact of carbonate content on total porosity can be further verified by the SEM observations, where carbonate minerals occur primarily as calcite and dolomite cements filling primary interparticle pores (Figure 8C,D).
Clay minerals in shales can develop slit-like pores between clay flakes, which makes a significant contribution to the total porosity [16,40,43,49]. However, shale samples containing extremely high ductile clay minerals generally undergo strong compaction and display low porosity, leading to the presence of a negative correlation between clay content and porosity [19,50]. Therefore, the relationship between clay content and total porosity can be complicated due to the two diverse effects mentioned above. Total pore volume has a weak positive correlation to clay minerals in the Dalong and Gufeng Formations (Figure 18C,F). This is consistent with SEM observations where abundant silt-like pores were observed between clay sheets (Figure 7C and Figure 8D–F), indicating the significant contribution of clay-associated pores on the total porosity.

5.3. Relationships between Fractal Dimensions and Pore Structure Parameters

The fractal dimension can be applied to evaluate the complexity and irregularity of pore structure. The relationship between the fractal dimensions (D1, D2) and the pore volume of the shale samples is illustrated in Figure 19. For the Dalong Formation, a good correlation is found between micropore volume, mesopore volume, and fractal dimensions, indicating that micropores and mesopores tend to be more complex and heterogeneous. The development of abundant nanometer-sized OM-hosted pores is likely responsible for the high complexity of the micropores and mesopores.
For the Gufeng Formation, the relationships between fractal dimensions (D1, D2) and pore volume show similar patterns (Figure 19D–F). The positive correlations between fractal dimensions (D1, D2) and micropore volume, along with mesopore volume suggest that shale samples with more abundant micropores and mesopores generally have a larger fractal dimension. This is interpreted as being because the micropores and mesopores are dominated by OM pores and partial silt-like InterP pores. Furthermore, the positive correlation coefficient between fractal dimension and pore volume for micropores (R2 = 0.51) is higher than that for mesopores (R2 = 0.33) (Figure 19D), suggesting that micropores are the primary cause of irregularity and heterogeneity in pore structure in our shale sample sets. In contrast, fractal dimensions (D1, D2) are negatively related to macropore volume (Figure 19F), indicating that pores with relatively large sizes have a decreasing irregularity in pore structure.

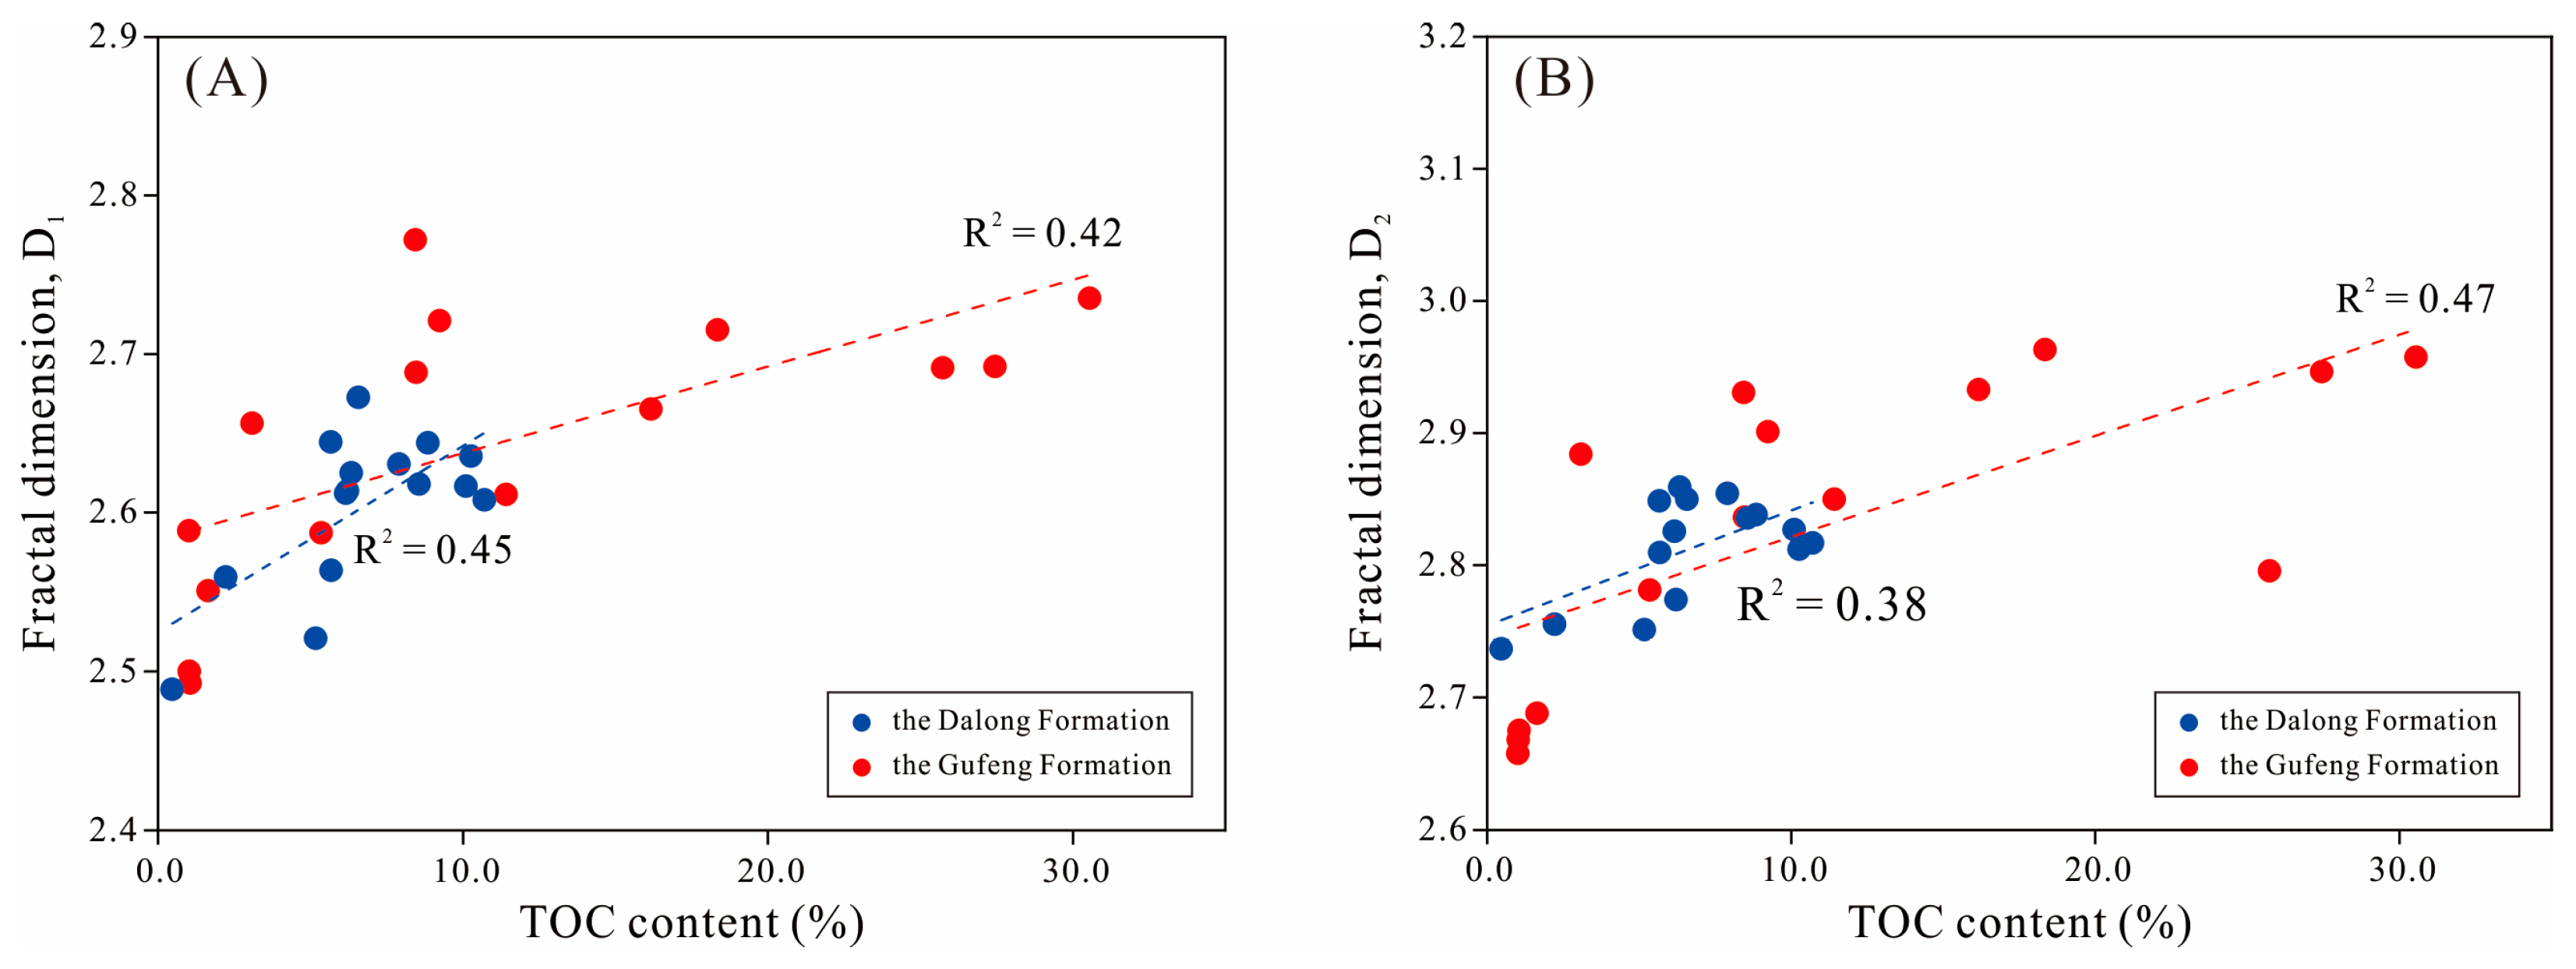
5.4. Relationships between Fractal Dimensions and Bulk Compositions

To understand the impact of shale compositions on fractal characteristics in the Dalong and Gufeng Formations, the correlations between fractal dimensions (D1, D2) and TOC content on the one hand, and major mineralogical compositions, on the other, are illustrated (Figure 20 and Figure 21, respectively). The positive relationships between fractal dimensions (D1, D2) and TOC content suggest that shale samples with high TOC content generally display a more complex and irregular pore network (Figure 20), which is likely due to the abundant OM micropores and great surface area of organic-rich shales. Furthermore, the Gufeng samples seem to display a higher average fractal dimension than that of the Dalong Formation (Figure 20), probably resulting from the high TOC content in the Gufeng Formation (average TOC = 8.3 wt.%).
Weakly positive relationships between fractal dimensions (D1, D2) and quartz content are observed (Figure 21A,D). This interpretation is consistent with that of previous studies on the Dalong Formation in South China [51]. The absence of correlations between fractal dimensions and brittle minerals is also verified by the SEM observations, where pores associated with quartz are dominated by mesopores or macropores in the Dalong and Gufeng Formations (Figure 7 and Figure 8). In addition, the surfaces of brittle mineral grains are generally smooth and homogenous, reducing the heterogeneity and complexity of the shale pore structure. The fractal dimensions (D1, D2) are strongly negatively correlated with carbonate content in the Gufeng Formation (Figure 21B,E). This is probably due to the occurrence of abundant carbonate cements filling primary interparticle pores and the absence of micropores related to carbonate minerals (Figure 7A–C and Figure 8A–C), leading to decreased fractal dimensions. In addition, a weakly negative relationship between fractal dimensions (D1, D2) and clay minerals content was observed in the Dalong Formation, whereas no obvious correlations existed in the Gufeng Formation (Figure 21C,F). These results appear to contradict those of previous studies, which suggested that abundant clay minerals generally cause increased complexity in shale pores due to the large surface area of clays [51,52]. The weakly negative correlations between fractal dimensions and clay minerals may be related to pore size and the degree of spatial order of the inter-layer pores within clay minerals [53], although clay minerals provide significant amounts of pore volume due to the development of numerous sheet-like pores. The effect of different clay minerals on the complexity of shale pore structure remains unclear and needs further investigation for the Gufeng and Dalong shales. In summary, OM and carbonate minerals content exert a predominant control on the complexity of the pore structure in our sample sets.

6. Conclusions

In this study, the lithofacies, pore structure, and fractal characteristics of the Dalong and Gufeng Formations in the western Hubei Province, South China, were investigated by integrating petrological, petrophysical examination, and FHH theory. The following conclusions can be drawn:
(1)
Based on TOC content, mineral compositions, rock texture, and fabric, four mudstone lithofacies are identified in the Dalong and Gufeng Formations, primarily consisting of siliceous mudstone, calcareous–siliceous mixed mudstone, argillaceous–siliceous mixed mudstone, and carbonaceous mudstone. Stratigraphically, silica-rich mudstone is predominantly distributed in the lower part of the Dalong Formation and Gufeng Formation, and the lithofacies gradually evolve into mixed mudstone upward.
(2)
The pore types are dominated by interparticle pores between matrix minerals, slit-shaped pores between clay flakes, and nanometer-sized OM pores in the Dalong and Gufeng Formations. The pore size distribution is predominantly characterized by a diameter of <30 nm, which is the primary contributor to total pore volume. The siliceous mudstone and carbonaceous mudstone are considered to be potential target lithofacies in the study area due to their high total porosity.
(3)
The pore development of the Dalong and Gufeng Formations is primarily influenced by both OM content and clay mineral content. The siliceous mudstone shale with high TOC content generally displays high pore volume. The moderate content of clay minerals promotes pore development due to silt-like pores between clay sheets. However, the weakly negative correlation between total pore volume and carbonate content suggests a negative impact of carbonate minerals on total porosity, which is ascribed to the presence of abundant pore-filling carbonate cement.
(4)
The pore structure of the Dalong and Gufeng Formations exhibits fractal characteristics based on the FHH model, indicating the irregularity and complexity of the pore structure. The pore heterogeneity is predominantly controlled by micropores, and, to a lesser degree, mesopores, displaying large fractal dimensions (D1, D2) in the range of relatively small pore diameters. The OM and carbonate minerals content exerts a dominant control on fractal dimensions, leading to enhanced heterogeneity of the pore structure.

Author Contributions

Conceptualization, Y.W., Y.Z., T.D. and K.D.; methodology, Y.W., Y.Z., K.D. and J.W.; software, Y.W. and Y.Z.; validation, Y.Z. and T.D.; formal analysis, Y.W., K.D., H.Z. and T.X.; investigation, Y.W., H.Z., T.X. and F.L.; resources, Y.W., J.W. and H.Z.; data curation, Y.W., T.X. and F.L.; writing-original draft preparation, Y.W.; writing-review and editing, Y.W., Y.Z. and K.D.; visualization, Y.W. and Y.Z.; supervision, Y.W. and T.D. All authors have read and agreed to the published version of the manuscript.

Funding

The research was financially supported by the project of Permian reservoir characteristics investigation and explora-tion target optimization in the Huaguoping compound oblique belt, western Hubei area (KCDZ2023-32).

Data Availability Statement

The data presented in this study are available on request from the corresponding author. The data are not publicly available due to [a temporary secret of the project’s needs].

Acknowledgments

Editors and anonymous reviews are gratefully acknowledged.

Conflicts of Interest

The authors declare no conflict of interest.

References

  1. Curtis, J.B. Fractured shale-gas systems. AAPG Bull. 2002, 86, 1921–1938. [Google Scholar]
  2. Jarvie, D.M.; Hill, R.J.; Ruble, T.E.; Pollastro, R.M. Unconventional shale-gas systems: The Mississippian Barnett shale of north-central Texas as one model for thermogenic shale-gas assessment. AAPG Bull. 2007, 91, 475–499. [Google Scholar] [CrossRef]
  3. Hao, F.; Zou, H.; Lu, Y. Mechanisms of shale gas storage: Implications for shale gas exploration in China. AAPG Bull. 2013, 91, 475–499. [Google Scholar] [CrossRef]
  4. Zou, C.; Zhu, R.; Chen, Z.-Q.; Ogg, J.G.; Wu, S.; Dong, D.; Qiu, Z.; Wang, Y.; Wang, L.; Lin, S.; et al. Organic-matter-rich shales of China. Earth-Sci. Rev. 2019, 189, 51–78. [Google Scholar] [CrossRef]
  5. Chalmers, G.; Bustin, R.; Power, I. Characterization of gas shale pore systems by porosimetry, pycnometry, surface area, and field emission scanning electron microscopy/transmission electron microscopy image analyses: Examples from the Barnett, Woodford, Haynesville, Marcellus, and Doig units. AAPG Bull. 2012, 96, 1099–1119. [Google Scholar]
  6. Loucks, R.G.; Reed, R.M.; Ruppel, S.C.; Hammes, U. Spectrum of pore types and networks in mudrocks and a descriptive classification for matrix-related mudrock pores. AAPG Bull. 2012, 96, 1071–1098. [Google Scholar] [CrossRef]
  7. Mastalerz, M.; Schimmelmann, A.; Drobniak, A.; Chen, Y. Porosity of Devonian and Mississippian New Albany Shale across a maturation gradient: Insights from organic petrology, gas adsorption, and mercury intrusion. AAPG Bull. 2013, 97, 1621–1643. [Google Scholar] [CrossRef]
  8. Milliken, K.L.; Rudnicki, M.; Awwiller, D.N.; Zhang, T. Organic matter-hosted pore system, Marcellus Formation (Devonian), Pennsylvania. AAPG Bull. 2013, 97, 177–200. [Google Scholar] [CrossRef]
  9. Ko, L.T.; Loucks, R.G.; Zhang, T.; Ruppel, S.C.; Shao, D. Pore and pore network evolution of Upper Cretaceous Boquillas (Eagle Ford–equivalent) mudrocks: Results from gold tube pyrolysis experiments. AAPG Bull. 2016, 100, 1693–1722. [Google Scholar] [CrossRef]
  10. Dong, T.; Harris, N.B.; Ayranci, K.; Twemlow, C.E.; Nassichuk, B.R. Porosity characteristics of the Devonian Horn River shale, Canada: Insights from lithofacies classification and shale composition. Int. J. Coal Geol. 2015, 141–142, 74–90. [Google Scholar] [CrossRef]
  11. Pommer, M.; Milliken, K. Pore types and pore-size distributions across thermal maturity, Eagle Ford Formation, southern Texas. AAPG Bull. 2015, 99, 1713–1744. [Google Scholar] [CrossRef]
  12. Katz, B.J.; Arango, I. Organic porosity: A geochemist’s view of the current state of understanding. Org. Geochem. 2018, 123, 1–16. [Google Scholar] [CrossRef]
  13. Liu, B.; Schieber, J.; Mastalerz, M. Combined SEM and reflected light petrography of organic matter in the New Albany Shale (Devonian-Mississippian) in the Illinois Basin: A perspective on organic pore development with thermal maturation. Int. J. Coal Geol. 2017, 184, 57–72. [Google Scholar] [CrossRef]
  14. Mastalerz, M.; Drobniak, A.; Stankiewicz, A. Origin, properties, and implications of solid bitumen in source-rock reservoirs: A review. Int. J. Coal Geol. 2018, 195, 14–36. [Google Scholar] [CrossRef]
  15. Milliken, K.L.; Olson, T. Silica Diagenesis, Porosity Evolution, and Mechanical Behavior In Siliceous Mudstones, Mowry Shale (Cretaceous), Rocky Mountains, USA. J. Sediment. Res. 2017, 87, 366–387. [Google Scholar] [CrossRef]
  16. Dong, T.; He, S.; Chen, M.; Hou, Y.; Guo, X.; Wei, C.; Han, Y.; Yang, R. Quartz types and origins in the paleozoic Wufeng-Longmaxi Formations, Eastern Sichuan Basin, China: Implications for porosity preservation in shale reservoirs. Mar. Pet. Geol. 2019, 106, 62–73. [Google Scholar] [CrossRef]
  17. Mandelbrot, B.B. Fractals in physics-squig clusters, diffusions, fractal measures, and the unicity of fractal dimensionality. J. Stat. Phys. 1984, 34, 895–930. [Google Scholar] [CrossRef]
  18. Mandelbrot, B.B. Self-affine fractals and fractal dimension. Phys. Scr. 1985, 32, 257–260. [Google Scholar] [CrossRef]
  19. Yang, R.; He, S.; Yi, J.; Hu, Q. Nano-scale pore structure and fractal dimension of organic-rich Wufeng-Longmaxi shale from Jiaoshiba area, Sichuan Basin: Investigations using FE-SEM, gas adsorption and helium pycnometry. Mar. Pet. Geol. 2016, 70, 27–45. [Google Scholar] [CrossRef]
  20. Shao, X.; Pang, X.; Li, Q.; Wang, P.; Chen, D.; Shen, W.; Zhao, Z. Pore structure and fractal characteristics of organic-rich shales: A case study of the lower Silurian Longmaxi shales in the Sichuan Basin, SW China. Mar. Pet. Geol. 2017, 80, 192–202. [Google Scholar] [CrossRef]
  21. Peng, N.; He, S.; Hu, Q.; Zhang, B.; He, X.; Zhai, G.; He, C.; Ynag, R. Organic nanopore structure and fractal characteristics of Wufeng and lower member of Longmaxi shales in southeastern Sichuan, China. Mar. Pet. Geol. 2019, 103, 456–472. [Google Scholar] [CrossRef]
  22. Ahmad, A.L.; Mustafa, N.N. Pore surface fractal analysis of palladium-alumina ceramic membrane using frenkel-Halsey-Hill (FHH) model. J. Colloid Interface Sci. 2006, 301, 575–584. [Google Scholar] [CrossRef] [PubMed]
  23. Yao, Y.; Liu, D.; Tang, D.; Tang, S.; Huang, W. Fractal characterization of adsorption-pores of coals from North China: An investigation on CH4 adsorption capacity of coals. Int. J. Coal Geol. 2008, 73, 27–42. [Google Scholar] [CrossRef]
  24. Li, A.; Ding, W.; He, J.; Dai, P.; Yin, S.; Xie, F. Investigation of pore structure and fractal characteristics of organic-rich shale reservoirs: A case study of Lower Cambrian Qiongzhusi formation in Malong block of eastern Yunnan Province, South China. Mar. Pet. Geol. 2016, 70, 46–57. [Google Scholar] [CrossRef]
  25. Wang, W.; Shi, W.; Fu, X. Shale gas exploration potential and target of Permian Dalong Formation in northern Sichuan. Prtroleum Geol. Exp. 2020, 42, 892–899. [Google Scholar]
  26. Xie, T.; Pan, S.; Wang, Y.; Ren, Z.; Yu, J.; Duan, K. Analysis on main controlling factors of shale gas enrichment in Upper Permian Dalong Formation in Well Endi 1, Western Hubei. Resour. Environ. Eng. 2022, 36, 149–153. [Google Scholar]
  27. Jiang, P.; Wu, J.; Zhu, Y.; Zhang, D.; Wu, W.; Zhang, R.; Wu, J.; Wang, Q.; Yang, Y.; Yang, X.; et al. Enrichment conditions and favorable areas for exploration and development of marine shale gas in Sichuan Basin. Acta Pet. Sin. 2023, 44, 91–109. [Google Scholar]
  28. Duan, K.; Xie, T.; Wang, Y.; Zhang, Y.; Shi, W.; Lu, Y. Reservoir Characteristics and Their Controlling Factors in Siliceous Shales of the Upper Permian Dalong Formation, Western Hubei Province, South China. Appl. Sci. 2023, 13, 1434. [Google Scholar] [CrossRef]
  29. Yin, H.; Jiang, H.; Xia, W.; Fegn, Q.; Zhang, N.; Shen, J. The end-Permian regression in South China and its implication on mass extinction. Earth-Sci. Rev. 2014, 137, 19–33. [Google Scholar] [CrossRef]
  30. Zhai, G.; Wang, Y.; Liu, G.; Zhou, Z.; Zhang, C.; Liu, X. Enrichment and accumulation characteristics and prospect analysis of the Permian marine conticental multiphase shale gas in China. Sediment. Geol. Tethyan Geol. 2020, 40, 102–117. [Google Scholar]
  31. Liu, W.; Qiao, Y.; Bo, J.; Mou, C.; Tong, J.; Yao, J. Geochemistry of mudstones from the Upper Permian Dalong Formation in the Enshi area, western Hubei, and its implications for weathering, provenance and tectonic setting. J. Lanzhou Univ. Nat. Sci. 2019, 55, 158–167. [Google Scholar]
  32. Luo, W.; Hou, M.; Liu, X.; Huang, S.; Chao, H.; Zhang, R.; Deng, X. Geological and geochemical characteristics of marine-continental transitional shale from the Upper Permian Longtan formation, Northwestern Guizhou, China. Mar. Pet. Geol. 2018, 89, 58–67. [Google Scholar] [CrossRef]
  33. He, Q.; Dong, T.; He, S.; Zhai, G. Methane adsorption capacity of marine-continental transitional facies shales: The case study of the Upper Permian Longtan Formation, northern Guizhou Province, Southwest China. J. Pet. Sci. Eng. 2019, 183, 106406. [Google Scholar] [CrossRef]
  34. Thommes, M.; Kaneko, K.; Neimark, A.V.; Olivier, J.P.; Rodriguez-Reinoso, F.; Rouquerol, J.; Sing, K.S.W. Physisorption of gases, with special reference to the evaluation of surface area and pore size distribution (IUPAC Technical Report). Pure Appl. Chem. 2015, 87, 1051–1069. [Google Scholar] [CrossRef]
  35. Jarniec, M. Evaluation of the fractal dimension form a single adsorption isotherm. Langmuir 1995, 11, 2316–2317. [Google Scholar] [CrossRef]
  36. Yang, F.; Ning, Z.; Liu, H. Fractal characteristics of shales from a shale gas reservoir in the Sichuan Basin, China. Fuel 2014, 115, 378–384. [Google Scholar] [CrossRef]
  37. Delle, P.C.; Bourdet, J.; Josh, M.; Clennell, M.B.; Rickard, W.D.A.; Saunders, M.; Sherwood, N.; Li, Z.; Dewhurst, D.N.; Raven, M.D. Organic matter network in post-mature Marcellus Shale: Effects on petrophysical properties. AAPG Bull. 2018, 102, 2305–2332. [Google Scholar] [CrossRef]
  38. Dong, T.; Harris, N.B.; McMillan, J.M.T.; Twemlow, C.E.; Nassichuk, B.R.; Bish, D.l. A model for porosity evolution in shale reservoirs: An example from the Upper Devonian Duvernay Formation, Western Canada Sedimentary Basin. AAPG Bull. 2019, 103, 1017–1044. [Google Scholar] [CrossRef]
  39. Curtis, M.E.; Cardott, B.J.; Sondergeld, C.H.; Rai, C.S. Development of organic porosity in the Woodford Shale with increasing thermal maturity. Int. J. Coal Geol. 2012, 103, 26–31. [Google Scholar] [CrossRef]
  40. Ardakani, O.H.; Sanei, H.; Ghanizadeh, A. Do all fractions of organic matter contribute equally in shale porosity? A case study from Upper Ordovician Utica Shale, southern Quebec, Canada. Mar. Pet. Geol. 2018, 92, 794–808. [Google Scholar] [CrossRef]
  41. Misch, D.; Klaver, J.; Gross, D. Factors controlling shale microstructure and porosity: A case study on upper Visean Rudov beds from the Ukrainian Dneiper–Donets Basin. AAPG Bull. 2018, 102, 2629–2654. [Google Scholar] [CrossRef]
  42. Misch, D.; Gross, D.; Hawranek, G. Solid bitumen in shales: Petrographic characteristics and implications for reservoir characterization. Int. J. Coal Geol. 2019, 205, 14–31. [Google Scholar] [CrossRef]
  43. Knapp, L.J.; Ardakani, O.H.; Uchida, S. The influence of rigid matrix minerals on organic porosity and pore size in shale reservoirs: Upper Devonian Duvernay Formation, Alberta, Canada. Int. J. Coal Geol. 2020, 227, 103525. [Google Scholar] [CrossRef]
  44. Wang, Y.; Bai, L.; Zhang, Y. Reservoir Characteristics and Influencing Factors of Organic-Rich Siliceous Shale of the Upper Permian Dalong Formation in Western Hubei. Energies 2023, 16, 5130. [Google Scholar] [CrossRef]
  45. Ko, L.T.; Ruppel, S.C.; Loucks, R.G. Pore-types and pore-network evolution in Upper Devonian-Lower Mississippian Woodford and Mississippian Barnett mudstones: Insights from laboratory thermal maturation and organic petrology. Int. J. Coal Geol. 2018, 190, 3–28. [Google Scholar] [CrossRef]
  46. Peng, J.; Milliken, K.L.; Fu, Q. Quartz types in the Upper Pennsylvanian organic-rich Cline Shale (Wolfcamp D), Midland Basin, Texas: Implications for silica diagenesis, porosity evolution and rock mechanical properties. Sedimentology 2020, 67, 2040–2064. [Google Scholar] [CrossRef]
  47. Qiu, Z.; Liu, B.; Dong, D.; Lu, B.; Yawar, Z.; Chen, Z.; Schieber, J. Silica diagenesis in the Lower Paleozoic Wufeng and Longmaxi Formations in the Sichuan Basin, South China: Implications for reservoir properties and paleoproductivity. Mar. Pet. Geol. 2020, 121, 104594. [Google Scholar] [CrossRef]
  48. Zhao, J.; Jin, Z.; Jin, Z.; Wen, X.; Geng, Y. Origin of authigenic quartz in organic-rich shales of the Wufeng and Longmaxi Formations in the Sichuan Basin, South China: Implications for pore evolution. J. Nat. Gas Sci. Eng. 2017, 38, 21–38. [Google Scholar] [CrossRef]
  49. Bustin, R.M.; Bustin, A.M.M.; Cui, X.; Ross, D.J.K.; Pathi, V.S.M. Impact of Shale Properties on Pore Structure and Storage Characteristics. In Proceedings of the SPE Shale Gas Production Conference, Fort Worth, TX, USA, 16–18 November 2008. [Google Scholar]
  50. Liu, B.; Mastalerz, M.; Schieber, J. Petrophysical property variations in overmature Marcellus Shale: Impliations for gas storage and producibility. AAPG Bull. 2023, 107, 685–716. [Google Scholar] [CrossRef]
  51. Zhang, J.; Li, X.; Xie, Z.; Li, J.; Zhang, X.; Sun, K.; Wang, F. Characterization of microscopic pore types and structures in marine shale: Examples from the Upper Permian Dalong formation, Northern Sichuan Basin, South China. J. Nat. Gas Sci. Eng. 2018, 59, 326–342. [Google Scholar] [CrossRef]
  52. Wu, Z.; He, S.; Li, X.; Liu, X.; Zhai, G.; Huang, Z.; Yang, W. Comparative study on pore structure characteristics of marine and transitional facies shales: A case study of the Upper Permian Longtan Formation and Dalong Formation in the Lower Yangtze area, south China. J. Pet. Sci. Eng. 2022, 215, 110578. [Google Scholar] [CrossRef]
  53. Yang, C.; Zhang, J.; Wang, X.; Tang, X.; Chen, Y.; Jiang, L.; Gong, X. Nanoscale pore structure and fractal characteristics of a marine-continental transitional shale: A case study from the lower Permian Shanxi Shale in the southeastern Ordos Basin, China. Mar. Pet. Geol. 2017, 88, 54–68. [Google Scholar] [CrossRef]
Figure 1. (A) Changhsingian Paleogeographic map of South China (modified from Yin et al., 2014) [29]. Paleogeographic partitions: HGG Basin = Hunan–Guizhou–Guangxi basin. ZFG clastic Region = Zhejiang–Fujian–Guangdong clastic Region; GLB = Guangyuan–Liangping Basin. Faults: LMSF = Longmenshan Fault; SDBSF = South Dabaoshan Fault; QFF = Qingfeng Fault; XF-GJF = Xiangfan–Guangji Fault; TC-LJF = Tanchen–Lujiang Fault; (B) Stratigraphic column of the Middle and Upper Permian strata in the South China.
Minerals 14 00010 g001
Figure 2. Stratigraphic variations in the gamma-ray (GR) log, lithology, TOC content, and the concentrations of major oxides. (A) the Dalong Formation; (B) the Gufeng Formation.
Minerals 14 00010 g002
Figure 3. Bulk mineralogical compositions determined from X-ray diffraction analysis.
Minerals 14 00010 g003
Figure 4. Representative core photographs and thin section images of major lithofacies in the Dalong Formation. (A) Macroscopic characteristics of black siliceous mudstone, sample depth = 368.75 m. (B) Thin section image of black siliceous mudstone showing the preserved radiolarians, sample depth = 355.80 m. (C) Thin section image of black siliceous mudstone showing the preserved radiolarians, sample depth = 357.90 m. (D) Macroscopic characteristics of gray calcareous–siliceous mixed mudstone, sample depth = 339.25 m. (E) Thin section image of gray calcareous–siliceous mixed mudstone showing the preserved radiolarians, sample depth = 345.80 m. (F) Thin section image of gray calcareous–siliceous mixed mudstone, sample depth = 335.40 m.
Minerals 14 00010 g004
Figure 5. Representative core photographs and thin section images of major lithofacies in the Dalong Formation. (A) Thin section image of siliceous mudstone showing the preserved radiolarians, sample depth = 477.35 m. (B) Thin section image of siliceous mudstone showing the preserved cephalopods, sample depth = 465.70 m. (C) Thin section image of calcareous–siliceous mixed mudstone showing the abundant dolomite, sample depth = 470.40 m. (D) Thin section image of calcareous-siliceous mixed mudstone, sample depth = 436.70 m.
Minerals 14 00010 g005
Figure 6. Representative core photographs, thin section, and SEM images of argillaceous–siliceous mixed mudstone (A,B) and carbonaceous mudstone (CF) in the Gufeng Formation. (A) Thin section image of argillaceous–siliceous mixed mudstone, sample depth = 448.25 m. (B) Thin section image of argillaceous–siliceous mixed mudstone, sample depth = 448.25 m. (C) Macroscopic characteristics of black siliceous mudstone showing sponge spicule, sample depth = 456.20 m. (D). Thin section image showing the preserved radiolarians, sample depth = 458.75 m. (E). Macroscopic characteristics of gray carbonaceous mudstone, sample depth = 460.0 m. (F). Microscopic characteristics of carbonaceous mudstone, sample depth = 458.75 m.
Minerals 14 00010 g006
Figure 7. SEM images showing mineral matrix and OM-hosted pores in the Dalong Formation. (A) Interparticle pores between calcite grains, JD-3, depth = 340.50 m. (B) Interparticle pores between calcite grains, JD-3, depth = 335.40 m. (C) Intraparticle pores between clay sheets, JD-3, depth = 340.50 m. (D) Abundant OM pores within second organic matter, JD-3, depth = 368.75 m. (E) Spongy or irregular OM pores occurring in solid bitumen between rigid minerals, JD-3, depth = 348.20 m. (F) Irregular or slit-shapaed OM pores, JD-3, depth = 348.20 m.
Minerals 14 00010 g007
Figure 8. SEM images showing mineral matrix pores in the Gufeng Formation. (A) Interparticle pores between rigid grains (e.g., calcite, quartz), JD-3, depth = 436.70 m. (B) Interparticle pores between rigid grains and OM, JD-3, depth = 458.75 m. (C) Intraparticle dissolution pores within calcite, JD-3, depth = 470.40 m. (D) Intraparticle pores between clay sheets, JD-3, depth = 470.40 m. (E) Intraparticle pores between clay sheets, JD-3, depth = 448.25 m. (F) Intraparticle pores, JD-3, depth = 458.75 m.
Minerals 14 00010 g008
Figure 9. SEM images showing OM-hosted pores in the Gufeng Formation. (A) Abundant development of organic matter occurring parallel to bedding, JD-3, depth = 458.75 m. (B) OM showing no development of OM pores, JD-3, depth = 458.75 m. (C) Particulate depositional OM (kerogen) showing no development of OM pores, JD-3, depth = 477.35 m. (D) Second OM containing numerous OM pores, JD-3, depth = 477.35 m. (E) Abundant OM pores, JD-3, depth = 477.35 m. (F) Irregular OM pores occurring in solid bitumen, JD-3, depth = 470.40 m.
Minerals 14 00010 g009
Figure 10. Carbon dioxide (CO2) and nitrogen (N2) adsorption isotherms of different shale lithofacies in the Dalong Formation. P/P0 = the ratio of vapor pressure to saturated pressure. The CO2 adsorption isotherms of siliceous mudstone (A) and calcareous-siliceous mixed mudstone (B). The N2 adsorption isotherms of siliceous mudstone (C) and calcareous-siliceous mixed mudstone (D).
Minerals 14 00010 g010
Figure 11. Nitrogen adsorption isotherms of different shale lithofacies in the Gufeng Formation. P/P0 = the ratio of vapor pressure to saturated pressure.
Minerals 14 00010 g011
Figure 12. Pore size distribution of the two shale lithofacies in the Dalong Formation measured by CO2 and N2 adsorption analysis. (A) Siliceous mudstone; (B) Calcareous-siliceous mixed mudstone. The dashed line indicates the diameter of ~1.3 nm.
Minerals 14 00010 g012
Figure 13. Pore size distribution of different shale lithofacies in the Gufeng Formation obtained by N2 adsorption measurements. The dashed lines indicate the diameter of ~2 nm and ~50 nm.
Minerals 14 00010 g013
Figure 14. Absolute pore volume of micropores, mesopores, and macropores for the Dalong and Gufeng Formations based on the CO2 and N2 adsorption data. The dashed lines indicate the dividing lines among different lithofacies.
Minerals 14 00010 g014
Figure 15. Plots of ln (V) versus ln (ln (P0/P)) based on N2 adsorption isotherms for the representative (A) Dalong Formation, and (B) Gufeng Formation samples. The dashed line indicates the dividing line of P0/P = 0.5.
Minerals 14 00010 g015
Figure 16. Different occurrence states of organic matter (OM) in the Middle and Upper Permian Dalong and Gufeng Formations. (A) The secondary OM occurring between the grians, JD-3, depth = 367.75 m. (B) Nanometer-sized spongy or irregular OM pores, JD-3, depth = 367.75 m. (C) The striped OM parallel to bedding, JD-3, depth = 458.75 m. (D) OM showing no development of pores, JD-3, depth = 458.75 m.
Minerals 14 00010 g016
Figure 17. Correlations between TOC content and pore volumes of micropores, mesopores, and macropores. (AD) the Dalong Formation; (EH) the Gufeng Formation.
Minerals 14 00010 g017
Figure 18. Correlations between total pore volume and primary mineral compositions of the Gufeng and Dalong Formations. (AC) the Dalong Formation; (DF) the Gufeng Formation.
Minerals 14 00010 g018
Figure 19. Correlations between fractal dimensions (D1, D2) and pore volumes of micropores, mesopores, and macropores in the Dalong and Gufeng Formations. (AC) The relationship between fractal dimensions and pore volume for different pore in the Dalong Formation. (DF) The relationship between fractal dimensions and pore volume for different pore in the Gufeng Formation.
Minerals 14 00010 g019
Figure 20. Correlations between fractal dimensions (D1, D2) and TOC content of the Gufeng and Dalong Formations. (A) The relationship between D1 and TOC. (B) The relationship between D2 and TOC.
Minerals 14 00010 g020
Figure 21. Correlations between fractal dimension (D1, D2) and major mineral compositions of the Gufeng and Dalong Formations. (AC) The relationship of D1 and the content of quartz, carbonate and clay minerals. (DF) The re-lationship of D2 and the content of quartz, carbonate and clay minerals.
Minerals 14 00010 g021
Table 1. Pore volume and surface area of the Dalong and Gufeng shales based on the CO2 and N2 adsorption analysis.
Sample IDDepthFormationTOCLithofaciesPore Volume (cm3/g × 10−2)Surface Area (m2/g)
m %<2 nm2–50 nm>50 nmTotal Pore Volume<2 nm2–50 nm>50 nmTotal
Surface Area
JD3-2335.40Dalong2.23Mixed mudstone0.401.8120.9703.18211.62810.3000.40022.328
JD3-4339.25Dalong6.58Calcareous/siliceous mixed mudstone0.702.1720.8963.76826.85814.0710.32441.253
JD3-5340.50Dalong0.47Mixed mudstone0.401.4760.7222.59811.9258.16870.2720.364
JD3-7343.40Dalong5.67Calcareous-rich siliceous mudstone0.401.7730.5702.74314.73111.0790.20626.016
JD3-8345.80Dalong6.34Calcareous/siliceous mixed mudstone0.902.5730.7684.24128.43917.3080.2746.017
JD3-9348.20Dalong6.21Siliceous mudstone0.602.6480.5543.80220.70214.0490.23134.982
JD3-10350.90Dalong5.17Siliceous mudstone0.602.8210.9794.40022.06715.3970.39637.860
JD3-12355.80Dalong7.90Siliceous mudstone0.802.4800.5233.80428.94716.4560.18745.590
JD3-13357.90Dalong10.10Siliceous mudstone1.504.3111.0466.85749.50424.7760.40974.689
JD3-14360.40Dalong10.27Siliceous mudstone1.003.4321.1365.56834.01419.2230.43153.668
JD3-15362.30Dalong6.17Siliceous mudstone0.902.6070.6274.13427.38315.1340.25842.775
JD3-16365.75Dalong8.57Siliceous mudstone1.303.8740.9786.15242.98823.7260.36567.079
JD3-17366.50Dalong10.70Siliceous mudstone1.203.1770.4664.84437.07819.8520.17457.104
JD3-18368.75Dalong8.86Siliceous mudstone1.103.7040.9675.77137.40521.9970.3759.772
JD3-19370.00Dalong5.68Siliceous/argillaceous mixed mudstone0.502.3960.7663.66116.02014.7610.31631.097
JD3-21428.10Gufeng1.64Calcareous/siliceous mixed mudstone0.191.0780.7452.0115.6005.2200.30511.125
JD3-23433.40Gufeng1.04Calcareous/siliceous mixed mudstone0.130.7860.7041.6193.8794.0300.2668.175
JD3-24436.70Gufeng1.01Mixed mudstone0.300.7420.8101.8529.8023.4670.30813.577
JD3-25439.90Gufeng1.05Calcareous/siliceous mixed mudstone0.501.3131.0782.89114.8706.4580.41421.742
JD3-28448.25Gufeng3.09Siliceous/argillaceous mixed mudstone0.501.0500.3981.94817.8628.2840.14126.287
JD3-31454.85Gufeng16.17Carbonaceous mudstone1.492.6890.3684.54246.69223.2220.13170.045
JD3-32456.20Gufeng18.36Carbonaceous mudstone2.082.1320.2944.50566.67921.2340.10888.021
JD3-33458.75Gufeng30.56Carbonaceous mudstone2.301.8530.4344.58778.25818.5370.15896.953
JD3-34460.00Gufeng27.45Carbonaceous mudstone2.082.6220.4275.12666.87424.0700.15491.098
JD3-35462.15Gufeng25.74Carbonaceous mudstone0.932.6330.3753.94130.21714.0440.18044.441
JD3-37465.70Gufeng8.47Siliceous mudstone0.471.1950.2721.93215.1047.0890.09722.290
JD3-40470.40Gufeng5.35Calcareous/siliceous mixed mudstone0.200.7390.3771.3168.6134.3400.14513.098
JD3-42473.40Gufeng8.44Siliceous mudstone0.410.4370.1841.02913.3313.8530.06417.248
JD3-45476.35Gufeng11.43Siliceous mudstone0.220.5680.2791.0706.9684.2760.10411.348
JD3-46477.35Gufeng9.24Siliceous mudstone0.901.1720.5122.58433.9169.6060.19743.719
Table 2. Fractal dimensions (D1, D2) calculated from the FHH model for the Gufeng and Dalong shales.
SampleDepth (m)TOC (wt.%)P/P0 < 0.50P/P0 > 0.50
Fitting EquationD1R2Fitting EquationD2R2
JD3-2335.402.23y = −0.4406x + 1.71742.5590.9975y = −0.2449x + 1.82952.7550.9904
JD3-4339.256.58y = −0.3273x + 2.40352.6730.9856y = −0.1502x + 2.52482.8500.9782
JD3-5340.500.47y = −0.5115x + 1.27812.4890.9991y = −0.2633x + 1.46732.7370.9790
JD3-7343.405.67y = −0.3554x + 2.05972.6450.9852y = −0.1513x + 2.23832.8490.9412
JD3-8345.806.34y = −0.3749x + 2.48042.6250.9883y = −0.1411x + 2.64662.8590.9325
JD3-9348.206.21y = −0.3862x + 2.19112.6140.9869y = −0.3862x + 2.19112.7740.9869
JD3-10350.905.17y = −0.4793x + 2.02412.5210.9960y = −0.2489x + 2.19342.7510.9690
JD3-12355.807.90y = −0.3695x + 2.45392.6310.9844y = −0.1456x + 2.60742.8540.9047
JD3-13357.9010.10y = −0.3833x + 2.75642.6170.9878y = −0.1732x + 2.95842.8270.9212
JD3-14360.4010.27y = −0.3644x + 2.62322.6360.9847y = −0.1881x + 2.73592.8120.9606
JD3-15362.306.17y = −0.3879x + 2.27222.6120.9882y = −0.1745x + 2.4552.8260.9405
JD3-16365.758.57y = −0.382x + 2.74542.6180.9889y = −0.1643x + 2.91372.8360.9306
JD3-17366.5010.70y = −0.392x + 2.54682.6080.9879y = −0.1834x + 2.68332.8170.9199
JD3-18368.758.86y = −0.3561x + 2.7362.6440.9865y = −0.1617x + 2.90612.8380.9382
JD3-19370.005.68y = −0.4366x + 2.06542.5630.9966y = −0.1904x + 2.27832.8100.9578
JD3-21428.101.64y = −0.4494x + 1.07982.5510.9957y = −0.3121x + 1.08422.6880.9898
JD3-23433.401.04y = −0.5002x + 0.69072.5000.9967y = −0.3319x + 0.70022.6680.9982
JD3-24436.701.01y = −0.4115x + 0.80982.5890.9934y = −0.3423x + 0.71212.6580.9956
JD3-25439.901.05y = −0.5075x + 1.21362.4930.9975y = −0.325x + 1.22572.6750.9951
JD3-28448.253.09y = −0.3437x + 1.92052.6560.9919y = −0.116x + 1.99522.8840.9938
JD3-31454.8516.17y = −0.3347x + 2.95882.6650.9873y = −0.0671x + 3.11862.9330.8576
JD3-32456.2018.36y = −0.2849x + 3.15352.7150.9740y = −0.037x + 3.26672.9630.9285
JD3-33458.7530.56y = −0.2648x + 3.23882.7350.9660y = −0.0426x + 3.28432.9570.9844
JD3-34460.0027.45y = −0.3079x + 3.18022.6920.9779y = −0.0537x + 3.29752.9460.8965
JD3-35462.1525.74y = −0.3088x + 2.48122.6910.9839y = −0.2045x + 2.49342.7960.9842
JD3-37465.708.47y = −0.3116x + 1.80512.6880.9849y = −0.1636x + 1.87872.8360.9494
JD3-40470.405.35y = −0.4127x + 1.00122.5870.9945y = −0.219x + 1.0792.7810.9914
JD3-42473.408.44y = −0.2281x + 1.65332.7720.9763y = −0.0694x + 1.68732.9310.9954
JD3-45476.3511.43y = −0.3886x + 1.06972.6110.9941y = −0.1503x + 1.16542.8500.9984
JD3-46477.359.24y = −0.2791x + 2.33992.7210.9788y = −0.0992x + 2.37812.9010.9935
Disclaimer/Publisher’s Note: The statements, opinions and data contained in all publications are solely those of the individual author(s) and contributor(s) and not of MDPI and/or the editor(s). MDPI and/or the editor(s) disclaim responsibility for any injury to people or property resulting from any ideas, methods, instructions or products referred to in the content.

