


Direct Tensile Measurement for Cemented Paste Backfill


Abstract
:1. Introduction
2. Materials and Methods
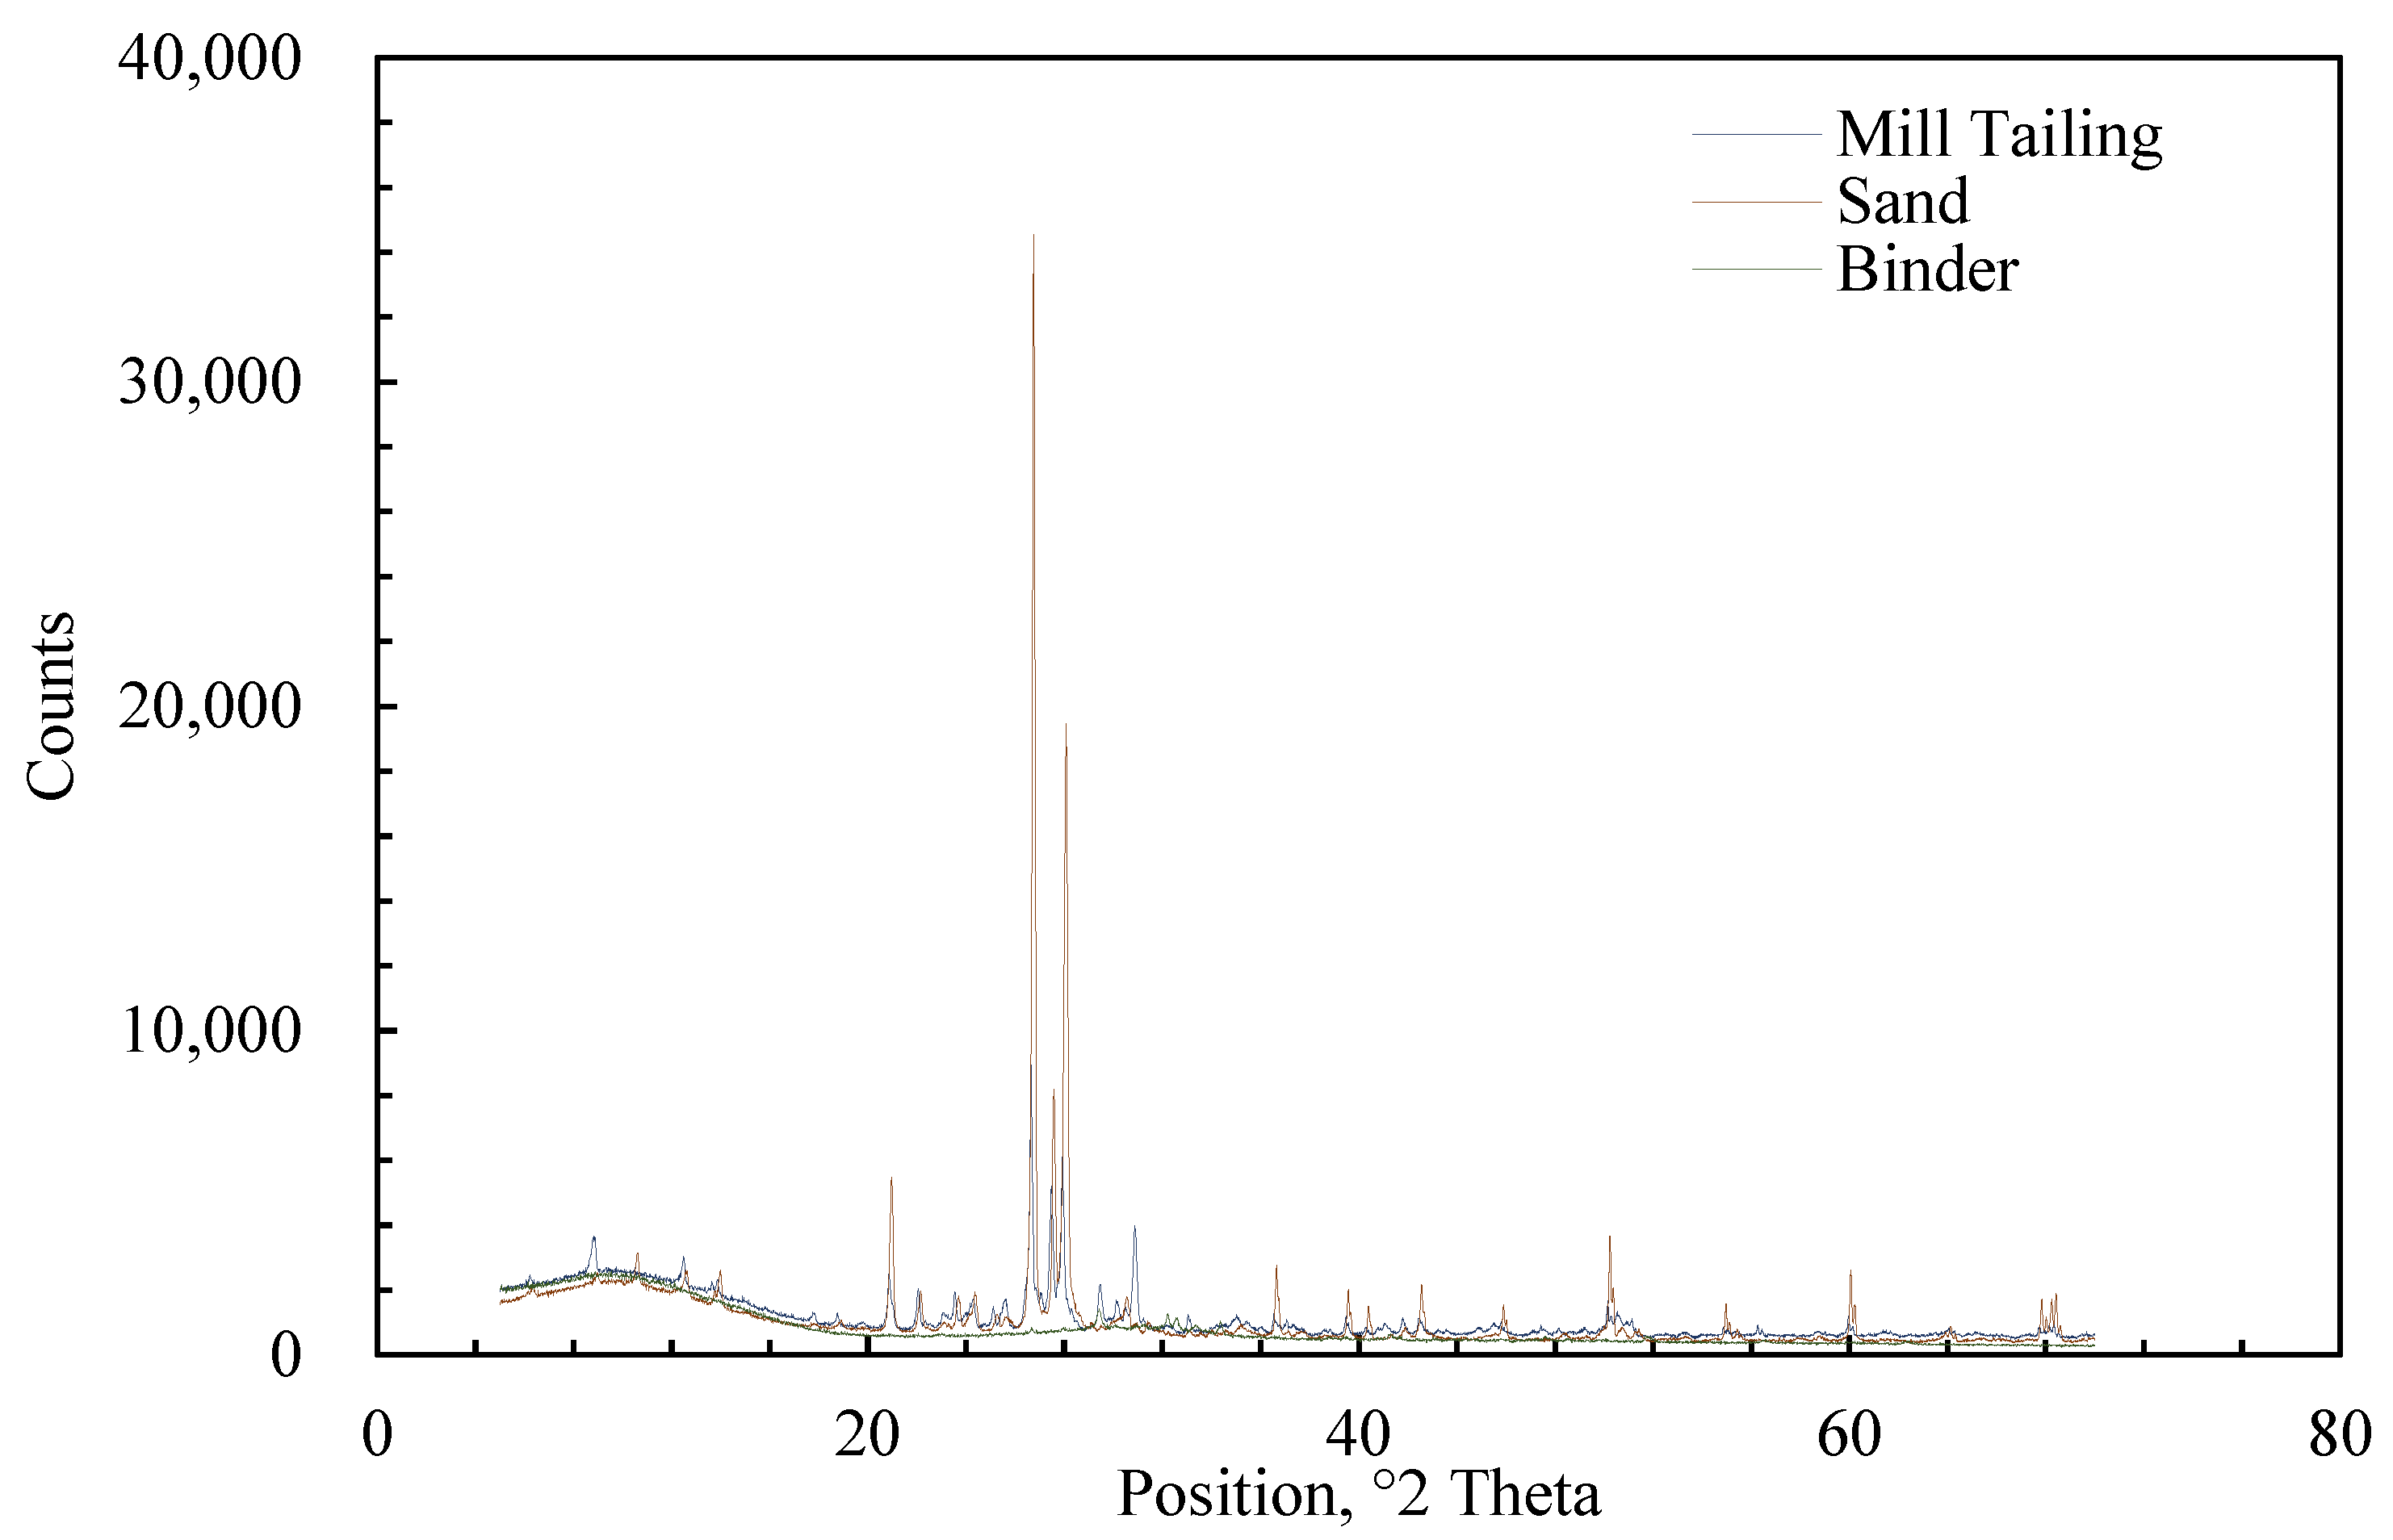
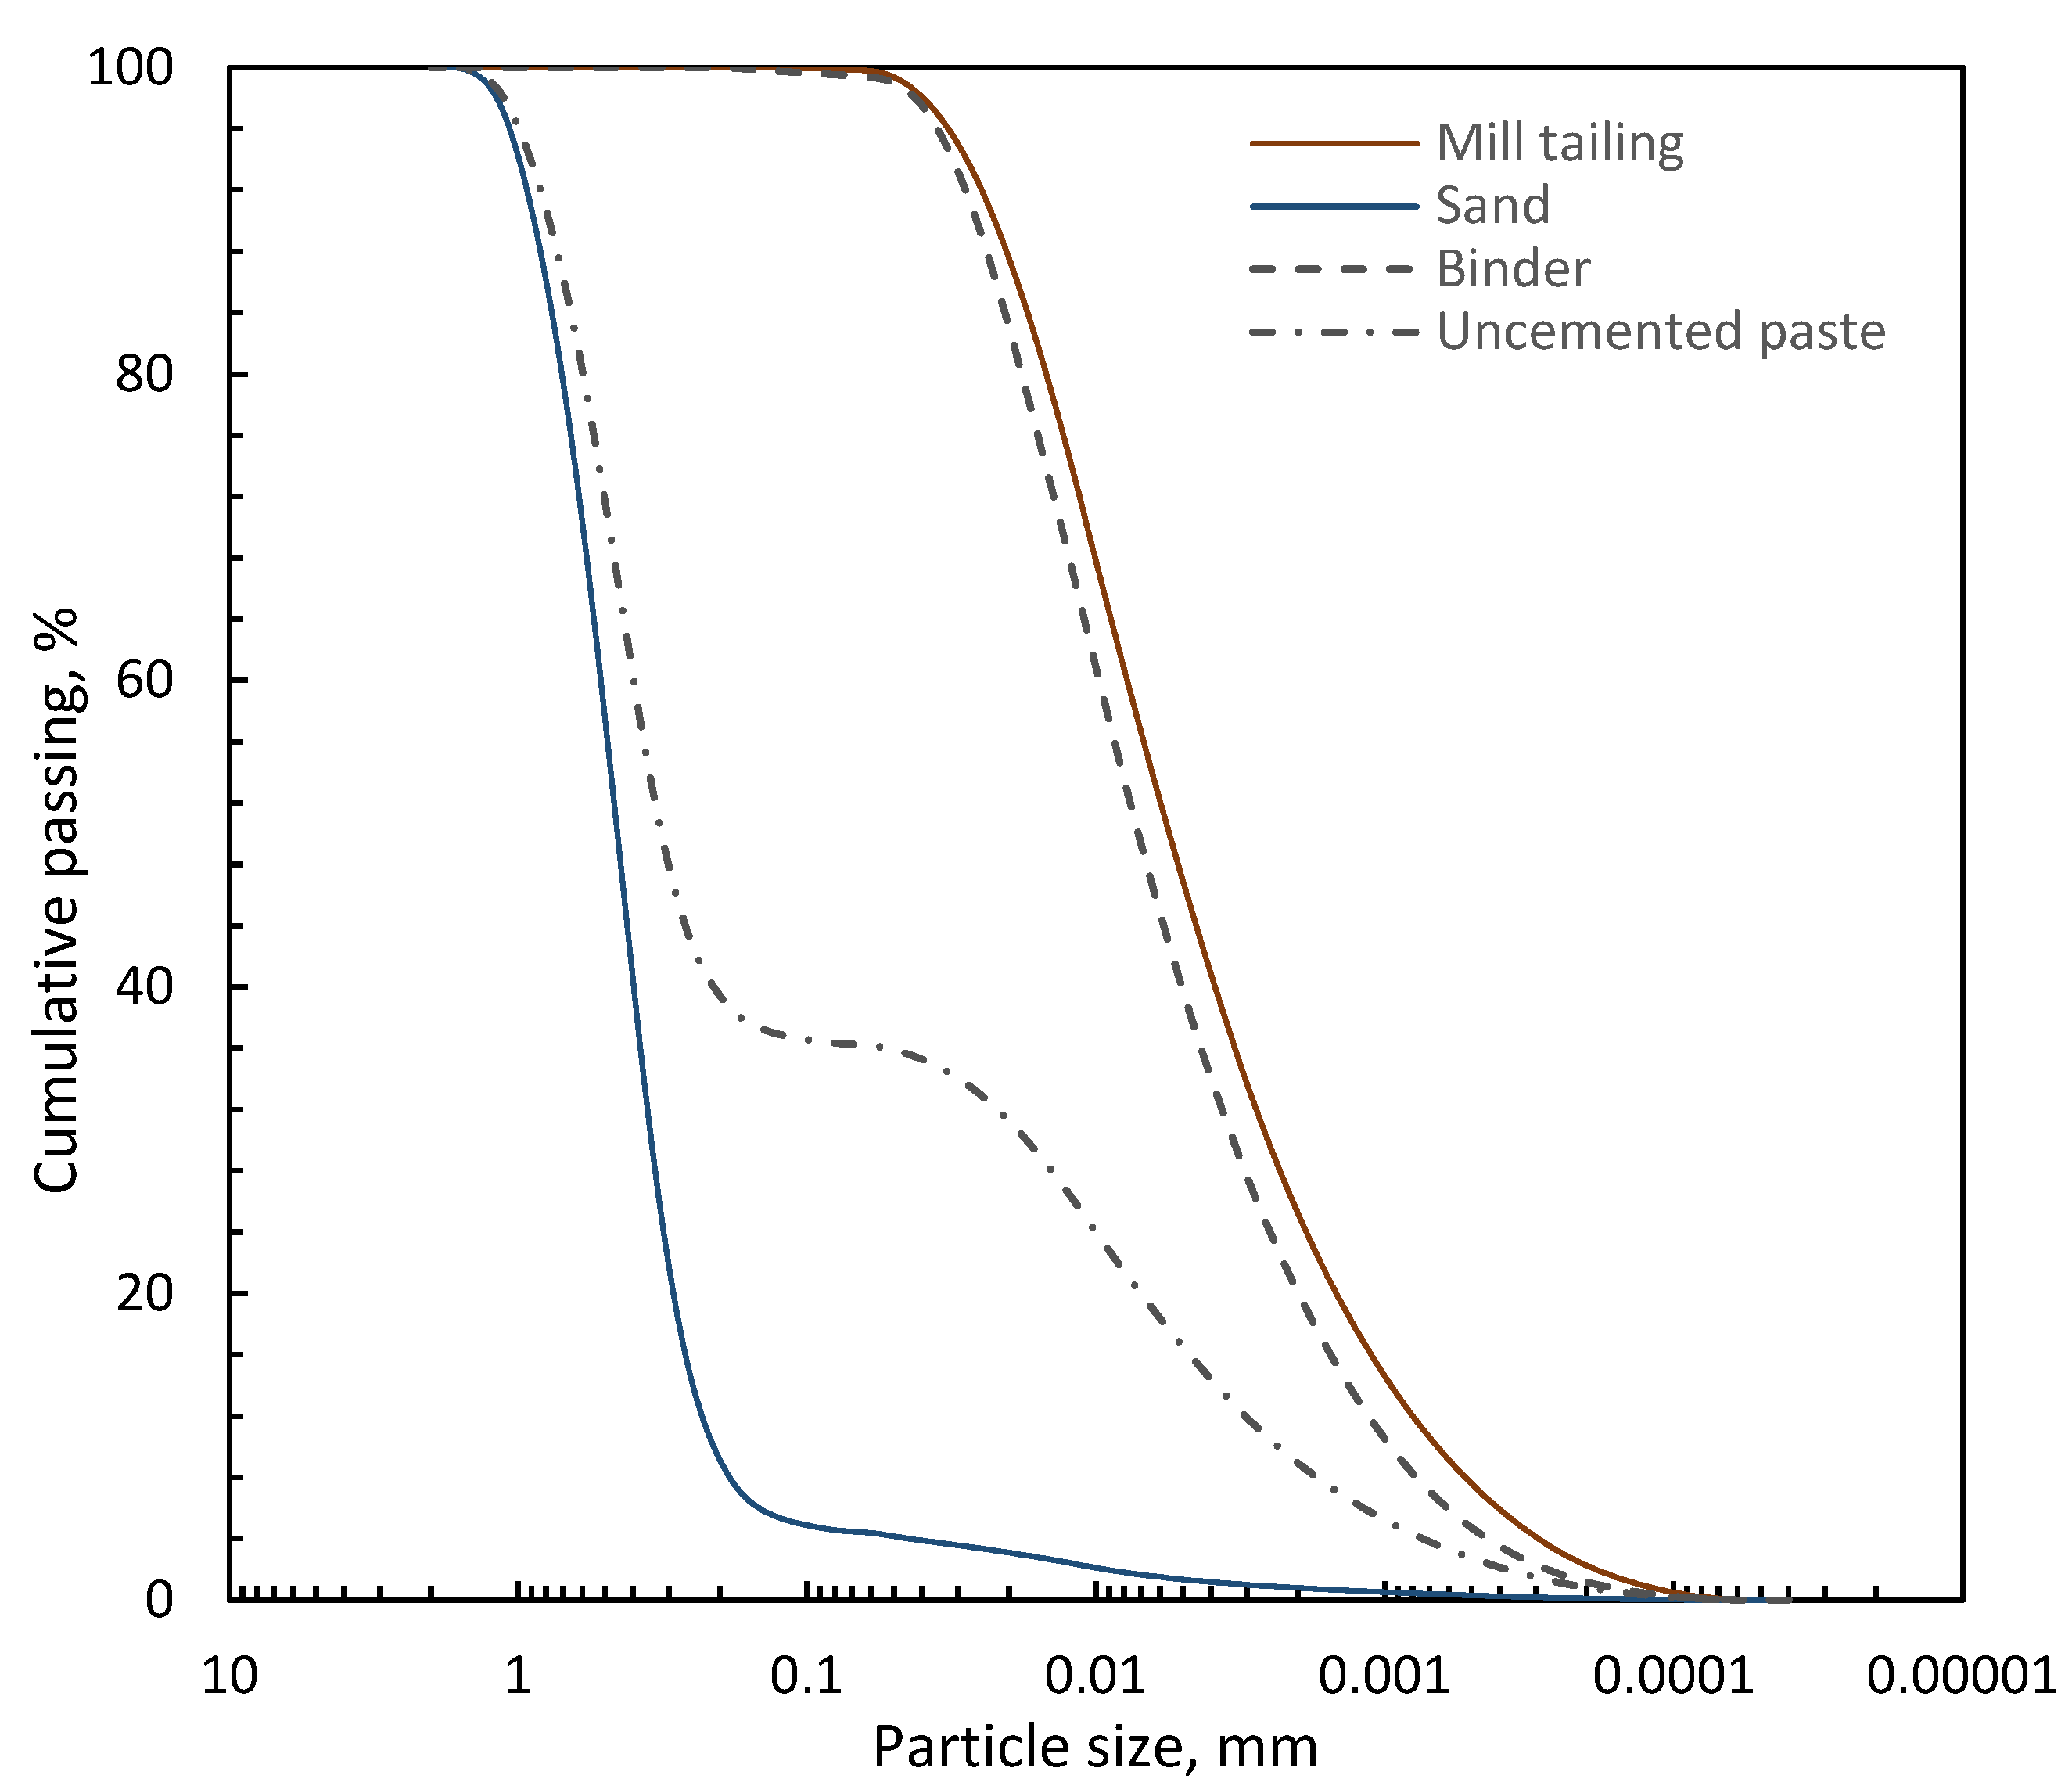
2.1. Materials
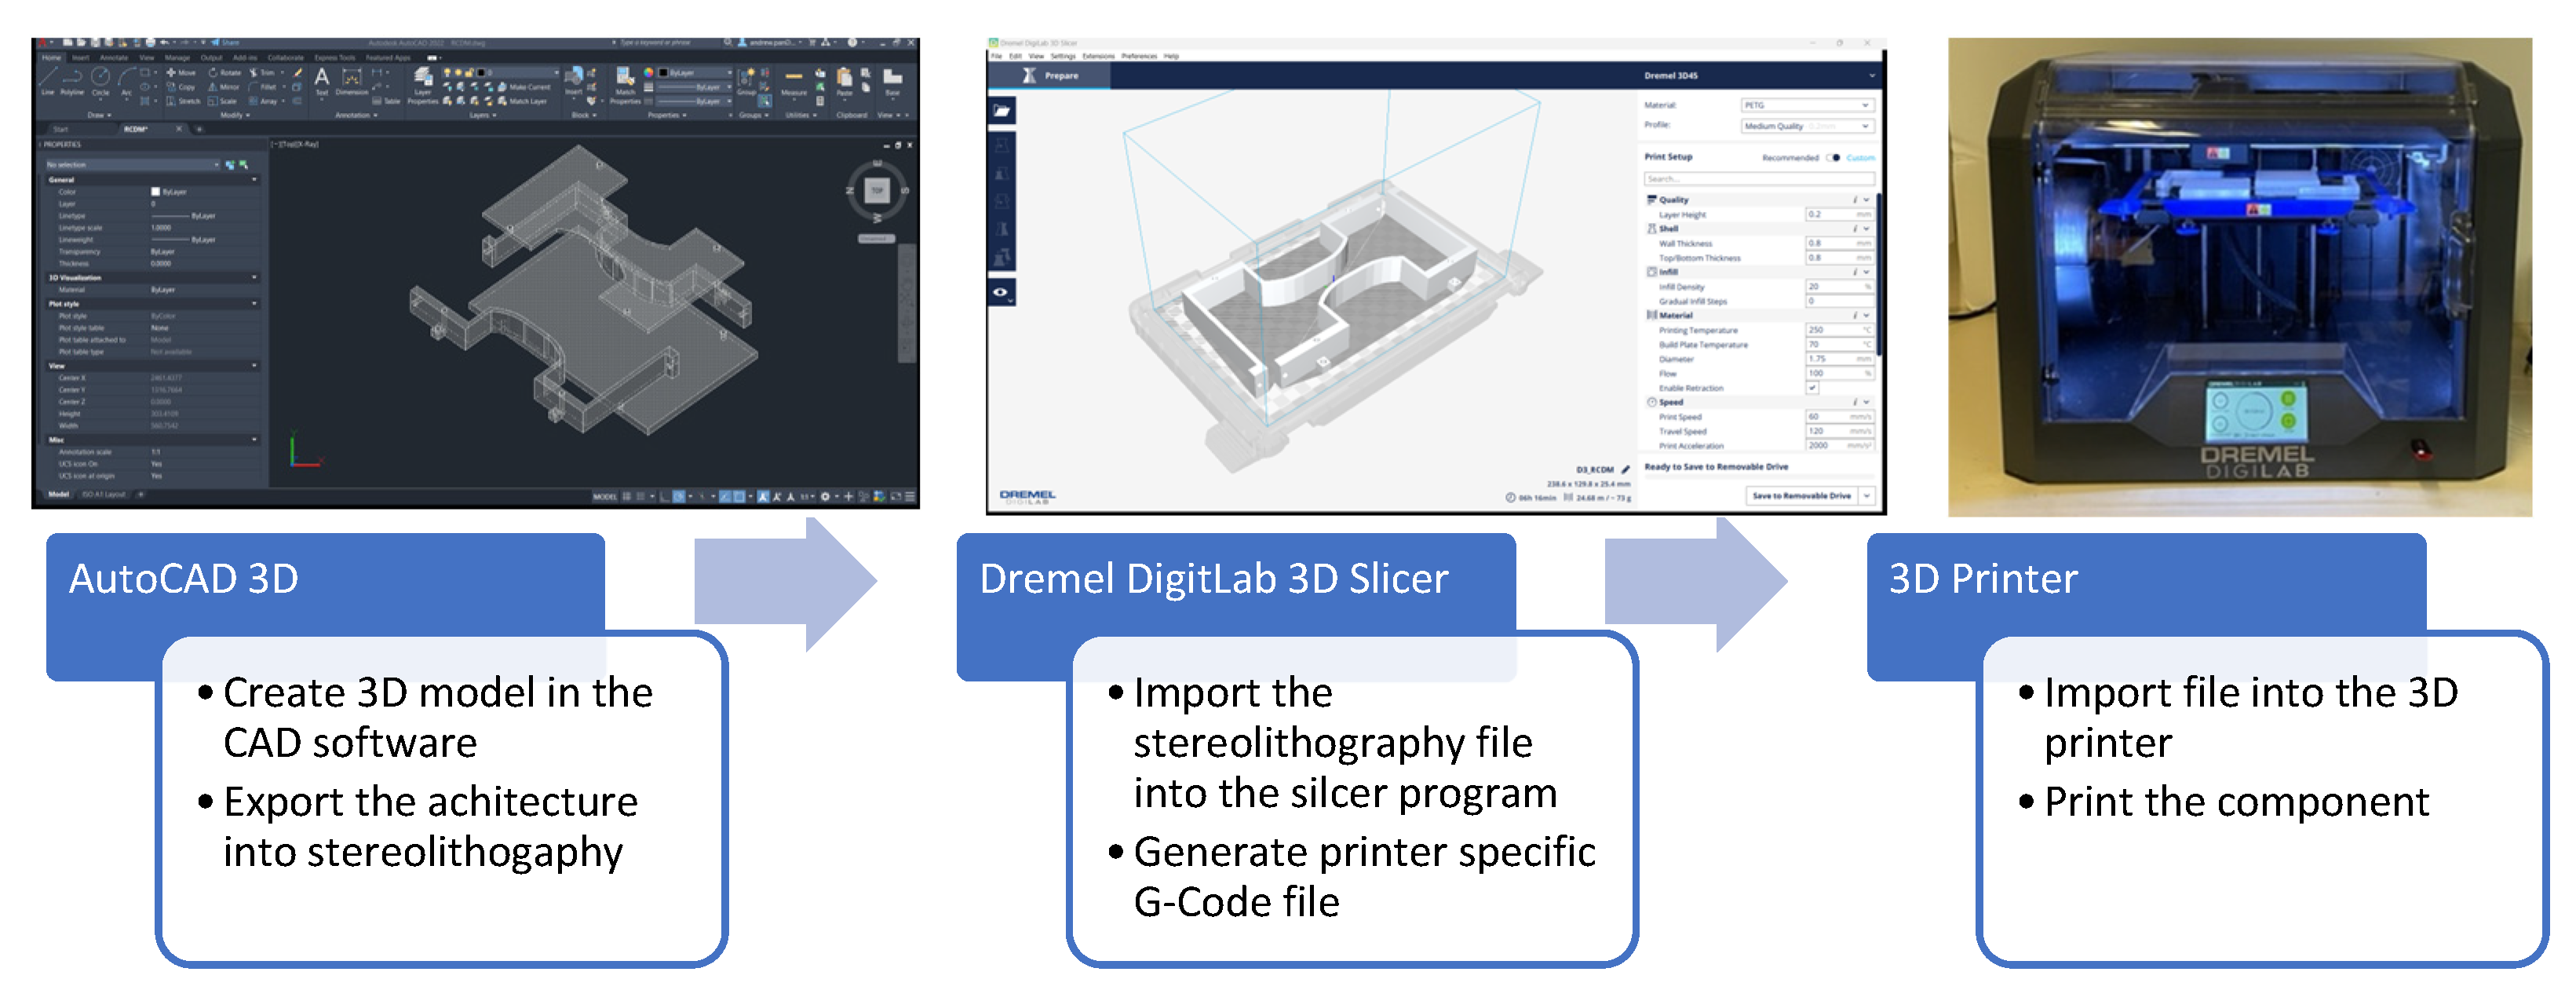
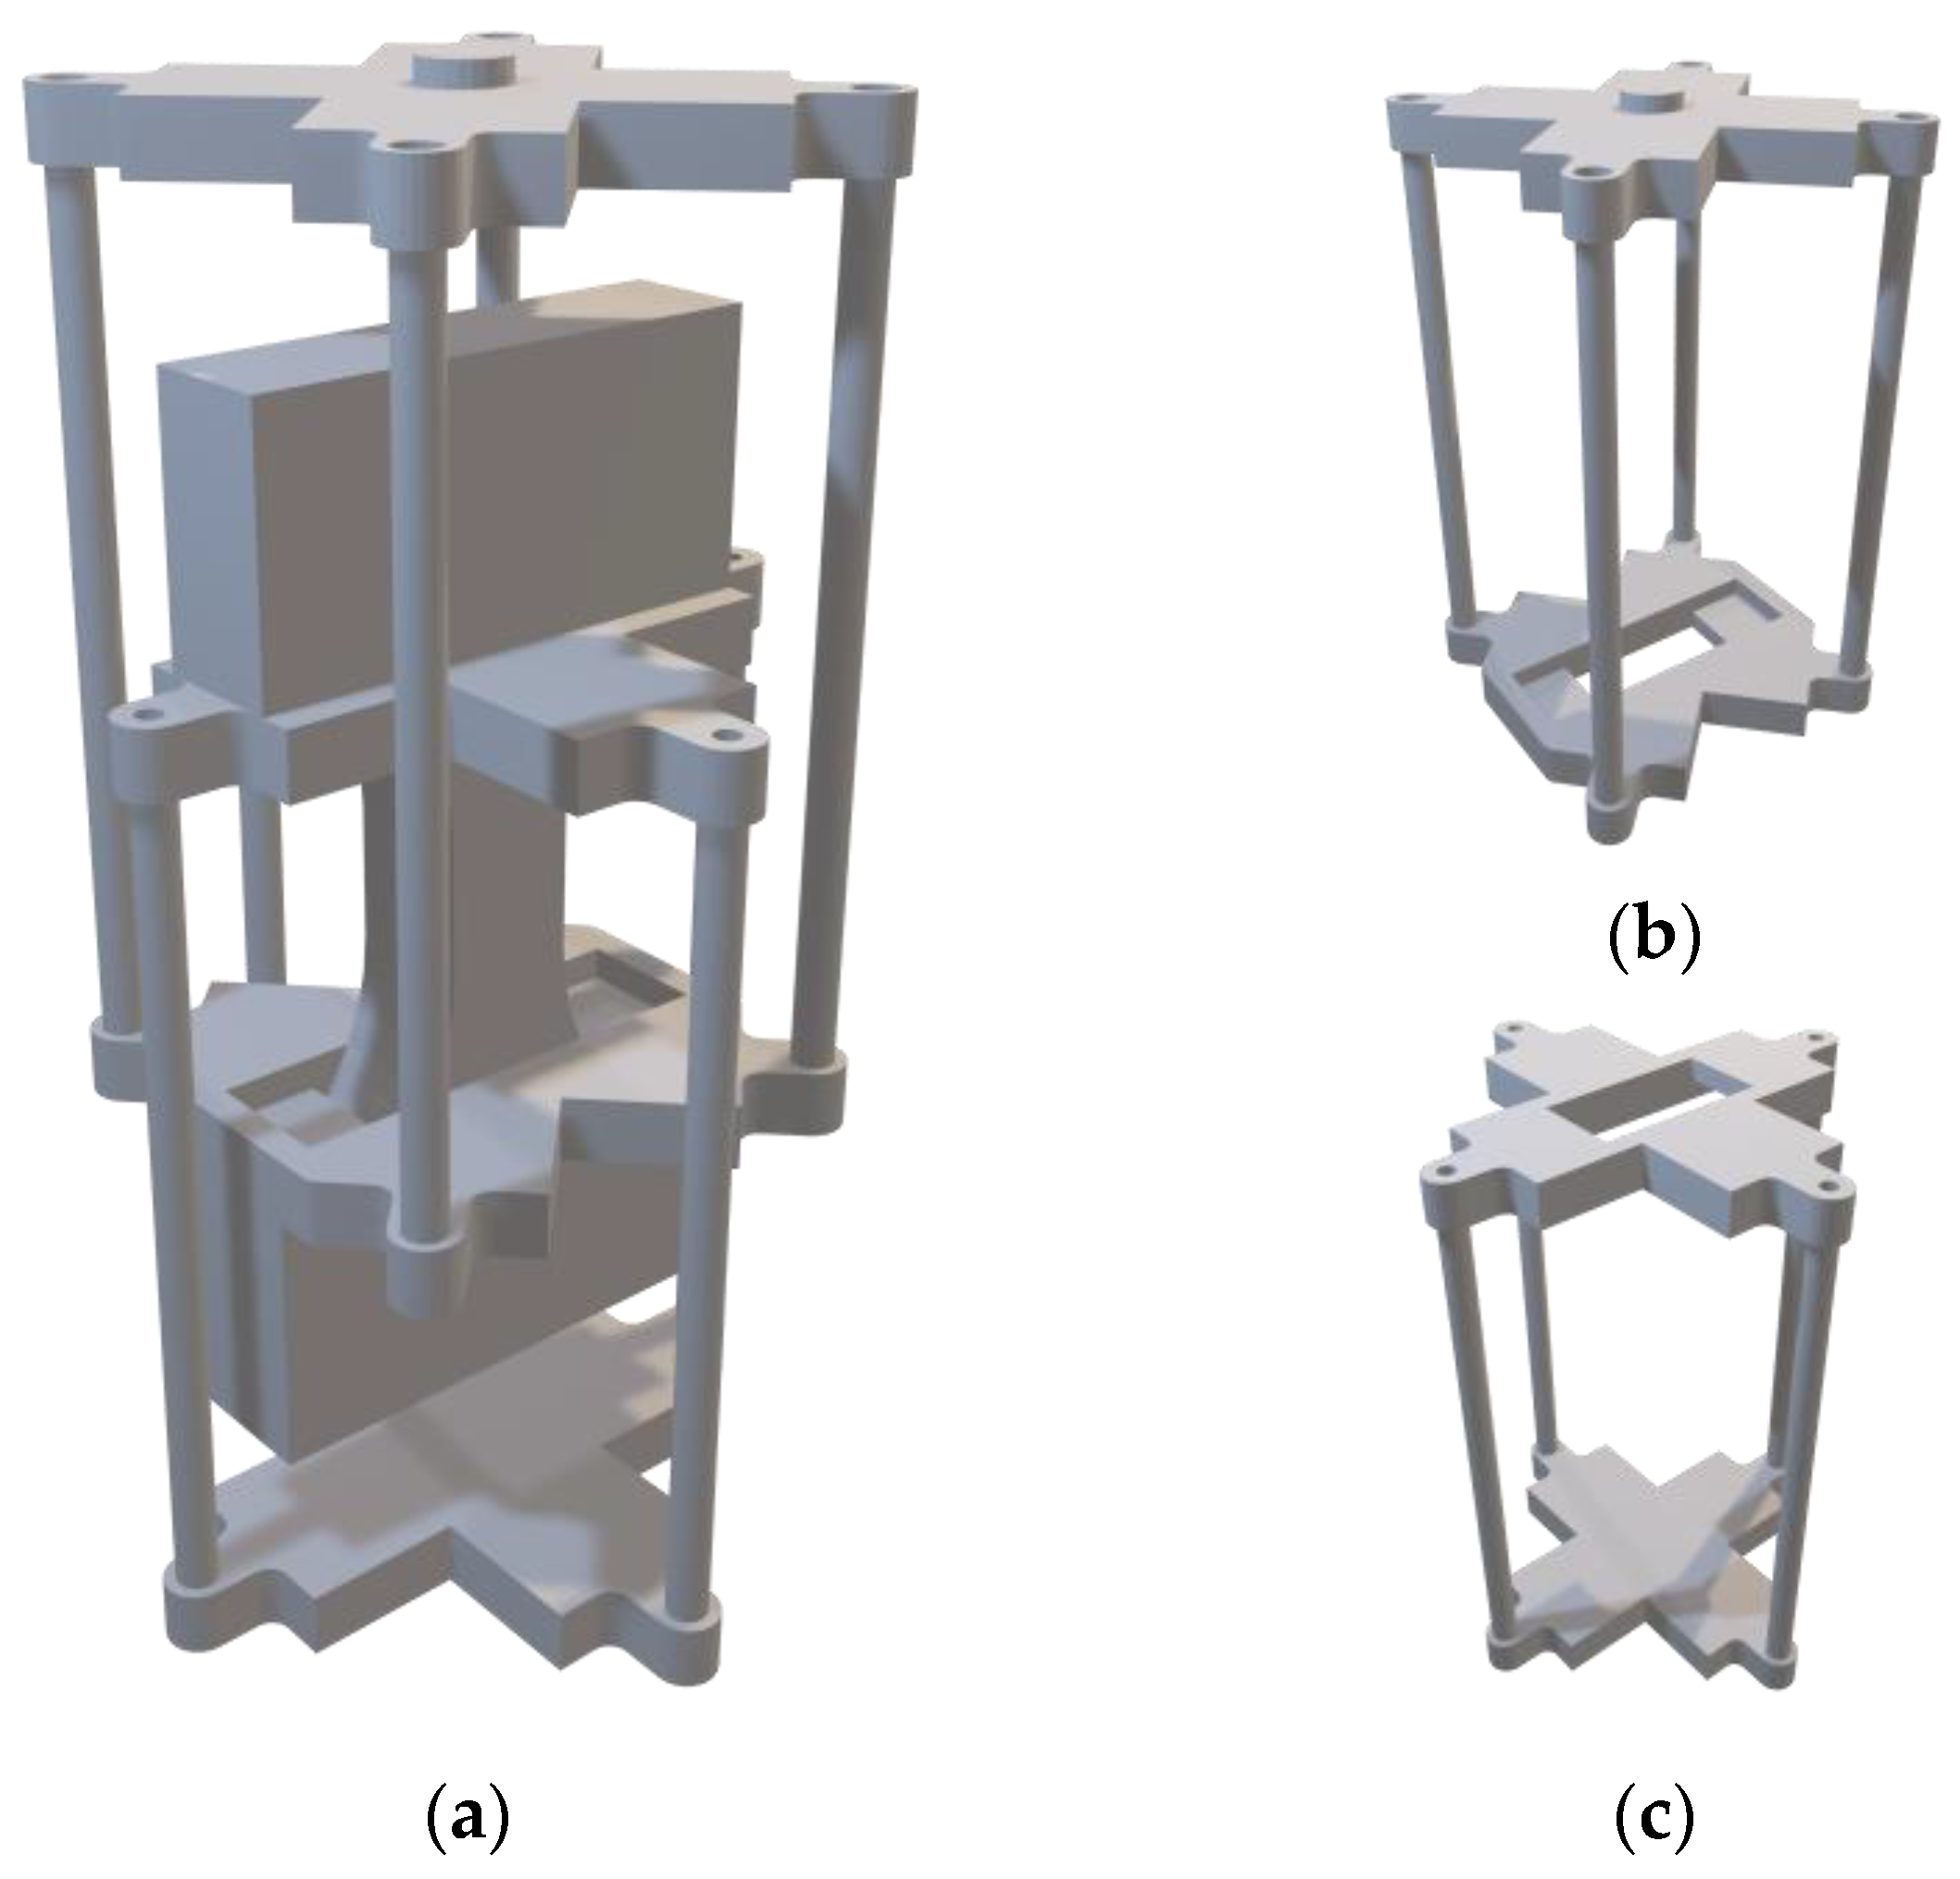
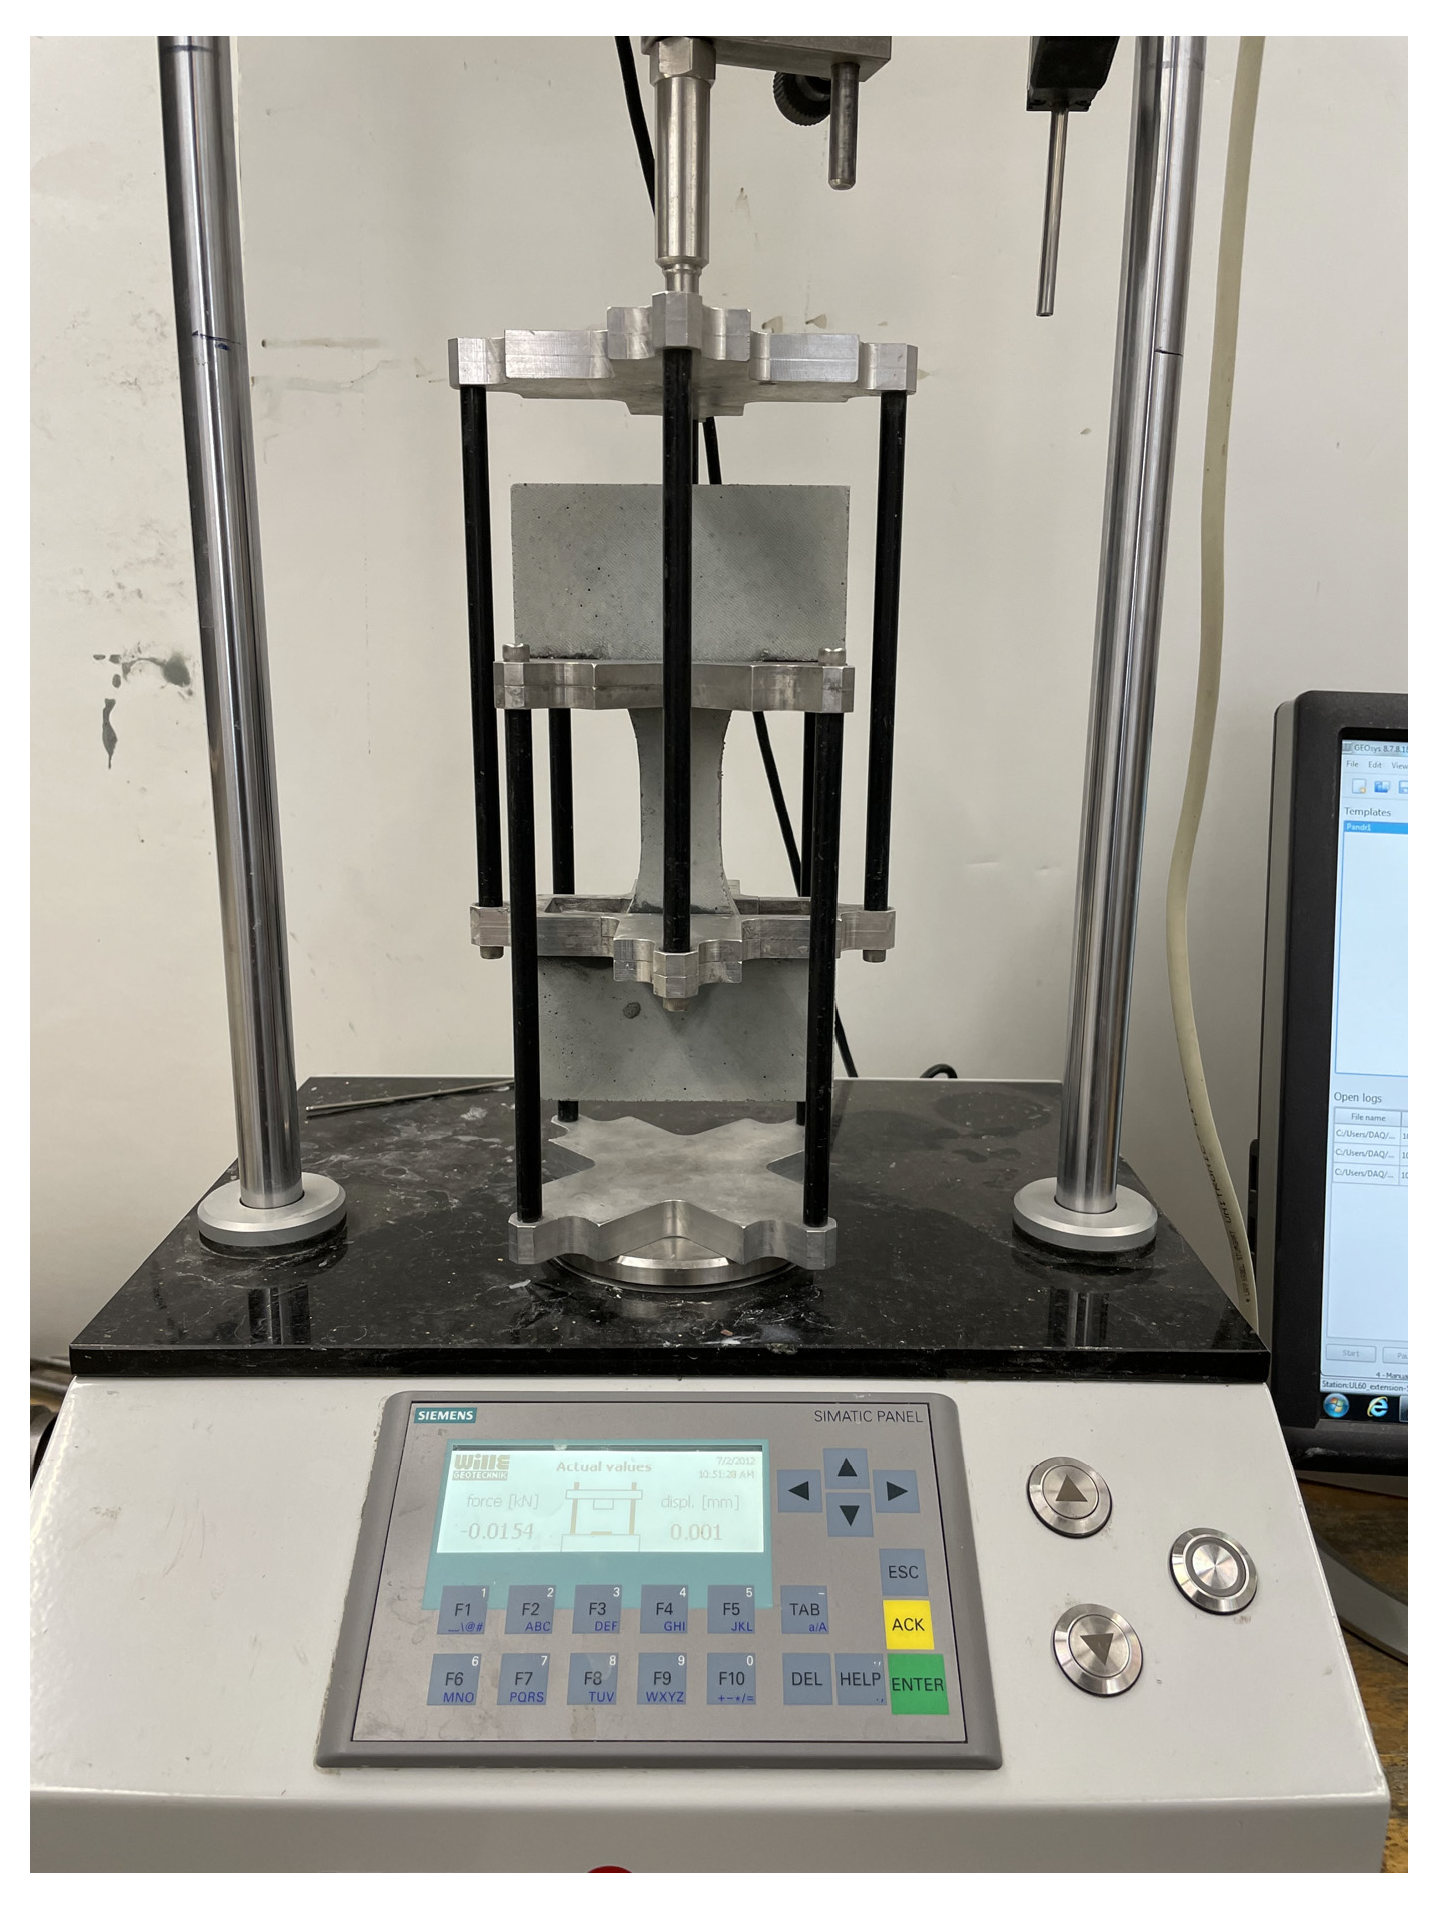
2.2. Test Apparatus
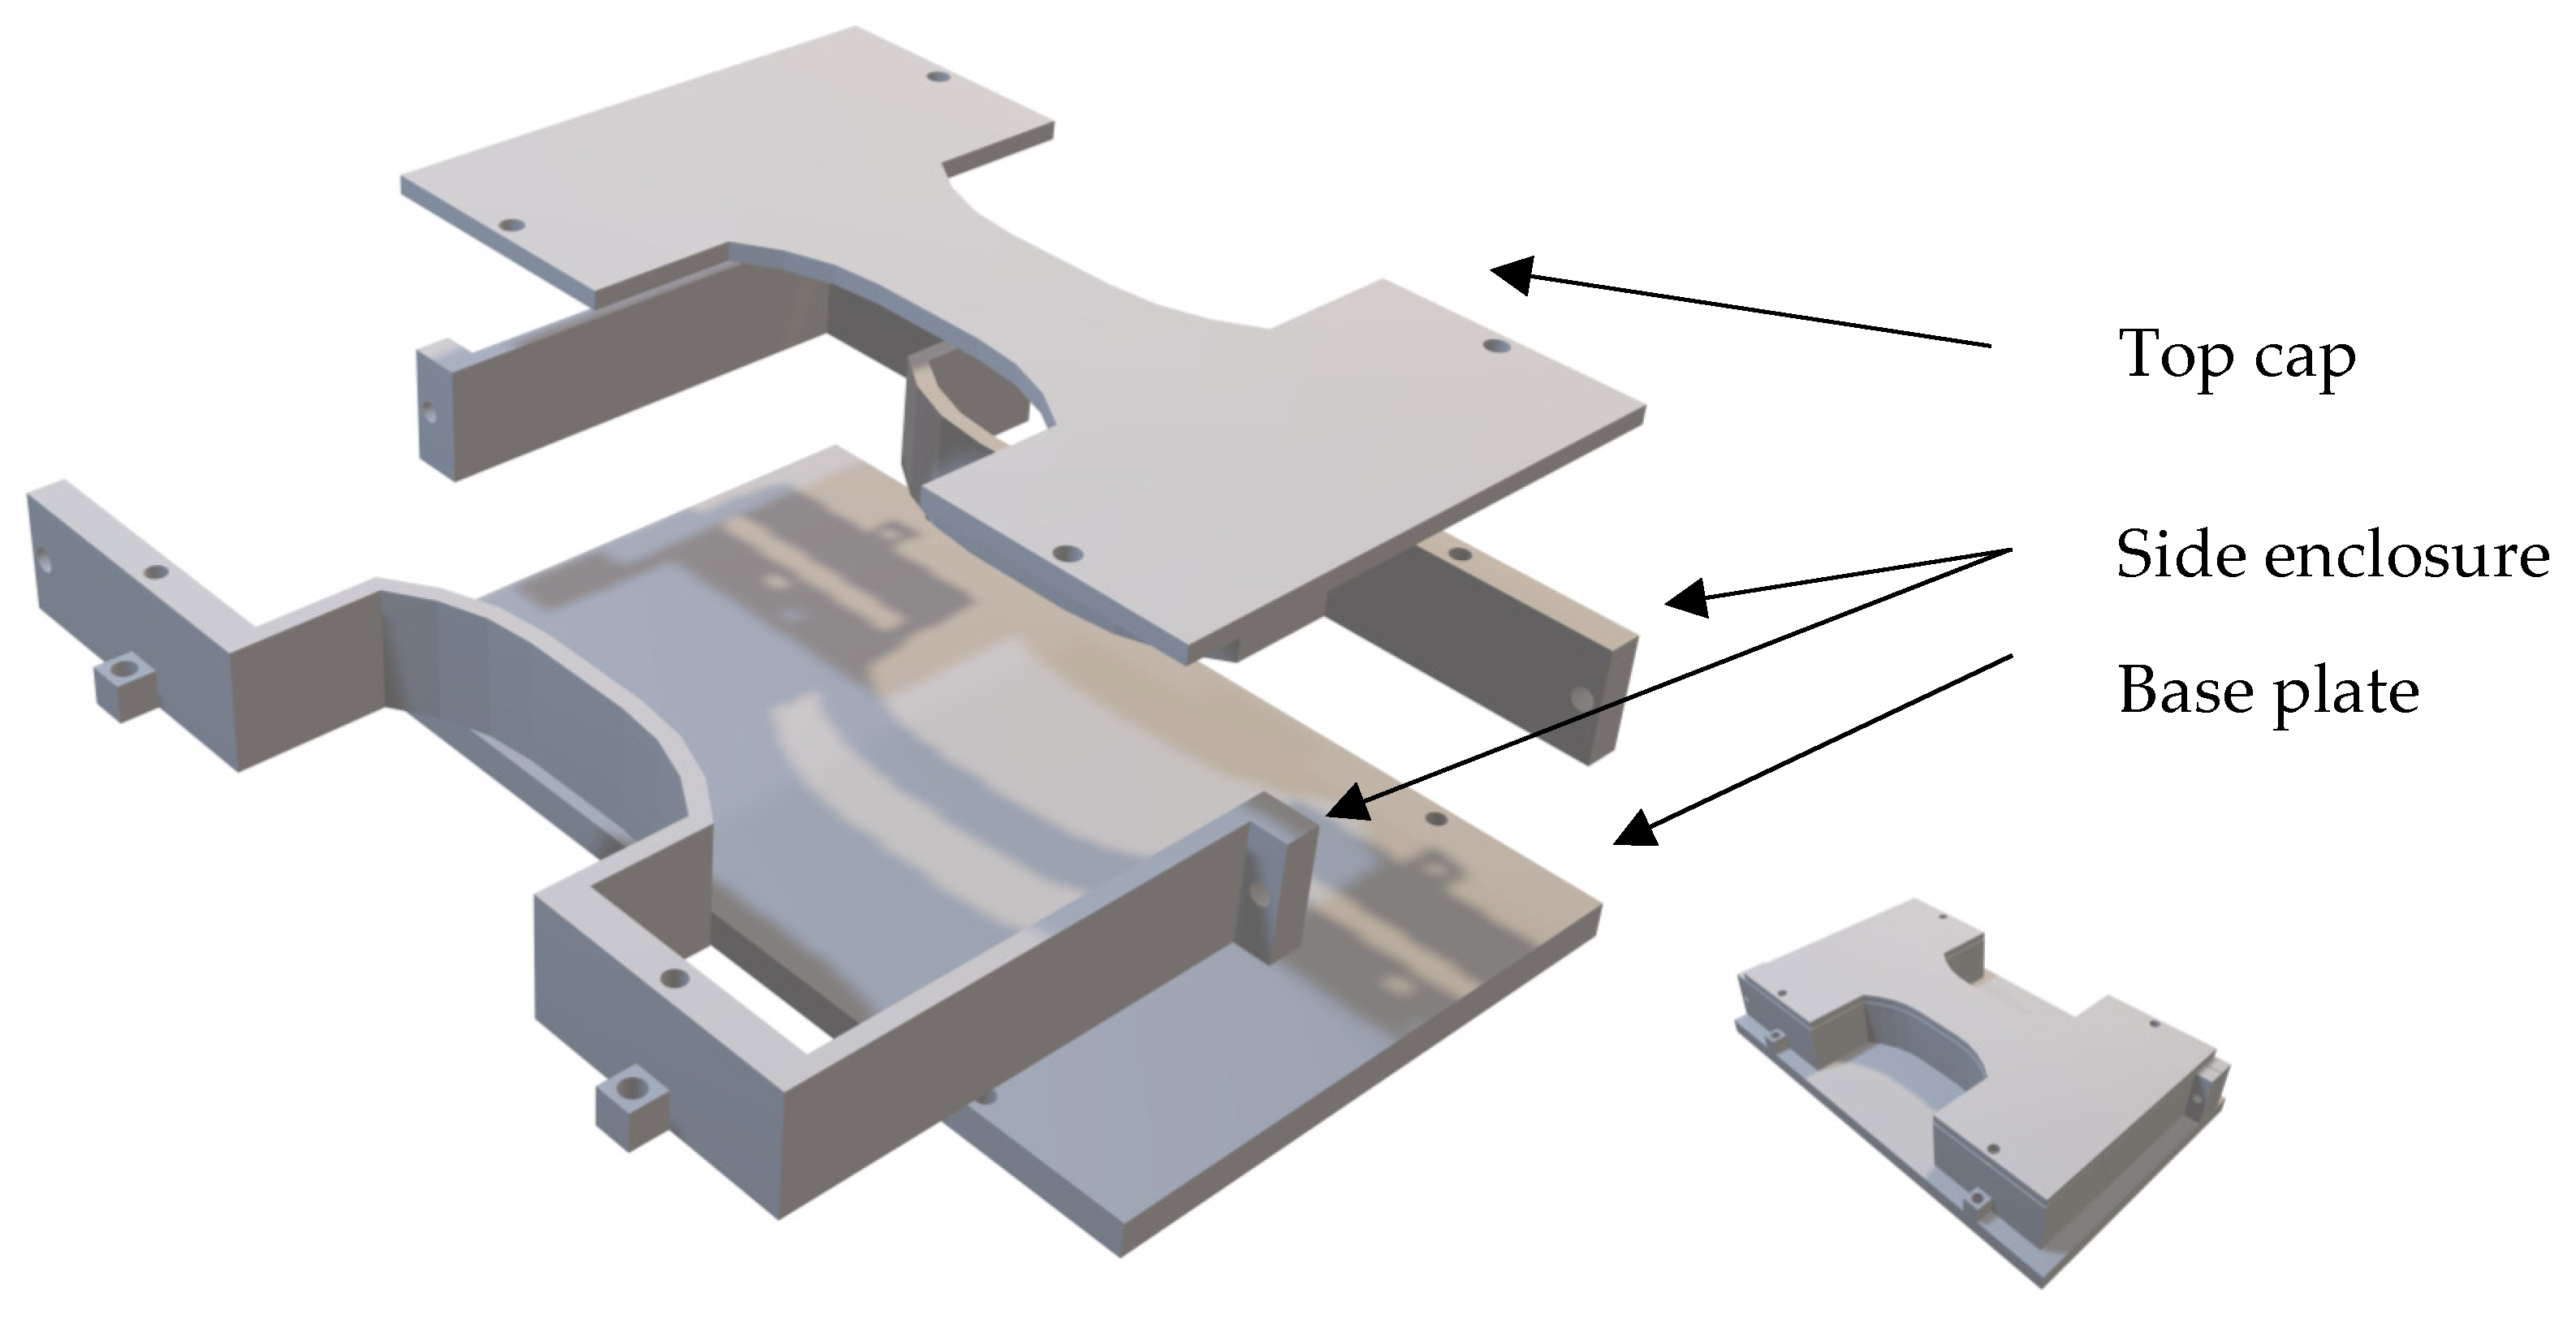
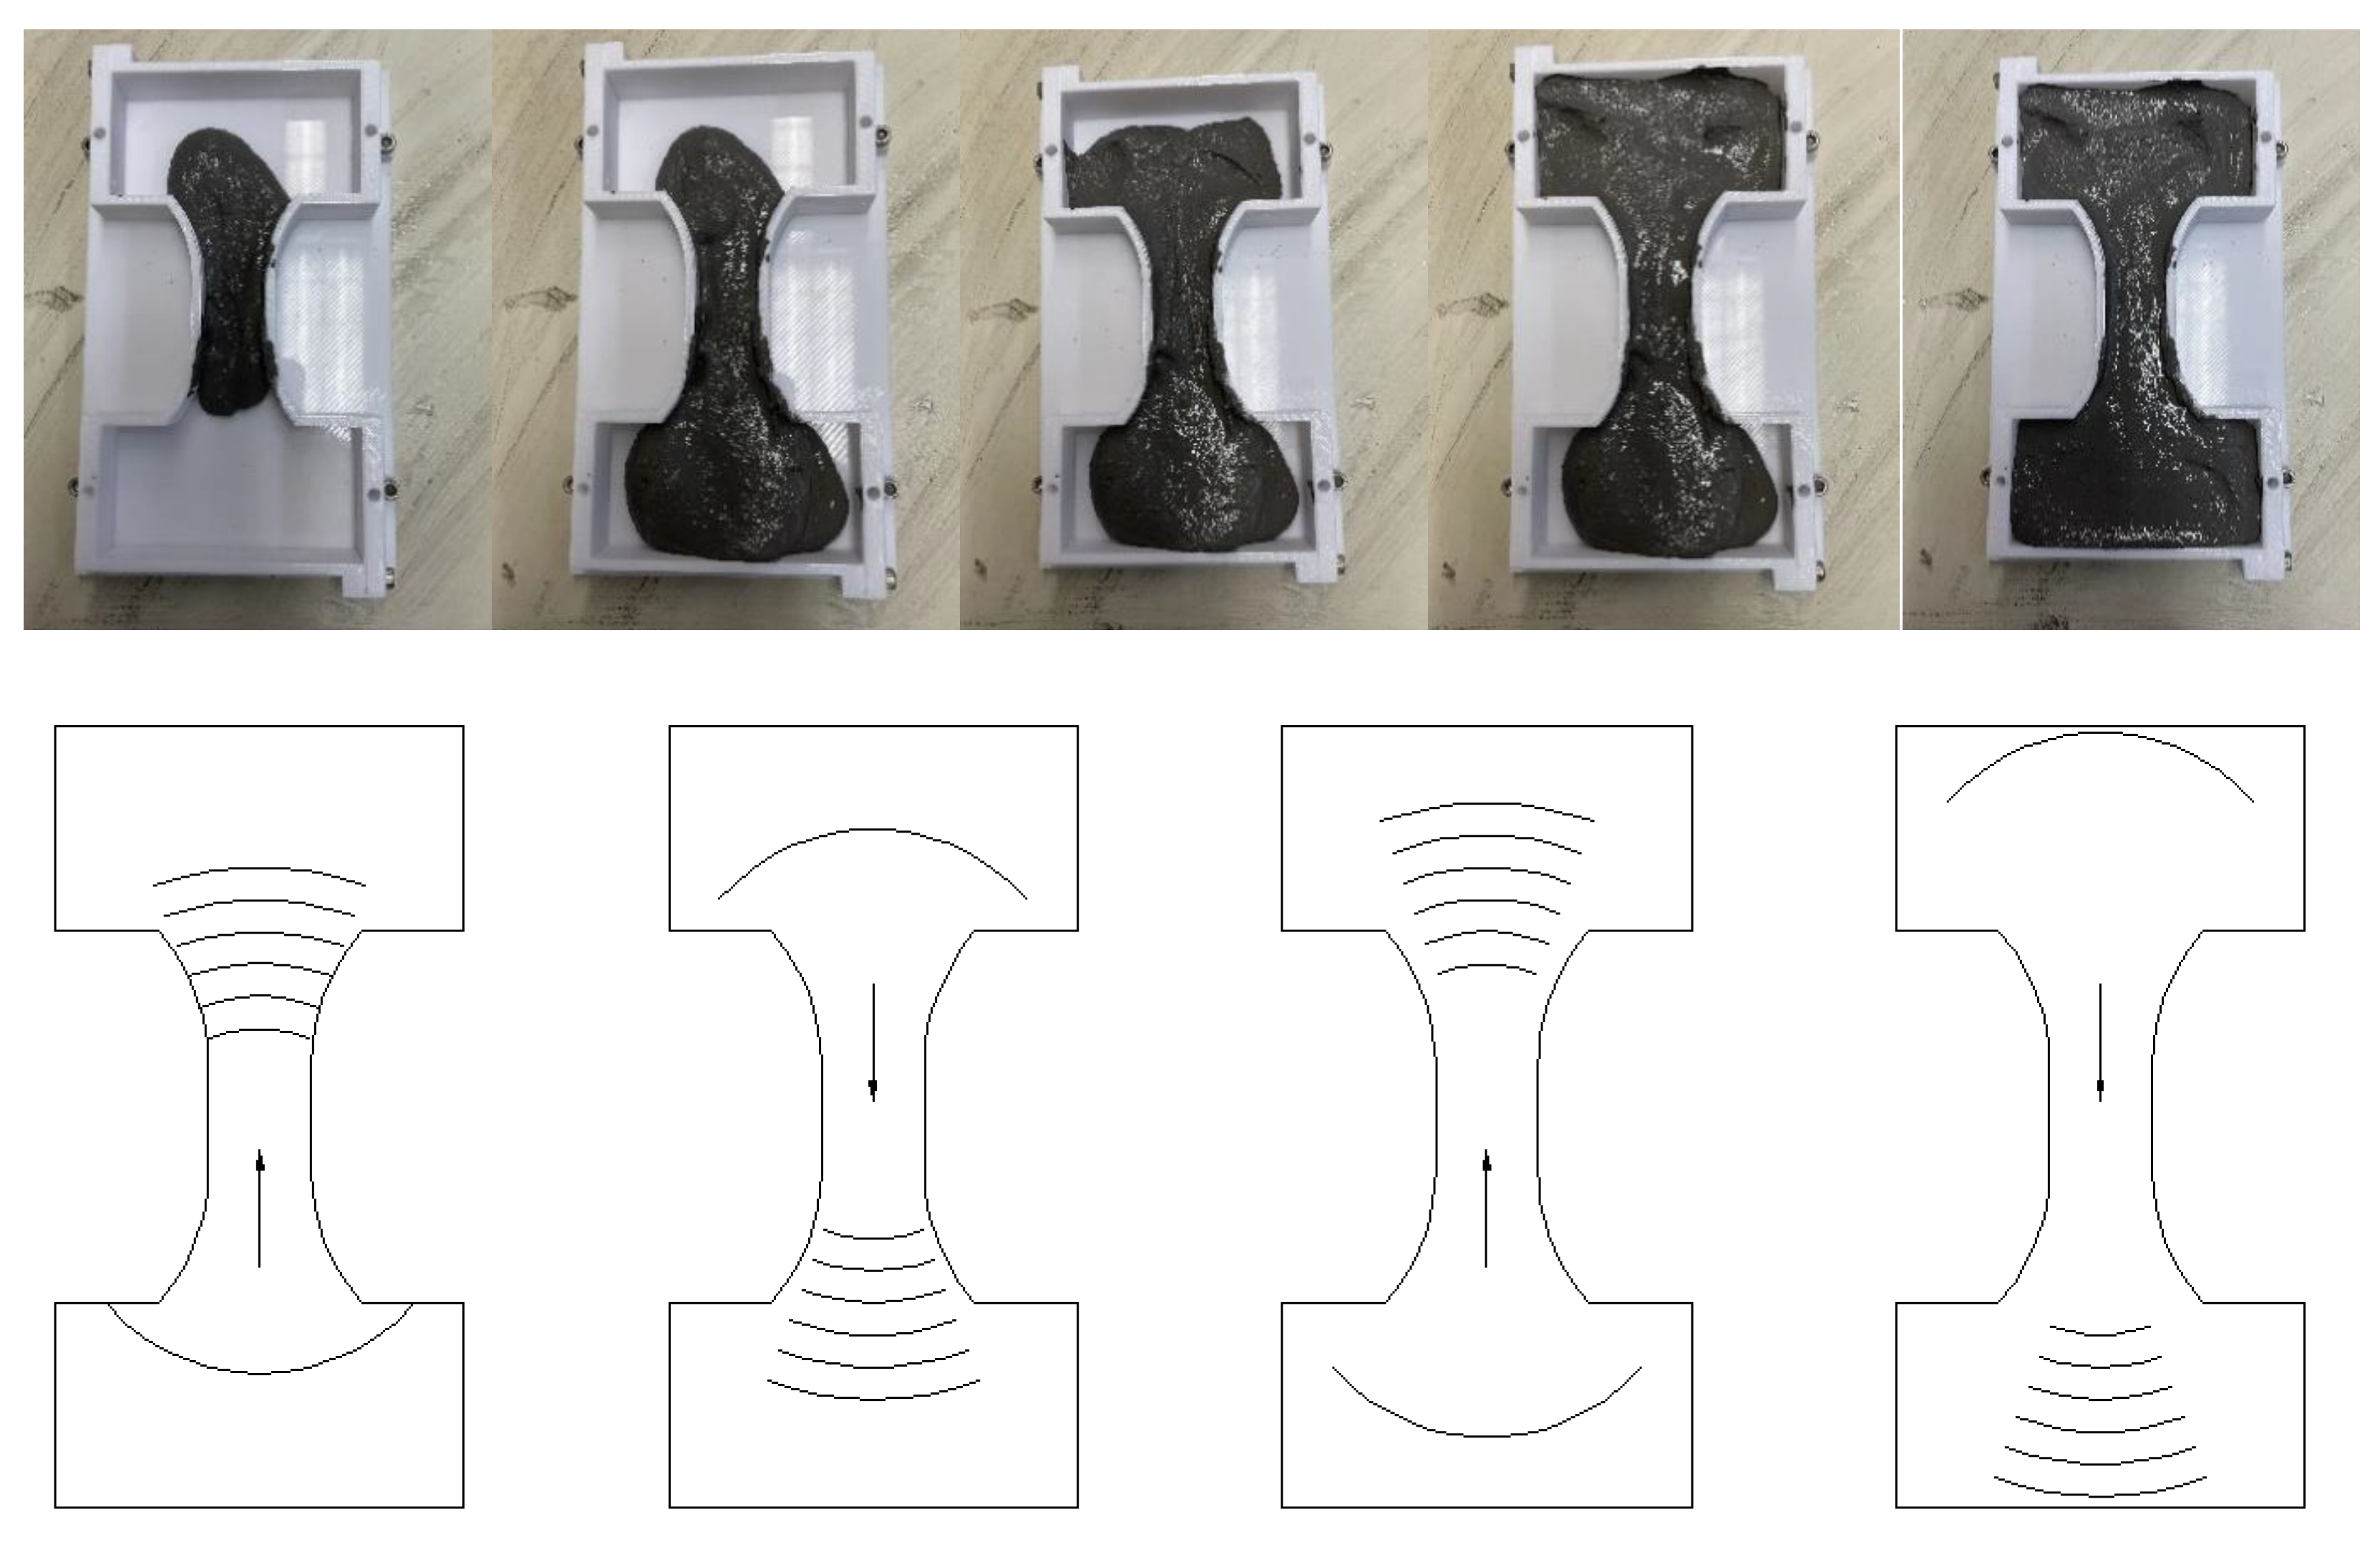
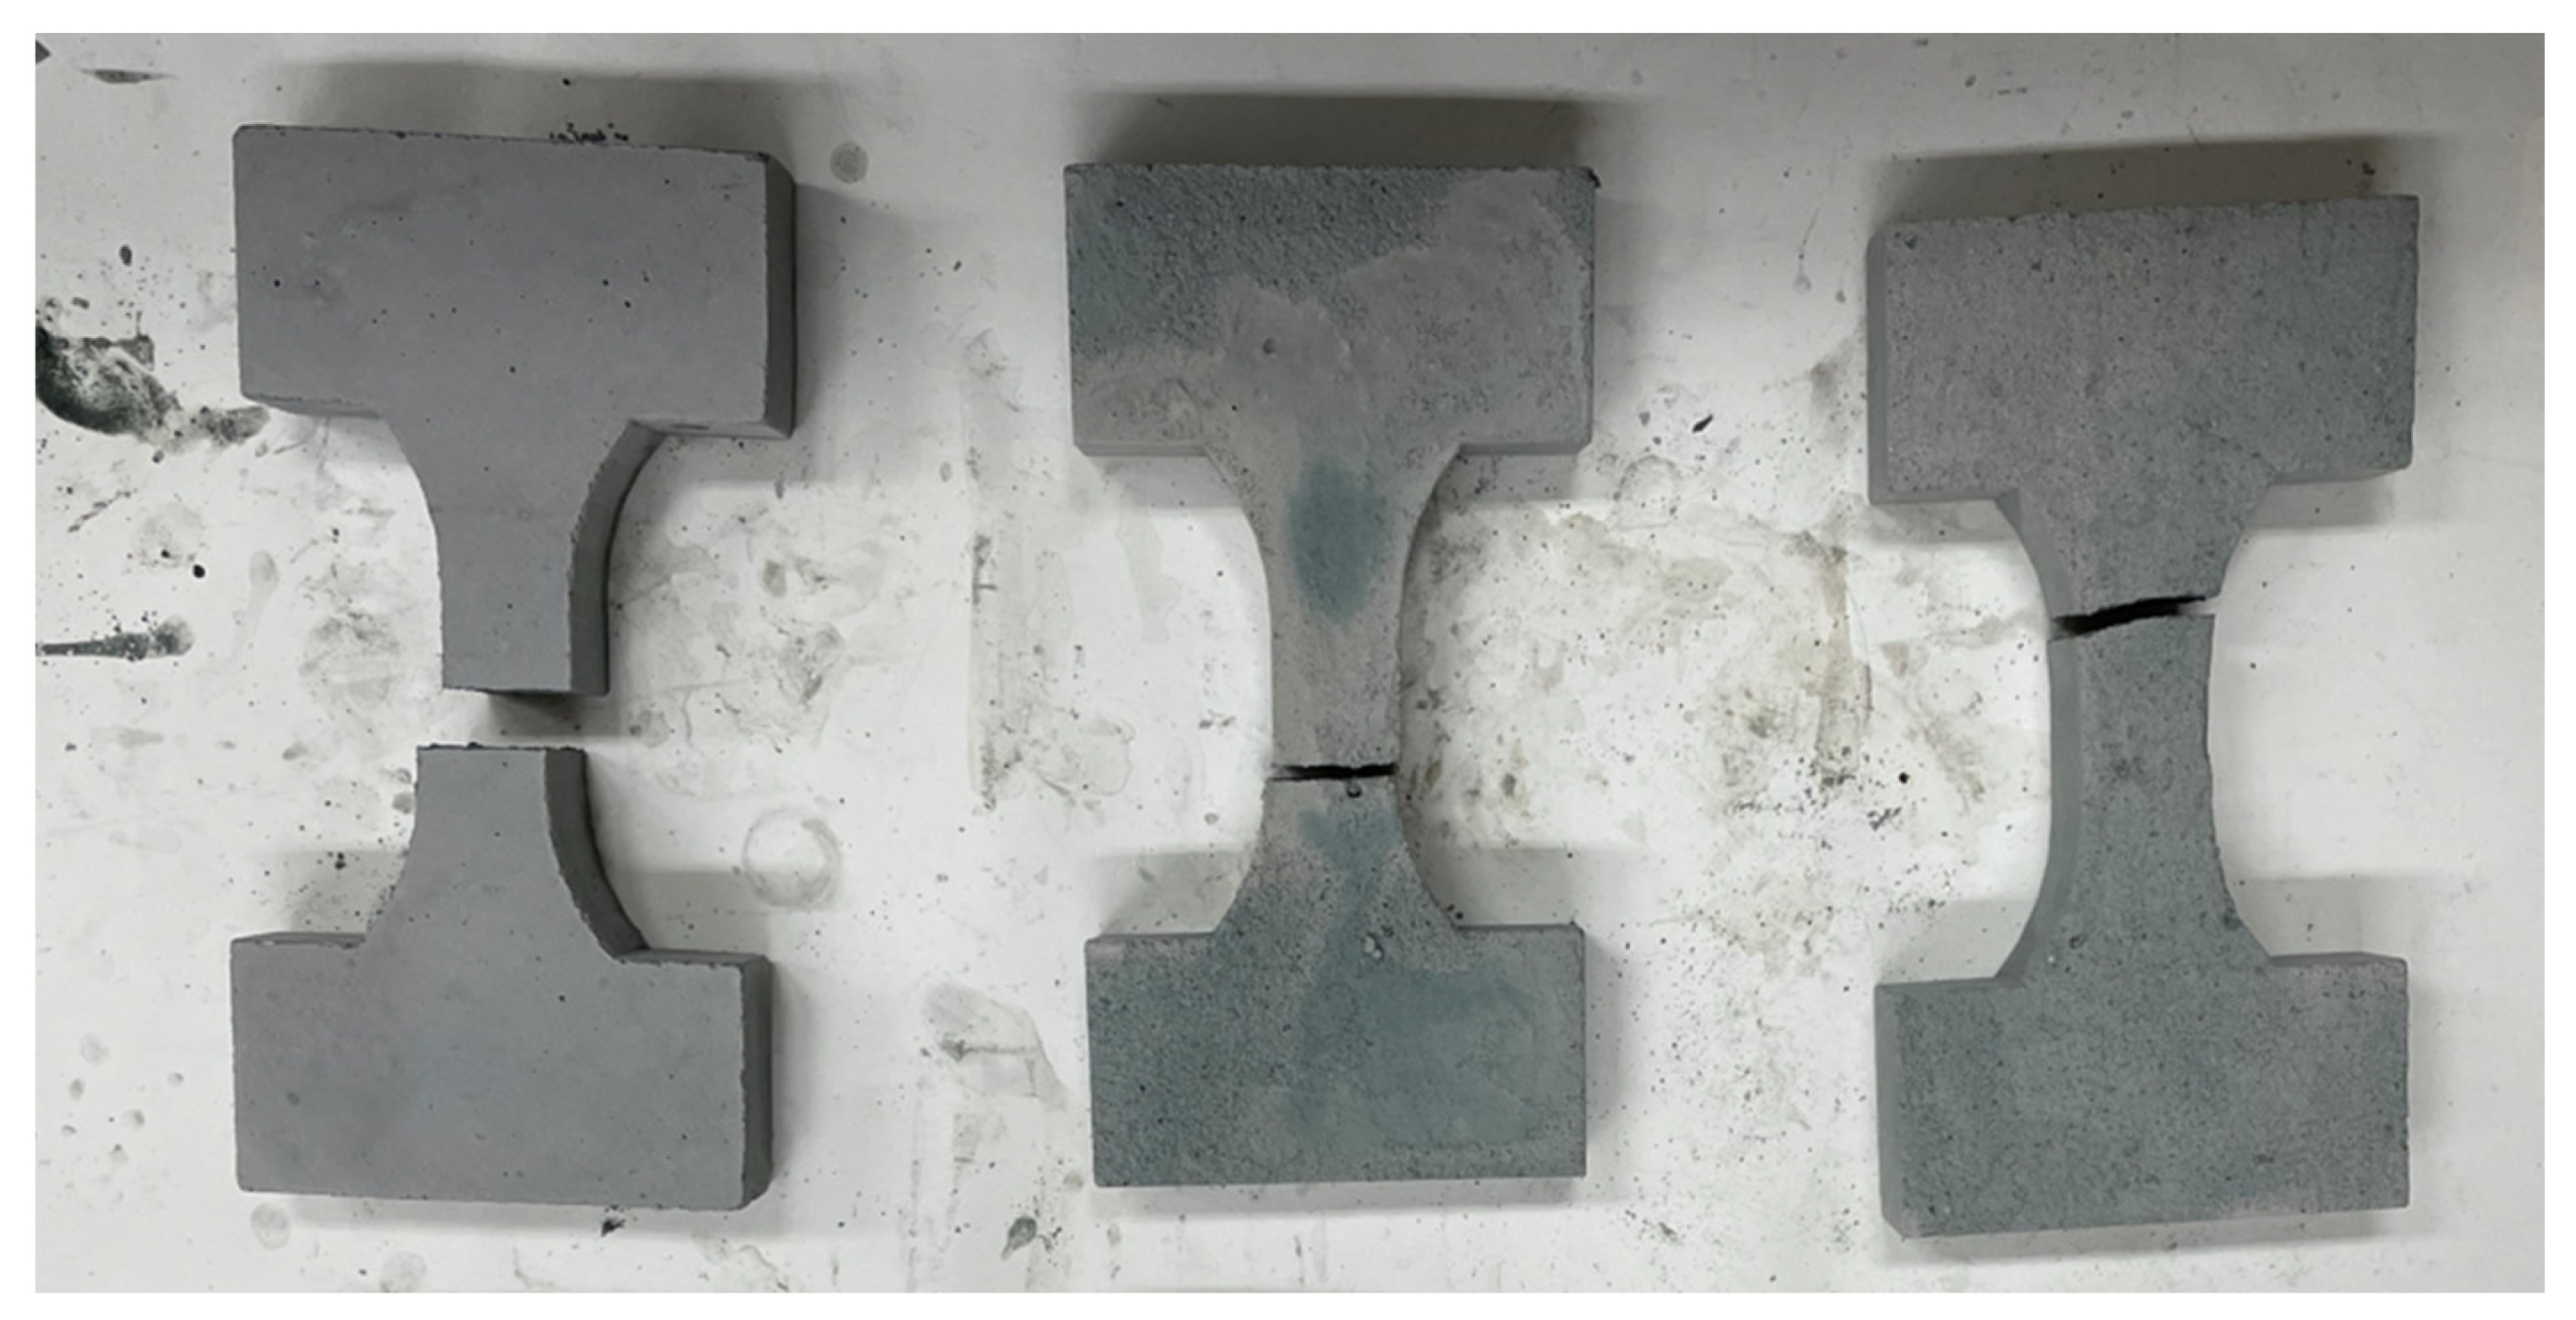
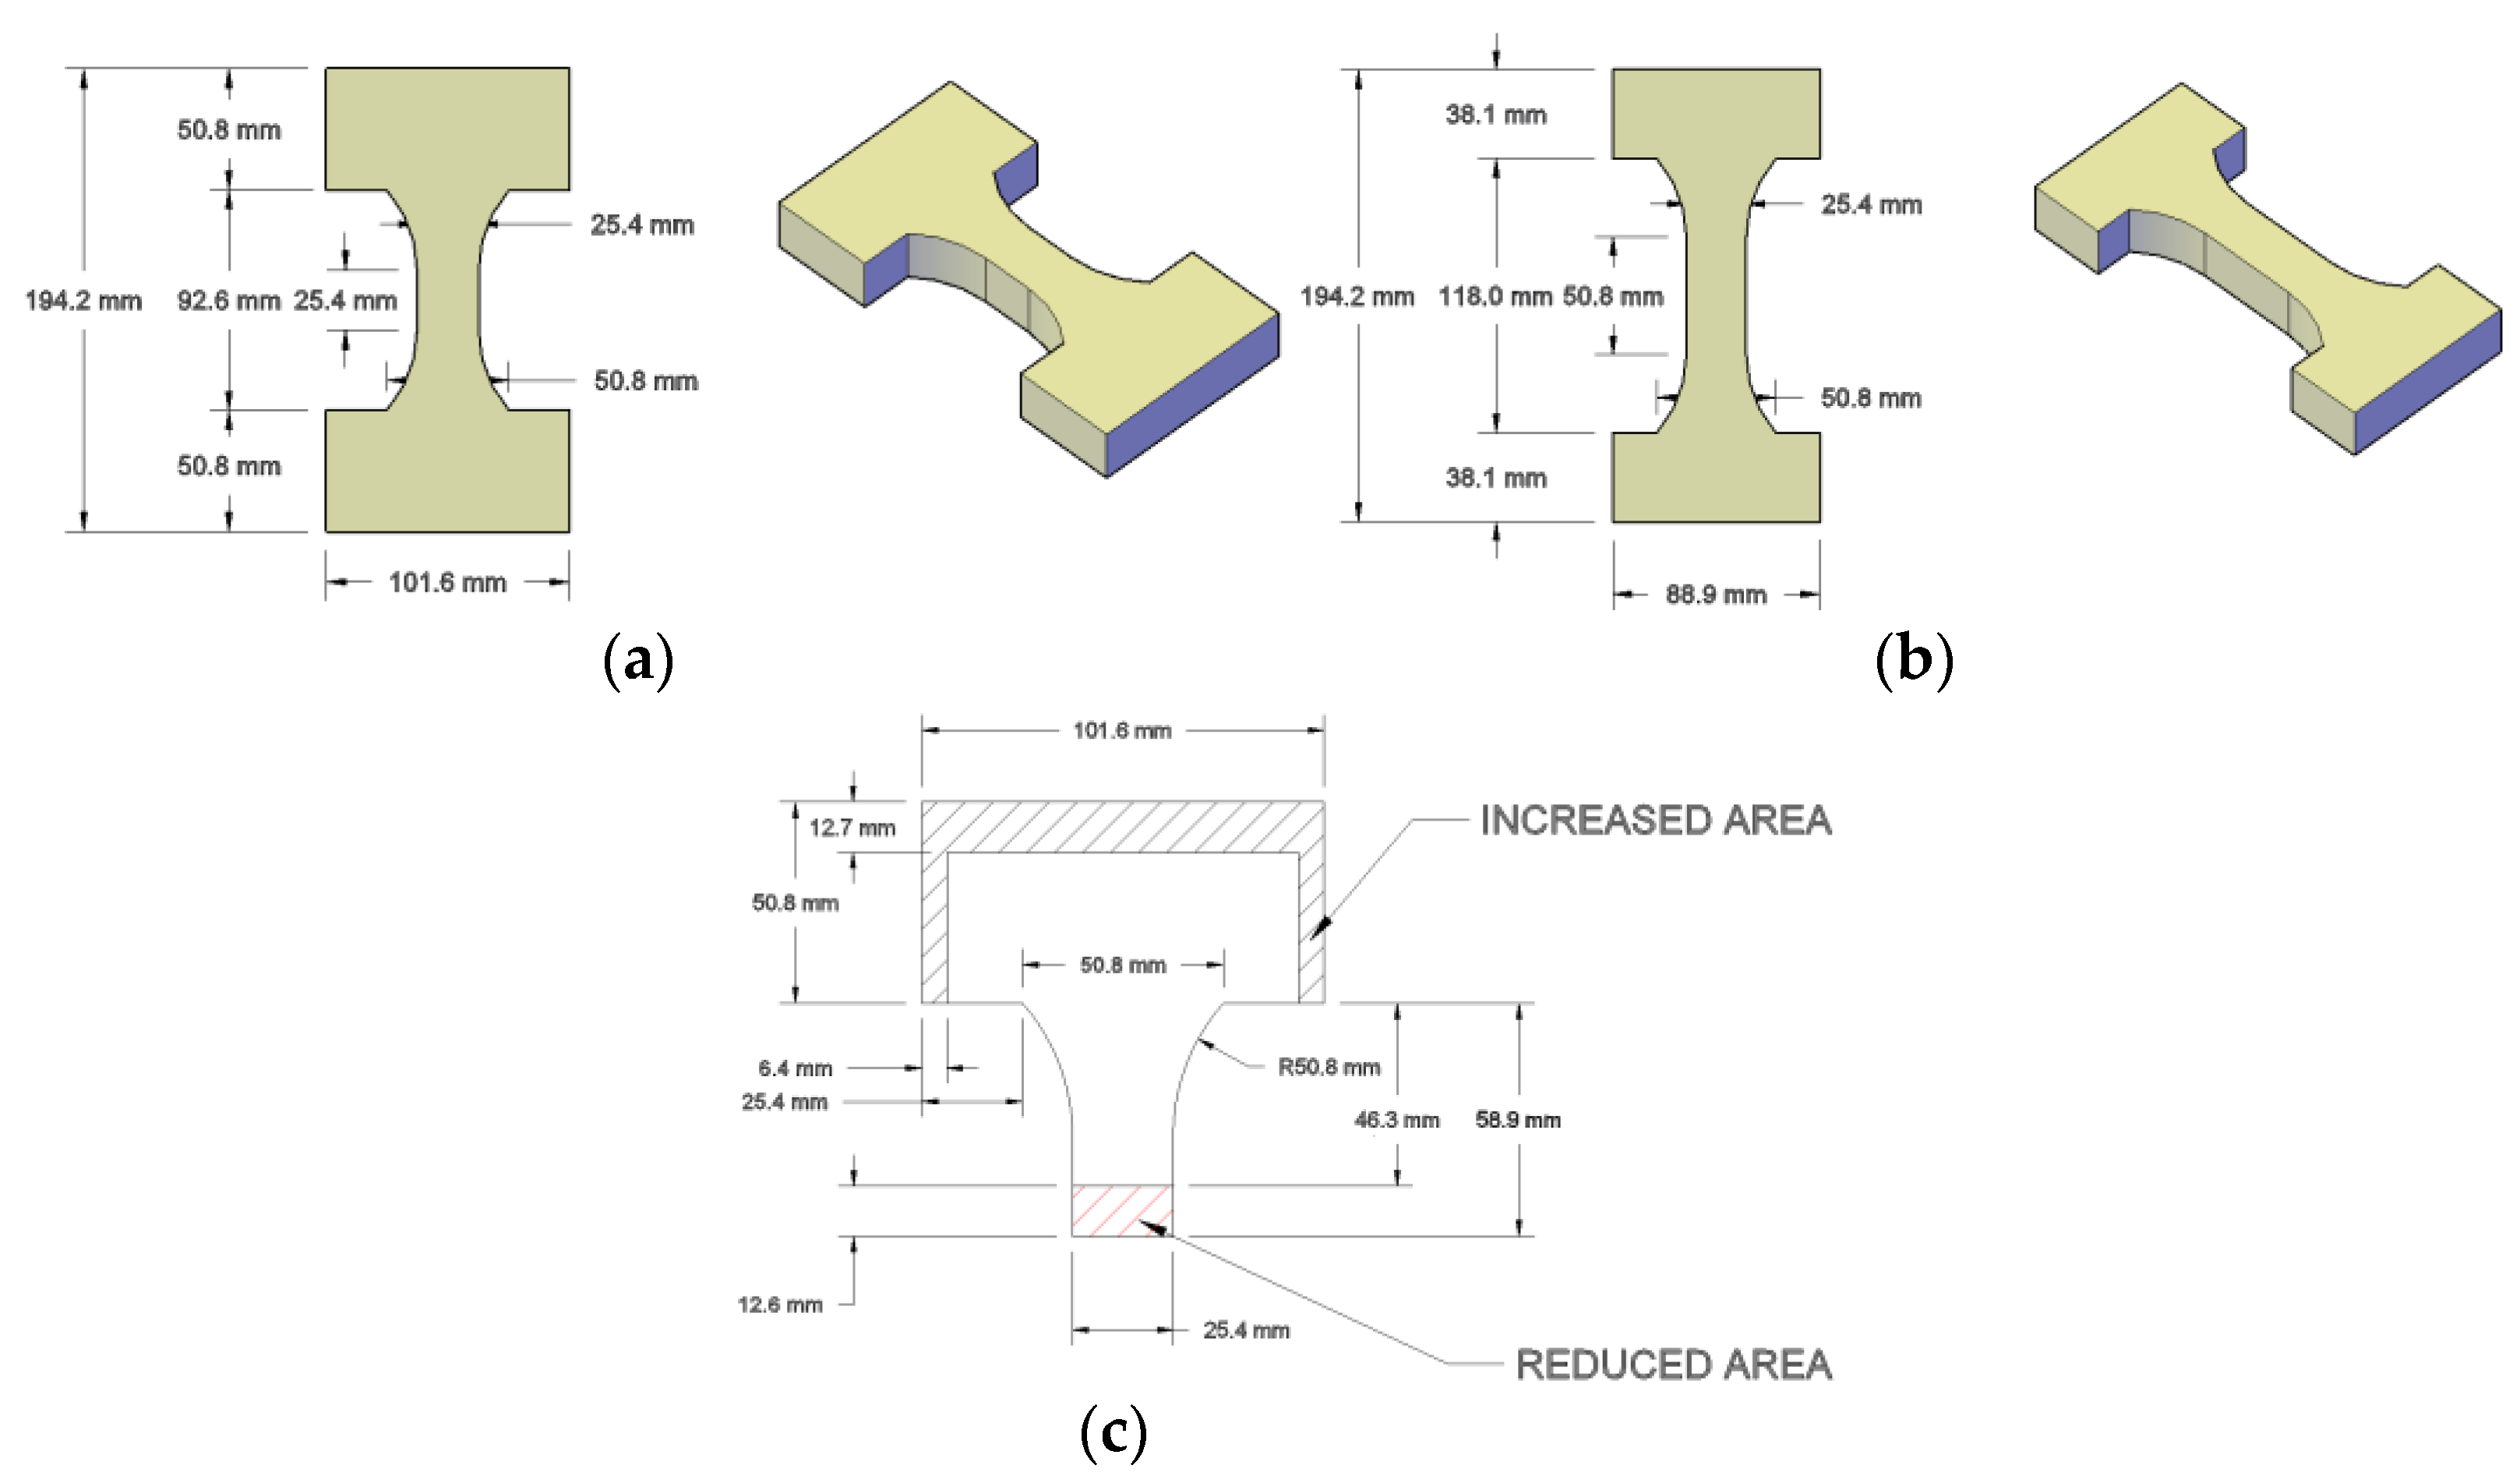
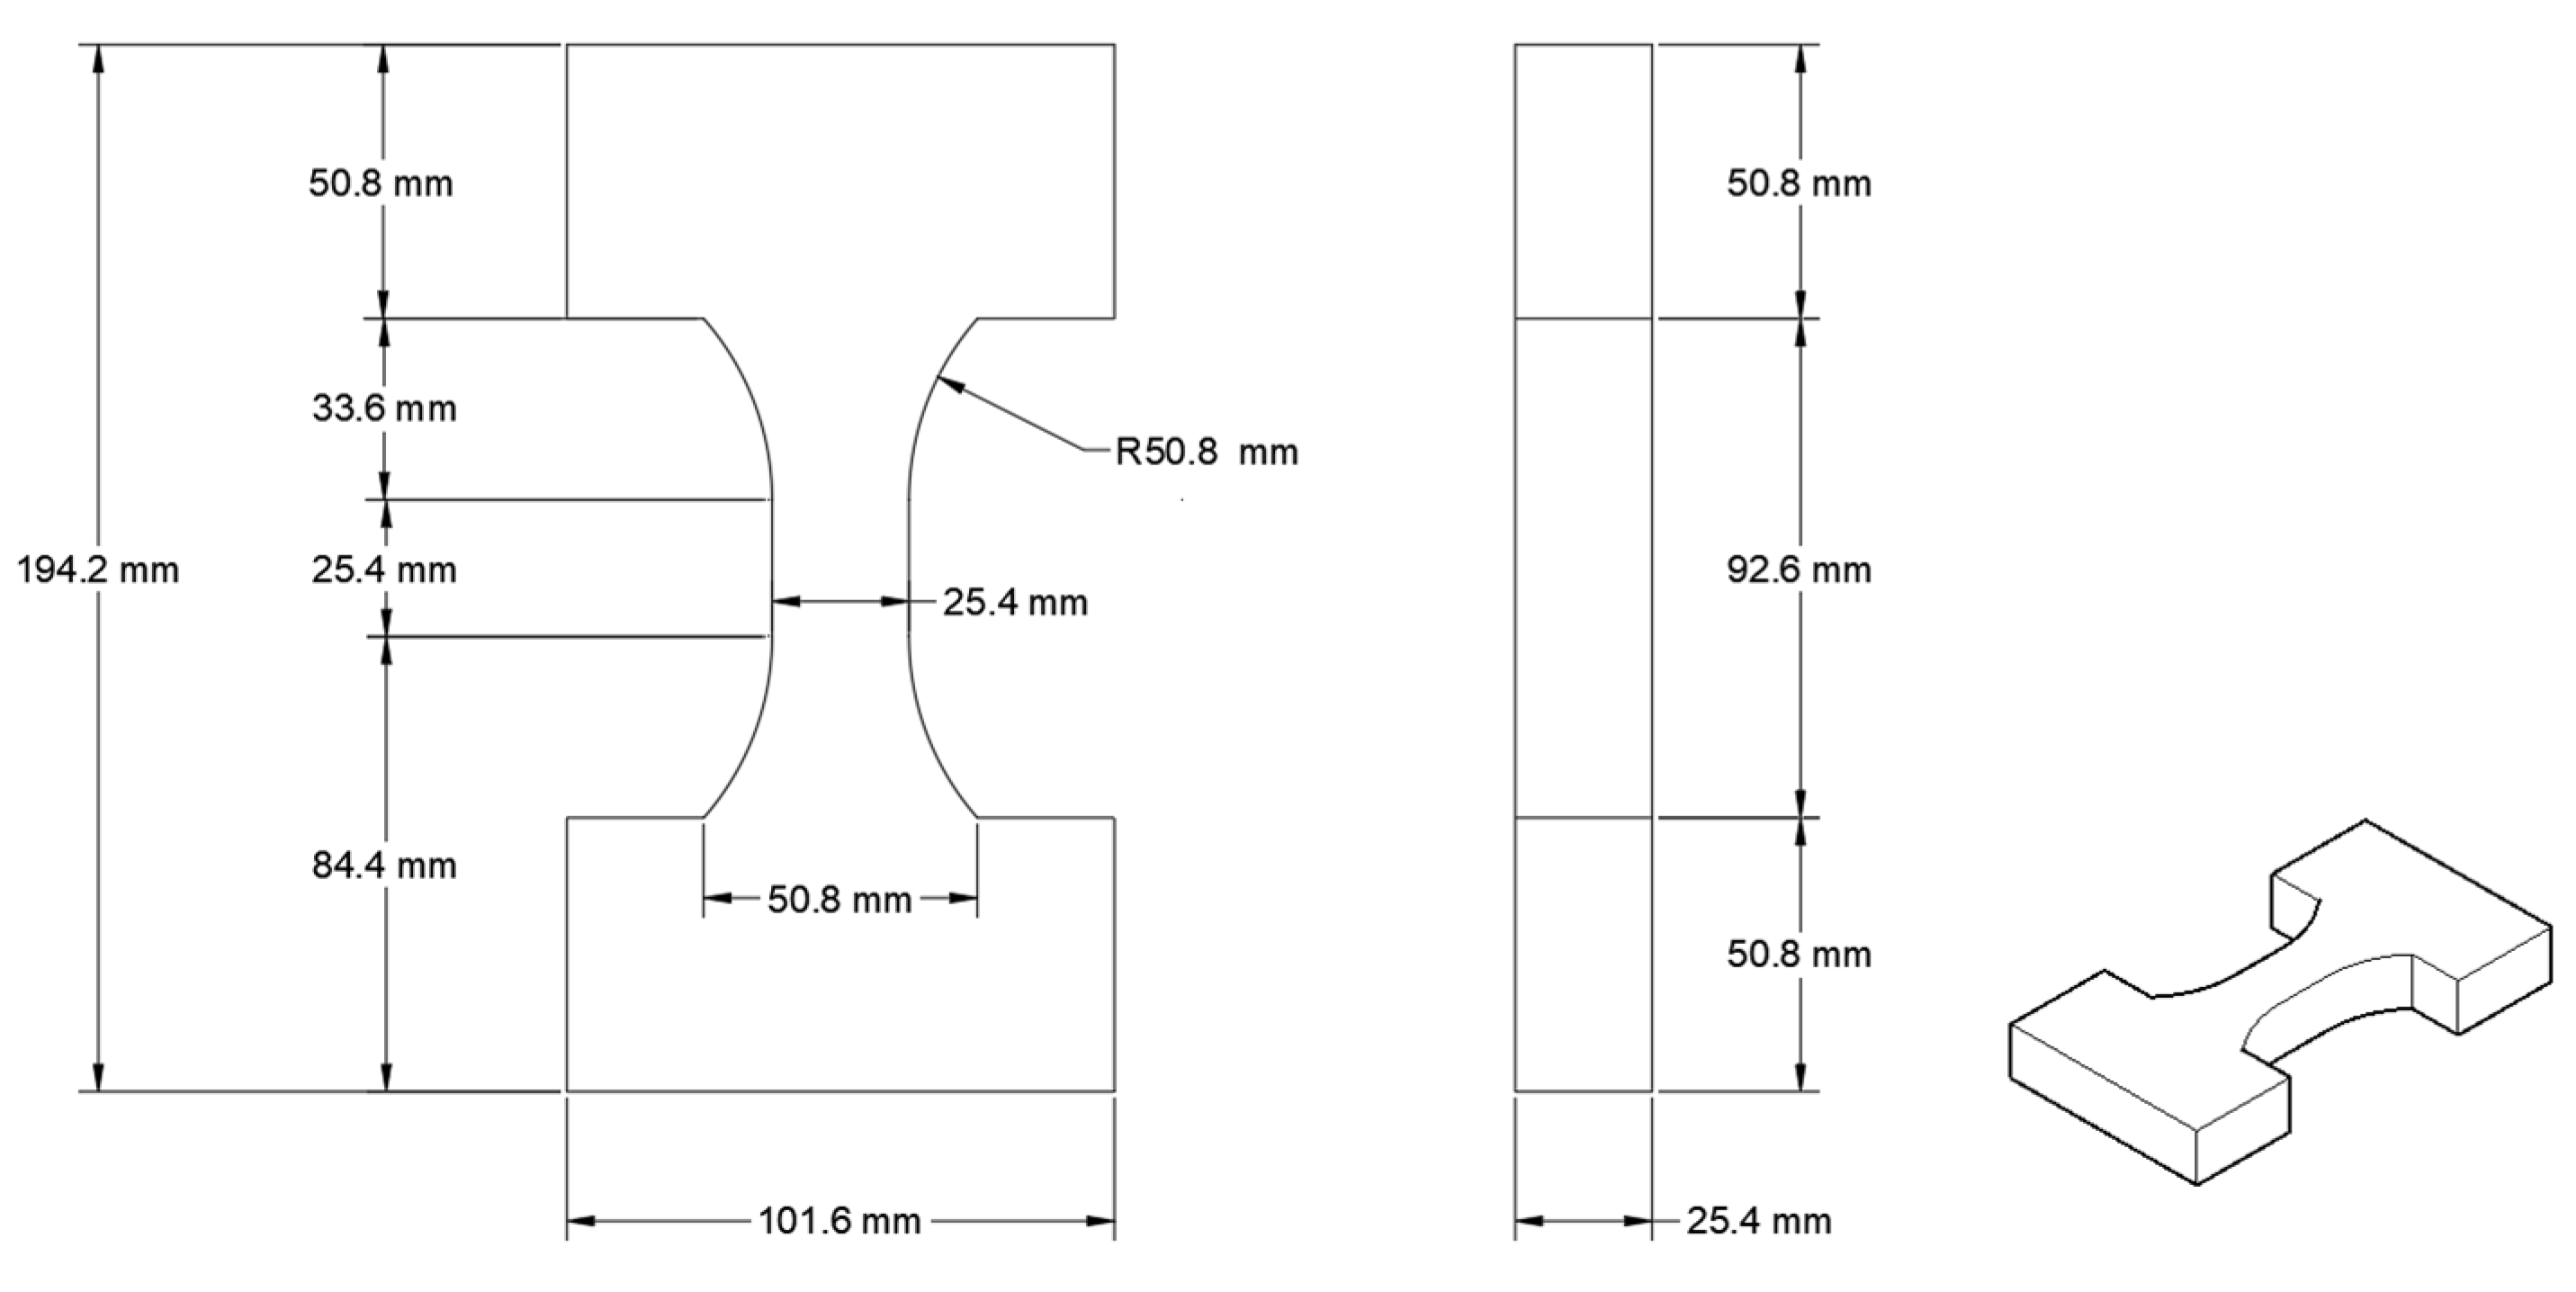
2.2.1. Rectangular Dog-Bone Mold
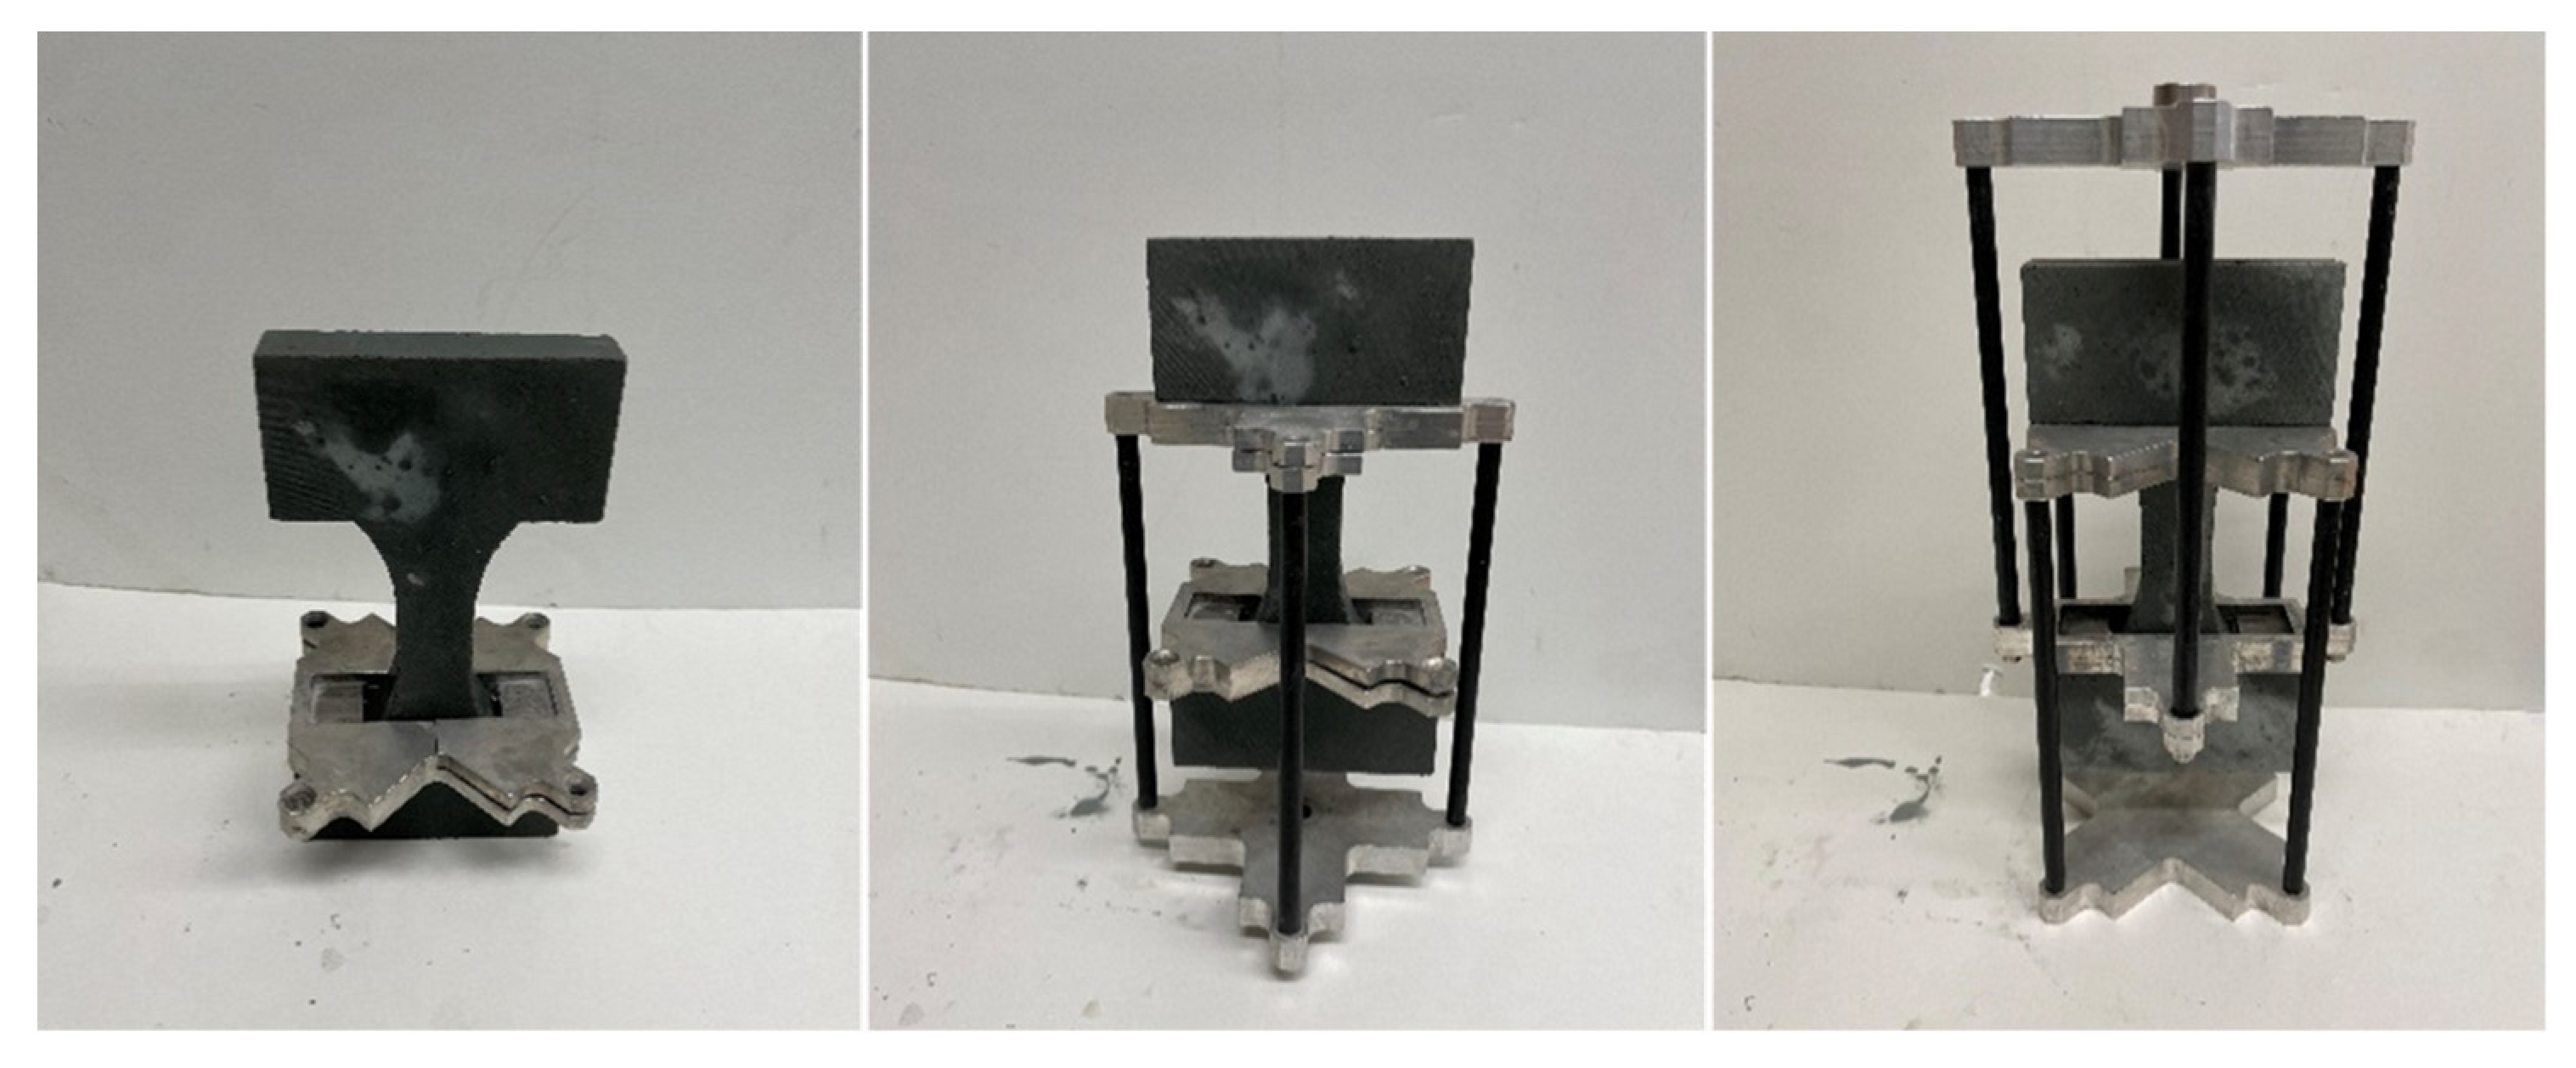
2.2.2. Compression to Tensile Load Converter
2.3. Experimental Protocol
2.3.1. Sample Preparation
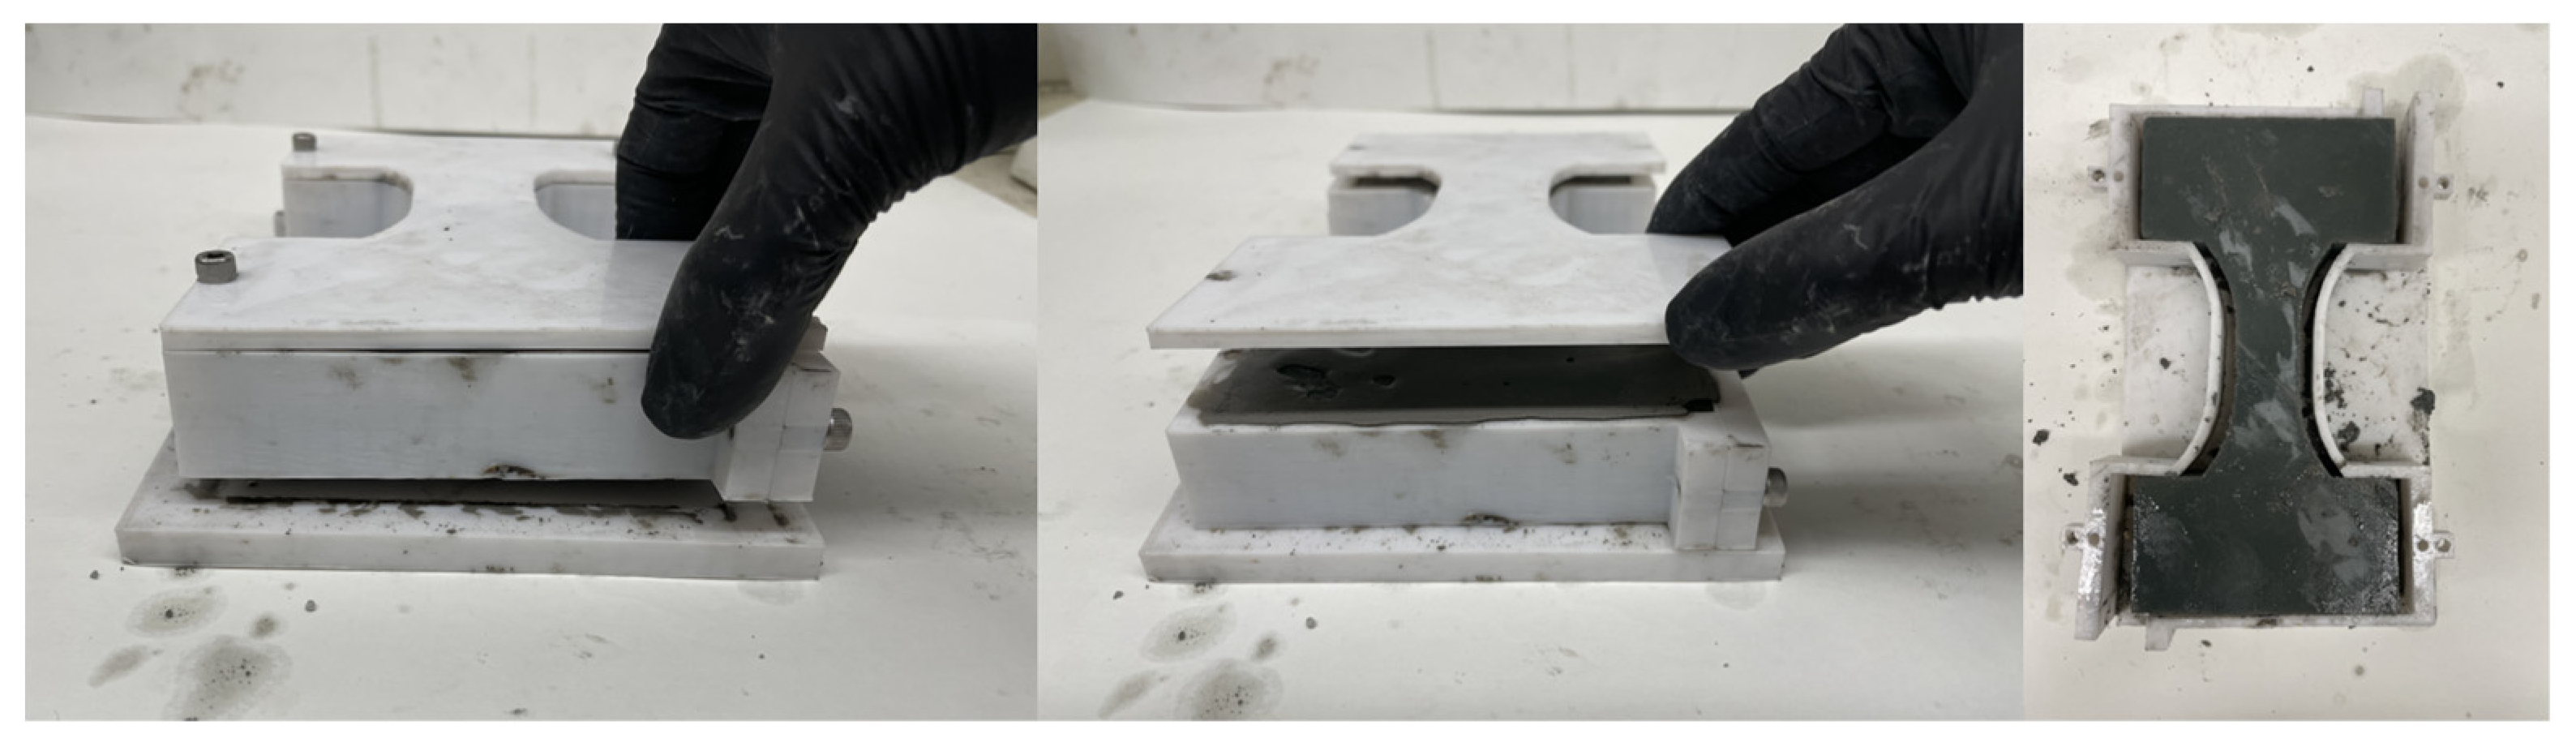
2.3.2. Demolding Process
2.3.3. Test Procedure
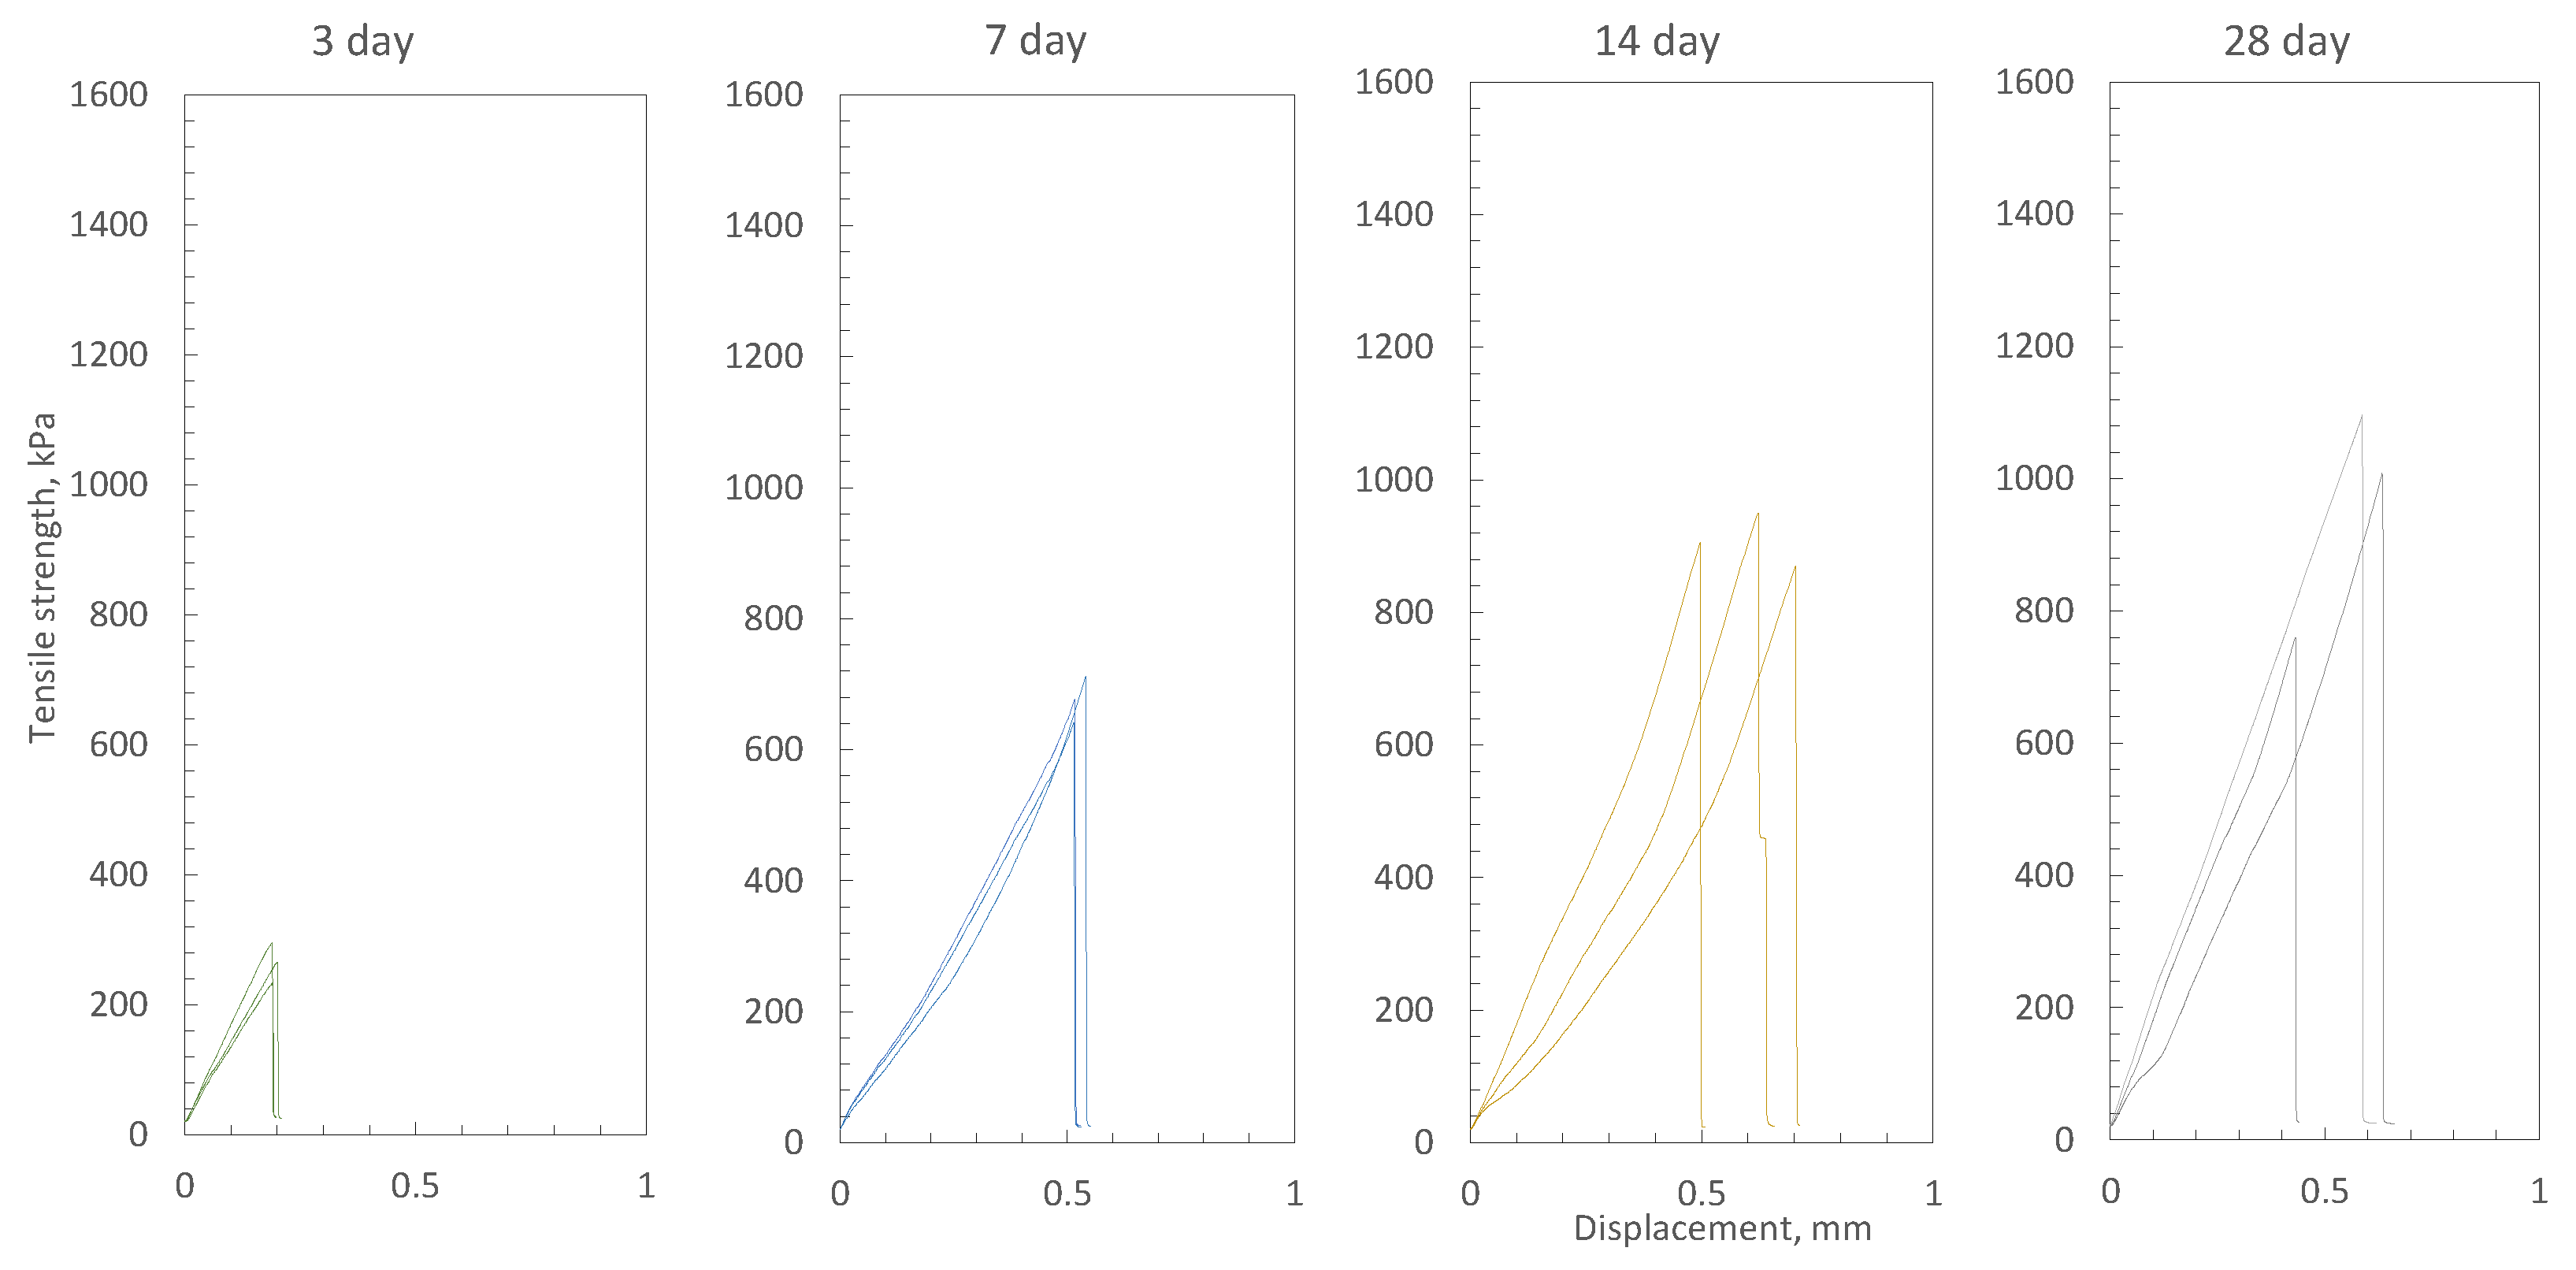
3. Results and Discussion
3.1. Geometric Design
3.2. Stiffness Analysis
3.2.1. Critical Buckling Analysis for Rods
3.2.2. Shear Analysis
4. Conclusions
Supplementary Materials
Author Contributions
Funding
Data Availability Statement
Acknowledgments
Conflicts of Interest
References
- Paterson & Cooke. Mine Backfill Design & Operation Course; Paterson & Cooke: Sudbury, ON, Canada, 2019. [Google Scholar]
- Yilmaz, E.; Cao, S.; Wu, D. Advances in the Design and Implementation of Cementitious Backfills. Front. Mater. 2022, 9, 964111. [Google Scholar] [CrossRef]
- Yang, L.; Li, J.; Liu, H.; Jiao, H.; Yin, S.; Chen, X.; Yu, Y. Systematic review of mixing technology for recycling waste tailings as cemented paste backfill in mines in China. Int. J. Miner. Metall. Mater. 2023, 30, 1430. [Google Scholar] [CrossRef]
- Yilmaz, E.; Belem, T.; Benzaazoua, M. Effects of curing and stress conditions on hydromechanical, geotechnical and geochemical properties of cemented paste backfill. Eng. Geol. 2014, 168, 23–37. [Google Scholar] [CrossRef]
- Skrzypkowski, K. The Influence of Room and Pillar Method Geometry on the Deposit Utilization Rate and Rock Bolt Load. Energies 2019, 12, 4770. [Google Scholar] [CrossRef]
- Pakalnis, R.; Caceres, C.; Clapp, K.; Morin, M.; Brady, T.; Williams, T.; Blake, W.; MacLaughlin, M. Design Spans—Underhand Cut and Fill Mining. In Proceedings of the 107th Canadian Institute of Mining Annual General Meeting, Toronto, ON, Canada, 1–9 April 2005; pp. 1–9. [Google Scholar]
- Keita, A.M.T.; Jahanbakhshzadeh, A.; Li, L. Numerical analysis of the failure mechanisms of sill mats made of cemented backfill. Int. J. Geotech. Eng. 2021, 16, 802–814. [Google Scholar] [CrossRef]
- Keita, A.M.T.; Jahanbakhshzadeh, A.; Li, L. Numerical analysis of the stability of arched sill mats made of cemented backfill. Int. J. Rock Mech. Min. Sci. 2021, 140, 104667. [Google Scholar] [CrossRef]
- Raffaldi, M.J.; Seymour, J.B.; Richardson, J.; Zahl, E.; Board, M. Cemented Paste Backfill Geomechanics at a Narrow-Vein Underhand Cut-and-Fill Mine. Rock Mech. Rock Eng. 2019, 52, 4925–4940. [Google Scholar] [CrossRef]
- Perras, M.A.; Diederichs, M.S. A Review of the Tensile Strength of Rock: Concepts and Testings. Geotech. Geol. Eng. 2014, 32, 525–546. [Google Scholar] [CrossRef]
- Mitchell, R.J. Sill mat evaluation using centrifuge models. Min. Sci. Technol. 1991, 13, 301–313. [Google Scholar] [CrossRef]
- Johnson, J.C.; Seymour, J.B.; Martin, L.A.; Stepan, M.; Arkoosh, A.; Emery, T. Strength and Elastic Properties of Paste Backfill at the Lucky Friday Mine, Mullan, Idaho. In Proceedings of the U.S. Rock Mechanics/Geomechanics Symposium, San Francisco, CA, USA, 29 June–1 July 2015. [Google Scholar]
- Grabinsky, M.; Bawden, W.; Thompson, B. Required Plug Strength for Continuously Poured Cemented Paste Backfill in Longhole Stopes. Mining 2021, 1, 80–99. [Google Scholar] [CrossRef]
- Thompson, B.D.; Bawden, W.F.; Grabinsky, M.W. In-Situ Backfill Monitoring—Lessons Learned and a New Case Study. Can. Geotech. J. 2012, 49, 755–772. [Google Scholar] [CrossRef]
- Kuzmenko, O.; Dychkovskyi, R.; Petlovanyi, M.; Buketov, V.; Howaniec, N.; Smoliński, A. Mechanism of Interaction of Backfill Mixtures with Natural Rock Fractures within the Zone of Their Intense Manifestation while Developing Steep Ore Deposits. Sustainability 2023, 15, 4889. [Google Scholar] [CrossRef]
- Grabinsky, M.; Jafari, M.; Pan, A. Cemented Paste Backfill (CPB) Material Properties for Undercut Analysis. Mining 2022, 2, 103–122. [Google Scholar] [CrossRef]
- Coviello, A.; Lagioia, R.; Nova, R. On the measurement of the tensile strength of soft rocks. Rock Mech. Rock Eng. 2005, 38, 251–273. [Google Scholar] [CrossRef]
- Komurlu, E.; Kesimal, A.; Demir, S. Experimental and numerical analyses on determination of indirect (splitting) tensile strength of cemented paste backfill materials under different loading apparatus. Geomech. Eng. 2016, 10, 775–791. [Google Scholar] [CrossRef]
- Fuenkajorn, K.; Klanphumeesri, S. Laboratory Determination of Direct Tensile Strength and Deformability of Intact Rocks. Geotech. Test. J. 2011, 34, 97–102. [Google Scholar]
- Pan, A.; Grabinsky, M. Tensile Strength of Cemented Paste Backfill. Geotech. Test. J. 2021, 44, 1886–1897. [Google Scholar] [CrossRef]
- Guo, L.; Peng, X.; Zhao, Y.; Liu, G.; Pan, A. Experimental Study on Direct Tensile Properties of Cemented Paste Backfill. Front. Mater. 2022, 2022, 864264. [Google Scholar] [CrossRef]
- Agnico Eagle. Macassa. Available online: https://www.agnicoeagle.com/English/operations/operations/Macassa-Mine/default.aspx (accessed on 7 April 2023).
- Mining Data Solution. Macassa Mine. Available online: https://miningdataonline.com/property/453/Macassa-Complex.aspx (accessed on 7 April 2023).
- Kerrich, R.; Watson, G.P. The Macassa Mine Archean lode gold deposit, Kirkland Lake, Ontario; geology, patterns of alteration, and hydrothermal regimes. Econ. Geol. 1984, 79, 1104–1130. [Google Scholar] [CrossRef]
- Stammers, L.K. Geochemical Constraints of the Gold Mineralization Sources from the South Mine Complex and the Main/’04 Breaks, Macassa Mine, Kirkland Lake, Ontario. Master’s Thesis, Western University, London, ON, Canada, 2016. [Google Scholar]
- Rietveld, H.M. A profile refinement method for nuclear and magnetic structures. J. Appl. Crystallogr. 1969, 2, 65–74. [Google Scholar] [CrossRef]
- Jafari, M.; Shahsavari, M.; Grabinsky, M. Cemented Paste Backfill Laboratory study: Sample preparation challenges. In Proceedings of the 70th Canadian Geotechnical Conference, Ottawa, ON, Canada, 23–26 September 2018. [Google Scholar]
- Pan, A.; Grabinsky, M. Mechanical Characterization of Cemented Paste Backfill. Eng 2023, 1, 738–747. [Google Scholar] [CrossRef]
- ASTM, ASTM D2166–06; Standard Test Method for Unconfined Compressive Strength of Cohesive Soil. ASTM International: West Conshohocken, PA, USA, 2006.
- Hu, Y.; Hang, B.; Zhang, B.; Li, K. Force Analysis and Strength Determination of the Cemented Paste Backfill Roof in Underhand Drift Cut-and-Fill Stopping. Appl. Sci. 2023, 13, 855. [Google Scholar] [CrossRef]
- Beer, F.P.; Johnston, R.E.; De Wolf, J.T.; Mazurek, D.F. Mechanics of Materials, 6th ed.; McGraw-Hill Science: New York, NY, USA, 2011. [Google Scholar]
- Euler, L. Methodus Inveniendi Lineas Curvas Maximi Minimive Proprietate Gaudentes Sive Solutio Problematis Isoperimetrici Latissimo Sensu Accepti; Marc-Michel Bousquet: Geneva, Switzerland, 1744. [Google Scholar]


| Chemical Composition | CaO | SiO2 | Al2O3 | MgO | SO3 | Fe2O3 | Na2O | K2O |
|---|---|---|---|---|---|---|---|---|
| Portland cement, wt% | 61.1 | 19.4 | 4.6 | 3.3 | 2.3 | 2 | 2 | 0.7 |
| Blast furnace slag, wt% | 37.1 | 36.1 | 10.4 | 13.2 | 3.4 | 0.7 | 0.4 | 0.5 |
| Binder, wt% | 39.5 | 34.5 | 9.8 | 12.3 | 3.3 | 0.8 | 0.6 | 0.5 |
| Mineralogy | Volume, % |
|---|---|
| Microcline | 40.00% |
| Dolomite | 12.90% |
| Quartz | 11.00% |
| Albite | 5.30% |
| Clinochlore | 3.20% |
| Pyrite | 0.30% |
| Amorphous | 27.20% |
| Mineralogy | Volume, % |
|---|---|
| Quartz | 41.20% |
| Microcline | 40.80% |
| Albite | 6.30% |
| Chlorite | 2.60% |
| Muscovite | 0.80% |
| Amorphous | 8.40% |
Disclaimer/Publisher’s Note: The statements, opinions and data contained in all publications are solely those of the individual author(s) and contributor(s) and not of MDPI and/or the editor(s). MDPI and/or the editor(s) disclaim responsibility for any injury to people or property resulting from any ideas, methods, instructions or products referred to in the content. |
© 2023 by the authors. Licensee MDPI, Basel, Switzerland. This article is an open access article distributed under the terms and conditions of the Creative Commons Attribution (CC BY) license (https://creativecommons.org/licenses/by/4.0/).
Share and Cite
Pan, A.; Grabinsky, M. Direct Tensile Measurement for Cemented Paste Backfill. Minerals 2023, 13, 1218. https://doi.org/10.3390/min13091218
Pan A, Grabinsky M. Direct Tensile Measurement for Cemented Paste Backfill. Minerals. 2023; 13(9):1218. https://doi.org/10.3390/min13091218
Chicago/Turabian StylePan, Andrew, and Murray Grabinsky. 2023. "Direct Tensile Measurement for Cemented Paste Backfill" Minerals 13, no. 9: 1218. https://doi.org/10.3390/min13091218
APA StylePan, A., & Grabinsky, M. (2023). Direct Tensile Measurement for Cemented Paste Backfill. Minerals, 13(9), 1218. https://doi.org/10.3390/min13091218