Article

Utilizing Remote Sensing and Satellite-Based Bouguer Gravity data to Predict Potential Sites of Hydrothermal Minerals and Gold Deposits in Central Saudi Arabia

1
Geology Department, Faculty of Science, Zagazig University, Zagazig 44519, Egypt
2
Construction, Oltu Vocational College, Ataturk University, Erzurum 25400, Turkey
3
Nuclear Materials, Authority, El-Maadi, Kattamyia, Cairo 530, Egypt
4
School of Emergency Management, Xihua University, Chengdu 610039, China
5
Department of Geology and Geophysics, College of Science, King Saud University, P.O. Box 2455, Riyadh 11451, Saudi Arabia
*
Author to whom correspondence should be addressed.
Minerals 2023, 13(8), 1092; https://doi.org/10.3390/min13081092
Submission received: 28 June 2023 / Revised: 28 July 2023 / Accepted: 9 August 2023 / Published: 15 August 2023

Abstract

:
This article aims to aid in exploring and forecasting hydrothermal minerals and gold deposits in Central Saudi Arabia (SA), with a focus on structural contexts. Remote sensing (RS) and satellite-based Bouguer gravity (SBG) data were integrated in order to create a mineral prediction map for the researched location. Data from the Landsat Operational Land Imager (OLI) and Shuttle Radar Topography Mission (SRTM) were transformed and enhanced using a variety of approaches. The delineation of hydrothermal alteration zones (HAZs) and highlighting of structural discontinuities in the OLI data were made possible using band ratios and oriented principal component analysis (PCA). Additionally, the underlying structural features were successfully exposed by processing the SBG using a variety of edge detection techniques, like the analytical signal (AS), total horizontal derivative (THD), tilt angle (TA), horizontal tilt angle (TDX), theta map (TM), horizontal derivative of the tilt derivative (HD_TDR), horizontal gradient of the tilt angle (HGTA), tilt angle of the analytical signal (TAAS), and soft sign function (SF). As a result, more prominent lineaments were found in the NW–SE, NNW–SSE, NE–SW, and NNE–SSW directions than in the N–S and E–W directions. The GIS incorporated surface/subsurface geological structure density maps with zones of hydrothermal alteration. It was found that the lineaments derived from the analysis of the RS and SBG data were more in line with the HAZs, which demonstrated the common connection between alteration zones and deep lineaments. The findings revealed a mineral prediction map with extremely low to extremely high probabilities. Overall, combining RS and SBG data effectively identified probable mineralization sites associated with hydrothermal processes and made it easier to create this study’s final predictive mineralization map.

1. Introduction

The Arabian Shield (ASh) is considered an economically significant shield worldwide, as it has promising possibilities for exploring metallic ore deposits. The ASh of Saudi Arabia (SA) consists of stratiform, vein, and magmatic to late magmatic contact metamorphism deposits [1]. Over 800 occurrences of gold (Au) and other metal deposits are found throughout the ASh, including porphyry copper, volcanic-hosted massive sulfide (VHMS) (Al-Amar, Gabal Sayid, and Al-Nuqrah), and Au ore deposits, such as those in the Bulghah and Mahd Ad Dahab mines (in the production stage) [1,2].
Significant gold mineralization is found in the central zones of the Najd fault system (NFS), specifically in Ghadarah, Fawarah, Hamdah, and Gariat Avala. Major fault zones parallel to the Red Sea also run northward from the south, becoming more connected as they go deeper underground, and they overlook several gold mines, including the Wadi Bidah, Jadmah, Wadi Laif, and Mamilah mines (Figure 1a) [3].
The Arabian-Nubian Shield (ANS) is considered significant for gold exploration and mining in SA. It is crucial for relationships between gold genesis and orogenic tectonics. Based on the tectonic settings and gold host rocks, primary gold mineralization can be divided into three basic types [4], as described in the following paragraphs.
The first type includes volcano-sedimentary connections, such as the Siham Group, and epithermal deposits, like the Mahd Ad Dhahab and Al-Amar ore deposits, as well as volcanogenic massive sulfide (VMS) gold deposits.
Based on Al-Shanti [5], the second type of gold mineralization is found in listwaenite rocks, which were formed after ophiolitic rocks were carbonatized. These rocks have several suture zones. For the Saudi Ma’aden Mining Company (SMMC), Bi’r Tawilah (study area, e.g., Masarah and Al Mansourah) is a suitable candidate for gold-mineralization-hosted listwaenite in the Nabitah suture (NS) zone and the western section of the Afif terrane (AT) [4].
The third form of gold deposit is hosted by late- to post-tectonic (640–610 Ma) plutons of diorite–granite and/or their subvolcanic substitutes that intruded the Bani Ghayy and Murdama Groups, chiefly abundant in the western (AT) and eastern (NS) zones, such as in Bi’r Tawilah, Sukhaybarat, Bulghah, Zalm, Jabal Ghadarah, and Ad Duwayhi [6,7,8,9,10]. Mesothermal quartz-vein-type gold ore mineralization, developed in intraplate settings, controls these deposits, which are magmatically and/or structurally controlled [11].
The majority of gold is found as loose microscopic specks along arsenopyrite, pyrite, and occasionally chalcopyrite fractures, which were produced by CO2-rich ore fluids within these deposits, which are connected through quartz veins and stringers [4,9].
Traditional field geology surveys are extremely costly, time-consuming, and difficult for mineral exploration in hydrothermal alteration zones (HAZs). Furthermore, interpolations are widely used in the outcomes achieved. In this situation, the combination of RS and SBG data may be considered as a substitute method for carrying out regional geological mapping with tolerable precision in a manageable amount of time.
The major goal of the current research is to recognize the best locations for mineral resources and gold deposits, using a combination of surface and subsurface structure components and HAZ areas. RS data (Landsat 8 OLI and SRTM data) and SBG data were used in conjunction in order to identify HAZs and structural lineaments in the area under investigation.
Reconnaissance investigations frequently utilize remote sensing technology. Remote sensing is a crucial method for understanding several aspects, including geological, geomorphic, structural, and mineral deposits. Multiple generations of unmanned satellites, called Landsat, ranging from their initial generation to generation 9, have been developed and released by the National Aeronautics and Space Administration (NASA). These satellites collect vital RS data regarding mineral resources, structural aspects, and land use/land cover. Geomorphic and geological components are described in [9,12,13,14,15,16,17,18,19,20,21,22,23]. In order to emphasize the spectral contrasts between the bands, ratio images have been employed. This method has been applied in remote sensing in order to map lithology and HAZs, and to mark spectral differences [24], so that a high contrast range of spectral properties—not possible with separate bands—may be displayed.
Based on fluctuations in rock density, SBG data play a vital role in finding subsurface structures. These geological formations serve as conduits for mineral deposits connected to hydrothermal systems. An essential problem to address when examining potential field data concerns locating and relating subsurface density patterns to subsurface structures [25,26,27,28,29]. Mineral exploration and structural studies can use edge detection methods to delineate the boundaries of subsurface structures [29,30,31,32]. Many approaches can be applied in order to detect structural edges, with most methods depending on the source field’s derivatives [33,34]. Previously, the limits of sources buried at varying depths on an observational plane were explored using various enhancing filters [35,36]. Several studies have increased the accuracy with which filters detect the boundaries of buried HAZs [3,37,38]. Many edge detection strategies can be applied in order to achieve the goals of such investigations. The first-order vertical derivative (FVD), total horizontal derivative (THD) [23], analytical signal (AS), tilt derivative (TD) [39], tilt angle (TA), and theta filtering [40] are some of these methods. Recently, the horizontal derivative of the tilt derivative (HD_TDR), horizontal gradient of the tilt angle (HGTA), tilt angle of the analytical signal (TAAS), and soft sign function (SF), filters that are based on second-order derivatives of potential field data, were developed. These techniques effectively improve the resolution of the findings of boundary detection while avoiding the secondary boundary problem.
As a result, combining RS images and SBG data should aid in improving lithologic mapping, enhancing geologic structures, and identifying gold mineralization zones.
Figure 1. (a) Location map of the Arabian Shield (Ash) showing major ophiolite belts, tectonostratigraphic terranes, fault zones, sutures, and post-accretionary basins in Saudi Arabia. The locations of 14 significant gold deposits are shown and include our investigated site in Central Saudi Arabia and the Bi’r Tawilah gold mining area (Jabal Masarah, Al Mansourah, and Ghadarah). (b) A geological map of the Ash showing the study area location [41], with modifications [42,43].
Minerals 13 01092 g001

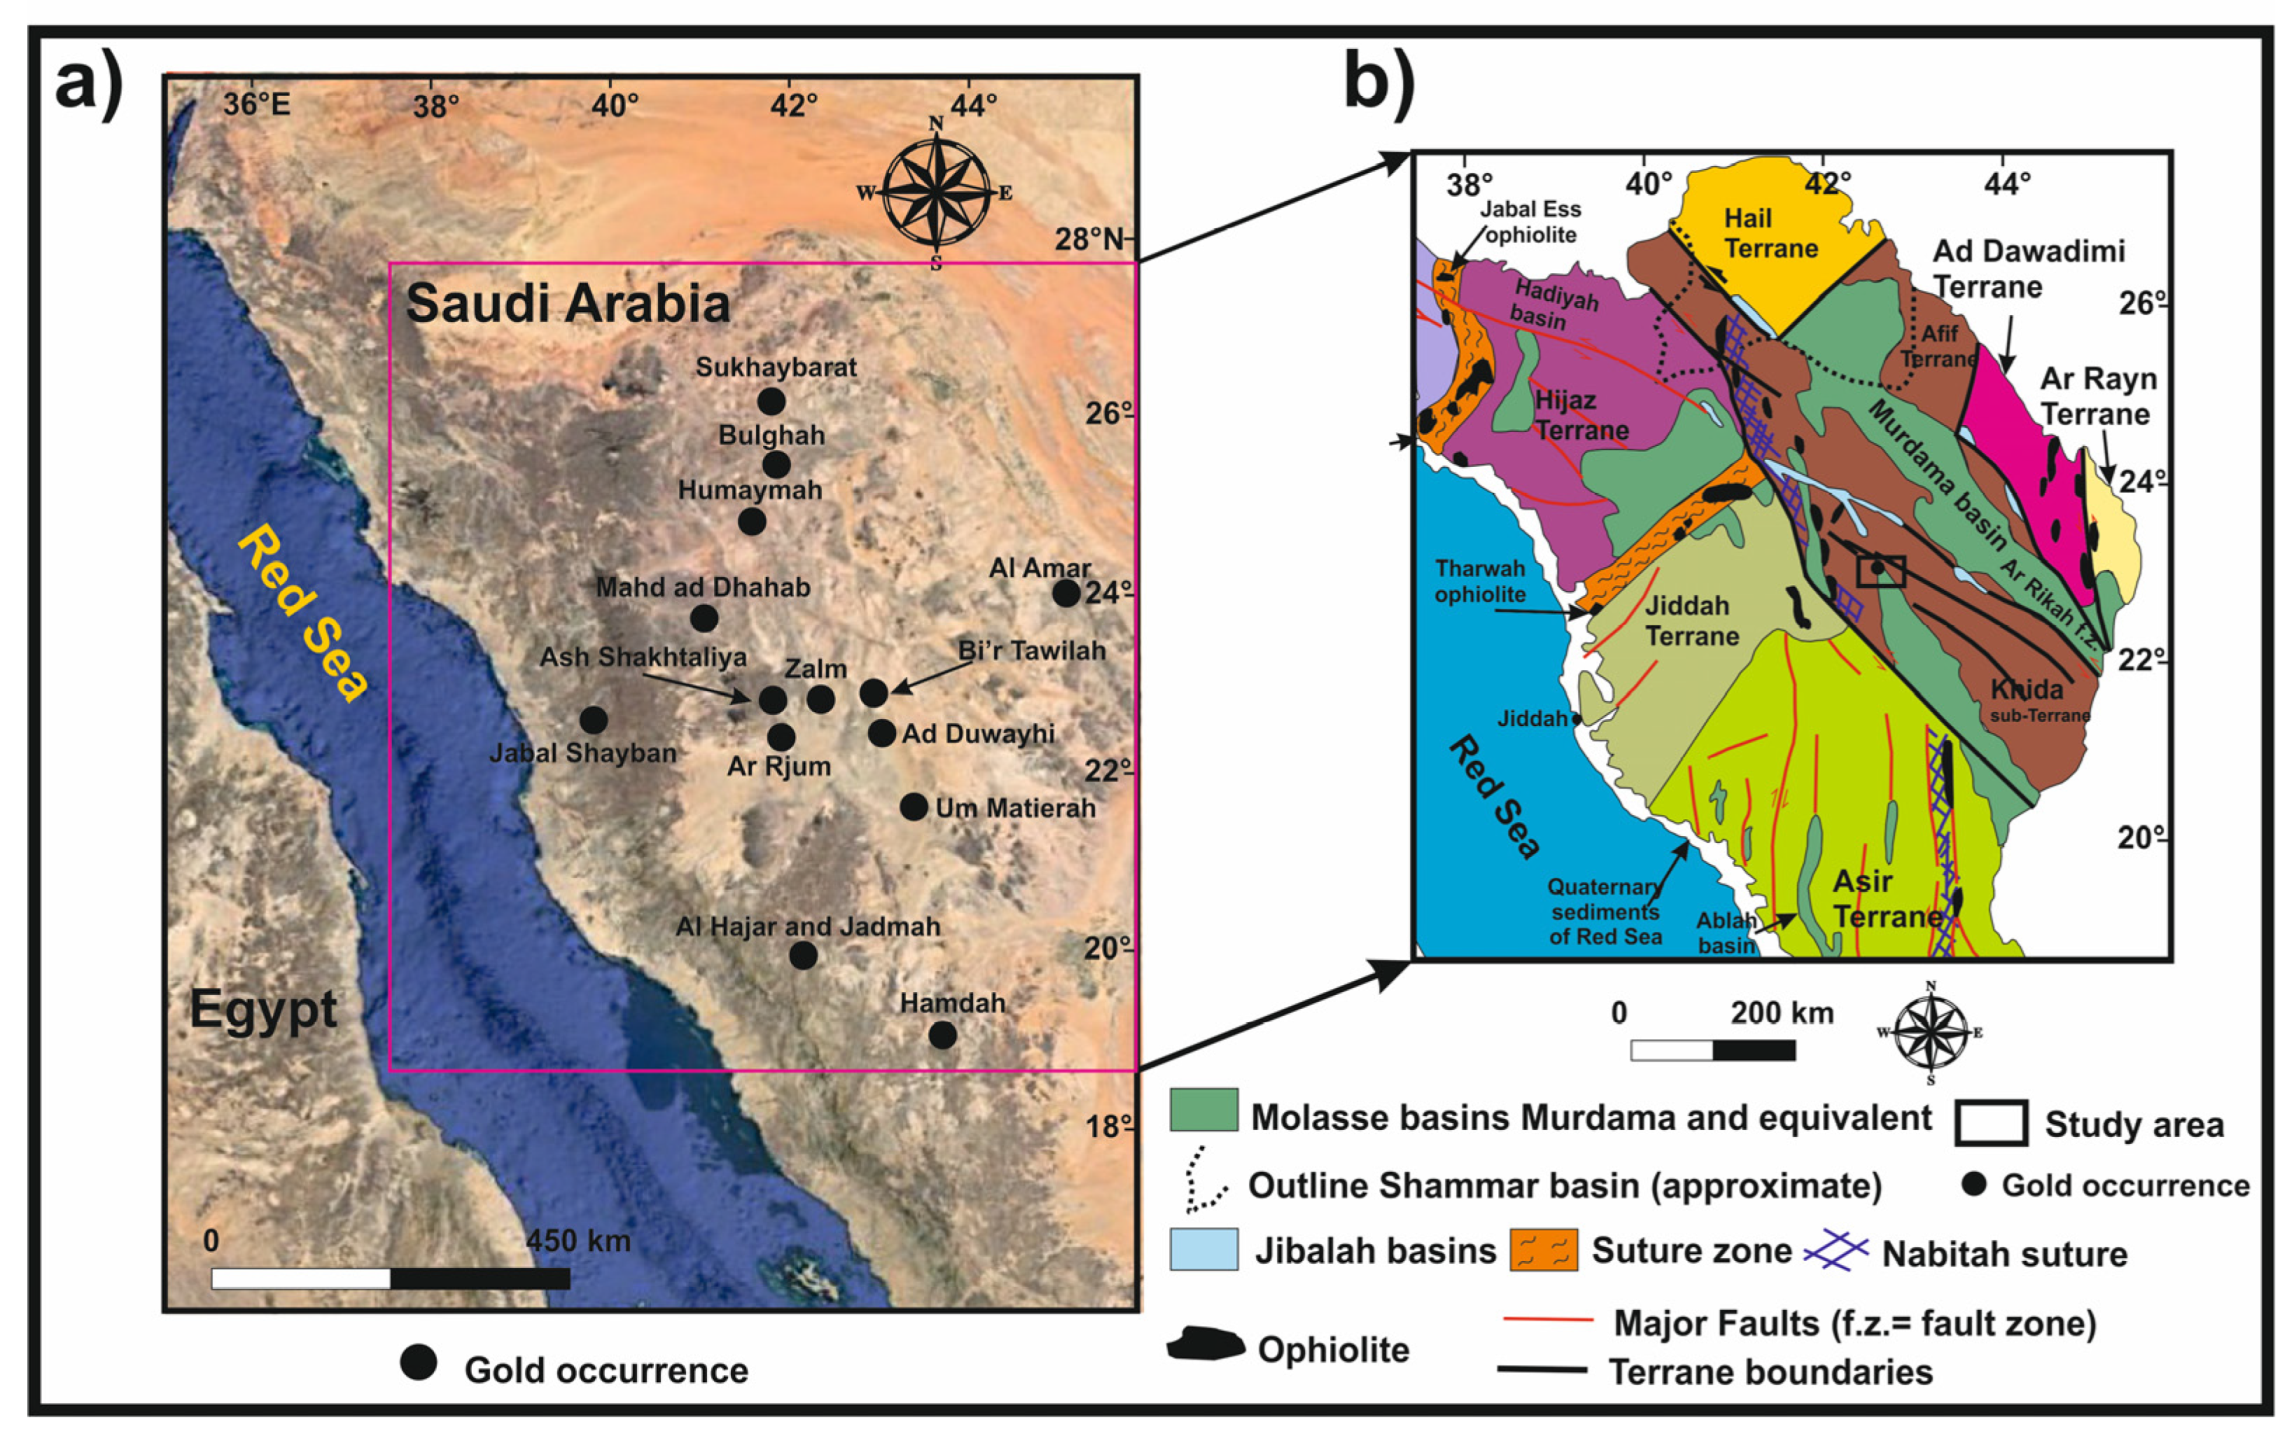
2. Geological Outlines

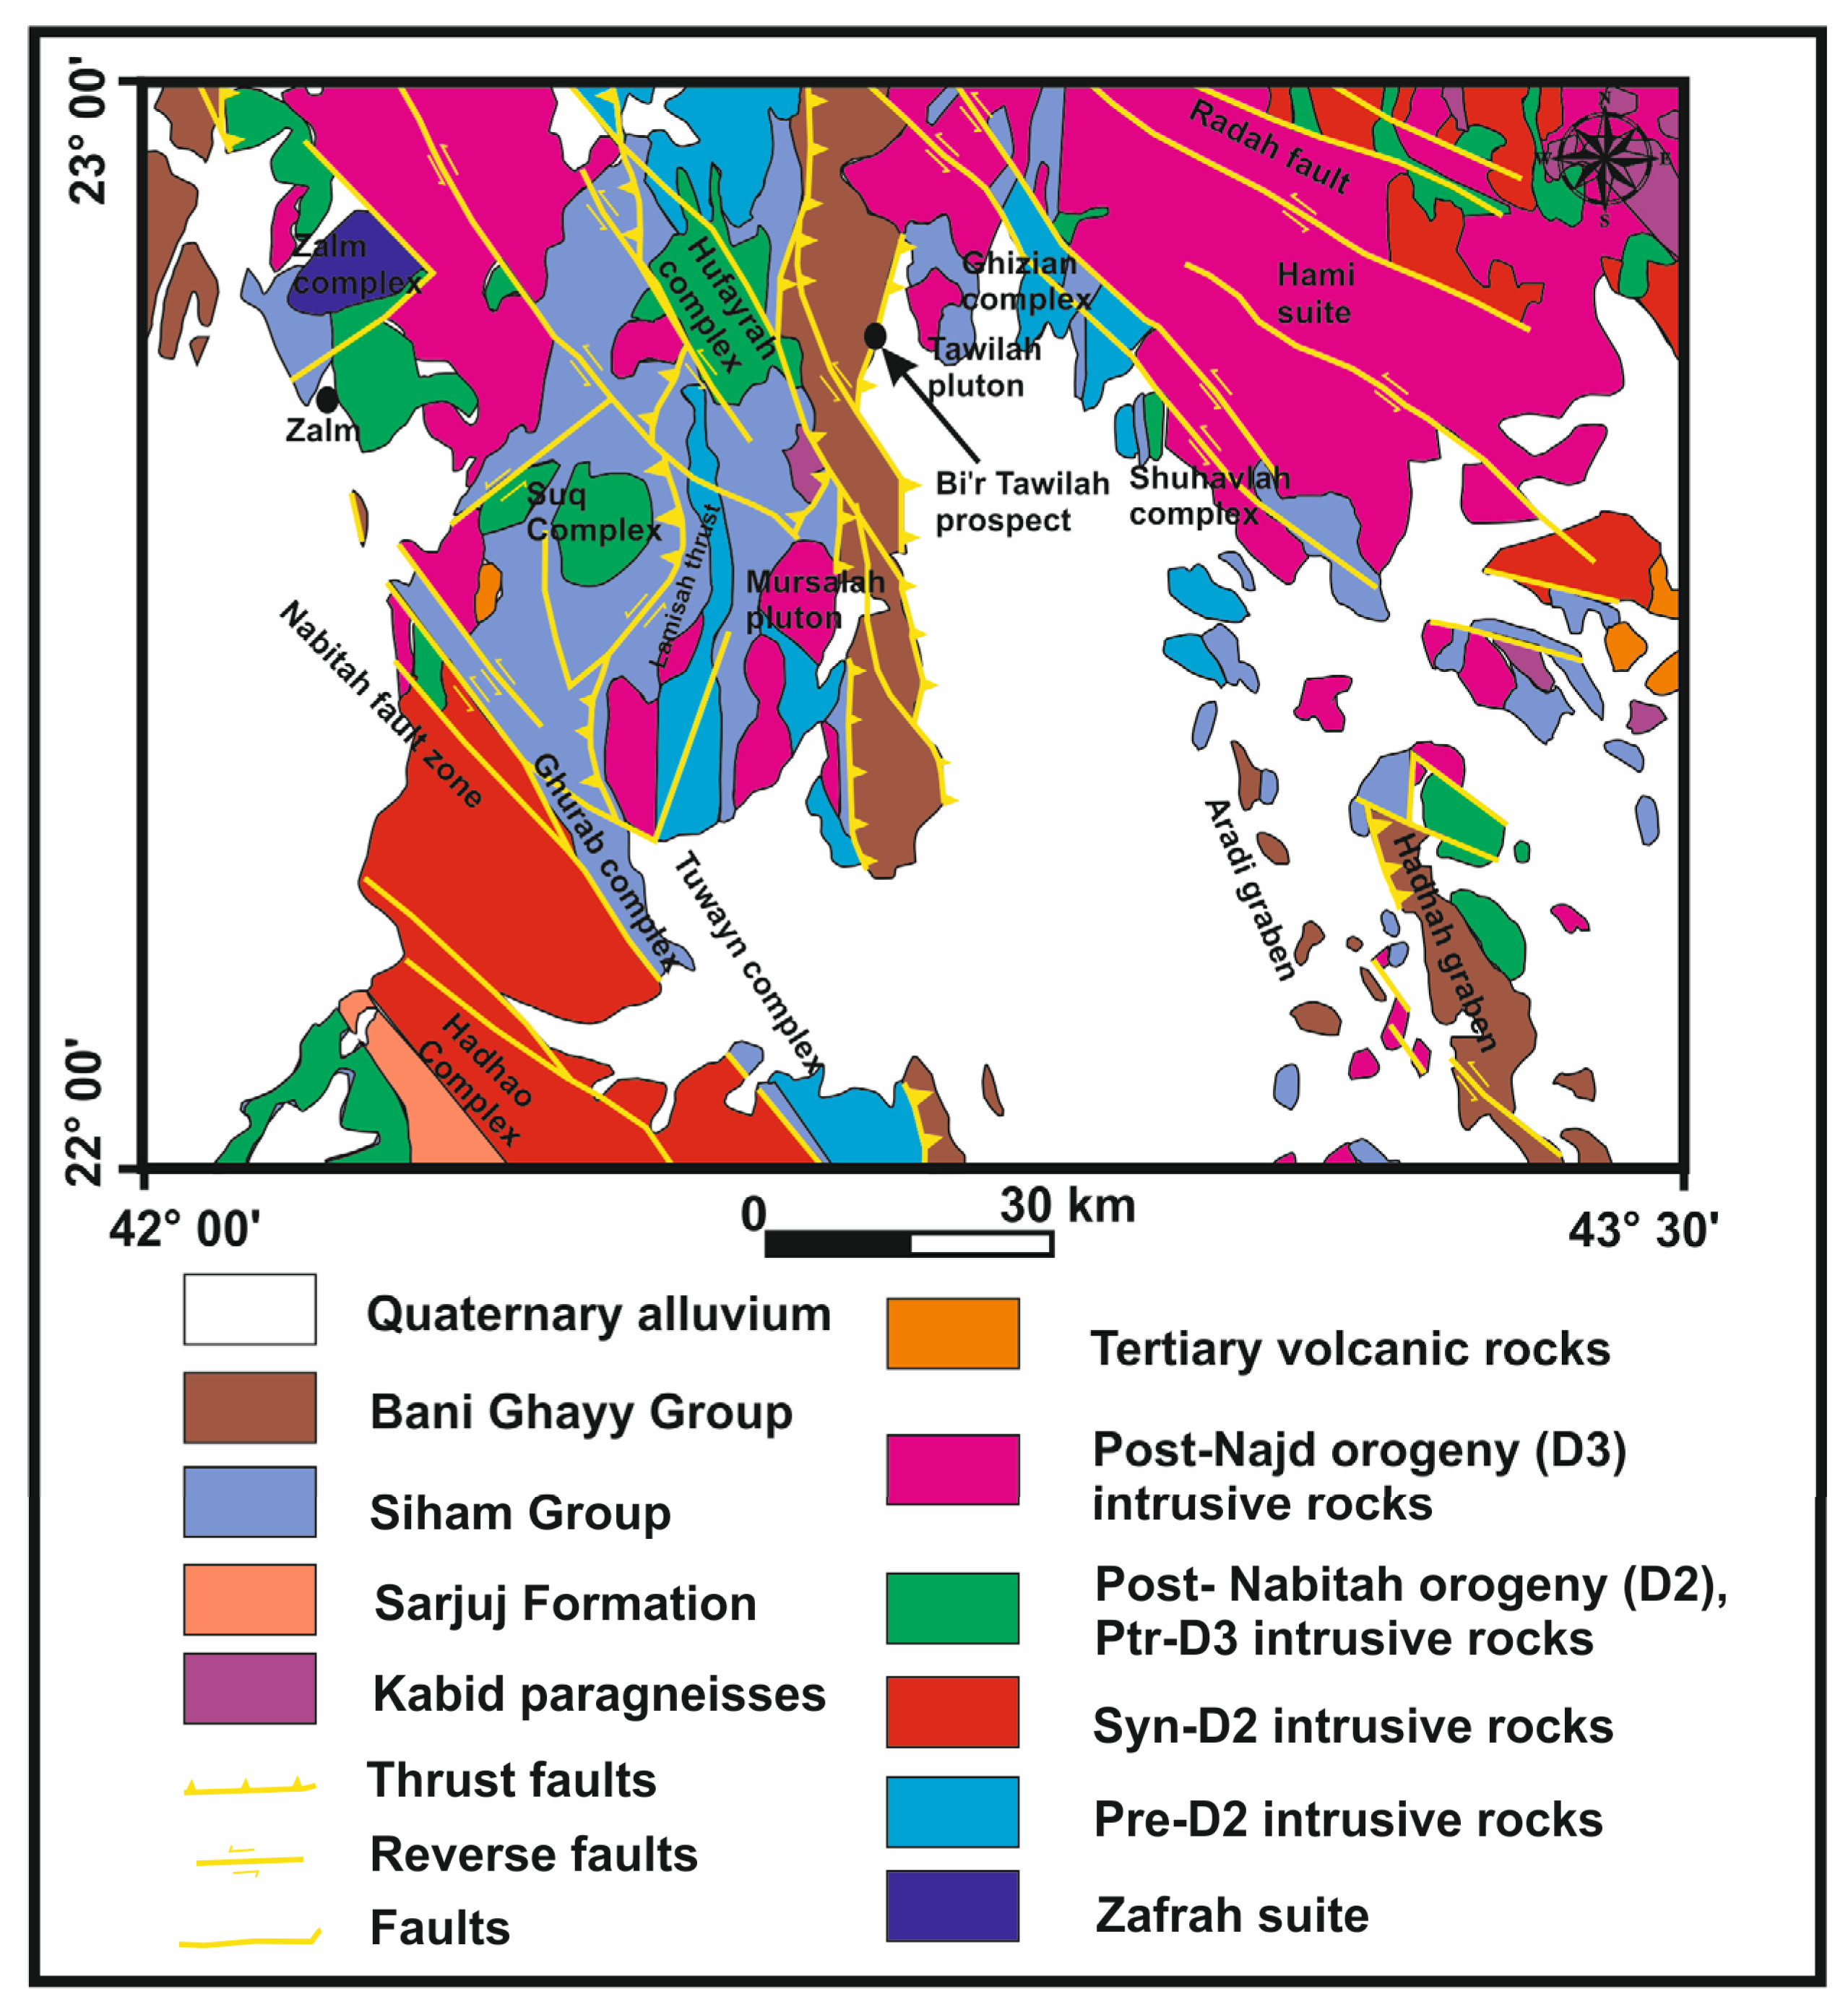
2.1. Geological Setting

The region under investigation is situated in the central (ASh) area neighborhood, including the Bi’r Tawilah gold mining area and its surroundings. Along the Ad Dafinah faults that divide the Afif terrane, the area is located east of the Jeddah terrane [44,45]. Latitudes 22°00′ to 23°00′ N and longitudes 42°00′ to 43°30′ E serve as its boundaries (Figure 1b). The Hulyfah volcano-sedimentary pattern (Bani Ghayy and Siham Groups, 690 Ma and 620 Ma, respectively; [46]) make up the majority of the Bi’r Tawilah area (Figure 2). Younger syn-orogenic rocks (granodiorite and porphyritic rhyodacite) that are 710–685 Ma old intrude into this region. The Bani Ghayy Group comprises siltstone, greywacke, and conglomerate and is intercalated with metabasalts and pyroclastics. In contrast, the Siham Group comprises severely deformed and foliated chlorite, hornblende, and sericite ortho-schists. According to Al Jahadli [9], both groups underwent metamorphism into greenschist–lower amphibolite facies. Ortho-schists and molasse sediments are the rocks that are visible in Jabal Bani Ghayy [47]. Gold and tungsten ore resources can be found at Bi’r Tawilah (Figure 2). The Bani Ghayy Group–Siham Group–N-striking thrust fault divides them [48].
A Pan-African example of gold mineralization, the Bi’r Tawilah gold mine in Central Saudi Arabia, includes hypogene and supergene minerals. The so-called “Nabitah orogenic zone” along the thrust fault (N–S) area hosts sulfidic gold deposits in the intermediate to felsic intrusions. Serpentines and associated listwaenites, porphyries, granites, and dioritic rocks are the four types of rock units that are present and are arranged from oldest to youngest. All kinds of rocks are subject to hydrothermal alteration, which includes chloritization, sericitization, carbonatization, and silicification [49].

2.2. Gold Mineralization and Structure Setting

Three gold mines (in the Bi’r Tawilah, Al Mansurah, and Masarah regions) are located within the research area. Mafic volcaniclastic rock units (Siham Group), conglomerate, and sandstone comprise most of the rock units in Bi’r Tawilah (the first area), with diorite and granodiorite only occasionally occurring at the surface. Jabal Ghadarh is a notable example of this. The N–S thrust fault (Bi’r Tawilah fault zone) deforms these rocks. Only one good barren quartz vein exposure, which is 55–120 cm thick and oriented NW, NE, and E–W, is present in the region. The Najd fault systems, which encompass the Bi’r Tawilah area, have structural data that are congruent with this [47].
Massive diamond drilling is mainly focused on listwaenite or carbonatized ultramafics, which have gold occurrences. The rocks made of listwaenite contain excellent gold occurrences. The boreholes in the Bi’r Tawilah region to the south reveal that minor ophiolitic serpentinite, diorite, deformed granodiorite, monzogranite, and porphyry intrusions constitute the principal lithologies present.
According to Surour et al. [49], the Bi’r Tawilah supergene zone exhibited the following characteristics: (1) the diorite was highly altered and had barren quartz stringers; (2) the granodiorite was affected by varying degrees of weathering; (3) the porphyry was weathered as indicated by the oxidized pyrite; (4) gold was found as inclusions in pyrite and silica in the deep horizons (i.e., hydrothermal alteration zones); and (5) in the weathered layers, supergene gold was discovered as the consequence of the oxidization of pyrite to goethite.

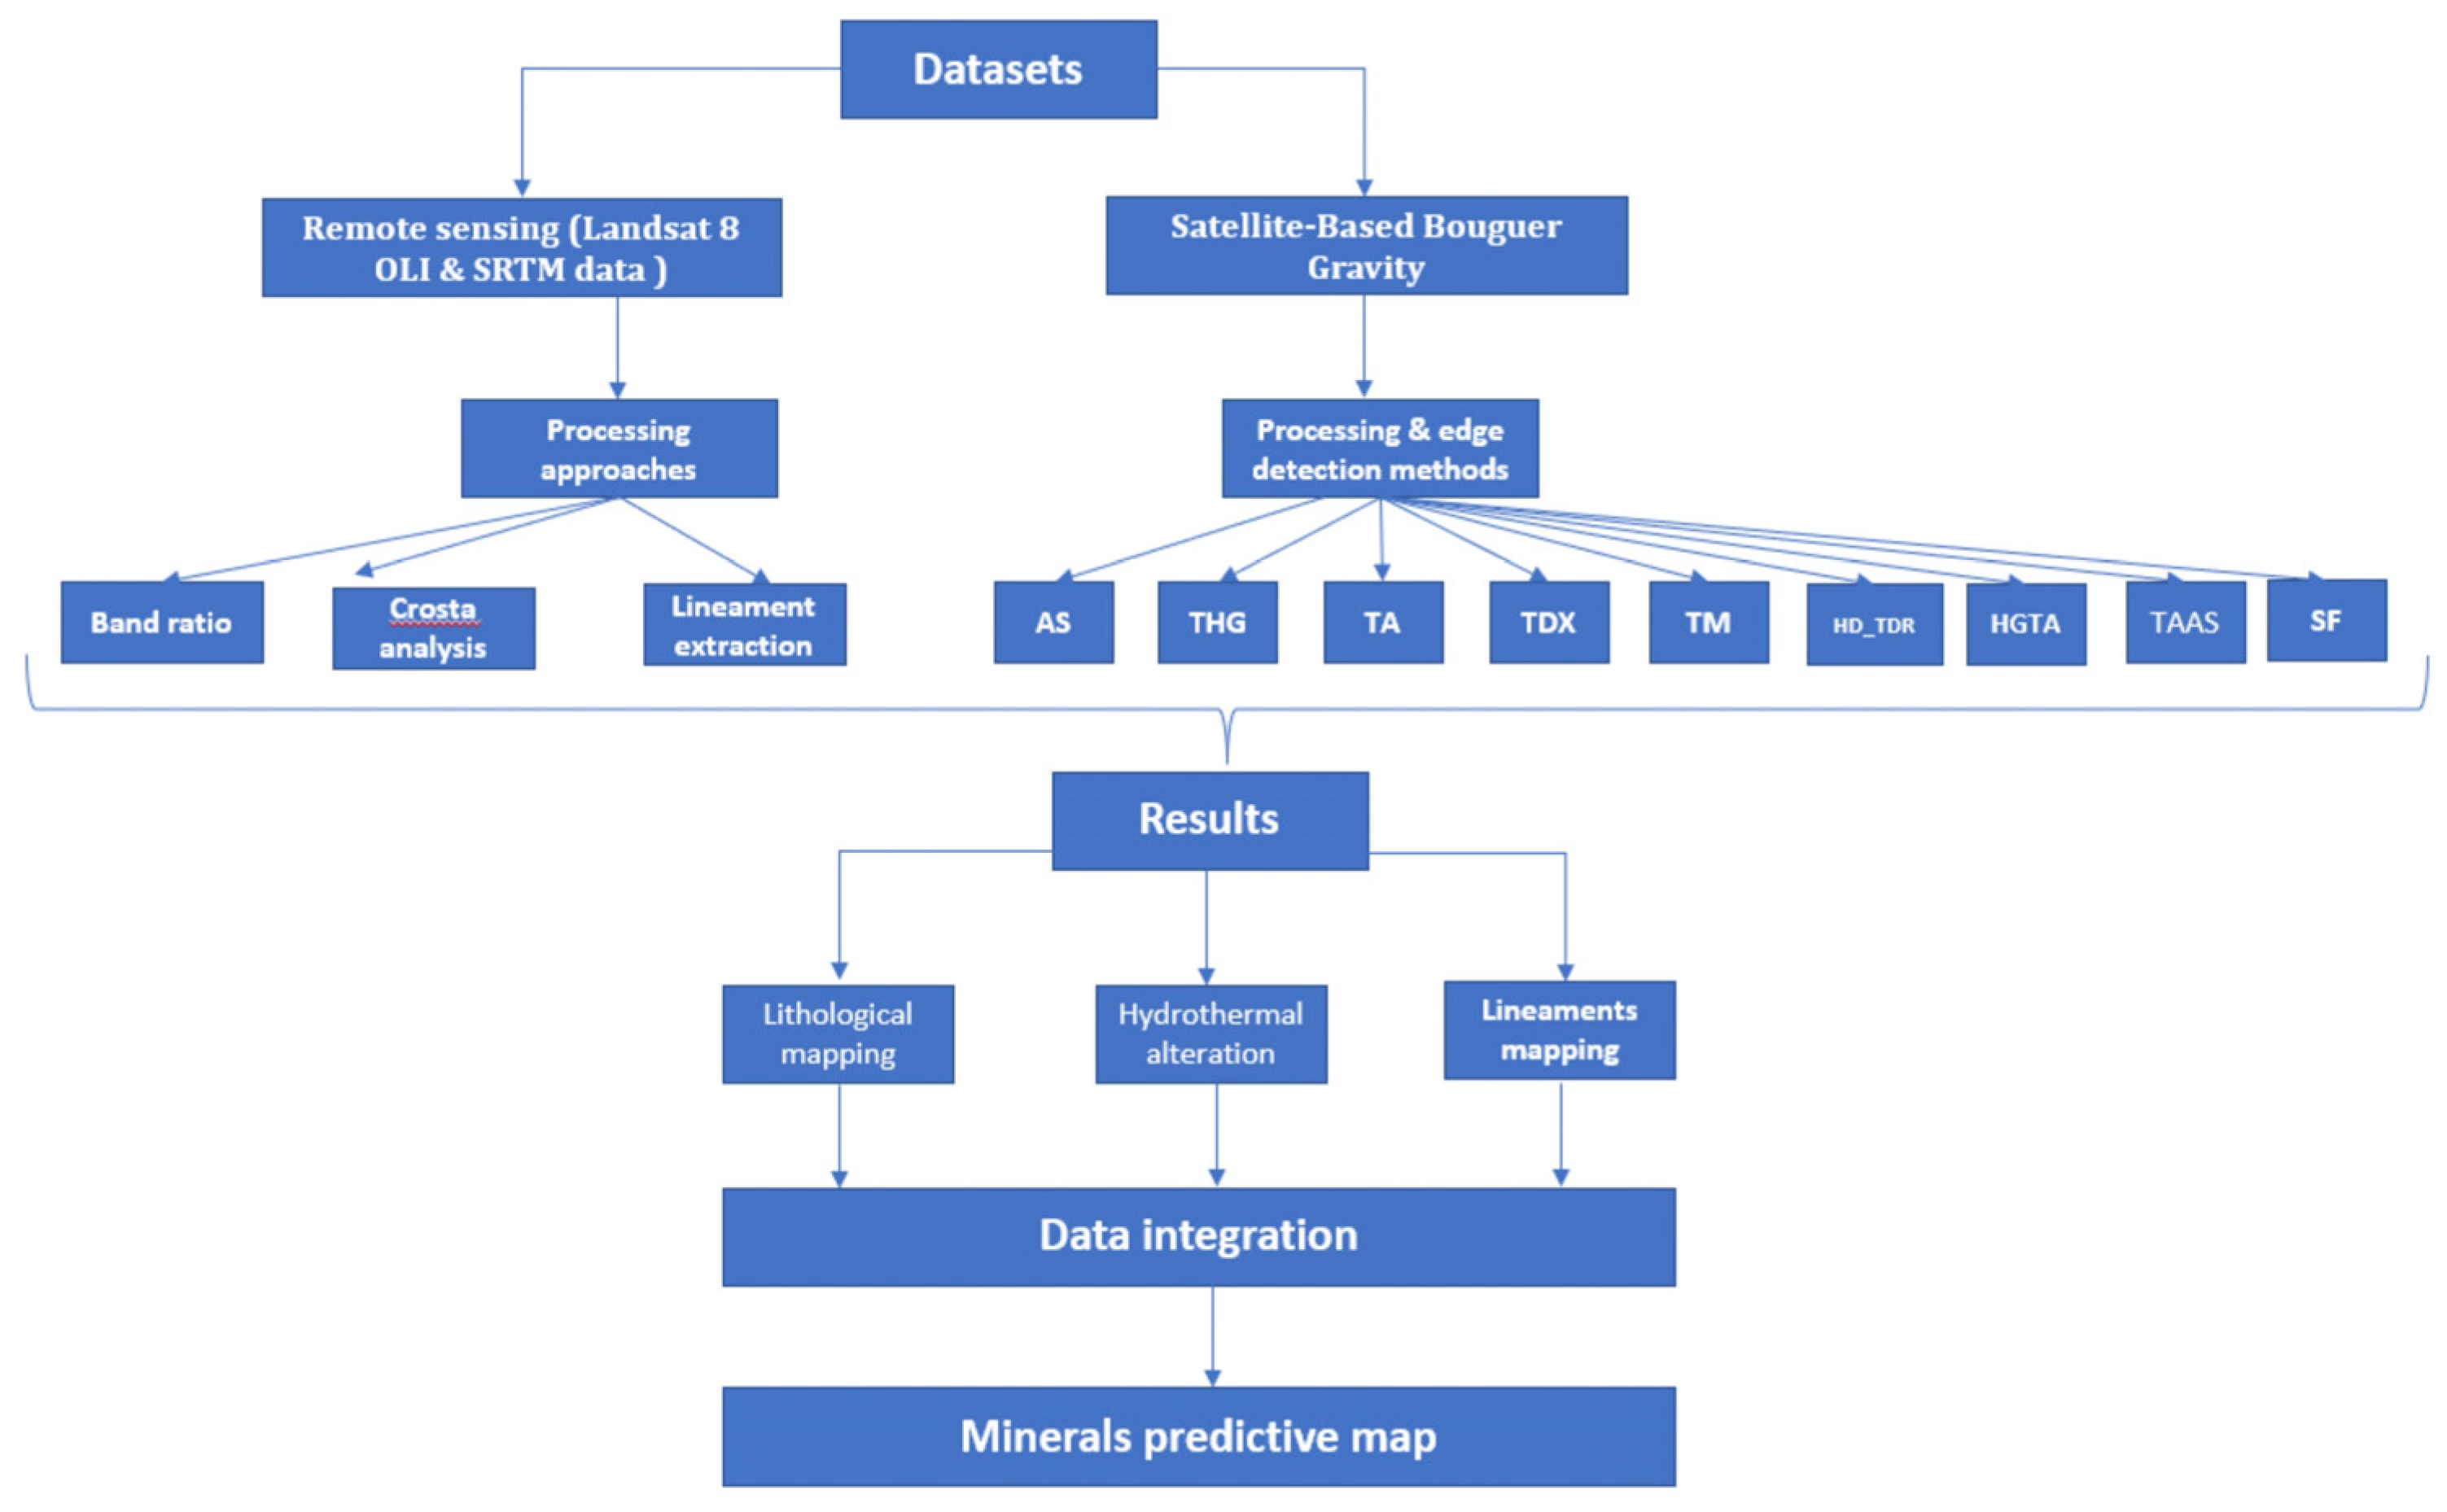
3. Materials and Methods

The present work utilized several analysis techniques to integrate the available datasets, including RS and SBG data [3,14,50], for mapping the structures and their related hydrothermal alteration zones (HAZs). These methods were used to connect the presence of mineral resources with the surface and subsurface structures delineated from the integrated approach. Figure 3 shows the integrated approach’s workflow and each method’s details.

3.1. Remote Sensing Data

The Landsat-8 OLI (L8) dataset covering the investigated area originated from a mosaic of four scenes. The dataset was acquired on 4 July 2019 and was downloaded for free from the USGS Earth Explorer website (https://earthexplorer.usgs.gov, accessed on 20 July 2023). There are 11 bands in this dataset, each with various wavelengths and resolutions (Table S1).
For the L8 raw data to be prepared for further processing and to be in an adequate condition for investigation, pretreatment had to be carried out. Radiometric calibration, atmospheric correction, and minimum noise fraction (MNF) were all included in the preliminary processing.
Radiometric calibration and the Fast Line-of-Sight Atmospheric Analysis of Spectral Hypercubes (FLAASH) atmospheric correction model were applied using the ENVI software version 5.3 by L3Harris Geospatial USA (Broomfield, CO, USA), as described by Jahvar et al. [51], to calibrate the L8 data with the spectral radiance, subset them, and convert the digital number (DN) to reflectance.
MNF segregates noise in the data from the spectral information [52,53]. L8 bands in the initial space are converted to eigenspaces via MNF. A data space can be divided into two distinct regions: one region is characterized by large eigenvalues and coherent eigenimages, while near-unity eigenvalues and noise-dominated images represent the other region. Eliminating unwanted information from the data and only using coherent portions will improve the outcomes of spectral processing [53]. The MNF bands were converted into their initial data space minus the noise band(s) for bands containing eigenvalues less than 2, which were then regarded as noise [54]. There were only seven bands for which the MNF approach for the L8 subset covering the research area was employed.

3.1.1. Band Ratios (BRs)

The band ratio technique is applied mainly in geological applications [55,56,57]. The band ratio approach divides the digital data value of one band with high reflectance by the digital data value of another band with low reflectance [58,59,60]. This method reduces the negative impact of environmental details, such as the Earth’s surface, while enhancing contrast and compositional data. Some characteristics that cannot be seen with raw data are highlighted by the shadow cast by the terrain’s surface.

3.1.2. Crosta Analysis

To distinguish between hydrothermally altered minerals, Crosta analysis is used to decrease the number of spectral band inputs for principal component analysis (PCA). This is carried out to enhance the likelihood that the unwanted spectral bands will be identified, which can then be simply mapped onto just one of the principal component images. The main component images that directly emphasize the spectral characteristics of particular targets were chosen using the Feature-Orientated Principal Component Selection (FPCS) technique. This technique is used to examine the loadings of PCA eigenvectors to identify the components that capture information relevant to the target spectral signatures. The features that are most relevant to the theoretical spectral signatures of specific targets are then used to detect the targets in the image. The pixels in those selected principal component images that correspond to the targets are assigned as either dark or bright pixels, indicating the presence of the targets [61].
The USGS spectral database was used to determine the spectral characteristics of iron oxides and minerals that contain hydroxyl [62]. Bands 2, 5, 6, and 7 of the Landsat 8 OLI were chosen based on this spectral database to emphasize the spectral responses of iron-oxide-bearing and hydroxyl-bearing (clay) minerals.

3.1.3. Digital Elevation Model (DEM) of SRTM

The Shuttle Radar Topography Mission (SRTM) data were obtained using the radar C-band at 3 arcsec (90 m at the equator) during a collaborative effort by the National Aeronautics and Space Administration (NASA) and the National Geospatial-Intelligence Agency (NGA—previously known as the National Imagery and Mapping Agency, or NIMA), along with the participation of the German and Italian space agencies [63]. Digital elevation model (DEM) data extracted from the SRTM data [64] were used to recognize and extract geological lineaments by calculating and interpreting DEM derivatives, including shaded relief maps, slope maps, and traverse profiles [65].

Fill Sink

The resolution, or the separation among sample points, is a key factor in determining the correctness of DEM data [66]. Sink (and peak) refers to a standard error in DEM images brought on by resolution issues or by rounding elevation values to the closest integer. In the ArcGIS 10.9 environment, a method known as fill sink was used for the SRTM DEM data of the research region to remove sink errors. A hill shadow thematic map was created using the rectified image.

Shaded Relief

The topography is depicted visually on shaded relief thematic maps using gray values from raster imagery [59,60,61]. The borders separating regions that are darkened and those that are not shaded could be lineaments. Examination of the shade map obtained from the DEM also helps to characterize the lineaments. Therefore, a minimum–maximum range along a color ramp was added to a thematic shaded relief map that was created using the DEM. An azimuth of 135° (southeast), which represents the sun’s position in relation to the horizon, was selected after examining the sun’s various positions and relative angles since it may reveal the shaded and unshaded areas more clearly than other values. The sun’s angle of elevation over the horizon was set to 45 degrees. The spatial analysis hill shading tool of the ArcMap mapping program was applied to complete the work.

Lineament Extraction

The PCI Geomatica 2014 program was used to automatically extract lineaments from the shaded relief image created from the SRTM DEM. The two primary processing stages used for automatic lineament extraction are described below. The first step is the recognition of edges that reveal regions of sharp variations in the values of nearby pixels, and the second step is the identification of the existence of lines [67,68]. These procedures mostly employ the PCI Geomatica software’s LINE module, a popular package for automatically extracting lineaments [55].
An experimental test of automatic lineament extraction was conducted using various value ratios for each LINE module parameter. The test was run on an optical dataset to determine the best set of parameters that returned accurate results for the lines that were extracted [67]. These parameters were applied to the used data in accordance with the literature, and their validity was confirmed by visual assessment. Among this study’s LINE module settings, the default, suggested, and defined values are all shown in Table S2.

3.2. Satellite-Based Bouguer Gravity Anomaly

This study used a high-resolution Earth gravity field model, SGG-UGM-2, as a satellite-based Bouguer gravity anomaly. The SGG-UGM-2 model is a combination of marine gravity data derived from satellite altimetry data and the Gravity Field and Steady-State Ocean Circulation Explorer (GOCE), the normal equation of the Gravity Recovery and Climate Experiment (GRACE), and EGM2008-derived continental gravity data up to degree 2190 and order 2159 [69]. The SGG-UGM-2 data are open-access and available at (http://icgem.gfz-potsdam.de/tom_longtime, accessed on 24 July 2023).

Edge Detection Operators

  • Previous Edge Detection Methods
Boundary analysis operators are utilized to find the edge of the subsurface source. These methods are used for potential data, such as gravity and magnetic data. The formulae for these methods are presented below.
The analytical signal (AS) method is presented as the square root of the sum of the squares of the x, y, and z derivatives, which is known as the 3D AS [70]:
A S = T x 2 + T y 2 + T z 2
In the result of the AS, the edge of a source is shown at the boundaries around the maximum values. The advantage of the AS method is that it is less dependent on the direction of the magnetization vector when using magnetic data. However, the AS method poorly balances the signals from shallow and deep anomalies [71].
The total horizontal gradient (THG) method is another common method, and the formula for the THG is given as [72]:
T H G = T x 2 + T y 2
In the result of the THG, the edge of the source is shown at the maximum values. The THG method is less noise-sensitive but poorly balances the signals from shallow and deep anomalies [71].
The tilt angle (TA) shows the edge of the source at zero values. The TA method can generate a balanced image for sources at different depths. The limitation of the TA method is that it produces secondary edges around the true edge [71]. The formula for the TA is given as [39]:
T A = t a n 1 T z T x 2 + T y 2
The TA method normalizes the vertical derivative (VDR) to the total horizontal derivative [73].
Another common technique in geophysical interpretation is the horizontal tilt angle (TDX), which is normalized to the absolute value of the vertical derivative [74]. The TDX method is represented as follows [75]:
T D X = t a n 1 T x 2 + T y 2 T z
Wijns et al. [40] proposed the theta map (TM) method, which produces balances between edges located at different source depths. The TM method shows the edge of a source at the minimum values. In addition, the TM method has secondary edges around the true edge, like the TA method. The TM method is given as follows [40]:
T M = c o s 1 T x 2 + T y 2 T x 2 + T y 2 + T z 2
  • Recent Edge Detection Methods
In recent years, many new boundary analysis methods have been proposed, such as the horizontal derivative of tilt derivative (HD_TDR) [76], horizontal gradient of tilt angle (HGTA) [77], soft sign function (SF) [78], and tilt angle of analytical signal (TAAS) [79] methods.
The HD_TDR method is like the analytical signal method but is sharper and generates better-defined maxima centered over the body edges of the source [76].
H D _ T D R = T D R x 2 + T D R y 2
The horizontal gradient of tilt angle (HGTA) method is given as follows [77]:
H G T A = T A x 2 + T A y 2
The soft sign function (SF) method was proposed by [78] as follows:
S F = k × T H G z ( k + 2 ) T H G x 2 + T H G y 2 T H G x 2 + T H G y 2 + k × T H G z ( k + 1 ) T H G x 2 + T H G y 2  
where T H G = T x 2 + T y 2 , and 1 k 10 will yield the best results [72].
The TAAS method shows the edges of the sources at the maximum values; however, the detected edges have low resolution. The formula for the TAAS is represented as [79]:
T A A S = t a n 1 A S z A S x 2 + A S y 2

4. Results and Discussion

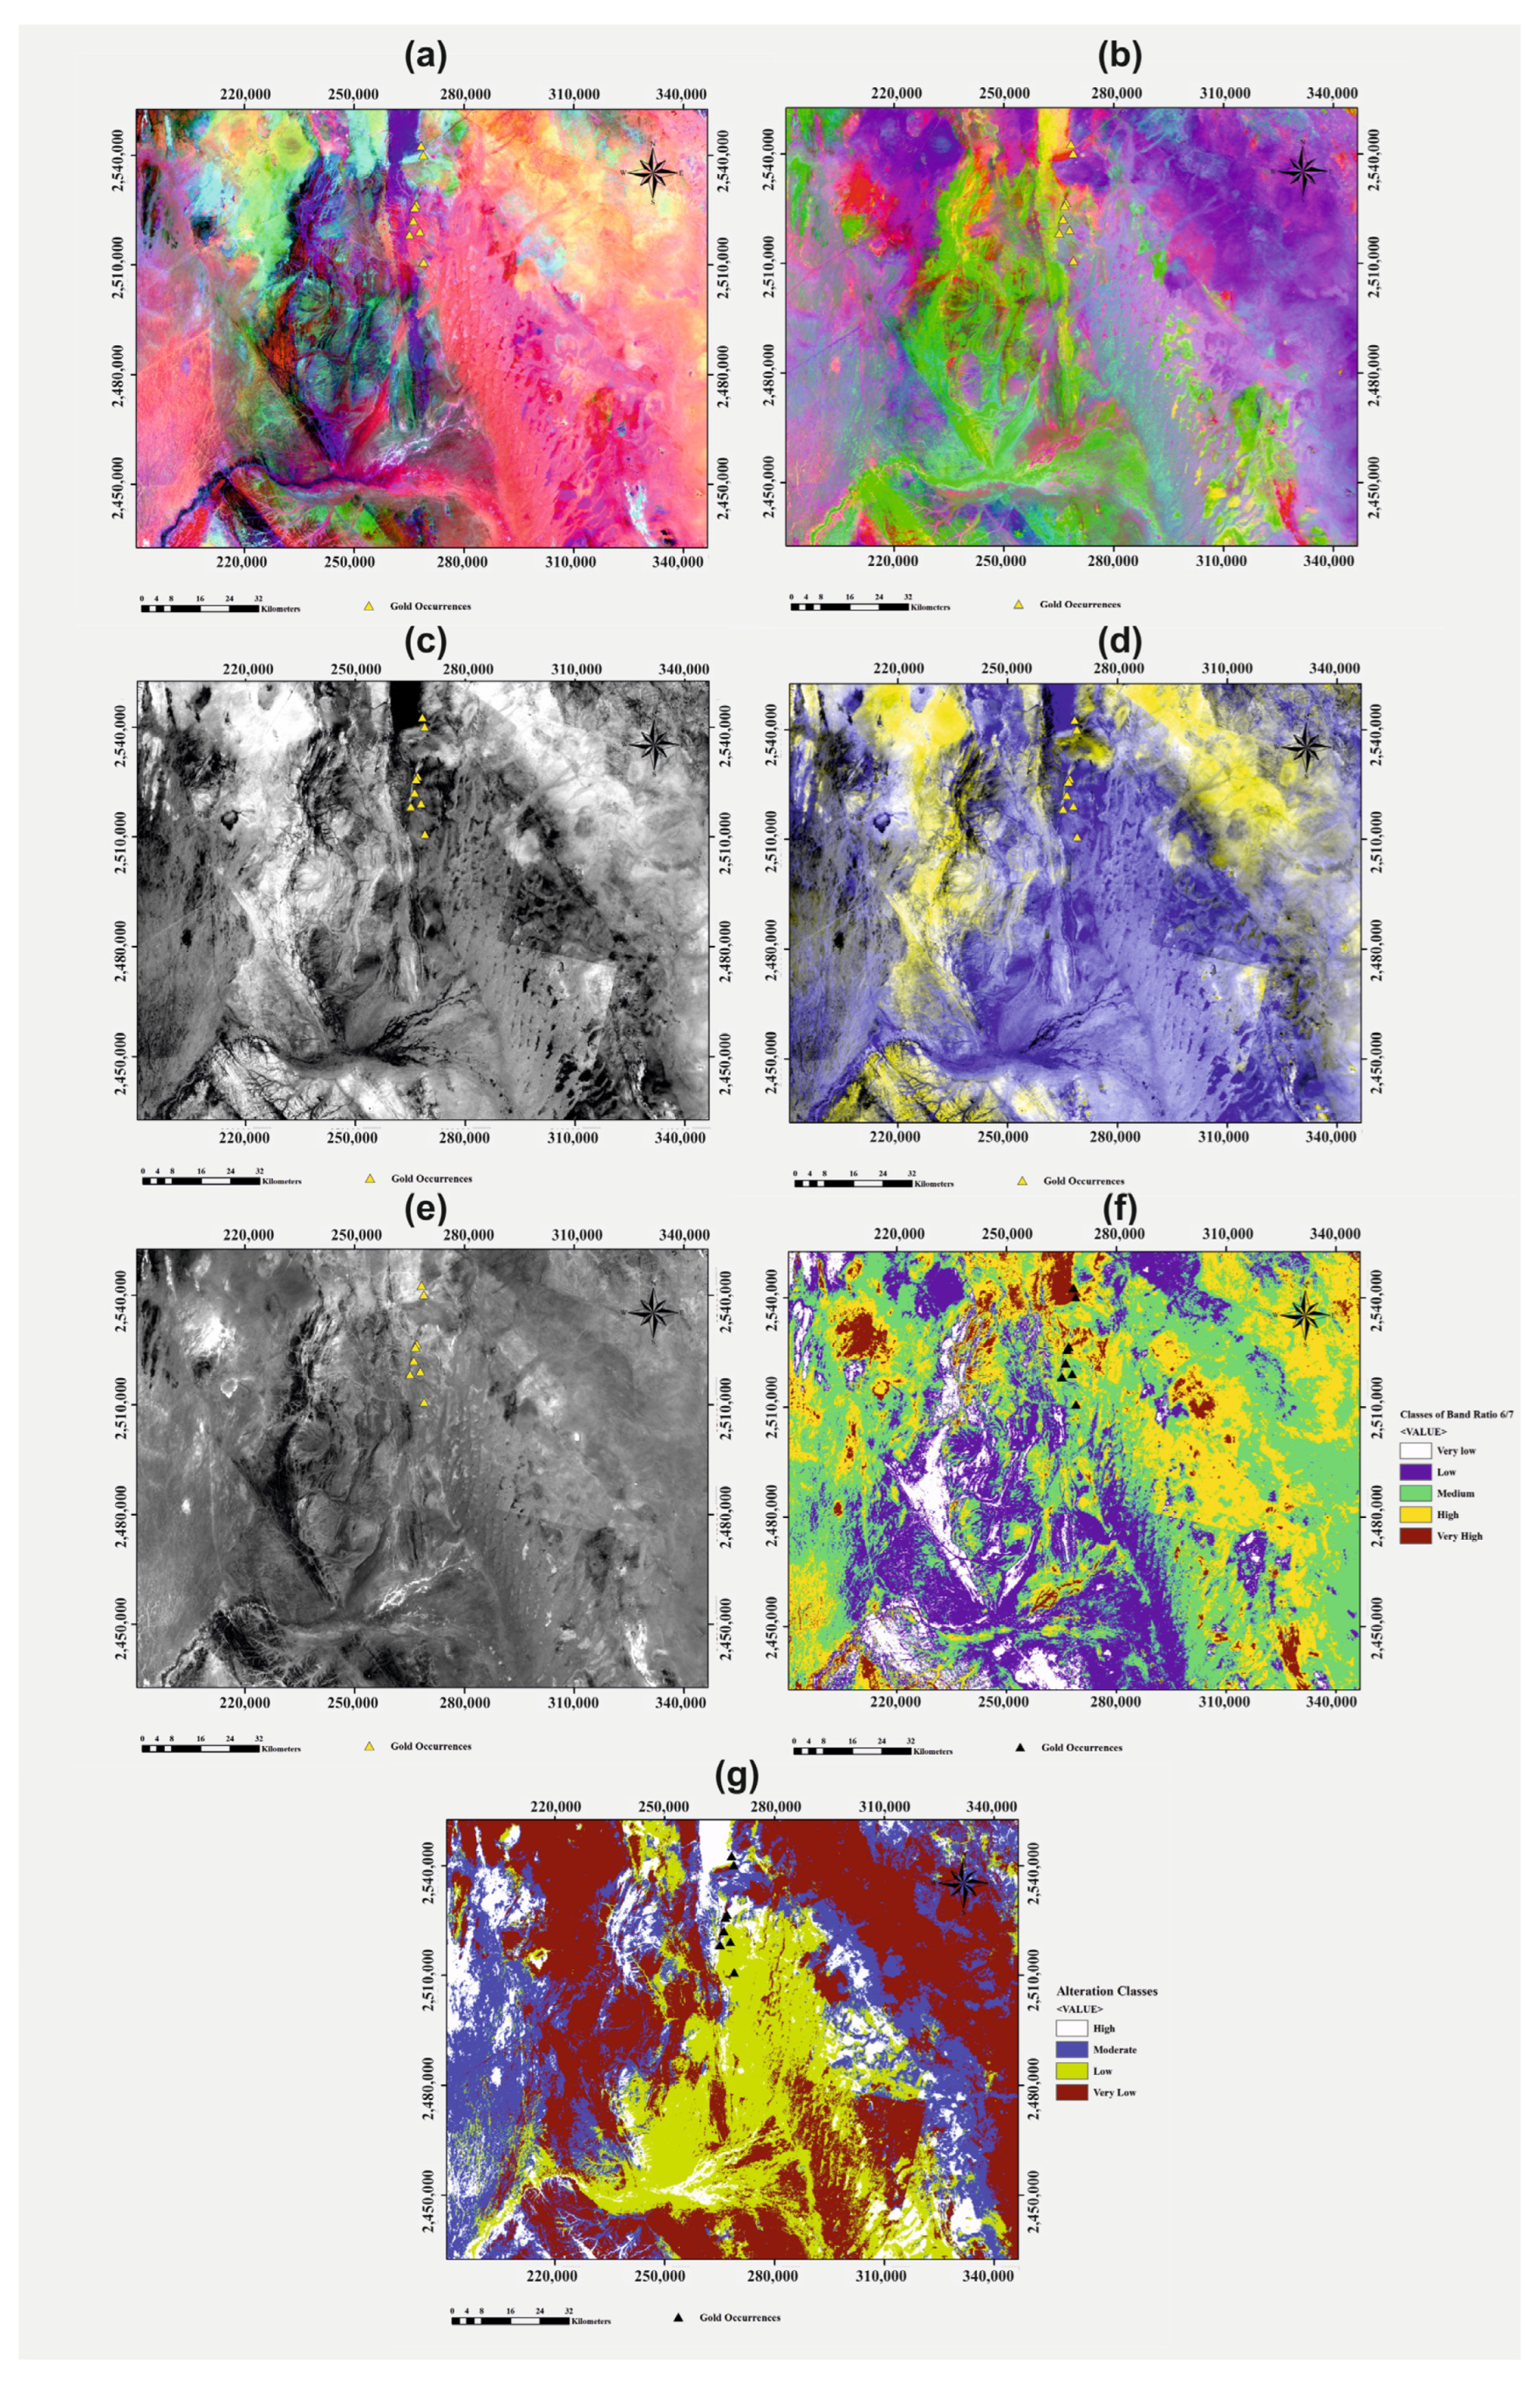
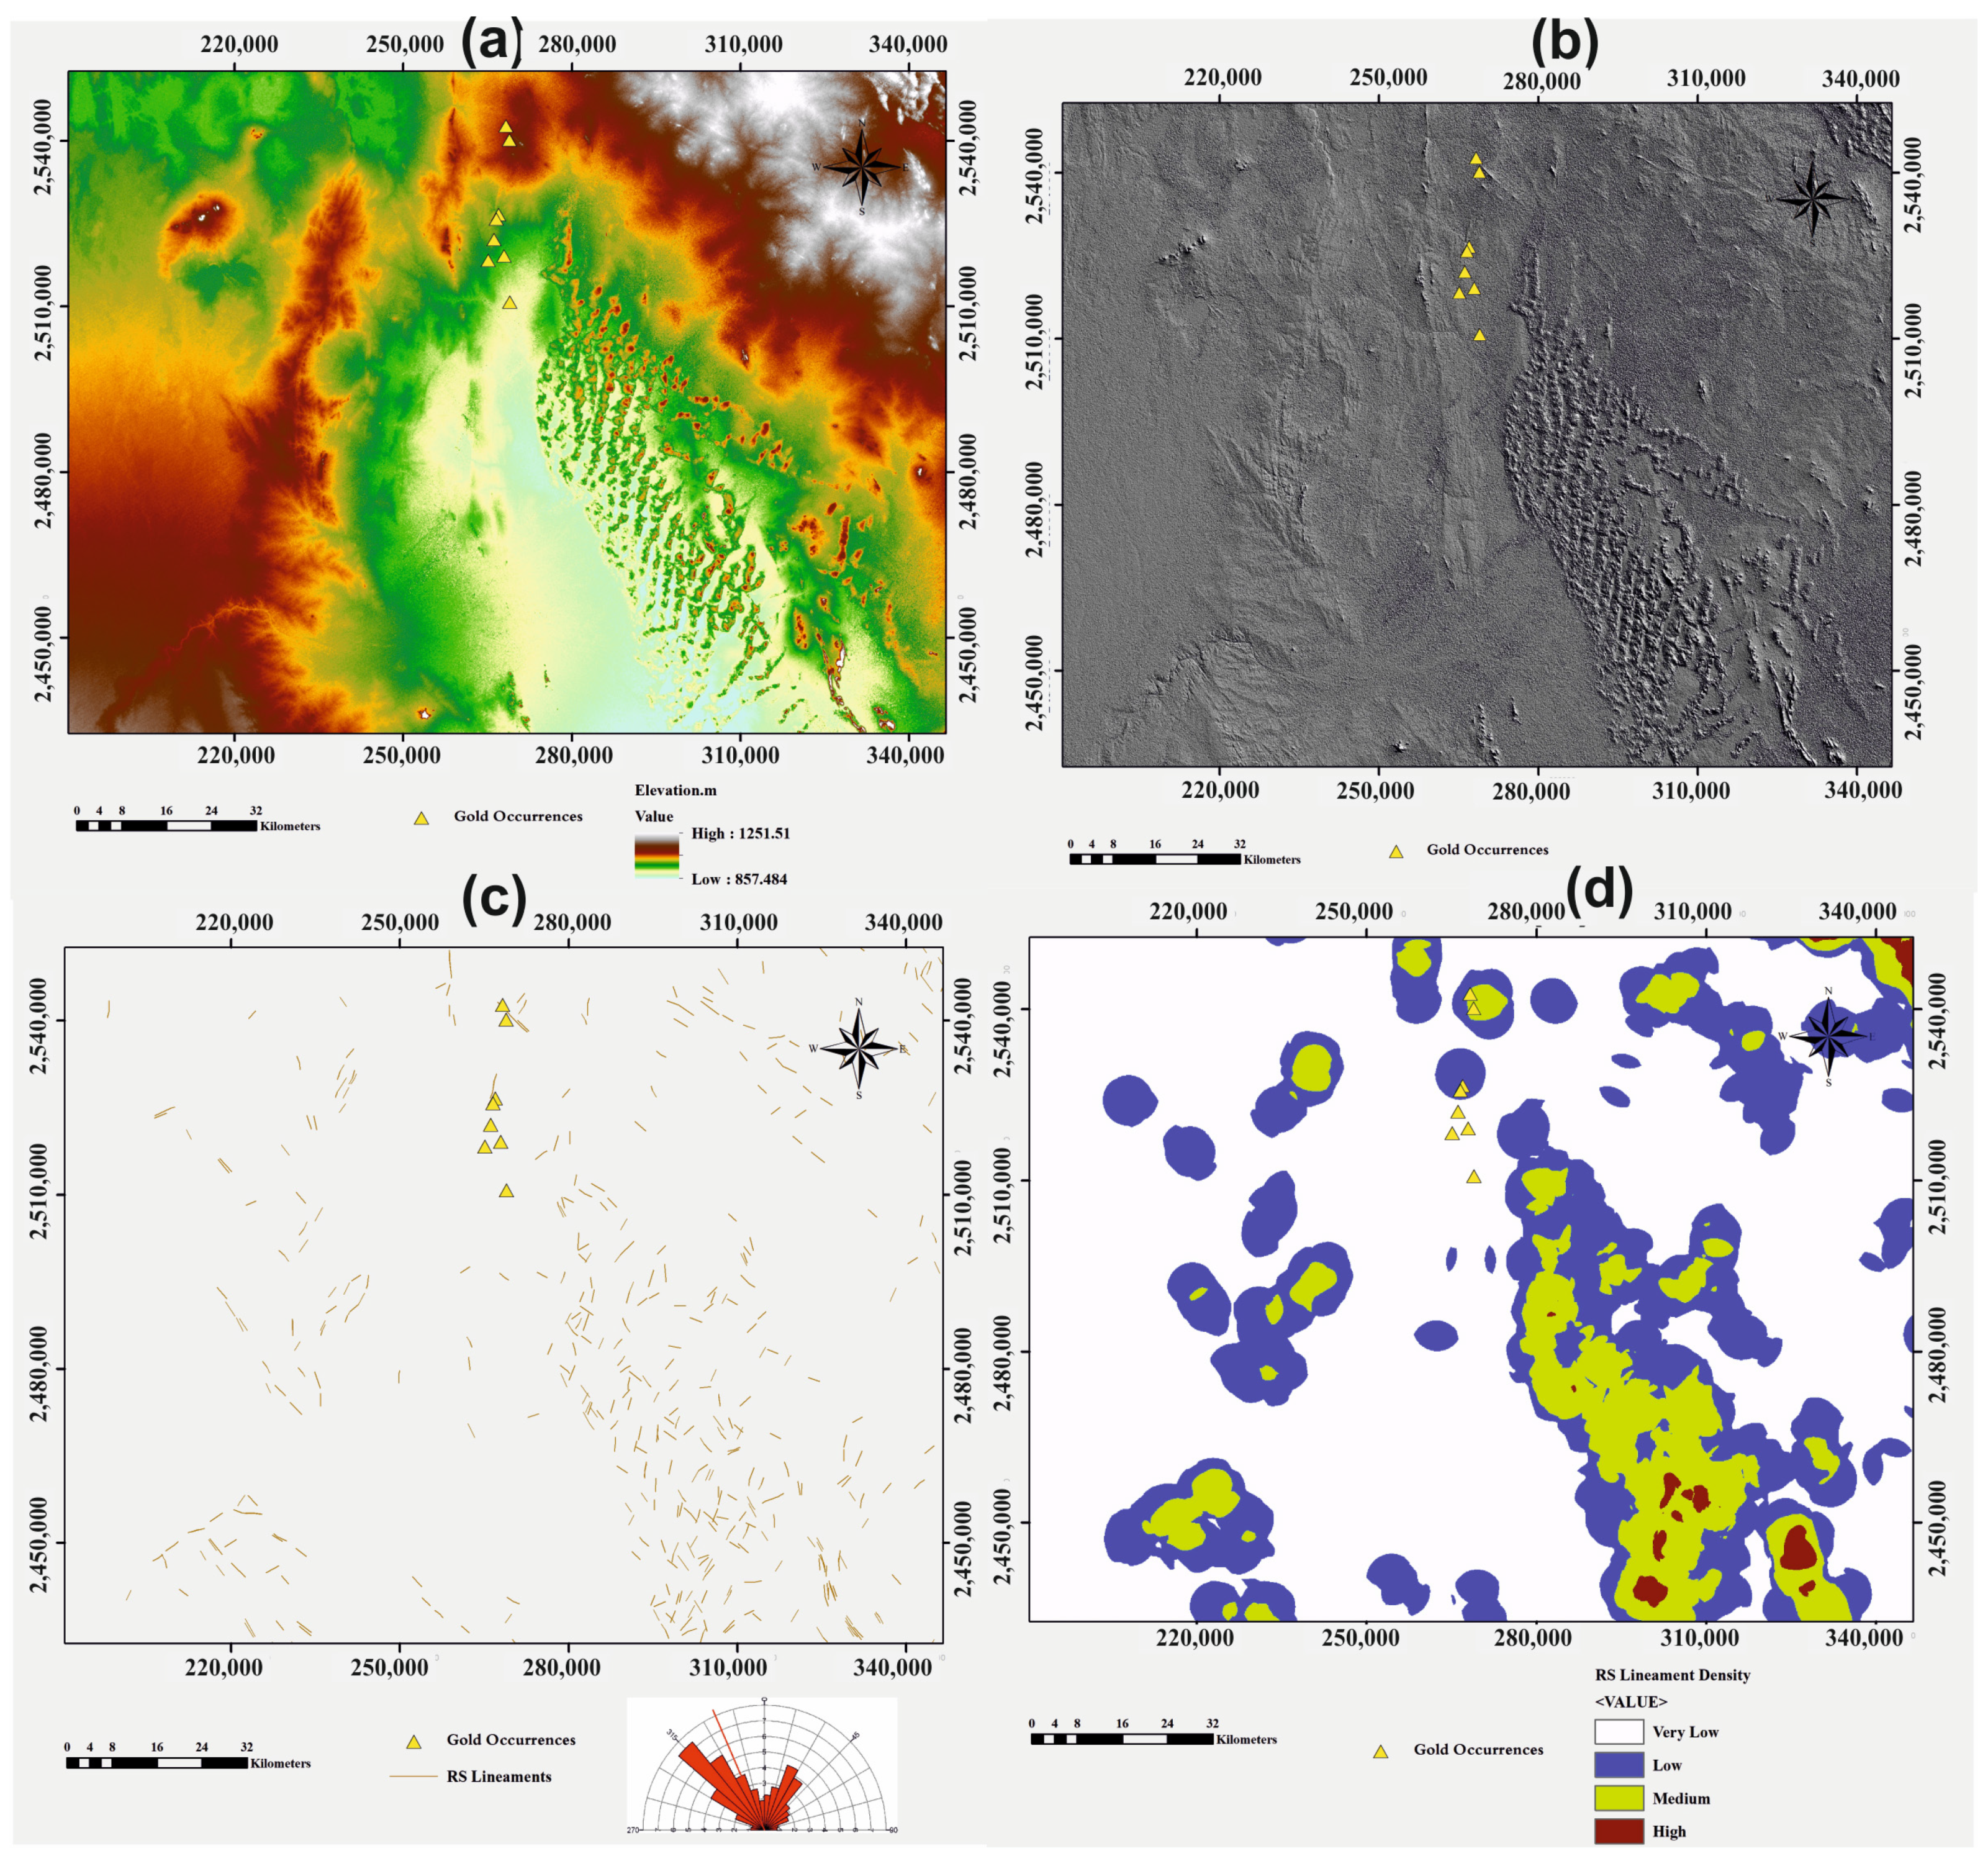
4.1. Remote Sensing (RS) Data

4.1.1. Landsat 8 OLI Data

The investigation of the Landsat data allowed for the outlining of the HAZ areas. The spectral Sabin ratios (4/2, 6/5, 6/7) are represented in the RGB images and shown in Figure 4a [80]. The OH-bearing minerals (clay minerals, such as kaolinite, montmorillonite, and alunite) mainly manifested in a 6/7 ratio, appearing in the RGB images as blue-colored regions. The crimson hue of ferric minerals, such as limonite, hematite, and goethite, was mirrored in the band ratio 4/2. Areas with a high concentration of iron oxides were detected as reddish spots in the band ratio 6/5. A false-color composite map representing an alteration map for the research area was created using band ratios 6/7, 6/5, and 5 [81,82,83], with the HAZs denoted in yellow (Figure 4b).
The corresponding eigenvectors and eigenvalues of SPCA for iron oxide layouts are shown in Table S3, with band 4 (reflection) and band 2 (absorption) as distinctive bands for iron oxides and the typical PC4 for iron oxides. Both the eigenvectors and individual values of the hydroxyl minerals were calculated using the Crosta analysis of the Landsat 8 OLI. Table S4 shows that in PC4, there was a difference in eigenvector importing among bands 6 (−0.774) and 7 (0.504). As a result, the darkest pixels represented band 7 (0.59) and reflected the OH-bearing minerals. The hydrothermally changed portions emerged in a brilliant tone following the negation of PC4.
During the generation of the Crosta alteration image (Figure 4c,d), the iron oxide minerals, hydroxyl minerals, iron oxide minerals (F, H + F, H), and RGB images were shown in grayscale. The white pixels with bright reflections that identify alteration areas in the grayscale images are likely to be zones with the most future potential since they display both iron-stained and clay alterations. While hydroxyl minerals are placed in yellow to orange reflection color in the RGB images, areas rich in iron oxide minerals are identified in cyan to bluish coloration [83].
The grayscale image produced by ratioing bands 6 and 7 (6/7) traced clay and hydroxyl-mineral-bearing areas as white-colored areas or linear patterns scattered along possible tectonic elements and associated stream channels, implying that the distribution of these minerals may be structurally governed (Figure 4e,f) [84].
The images incorporate data from the band ratios and PCA-defined rock alteration caused by hydrothermal activity. These zones can be used to differentiate between locations with a high number of hydroxyl and iron oxide changes. As a result, the images were divided into five ranks. Figure 4g shows that the higher the rank, the better the mineral’s favorable prospective grade. The richness of HAZs often indicates mineral alteration regions, particularly those rich in gold mineralization, which are frequently associated with highly sheared areas [85].

4.1.2. STRM DEM Data

The topographic variances varied from 857 to 1251 m (a.s.l.) according to the analysis of the SRTM DEM (Figure 5a). Additionally, the DEM offered geometry-related information not made available by previous RS approaches. The geological analysis of the Landsat photos and SRTM data revealed structures with lineaments (Figure 5b). From the findings of the lineament analysis, a total of 552 extracted lineaments from the STRM DEM are displayed in Figure 5c, along with a density map (Figure 5d) and a rose diagram showing the spatial distribution of the lineaments. The rose diagram is used to indicate the observed lineament trends, with patterns in the NW–SE, NNW–SSE, NE–SW, and NNE–SSW directions being considerably more apparent than those in the N–S and E–W directions (Figure 5c).
Lineament density analysis was performed to determine the frequency of the lineaments per unit area. Also referred to as the lineament frequency, the lineament density is a measure of a collection of linear features in a location. This analysis led to the creation of a map (Figure 5d) that depicts the locations of the lineaments throughout the investigated area. According to [86], areas with a high lineament density are suitable for mineral prospecting.

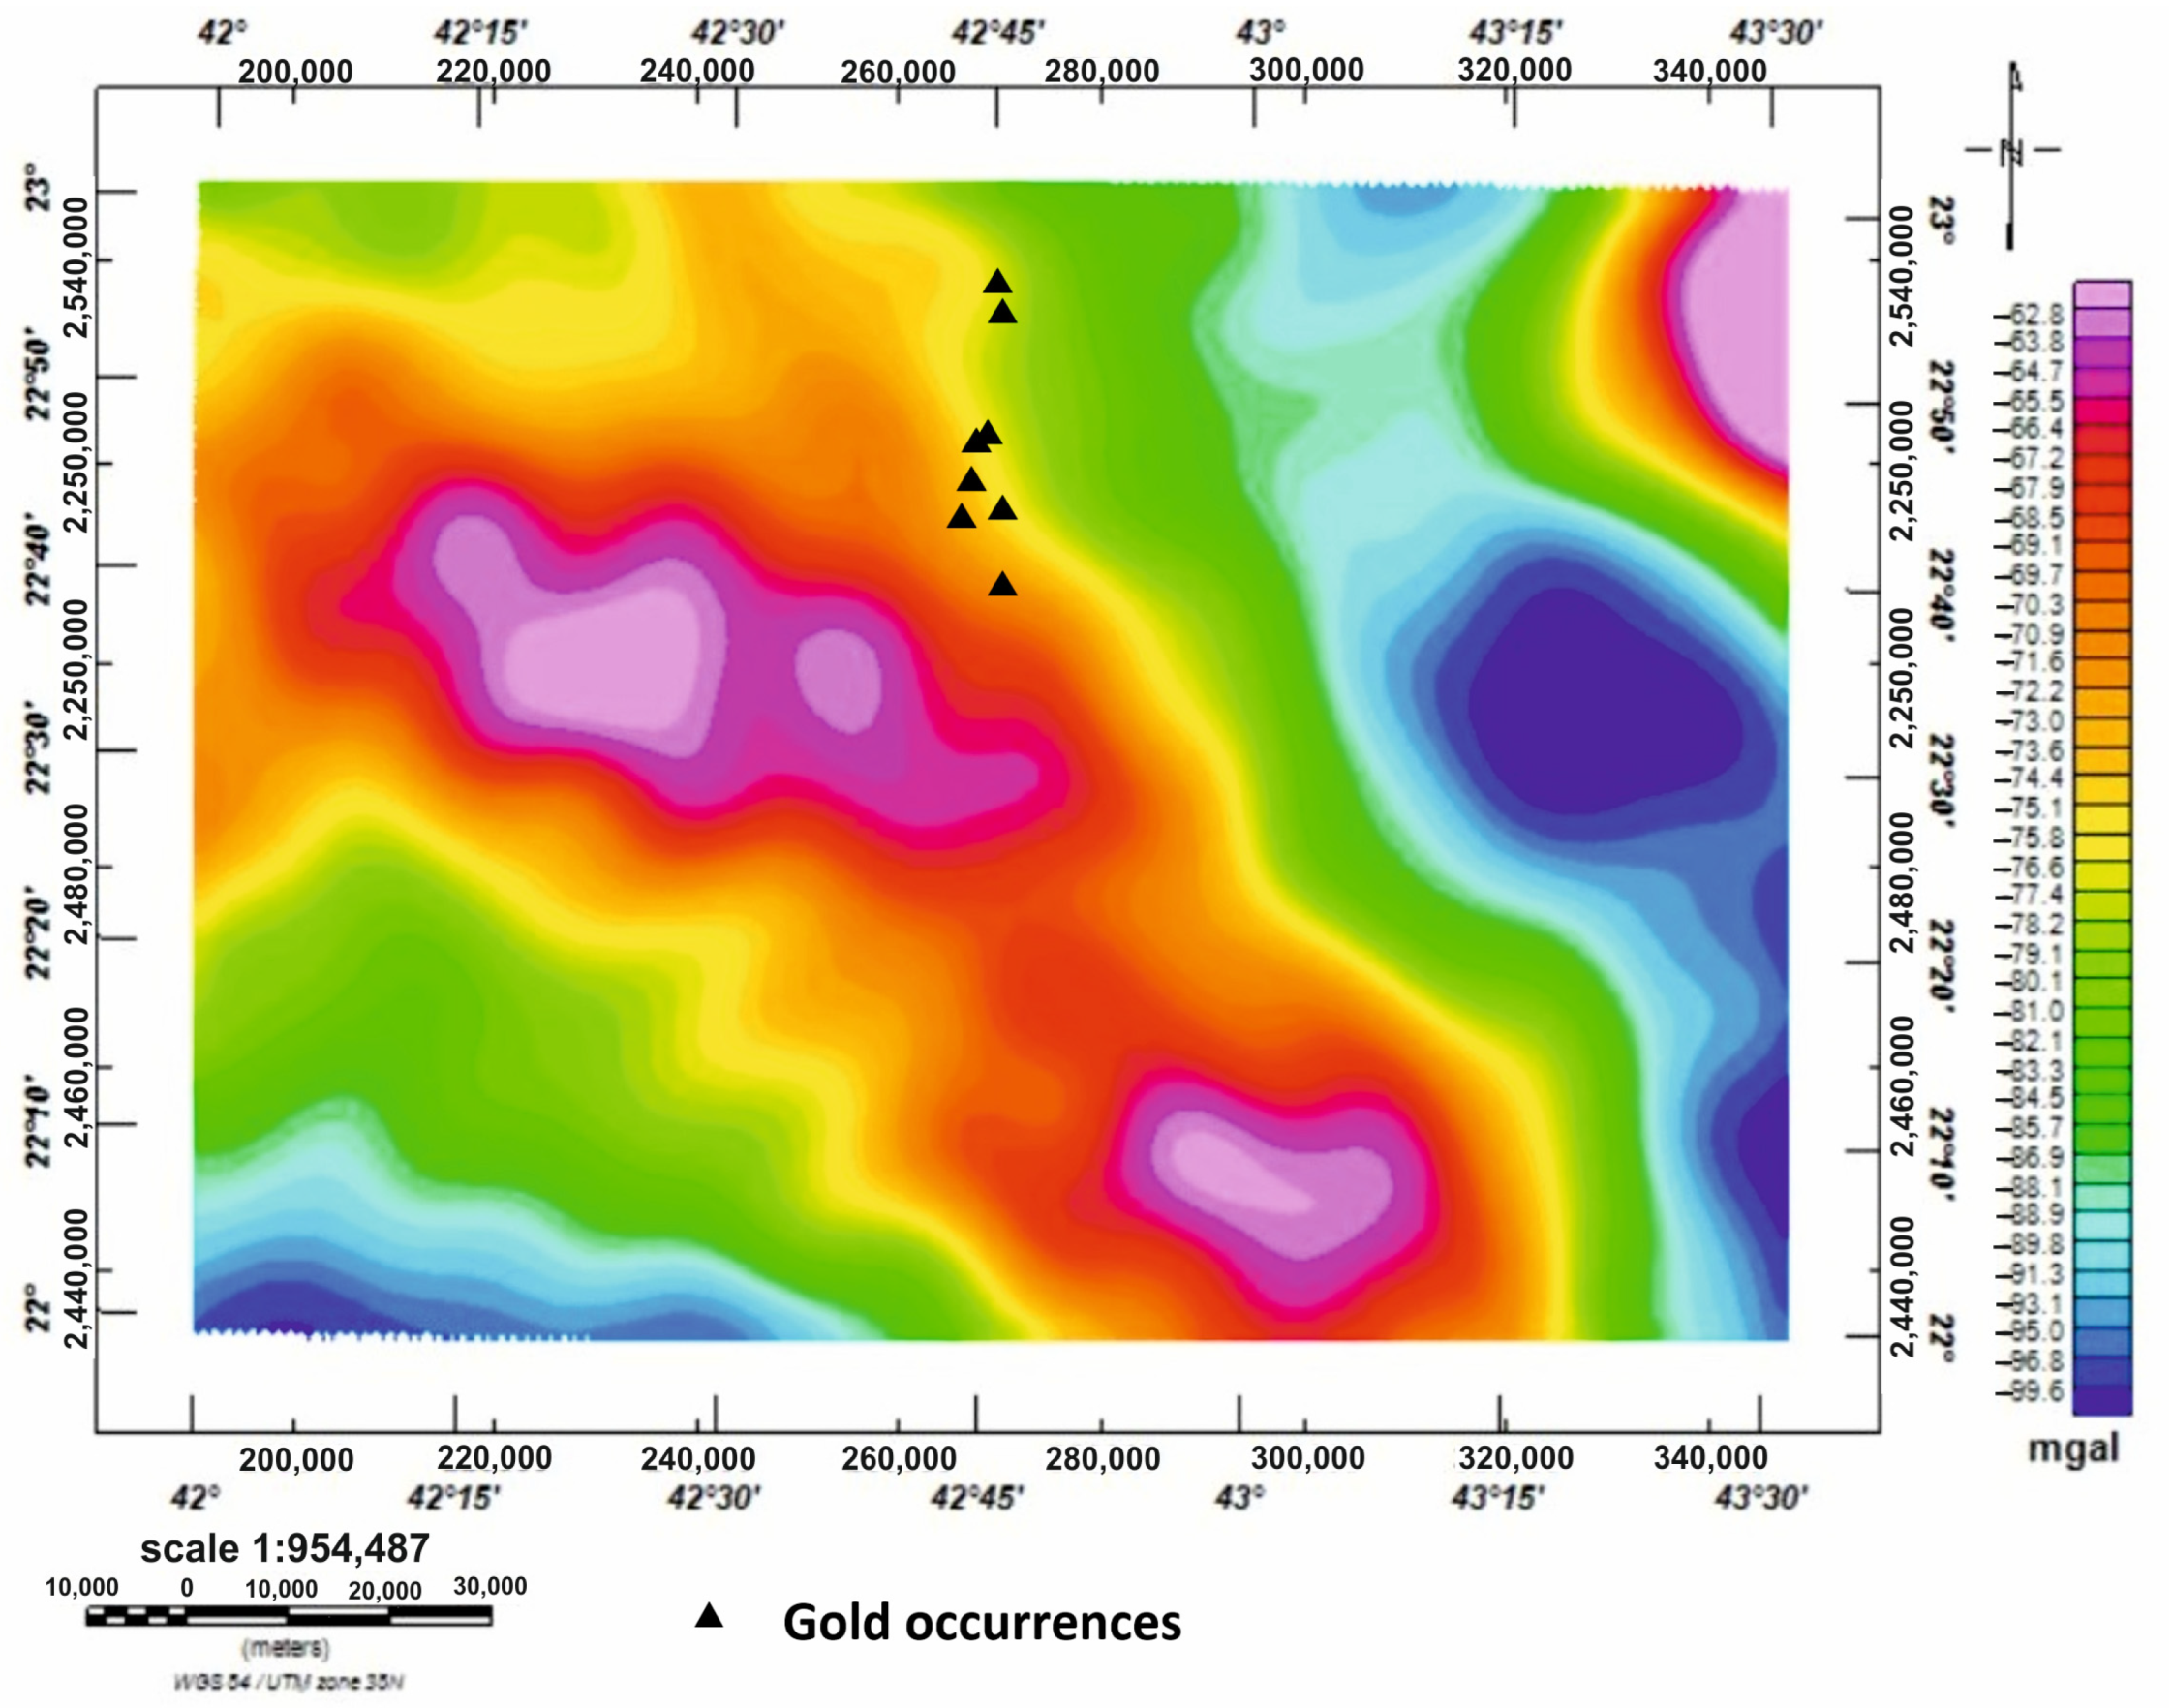
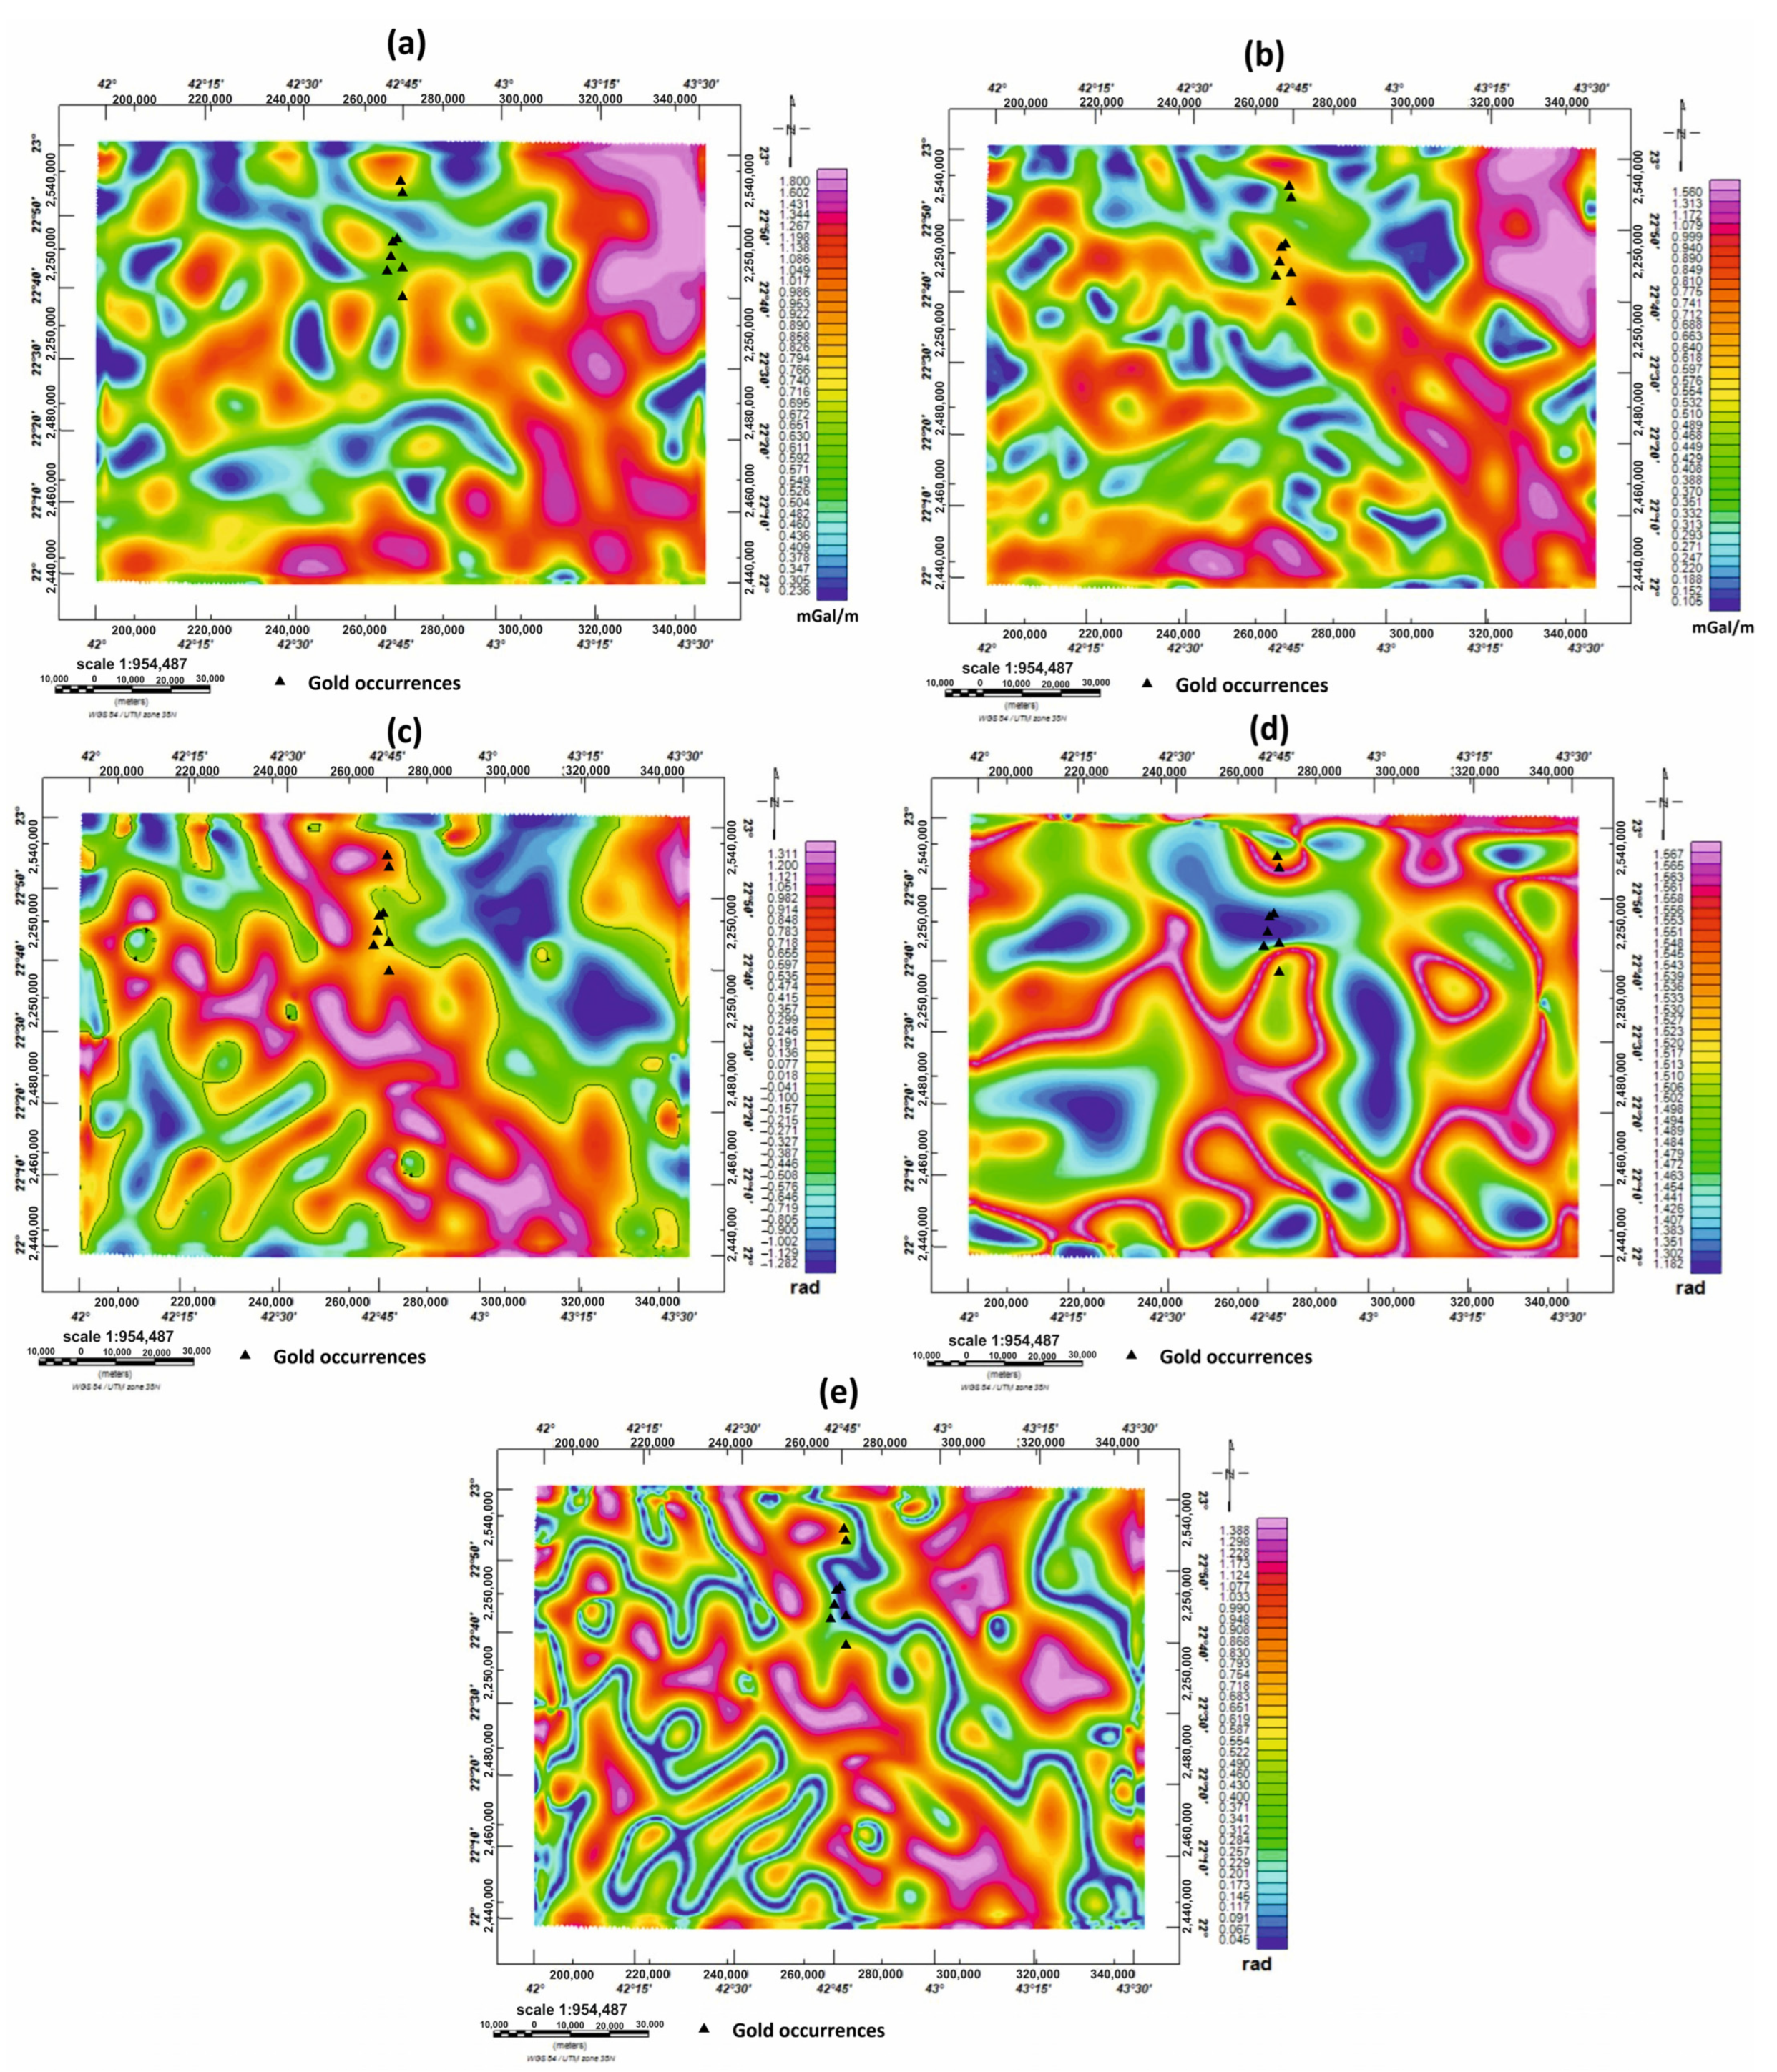
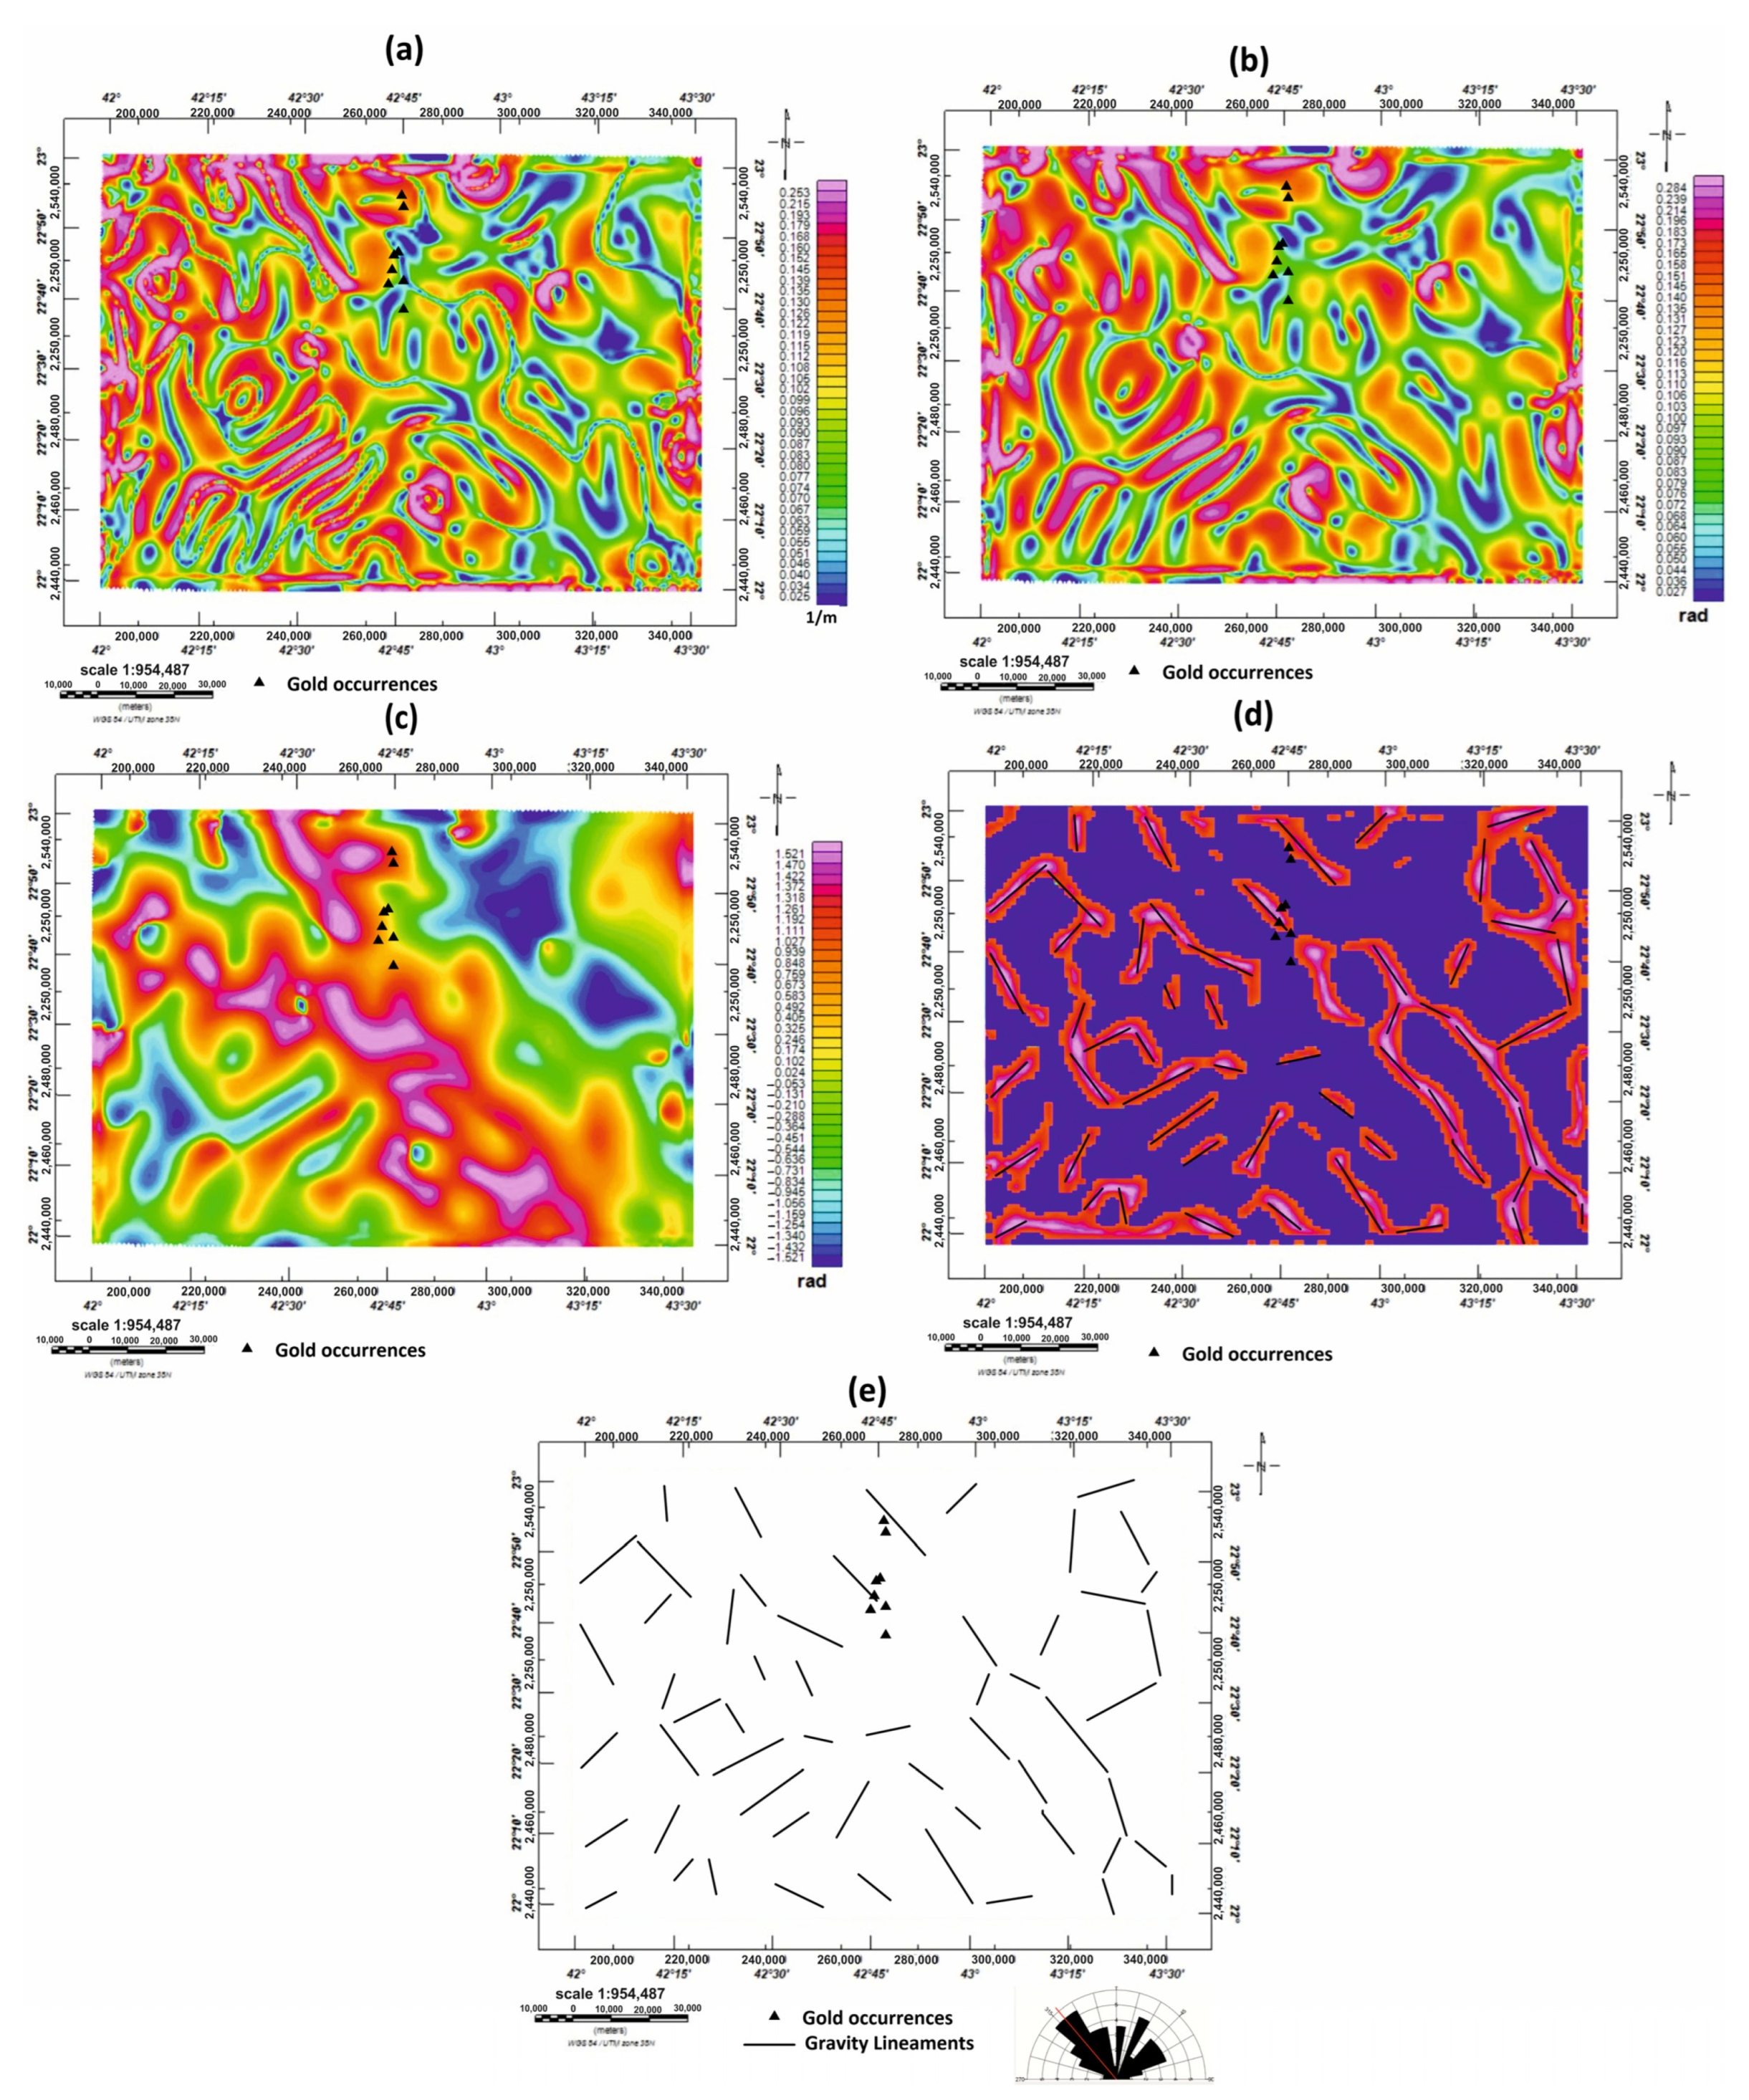
4.2. Satellite-Based Bouguer Gravity (SBG) Data

In this study, the SGG-UGM-2 model was selected to obtain Bouguer gravity anomaly data between longitudes 42° and 43.3° and latitudes 22° and 23°, with a grid interval of 4 km. The Bouguer anomaly values changed from −62.8 to −99.6 mGal (Figure 6).
Several threshold analysis operators were used, including the AS, THG, TA, TDX, and TM. Furthermore, modern edge recognition filters such as HD_TDR, HGTA, TAAS, and SF were used, and the findings were correlated with the research area’s tectonic structure, according to the Hulyfah volcano-sedimentary pattern (Siham and Bani Ghayy Groups), which makes up most of the Bi’r Tawilah area and its surroundings. The Bouguer gravity map revealed higher values in the research region’s central, southern, and northeastern parts. At the low–high-anomaly interface, −75.1 m Gal values were reported near the Bir Tawilah gold mining area (Figure 6).
The regional high-gravity anomalies are associated with crustal thickening in the research region’s central, southern, and northeastern parts [87], implying that lithological crust changes cause this regional gravity anomaly gradient.
In the results of the AS method, the discontinuities cannot be seen, and the greatest values near the map’s north reflect a northwest–southeast trend. This result could be explained by the AS’s poor performance in recognizing shallow and deeper sources, and the discontinuities could be shallow sources in this location (Figure 7a).
The NW–SE and NE–SW trends in the THG, TA, TDX, and TM data can, however, be seen clearly. The THD results are consistent with the nearby active and potential faults (Figure 7b–e). The maximum values depict the boundaries of tectonic plates and discontinuities. Additionally, although the TDX approach provides the edges at the maximum values (Figure 7d), the TA result displays the fault edges at the zero values rather than the maximum values (Figure 7c). In the TM filter result, when the TM filter provides zero values, but the TDX filter yields maximum values at the exact locations, this may be connected to how the TM method produces secondary edges (Figure 7e). The TM and TDX maps have interconnected lineaments, which can make the interpretation more challenging.
The high-resolution SBG map underwent enhanced filtering using HD_TDR, HGTA, TAAS, and SF (Figure 8).
The HGTA generated from the tilt angle filter is shown in Figure 8b, along with its effects and outputs. The lineaments brought about by lithological variation were visible along the tilt angle’s zero-contour line, but this filter did not pick up on sharp edges [88].
The NE–SW, NW–SE, and N–S faults had prominent signatures on the HD_TDR and HGTA maps (Figure 8a,b). Therefore, they could not be used to identify the structural patterns in this situation. Strong filters called the TAAS and SF enable simultaneous equalization of signals with low and high amplitudes.
The geologic characteristics were considerably simpler to comprehend visually and qualitatively because the TAAS and SF maps (Figure 8c,d) provided a more detailed characterization of the features. A more exact length and width delineation can be seen on the SF map (Figure 8d). The visual comparison makes it simpler to understand the SF-derived lineaments. Subsurface linear structures detected in the research region according to the SF map (Figure 8e) exhibited lineaments, with the trends in the NW–SE, NNW–SSE, NE–SW, and NNE–SSW directions being more evident than those in the N–S and E–W directions. The lineament map derived from the subsurface gravity data highlighted the bulk of elongated NW–SE zones and their intersecting NE–SW trends (Figure 8e).

4.3. Integration of RS and SBG Results

Integrating multiple data sources in a spatial evaluation approach is essential in mineral prospect mapping [89]. To estimate the likely location of gold resources, a combined strategy has been used to characterize the areas of mineral occurrences [90]. This section combines the lineaments and HAZs produced from the RS and SBG data. This is helpful for investigation strategies in searching for minerals and serves as adequate evidence of mineralization.
By integrating the lineaments derived from the RS and SBG data, an integrative lineament map (Figure 9a) was constructed, which displays the critical surface and subsurface features (faults/fractures). Analysis of the RS- and SBG-derived lineaments revealed that the lineaments in the NW–SE, NNW–SSE, NE–SW, and NNE–SSW directions were more pronounced than those in the N–S and E–W directions. A density map was created using the data’s recovered lineaments (Figure 9b), and we classified it into four classes. This map showed a high density of fracture/fault zones in the southeast of the research region (south of the Bir Tawilah gold mine) and a medium density in some sections of the western and eastern parts. The density map also showed a prominent NW–SE tendency that crossed the NE–SW trend.
The geodynamic evolution of the studied area has been significantly controlled by the linear trends that have been found. These patterns, which govern the rock units and represent ideal locations for hydrothermal solutions, were confirmed in the Landsat data. The integrated and extracted lineaments from the RS and SBG data and the geological map were superimposed on the derived hygrothermal zone map to indicate the favorable and predicted sites of gold and hydrothermal mineralization (Figure 10). High-class sites indicate a desirable location and a greater density of mineral resources, considering that many mineral and gold deposits are linked to HAZs, including fluids that rise through fault lines and fissures.
As a consequence of this, regions that have a greater lineament density, which is associated with tectonic/structural lithosphere deformation [91], are more likely to have deposits of gold mineralization. Therefore, the areas with the greatest change and lineament density are compatible with the most appropriate predicted mineralization regions. In addition, the location of the existing gold mines also correlates well with these locations. As a result, the predicted Au mineralization zones are found in the southeastern, eastern, and northern regions (Figure 10).

5. Conclusions

The research region is situated in the center of the Arabian Shield (Ash) and includes the Bi’r Tawilah gold mine area and its surrounding area, which is considered to be one of Saudi Arabia’s largest gold mining areas. The current study’s primary objective was to identify the optimal locations of mineral resources and gold deposits by combining surface and subsurface structure components and hydrothermal alteration zone locations. The detection of HAZs and structural lineaments in the investigated area was achieved using an integrated approach based on remote sensing (RS) data (Landsat 8 OLI and SRTM data) and SBG data.
The merging of the RS and SBG data allowed for the detection of structural discontinuities and HAZs in the research area. In order to locate HAZs in the Landsat OLI data, image processing techniques including band ratios and PCA were applied. From the final image, four zones representing different degrees of alteration were identified. Lineaments were taken from the SRTM data analysis. Using the SBG data, several edge detection methods were utilized to build subsurface lineaments. The lineaments in the NW–SE, NNW–SSE, NE–SW, and NNE–SSW directions were more significant than those in the N–S and E–W directions, according to the analysis of the RS and SBG data’s lineaments. The HAZs and lineament density were combined to create a mineral potential map that maximized the area of possible mineral resources.
The lineaments derived from the RS and SBG data analysis were found to be more compatible with the HAZs. This demonstrates that deep lineaments are frequently linked to alteration zones. This combination reflects the efficacy of using RS and SBG maps to explore gold occurrences and the associated hydrothermal metallic mineralization.

Supplementary Materials

The following supporting information can be downloaded at: https://www.mdpi.com/article/10.3390/min13081092/s1, Table S1: Spectral bands of the Landsat 8 satellite; Table S2: The values used for the parameters of the LINE module; Table S3: Eigenvectors and eigenvalues for iron-oxides mapping; and Table S4: Eigenvectors and eigenvalues for hydroxyl minerals mapping. References [92,93] are cited in the Supplementary Materials.

Author Contributions

Conceptualization, A.A.E.-R., F.D. and I.A.; methodology, A.A.E.-R., F.D. and I.A.; software, A.A.E.-R., F.D., I.A. and O.A.; validation, A.A.E.-R. and F.D.; formal analysis, A.A.E.-R., F.D. and I.A.; investigation, A.A.E.-R., F.D., I.A. and L.J.; resources, A.A.E.-R. and F.D.; data curation, A.A.E.-R., F.D. and I.A.; writing—original draft preparation, A.A.E.-R., F.D. and I.A.; writing—review and editing, A.A.E.-R., I.A., L.J. and O.A.; visualization, A.A.E.-R. and I.A.; supervision, A.A.E.-R. and I.A.; project administration, K.A. and M.S.F.; funding acquisition, K.A. and M.S.F. All authors have read and agreed to the published version of the manuscript.

Funding

This research was supported by the Researchers Supporting Project, number (IFKSUOR3-192-4), Ministry of Education, Saudi Arabia.

Data Availability Statement

Data are available from the corresponding authors upon reasonable request.

Acknowledgments

The authors extend their appreciation to the Deputyship for Research and Innovation, Ministry of Education, Saudi Arabia, for funding this research through project no. (IFKSUOR3-192-4). Also, we thank the editors and reviewers for their valuable comments and suggestions.

Conflicts of Interest

The authors declare no conflict of interest.

References

  1. Darwish, M.A.; Butt, N.A. Mineral resource potential and its development in Saudi Arabia. Eng. Sci. 1996, 8, 107–120. [Google Scholar] [CrossRef]
  2. Ministry of Planning KSA. Fourth Development Plan (1985–1990); Ministry of Planning KSA: Riyadh, Saudi Arabia, 1985; pp. 167–184.
  3. Eldosouky, A.M.; El-Qassas, R.A.Y.; Pham, L.T.; Abdelrahman, K.; Alhumimidi, M.S.; El Bahrawy, A.; Mickus, K.; Sehsah, H. Mapping Main Structures and Related Mineralization of the Arabian Shield (Saudi Arabia) Using Sharp Edge Detector of Transformed Gravity Data. Minerals 2022, 12, 71. [Google Scholar] [CrossRef]
  4. Harbi, H.A.; Eldougdoug, A.A.; Al Jahdali, N.S. Evolution of the Arabian shield and associated mineralization. In Proceedings of the 9th Arab Conference of Mineral Resources, Jeddah, Saudi Arabia, 30 October–1 November 2006; pp. 1–11. [Google Scholar]
  5. Al-Shanti, A.M.S. Geology of the Arabian Shield; Center for Scientific Publishing, King Abdlaziz University: Jeddah, Saudi Arabia, 1993. [Google Scholar]
  6. Collenette, P.; Grainger, D.J. Mineral Resources of Saudi Arabia, not Including Oil, Natural Gas, and Sulfur. In Ministry of Petroleum and Mineral Resources, Directorate General of Mineral Resources; Ministry of Petroleum Saudi: Jeddah, Saudi Arabia, 1994. [Google Scholar]
  7. Nehlig, P.; Salpeteur, I.; Asfirane, F.; Bouchot, V.; Eberlé, J.M.; Genna, A. The mineral potential of the Arabian shield: A reassessment. In Proceedings of the IUGS/UNESCO Meeting on the “Base and Precious Metal Deposits in the Arabian Shield”, Jeddah, Saudi Arabia, 12–19 November 1999; pp. 12–19. [Google Scholar]
  8. Leistel, J.M.; Al Jahdali, N.; Khalil, I.; Kattu, G.; Eberle, J.M.; Lambert, A.; Siddiqui, A.; Saleh, Y. Results of Precious Metal Exploration in the Zalim Prospect, Kingdom of Saudi Arabia; Ministry of Petroleum and Mineral Resources, Deputy Ministry for Mineral Resources: Jeddah, Saudi Arabia, 1999; Technical Report; BRGM-TR-99-14; 108p.
  9. Al Jahdli, N.S. Geology of Jabal Ghadarah Area, Bi’r Tawilah District with Special Emphasis on Listvinite as a Potential Source for Gold in the Kingdom of Saudi Arabia’, M.Sc.; King Abdulaziz University: Jeddah, Saudi Arabia, 2004. [Google Scholar]
  10. Doebrich, J.L.; Zahony, S.G.; Leavitt, J.D.; Portacio, J.S., Jr.; Siddiqui, A.A.; Wooden, J.L.; Fleck, R.J.; Stein, H.J. Ad Duwayhi, Saudi Arabia: Geology and geochronology of a Neoproterozoic intrusion-related gold system in the Arabian Shield. Econ. Geol. 2004, 99, 713–741. [Google Scholar] [CrossRef]
  11. Agar, R.A.; Stacey, J.S.; Whitehouse, M.J. Evolution of Southern Afif Terrane: A Geochronologic Study; Ministry of Petroleum and Mineral Resources, Deputy Ministry for Mineral Resources: Jeddah, Saudi Arabia, 1992; Open-File-Report; DGMR-OF-10-15; 46p.
  12. Abdelkareem, M.; El-Baz, F. Characterizing hydrothermal alteration zones in Hamama area in the central Eastern Desert of Egypt by remotely sensed data. Geocarto Int. 2017, 33, 1307–1325. [Google Scholar] [CrossRef]
  13. Ahmed, A.A.; Abdelkareem, M.; Asran, A.M.; Mahran, T.M. Geomorphic and lithologic characteristics of Wadi Feiran basin, Southern Sinai, Egypt, using remote sensing and field investigations. J. Earth Syst. Sci. 2017, 126, 85. [Google Scholar] [CrossRef] [Green Version]
  14. Abdelkareem, M.; El-Din, G.M.K.; Osman, I. An integrated approach for mapping mineral resources in the Eastern Desert of Egypt. Int. J. Appl. Earth Obs. Geoinf. 2018, 73, 682–696. [Google Scholar] [CrossRef]
  15. Sultan, M.; Arvidson, R.E.; Sturchio, N.C. Mapping of serpentinites in the Eastern Desert of Egypt by using Landsat thematic mapper data. Geology 1986, 14, 995–999. [Google Scholar] [CrossRef]
  16. Abdelsalam, M.G.; Stern, R.J.; Berhane, W.G. Mapping gossans in arid regions with Landsat TM and SIR-C images: The Beddaho Alteration Zone in northern Eritrea. J. Afr. Earth Sci. 2000, 30, 903–916. [Google Scholar] [CrossRef]
  17. Madani, A.A.; Rahman, E.M.A.; WZY, K.M.F.A.; Emam, A. Mapping of the hydrothermal alteration zones at Haimur gold mine area, South Eastern Desert, Egypt, using remote sensing techniques. Egypt. J. Remote Sens. Space Sci. 2003, 6, 47–60. [Google Scholar]
  18. Ramadan, T.M.; Kontny, A. Mineralogical and structural characterization of alteration zones detected by orbital remote sensing at Shalatein District, SE Desert, Egypt. J. Afr. Earth Sci. 2004, 40, 89–99. [Google Scholar] [CrossRef]
  19. Abdelkareem, M.; El-Baz, F. Mode of formation of the Nile Gorge in northern Egypt: A study by DEM-SRTM data and GIS analysis. Geol. J. 2015, 51, 760–778. [Google Scholar] [CrossRef]
  20. El Khidir, S.O.; Babikir, I.A. Digital image processing and geospatial analysis of landsat 7 ETM+ for mineral exploration, Abidiya area, North Sudan. Int. J. Geomat. Geosci. 2013, 3, 645–658. [Google Scholar]
  21. Amuda, O.S.; Adebisi, S.A.; Jimoda, L.A.; Alade, A.O. Challenges and possible panacea to the municipal solid wastes management in Nigeria. J. Sustain. Dev. Stud 2014, 6, 64–70. [Google Scholar]
  22. Poormirzaee, R.; Oskouei, M.M. Use of spectral analysis for detection of alterations in ETM data, Yazd, Iran. Appl. Geomat. 2010, 2, 147–154. [Google Scholar] [CrossRef] [Green Version]
  23. El-Din, G.K.; Abdelkareem, M. Integration of remote sensing, geochemical and field data in the Qena-Safaga shear zone: Implications for structural evolution of the Eastern Desert, Egypt. J. Afr. Earth Sci. 2018, 141, 179–193. [Google Scholar] [CrossRef]
  24. Goetz, A.F.H.; Rock, B.N.; Rowan, L.C. Remote sensing for exploration; an overview. Econ. Geol. 1983, 78, 573–590. [Google Scholar] [CrossRef]
  25. Kafadar, O. CURVGRAV-GUI: A graphical user interface to interpret gravity data using curvature technique. Earth Sci. Inform. 2017, 10, 525–537. [Google Scholar] [CrossRef]
  26. Eldosouky, A.M.; Saada, S.A. Source edge detection (SED) of aeromagnetic data: Synthetic examples and a case study from Haimur area, south Eastern Desert, Egypt. Arab. J. Geosci. 2020, 13, 1–12. [Google Scholar] [CrossRef]
  27. Pham, L.T.; Oksum, E.; Vu, M.D.; Vo, Q.T.; Du Le-Viet, K.; Eldosouky, A.M. An improved approach for detecting ridge locations to interpret the potential field data for more accurate structural mapping: A case study from Vredefort dome area (South Africa). J. Afr. Earth Sci. 2020, 175, 104099. [Google Scholar] [CrossRef]
  28. Eldosouky, A.M.; Mohamed, H. Edge detection of aeromagnetic data as effective tools for structural imaging at Shilman area, South Eastern Desert, Egypt. Arab. J. Geosci. 2021, 14, 1–10. [Google Scholar] [CrossRef]
  29. El-Raouf, A.A.; Doğru, F.; Abdelrahman, K.; Fnais, M.S.; El Manharawy, A.; Amer, O. Using Airborne Geophysical and Geochemical Methods to Map Structures and Their Related Gold Mineralization. Minerals 2023, 13, 237. [Google Scholar] [CrossRef]
  30. Eldosouky, A.M.; Sehsah, H.; Elkhateeb, S.O.; Pour, A.B. Integrating aeromagnetic data and Landsat-8 imagery for detection of post-accretionary shear zones controlling hydrothermal alterations: The Allaqi-Heiani Suture zone, South Eastern Desert, Egypt. Adv. Space Res. 2019, 65, 1008–1024. [Google Scholar] [CrossRef]
  31. Oksum, E.; Le, D.V.; Vu, M.D.; Nguyen, T.H.T.; Pham, L.T. A novel approach based on the fast sigmoid function for interpretation of potential field data. Bull. Geophys. Ocean. 2021, 62, 543–556. [Google Scholar]
  32. Kharbish, S.; Eldosouky, A.M.; Amer, O. Integrating mineralogy, geochemistry and aeromagnetic data for detecting Fe–Ti ore deposits bearing layered mafic intrusion, Akab El-Negum, Eastern Desert, Egypt. Sci. Rep. 2022, 12, 15474. [Google Scholar] [CrossRef]
  33. Pham, L.T. A comparative study on different filters for enhancing potential field source boundaries: Synthetic examples and a case study from the Song Hong Trough (Vietnam). Arab. J. Geosci. 2020, 13, 723. [Google Scholar] [CrossRef]
  34. Pham, L.T. A high resolution edge detector for interpreting potential field data: A case study from the Witwatersrand basin, South Africa. J. Afr. Earth Sci. 2021, 178, 104190. [Google Scholar] [CrossRef]
  35. Hang, N.T.T.; Thanh, D.D.; Minh, L.H. Application of directional derivative method to determine boundary of magnetic sources by total magnetic anomalies. J. Sci. Earth 2017, 39, 362–375. [Google Scholar] [CrossRef] [Green Version]
  36. Pham, L.T.; Oksum, E.; Kafadar, O.; Trinh, P.T.; Nguyen, D.V.; Vo, Q.T.; Le, S.T.; Do, T.D. Determination of subsurface lineaments in the Hoang Sa islands using enhanced methods of gravity total horizontal gradient. Vietnam J. Earth Sci. 2022, 43, 395–409. [Google Scholar]
  37. Eldosouky, A.M.; Pham, L.T.; Abdelrahman, K.; Fnais, M.S.; Gomez-Ortiz, D. Mapping structural features of the Wadi Umm Dulfah area using aeromagnetic data. J. King Saud Univ.-Sci. 2021, 34, 101803. [Google Scholar] [CrossRef]
  38. Eldosouky, A.M.; Pham, L.T.; Mohmed, H.; Pradhan, B. A comparative study of THG, AS, TA, Theta, TDX and LTHG techniques for improving source boundaries detection of magnetic data using synthetic models: A case study from G. Um Monqul, North Eastern Desert, Egypt. J. Afr. Earth Sci. 2020, 170, 103940. [Google Scholar] [CrossRef]
  39. Miller, H.G.; Singh, V. Potential field tilt—A new concept for location of potential field sources. J. Appl. Geophys. 1994, 32, 213–217. [Google Scholar] [CrossRef]
  40. Wijns, C.; Perez, C.; Kowalczyk, P. Theta map: Edge detection in magnetic data. Geophysics 2005, 70, L39–L43. [Google Scholar] [CrossRef]
  41. Nehlig, P.; Genna, A.; Asfirane, F.; Guerrot, C.; Eberlé, J.; Kluyver, H.; Lasserre, J.; Le Goff, E.; Nicol, N.; Salpeteur, N.; et al. A review of the Pan-African evolution of the Arabian Shield. Geoarabia 2002, 7, 103–124. [Google Scholar] [CrossRef]
  42. Johnson, P.R.; Woldehaimanot, B. Development of the Arabian-Nubian Shield: Perspectives on accretion and deformation in the northern East African Orogen and the assembly of Gondwana. Geol. Soc. Lond. Spéc. Publ. 2003, 206, 289–325. [Google Scholar] [CrossRef]
  43. Stern, R.J.; Johnson, P. Continental lithosphere of the Arabian Plate: A geologic, petrologic, and geophysical synthesis. Earth-Sci. Rev. 2010, 101, 29–67. [Google Scholar] [CrossRef]
  44. Johnson, P.R. Tectonic development of the Arabian Shield: An overview. In US Geological Survey Saudi Arabia Mission, IUGS/UNESCO Deposit Modelling Workshop; Ministry of Petroleum and Mineral Resources, Deputy Ministry for Mineral Resources: Jeddah, Saudi Arabia, 1999. [Google Scholar]
  45. Johnson, P.R. Post-amalgamation basins of the NE Arabian shield and implications for Neoproterozoic III tectonism in the northern East African orogen. Precambrian Res. 2003, 123, 321–337. [Google Scholar] [CrossRef]
  46. Stacey, J.S.; Agar, R.A. U-Pb isotopic evidence for the accretion of a continental microplate in the Zalm region of the Saudi Arabian Shield. J. Geol. Soc. 1985, 142, 1189–1203. [Google Scholar] [CrossRef]
  47. Agar, R.A. Geologic map of the Zalm quadrangle, sheet 22F, Kingdom of Saudi Arabia. Saudi Arab. Deputy Minist. Miner. Resour. Geol. Map GM 1989, 89, 41. [Google Scholar]
  48. Sabir, H.; Labbé, J.F. Bi’r Tawilah tungsten prospect, Najd region, Kingdom of Saudi Arabia. J. Afr. Earth Sci. (1983) 1986, 4, 249–255. [Google Scholar] [CrossRef]
  49. Surour, A.A.; Harbi, H.M.; Ahmed, A.H. The Bi’r Tawilah deposit, central western Saudi Arabia: Supergene enrichment of a Pan-African epithermal gold mineralization. J. Afr. Earth Sci. 2014, 89, 149–163. [Google Scholar] [CrossRef]
  50. Zeinelabdein, K.A.E.; Elemam, M.S.; Ali, H.A.; Alhassan, O.M. An integrated analysis of Landsat OLI image and satellite gravity data for geological mapping in North Kordofan State, Sudan. Am. J. Earth Sci. 2014, 1, 25–32. [Google Scholar]
  51. Javhar, A.; Chen, X.; Jovid, A.; Yunus, M.; Jamshed, A.; Eldiiar, D.; Zulfiyor, B. Evaluation of remote sensing techniques for lithological mapping in the southeastern Pamir using Landsat 8 OLI data. Int. J. Geoinformatics 2018, 14, 1–10. [Google Scholar]
  52. Green, A.; Berman, M.; Switzer, P. Craig A transformation for ordering multispectral data in terms of image quality with implications for noise removal. IEEE Trans. Geosci. Remote. Sens. 1988, 26, 65–74. [Google Scholar] [CrossRef] [Green Version]
  53. Vermillion, S.C.; Sader, S.A. Use of the minimum noise fraction (MNF) transform to analyze airborne visible/infrared imaging spectrometer (AVIRIS) data of northern forest types. AVIRIS Workshop 1999, 7. [Google Scholar]
  54. Boardman, J.W.; Kruse, F.A. Automated spectral analysis: A geologic example using AVIRIS data, north Grapevine Mountais. San Antonio. In Proceedings of the Tenth Thematic Conference, Geologic Remote Sensing, San Antonio, TX, USA, 9–12 May 1994; pp. I-407–I-418. [Google Scholar]
  55. Amer, R.; Kusky, T.; Ghulam, A. Lithological mapping in the Central Eastern Desert of Egypt using ASTER data. J. Afr. Earth Sci. 2010, 56, 75–82. [Google Scholar] [CrossRef]
  56. Ali, A.S.; Pour, A.B. Lithological mapping and hydrothermal alteration using Landsat 8 data: A case study in ariab mining district, red sea hills, Sudan. Int. J. Basic Appl. Sci. 2014, 3, 199. [Google Scholar] [CrossRef]
  57. Mhamdi, H.S.; Raji, M.; Maimouni, S.; Oukassou, M. Fractures network mapping using remote sensing in the Paleozoic massif of Tichka (Western High Atlas, Morocco). Arab. J. Geosci. 2017, 10, 125. [Google Scholar] [CrossRef]
  58. Goetz, A.F.H.; Rowan, L.C.; Kingston, M.J. Mineral Identification from Orbit: Initial Results from the Shuttle Multispectral Infrared Radiometer. Science 1982, 218, 1020–1024. [Google Scholar] [CrossRef]
  59. Mars, J.C.; Rowan, L.C. Regional mapping of phyllic-and argillic-altered rocks in the Zagros magmatic arc, Iran, using Advanced Spaceborne Thermal Emission and Reflection Radiometer (ASTER) data and logical operator algorithms. Geosphere 2006, 2, 161–186. [Google Scholar] [CrossRef]
  60. Pour, A.B.; Hashim, M. Hydrothermal alteration mapping from Landsat-8 data, Sar Cheshmeh copper mining district, south-eastern Islamic Republic of Iran. J. Taibah Univ. Sci. 2015, 9, 155–166. [Google Scholar] [CrossRef] [Green Version]
  61. Loughlin, W.P. Principal component analysis for alteration mapping. Photogramm. Eng. Remote Sens. 1991, 57, 1163–1169. [Google Scholar]
  62. Kokaly, R.F.; Clark, R.N.; Swayze Gregg, A.; Livo KEric Hoefen Todd, M.; Pearson Neil, C.; Wise Richard, A.; Benzel William Lowers Heather, A.; Driscoll Rhonda, L.; Klein Anna, J. USGS Digital Spectral Library; US Geological Survey: Reston, VA, USA, 2017. [CrossRef]
  63. Rabus, B.; Eineder, M.; Roth, A.; Bamler, R. The shuttle radar topography mission—A new class of digital elevation models acquired by spaceborne radar. ISPRS J. Photogramm. Remote. Sens. 2003, 57, 241–262. [Google Scholar] [CrossRef]
  64. Smith, M.J.; Clark, C.D. Methods for the visualization of digital elevation models for landform mapping. Earth Surf. Process. Landf. 2005, 30, 885–900. [Google Scholar] [CrossRef]
  65. Ganas, A.; Athanassiou, E. A comparative study on the production of satellite orthoimagery for geological remote sensing. Geocarto International 2000, 15, 53–62. [Google Scholar] [CrossRef]
  66. Environmental Systems Resource Institute. ArcGIS Desktop Sofware, Release 10; Environmental Systems Resource Institute: Redlands, CA, USA, 2012. [Google Scholar]
  67. Adiri, Z.; El Harti, A.; Jellouli, A.; Lhissou, R.; Maacha, L.; Azmi, M.; Zouhair, M.; Bachaoui, E.M. Comparison of Landsat-8, ASTER and Sentinel 1 satellite remote sensing data in automatic lineaments extraction: A case study of Sidi Flah-Bouskour inlier, Moroccan Anti Atlas. Adv. Space Res. 2017, 60, 2355–2367. [Google Scholar] [CrossRef]
  68. Thannoun, R.G. Automatic extraction and geospatial analysis of lineaments and their tectonic significance in some areas of Northern Iraq using remote sensing techniques and GIS. Int. J. Enhanc. Res. Sci. Technol. Eng. Bull. 2013, 2, 1–11. [Google Scholar]
  69. Liang, W.; Li, J.; Xu, X.; Zhang, S.; Zhao, Y. A high-resolution Earth’s gravity field model SGG-UGM-2 from GOCE, GRACE, satellite altimetry, and EGM2008. Engineering 2020, 6, 860–878. [Google Scholar] [CrossRef]
  70. Roest, W.R.; Verhoef, J.; Pilkington, M. Magnetic interpretation using the 3-D analytic signal. Geophysics 1992, 57, 116–125. [Google Scholar] [CrossRef]
  71. Prasad, K.N.D.; Pham, L.T.; Singh, A.P. Structural mapping of potential field sources using BHG filter. Geocarto Int. 2022, 37, 11253–11280. [Google Scholar] [CrossRef]
  72. Cordell, L. Gravimetric expression of graben faulting in Santa Fe country and the Espanola basin. In Guidebook to Santa Fe Country, 30th Field Conference; New Mexico Geological Survey: Leroy Place Socorro, NM, USA, 1979; pp. 59–64. [Google Scholar]
  73. Ferreira, J.; de Souza, J.; de Bongiolo, A.; de Castro, L.G. Enhancement of the total horizontal gradient of magnetic anomalies using the tilt angle. Geophysics 2013, 78, J33–J41. [Google Scholar] [CrossRef]
  74. Ibraheem, I.M.; Haggag, M.; Tezkan, B. Edge Detectors as Structural Imaging Tools Using Aeromagnetic Data: A Case Study of Sohag Area, Egypt. Geosciences 2019, 9, 211. [Google Scholar] [CrossRef] [Green Version]
  75. Cooper, G.; Cowan, D. Enhancing potential field data using filters based on the local phase. Comput. Geosci. 2006, 32, 1585–1591. [Google Scholar] [CrossRef]
  76. Al-Badani, M.A.; Al-Wathaf, Y.M. Using the aeromagnetic data for mapping the basement depth and contact locations, at southern part of Tihamah region, western Yemen. Egypt. J. Pet. 2018, 27, 485–495. [Google Scholar] [CrossRef]
  77. Verduzco, B.; Fairhead, J.D.; Green, C.M.; MacKenzie, C. New insights into magnetic derivatives for structural mapping. Geophysics 2004, 23, 116–119. [Google Scholar] [CrossRef]
  78. Pham, L.T.; Eldosouky, A.M.; Abdelrahman, K.; Fnais, M.S.; Gomez-Ortiz, D.; Khedr, F. Application of the improved parabola-based method in delineating lineaments of subsurface structures: A case study. J. King Saud Univ.-Sci. 2021, 33, 101585. [Google Scholar] [CrossRef]
  79. Cooper, G.R. Reducing the dependence of the analytic signal amplitude of aeromagnetic data on the source vector directionSignal amplitude of aeromagnetic data. Geophysics 2014, 79, J55–J60. [Google Scholar] [CrossRef]
  80. Sabins, F.F. Remote sensing for mineral exploration. Ore Geol. Rev. 1999, 14, 157–183. [Google Scholar] [CrossRef]
  81. Ramadan, T.M.; Sultan, S.A. Integration of geological, remote sensing and geophysical data for the identification of massive sulphide zones at Wadi Allaqi area, South Eastern Desert, Egypt. In Proceedings of the IGARSS 2003. 2003 IEEE International Geoscience and Remote Sensing Symposium. Proceedings (IEEE Cat. No. 03CH37477), Toulouse, France, 21–25 July 2003; pp. 2589–2592. [Google Scholar]
  82. Gabr, S.S.; Diab, H.; Fattah, T.A.A.; Sadek, M.F.; Khalil, K.I.; Youssef, M.A. Aeromagnetic and Landsat-8 data interpretation for structural and hydrothermal alteration mapping along the Central and Southern Eastern Desert boundary, Egypt. Egypt. J. Remote Sens. Space Sci. 2021, 25, 11–20. [Google Scholar] [CrossRef]
  83. Crosta, A.P. Enhancement of Landsat Thematic Mapper imagery for residual soil mapping in SW Minas Gerais State Brazil, a prospecting case history in greenstone belt terrain. In Proceedings of the 7th ERIM Thematic Conference on Remote Sensing for Exploration Geology, Calgary, AL, Canada, 2–6 October 1989. [Google Scholar]
  84. Osinowo, O.O.; Gomy, A.; Isseini, M. Mapping hydrothermal alteration mineral deposits from Landsat 8 satellite data in Pala, Mayo Kebbi Region, Southwestern Chad. Sci. Afr. 2021, 11, e00687. [Google Scholar] [CrossRef]
  85. Pour, A.B.; Hashim, M.; Hong, J.K.; Park, Y. Lithological and alteration mineral mapping in poorly exposed lithologies using Landsat-8 and ASTER satellite data: North-eastern Graham Land, Antarctic Peninsula. Ore Geol. Rev. 2019, 108, 112–133. [Google Scholar] [CrossRef]
  86. Hubbard, B.M.; Thompson, T.J. Lineament Analysis of Mineral Areas of Interest in Afghanistan: Automatically Delineated Lineaments using 30-m TM Imagery; US Geological Survey: Reston, VA, USA, 2012; Open-File Report; 28p.
  87. Melouah, O.; Eldosouky, A.M.; Ebong, E.D. Crustal architecture, heat transfer modes and geothermal energy potentials of the Algerian Triassic provinces. Geothermics 2021, 96, 102211. [Google Scholar] [CrossRef]
  88. Pham, L.T.; Oksum, E.; Le, D.V.; Ferreira, F.J.; Le, S.T. Edge detection of potential field sources using the softsign function. Geocarto Int. 2022, 37, 4255–4268. [Google Scholar] [CrossRef]
  89. Rigol-Sanchez, J.P.; Chica-Olmo, M.; Abarca-Hernandez, F. Artificial neural networks as a tool for mineral potential mapping with GIS. Int. J. Remote Sens. 2003, 24, 1151–1156. [Google Scholar] [CrossRef]
  90. Woldai, T.; Pistocchi, A.; Master, S. Validation and sensitivity analysis of a mineral potential model using favourability functions. Monash University Epress 2006, 2, 1. [Google Scholar] [CrossRef] [Green Version]
  91. Alexander, I.; Samuel, O.O.; Esther, C.M. Integrating Landsat-ETM and Aeromagnetic data for enhanced structural interpretation over Naragwata area, North-Central Nigeria. Int. J. Sci. Eng. Res. 2015, 6, 2229–5518. [Google Scholar]
  92. Irons, J.R.; Dwyer, J.L.; Barsi, J.A. The next Landsat satellite: The Landsat data continuity mission. Remote Sens. Environ. 2012, 122, 11–21. [Google Scholar] [CrossRef] [Green Version]
  93. Roy, D.P.; Wulder, M.A.; Loveland, T.R.; Woodcock, C.E.; Allen, R.G.; Anderson, M.C.; Helder, D.; Irons, J.R.; Johnson, D.M.; Kennedy, R.; et al. Landsat-8: Science and product vision for terrestrial global change research. Remote Sens. Environ. 2014, 145, 154–172. [Google Scholar] [CrossRef] [Green Version]
Figure 2. A geological map of the study area (modified from [47,49]).
Minerals 13 01092 g002
Figure 3. Workflow of the methods applied in the present study. Abbreviations are used in the table as follows: analytical signal (AS); total horizontal derivative (THD); tilt angle (TA); horizontal tilt angle (TDX); theta map (TM); horizontal derivative of tilt derivative (HD_TDR); horizontal gradient of tilt angle (HGTA); tilt angle of analytical signal (TAAS); and soft sign function (SF).
Minerals 13 01092 g003
Figure 4. (a) Sabin band ratios in an RGB image. (b) Band ratios 6/7, 5/6, and 5 in an RGB image. (c) Crosta analysis (H, H + F, F) in a grayscale image. (d) RGB image. (e) Band ratio 6/7 for hydroxyl-bearing minerals in a grayscale image. (f) RGB image of band ratio 6/7 classes. (g) Hydrothermal alteration zone classes in the study area.
Minerals 13 01092 g004
Figure 5. (a) The elevation map of the STRM DEM. (b) Shaded relief thematic map. (c) Elevations in the STRM DEM extracted lineament map. (d) Lineament density map.
Minerals 13 01092 g005
Figure 6. Bouguer gravity map of the study area.
Minerals 13 01092 g006
Figure 7. Boundary analysis results of the study area: (a) AS, (b) THG, (c) TA, (d) TDX, and (e) TM.
Minerals 13 01092 g007
Figure 8. The results of recent boundary analysis methods: (a) HD_TDR, (b) HGTA, (c) TAAS, and (d) SF. (e) Extracted lineaments from the SBG data after applying advanced edge detection approaches.
Minerals 13 01092 g008
Figure 9. (a) An integrated lineament from the RS (black) and SBG (red) data. (b) Lineament density map from the RS and SBG data.
Minerals 13 01092 g009
Figure 10. The map shows the hydrothermal alteration zone classes for the study area and is superimposed by the integrated lineaments from the geological map (black) and RS (gray) and SBG (red) data. The rose diagrams display the major and minor trends of the derived lineaments from the geological map and RS and SBG data analysis.
Minerals 13 01092 g010
Disclaimer/Publisher’s Note: The statements, opinions and data contained in all publications are solely those of the individual author(s) and contributor(s) and not of MDPI and/or the editor(s). MDPI and/or the editor(s) disclaim responsibility for any injury to people or property resulting from any ideas, methods, instructions or products referred to in the content.

