Abstract
Geochemical overprinting on placer gold deposits produces complex deposits with apparently paradoxical geochemical and morphological attributes. The La Cholla placer gold deposits near Quartzsite, Arizona, USA, contain sharp and often undamaged gold crystals within high-energy gravels as a result of postdepositional recrystallization by localized hot springs. Geothermal fluids emanated from a basin-bounding fault and left a distinct signature that includes recrystallized gold with low Pb and δ65Cu > 1.14‰, secondary uraninite and carnotite, travertine deposits, and mounds of highly silicified placer gravels. Surrounding these deposits are placer gravels with angular gold morphology and geochemistry indicative of flash-flood pulse placers with a lode gold source < 5 km and gold particles with low Pb and δ65Cu < 0.77‰. The multitude of small local lode gold source veins is likely related to specialized fluid migration along mid-Tertiary detachment faults. The unroofing of these veins at 5 to 17 Ma by high-angle Basin and Range faulting led to extensive placer development, with subsequent localized modification by geothermal fluid migration along the same faults. This study documents geochemical overprinting and modification of placer deposits and bears upon the study of other placers containing crystalline gold and uranium mineralization. Similar deposits may document past geothermal activity and identify structural fluid conduits and steep paleo-topographic gradients.
1. Introduction
The investigation of lode and placer gold deposit genesis bears directly on the exploration and extraction of this economically prized and industrially important metal. Natural “native gold” alloys of Au + Ag ± Cu (hereafter referred to as native primary gold) within lode ore deposits is well understood, and is generally interpreted as having a shallow hydrothermal origin ([1,2] and references therein). Placer gold is native gold within secondary sedimentary deposits, and its occurrence has been credited to primary, secondary, and a combination of primary and secondary formations [3]. In the simplest and most historically accepted theory of placer formation, a gold mass forms as a lode deposit during a hydrothermal event and survives physical and chemical weathering as native gold particles due to the low chemical reactivity and malleability of gold [1,4]. However, a secondary, accretionary origin for some placer gold has been suggested by observations of bacterioform gold, high-purity gold overgrowths, and nanoparticulate gold in biomats [3,5,6,7,8,9]. Other authors have rejected low-temperature or biogeochemical nugget growth and suggested an abiological, high-temperature (100 s of °C) origin within lode deposits [10]. The recent consensus of many workers is that the processes of both primary and secondary models likely play a role in placer gold formation, with the specific contribution of each end member varying from location to location [3,11,12,13].
Studies of placer gold deposits have used morphology [14,15,16], trace element chemistry [14,17], biogeochemistry [3,7], and stable isotopes to understand deposit genesis. For example, placer gold alloy typically contains lead [18,19] in quantities sufficient to permit measurement of the lead isotope signal to provide insights into potential source(s) and process(es) that contributed to placer formation [14,20,21].
In particular, gold nuggets found in placers at Rich Hill, Arizona, contain thousands of ppm Pb and virtually no U [20]. Distinct Pb isotope values between vein and placer gold at Rich Hill indicated that the placer nuggets formed within the placer environment [20]. Therefore, comparison of isotope signatures between different types of native gold can provide important information about the origin of gold in the placer deposits.
In this study we take advantage of a recent resurgence in small-scale placer gold mining in the La Cholla District to obtain unique and historically rare access to these mining claims and samples. We utilize the mode of occurrence, morphology, elemental compositions, and Cu isotopes in the different types of native gold occurring in these placers to decipher the origin and evolution of native gold.
2. History and Geological Setting
The La Cholla District is located 10 km (6.2 miles) southwest of the town of Quartzsite in the Basin and Range Province of western Arizona, USA (Figure 1). Official placer gold production for all three adjoining districts of the greater Quartzsite area, from 1862 to present, is estimated at over 4665 kg (150,000 troy ounces) ([21] and references therein). Production for the La Cholla placers was poorly recorded but estimated at less than 746 kg (24,000 troy ounces) [22]. However, the real total production is likely much higher, as considerable amounts of gold went unreported in this remote district with a significant population of foreign miners [22,23,24]. The La Cholla District, and especially the Gold Eye Mine area within it, is noted for a localized abundance of very-well-crystalized gold within the placer deposits (Figure 2). Modern placer operations in the past two decades by Larry Schreiner (Beehive Mining), Steve Hunt (Gold Eye Mine), Terry Barnes (Melfern Mine), and metal detecting by countless others have yielded over 10 kg (over 300 troy ounces) of gold, including hundreds of individual euhedral gold crystals < 1 g, with one massive cluster of physically damaged crystals recovered in 2019 weighing 280 g (9 troy ounces) (Figure 2 and Figure 3).
The placer deposits at La Cholla were known to Europeans by at least the early 1800s, well before the “official” discovery in 1862. Many sources refer to “old Spanish diggings” that were encountered by the prospectors in the 1860s (e.g., [25,26]). Later work suggests that these placer diggings in La Cholla, and shallow prospect shafts in the nearby Plomosa District, were excavated by French fur trappers who were overwintering in the warmer climate of Arizona. A summary of the evidence provided in [25] includes stories by native peoples of revenge killings between themselves and Europeans in the 1830s to 1840s and artifacts from France such as coins, a sword, and a mirror (the latter two with French hallmarks). Some of these artifacts have been preserved in the collections of the Yuma and Quartzsite Historical Societies. In the 2000s, the location and extent of these older workings in the La Cholla District were mapped in a mining history project [26] that utilized a combination of historical and contextual evidence. Placer gold from the greater Quartzsite region is poorly studied and understood, with few published studies [26,27].
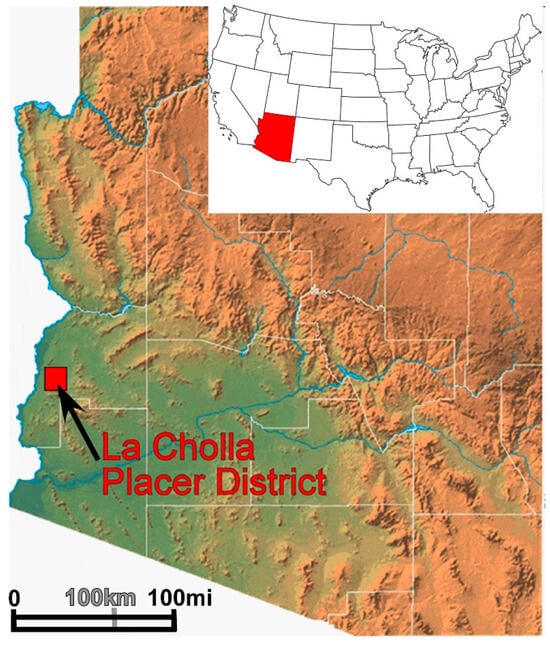
Figure 1.
Index map of the location of the La Cholla District (red square), with inset map of the United States showing the location of Arizona in red (modified from [26]).
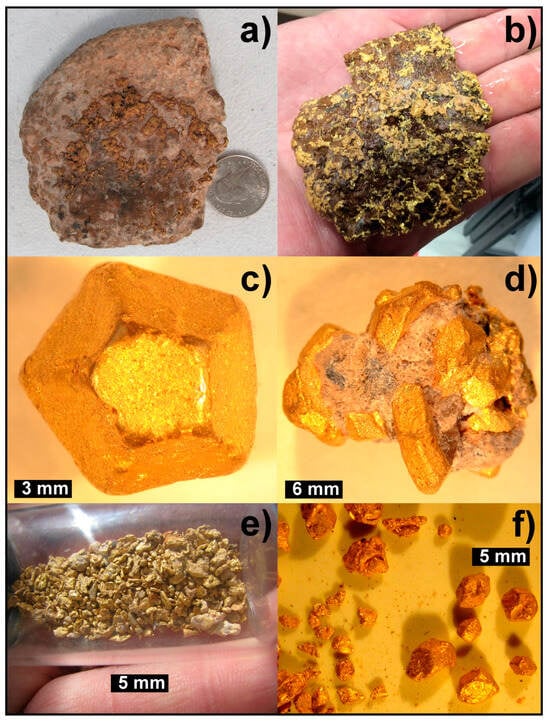
Figure 2.
Examples of placer gold from the La Cholla placers: (a) A mass of caliche containing a 280 g (9 troy ounce) cluster of gold crystals. Coin is 24.26 mm. (b) The same cluster after removal of caliche with weak acid, highlighting damaged outer crystals and sharp internal crystal masses. Hand for scale. (c) Example of a 9 mm single crystal of gold from the placer deposit. (d) An 18 mm long cluster of crystals from the placer deposit showing tan caliche and silicified matrix. (e) A vial with raw dry-wash gold from the La Cholla placers, showing angular gold. Vial is 15 mm diameter. (f) Side-by-side comparison of angular gold (left) and damaged crystal gold (right) from the same day of operations at site 2019. All photos by author (EM).
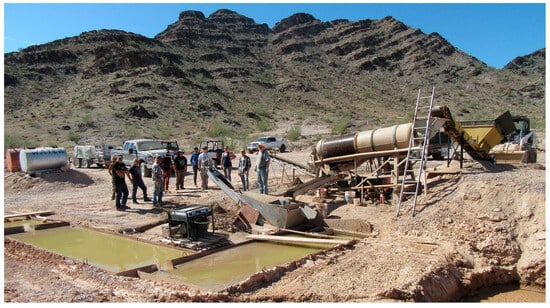
Figure 3.
Example of a portable wet recovery plant at Beehive Mining’s operations in 2020. This plant is typically moved annually to new sites to access new deposits. A small loader at right loads paydirt into the yellow hopper to feed a conveyer to the cylindrical trommel (center-right). Gold is recovered from washed sediment in a sluice (center). Settling pans for water recycling are on the left.
The geological and geochemical setting of the La Cholla Placers was documented with field mapping of placer lithology/mineralogy, unit thickness, and depositional indicators. Locations of placer gold sampling are presented in Figure 4, while corresponding data are in Table 1. While much of the placer unit is weakly to moderately cemented by caliche (soil carbonate) and has angular gold particles, localized zones occur with abundant gold crystals and heavily silicified sediments with little to no caliche (Figure 5). For the purposes of this study, we refer to these cemented and altered gold-bearing sediments as “placers” to denote both their origin and method of mining. Within these silicified zones, striking bright yellow carnotite [K2(UO2)2(VO4)2•3H2O] occurs as sparse coatings both on clasts and along postsilicification fractures (Figure 6). From the unconsolidated and caliche-cemented placers, two small particles of uraninite [UO2] were identified in “black sand” placer concentrates. Lead also occurs abundantly within the unconsolidated and caliche-cemented placer unit, with nodules of argentiferous galena encrusted by cerussite (1 mm to 10 cm) being abundant enough to have been mined historically as their own resource [25]. These galena/cerussite nodules should not be confused with anthropogenic lead bullet fragments that are often found in heavy mineral separates from many modern placer operations.
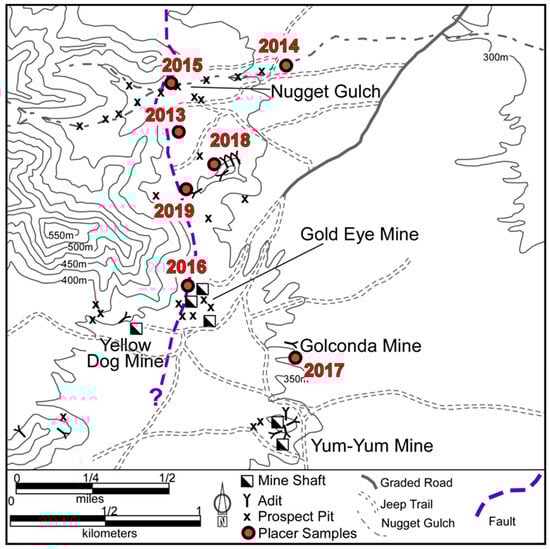
Figure 4.
Map of La Cholla placers showing location of placer samples from this study (red dots) and major mines and landmarks. Dashed purple line is the approximate trace of the major range-bounding fault.

Table 1.
Morphological measurements and calculations, plus major and minor element concentrations for placer gold particles examined in this study. * denotes samples which were also analyzed by ICP-MS, with associated data presented in Table 2. † Flatness index (FI) was calculated using the formula FI = length + width/2 X thickness or (X + Y)/2Z) in the nomenclature below. ‡ Distance was calculated using the flatness index, as described in Section 3. “Inclusion” classification is for gold with >30% mineral inclusions by visual estimation.
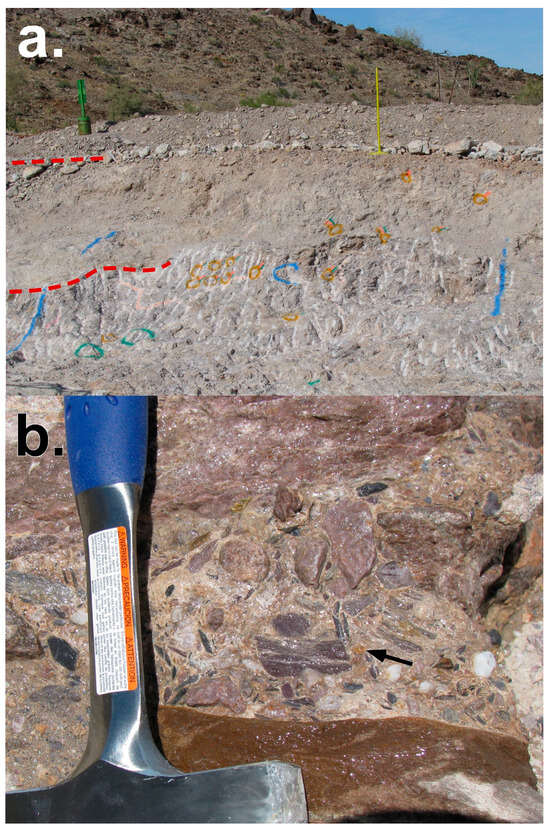
Figure 5.
Photos of La Cholla placers at the Gold Eye Mine (site 2016). (a) Section of an active mining face in placer gravels. Green post on left is 1 m (field of view is ~8 m, L to R). From the top, separated by red dashed lines on left: modern slope-wash gravels, older caliche-cemented gravels, and at bottom of section, silica-cemented gravels. Orange spray-painted circles on outcrop mark metal detector “hits” where gold crystals or nuggets were later recovered. White vertical lines in silica-cemented unit are from a backhoe-mounted jackhammer. (b) Detail of silica-cemented gravels, wetted with water to highlight detail. A 6 mm gold crystal is exposed at the black arrow. Rock hammer for scale.
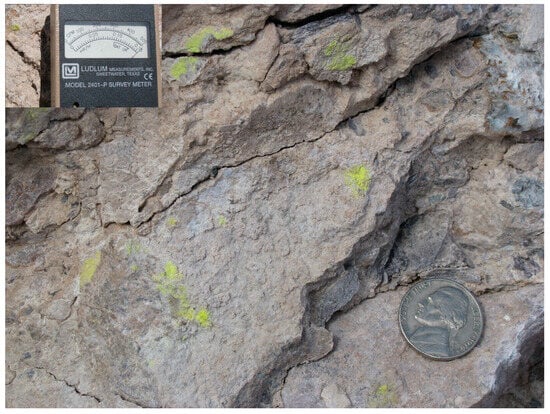
Figure 6.
Silica- and caliche-impregnated sand and gravel placer unit at La Cholla. The caliche coating conceals unit texture in most places. Yellow coatings are the uranium mineral carnotite. Coin is 21.21 mm diameter. Inset photo is a α–β–γ radiation survey meter on the same outcrop showing a reading exceeding 0.15 mR/h (500 counts per minute).
Known lode gold sources for placers at La Cholla include dozens of small veins of quartz + siderite + gold ± pyrite ± chalcopyrite ± iron oxides or quartz + tourmaline ± gold. The specific location of individual veins is not mapped or recorded here, at the request of mining claim owners. These veins are generally less than 1 m wide and persist for 10s of m along strike, and they have been opened by dozens of shallow prospect shafts and adits. The largest lode mines were the Yum Yum and Beehive, with a combined production of 8.5 kg (275 troy ounces) of gold [23,24,26,28]. These lode gold deposits occur within the Jurassic McCoy Mountains Formation [29]. In the study area, this complex sequence of south-dipping metasedimentary rocks includes a tan metaconglomerate-to-quartzite overlain by a distinctive purple-to-green phyllitic schist. Felsic volcanic rocks of Jurassic age occur within the north end of the district [30] but host fewer of the lode gold veins.
3. Materials and Methods
This study examines placer gold recovered during modern placer mining operations and was facilitated by the willingness of several mine owners to permit scientific study of their gold. Samples were obtained from each of the seven study area localities employing the methodology described below. It was not practical to obtain additional samples for this study due to the elevated price of gold, difficulty in maintaining access to claims, and time required for obtaining sterile samples and new samples from within cemented deposits using only hand tools.
Samples of gold were recovered from placer deposits by utilizing a combination of methods. Samples of 0.25 to 1 g were recovered for geochemical and shape analyses using the portable wet recovery plants operated by individual mine owners. In these operations, a “Bobcat” loader feeds placer gravels into a wet spray trommel to separate oversize gravels. The oversize gravels are later examined with a metal detector for the collection of the rare oversize gold. The trommel fines are processed in a recirculating sluice with riffles and gold matting, with cleanup by hand panning of concentrates. These plants can process 2 to 10 cubic yards of material per day, with capacity limited by water quality and water availability. Three cascading rectangular 2 × 3 m metal settling basins recycle the plant water, and operations end each day when water becomes too muddy and inhibits gold recovery (Figure 3).
Additional samples were recovered using a Keene Engineering vibrostatic dry washer (Chatsworth, CA, USA). Similarly, larger gold (>0.50 g) was recovered with a MINELAB GP-Extreme metal detector under dry conditions. In zones of placer sediment that were heavily silicified and cemented, metal detector “hits” were marked and samples removed later by hand with a hammer and chisel. All samples were recovered by, or in the presence of, one of the authors. Samples were not cleaned prior to analysis.
Secondary gold structures and morphologies of placer gold samples were measured and imaged using established methods [31]. Morphological measurements and observations were performed on individual gold particles using microtweezers and a binocular microscope with digital camera. Samples for additional shape and surface chemical analyses were mounted with double-sided carbon tape on their flattest side to expose the maximum surface area. A LEO Zeiss 1540XB Field Emission Gun-Scanning Electron Microscope (SEM) (Carl Zeiss AG, Jena, Germany) was used to generate secondary electron (SE) and backscatter electron (BSE) images using an acceleration voltage of 2 or 15 kV, respectively. Concavities on gold particle surfaces were targeted, as these regions were most likely to contain and preserve exterior-projecting mineral inclusions and fragile bacterioform gold structures.
Additional SEM imaging of the exterior and interior surfaces of representative gold particles was performed with a Fisher-Phenom ProX SEM employing the same settings detailed above. A Cameca SX-100 at the University of Arizona was used for Electron Probe Micro-Analyzer (EPMA) probe measurements of gold (major) and silver–copper (minor) element abundances, using standard off-peak interference and matrix corrections [32,33]. Following shape analysis and grain exterior observations, samples were mounted on a postmount with double-sided carbon tape and lightly polished to expose grain interiors for major and minor element analysis. Some of these samples were later removed for ICP-MS and copper isotope analyses. Some samples were embedded in low-volatile epoxy and deeply polished to explore potential rim chemistry variations, using sequential grits down to a 0.3 micron diamond abrasive. Great care was taken to minimize sample preparation artifacts such as deposition of polishing debris into fractures or pores, localized smearing which can obscure internal chemistry or physical features, and cross-contamination [34,35]. The error associated with the in situ EPMA element microprobe analyses is less than ±0.1 wt%.
For trace element analyses, native gold nuggets were dissolved in precleaned Teflon beakers with 4 mL ultrapure Aqua Regia on a hot plate for 24 h. A small fraction of the resultant Aqua Regia solution was further diluted with 5% HNO3 to achieve final dilution of around 2000×. Precise final dilution factor was determined by weight for each sample. Trace element analyses were performed on an Element2 HR-ICP-MS (Thermo Finnigan, San Jose, CA, USA) at medium resolution. Quantification of the results was achieved via external calibration using a set of gravimetrically prepared dilutions of commercial ICP-MS standards (SPEX CertiPrep, Inc., Metuchen, NJ, USA).
Native gold samples were processed similar to the techniques in [36], where two ion-exchange chromatography was used to purify the copper from the gold-rich matrix. The gold was dissolved in Teflon beakers with 4 mL of ultrapure Aqua Regia at 140 °C for 24 h. These solutions were dried, and concentrations of copper were measured from these solutions on an ICP-OES at Pennsylvania State University to determine the amount of solution to dry for purification by ion exchange chromatography. Approximately 10 micrograms of copper was used for ion exchange chromatography, as defined in [37].
Copper isotope ratios were measured on the Neptune (Thermo brand, Schaumburg, IL, USA) at Pennsylvania State University. The instrument was in low resolution mode and the solution concentrations were at 100 ppb. This generated a 5 V signal on 63Cu. Mass bias was corrected for using standard–sample–standard bracketing with the NIST 976 international isotope standard. One block of 30 ratios was measured for each sample, and this procedure was repeated so that the reported values are an average of 60 ratios. The reported values are in the traditional per mil format compared to the NIST 976. Errors for the analyses are 0.08‰ (2Θ) and are calculated by the overall variations of the NIST standard for the duration of the measurement session (described in [37]). Replicate values all fall within this reported range. An internal standard (USD 1 cent coin from 1838) had δ65Cu = +0.05‰ (±0.07, 2σ, n = 3) within the error of the value reported in [37].
Morphological analyses were performed on physical measurements using the methods and reporting nomenclature outlined in detail in [38,39,40,41,42,43]. Flatness index (FI) was calculated using the formula FI = length + width/2 X thickness or (X + Y)/2Z) [42].
4. Results
The thickness of the placer gravels is just 0.5 m (1.6 ft) in the west against the southern Dome Rock Mountains bedrock but over 30 m (100 ft) thick as measured in mine shafts to the east. Throughout most of these thicker sections, gold is irregularly distributed and fine-grained, averaging 0.2 g/m3 where sampled. In the thicker sections of placer, a richer zone averaging 1 g/m3 was encountered at about mid-depth within a bed of coarser sediment, while the richest zone is just above bedrock with grades above 1 g/m3 and containing the coarsest gold. The placer gravels contain zones of strong silicification and calcite cementing where they extend over a major high-angle range-bounding fault (Figure 4). Remnants of small pods of travertine are also found in the gravels over this fault, though much more has been mined historically for production of lime to whitewash the early adobe buildings of the region.
The four main methods used to examine the placer gold from the La Cholla placers are morphological measurements using a binocular microscope or SEM; major and minor element characterization of gold grain outer surfaces and interiors using EPMA; trace element characterization of gold particles using ICP-MS; and copper isotope measurements. Biological observations, amplifications, and culturing with subsequent biomolecular sequencing of the isolate were performed on samples collected under sterile conditions. However, this work is beyond the scope of the present study and requires additional analyses.
Results of morphological analyses are presented in Figure 7 and Table 1. Surface textures [36] varied from highly irregular and angular to regular and rounded and include a wide range of putative (bio)geochemical forms and textures. Gold from the silicified gravels, and their physical weathering products located directly down the modern topographic gradient, are dominantly regular and smooth surfaced three-dimensional euhedral crystals with sharp faces (e.g., Figure 2c,d). Paradoxically, these same silicified deposits contain abundant rounded fist- to pea-sized cobbles and gravel, suggestive of a high-energy depositional environment (Figure 3b).
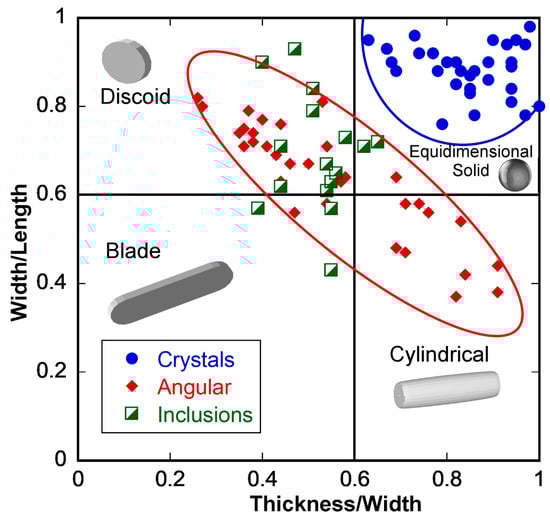
Figure 7.
Zingg plot of the morphology of placer gold from the La Cholla placers. Examples of idealized morphology are presented in gray.
Gold particles from unconsolidated and caliche-cemented gravels have surface angularity and are considerably flattened and elongate. The angular placer gold particles examined with SEM imaging exhibit deep pockets which contain matlike structures with a strong morphological resemblance to bacterial mats and surfaces replete with a wide range of putative biomorphic forms. Where present, impact striation marks were dull and weathered, suggesting prolonged exposure to chemical weathering after they were created. These striations are not shiny and fresh, as is often observed when damage occurs during mining.
A subset of the angular gold grouping is “inclusion gold” that contains inclusions of other minerals at >30% by volume within gold otherwise exhibiting the same angular gold group characteristics. The inclusion grouping gold has inclusions of siderite, iron oxides, metal sulfides (pyrite, chalcopyrite, galena), quartz, mica, and on rare occasions tourmaline. Where present, the tourmaline crystals are observed intact and penetrating the interiors of gold particles (Figure 8). Morphology of this gold grouping is similar to the angular grouping, and where it differs, this is attributed to external projections of the inclusions.
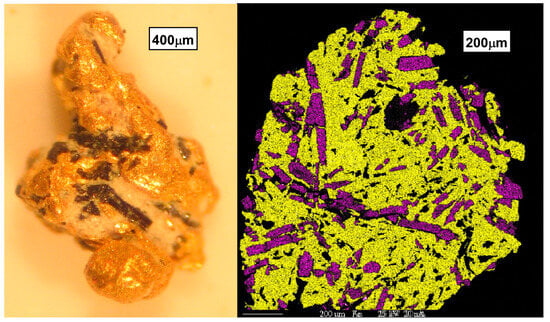
Figure 8.
Inclusion gold morphology showing tourmaline inclusions. (L) The exterior of a small gold particle showing black elongate crystals of tourmaline. (R) SEM-EDX element map for a polished interior section of gold showing iron (red) and semiquantitative boron (blue) abundance, highlighting tourmaline as purple within a gold (yellow) matrix. Black interior spots are quartz.
Major and minor element data for gold grain interior surfaces are presented in Table 1. The crystal shape population (n = 34) ranged from 99.95 to 95.92 wt% gold, with an average of 98.82%. Silver ranged from 4.07 to 0.05 wt% silver, with an average of 1.17%. Copper ranged from 191 to 18 mg/kg, with an average of 103 mg/kg. The angular gold group (n = 32) ranged from 99.26 to 92.07 wt% gold, with an average of 96.04%. Silver ranged from 7.86 to 0.07 wt% silver, with an average of 3.91%. Copper ranged from 1109 to 128 mg/kg, with an average of 468 mg/kg. The inclusion gold group (n = 16) ranged from 99.5 to 94.23 wt% gold, with an average of 96.89%. Silver ranged from 5.63 to 0.44 wt% silver, with an average of 3.00%. Copper ranged from 5722 to 355 mg/kg, with an average of 1082 mg/kg ppm.
Trace element characterization of gold particles using ICP-MS is presented in Table 2. All trace elements except copper have very low abundance. Of particular note are the exceedingly low levels of Pb and U measured within the gold particles. Copper concentrations range from 101 mg/kg to 5788 mg/kg, consistent with EPMA values reported for La Cholla placer gold particles.
Table 2.
ICP-MS trace element data for select placer gold particles. Units are mg/kg.
Copper isotope measurement for individual placer gold particles (Table 3) ranged from a δ65Cu high of +4.95‰ to a low of +0.14‰. Distribution of values is bimodal, with the crystal grouping >1.14‰ and the angular and inclusion grouping <0.77‰. Samples in Table 3 are either for the same particles also found in Table 1 (e.g., 2014 A2) or for separate particles not presented in Table 1 (e.g., 2014 Angular).
Table 3.
Copper isotope data for select placer gold particles.
5. Discussion
5.1. Geology of the La Cholla Placers
The La Cholla placers can be divided into two main units: placer gravels that are strongly cemented by silicification and placers that are weakly cemented by caliche or are unconsolidated (Figure 5). The latter placer deposits contain angular to rounded clasts of local bedrock up to 1 m in diameter and suggest an environment of deposition that was very energetic. These are most likely pulse placers [40] that have accumulated from multiple generations of desert flash-flood events.
It is notable that the placers that are silicified and those with the most competent calcite cement both occur along a major high-angle range-bounding fault that delineates the eastern side of the southern Dome Rock Mountains. Travertine pods and mounds up to 4 m are also found directly above this same fault (Figure 9) and nearby down the modern topographic gradient. Remnants of many these deposits are often hard to identify as most were mined for production of lime whitewash that was used historically for the adobe walls of buildings in the region [25]. Similar and larger travertine deposits up to 8 m were found in gravels of “Lime Kiln Gulch” along a major high-angle range-bounding fault a few miles away that marks the western side of the southern Dome Rock Mountains. These travertine deposits are likely fossil thermal springs that mark the surface expression of hydrothermal fluids emerging from depth along the basin-bounding faults.
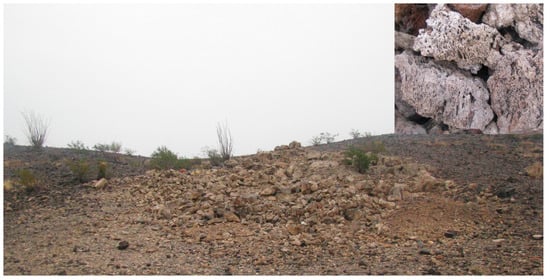
Figure 9.
A mound of light-colored travertine sits in contrast against dark McCoy Mountains metasedimentary rocks. Mound is approximately 4 m across. Inset photo shows detail of 25 cm long travertine clasts.
5.2. Morphology of La Cholla Gold
The surface morphology of the particles of gold from the angular grouping is typical of shorter transport distances in arid climates [14] and has features such as brittle mineral inclusions, angular forms, and percussion impact markings that are typical of debris-flow pulse placers [40]. Similarly, analysis of angular gold morphology on a Zingg plot (Figure 7) reveals a continuous trend of forms ranging from cylindrical to discoid. This range and trend has been attributed to placer gold morphologies driven by high-energy events [15]. Extensive scanning electron microscope, backscatter electron, and elemental mapping imaging of this gold is presented in [26].
The placer gold particles from the crystal grouping are, unsurprisingly, distinct three-dimensional forms that are likely dictated by crystal habit. Variation in morphology is mainly controlled by minor deformation caused by very short transport distances. The presence of these well-formed and often undamaged crystals of soft gold alloy (Figure 2c,d) within a high-energy deposit (Figure 5b) suggests that the formation of the crystals postdates the deposition of the gravels. Yet, the intense silicification of the crystal-bearing placer unit precludes crystal deposition after the silicification event. This leaves the silicification event as a prime suspect for deposition of these placer gold crystals.
Morphology may also be used to estimate transport distance of placer gold particles (e.g., [4,41,42]). Specifically, morphology has been used to determine the distance placer gold has traveled, as gold is known to become flatter with increasing transport distance and more elongate in high-energy environments. These same trends are observed in the angular gold particles of the La Cholla placers. Quantification of transport distance may be estimated using the flatness index (FI), where the formula FI = ((length + width)/2 × thickness) is used [42]. In this paper, we consolidate historical data from other placer districts and sources [41,42,43] to calculate a best-fit equation where transport distance (km) = 1.2833 + (FI − 0.57662) + (FI2 × 0.31718). It is acknowledged that this equation is a generalization for placer gold and that the placer gold alloy composition, local climate variation, chemistry of the water of transportation, mineralogy of the sediment load, and other factors will influence the reliability of this approximation of transport distance due to their effects on chemical and physical weathering rates. Nevertheless, we present transport distance estimates here, as the differences between these estimates and even the absolute values are informative in understanding potential sources of the placer gold.
For the angular gold grouping, estimated transport distances from the lode source range from 1.2 to 4.6 km, with an average of 2.1 km. The inclusion gold subgrouping has similar values, ranging from 1.3 to 3.2 km, with an average of 1.8 km. The crystal grouping of placer gold ranges from 1.0 to 1.2 km, with an average of 1.1 km. It should come as no surprise that the gold crystals which likely formed in situ within the placer have such small estimated transport distances; this suggests an error of distance estimation of approximately 1 km.
Using the range-bounding fault as a reference line (Figure 4), it is possible to plot the average transport distance estimate for each sample site vs. the measured distance of that site from the fault (Figure 10). As expected, the estimated distance from the lode source of the placer gold increases with increasing distance down the elevation gradient and away from the fault. The Y-intercept suggests that the lode source of the placer gold lies at least 1.5 km uphill to the west of the fault. This is consistent with the known locations of quartz ± siderite ± gold and quartz ± tourmaline ± gold veins in the southern Dome Rock Mountains, and specifically the patented claims of the Beehive lode located just to the west of the area in Figure 4.
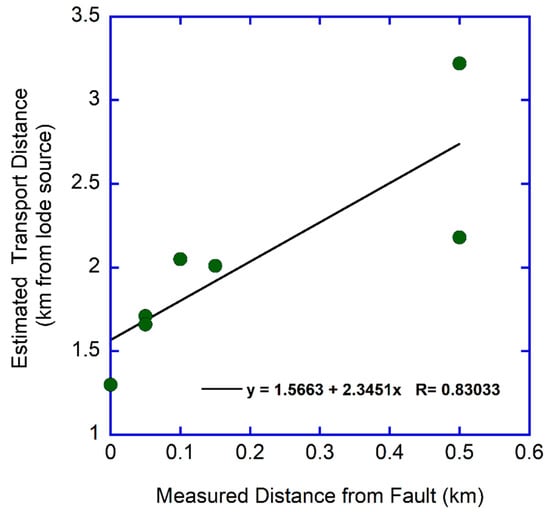
Figure 10.
Plot of estimated transport distance for angular placer gold particles (calculated from flatness index) vs. measured distance from the range-bounding fault. Plot is for average transport distance by sample site and not for individual particles.
5.3. Geochemistry of La Cholla Placer Gold
5.3.1. Abundances of Silver and Copper in Gold Alloy and Inclusion Significance
The placer gold morphology groups from the La Cholla placers have major and minor element abundances within the gold alloy of the interiors of the particles that form distinct populations (Figure 11). Crystals generally have the lowest copper values and a wide range of gold–silver alloying trends, tending towards higher gold purity. Angular gold typically has higher copper than the crystals and gold–silver alloying trends tending towards less elevated gold purity. Inclusion gold has the highest copper values, with one exceptionally elevated sample. As care was taken to avoid measurements on or adjacent to inclusions, this is likely due to microinclusions or diffusion from inclusions of copper phases. The inclusion gold otherwise exhibits a gold–silver alloying trend similar to the angular gold particles.
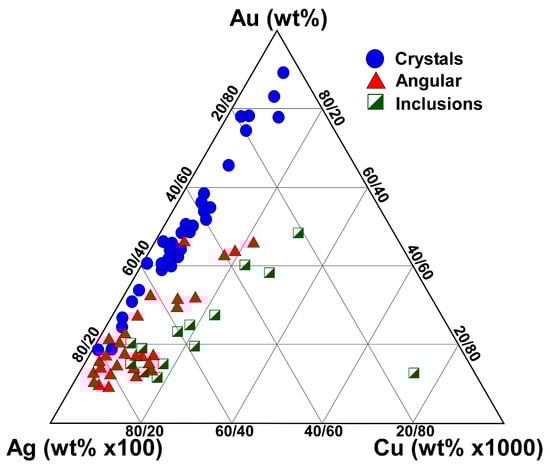
Figure 11.
Ternary plot of major and minor elemental abundances for individual gold particles measured in this study. Silver abundance has been amplified by ×100 and copper by ×1000 to highlight differences and relationships between different gold morphology groups.
Significantly, the continuous and overlapping gold–silver alloying trend between the angular placer gold particles and the placer crystals hints at a genetic link between these gold morphology groupings. This trend is consistent with gold crystal formation from dissolution of angular gold, with selective removal of some silver and copper.
For angular and inclusion gold, the elemental abundances display a relationship with the estimates of transport distance calculated from morphology (Figure 12). With increasing transport distance, gold purity increases, while silver and copper decrease. This has been observed in many districts around the world [1,4,15].
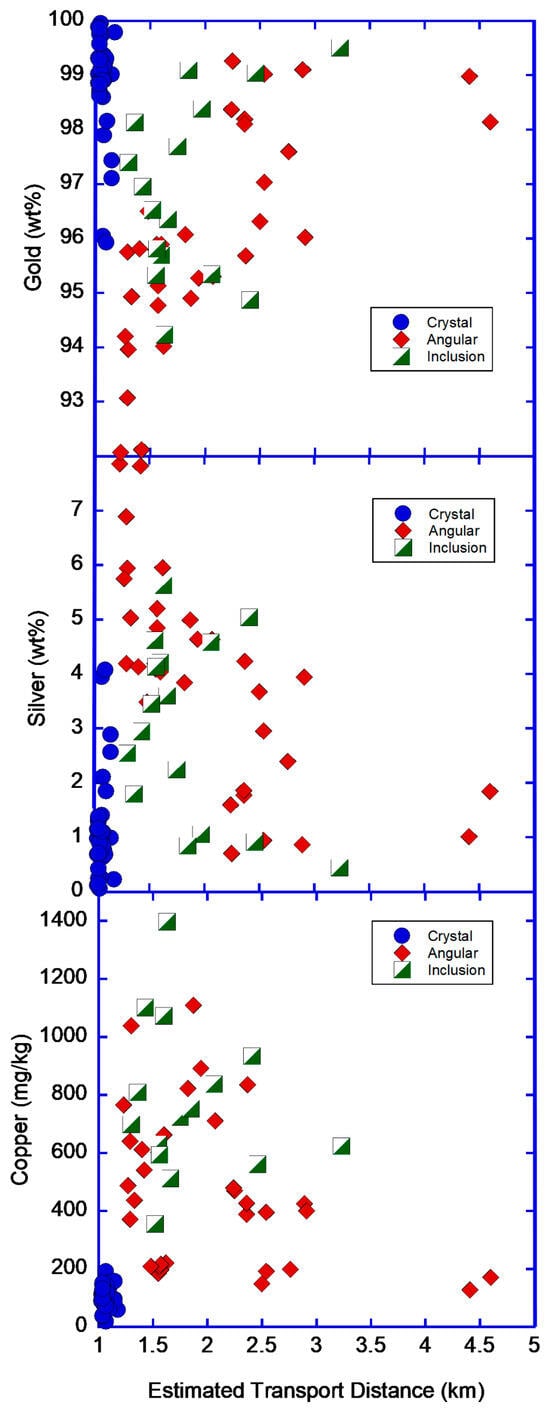
Figure 12.
Plot of estimated transport distance for placer gold particles (calculated from flatness index) vs. elemental abundances for individual gold particles measured in this study.
Inclusions of minerals within placer gold particles provide an additional link to source regions (Figure 8). Inclusions within gold crystals were limited to fine, rounded quartz particles and crack fillings of silica. Angular and inclusion gold groupings always have inclusions in varying amounts and speciation. While quartz is the most abundant inclusion observed, sulfides are quite common (e.g., pyrite, chalcopyrite). In some angular and inclusion gold, pseudomorphs of siderite (iron carbonate) and iron oxides after pyrite are quite common. Inferred lode sources of gold above the placers display similar vein mineralogy. It is likely that primary vein mineralogy included sulfides and gold, as is typical for base metal epithermal veins in this part of Arizona. But the deep and localized carbonate alteration of some of these veins to form abundant siderite hints at a later hydrothermal event. The genetic link between visible native gold and siderite was clearly understood by early miners who methodically tested virtually every quartz–siderite vein with prospect pits and shafts. Indeed, the Yum Yum Mine is noted for spectacular specimens of chocolate-brown siderite riddled with native gold that are on display at the Arizona Mining and Mineral Museum in Phoenix.
Placer and lode gold is also found in association with tourmaline (Figure 8). Much recent work has been undertaken to examine the genetic relationship between gold and tourmaline within veins of orogenic gold deposits [44,45,46]. While an examination of this relationship at La Cholla was precluded by the small number of placer gold particles with tourmaline inclusions, future investigators may find this fertile ground to examine if older orogenic deposits predate the detachment-related base metal and gold veins.
5.3.2. Uranium and Lead Elemental Abundances
A surprising discovery was the very low levels of U and Pb within placer gold of the La Cholla placers (Table 2). It was initially hypothesized that levels of these elements would be elevated in the gold particles, based upon the abundance of lead (as galena and cerussite) in lode and placer deposits of the district and region and the observation of the uranium mineral carnotite [K2(UO2)2(VO4)2•3H2O] within portions of the placers.
The La Cholla gold samples show extremely low concentrations of trace elements (Table 2). Only Cu is present at 100s to 1000s of mg/kg levels (Table 1 and Table 2). ICP-MS analyses revealed Pb < 0.46 mg/kg in 75% of the samples, with the remaining two samples at 1.8 and 71 mg/kg (Table 2). Uranium concentrations were mostly below the detection limit (<0.0001). Only three samples showed detectable U concentrations between 0.001 and 0.004 mg/kg (Table 2). The observed extremely low U content in the native gold samples agrees with other works [18,20]. However, the observed very low Pb content in the La Cholla placer gold is unusual compared to the 450–10,300 mg/kg Pb observed in native gold samples from Rich Hill, Arizona [20]. This observation potentially indicates that the processes responsible for the formation of the La Cholla placer gold are different compared to the Rich Hill placers.
The low levels of uranium in the placer gold at La Cholla are more striking when the abundance of carnotite within the silicified placers is considered. Uranium is well-known to occur as detrital fragments in some late Archean to early Proterozoic gold placers (e.g., [47,48]), though the La Cholla placers are considerably younger. Uraninite particles were also observed in the “black sand” concentrates from the unconsolidated and caliche-cemented La Cholla placers, though a local bedrock source has yet to be identified. Insights on the significance of the uranium occurrence lie in the distribution and speciation of the uranium at La Cholla. Uraninite clearly occurs as detrital particles in the unconsolidated and caliche-cemented placers but has not been found within the silicified placers. Conversely, carnotite occurs in abundance within the silicified placers but is not found within the unconsolidated and caliche-cemented placers. The formation of carnotite within calcrete (caliche) has been well studied (e.g., [49,50]). These studies differentiate between carnotite sandstone deposits that form due to a redox front and caliche carnotite deposits that form due to the effect of carbonate solutions on uranium and vanadium solubility. Carbonated fluids are excellent at transporting uranium and vanadium over a wide range of pH, whereas uncarbonated solutions will favor precipitation of carnotite down to a pH < 4 (Figure 3 in [49]). The highly carbonated thermal waters which produced travertine mounds within the placer gravels would provide the ideal mechanism to transport dissolved uranium and vanadium.
These same carbonated thermal waters would leach uranium and vanadium from bedrock but also contribute to the oxidation of the base metal quartz veins to produce siderite–quartz veins. The highly carbonated fluids would also interact with any placer gold encountered and locally dissolve and reprecipitate some of the placer gold as crystals. After emerging from the vents, excess fluids would soak into the surrounding gravels and migrate along bedrock channels to precipitate uraninite where reducing organic debris was encountered. At a later point, the fluids at some of these vents changed to lower pH/Eh and higher temperatures and elevated dissolved silica content. This change in fluid chemistry replaced the original carbonate alteration with strong silicification and permitted carnotite precipitation within the gravels.
5.3.3. Copper Isotope Values
There is a distinct copper isotope difference between the angular (δ65Cu = +0.54 ± 0.22) and crystalline (δ65Cu = +2.8 ± 1.0) gold samples. Oxidation of copper over a large range of temperatures and pressures is known to generate fluids that are enriched in the 65Cu isotope. Both empirical [51,52,53,54,55,56] and theoretical [57,58] data demonstrate this occurrence. The lower δ65Cu copper isotope values are similar to those found in epithermal gold deposits [59,60] and most likely represent the primary signature of the gold originating from local base metal veins. The carbonated hydrothermal overprinting event at La Cholla was most likely oxidative in nature and “leached” heavier Cu from the preexisting lode vein minerals. Zones where alteration was intense produced recrystallized placer gold with a heavier copper isotope signal inherited from the oxidation of the base metal veins and older angular placer gold. Slightly heavier copper isotope values in angular placer gold may indicate the degree to which the parent vein was subjected to carbonate alteration to produce siderite–gold veins, the degree of limited interaction of these fluids with angular placer gold, or both. However, the formation of the younger crystalline placer gold is associated with these carbonated hydrothermal fluids as recorded by their distinctly heavier δ65Cu values.
5.4. Origin and Evolution of the La Cholla Placer Gold Deposits
It is well-known that in primary lode deposits, a succession of superimposed ore-forming events produce telescoping and complex deposits (i.e., hybrid deposits types; [61]). The La Cholla placers are an excellent example of similar complex deposit history and overprinting within a secondary placer deposit.
Gold mineralization in the greater La Cholla District and districts to the north have a clear association with migration of specialized fluids along mid-Tertiary detachment faults (e.g., Copperstone Deposit, [62]). These mid-Tertiary primary lode gold deposits were subsequently unroofed by erosion related to continued detachment faulting and later 5 to 17 Ma high-angle Basin and Range faulting, and they began producing placer gold deposits.
Volcanism during this same period (e.g., [63]) produced thermal springs along these high-angle faults, which served as convenient conduits for deep, warm, mineral-rich fluids. Geochemical constraints suggest that the original placers were locally intruded and altered by geothermal fluids emanating from these faults. Similar localized geothermal alternation of placer deposits may be documented in the “White Placers” of Rich Hill, Arizona, USA, and the White Channel sediments of the Klondike region, Yukon Territory, Canada [14,64,65,66]. Originally, these fluids at La Cholla were warm and carbonate-rich, resulting in leaching of uranium and lead, mobilization of placer gold, and precipitation of travertine mounds. Later, these fluids became warmer and Si-dominant, resulting in cementation of portions of the placers with silica, recrystallization of placer gold as gold crystals, and precipitation of U and V as carnotite. The result is a complex placer deposit consisting of the original placer with overprinting by carbonate and later silica alteration events. Significantly, these geothermal alterations of the original placer produced localized recrystallization of placer gold as distinct, sharp crystals within the placer gravels. They also leached select elements (U, Pb, V) from the placer deposit and produced localized secondary uranium mineralization.
6. Conclusions
This study of geochemical overprinting and modification of placer deposits bears directly upon the study of other placers, especially those containing crystalline gold and uranium mineralization. The geochemical overprinting of placer deposits has produced much controversy due to the apparently paradoxical evidence recorded within them. This has also caused decades of debate regarding the genesis of very old placer deposits.
In the La Cholla placer gold deposits near Quartzsite, Arizona, USA, geochemical overprinting on placer gold deposits produced complex deposits with sharp and often undamaged gold crystals within high-energy gravels as a result of postdepositional recrystallization by localized hot spring systems. The geothermal fluids emanated from a basin-bounding fault and left a distinct geochemical signature that includes recrystallized gold, secondary uraninite and carnotite, travertine deposits, and mounds of highly silicified placer gravels. Surrounding these deposits are more typical placer gravels with angular placer gold morphologies and geochemistry indicative of flash-flood pulse placers with a lode gold source within 5 km of the deposit. The multitude of small local lode gold source veins is likely related to specialized fluid migration along mid-Tertiary detachment faults. The unroofing of the deposit by 5 to 17 Ma high-angle Basin and Range faulting led to extensive placer development with subsequent localized modification by geothermal fluid migration along the same faults.
Future workers should utilize the evidence provided by similar overprinting on placer deposits to infer conditions of deposit formation and evolution. These interpretations may include evidence of past geothermal activity, the presence of previously undiscovered structures which served as fluid conduits, and areas of steep paleo-gradients of topography.
Author Contributions
Methodology, E.B.M., R.M. and G.K.; formal analysis, E.B.M., R.M., G.K. and J.P.; investigation, J.P.; writing—original draft preparation, E.B.M. and J.P.; writing—review and editing, E.B.M., R.M. and G.K.; supervision, G.K.; funding acquisition, G.K. All authors have read and agreed to the published version of the manuscript.
Funding
Instrumentation was provided and supported by the National Science Foundation, EAR-0115884 and EAR-0941106. XRF instrumentation was provided by a grant from the W.M. Keck Foundation. Support was also provided by a NASA Astrobiology Institute Minority Institution Research Sabbatical (NAI-MIRS) program award to the lead author and an institutional grant by CSUSB. CSUSB provided internal funding to support undergraduate participation in this research activity.
Data Availability Statement
The data presented in this study are available in the article. Additional data is not available, at request of the mine owners.
Acknowledgments
This study would not have been possible without the generous support of mine owners Larry Schreiner and Steve Hunt. Their support of field work on their mining claims, provision of samples, and open communication about the nature of the deposits they were mining were invaluable. The lead author also thanks his colleagues of the Minority Institution Astrobiology Collaborative (MiAC) for providing the supportive environment that made this work possible. We thank Ken Domanik at the University of Arizona for help with probe analyses. James Pelley provided support for SEM imaging. Additional field support was provided by Blake Harmon and the Quartzsite Metal Detecting Club and undergraduate students from CSUSB.
Conflicts of Interest
The authors declare no conflict of interest.
References
- Boyle, R.W. The Geochemistry of Gold and Its Deposits: Together with a Chapter on Geochemical Prospecting for the Element; Geological Survey of Canada: Ottawa, ON, Canada, 1979; 280p, ISBN 0-660-19591-7.
- Saunders, J.A.; Unger, D.L.; Kamenov, G.D.; Fayek, M.; Hames, W.E.; Utterback, W.C. Genesis of Middle Miocene Yellowstone-hotspot-related bonanza epithermal Au-Ag deposits, Northern Great Basin, USA. Min. Dep. 2008, 43, 715–734. [Google Scholar] [CrossRef]
- Reith, F.; Fairbrother, L.; Nolze, G.; Wilhelmi, O.; Clode, P.L.; Gregg, A.; Parsons, J.E.; Wakelin, S.A.; Pring, A.; Hough, R.; et al. Nanoparticle factories: Biofilms hold key to gold dispersion and nugget formation. Geology 2010, 38, 843–846. [Google Scholar] [CrossRef]
- Lindgren, W. Tertiary Gravels of the Sierra Nevada of California; Professional Paper 78; US Geological Survey: Washington, DC, USA, 1911; 226p.
- Watterson, J.R. Artifacts resembling budding bacteria produced in placer-gold amalgams by nitric acid leaching. Geology 1994, 20, 1144–1146. [Google Scholar] [CrossRef]
- Mossman, D.J.; Reimer, T.; Durstling, H. Microbial processes in gold migration and deposition: Modern analogues to ancient deposits. Geosci. Can. 1999, 26, 131–140. [Google Scholar]
- Reith, F.; Lengke, M.F.; Falconer, D.; Craw, D.; Southam, G. Winogradski Review: The geomicrobiology of gold. Int. Soc. Microb. Ecol. J. 2007, 1, 567–584. [Google Scholar] [CrossRef]
- Hough, R.M.; Butt, C.R.M.; Fisher-Buhner, J. The crystallography, metallography and composition of gold. Elements 2009, 5, 297–302. [Google Scholar] [CrossRef]
- Southam, G.; Lengke, M.F.; Fairbrother, L.; Reith, F. The biogeochemistry of gold. Elements 2009, 5, 303–307. [Google Scholar] [CrossRef]
- Hough, R.M.; Butt, C.R.M.; Reddy, S.M.; Verrall, M. Gold nuggets: Supergene or hypogene? Austr. J. Earth Sci. 2007, 54, 959–964. [Google Scholar] [CrossRef]
- Fairbrother, L.; Brugger, J.; Shapter, J.; Laird, J.; Southam, G.; Reith, F. Supergene gold transformation: Biogenic secondary and nano-particulate gold from arid Australia. Chem. Geol. 2012, 320, 17–31. [Google Scholar] [CrossRef]
- Craw, D.; Lilly, K. Gold nugget morphology and geochemical environments of nugget formation, southern New Zealand. Ore Geol. Rev. 2016, 79, 301–315. [Google Scholar] [CrossRef]
- Stewart, J.; Kerr, G.; Prior, D.; Halfpenny, A.; Pearce, M.; Hough, R.; Craw, D. Low temperature recrystallisation of alluvial gold in paleoplacer deposits. Ore Geol. Rev. 2017, 88, 43–56. [Google Scholar] [CrossRef]
- Melchiorre, E.B.; Kamenov, G.D.; Sheets-Harris, C.; Andronikov, A.; Leatham, W.B.; Yahn, J.; Lauretta, D.S. Climate-induced geochemical and morphological evolution of placer gold deposits at Rich Hill, Arizona, USA. Geol. Soc. Am. Bull. 2017, 129, 193–202. [Google Scholar] [CrossRef]
- Melchiorre, E.B.; Henderson, J. Topographic gradients and lode gold sourcing recorded by placer gold morphology, geochemistry, and mineral inclusions in the east fork San Gabriel River, California, USA. Ore Geol. Rev. 2019, 109, 348–357. [Google Scholar] [CrossRef]
- Masson, F.X.; Beaudoin, G.; Laurendeau, D. Multi-method 2D and 3D reconstruction of gold grain morphology in alluvial deposits: A review and application to the Rivière du Moulin (Québec, Canada). Geol. Soc. Lond. Spec. Publ. 2022, 516, 337–352. [Google Scholar] [CrossRef]
- Melchiorre, E.B.; Orwin, P.M.; Reith, F.; Rea, M.A.D.; Yahn, J.; Allison, R. Biological and geochemical development of placer gold deposits at Rich Hill, Arizona, USA. Minerals 2018, 8, 56. [Google Scholar] [CrossRef]
- Pettke, T.; Frei, R. Isotope systematics in vein gold from Brusson, Val d’Ayas (NW Italy), Pb/Pb evidence for a Piemonte metaophiolite Au source. Chem. Geol. 1996, 127, 111–124. [Google Scholar] [CrossRef]
- Kamenov, G.D.; Saunders, J.A.; Hames, W.E. Mafic Magmas as Sources for Gold in Middle-Miocene Epithermal Deposits of Northern Great Basin, USA: Evidence from Pb Isotopic Compositions of Native Gold. Econ. Geol. 2007, 102, 1191–1195. [Google Scholar] [CrossRef]
- Kamenov, G.D.; Melchiorre, E.B.; Ricker, F.N.; DeWitt, E. Insights from Pb Isotopes for Native Gold Formation during Hypogene and Supergene Processes at Rich Hill, Arizona. Econ. Geol. 2013, 108, 1577–1589. [Google Scholar] [CrossRef]
- Jones, E.L. Gold Deposits Near Quartzsite, Arizona; U.S. Geological Survey Bulletin 620; US Government Printing Office: Washington, DC, USA, 1915; pp. 45–57.
- Blake, W.P. Report of the Territorial Geologist. In Report of the Governor of Arizona for 1899; Arizona Territorial Government: Phoenix, AZ, USA, 1899; pp. 42–153. [Google Scholar]
- Tenney, J.B. Unpublished Field Notes; Arizona Bureau of Mines: Tucson, AZ, USA, 1933.
- Wilson, E.D. Arizona Gold Placers and Placering, 5th ed.; Bulletin 160; Arizona Bureau of Mines and Mineral Technology: Tucson, AZ, USA, 1952; p. 148.
- Keiser, W. Lost Mines and Prospectors’ Lore; Yuma County Historical Society, Inc.: Yuma, AZ, USA, 1978; p. 49. [Google Scholar]
- Melchiorre, E.B. Gold Atlas of Quartzsite, Arizona: Volume 2, Southern Dome Rock Mountains; Rock Doc Publications: San Bernardino, CA, USA, 2013; p. 298. [Google Scholar]
- Velasquez, C.M.L. Geochemical Classification of Placer and Lode Gold Deposits within the Northern Dome Rock Mountains of the Quartzsite Mining District. Master’s Thesis, California State University, San Bernardino, AZ, USA, 2012. [Google Scholar]
- Wilson, E.D.; Cunningham, J.B.; Butler, G.M. Arizona Lode Gold Mines and Gold Mining; Bulletin 137; Arizona Bureau of Mines and Mineral Technology: Tucson, AZ, USA, 1952; p. 261.
- Harding, L.E.; Coney, P.J. The geology of the McCoy Mountains Formation, southeastern California and southwestern Arizona. Geol. Soc. Am. Bull. 1985, 96, 755–769. [Google Scholar] [CrossRef]
- Tosdal, R.M.; Haxel, G.B.; Wright, J.E.; Jenney, J.P.; Reynolds, S.J. Jurassic geology of the Sonoran Desert region, southern Arizona, southeastern California, and northernmost Sonora: Construction of a continental-margin magmatic arc. Geol. Evol. Ariz. Ariz. Geol. Soc. Dig. 1989, 17, 397–434. [Google Scholar]
- Shuster, J. Structural and chemical characterization of placer gold grains: Implications for bacterial contributions to grain formation. Geomicro. J. 2015, 32, 158–169. [Google Scholar] [CrossRef]
- Armstrong, J.T. Quantitative analysis of silicates and oxide minerals: Comparison of Monte-Carlo, ZAF and Phi-Rho-Z procedures. In Proceedings of the Microbeam Analysis Society; Newbury, D.E., Ed.; San Francisco Press: San Francisco, CA, USA, 1988; pp. 239–246. [Google Scholar]
- Donovan, J.J.; Snyder, D.A.; Rivers, M.L. An improved interference correction for trace element analysis. Microbeam An. 1993, 2, 23–28. [Google Scholar] [CrossRef]
- Knight, J.B.; McTaggart, K.C. Composition of Gold from Southwestern British Columbia: British Columbia; Geological Fieldwork 1988, Paper Vol. 1989-1; Ministry of Energy, Mines and Petroleum Resources: Ottawa, ON, Canada, 1989; pp. 387–394.
- Douma, Y.; Knight, J.B. Mounting samples in methylmethocrylate for SEM and EMP analysis. J. Sed. 1994, A64, 675–677. [Google Scholar] [CrossRef]
- Saunders, J.A.; Mathur, R.; Kamenov, G.D.; Shimizu, T.; Brueseke, M.E. New isotopic evidence bearing on bonanza (Au-Ag) epithermal ore-forming processes. Miner. Depos. 2015, 51, 1–11. [Google Scholar] [CrossRef]
- Mathur, R.; Titley, S.; Barra, F.; Brantley, S.; Wilson, M.; Phillips, A.; Munizaga, F.; Maksaev, V.; Vervoort, J.; Hart, G. Exploration potential of Cu isotope fractionation in porphyry copper deposits. J. Geochem. Explor. 2009, 102, 1–6. [Google Scholar] [CrossRef]
- Blott, S.J.; Pye, K. Particle shape: A review and new methods of characterization and classification. Sedimentology 2008, 55, 31–63. [Google Scholar] [CrossRef]
- Zingg, T. Beitrag zur schotteranalyse. Schweiz. Mineral. Petrogr. Mitt. 1935, 15, 39–140. [Google Scholar]
- McCulloch, R.; Lewis, B.; Keill, D.; Shumaker, M. Applied Gold Placer Exploration and Evaluation Techniques; Special Publication 115; Montana Bureau of Mines and Geology: Butte, MT, USA, 2003; p. 115.
- Hérail, G.; Fornari, M.; Viscarra, G.; Miranda, V. Morphological and chemical evolution of gold grains during the formation of a polygenic fluviatile placer: The Mio- Pleistocene Tipuani placer example (Andes, Bolivia). Chron. Rech. Min. 1990, 500, 41–49. [Google Scholar]
- Loen, J.S. Use of placer gold characteristics to locate bedrock gold mineralization. Explor. Min. Geol. 1995, 4, 335–339. [Google Scholar]
- Cailleux, A.; Tricart, J. Introduction to the study of sand and pebbles. Cent. Doc. Univ. Paris 1959, 3, 194–202. [Google Scholar]
- Fontem, N.K.; Suh, C.E.; Ngatcha, R.B.; Shemang, E.M.; Vishiti, A.; Melchiorre, E.; Fon, A.N. Tourmaline occurrence and gold mineralization at a granitoid-metasediment contact in the Upper Lom Basin, east Cameroon. SN Appl. Sci. 2023, 5, 141. [Google Scholar] [CrossRef]
- Guo, M.; Liu, J.; Zhai, D.; de Fourestier, J.; Liu, M.; Zhu, R. Tourmaline as an indicator of ore-forming processes: Evidence from the Laodou gold deposit, Northwest China. Ore Geol. Rev. 2023, 154, 105304. [Google Scholar] [CrossRef]
- Faye, C.I.; Ndiaye, A.A.; Dia, I.; Gueye, M.; Moritz, R. Geological, geophysical and surface geochemical guides for gold exploration in the Falémé Volcanic Belt, West African Craton, Senegal. J. Geochem. Explor. 2023, 245, 107145. [Google Scholar] [CrossRef]
- Minter, W.E.L. Detrital gold, uranium, and pyrite concentrations related to sedimentology in the Precambrian Vaal Reef placer, Witwatersrand, South Africa. Econ. Geol. 1976, 71, 157–176. [Google Scholar] [CrossRef]
- Hallbauer, D.K. Geochemistry and Morphology of Mineral Components from the Fossil Gold and Uranium Placers of the Witwatersand; US Geological Survey Professional Paper 1161-A-BB; US Government Printing Office: Washington, DC, USA, 1981.
- Mann, A.W. Chemical Ore Genesis Models for the Precipitation of Carnotite in Calcrete; Commonwealth Scientific and Industrial Research Organisation Paper CSIRO-FP-7; Commonwealth Scientific and Industrial Research Organisation: Canberra, Australia, 1974.
- Mann, A.W.; Deutscher, R.L. Genesis principles for the precipitation of carnotite in calcrete drainages in Western Australia. Econ. Geol. 1978, 73, 1724–1737. [Google Scholar] [CrossRef]
- Borrok, D.M.; Nimick, D.A.; Wanty, R.B.; Ridley, W.I. Isotopic variations of dissolved copper and zinc in stream waters affected by historical mining. Geochim. Cosmochim. Acta 2008, 72, 329–344. [Google Scholar] [CrossRef]
- Ehrlich, S.; Butler, I.; Halicz, L.; Rickard, D.; Oldroyd, A.; Matthews, A. Experimental study of the copper isotope fractionation between aqueous Cu (II) and covellite, CuS. Chem. Geol. 2004, 209, 259–269. [Google Scholar] [CrossRef]
- Kimball, B.E.; Mathur, R.; Dohnalkova, A.C.; Wall, A.J.; Runkel, R.L.; Brantley, S.L. Copper isotope fractionation in acid mine drainage. Geochim. Cosmochim. Acta 2009, 73, 1247–1263. [Google Scholar] [CrossRef]
- Li, D.; Liu, S.-A. Copper Isotope Fractionation during Basalt Leaching at 25 °C and pH = 0.3, 2. J. Earth Sci. 2022, 33, 82–91. [Google Scholar] [CrossRef]
- Mathur, R.; Ruiz, J.; Titley, S.; Liermann, L.; Buss, H.; Brantley, S.L. Cu isotopic fractionation in the supergene environment with and without bacteria. Geochim. Cosmochim. Acta 2005, 69, 5233–5246. [Google Scholar] [CrossRef]
- Zhao, Y.; Xue, C.; Liu, S.-A.; Mathur, R.; Zhao, X.; Yang, Y.; Dai, J.; Man, R.; Liu, X. Redox reactions control Cu and Fe isotope fractionation in a magmatic Ni–Cu mineralization system. Geochim. Cosmochim. Acta 2019, 249, 42–58. [Google Scholar] [CrossRef]
- Fujii, T.; Moynier, F.; Abe, M.; Nemoto, K.; Albarède, F. Copper isotope fractionation between aqueous compounds relevant to low temperature geochemistry and biology. Geochim. Cosmochim. Acta 2013, 110, 29–44. [Google Scholar] [CrossRef]
- Seo, J.H.; Lee, S.K.; Lee, I. Quantum chemical calculations of equilibrium copper (I) isotope fractionations in ore-forming fluids. Chem. Geol. 2007, 243, 225–237. [Google Scholar] [CrossRef]
- Duan, J.; Tang, J.; Li, Y.; Liu, S.-A.; Wang, Q.; Yang, C.; Wang, Y. Copper isotopic signature of the Tiegelongnan high-sulfidation copper deposit, Tibet: Implications for its origin and mineral exploration. Miner. Depos. 2016, 51, 591–602. [Google Scholar] [CrossRef]
- Saunders, N.J.; Barling, J.; Harvey, J.; Halliday, A.N. Heterogeneous nickel isotopic compositions in the terrestrial mantle—Part 1: Ultramafic lithologies. Geochim. Cosmochim. Acta 2020, 285, 129–149. [Google Scholar] [CrossRef]
- Sillitoe, R.H. Erosion and collapse of volcanoes: Causes of telescoping in intrusion-centered ore deposits. Geology 1994, 22, 945–948. [Google Scholar] [CrossRef]
- Salem, H.M. Geochemistry, Mineralogy, and Genesis of the Copperstone Gold Deposit. Ph.D. Thesis, The University of Arizona, La Paz County, AZ, USA, 1993; p. 211. [Google Scholar]
- Reynolds, S.J.; Welty, J.W.; Spencer, J.E. Volcanic history of Arizona: Fieldnotes. Ariz. Bur. Geol. Miner. Technol. 1986, 16, 1–5. [Google Scholar]
- Dufresne, M.B. Origin of Gold in the White Channel Sediments of the Klondike Region, Yukon Territory. Master’s Thesis, University of Alberta, Edmonton, AB, Canada, 1986; p. 181. [Google Scholar]
- Dufresne, M.B.; Morison, S.R.; Nesbitt, B.E. Evidence of hydrothermal alteration in White Channel sediments and bedrock of the Klondike area, west-central Yukon. Yuk. Geol. 1986, 1, 44–49. [Google Scholar]
- Tempelman-Kluit, D.J. White Channel Gravel of the Klondike. Yukon Exploration and Geology 1981, Exploration and Geological Services Division; Yukon Indian and Northern Affairs Canada: Whitehorse, YT, Canada, 1982; p. 79.
Disclaimer/Publisher’s Note: The statements, opinions and data contained in all publications are solely those of the individual author(s) and contributor(s) and not of MDPI and/or the editor(s). MDPI and/or the editor(s) disclaim responsibility for any injury to people or property resulting from any ideas, methods, instructions or products referred to in the content. |
© 2023 by the authors. Licensee MDPI, Basel, Switzerland. This article is an open access article distributed under the terms and conditions of the Creative Commons Attribution (CC BY) license (https://creativecommons.org/licenses/by/4.0/).