Article

Global Crystallographic Texture of Pyrite in Fossil Wood (Jurassic, Oryol Region, Russia)

by
Alexey Pakhnevich
1,2,
Dmitry Nikolayev
2 and
Tatiana Lychagina
2,*
1
Borissiak Paleontological Institute, Russian Academy of Sciences, 117647 Moscow, Russia
2
Frank Laboratory of Neutron Physics, Joint Institute for Nuclear Research, 141980 Dubna, Russia
*
Author to whom correspondence should be addressed.
Minerals 2023, 13(8), 1050; https://doi.org/10.3390/min13081050
Submission received: 28 June 2023 / Revised: 25 July 2023 / Accepted: 4 August 2023 / Published: 8 August 2023
(This article belongs to the Special Issue Biomineralization in Prokaryotes and Eukaryotes)

Abstract

:

Simple Summary

Fossil wood of the Jurassic period from the Oryol region, Russia was studied using a non-destructive method. The method is based on the high penetrating power of neutrons into matter. The organic matter of the wood was replaced by the mineral pyrite. The distribution of pyrite crystal orientations in the fossil wood and pyrite nodules from the same locality was compared. It was found that mineral crystals replacing fossil wood are more ordered than these mineral crystals in the nodules. This fact confirms the idea that, in the future, using an organic matrix, it is possible to grow crystals in given directions, planning in advance the properties of new materials. It was also concluded that one can assume the origin of the studied objects by analyzing the distribution of their crystal orientations. It may be useful in the search for mineral matter of biogenic origin.

Abstract

Many works are devoted to the study of the crystallographic texture of primary skeletal minerals of animals. But how the directions of mineral crystals that replace the organic matter in the fossil state are oriented is unknown. Here we investigated the crystallographic texture of pyrite grown on an organic matrix and without it. Jurassic pyritized wood (Middle Jurassic, Callovian) was studied by the neutron diffraction method. The global crystallographic texture of pyrite in nodules and fossil wood is compared. It was found that in both cases, the isoline patterns of pole figures and texture sharpness are similar to the same characteristics of abiogenic calcite. But the orientations of pyrite crystals in wood are more ordered, the isolines are closer, and the regions of maximum pole density are wider. That is, the pyrite crystals that replaced the petrified wood are more ordered. This was influenced by the organic matrix on which the crystals grew. Repetition of a fossil mollusk shell shape without using its shell as a matrix for crystal growth does not lead to an increase in the crystallographic texture sharpness. This is illustrated by an example of the inner core calcite shell of the gastropod mollusk Bellerophon sp.

1. Introduction

Organic compounds are destroyed often after the death of the organism and are not preserved in the fossil record. However, in some cases, the organic or its derivatives are preserved; for example, chemofossils are fragments or whole molecules of biogenic origin. Natural polymers such as cellulose, lignin, and sporopollenin are often preserved in the fossil state. Therefore, some plant remains are well preserved, almost unchanged for millions of years; for example, wood. In other cases, it can be charred, that is, a significant part of the organic matter turns into carbon or wood is replaced by minerals. The range of these minerals is significant, namely quartz [1], opal, pyrite, marcasite, volkonskoite, siderite, malachite, azurite and apatite, chalcedony, calcite, dolomite, hematite, goethite, hollandite, lepidocrocite, chalcopyrite, chalcocite, bornite, covellite, fluorite, barite, natrolite, and vivianite. A detailed review of the wood replacement with minerals can be found in [2]. In this case, the mineral grows on the surfaces of biological structures or replaces them.
One common mineral that replaces fossils is pyrite (FeS2). There are known cases of pyrite replacing the mineral skeletons of organisms; for example, shells of crinoids, brittle stars, and other echinoderms (Figure 1a) [3], shells of gastropods, bivalves [4], cephalopods [5], and scaphopods mollusks [6], brachiopods (Figure 1b,c) [7], coral skeletons [8] and sponges [9], vertebrate bones [10], microfossil shells—foraminifers [11,12], radiolarians [13], diatoms [14,15,16], and ostracods [17]. In addition to mineral skeletons, organic structures also undergo pyritization; for example, trilobite shells [18], graptolite colonies [19,20,21], and insect covers [22], animal soft tissues in brachiopods, hydroids, priapulids, annelids, entoproct [23,24,25,26], as well as charred plant remains [27,28,29,30]. A detailed study on soft tissue pyritization was published in [31]. Due to pyritization, some Proterozoic organisms lacking mineral skeleton are preserved [32,33]. Examples of pyritization of bacterial cells have been described [34,35,36,37,38]. There are isolated cases when pyrite begins to be replaced during the lifetime of foraminiferal shells living off the coast of Puerto Rico [39], and recent bivalve mollusks Mercenaria mercenaria (Linnaeus, 1758) and Geukensia demissa (Dillwyn, 1817) living in the marshes of Georgia (USA) [40]. In the case of the replacement of fossilized shells, not only the biogenic substance, but also the sedimentary rock inside the shell often undergoes pyritization (Figure 1c), i.e., pyritization is not selective.
Since the shell of trilobites, like other arthropods, most likely consisted of the polysaccharide chitin, this means that the structures of the chitin shell became a matrix for the growth of pyrite crystals. The same role is played by polymeric structures in fossil wood.
To what extent does the fossilized matrix influence the distribution of pyrite crystal orientations? It can be assumed that they can replace the fossil object maintaining the crystals orientation tending to isotropic, but the wood organic structures can act as an organizing matrix that increases the crystals ordering in the object. To find out how woody structures, consisting of organic polymers or charred, affect the increase of the pyrite crystal orientations ordering is the main goal of our study. It can only be carried out by analyzing and comparing the global crystallographic texture of pyrite that replaces and does not replace fossil wood. We do not consider other issues of wood pyritization, since they need to be given special attention, and this was not one of our tasks in this study.
Figure 1. Examples of fossils with a pyritized calcite skeleton. (a) Shell of brittle star Furcaster palaeozoicus (Stürtz, 1886), Bundenbach, Germany, Lower Devonian; (b,c) shell of the brachiopod Paraspirifer bownockeri (Steward, 1927), Ohio, USA, Middle Devonian. Red arrows show shell structures replaced by pyrite, green arrow shows host rock replaced by pyrite. Scale bar is 5 mm.
Minerals 13 01050 g001
The crystallographic texture is a set of crystalline orientations in a polycrystalline sample. Quantitative information about crystallographic texture is contained in measured pole figures that are two-dimensional distributions of relative volumes for specific crystallographic directions on a unit sphere [41]. The pole figure measurements have been developed for metals and alloys. At present, there is a great interest in the crystallographic texture study of biological samples [42,43,44,45,46,47,48,49,50,51,52]. It should be noted that only neutron measurements make it possible to measure the global texture (the entire object) of coarse-grained samples of centimeter size [42,43,44,45], in contrast to X-rays and electron backscatter diffraction (EBSD) methods [46,47,48,49,50,51,52]. It is possible because of a much greater penetration depth of neutrons in a sample material that yields non-destructive texture measurements.

2. Materials and Methods

Pyrite spherical nodules and pyritized wood were collected for the study from a sand quarry near the village Sukhochevo, Kromy district, Oryol region (Figure 2), Russia. The geological age of the finds is Middle Jurassic, Middle Callovian. The age was determined by the accompanying fauna [39]. The inner core of the gastropod mollusk Bellerophon sp. shell, collected in the deposits of the Middle Carboniferous, Moscovian Stage, Myachkovo Horizon, in the Domodedovo quarry (Russia, Moscow Region) was measured for comparison.
The morphological structure of the fossil wood and the pyrite nodules was studied using Skyscan 1172 and Neoscan N 80 X-ray microtomographs (Borissiak Paleontological Institute, Russian Academy of Science, PIN RAS). The latter were analyzed for the detection of biogenic inclusions, the presence of which would make the results unreliable. Microtomography was carried out using the following parameters: current, 37–104 mA; voltage, 100–110 kV; filters Al 1 mm (for nodules, wood, brachiopod shells), Cu 1 mm (for wood), step rotation 0.7°, rotation 180°.
The features of wood replacement with pyrite and elemental composition were studied using a Tescan/Vega2 scanning electron microscope with a microanalyzer without deposition in low vacuum.
The global crystallographic texture information was gained using pole figures measured by the neutron diffraction method at the SKAT (from Russian: Spektrometer Kolitshestvennovo Analiza Tekstury, Spectrometer for the Quantitative Analysis of Textures) facility [53,54] at the Frank Laboratory of Neutron Physics of the Joint Institute for Nuclear Research (Russia, Dubna). SKAT is situated on the 7A-2 beamline of the high flux pulsed nuclear reactor IBR-2 [55]. Periodic pulses of the IBR-2 reactor are obtained as a result of mechanical modulation of the neutron-producing reaction with a frequency of 5 Hz, so the time between pulses is 200 μs. The neutrons are slowed down by interaction with the water moderator, until they approach an approximate Maxwell velocity distribution with a maximum value in the desired range from 0.05 to 0.5 nm that is suitable for diffraction experiments. The pulse half-width of thermal neutrons is 340 μs at their average flux density from the moderator surface of 1013 neutrons/cm2 s. The time-of-flight method corresponding to pulsed sources with the abbreviation TOF finds excellent application in texture studies [42,43,44,45,56]. The principle of the TOF method is as follows. A “white” neutron pulse is incident on a sample through a neutron guide. Neutrons elastically scattered on the sample are recorded in the time channels of the analyzing device as they arrive depending on the wavelength. The time sweep of such a signal is the TOF diffraction pattern. Each pattern contains 3100-time channels with counted neutrons for each channel in case of the SKAT instrument. The total neutron flight time with a wavelength λ is t = L v = m h L λ , where L is the total flight distance from the neutron source to the detector (about 104 m for the SKAT instrument), v is the neutron velocity (about 2200 m/s for the thermal neutrons), m is the neutron mass, h is the Planck’s constant. Therefore, diffraction peaks are observed due to the Bragg condition λ = 2 d h k l sin ϑ in a detector located at an angle 2 ϑ with respect to the incident beam, in time channels corresponding to times t h k l = 2 m h L d h k l sin ϑ , where d h k l is the lattice spacing of the reflecting plane with Miller indices (hkl). In case of the SKAT diffractometer for any of 19 He3 detectors 2 ϑ = 90 ° . This is achieved by installing all detectors on a ring with a diameter of 2 m. Measurements at the same scattering angles lead to the same position of the same diffraction peaks for all detectors. Therefore, no intensity corrections when pole figure extracting from the patterns are required. The pole figures are extracted from diffraction patterns recorded from the sample at various positions given by the spherical angles ( χ , η ). A special goniometer is used for this, which makes it possible to rotate the sample in the neutron beam. The pattern for each sample position is recorded. The value of the pole density for a point on the pole figure is obtained by determining the integrated intensity of one reflection of this pattern. To measure the complete pole figures, the sample is rotated by means of a goniometer by 360° with a step of 5° about the horizontal axis located at 45° with respect to the incident neutron beam. Thus, 19 × 72 = 1368 diffraction patterns are measured for each sample. As one can see from Figure 3a, the detectors are not equally placed on the ring, but they are equally spaced on the line that is the intersection of the unit sphere and the Debye-Scherrer cone. The neutron beam cross section is 50 mm × 90 mm, which makes it possible to measure large samples up to 100 cm3. Due to the large penetration depth of neutrons, bulk samples of centimeter size can be investigated in transmission geometry. It should also be noted that there are no special requirements for the sample surface preparation for the experiment. The SKAT has a sufficiently high resolution of Δ d / d = 5 × 10 3 at d = 2.5 Å and 2 ϑ = 90 ° because of the long flight path (more than 100 m) as well as the presence of collimators in front of the detectors. Measurement time depends on the sample material scattering power and sample volume. In the case of pyrite pole figures the measurement time for one sample was about 22 h. It is necessary to note an important feature of the TOF method. The diffraction reflections corresponding to different pole figures are simultaneously present in the pattern. It means that several pole figures are recorded at the same time. The experiment is fully automated and controlled by a personal computer.
Pole figures characterize the relative volume of specific crystallographic direction measured in a sample coordinate system on the unit sphere. Thus, the relative intensities of the diffraction reflexes for different sample orientations are of interest for a texture diffraction experiment. It is possible to obtain the values of the pole densities at the same point for different pole figures by determining their intensities, since the TOF pattern contains several reflections. The intense isolated diffraction reflections in each of the 1368 recorded patterns were analyzed using the Pole Figure Extractor program [57,58]. The extracted pole figures are indexed according to corresponding diffraction reflex indices. To index these reflexes, theoretically calculated patterns are used.
The pole figures are presented on stereographic projections. The stereographic projection is obtained from the spherical one by means of sphere point projecting on the equatorial plane (Figure 3b). To project a point from the northern hemisphere, it should be connected by a line with the south pole. The intersection of the projecting line with the equatorial plane gives stereographic projection of this point.
Figure 3. The SKAT instrument: (a) scheme, (b) detectors arrangement on the sphere.
Minerals 13 01050 g003
The most commonly used way of contouring the orientation density in a pole figure is to draw lines of equal pole density, or equal intensity, as known from topographic or weather maps. Intensity lines, also called contour lines are curves that connect contiguous points of the same pole density. It is necessary to normalize the orientation densities to standard units for a comparison of pole figures of different samples. The commonly used convention is to express the data in multiples of a random orientation distribution (mrd), which means that the pole figure of a random standard sample would have intensity equal 1 mrd at all points. Pole figure regions with intensities higher than 1 mrd indicate that more lattice planes arrange in those directions than in a sample with random texture. The more ordered the crystals, the higher the intensity on the pole figure (pole density). An increase in pole figure intensity is interpreted as texture strengthening.
The approach for pole figures extraction based on a summation of the diffraction reflex intensities was selected because the peak/noise ratio for selected pyrite reflexes was not very high. The analysis was carried out according to the crystallographic texture maximum sharpness and the isolines pattern of the pyrite pole figures with the Miller indices (111) and (200). All pole figures presented in this paper were normalized and smoothed with the same parameter.
Let us explain the pole figure normalization and smoothing. Let y ( χ , η ) be the unit vector of a direction in the “sample coordinate system” [ χ , η are spherical coordinates of the vector], h ( ϑ , φ ) the unit vector of a direction described in the “crystal coordinate system” of a single crystal [ ϑ , φ are spherical coordinates of the vector], then pole figure function P h ( y ) gives the volume fraction of the sample for which the lattice plane normal h falls in various sample directions y . One can write the following expression for the isotropic distribution:
S 2 P h i s ( y ) d y = 4 π .
Then for an arbitrary distribution we will have:
S 2 P h ( y ) d y = A .
If we introduce normalized pole figure:
P h n o r m ( y ) = 4 π A P h ( y )
Then
S 2 P h n o r m ( y ) d y = 4 π .
We used smoothing in order to highlight the main elements and remove non-essential details on the pole figures. This was done by using the following procedure [59]:
P h s ( y * ) = j = 1 J w j P h i ( y j ) / j = 1 J w j
with weights
w j = exp ( ω j 2 / ω 0 2 )
where ω 0 is the half-width of the weight function or smoothing parameter and ω j is the angular distance between vectors y * and y j .
The pole figure errors are connected to different reasons. These are the approximation errors related to the instrumental resolution and the statistical errors related to the finite intensity of neutron source and the finite number of grains in a studied sample [60,61]. Besides that, the main influence of the error of the half-width determining of diffraction reflexes on the pole figure errors is found in [62,63].

3. Results

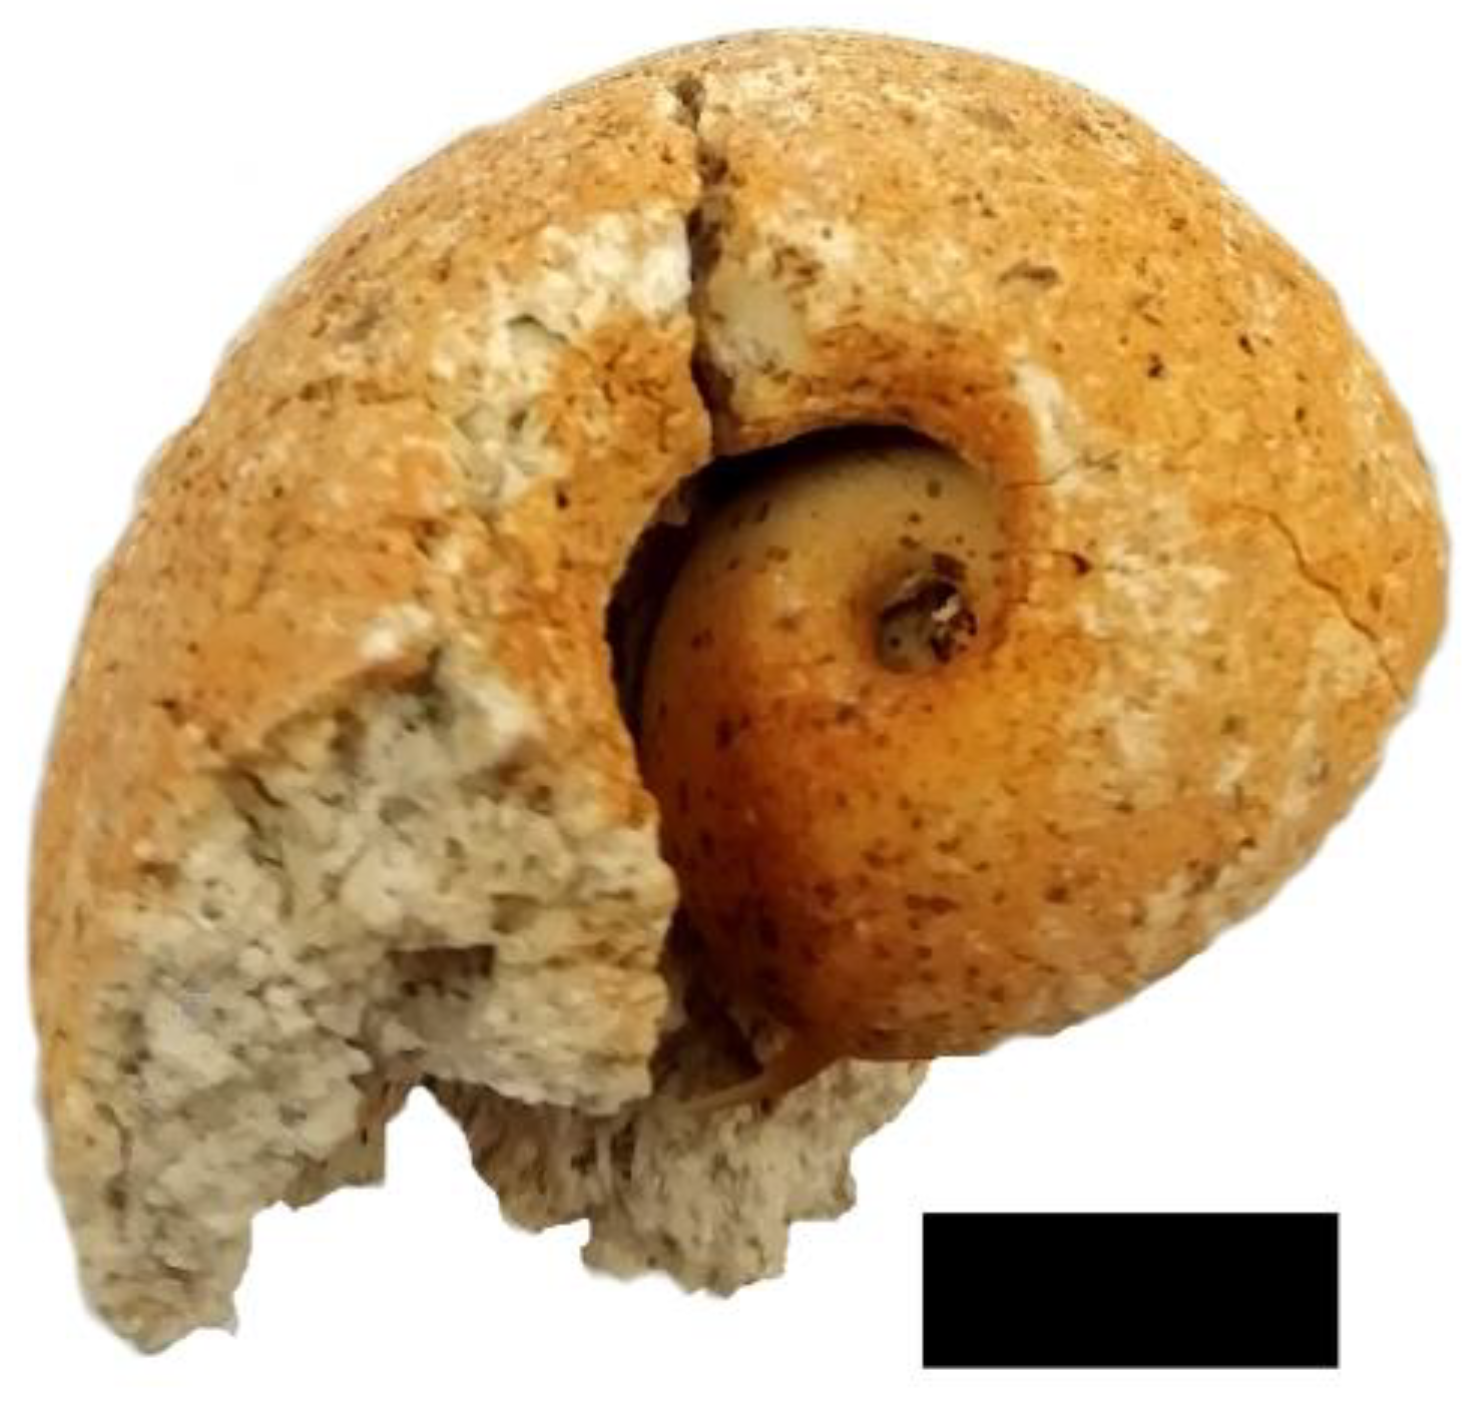
3.1. Wood Preservation

There are several variants of fossil wood remains in the locality, namely charred, pyritized, and silicified (Figure 4). Charred wood is found in large quantities (Figure 4g,h), in the form of small stumps and branches with a preserved structure of plant tissues. It is light, and quickly crumbles on air after drying. Since it is being washed out of the section, there was a question about its geological age. It was solved when pyritization was found in a number of fragments of charred wood (Middle Jurassic, Middle Callovian). That is, the replacement with pyrite occurs not according to some mineral that previously replaced the organic structures, but according to the original organic matter or already charred wood structures. It should also be noted that the processes of charring and pyritization occur under similar conditions of oxygen deficiency.

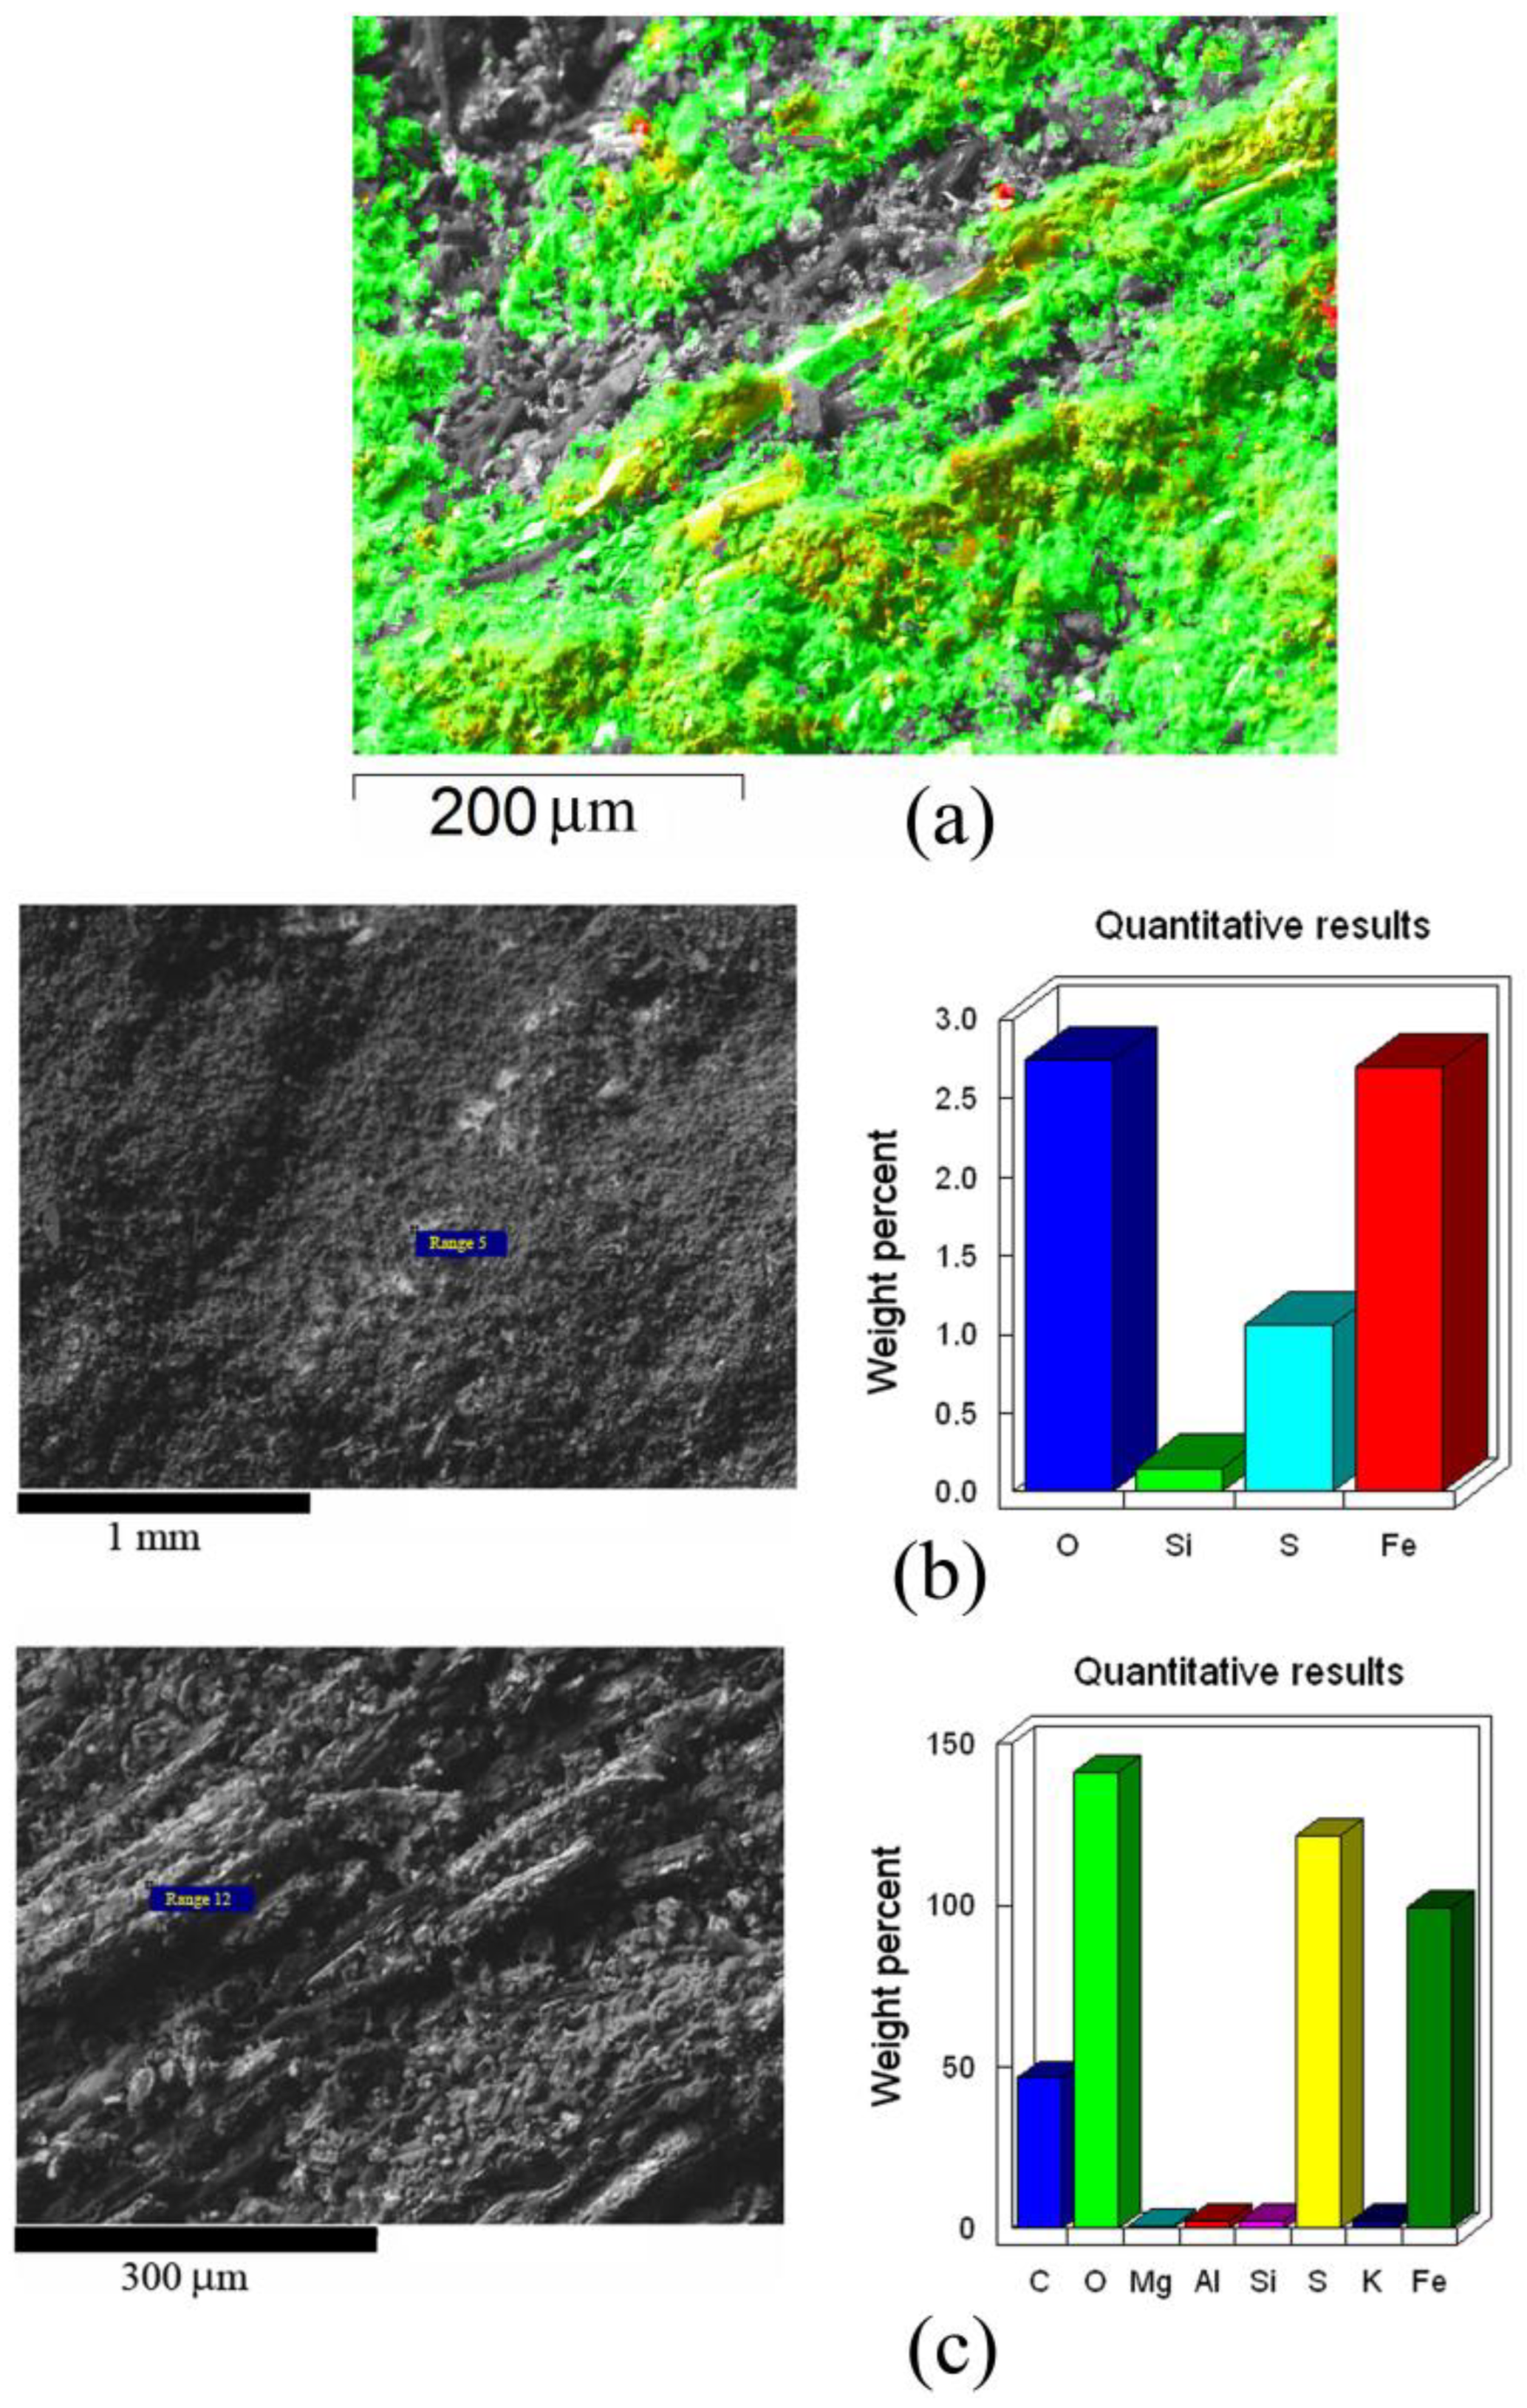
3.2. Microstructure and Distribution of Chemical Elements in Wood

Well preserved wood structures overgrown with mineral substance are clearly seen in Figure 5. Our further studies shown in Figure 6, Figure 7 and Figure 8 confirm that this is pyrite. Similar results, when pyrite was deposited on plant cell structures and in spaces between cells, were obtained during experimental pyritization [64]. The same was found on fossil pyritized plants Plataninium sp. In our case, pyrite forms large crystals (Figure 5e,f), which are also found in fossil plants [64,65]. Pyrite also forms fouling of woody structures in the form of a crust (Figure 5g,h).
The elemental composition is dominated by several chemical elements, namely oxygen, sulfur, iron, and silicon. The last one is presented in small quantities. At some points, carbon, magnesium, aluminum, and potassium were noted (Figure 6). Undoubtedly, the presence of sulfur and iron is associated with pyritization. It is possible that a significant amount of oxygen is associated with the oxidation of pyrite on air with the formation of sulfur and iron oxides, since all samples were washed out of the layer and collected in contact with oxygen. Carbon may be associated with the presence of charred areas of wood. The remaining elements may have come from terrigenous rocks, since woody remains are located in sandy-clayey deposits. There is a predominance of sulfur and iron on the elements map of one of the samples.
Figure 6. Elemental analysis of pyritized wood: (a) chemical elements map with green for iron, red for sulfur, yellow for a combination of iron and sulfur; (b,c) element contents at the certain points.
Minerals 13 01050 g006

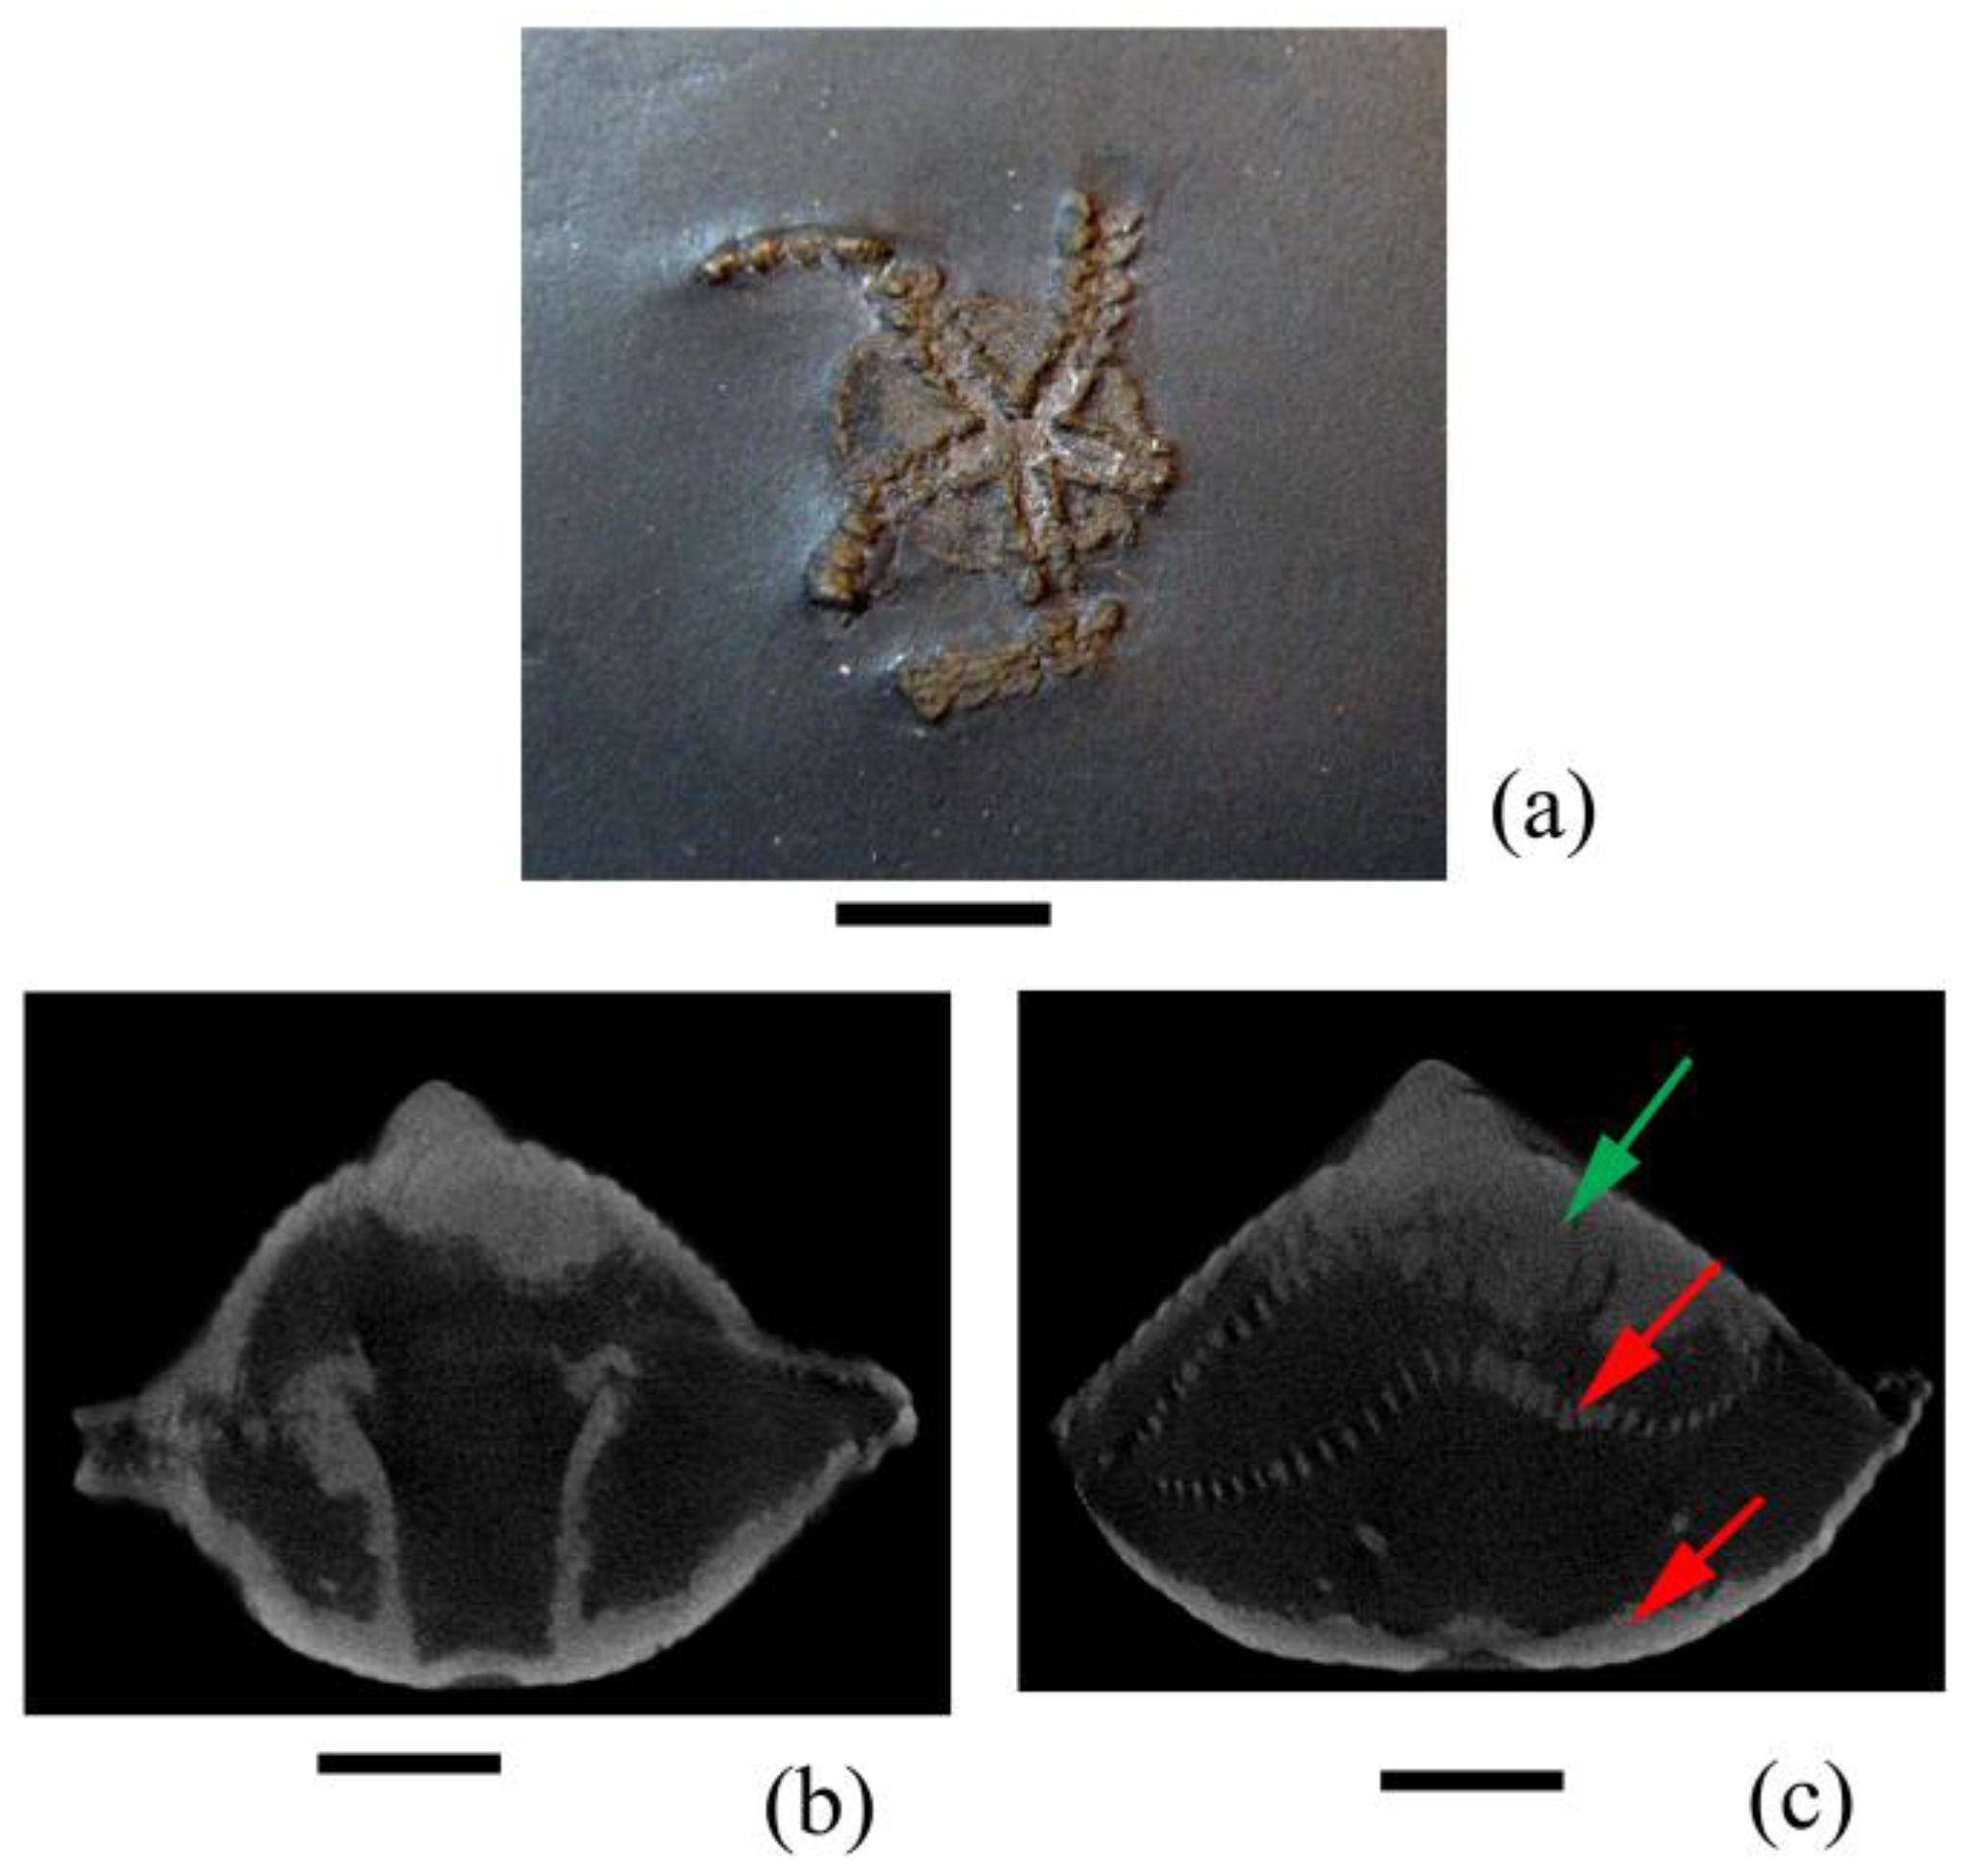
3.3. X-ray Microtomography of Pyritized Wood and Pyrite Nodules

The virtual sections show that the wood structures and the gaps between them are filled with pyrite, and small spaces rarely remain (Figure 7a–c). Nevertheless, wood rings stand out, between which clear boundaries are visible. The pyrite replacing wood and filling the space between woody structures is probably fine-grained. It does not form dense accumulations in the form of a continuous mass. Along with it, there is pyrite that forms ray-like inclusions or continuous denser masses (Figure 7a–c). Part of it is unlikely to be related to the replacement of wood. Such pyrite is wedged into it after the primary pyritization. One of the nodules was completely devoid of biogenic inclusions, while the second one contained an insignificant amount of wood fragments (Figure 7d).
Figure 7. Virtual sections (ac) of the pyritized wood and (d) pyrite nodules with small inclusions of wood. White arrows mark continuous dense pyrite masses, red arrow is the inclusion of wood in the pyrite nodule. Scale bar is 1 mm.
Minerals 13 01050 g007

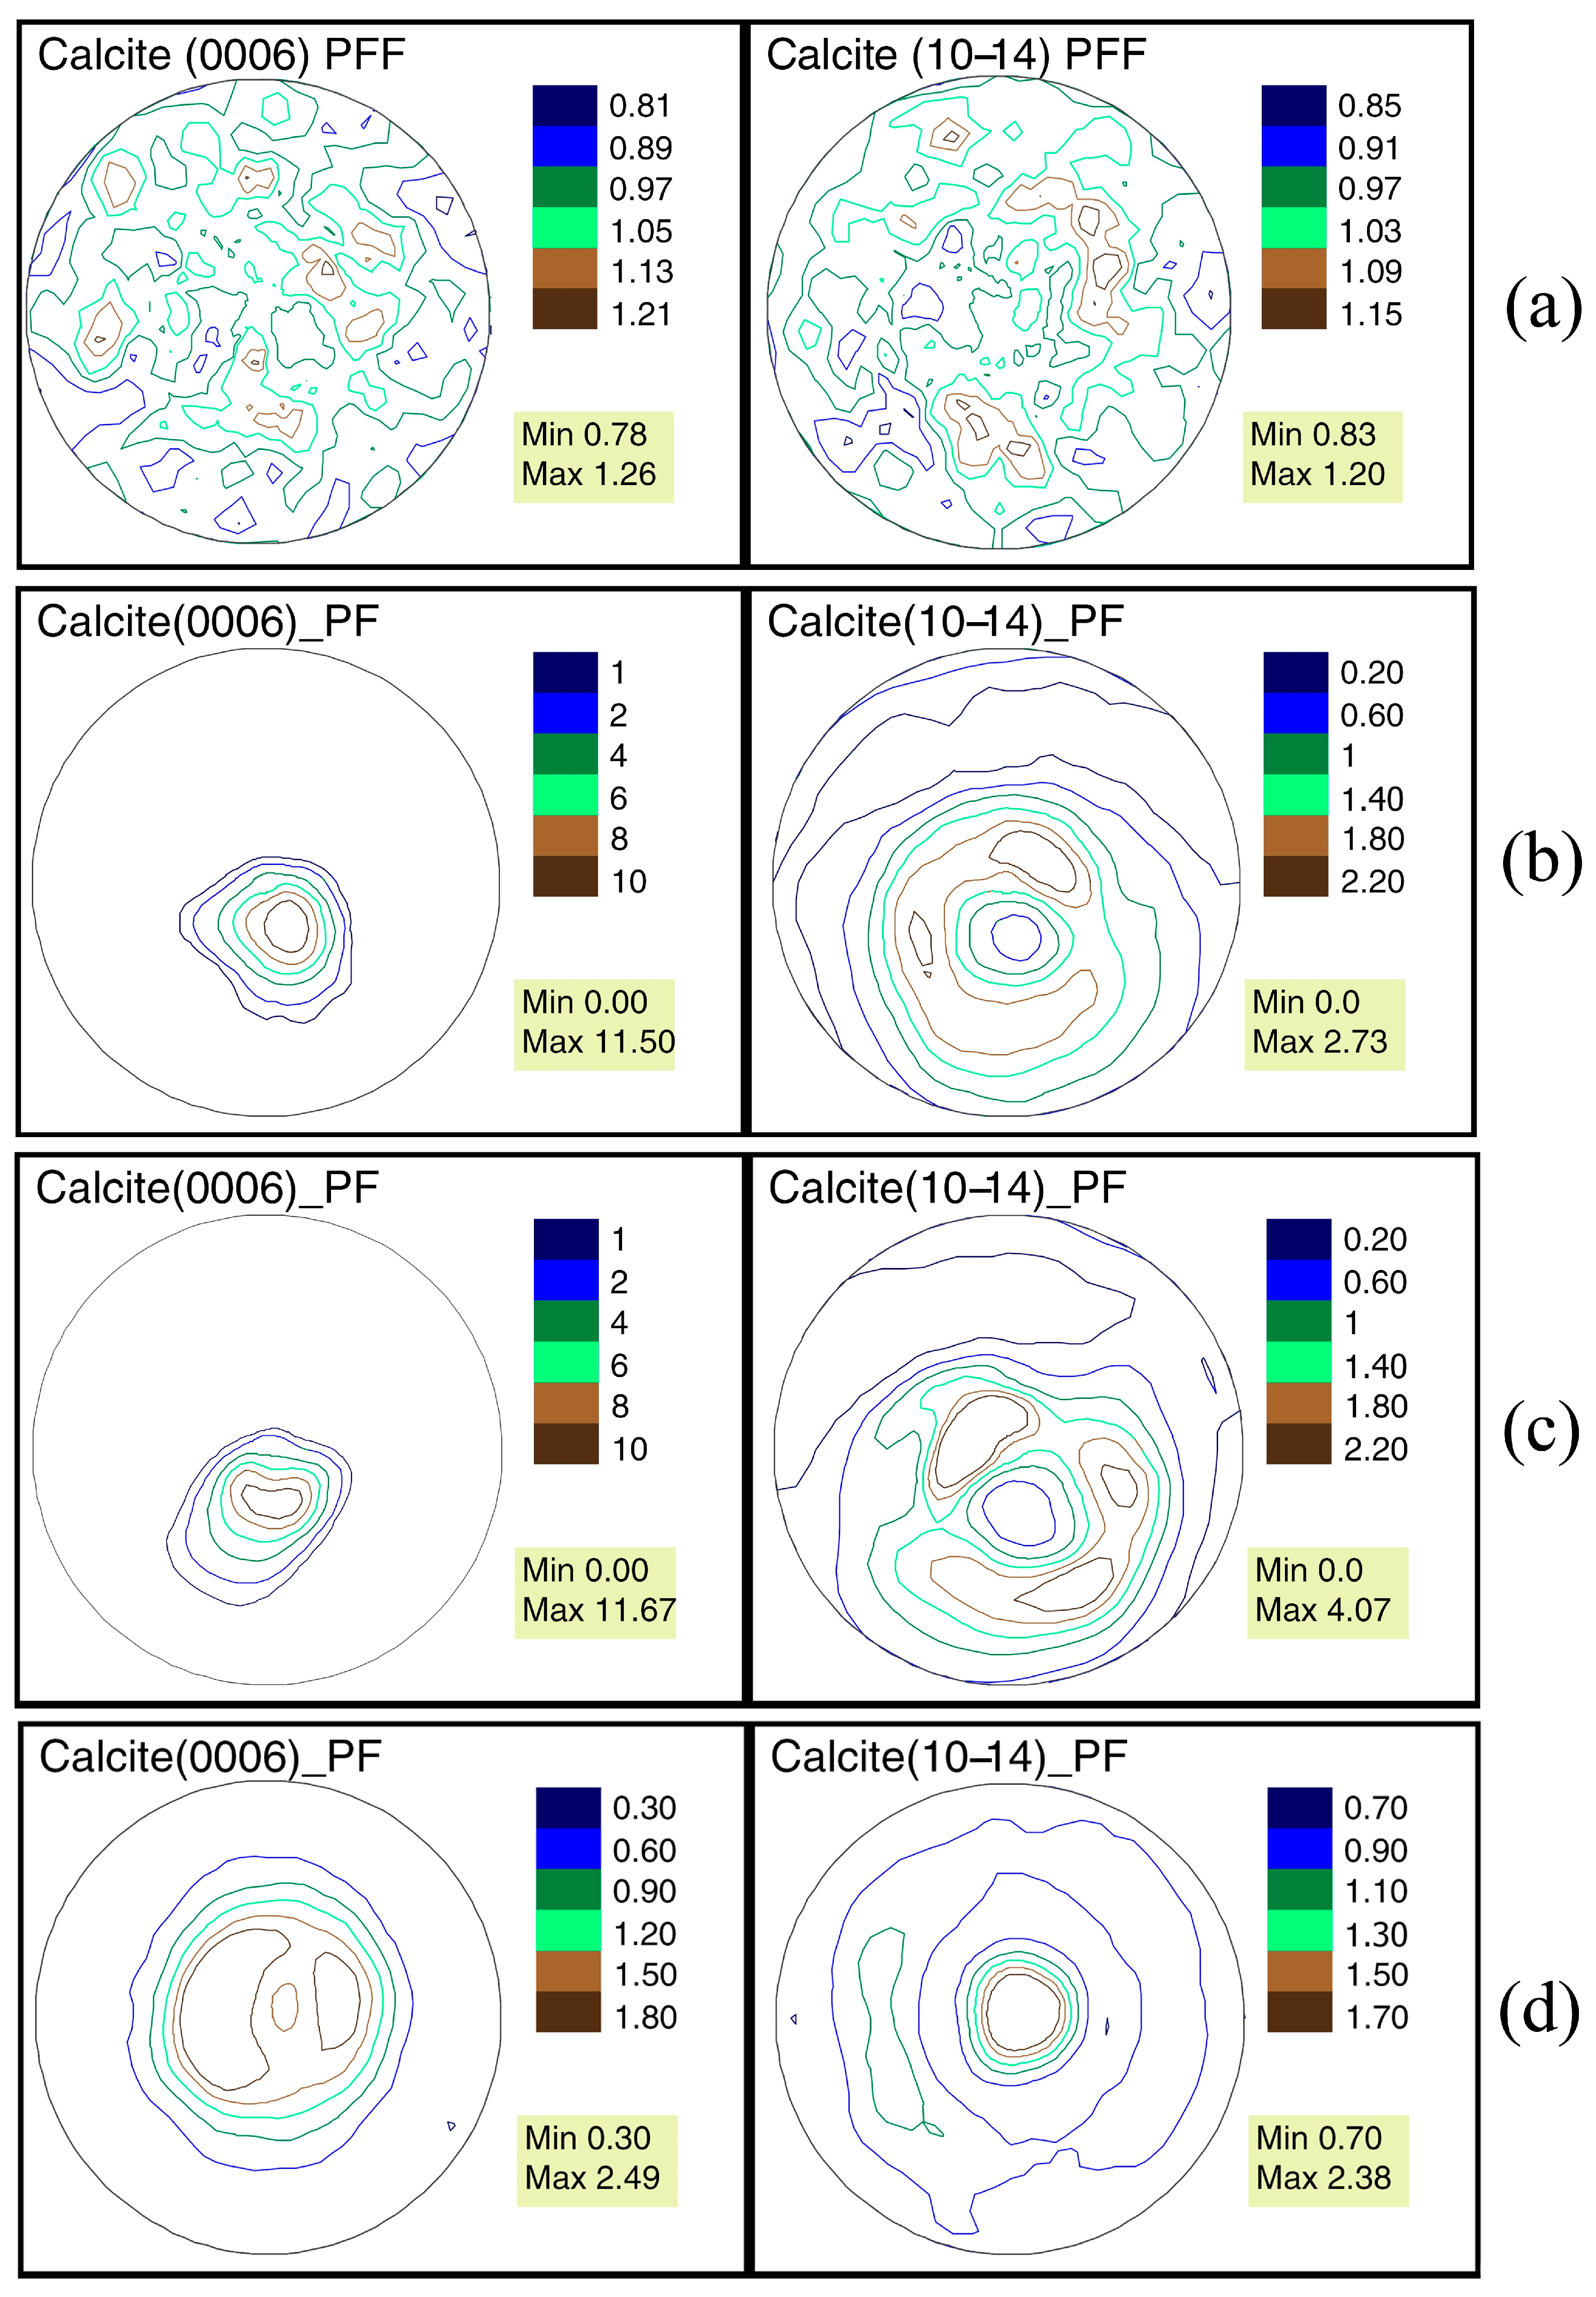
3.4. Global Crystallographic Texture of Pyrite

Pyrite is predominantly found in the studied wood sample. It has a cubic crystalline structure with space group Pa-3 (No.205, Supplementary File S1.CIF). The neutron TOF pattern (Figure 8a) shows diffraction reflections of this phase. The presence of quartz is not excluded, but in a small amount, not exceeding 2%. The patterns measured for nodules revealed reflections of pyrite and several other minerals (Figure 8b): black line is for the nodule marked as (d) in Figure 4, whereas red line is for the nodule marked as (e) in Figure 4. We placed indices above the diffraction reflections of the pyrite on the neutron TOF patterns presented in Figure 8. We did not aim for a detailed study of the phase composition of the nodules in this work. However, we were able to recognize the quartz in addition to pyrite in the nodules. Most likely, quartz comes from coarse-grained Jurassic sandstone, the grains of which are often cemented with pyrite. Wood and nodules are associated with these rocks.
Figure 8. The neutron TOF diffraction patterns: (a) for the pyritized wood, (b) for the pyrite nodules: black line is for the nodule marked as (d) in Figure 4; red line is for the nodule marked as (e) in Figure 4. The patterns are presented as dependences on the lattice spacing and on TOF channels.
Minerals 13 01050 g008
The pole figures (111) and (200) for the globular nodules and for the pyritized wood are presented in Figure 9.
In the first two cases, the orientation of the crystals on the (111) pole figure is close to isotropic. The sharpness of the crystallographic texture is not too volatile and is in the range of 1.22–1.25 mrd (Figure 9a,b). Maximum values of pole density are also small, in the range of 1.30–1.37 mrd on the (200) pole figure. The pyrite crystals of the wood turned out to be more ordered. The maximum values of pole density are 1.62 mrd for the (111) pole figure and 2.13 mrd for the (200) pole figure (Figure 9c). According to the isoline pattern, the nodule pole figures are distinguished by the presence of several small centers of texture peaks located in different parts of the pole figures. Their location is not repeated. The wood pyrite pole figures also have several peaks, but they take up more area on the figures. The isolines are much closer.

4. Discussion

It was revealed according to the data obtained that both fossil wood and nodules are dominated by pyrite. Using elemental analysis (Figure 6), we established that the wood sample consists mainly of iron and sulfur. It was revealed by neutron diffraction (Figure 8a) that the main substance of the wood sample is pyrite. We did not find areas corresponding to charred or silicified wood on microtomographic sections (Figure 7). Wood elements are clearly visible in the SEM images presented in Figure 5. Pyrite replaces them and covers the outside with crust, filling the space. Nodules do not contain large inclusions of biogenic origin, so they can be compared with each other and with fossil wood. Pyrite fills all the space between wood structures and replaces the structures themselves. At the same time, the mineral that fills the space is presented both in the form of large crystals and in the form of fine-crystalline crusts of various shapes. That is, in a wood sample, there are both crystals with arbitrary weakly ordered orientations and crystals that repeat the shape of biological structures. But can the repetition of the shape of a biogenic object affect the crystallographic texture? This issue can be considered using the example of calcite pole figures obtained for the inner core of the shell of the gastropod mollusk Bellerophon sp. from the Middle Carboniferous deposits of the Domodedovo quarry (Russia, Moscow region) (Figure 10).
The inner core is formed as a result of the postmortem filling of the mollusk shell with silt and its further mineralization. After that, the shell itself dissolves and its inner cast preserves the inner core. The sharpness of the crystallographic texture of the core is very low, which is close to isotropic, namely 1.26 mrd for the pole figure (0006) and 1.20 mrd for the pole figure (10–14). Several centers of the crystallographic texture sharpness are marked on both pole figures. The crystallographic texture of calcite of this object is very different from calcite of biological objects—shells of bivalve mollusks, according to the pattern of pole figure isolines and pole density maximum values. For example, for the recent Mytilus galloprovincialis Lamarck, 1819, the sharpness of the calcite crystallographic texture reached 11.67 mrd for the pole figure (0006) and 4.07 mrd for the pole figure (10–14). However, as follows from our experience, the sharpness of the calcite crystallographic texture for mollusk shells is lower in a large number of cases. For example, the maximum sharpness of the calcite crystallographic texture is only 2.53 mrd for the pole figure (0006) and 1.93 for the pole figure (10–14) for the bivalve mollusk Ostrea edulis L., 1758. But the pole figure isolines pattern, in both cases, is completely different from that observed for calcite in the inner core (Figure 11).
There are usually one or two dominant directions of crystal orientations that occupy a significant area of the pole figure. This pattern is also repeatable, that is, it is similar to calcite in the shells of the same species but living in different areas (Figure 11b,c). Compared to this, both the isoline pattern and the maximum sharpness of the calcite pole figures from the inner core of the Bellerophon sp. shell are significantly different from calcite of biogenic origin. That is, the shape of the shell that was repeated by the silt, further mineralized by calcite, did not affect the mineral crystallographic texture. Pyrite in the nodules and the fossil wood is more similar to abiogenic calcite in terms of pole figure isoline patterns and maximum sharpness. But despite the fact that it is also abiogenic in all cases, it differs in the fossil wood from pyrite in the nodules. It is more ordered, despite the fact that it replaces not only wood structures, but also the space between them. It differs both in the pattern of pole figure isolines and in maximum pole density sharpness.

5. Conclusions

Pyrite crystals replacing fossil wood turned out to be more ordered, which is observed both in the maximum sharpness of the crystallographic texture and in the pole figure isoline patterns. This means that organic or charred plant structures partially became a matrix for the growth of pyrite and influenced its crystal ordering. Thus, it can be assumed that a matrix of organic or other origin can be used for growing mineral crystals with an increased ordering of crystal orientations. The mineral substance of biogenic origin, for example, calcite of bivalve shells, has more ordered crystal orientations than abiogenic minerals. But even if it, or organic matter, is replaced by a secondary mineral, the ordering of the mineral crystals will be higher than in a rock of abiogenic origin. One can assume the origin of the studied objects by analyzing their crystallographic texture. It may also be useful in the search for mineral substance of biogenic origin.

Supplementary Materials

The following are available online at https://www.mdpi.com/article/10.3390/min13081050/s1. Supplementary File S1.CIF.

Author Contributions

Conceptualization, methodology, all authors; software, D.N., T.L.; formal analysis, all authors; writing—original draft preparation, A.P.; writing—review and editing, D.N., T.L.; investigation, visualization, all authors; project administration, T.L. All authors have read and agreed to the published version of the manuscript.

Funding

The APC was funded by the Joint Institute for Nuclear Research.

Data Availability Statement

The data supporting reported results can be obtained on request from the article authors.

Acknowledgments

The authors express their heartfelt thanks to S.V. Bagirov (PIN RAS) for some of the photos and Rakitov R.A. (PIN RAS) for help in working with the scanning electron microscope.

Conflicts of Interest

The authors declare no conflict of interest.

References

  1. Mustoe, G.E. Wood petrifaction: A new view of permineralization and replacement. Geosciences 2017, 7, 119. [Google Scholar] [CrossRef] [Green Version]
  2. Mustoe, G.E. Mineralogy of non-silicified wood. Geosciences 2018, 8, 85. [Google Scholar] [CrossRef] [Green Version]
  3. Glass, A. Pyritized tube feet in a protasterid ophiuroid from the Upper Ordovician of Kentucky, U.S.A. Acta Palaeontol. Pol. 2006, 51, 171–184. [Google Scholar]
  4. Morov, P.; Kuchera, Y. New data on the Upper Jurassic of the city Syzran based on the results of studying the Zavodskoye outcrop. Samar. Luka Probl. Reg. Glob. Ecol. 2012, 21, 139–147. (In Russian) [Google Scholar]
  5. Kizilstein, L.Y. Pyritization of fossil mollusk shells and some issues of hypergene sulfide formation. Lithol. Miner. 2006, 6, 635–641. (In Russian) [Google Scholar]
  6. Chernova, O.S.; Zhukovskaya, E.A. Biostratigraphic characteristics of deposits of the Yu-I horizon of the Krapivinskoe oil field. Izv. Tomsk. Polytech. Univ. 2010, 317, 122–127. [Google Scholar]
  7. Hagadorn, J.W.; Whiteley, T.; Nealson, K.H. 3D Imaging of Pyritized Soft Tissues in Paleozoic Konservat lagerstätten. Geol. Soc. Am. Abst. Progr. 2001, 33, 430–431. [Google Scholar]
  8. Manda, Š.; Štorch, P.; Slavik, L.; Fryda, J.; Křiž, J.; Tasaryova, Z. The graptolite, conodont and sedimentary record through the Late Ludlow Kozlowskii Event (Silurian) in the shale-dominated succession of Bohemia. Geol. Mag. 2012, 149, 507–531. [Google Scholar] [CrossRef]
  9. Botting, J.P.; Muir, L.A.; Sutton, M.D.; Barnie, T. Welsh gold: A new exceptionally preserved pyritized Ordovician biota. Geology 2011, 39, 879–882. [Google Scholar] [CrossRef]
  10. Efimov, V.M. Undora Paleontological Museum—20th Anniversary. In Nature of the Simbirsk Volga Region. Collection of Scientific Papers of the XII Interregional Scientific and Practical Conference “Natural Scientific Research in the Simbirsk-Ulyanovsk Region”; Ulyanovsk State University, Promotion Technologies Corporation Publishing House: Ulyanovsk, Russia, 2010; Issue 11, pp. 16–18. [Google Scholar]
  11. Loseva, E.I. On the question of the origin of outcasts (based on materials from the Tsilma river basin). Izv. Komi Branch All-Union Geogr. Soc. 1965, 10, 106–110. (In Russian) [Google Scholar]
  12. Malenkina, S.Y. Phosphatized microfossils of the Late Jurassic of the East European Platform. News Paleontol. Stratigr. Suppl. J. Geol. Geophys. 2008, 10–11, 242–247. (In Russian) [Google Scholar]
  13. Afanas’eva, M.S.; Amon, E.O.; Boltovskoy, D. Ecology and biogeography of radiolarians: A new look at the problem. Part 1. Ecology and taphonomy. Lithosphere 2005, 3, 31–56. [Google Scholar]
  14. Kaczmarska, I.; Ehrman, J.M. Pyritized diatoms in the sediments at the distal end of the Bengal fan. Proc. Ocean Drill. Prog. Sci. Results 1990, 116, 243–247. [Google Scholar]
  15. Harwood, D.M.; Gersonde, R. Lower Cretaceous diatoms from ODP LEG 113 SITE 693 (Weddell Sea). Part 2: Resting spores, chrysophycean cysts, and endoskeletal dinoflagellate, and notes on the origin of diatoms. Proc. Ocean Drill. Prog. Sci. Results 1990, 113, 403–425. [Google Scholar]
  16. Thyberg, B.I.; Stabell, B.; Faleide, J.l.; Bjørlykke, K. Upper Oligocene diatomaceous deposits in the northem North Sea—Silica diagenesis and paleogeographic implications. Norsk Geol. Tidsskr. 1999, 79, 3–18. [Google Scholar] [CrossRef]
  17. Farrell, U.C.; Martin, M.J.; Hagadorn, J.W.; Whiteley, T.; Briggs, D.E.G. Beyond Beecher’s Trilobite Bed: Widespread pyritization of soft tissues in the Late Ordovician Taconic foreland basin. Geology 2009, 37, 907–910. [Google Scholar] [CrossRef]
  18. Briggs, D.E.G.; Bottrell, S.; Raiswell, R. Pyritization of soft-bodied fossils: Beecher’s Trilobite Bed, Upper Ordovician. N. Y. State Geol. 1991, 19, 1221–1224. [Google Scholar] [CrossRef]
  19. Bjerreskov, M. Discoveries on graptolites by X-ray studies. Acta Palaeontol. Pol. 1978, 23, 463–470. [Google Scholar]
  20. Loydell, D.K.; Orr, P.J.; Kearns, S. Preservation of soft tissues in Silurian graptolites from Latvia. Palaeontology 2004, 47, 503–513. [Google Scholar] [CrossRef]
  21. Page, A.; Meinhold, G.; Le Heron, D.P.; Elgadry, M. Normalograptus kufraensis, a new species of graptolite from the western margin of the Kufra Basin, Libya. Geol. Mag. 2013, 150, 743–755. [Google Scholar] [CrossRef] [Green Version]
  22. Wang, B.; Zhao, F.; Zhang, H.; Fang, Y.; Zheng, D. Widespread pyritization of insects in the Early Cretaceous Jehol biota. Palaios 2012, 27, 707–711. [Google Scholar] [CrossRef]
  23. Südkamp, W.H. Discovery of soft parts of a fossil brachiopod in the “Hunsrückschiefer” (Lower Devonian, Germany). Paläontol. Zeit. 1997, 71, 91–95. [Google Scholar] [CrossRef]
  24. Farrell, U.C.; Briggs, D.E.G. A pyritized polychaete from the Devonian of Ontario. Proc. R. Soc. B 2007, 274, 499–504. [Google Scholar] [CrossRef] [PubMed]
  25. Högström, A.E.S.; Briggs, D.E.G.; Bartels, C. A pyritized lepidocoleid machaeridian (Annelida) from the Lower Devonian Hunsrück slate, Germany. Proc. R. Soc. B 2009, 276, 1981–1986. [Google Scholar] [CrossRef] [PubMed]
  26. Balinski, A.; Sun, Y. Preservation of Soft Tissues in an Ordovician Linguloid Brachiopod from China. Acta Palaeontol. Pol. 2013, 58, 115–120. [Google Scholar] [CrossRef]
  27. Manukovsky, S.V.; Mizin, A.I. Middle Devonian sedimentation environments on the Voronezh anteclise. Bull. Voronezh Univ. Ser. Geol. 2007, 2, 50–52. (In Russian) [Google Scholar]
  28. Akhlestina, E.F.; Moskovsky, G.A. Post-salt Mesozoic-Cenozoic deposits of the Gremyachinsky potassium salt deposit. Izv. Saratov. Univ. Ser. Earth Sci. 2008, 8, 50–55. [Google Scholar]
  29. Zhukova, E.V. Jurassic sedimentation cycles in the formation of natural reservoirs of the Vilyui syneclise. Neftegaz. Geol. Theory Pract. 2014, 9, 1–12. Available online: http://www.ngtp.ru/rub/4/2_2014.pdf (accessed on 3 August 2023). (In Russian).
  30. Zvonarev, A.E. Minerageny of the Aptian stage of the Lipetsk region. Bull. Voronezh Univ. Ser. Geol. 2008, 2, 54–73. (In Russian) [Google Scholar]
  31. Farrell, U.C. Pyritization of soft tissues in the fossil record: An overview. Paleontol. Soc. Pap. 2014, 20, 33–58. [Google Scholar] [CrossRef]
  32. Cai, Y.; Hua, H.; Xiao, S.; Schiffbauer, J.D.; Li, P. Biostratinomy of the Late Ediacaran Gaojiashan lagerstätte from Southern Shaanxi, South China: Importance of event deposits. Palaios 2010, 25, 487–506. [Google Scholar] [CrossRef]
  33. Wacey, D.; McLoughlin, N.; Kilburn, M.R.; Saunders, M.; Cliff, J.B.; Kong, C.; Barley, M.E.; Brasier, M.D. Nanoscale analysis of pyritized microfossils reveals differential heterotrophic consumption in the ~1.9-Ga Gunflint chert. Proc. Nalt. Acad. Sci. USA 2013, 110, 8020–8024. [Google Scholar] [CrossRef]
  34. Schieber, J. The role of an organic slime matrix in the formation of pyritized burrow trails and pyrite nodules. Palaios 2002, 17, 104–109. [Google Scholar] [CrossRef]
  35. Powel, W.G.; Johnston, P.A.; Collom, C.J. Geochemical evidence for oxygenated bottom waters during deposition of fossiliferous strata of the Burgess Shale Formation. Palaeogeogr. Palaeoclimat. Palaeoecol. 2003, 201, 249–268. [Google Scholar] [CrossRef]
  36. Folk, R.L. Nannobacteria and the formation of framboidal pyrite: Textural evidence. J. Earth Syst. Sci. 2005, 114, 369–374. [Google Scholar] [CrossRef]
  37. Machulina, S.A. Geological conditions for the formation of the “black smoker” in the Donbass. Dopovidi Natl. Acad. Sci. Ukr. 2008, 12, 107–110. (In Russian) [Google Scholar]
  38. Lukin, A.E. Black shale formations of the Euxinian type—Megatraps of natural gas. Geol. Miner. Resour. World Ocean. 2013, 4, 5–28. (In Russian) [Google Scholar]
  39. Seiglie, G.A. Pyritization in living foraminifers. J. Foram. Res. 1973, 3, 1–6. [Google Scholar] [CrossRef]
  40. Clark, G.R.; Lutz, R.A. Pyritization in the shells of living bivalves. Geology 1980, 8, 268–271. [Google Scholar] [CrossRef]
  41. Bunge, H.J. Texture Analysis in Material Science. Mathematical Methods; Butterworths Publ.: London, UK, 1982; p. 595. [Google Scholar]
  42. Pakhnevich, A.; Nikolayev, D.; Lychagina, T. Crystallographic Texture of the Mineral Matter in the Bivalve Shells of Gryphaea dilatata Sowerby, 1816. Biology 2022, 11, 1300. [Google Scholar] [CrossRef]
  43. Nikolayev, D.I.; Lychagina, T.A.; Pakhnevich, A.V. Experimental neutron pole figures of minerals composing bivalve mollusk shells. Springer Nat. Appl. Sci. 2019, 1, 344. [Google Scholar] [CrossRef] [Green Version]
  44. Pakhnevich, A.; Nikolayev, D.; Lychagina, T.; Balasoiu, M.; Ibram, O. Global Crystallographic Texture of Freshwater Bivalve Mollusks of the Unionidae Family from Eastern Europe Studied by Neutron Diffraction. Life 2022, 12, 730. [Google Scholar] [CrossRef] [PubMed]
  45. Nekhoroshkov, P.; Zinicovscaia, I.; Nikolayev, D.; Lychagina, T.; Pakhnevich, A.; Yushin, N.; Bezuidenhout, J. Effect of the elemental content of shells of the bivalve mollusks (Mytilus galloprovincialis) from Saldanha Bay (South Africa) on their crystallographic texture. Biology 2021, 10, 1093. [Google Scholar] [CrossRef] [PubMed]
  46. Ouhenia, S.; Chateigner, D.; Belkhir, M.A.; Guilmeau, E. Microstructure and crystallographic texture of Charonia lampas lampas shell. J. Struct. Biol. 2008, 163, 175–184. [Google Scholar] [CrossRef] [PubMed]
  47. Chateigner, D.; Kaptein, R.; Dupont-Nivet, M. X-ray quantitative texture analysis on Helix aspersa aspera (Pulmonata) shells selected or not for increased weight. Am. Malac. Bull. 2009, 27, 157–165. [Google Scholar] [CrossRef]
  48. Frýda, J.; Klicnarová, K.; Frýdová, B.; Mergl, M. Variability in the crystallographic texture of bivalve nacre. Bull. Geosci. 2010, 85, 645–662. [Google Scholar] [CrossRef] [Green Version]
  49. Hahn, S.; Rodolfo-Metalpa, R.; Griesshaber, E.; Schmahl, W.W.; Buhl, D.; Hall-Spencer, J.M.; Baggini, C.; Fehr, K.T.; Immenhauser, A. Marine bivalve shell geochemistry and ultrastructure from recent low pH environments: Environmental effect versus experimental bias. Biogeosciences 2012, 9, 1897–1914. [Google Scholar] [CrossRef] [Green Version]
  50. Fitzer, S.C.; Phoenix, V.R.; Cusack, M.; Kamenos, N.A. Ocean acidification impacts mussel control on biomineralization. Sci. Rep. 2014, 4, 6218. [Google Scholar] [CrossRef] [Green Version]
  51. Kučeráková, M.; Rohlicek, J.; Vratislav, S.; Jarosova, M.; Kalvoda, L.; Lychagina, T.; Nikolayev, D.; Douda, K. Texture and element concentration of the freshwater shells from the Unionidae family collected in the Czech Republic by X-ray, neutron and electron diffraction. Crystals 2021, 11, 1483. [Google Scholar] [CrossRef]
  52. Kucerakova, M.; Rohlicek, J.; Vratislav, S.; Nikolayev, D.; Lychagina, T.; Kalvoda, L.; Douda, K. Texture Study of Sinanodonta woodiana Shells by X-ray Diffraction. J. Surf. Investig. X-ray Synchrotron Neutron Tech. 2021, 15, 640–643. [Google Scholar] [CrossRef]
  53. Keppler, R.; Ullemeyer, K.; Behrmann, J.H.; Stipp, M. Potential of full pattern fit methods for the texture analysis of geological materials: Implications from texture measurements at the recently upgraded neutron time-of-flight diffractometer SKAT. J. Appl. Crystallogr. 2014, 47, 1520–1534. [Google Scholar] [CrossRef]
  54. Lychagina, T.A.; Nikolayev, D.I.; Balasoiu, M.; Nicu, M.; Ionascu, L.; Dragolici, A.C.; Dragolici, F. Aging studies of low ph cement-based materials used for aluminum radioactive waste conditioning. Rom. J. Phys. 2019, 64, 802. [Google Scholar]
  55. Shvetsov, V.N. Neutron Sources at the Frank Laboratory of Neutron Physics of the Joint Institute for Nuclear Research. Quantum Beam Sci. 2017, 1, 6. [Google Scholar] [CrossRef] [Green Version]
  56. Feldman, K. Texture Investigation by Neutron Time-of-Flight Diffraction. Textures Microstruct. 1989, 10, 309–323. [Google Scholar] [CrossRef] [Green Version]
  57. Nikolayev, D.I.; Lychagina, T.A.; Nikishin, A.V.; Yudin, V.V. Investigation of measured pole figures errors. Mater. Sci. Forum 2005, 495–497, 307–312. [Google Scholar] [CrossRef]
  58. Nikolayev, D.I.; Lychagina, T.A.; Nikishin, A.V.; Yudin, V.V. Study of error distribution in measured pole figures. Solid State Phenom 2005, 105, 77–82. [Google Scholar] [CrossRef]
  59. Nikolayev, D.I.; Ullemeyer, K. A Note on Preprocessing of Diffraction Pole Density Data. J. Appl. Cryst. 1994, 27, 517–520. [Google Scholar] [CrossRef]
  60. Mücklich, K.; Klimanek, P. Experimental errors in quantitative texture analysis from diffraction pole figures. Mater. Sci. Forum 1994, 157–162, 275–286. [Google Scholar] [CrossRef]
  61. Luzin, V.V.; Nikolayev, D.I. On the errors of the experimental pole figures. Textures Microstruct. 1996, 25, 121–128. [Google Scholar] [CrossRef]
  62. Nikolayev, D.I.; Lychagina, T.A. Investigation of Experimental Pole-Figure Errors by Simulation of Individual Spectra. Crystallogr. Rep. 2007, 52, 774–780. [Google Scholar]
  63. Lychagina, T.A.; Nikolayev, D.I.; Wagner, F. Using Individual Spectra Simulation for the Study of Pole Figures Errors. Texture Stress Microstruct. 2009, 2009, 237485. [Google Scholar] [CrossRef] [Green Version]
  64. Grimes, S.T.; Brock, F.; Rickard, D.; Davies, K.L.; Edwards, D.; Briggs, D.E.G.; Parkes, R.J. Understanding fossilization: Experimental pyritization of plants. Geology 2001, 29, 123–126. [Google Scholar] [CrossRef]
  65. Grimes, S.T.; Davies, K.L.; Butler, I.B.; Brock, F.; Edwards, D.; Rickard, D.; Briggs, D.E.G.; Parkes, R.J. Fossil plants from the Eocene London Clay: The use of pyrite textures to determine the mechanism of pyritization. J. Geol. Soc. 2002, 159, 493–501. [Google Scholar] [CrossRef]
Figure 2. Map with a mark of the location of the pyritized wood and pyrite nodules (coordinates 52.690797°, 35.896452°).
Minerals 13 01050 g002
Figure 4. Pyrite nodules and wood with different fossilization features: (ac) pyritized wood; (d,e) pyrite nodules; (f) silicified wood; (g,h) charred wood in the quarry. Russia, Oryol region, Kromy district, Sukhochevo village, sand pit, Middle Jurassic, Middle Callovian stage, Middle substage. Scale bar is 1 cm.
Minerals 13 01050 g004
Figure 5. SEM images of pyritized wood: (ad) wood appearance. Red arrows show wood structures; (e,f) wood with large pyrite crystals marked by green arrows; (g,h) structural elements of wood covered with fine-grained pyrite; Russia, Oryol region, Kromy district, Sukhochevo village, sand quarry, Middle Jurassic, Callovian stage, Middle substage.
Minerals 13 01050 g005
Figure 9. The pyrite pole figures of (a) nodule marked as (d) in Figure 4, (b) nodule marked as (e) in Figure 4, (c) fossil wood.
Minerals 13 01050 g009
Figure 10. The inner core external view of the gastropod mollusk Bellerophon sp. shell composed of limestone. Scale bar is 1 cm.
Minerals 13 01050 g010
Figure 11. Calcite pole figures (a) of the inner core of the gastropod Bellerophon sp. shell; calcite pole figures of recent bivalve mollusks Mytilus galloprovincialis: (b) coast of the Kazantip Bay (Sea of Azov, Crimea Peninsula) opposite the village Pesochnoe, (c) Black Sea, coast of Romania; (d) calcite pole figures of the recent bivalve Ostea edulis, coast of Portugal, Lagos.
Minerals 13 01050 g011
Disclaimer/Publisher’s Note: The statements, opinions and data contained in all publications are solely those of the individual author(s) and contributor(s) and not of MDPI and/or the editor(s). MDPI and/or the editor(s) disclaim responsibility for any injury to people or property resulting from any ideas, methods, instructions or products referred to in the content.

