Abstract
Geochemical studies of rare earth elements (REEs) as well as major and trace elements were conducted on the beach placer sands from the Kanyakumari coastal region, a well-known high background natural radiation area (HBNRA). For the first time, uranium isotope ratios (234U/238U and 235U/238U) were determined in the study area to investigate the provenance and leaching of U from the beach sands. Inductively coupled plasma mass spectrometry was used for the measurement of REEs and trace elements whereas thermal ionization mass spectrometry (TIMS) was used for the measurement of U isotope ratios. ∑REEs were found to be in the range of 778.93 to 15,007. 54 µg/g, whereas ∑Light REEs were in the range of 770.58 to 14,860.80 µg/g and ∑Heavy REEs varied from 8.35 to 146.74 µg/g. The enrichment factor showed the LREEs Th and U were extremely enriched in the Kanyakumari beach placer sands. The 235U/238U isotope ratios were similar to the natural terrestrial ratio value. The 234U/238U activity ratio varied from 0.995 to 1.071, and showed the prevailing secular equilibrium among them. The δ238U results could, to some extent, explain the U fractionation and source.
1. Introduction
Geochemical properties of rare earth elements (REEs) are particularly useful tools for better understanding of the mobilization of elements during weathering and the redistribution of elements [1,2]. The unique and main attraction of using REEs to study geochemical problems is that they form a coherent group whose chemical properties change systematically across the series. The lanthanide contraction leads to a systematic variation of REEs in partitioning between the magmatic melts and crystals, with coexisting liquids of different compositions. The partition of REEs into a melt under upper mantle conditions decreases with decreasing ionic radius. Thus, the upper mantle shows depleted light REEs (LREEs) from La to Gd whereas it is vice-versa in the case of the continental crust and this renders the REEs useful in understanding crustal evolutionary history [3,4].
During weathering, the REEs are highly mobilized as a group under acidic pH conditions and are precipitated or absorbed by hydroxides under neutral or alkali pH conditions [5]. The strongly depleted heavy REEs (HREEs) pattern relative to shale has been observed in river-borne sediments and also a negative Eu anomaly has been observed in intensely weathered sediments. The Eu anomaly in sediments is important for understanding the nature of source and has been explained in detail elsewhere [6,7]. However, the physical sorting will affect the REE chemistry; thus, REE patterns of sediments with all granulometric grades will closely represent the source provided the source region undergoes moderate chemical weathering [8]. During a nuclear fission reaction, some REE isotopes also occur as radionuclides and can be found in nuclear waste or in the fallout of nuclear accidents [9]. The naturally occurring REEs are not found in pure metal form but in the form of minerals such as phosphates, silicates, carbonates, oxides, and halides [10].
The importance and applications of REEs has increased tremendously, since they are being used in many types of electronic devices, satellite, radar systems, electrical vehicles, and many more technological applications [11]. Bastnaesite (a fluorocarbonate), xenotime (yttrium phosphate), and monazite (a thorium-bearing phosphate) are the principal sources of REE around the globe. REEs occur in minor quantities in the Earth’s crust and occur abundantly in the form of beach placer deposits in India. Beach placer deposits are formed by weathering of hinterland rocks, eroded and deposited in the coastal environment by rivers and streams which are then redistributed by the action of waves [12]. Monazite [(Ce, La, Nd, Th) PO4] is the principal source of REEs and thorium which occurs as a beach placer deposit along several coasts of India. The estimated resource of monazite in beach and inland placer deposits was 12.5 million tons in India as of 2016. The coastal regions of Andhra Pradesh (3.69 million tons), Odisha (3.06 million tons), Tamil Nadu (2.46 million tons), Kerala (1.84 million tons), and West Bengal (1.20 million tons) are well-known for their monazite reserves [13].
The Manavalakurichi beach placer deposit of the Kanyakumari district in Tamil Nadu is one of the major beach placer deposits containing monazite. The Indian Rare Earth Limited (IREL), a Government of India undertaking company under the Department of Atomic Energy (DAE), has been mining the Manavalakurichi beach placer sands for REEs since 1950. As per the Indian Minerals Yearbook 2019 of Indian Bureau of Mines, about 6000 tons per year of monazite (96% pure) has been separated from the IREL installed at the Manavalakurichi of the Kanyakumari district. Since monazite is a thorium-bearing radioactive mineral, several studies have been conducted on the distribution of natural radionuclides such as 40K, 232Th, and 238U along the coast of the Kanyakumari high background natural radiation area (HBNRA) [14,15,16,17,18,19].
Uranium (U) is the heaviest naturally occurring element and has three naturally occurring radioisotopes 234U, 235U, and 238U with isotopic abundances of 0.0054%, 0.720%, and 99.275%. The 235U/238U isotope ratio has fundamental implications in geochronology, geochemistry, cosmochemistry, nuclear physics, and nuclear energy [20]. The natural terrestrial value of 0.0000548 and 0.00725 for 234U/238U and 235U/238U isotope ratios are expected in the natural samples containing U [21]. 234U is often found to be in secular equilibrium with 238U; however, variations have been observed in groundwater, ocean, lakes, rivers, and soil due to preferential leaching of 234U [22,23,24]. The relationship between 234U/238U activity ratio vs. Th/U ratio and chemical index of alteration (CIA) suggests the leaching of 234U from the Odisha HBNRA soils which could potentially increase the U concentration in the groundwater [25]. The 235U/238U ratio has been attributed to understand the oxidation–reduction processes in the environment, and leaching of U during continental weathering and magmatic processes [26,27,28]. U commonly occurs in two redox states in nature, U (IV) and U (VI). Under oxidizing conditions in the marine environment, U (VI) is mobile, forming soluble complexes primarily with carbonate and phosphate, whereas in a reducing environment, U occurs in a tetravalent U (IV) state, forming relatively insoluble complexes with hydroxides, hydrated fluorides, and phosphates. Under these conditions, uranium is fixed in the beach sands and becomes enriched [29,30,31]. Thus, a possible U fractionation at the Earth’s surface can occur and may be a useful tool in the environmental sciences [32,33].
The results of 234U/238U and 235U/238U isotope ratios on the beach placer deposits of Kanyakumari are lacking. In order to understand the geochemical origin of REE-enriched beach sands, this study applies the combination of geochemistry of major oxides and rare earth elements with U isotope ratios on the selected samples along the coastal region of Kanyakumari HBNRA.
2. Study Area
The study was conducted on the beach sands collected from the Kanyakumari coastal region. A total of 7 sampling stations within latitude N 8.17672 to 8.23725 and longitude E 77.1709 to 77.7436 were selected, 6 from Kanyakumari coast and 1 from the coast of neighboring district Tirunelveli as a control (Figure 1). Kanyakumari is on the terrain of the Trivandrum Granulite Block (TB) and Nagercoil Granulites (NG), which lies immediate south of the Achankovil Shear Zone (ACSZ) of the Southern Granulite Terrain (SGT). The TB is a vast supracrustal-dominated terrain with metapelites (garnet-biotite gneiss), khondalites (garnet-biotite-sillimanite ± cordierite granulite) and charnockites with a few syenite bodies [34]. NG at the southernmost tip of the Indian Peninsula has an acid to intermediate charnockites of calc-alkaline affinity and the granulites are tonalite to granodiorite in composition with >5 m bands of mafic granulites and <50 cm wide mafic dykes; the major mineral phases of these rocks include K-feldspar, plagioclase, quartz, orthopyroxene, biotite, and garnet with accessory minerals such as ilmenite, zircon, and monazite [35]. The heavy minerals occur as discrete patches and their percentage on the Kanyakumari beach placer deposits varies from 8 to 85% with ilmenite, zircon, monazite, and rutile [36]. Kanyakumari experiences a tropical climate with an average annual rainfall of 1450 mm, which helps the short perennial rivers such as Pazhaiyar, Valliyar, and Tamirabarani to weather the TB and NG block, providing sediments to the coast. The catchment rocks of the rivers are charnockite and granulite gneisses. The longshore currents can facilitate the transportation of sediments along the coast during the southwest monsoon, but it is limited due to the coastal morphology. The coastal stretch of Kanyakumari includes sandy beaches, beach terraces, sand dunes, rocky shores, and estuaries with the onshore margin comprised of Late Quaternary deposits and outcrops of charnockite and garnet-biotite gneiss which act as natural barriers for wave actions and storm surges [37].
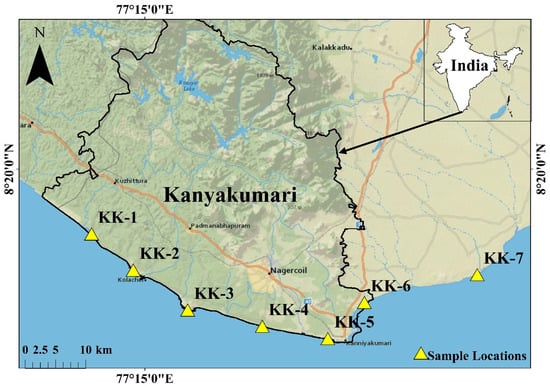
Figure 1.
Study area map with sample locations (created using ArcGIS 10.6 software).
3. Materials and Methods
3.1. Sample Collection and Preparation
Sand samples along the Kanyakumari coast were collected from the surface layer (0–10 cm) using a Daiki soil sampler during March 2022 (Indian summer season). About 2 kg of beach sand was collected as a composite sample by making a square outline for an area of about 1 m2 and sand was collected from each corner and from the center. The five portions were mixed thoroughly before packing in a polyethylene bag and transported to the laboratory. The sand samples were first air-dried and then oven-dried at 105 °C for 24 h and after manually removing the extraneous materials, the samples were passed through 2 mm mesh sieve. After homogenization, the grain size of the samples was pulverized to less than 150 µm using a ball mill.
3.2. Major Oxides Analysis
About 0.7 g of powdered sample was mixed with 4.2 g of Li2B4O7 (flux agent) and 1 g of NH4NO3 (oxidizing agent). The mixture was ashed at 400 °C for 3 h in a muffle furnace and then mixed with 0.1 mL of NH3I (reducing agent). The ashed mixture was heated at 1100 °C for 240 s in a high frequency bead sample maker (TK-4100, Kagaku, Tokyo, Japan) and cooled to room temperature [38]. After the preparation of the bead, the major oxides were measured in a wavelength dispersive XRF spectrometer (ZSX100e, Rigaku, Tokyo, Japan) with an X-ray tube of 4 kW Rh and ultra-thin Rh end window. The certified reference materials (CRMs) supplied by the Geological Survey of Japan such as JLk-1 (lake sediment) and JB-1 (Japan basalt) were prepared and measured by following the same procedure in order to validate the method. The recovery percentage of the CRMs ranged from 90%–107% for JLk-1 and 92%–108% for JB-1.
3.3. Trace Elements, REEs, Th, and U Analysis
About 0.5 g of powdered sample was ashed at 550 °C for 5 h in a muffle furnace to remove the organic matter and cooled in a desiccator [38]. The ashed samples were decomposed using a mixture of ultrapure analytical grade HNO3, HF, and HClO4 (TAMA-Pure-AA-100, Tama Chemicals Co., Ltd., Kawasaki, Japan) in a closed PTFE pressure vessel microwave digestion system [39]. After microwave digestion, the samples were transferred carefully to the Teflon beakers and evaporated to dryness on a hotplate. Since the samples were rich in refractory minerals such as ilmenite, rutile, and zircon, aqua regia was used for further decomposition to attain a clear solution. The final clear solution was evaporated to complete dryness and dissolved using HNO3 to yield the sample solution for measurement and a blank was also prepared in the same way. All samples and the blank were diluted using 3% HNO3 and spiked with internal standard 103Rh before determining the elemental concentration using ICP-MS (Agilent 8800, Agilent Technologies, Tokyo, Japan). The operating parameters and calibration of the ICP-MS are explained in detail elsewhere [39]. To validate the analytical procedure, CRMs such as JLk-1 (Lake sediment), JB-3 (Japan basalt), and JSd-2 (Stream sediment) supplied by the Geological Survey of Japan and GBW07312 (Stream sediment) supplied by National Institute of Metrology, Chaoyang, Beijing, China, were analyzed. The recovery results of REEs, Th, and U are shown in Figure 2 and the measured value was found to be in good agreement with the certified values.
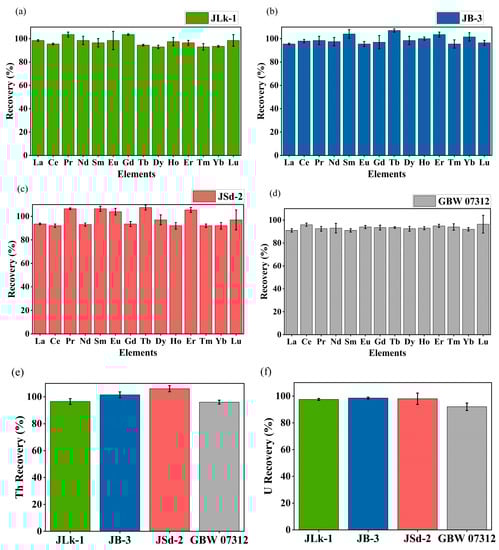
Figure 2.
Recovery (%) of REEs for CRMs (a) JLk-1, (b) JB-3, (c) JSd-2, (d) GBW 07312, (e) Th recovery (%) of CRMs, and (f) U recovery (%) of CRMs.
3.4. Chemical Separation of U
U was separated from the digested samples by following AER-UTEVA separation scheme. The pre-conditioned anion exchange resin (AER) AG 1 × 8 (200–400 mesh, BioRad Laboratories Inc., Hercules, CA, USA) was prepared in a column of length 118 mm and diameter 10.5 mm (Muromac column L, Muromachi Chemicals Inc., Omuta, Fukuoka, Japan) and filled up to a volume of 8 mL. The column was washed with 50 mL of 8 M HNO3 and the prepared sample solution in 15 mL of 8 M HNO3 was loaded on the AER column. The trace elements and REEs were removed by passing 10 mL of 8 M HNO3 and the U fraction was eluted, passing 70 mL of 8 M HNO3 into the AER column. The elute was dried completely and the load solution for the UTEVA column was prepared by dissolving the residue in 2 mL of 4 M HNO3. The pre-cleaned UTEVA resin (100–150 µm, Eichrom Technologies Inc., Lisle, IL, USA) was filled up to a volume of 1 mL in a 50 mm in length and 5.5 mm in diameter column (Muromac column S, Muromachi Chemicals Inc., Omuta, Fukuoka, Japan). The sample was loaded onto the pre-conditioned column and washed by passing 6 mL of 4 M HNO3. The Th fraction was removed from the column by passing 9 mL of 5 M HCl and the U fraction was eluted by passing 15 mL of 0.1 M HNO3. Since an organic extractant was observed in the fraction collected after UTEVA column [40], the final elute was evaporated to complete dryness and decomposed using concentrated HNO3 and HClO4. The samples were then loaded on the rhenium (Re) filament for TIMS measurement.
The separation scheme was followed for the CRM JLk-1 in order to calculate the U recovery. Each elute of the separation was collected to study the behavior of trace elements, REEs, Th, and U. The collected fractions were measured using the ICP-MS for elemental concentrations. Figure 3 is the elution pattern of the most common interfering elements such as Th, Fe, and Pb for U isotope ratio measurements by inorganic mass spectrometry. The analysis value of U (µg/g) was in good agreement with the certified value of JLk-1. The 234U/238U and 235U/238U isotope ratios were measured using a thermal ionization mass spectrometer (Isotopx PhoenixTM X62, Middlewich, Cheshire, UK). The details of instrument optimization, measurement protocol, and validation are explained elsewhere [40].
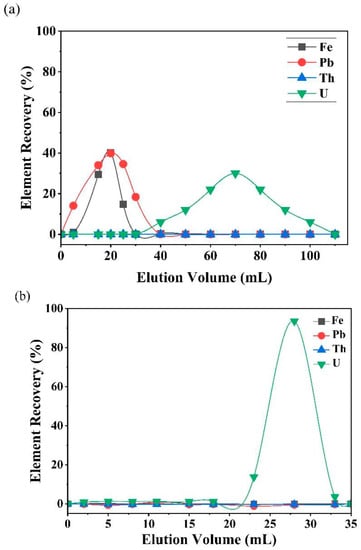
Figure 3.
Separation profiles of JLk-1 obtained using an (a) AER column and (b) UTEVA column.
4. Results and Discussion
4.1. Major Oxides Geochemistry
The major element oxide concentrations of sand samples are summarized in Table 1. The SiO2 values ranged between 15.8 and 52.9 wt% with an average of 31.8 wt%. The TiO2 wt% ranged between 7.3 and 36.8 with an average of 26.7 wt% and the Fe2O3 wt% were in the range of 14.9 to 30.3 with an average of 22.2 wt%. Figure 4 shows the Harker variation diagram of different elements with SiO2. The average K2O/Al2O3 ratio (0.02) was very low, indicating the low content of K-bearing minerals in the beach sand. The SiO2/Al2O3 ratio has been widely used to understand the textural maturity of sediments. The average SiO2/Al2O3 for the Kanyakumari beach sand was found to be 7.5, which has a relatively low degree of maturity when compared to other highly weathered sediments (~30). However, there is some degree of sediment maturity when compared to the SiO2/Al2O3 ratios of acidic and basic rocks which are around three and five [41]. The weak correlation between SiO2 vs. TiO2, Fe2O3, and P2O5 indicates that they have remained chemically immobile in the sand. This is due to the presence of highly weathering-resistant heavy minerals such as ilmenite, rutile, and monazite. The TiO2% was higher than the SiO2% at three locations (KK-1, KK-3, KK-5). This could be due to the presence of Ti-bearing heavy minerals ilmenite and rutile. A strong correlation was observed between the TiO2, P2O5, and Th. It was observed in the samples that there was an increase in Th, TiO2, Fe2O3, and P2O5 concentrations with a decrease in SiO2 concentration, respectively. A similar condition was observed in other HBNRAs such as Odisha [38], Kerala [42], Andhra Pradesh [43], and Madagascar [44]. The coefficient correlation of the major oxides with Th and U is shown in Table 2. The major oxides such as TiO2, Fe2O3 and P2O5 showed a strong correlation with Th and U. All these factors can be attributed to the presence of heavy minerals such as ilmenite and monazite.

Table 1.
Major oxides (%) of the Kanyakumari HBNRA beach sands.
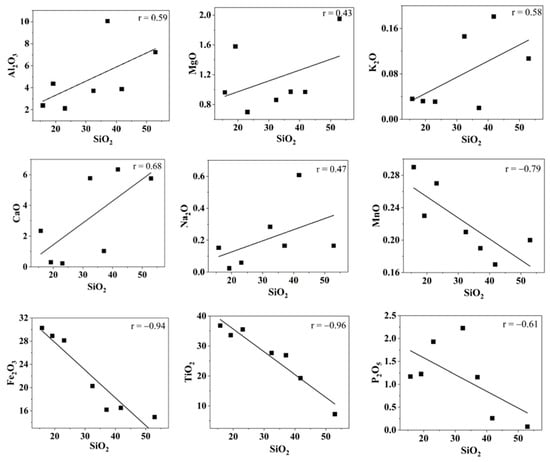
Figure 4.
Harker variation diagrams for SiO2 (wt%) with other major oxides (wt%).
Table 2.
Correlation coefficient between the major oxides, Th, and U.
The sand deposited along the coast are products of weathering from the source region. The chemical index of alteration (CIA) is used as a parameter to understand the degree of weathering of the sediments. The index can be calculated as CIA = (Al2O3/[Al2O3 + CaO* + Na2O + K2O]) × 100, where the Al2O3, CaO*, Na2O, and K2O are in molar proportion and CaO* is the CaO in the silicate fraction. The CIA values below 50 are referred as un-weathered, from 50 to 65 is weakly weathered, 65 to 85 is moderately weathered, and from 85 to 100 is strongly weathered [45]. The CIA values of the Kanyakumari beach sands ranged from 63 to 97, which suggested that the sands were weakly to strongly weathered. The A–CN–K triangular plot gives the weathering trend and it is a plot of the molecular proportion of Al2O3, CaO, Na2O, and K2O [45]. Figure 5 shows the A–CN–K triangular plot and the weathering trend of the beach sands of Kanyakumari along with the PAAS [4], Odisha HBNRA soil [38], Nagercoil charnockite [46], and UCC [47]. The weathering pattern trends towards the Al2O3 apex suggests a steady increase in the intensity of weathering and all the samples plot along the same weathering trend line suggests the sands were derived from a similar source [45]. Both the CIA and A–CN–K suggest that these sands are chemically weathered.
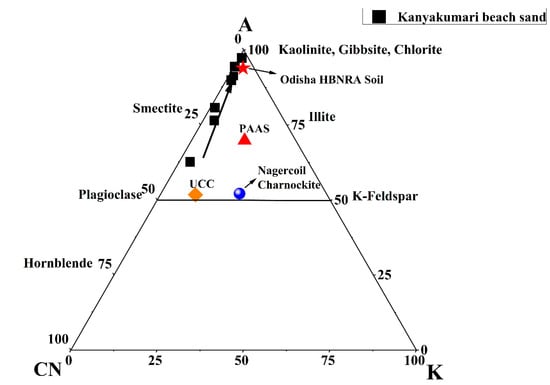
Figure 5.
A–CN–K triangular plot for Kanyakumari beach sands, PAAS [4], Odisha HBNRA Soil [38], Nagercoil charnockite [46], and UCC [47].
4.2. REEs and Trace Elements Geochemistry
The concentrations and the correlation coefficients of REE with Th and U of the Kanyakumari beach sand are given in Table 3 and Table 4. Figure 6 shows the chondrite normalized REE patterns of the Kanyakumari beach sands along with UCC [47], Odisha charnockite [48], Nagercoil charnockite (garnet-bearing), Nagercoil charnockite (garnet-absent), and Nagercoil biotite gneiss [49]. The chondrite normalized REE pattern showed a relatively LREE-enriched pattern with a prominent Eu anomaly (Figure 6). The ∑REEs for the Kanyakumari beach placer sands varied from 778.93 to 15,007.54 µg/g with a mean of 6645.58 µg/g, whereas the ∑LREEs varied from 770.58 to 14,860.80 µg/g with a mean of 6597.86 µg/g, which was approximately 50 times higher than the ∑LREEs of UCC (136.28 µg/g) and ∑HREEs varied from 8.35 to 146.74 µg/g with a mean of 47.73 µg/g. Among several major oxides, only P2O5 showed a positive and TiO2 showed a weak correlation with the ∑REEs; however, P2O5 and Th had a strong coherence with ∑LREEs (Figure 7), suggesting the control of the monazite mineral on the LREE enrichment. The weak correlation between TiO2 and REE could be attributed to the ilmenite with a major titaniferous mineral in the charnockites and with less control over REEs [10]. The (Ce/Yb)N, (Ce/Sm)N, and (Gd/Yb)N ratios of the Kanyakumari beach sands ranged from 91.12 to 295.67, 3.30 to 4.33, and 9.77 to 42.60, respectively. A limited variation in the (Ce/Yb)N may suggest the sediments were derived from different size fractions. In the present study the (Ce/Yb)N variation was high. This could be due to unmixing of sands, where the light minerals might have washed away as a result of wave action along the coast. A large variation was observed in the abundance of REEs in all the samples, yet the patterns remained similar. Similar patterns may insinuate a uniform source for samples collected from different locations along the coast. LREE-enriched patterns in Nagercoil garnet-bearing charnockite showed negative EuA (Europium anomaly) (0.62) and a more positive Eu anomaly (1.22) for the charnockite without garnet, shown in Figure 6. The EuA has been calculated by EuA = EuN/√(SmN × GdN), where EuN, SmN, and GdN are the chondrite normalized values. EuA > 1 indicates a positive and EuA < 1 indicates a negative anomaly. The EuA of the sands varied from 0.03 to 0.09 with an average of 0.05, indicating a negative Eu anomaly. A similar observation has been reported in the Odisha HBNRA soil [38], whereas a positive Eu anomaly was observed in the Andhra Pradesh coastal sands [48]. The Eu anomaly in the sand was mainly controlled by the feldspar (mainly plagioclase), therefore, REE patterns of the Kanyakumari beach sand show a negative Eu anomaly. The feldspars may transform to clays under intense chemical weathering. The CIA results showed that the beach sands were intensely weathered and the feldspars may have been removed in the clay fractions and enrichment of heavy minerals imposed a negative Eu anomaly. The higher LREE/HREE ratio with negative Eu anomaly suggests a felsic source for the sands.
Table 3.
REE, Th, and U (µg/g) concentrations of Kanyakumari beach sands.
Table 4.
Correlation coefficient between REEs, Th, and U of the Kanyakumari beach sands.
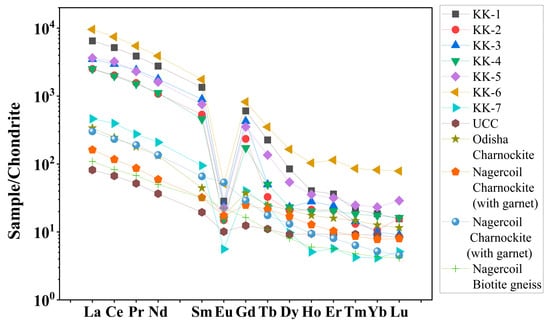
Figure 6.
Chondrite normalized REE patterns of Kanyakumari beach sands with references.
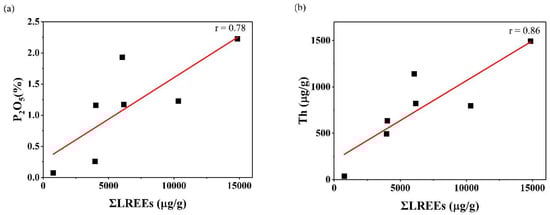
Figure 7.
(a) ƩLREEs (µg/g) vs. P2O5 (%) and (b) ƩLREEs (µg/g) vs. Th (µg/g).
The Rb vs. Sr covariance is plotted in Figure 8. The Rb/Sr ratio is lower than 0.3 in the upper crust whereas in the mantle it is below 0.03 [46]. The beach sand Rb/Sr ratio varied from 0.04 to 0.20 with an average of 0.12 and within the limit of the upper crustal values. A comparison of Kanyakumari beach sand with Nagercoil charnockite with garnet and without garnet [49], Odisha charnockite [48], and HBNRA Odisha soil [38] is shown in Figure 8. The beach sands were in the range of Nagercoil charnockite, which suggests that rocks may be the possible sources for sands deposited along the Kanyakumari coast. The Nd/Ce ratio ranged from 0.4 to 0.5 with an average of 0.4, and La/Ce ratio ranged from 0.4 to 0.5 with an average of 0.5. The average Nd/Ce and La/Ce ratios of the Indian coast HBNRA such as Kerala, Andhra Pradesh, and Odisha were 0.4 and 0.5 [42,43,50]. HBNRA showed similar Nd/Ce and La/Ce ratios, which dominated the enrichment of monazite.
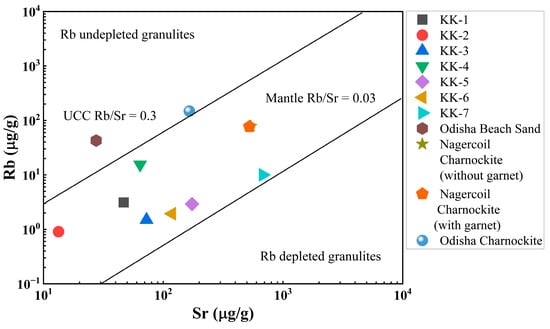
Figure 8.
Sr vs. Rb distribution of the Kanyakumari beach sands with references.
The plot of La/Th vs. Th/U (Figure 9a) could be used to interpret the behavior of U and Th in the source rocks. The Th/U ratios of Kanyakumari beach sands plotted along the y-axis suggest a preferential loss of U in the source rock, corroborating to a lesser extent with the La/Th vs. Th/U cross plot for the charnockites [46]. During metamorphism, granulite facies, Th, and U may be retained in the accessory minerals such as zircon, apatite, sphene, or monazite. The weak coherence (R2 = 0.04) between the Yb and Zr suggested only a minor amount of zircon was present in the beach placers and monazite played a major role in controlling Th/U ratio. The U and Th behave differently in reducing and oxidizing environments and it is reflected in the Th/U ratios. The Th vs. Th/U ratios of the Kanyakumari beach placers are shown in Figure 9b. Th and U were highly stable in reducing conditions and insoluble forms of Th (IV) and U(IV) led to the enrichment of both U and Th with the Th/U ratio ranging from 0 to 2. The Th/U ratio of seven was reported to explain the mobilization of U through weathering and leaching in an oxidizing terrestrial environment where U will be in a soluble U(VI) state [51].
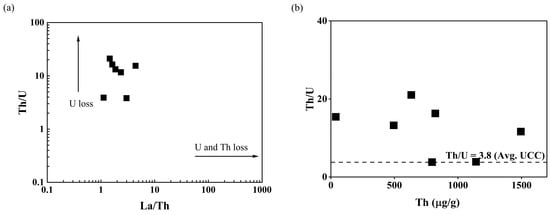
Figure 9.
(a) La/Th vs. Th/U distribution and (b) Th vs. Th/U of the beach placer sands.
The U and Th concentrations for the Kanyakumari beach placer sands (n = 6) ranged from 30.07 to 292.48 µg/g and 494.45 to 1495.10 µg/g with a mean of 124.50 and 897.05 µg/g, respectively. The Th/U ratio ranged from 3.8 to 21.1 with an average of 11.6, which was higher than the UCC Th/U ratio of 3.8. The control point (KK-7) also had a higher Th/U ratio of around 15.4. The Th/U ratio of all the beach sands were found to be higher than seven, suggesting a preferential loss of U and enrichment of Th due to the prevailing oxidizing terrestrial environment. The Th-bearing minerals such as monazite and ilmenite can contribute to the Th concentration and control the Th/U ratios. Table 4 shows the correlation coefficients between REEs, Th, and U. The ratios of ∑LREEs/(Th + U) varied from 4.21 to 10.28; this supports the substitution of LREEs by Th and U [19,43]. The REEs and Th were found to be in strong positive correlation when compared to U with REEs. Since Th is a high field strength element (HFSE), it shows similar behavior to the REEs during weathering and sedimentation [52].
4.3. Enrichment of Rare Earth Elements, Th and U
The enrichment factor (EF) was estimated to understand the enrichments of trace and rare earth elements in the beach placer sands compared to the UCC. EF was calculated using the following equation (Equation (1)) and Al is used as the reference element [50]:
where Conc(El) is the concentration of element and X is the reference element
The average EF values ranged between 0.54 and 348.11 and followed the order Th > U > Ce > Pr > La > Nd > Sm > Gd > Tb > Dy > Er > Ho > Y > Tm > Lu > Yb > Eu. The EF < 2 is classified as minimal or no enrichment, 2 < EF < 5 as moderate enrichment, 5 < EF < 20 as significant enrichment, 20 < EF < 40 as very high enrichment, and EF > 40 as extremely high enrichment. Based on this classification, LREEs are extremely enriched in the Kanyakumari beach placer sands whereas most of the HREEs are also enriched (Figure 10). Th and U are extremely enriched in the beach sands with EF values ranging from 7.8 to 786.8 and 1.97 to 783.6 with an average of 348.1 and 206.7. The enrichment of all these elements is supposed to be natural since the Kanyakumari beach sands were enriched with heavy minerals such as ilmenite, monazite, garnet, and rutile.
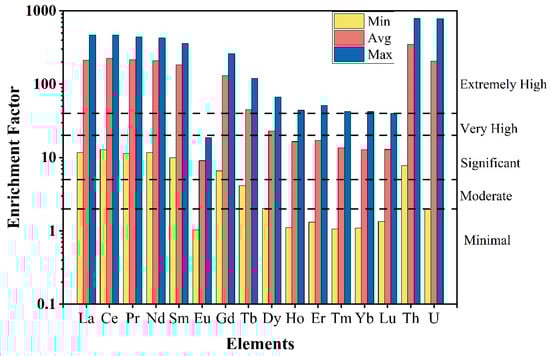
Figure 10.
Enrichment factors (minimum, maximum, and average) of REEs, Th, and U in the Kanyakumari beach sands.
The geo accumulation index (Igeo) was calculated using the Equation (2) [50]. A factor of 1.5 has been used as background matrix due to lithogenic effect:
where Ci is the concentration of elements in beach sand and Bi is the background value of the element.
The average Igeo values followed the order of Th > Ce > Pr > La > Nd > Sm > Gd > U > Tb > Dy > Er > Ho > Tm > Lu > Yb > Eu. There are seven classifications in this category. The average Igeo value of Th, based on the seven classifications, falls in the Class 6 (extreme accumulation). U with average Igeo value of 3.6 falls in the Class 4 (high accumulation) classification. The LREEs (La, Ce, Pr, Nd, Sm, Gd) average values ranged from 3.8 to 4.6 falls in the Class 5 (very high accumulation) classification of the Igeo. In both the cases of EF and Igeo Th was followed by Ce, this is due to monazite, a mineral which contains Ce as the dominant lanthanide.
4.4. 234U/238U Activity Ratios and 235U/238U Isotope Ratios of Kanyakumari HBNRA Sand
The U concentrations varied from 30.07 ± 1.83 to 292.48 ± 3.12 µg/g (Figure 11). The distribution of U along the Kanyakumari coast is not uniform and is highly controlled by the mineralogy of the sands. A few geochemical studies in Kanyakumari have been reported on monazite chemistry [17], trace metal evaluation [18], and beach sands [19]. For the first time, measurement of the 234U/238U activity ratio and 235U/238U isotope ratio in Kanyakumari HBNRA sands has been reported using thermal ionization mass spectrometry (TIMS). The 234U/238U activity ratio and 235U/238U isotope ratios are summarized in Table 5. The 234U/238U activity ratio and 235U/238U isotope ratios of the Kanyakumari HBNRA were compared with the two soil samples from Odisha HBNRA [25]. The 234U/238U activity ratio and 235U/238U isotope ratios were measured using MC-ICP-MS Odisha HBNRA soils. The results of 234U/238U and 235U/238U ratios of Odisha soil samples were in good agreement with TIMS [25]. The 235U/238U isotope ratio of the placer sands from Kanyakumari HBNRA (n = 6) varied from 0.007256 to 0.007263 with an average of 0.007259 and the control sample (KK-7) had a value of 0.007256, respectively (Figure 12). The 235U/238U isotope ratios of the placer sands were comparable with the natural terrestrial ratio of 235U/238U which is 0.00725.
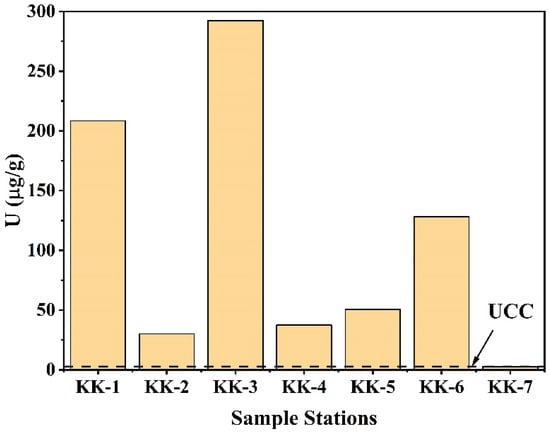
Figure 11.
U concentrations (µg/g) of Kanyakumari beach placer sands (KK-1 to KK-6) and the control sample (KK-7).
Table 5.
U concentrations with 234U/238U activity ratio, 235U/238U isotope ratio, and 238U of Kanyakumari beach placer sands and Odisha soil.
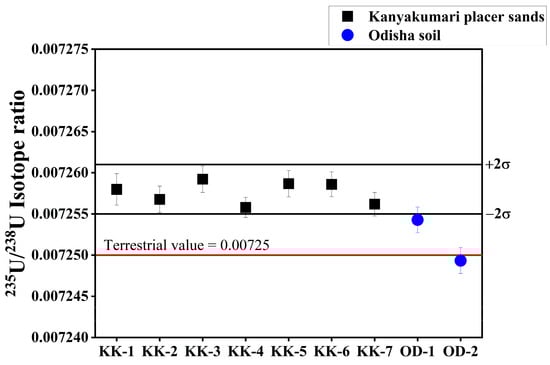
Figure 12.
235U/238U isotope ratios of Kanyakumari HBNRA placer sands with soil samples of Odisha HBNRA.
To understand the U fractionation, the δ238U was estimated for the placer sands. δ238U was calculated using the following equation (Equation (3)) and it is expressed in ‰ (permill):
where (238U/235U)Sample refers to the 238U/235U ratio of placer sands and (238U/235U)Std refers to the 238U/235U isotope ratio of standard
In geochronology, a normal terrestrial value for 238U/235U is equal to 137.88 has been used for the past four decades [31]. In that case, the NBL CRM 112-A has a 238U/235U value equal to 137.837 ± 0.015; hence, it was used as the standard for the calculation of δ238U [25,53,54]. The δ238U for the present study ranged from −0.59 to −0.12‰ (Table 5). Figure 13 shows the comparison of δ238U values with respect to U concentrations of post-Archaean Australian shale (−0.39‰) [54] and Odisha soil (0.1‰) with the present study. The Kanyakumari placer sands (except KK-3) were in the range of granite and granitoid which was comparable with continental crust (δ238U = −0.51 to −0.16‰) [33,54], whereas the Odisha soil was close to mineralized sediments [25]. Zircon, sphene, apatite, monazite, and ilmenite are some of the accessory minerals that host U on the continental crust. Monazite has the lowest δ238U (−0.68‰) value among these minerals [31] and one of the Kanyakumari beach placer sand samples (KK-3) was close to this value which is supported due to the enrichment of monazite. The variations observed in both the HBNRAs support that weathering has a major role in controlling the U fractionation.
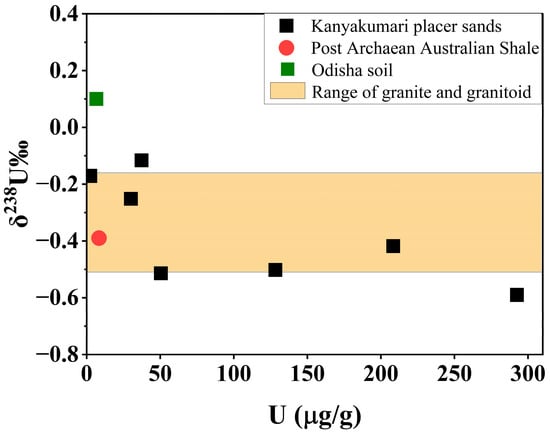
Figure 13.
δ238U values of Kanyakumari HBNRA placer sands with various references.
The 234U/238U isotope ratio was used to calculate the 234U/238U activity ratio. The 234U/238U activity ratio of Kanyakumari beach placer sands varied from 0.995 ± 0.001 to 1.071 ± 0.002 with an average of 1.021 ± 0.025 (Figure 14). The 234U/238U activity ratio does not show a large disequilibrium in the Kanyakumari placer sands and is similar to the Odisha HBNRA soils [25]. As discussed earlier, Th/U can give an idea about the leaching of U under the oxidizing environment. The leaching of 234U can also be influenced by chemical weathering. In the case of Kanyakumari HBNRA, the beach sands are the sediments deposited by the rivers and redistributed by the waves. The source rock might have undergone extensive chemical weathering and given rise to the enrichment of highly resistant minerals such as ilmenite, zircon, monazite, and garnet. Thus, it is difficult to interpret the leaching of U based on the correlation with Th/U and CIA, at least in the context of Kanyakumari beach placer sands.
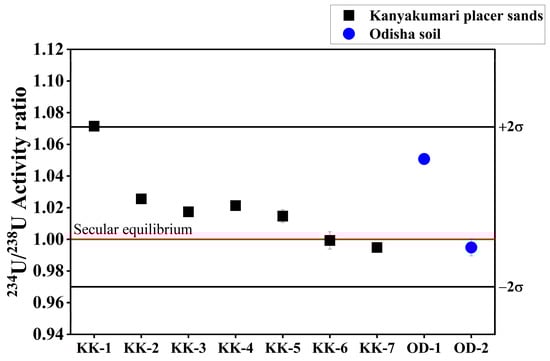
Figure 14.
234U/238U activity ratios of Kanyakumari HBNRA placer sands.
5. Conclusions
Based on the results and discussion we conclude that:
- The Kanyakumari beach sands are derived from an intensively weathered source region where most of the felsic minerals bearing Ca, Na, and K were removed and this is reflected through the CIA.
- The geochemistry of trace elements (Rb vs. Sr) suggests that the sands may be predominantly derived from the Trivandrum and Nagercoil Block of the Southern Granulite Terrains (SGT).
- Monazite has an enormous control on the REEs present along the Kanyakumari and this is reflected through the LREE-enriched patterns. Other heavy minerals such as ilmenite and zircon had control on HREEs and the beach sands showed a fractionated HREE pattern suggesting a minor control of these minerals on the REE.
- The 234U/238U activity ratio showed that the U in the Kanyakumari beach sands were in secular equilibrium and the 235U/238U isotope ratios were in close proximity to the natural terrestrial value of the 235U/238U isotope ratio.
- The δ238U suggests that Kanyakumari HBNRA placer sands are in the range of granite and granitoid which is the general composition of the rock types present in the hinterland.
Author Contributions
Conceptualization, T.N., K.I. and S.K.S.; methodology, T.N. and S.K.S.; formal analysis, S.K.S.; investigation, T.N. and S.K.S.; writing—original draft preparation, T.N. and S.K.S.; writing—review and editing, T.N., K.I. and S.K.S.; Supervision, K.I. and S.K.S.; Funding acquisition, K.I. and S.K.S. All authors have read and agreed to the published version of the manuscript.
Funding
This research was partially supported by the JSPS core-to-core program (Grant Number: JPJSCCB20210008).
Data Availability Statement
All data appears in the article.
Acknowledgments
One of the authors (T.N.) is thankful to the Tokyo Metropolitan Government, Tokyo, Japan for the award of the doctoral fellowship “Tokyo Human Resources Fund for City Diplomacy” at Tokyo Metropolitan University. T.N. is thankful to the National Institute of Radiological Sciences, National Institutes for Quantum Science and Technology (QST) Chiba, Japan for the award of QST Research Assistant. Author T.N. would like to acknowledge the support of Sharayu Kasar, Nimelan Veerasamy, and Hideki Arae during sample collection and in the laboratory. All authors would like to thank Yuvin Sahoo for scientific discussion during the study.
Conflicts of Interest
The authors declare no conflict of interest.
References
- Nesbitt, H. Mobility and fractionation of rare earth elements during weathering of a granodiorite. Nature 1979, 279, 206–210. [Google Scholar] [CrossRef]
- McLennan, S.M.; Taylor, S.R. Rare earth element mobility associated with uranium mineralization. Nature 1979, 282, 247–250. [Google Scholar] [CrossRef]
- Sholkovitz, E.; Shen, G.T. The incorporation of rare earth elements in modern coral. Geochim. Cosmochim. Acta 1995, 59, 2749–2756. [Google Scholar] [CrossRef]
- Taylor, S.R.; McLennan, S.M. The Continental Crust: Its Composition and Evolution; Blackwell: Oxford, UK, 1985; Volume 312, pp. 673–674. [Google Scholar]
- Chakhmouradian, A.R.; Wall, F. Rare earth elements: Minerals, mines, magnets (and more). Elements 2012, 8, 333–340. [Google Scholar] [CrossRef]
- Cullers, R.L.; Barret, T.; Carlson, R.; Robinson, B. Rare-earth element and mineralogic changes in Holocene soil and stream sediment: A case study in the Wet Mountains, Colorado, USA. Chem. Geol. 1987, 63, 275–297. [Google Scholar] [CrossRef]
- Sholkovitz, E.R.; Elderfield, H. Cycyling of dissolved rare earth elements in Chesapeake Bay. Glob. Biogeochem. Cycles 1988, 2, 157–176. [Google Scholar] [CrossRef]
- Singh, P.; Rajamani, V. REE geochemistry of recent clastic sediments from the Kaveri floodplains, southern India: Implication to source area weathering and sedimentary processes. Geochim. Cosmochim. Acta 2001, 65, 3093–3108. [Google Scholar] [CrossRef]
- Sahoo, S.K.; Yonehara, H.; Kurotaki, K.; Shiraishi, K.; Ramzaev, V.; Barkovski, A. Determination of rare earth elements, thorium and uranium by inductively coupled plasma mass spectrometry and strontium isotopes by thermal ionization mass spectrometry in soil samples of Bryansk region contaminated due to Chernobyl accident. J. Radioanal. Nucl. Chem. 2001, 247, 341–345. [Google Scholar] [CrossRef]
- Balaram, V. Potential Future Alternative Resources for Rare Earth Elements: Opportunities and Challenges. Minerals 2023, 13, 425. [Google Scholar] [CrossRef]
- Balaram, V. Rare earth elements: A review of applications, occurrence, exploration, analysis, recycling, and environmental impact. Geosci. Front. 2019, 10, 1285–1303. [Google Scholar] [CrossRef]
- Van Gosen, B.S.; Fey, D.L.; Shah, A.K.; Verplanck, P.L.; Hoefen, T.M. Deposit Model for Heavy-Mineral Sands in Coastal Environments. In Mineral Deposit Models for Resource Assessment; U.S. Geological Survey Scientific Investigations Report; U.S. Geological Survey: Reston, VA, USA, 2014. [Google Scholar] [CrossRef]
- Singh, Y. Rare earth element geochemistry of monazites from beach sand deposits of Indian Coasts: Implications for clean energy. J. Appl. Geochem. 2020, 22, 209–220. [Google Scholar]
- Padua, J.C.; Basil Rose, M.R. Natural gamma radioactivity in the villages of Kanyakumari District, Tamil Nadu, India. Radiat. Prot. Dosim. 2013, 156, 42–48. [Google Scholar] [CrossRef] [PubMed]
- Ajithra, A.K.; Venkatraman, B.; Jose, M.T.; Chandrasekar, S.; Shanthi, G. Assessment of natural radioactivity and associated radiation indices in soil samples from the high background radiation area, Kanyakumari district, Tamil Nadu, India. Radiat. Prot. Environ. 2017, 40, 27–33. [Google Scholar] [CrossRef]
- Natarajan, T.; Sahoo, S.K.; Nakajima, T.; Veerasamy, N.; Yamazaki, S.; Inoue, K.; Ramola, R.C. Distribution of 226Ra, 232Th and 40K in Kanyakumari beach placer deposits along Tamil Nadu coast, India. J. Radioanal. Nucl. Chem. 2023. [Google Scholar] [CrossRef]
- Perumalsamy, C.; Bhadra, S.; Balakrishnan, S. Decoding evolutionary history of provenance from beach placer monazites: A case study from Kanyakumari coast, southwest India. Chem. Geol. 2016, 427, 83–97. [Google Scholar] [CrossRef]
- Sundar, S.; Roy, P.D.; Chokkalingam, L.; Ramasamy, N. Evaluation of metals and trace elements in sediments of Kanyakumari beach (southernmost India) and their possible impact on coastal aquifers. Mar. Pollut. Bull. 2021, 169, 112527. [Google Scholar] [CrossRef]
- Veerasamy, N.; Murugan, R.; Kasar, S.; Inoue, K.; Kavasi, N.; Balakrishnan, S.; Arae, H.; Fukushi, M.; Sahoo, S.K. Geochemical characterization of monazite sands based on rare earth elements, thorium and uranium from a natural high background radiation area in Tamil Nadu, India. J. Environ. Radioact. 2021, 232, 106565. [Google Scholar] [CrossRef]
- Ivanovich, M.; Harmon, R.S. Uranium-Series Disequilibrium: Applications to Earth, Marine, and Environmental Sciences, 2nd ed.; Natural Environment Research Council: Keyworth, UK, 1992; p. 910. [Google Scholar]
- Sahoo, S.K.; Nakamura, Y.; Shiraishi, K.; Masuda, A. Accurate measurement of uranium isotope ratios in soil samples using thermal ionization mass spectrometry equipped with a warp energy filter. Int. J. Environ. Anal. Chem. 2004, 84, 919–926. [Google Scholar] [CrossRef]
- Moreira-Nordemann, L.M. Use of 234U/238U disequilibrium in measuring chemical weathering rate of rocks. Geochim. Cosmochim. Acta 1980, 44, 103–108. [Google Scholar] [CrossRef]
- Latham, A.G.; Schwarcz, H.P. On the possibility of determining rates of removal of uranium from crystalline igneous rocks using U-series disequilibria-1: A U-leach model, and its applicability to whole-rock data. Appl. Geochem. 1987, 2, 55–65. [Google Scholar] [CrossRef]
- Kanai, Y.; Sakamaki, Y. Uranium redistribution implied by 234U/238U disequilibrium study on apatite-bearing sedimentary rocks at Nakamaruke district, central Japan. Appl. Geochem. 1994, 9, 547–552. [Google Scholar] [CrossRef]
- Veerasamy, N.; Kasar, S.; Murugan, R.; Inoue, K.; Natarajan, T.; Ramola, R.C.; Fukushi, M.; Sahoo, S.K. 234U/238U disequilibrium and 235U/238U ratios measured using MC-ICP-MS in natural high background radiation area soils to understand the fate of uranium. Chemosphere 2023, 323, 138217. [Google Scholar] [CrossRef]
- Bopp IV, C.J.; Lundstorm, C.C.; Johnson, T.M.; Sanford, R.A.; Long, P.E.; Williams, K.H. Uranium 238U/235U isotope ratios as indicators of reduction: Results from an in situ biostimulation experiment at Rifle, Colorado, USA. Environ. Sci. Technol. 2010, 44, 5927–5933. [Google Scholar] [CrossRef]
- Brennecka, G.A.; Borg, L.E.; Hutcheon, I.D.; Sharp, M.A.; Anbar, A. Natural variations in uranium isotope ratios of uranium ore concentrates: Understanding the 238U/235U fractionation mechanism. Earth Planet. Sci. Lett. 2010, 291, 228–233. [Google Scholar] [CrossRef]
- Murphy, M.J.; Stirling, C.H.; Kaltenbach, A.; Turner, S.P.; Schaefer, B.F. Fractionation of 238U/235U by reduction during low temperature uranium mineralisation processes. Earth Planet. Sci. Lett. 2014, 388, 306–317. [Google Scholar] [CrossRef]
- Mishra, S.; Kasar, S.; Takamasa, A.; Veerasamy, N.; Sahoo, S.K. Measurement of uranium distribution coefficient and 235U/238U in soils affected by Fukushima dai-ichi nuclear power plant accident. J. Environ. Radiact. 2019, 198, 36–42. [Google Scholar] [CrossRef]
- Chernyshev, I.V.; Golubev, V.N.; Chugaev, A.V.; Baranova, A.N. 238U/235U isotope ratio variations in minerals from hydrothermal uranium deposits. Geochem. Int. 2014, 52, 1013–1029. [Google Scholar] [CrossRef]
- Heiss, J.; Condon, D.J.; McLean, N.; Noble, S.R. 238U/235U systematics in terrestrial uranium-bearing minerals. Science 2012, 335, 1610–1614. [Google Scholar] [CrossRef]
- Stirling, C.H.; Anderson, M.B.; Potter, E.K.; Halliday, A.N. Low-temperature fractionation of uranium. Earth Planet. Sci. Lett. 2007, 264, 208–225. [Google Scholar] [CrossRef]
- Weyer, S.; Anbar, A.D.; Gerdes, A.; Gordon, G.W.; Algeo, T.J.; Boyle, E.A. Natural fractionation of 238U/235U. Geochim. Cosmochim. Acta 2008, 72, 345–359. [Google Scholar] [CrossRef]
- Santosh, M.; Yokoyama, K.; Biju-Sekhar, S.; Rogers, J.J.W. Multiple tectonothermal events in the granulite blocks of Southern India revealed from EPMA dating: Implications on the history of Supercontinents. Gondwana Res. 2003, 6, 29–63. [Google Scholar] [CrossRef]
- Rajesh, H.M.; Santosh, M.; Yoshikura, S. The Nagercoil charnockite: A magnesian, calcic to calc-alkalic granitoid dehydrated during a granulite-facies metamorphic event. J. Petrol. 2011, 52, 375–400. [Google Scholar] [CrossRef]
- Angusamy, N.; Rajamanickam, G.V. Distribution of heavy minerals along the beach from Mandapam to Kanyakumari, Tamil Nadu. J. Geol. Soc. India 2000, 56, 199–211. [Google Scholar]
- Kaliraj, S.; Chandrasekar, N.; Ramachandran, K.K. Mapping of coastal landforms and volumetric change analysis in the south west coast of. Kanyakumari, South India using remote sensing and GIS techniques. Egypt J. Remote Sens. Space Sci. 2017, 20, 265–282. [Google Scholar] [CrossRef]
- Veerasamy, N.; Sahoo, S.K.; Inoue, K.; Arae, H.; Fukushi, M. Geochemical behavior of uranium and thorium in sand and sandy soil samples from a natural high background radiation area of the Odisha coast, India. Environ. Sci. Pollut. Res. 2020, 27, 31339–31349. [Google Scholar] [CrossRef]
- Kasar, S.; Murugan, M.; Arae, H.; Aono, T.; Sahoo, S.K. A microwave digestion technique for the analysis of rare earth elements, thorium and uranium in geochemical certified reference materials and soils by inductively coupled plasma mass spectrometry. Molecules 2020, 25, 5178. [Google Scholar] [CrossRef]
- Kasar, S.; Aono, T.; Sahoo, S.K. Precise measurement of 234U/238U, 235U/238U and 236U/238U isotope ratios in Fukushima soils using thermal ionization mass spectrometry. Spectrochim. Acta B At. Spectrosc. 2021, 180, 106161. [Google Scholar] [CrossRef]
- Roser, B.P.; Cooper, R.A.; Nathan, S.; Tulloch, A.J. Reconnaissance sandstone geochemistry, provenance, and tectonic setting of the lower Paleozoic terranes of the West Coast and Nelson, New Zealand. N. Z. J. Geol. Geophys. 1996, 39, 1–16. [Google Scholar] [CrossRef]
- Anitha, J.K.; Joseph, S.; Rejith, R.G.; Sundararajan, M. Monazite chemistry and its distribution along the coast of Neendakara–Kayamkulam belt, Kerala, India. SN Appl. Sci. 2020, 2, 812. [Google Scholar] [CrossRef]
- Ganapathi Rao, P.; Bangaku Naidu, K.; Reddy, K.S.N.; Sekhar, C.R.; Murali Krishna, K.N.; Anji Reddy, M. Geochemical studies of monazites from coastal sands of Kandivalasa–Dibbalapalem coast, Andhra Pradesh. J. Earth Syst. Sci. 2020, 129, 143. [Google Scholar] [CrossRef]
- Van Hao, D.; Nguyen Dinh, C.; Jodlowski, P.; Kovacs, T. High-level natural radionuclides from the Mandena deposit, South Madagascar. J. Radioanal. Nucl. Chem. 2019, 319, 1331–1338. [Google Scholar] [CrossRef]
- Nesbitt, H.W.; Young, G.M.; McLennan, S.M.; Keays, R.R. Effects of chemical weathering and sorting on the petrogenesis of siliciclastic sediments, with implications for provenance studies. J. Geol. 1996, 104, 525–542. [Google Scholar] [CrossRef]
- Tomson, J.K.; Bhaskar Rao, Y.J.; Vijaya Kumar, T.; Mallikharjuna Rao, J. Charnockite genesis across the Archaean–Proterozoic terrane boundary in the South Indian Granulite Terrain: Constraints from major–trace element geochemistry and Sr–Nd isotopic systematics. Gondwana Res. 2006, 10, 115–127. [Google Scholar] [CrossRef]
- Rudnick, R.L.; Gao, S.; Holland, H.D.; Turekian, K.K. Composition of the Continental Crust. In The Crust; Rudnick, R.L., Ed.; Elsevier-Pergamon: Oxford, UK, 2003; Volume 3, pp. 1–64. [Google Scholar]
- Narayana, B.L.; Rama Rao, P.; Reddy, G.L.N.; Divakara Rao, V. Geochemistry and origin of megacrystic granitoid rocks from Eastern Ghats Granulite Belt. Gondwana Res. 1999, 2, 105–115. [Google Scholar] [CrossRef]
- Gao, P.; Santhosh, M.; Yang, C.; Kwon, S.; Ramkumar, M. High Ba–Sr adakitic charnockite suite from the Nagercoil Block, southern India: Vestiges of Paleoproterozoic arc and implications for Columbia to Gondwana. Geosci. Front. 2021, 12, 101126. [Google Scholar] [CrossRef]
- Veerasamy, N.; Sahoo, S.K.; Murugan, R.; Kasar, S.; Inoue, K.; Fukushi, M.; Natarajan, T. ICP-MS measurement of trace and rare earth elements in beach placer-deposit soils of Odisha, east coast of India, to estimate natural enhancement of elements in the environment. Molecules 2021, 26, 7510. [Google Scholar] [CrossRef]
- Anjos, R.M.; Veiga, R.; Macario, K.; Carvalho, C.; Sanches, N.; Bastos, J.; Gomes, P.R.S. Radiometric analysis of Quaternary deposits from the southeastern Brazilian coast. Mar. Geol. 2006, 229, 29–43. [Google Scholar] [CrossRef]
- Nyakairu, G.W.A.; Koeberl, C. Mineralogical and chemical composition and distribution of rare earth elements in clay-rich sediments from central Uganda. Geochem. J. 2001, 35, 13–28. [Google Scholar] [CrossRef]
- Telus, M.; Dauphas, N.; Moynier, F.; Tissot, F.L.H.; Teng, F.; Nabelek, P.I.; Craddock, P.R.; Groat, L.A. Iron, zinc, magnesium and uranium isotopic fractionation during continental crust differentiation: The tale from migmatites, granitoids, and pegmatites. Geochim. Cosmochim. Acta 2012, 97, 247–265. [Google Scholar] [CrossRef]
- Noordmann, J.; Weyer, S.; Bastian Georg, R.; Jöns, S.; Sharma, M. 238U/235U isotope ratios of crustal material, rivers and products of hydrothermal alteration: New insights on the oceanic U isotope mass balance. Isot. Environ. Health Stud. 2016, 52, 141–163. [Google Scholar] [CrossRef]


Disclaimer/Publisher’s Note: The statements, opinions and data contained in all publications are solely those of the individual author(s) and contributor(s) and not of MDPI and/or the editor(s). MDPI and/or the editor(s) disclaim responsibility for any injury to people or property resulting from any ideas, methods, instructions or products referred to in the content. |
© 2023 by the authors. Licensee MDPI, Basel, Switzerland. This article is an open access article distributed under the terms and conditions of the Creative Commons Attribution (CC BY) license (https://creativecommons.org/licenses/by/4.0/).