Article

Structural and Thermodynamic Properties of Magnesium-Rich Liquids at Ultrahigh Pressure

by
Felipe González-Cataldo
1,* and
Burkhard Militzer
1,2
1
Department of Earth and Planetary Science, University of California, Berkeley, CA 94720, USA
2
Department of Astronomy, University of California, Berkeley, CA 94720, USA
*
Author to whom correspondence should be addressed.
Minerals 2023, 13(7), 885; https://doi.org/10.3390/min13070885
Submission received: 20 May 2023 / Revised: 23 June 2023 / Accepted: 24 June 2023 / Published: 29 June 2023
(This article belongs to the Special Issue First Principles Simulations of Minerals)

Abstract

:
We explore the structural properties of Mg, MgO, and MgSiO3 liquids from ab initio computer simulations at conditions that are relevant for the interiors of giant planets, stars, shock compression measurements, and inertial confinement fusion experiments. Using path-integral Monte Carlo and density functional theory molecular dynamics, we derive the equation of state of magnesium-rich liquids in the regime of condensed and warm dense matter, with densities ranging from 0.32 to 86.11 g cm−3 and temperatures from 20,000 K to 5 × 10⁸ K. We study the electronic structure of magnesium as a function of density and temperature and the correlations of the atomic motion, finding an unexpected local maximum in the pair correlation functions that emerges at high densities which decreases the coordination number of elemental magnesium and reveals a higher packing. This phenomenon is not observed in other magnesium liquids, which maintain a rather constant coordination number.

1. Introduction

Magnesium-rich liquids are significant minerals in planetary science because they represent the main constituent of magma oceans [1] that formed when the iron and silicate phases separated during the formation of Earth and super-Earth planets [2,3,4]. Sizable magma oceans have been predicted to persist over long periods of time [5]. Thus, understanding how the properties of magnesium-rich liquids change with pressure and temperature can enable us to better constrain the models of formation and evolution of rocky planets [6]. Magnesium-rich liquids provide valuable information for inertial confinement fusion (ICF) experiments, in which materials are exposed to extreme conditions [7,8,9] that transform liquids into warm dense matter and dense plasmas that are difficult to understand. State-of-the-art laboratories, including the National Ignition Facility (NIF) at Lawrence Livermore National Laboratory, the Omega laser at the University of Rochester, the Z machine at Sandia National Laboratory, and the SLAC laboratory, regularly investigate these conditions to explore matter in the high energy density regime, exploring matter by probing materials at ultrahigh pressure and temperature conditions never explored before, which are present in the interiors of white dwarf stars [10], rocky exoplanets [11,12], and giant planets such as Jupiter [13,14]. While these experiments have accessed the warm dense matter regime and recently been able to achieve fusion conditions [15], theoretical methods have difficulties accessing this regime due to the strong level of ionization, which makes interpretation of experimental measurements a difficult task.
The properties of magnesium-rich liquids are very interesting. Their Grüneisen parameter increases upon compression [16], and their heat capacity can increase beyond the ideal gas limit upon ionization [17]. MgO, SiO2, and MgSiO3 are all insulators in the solid phase that become modest electronical conductors in liquid form at high enough temperature and pressure, which implies that super-Earth planets can generate magnetic fields in their mantle [5,18]. The structure of liquid magnesiosilicates varies substantially with compression [19,20,21]. Certain melts, such as MgSiO3, are good solvents for water. Their solubility has been found to increase with pressure, which has important consequences for the Earth’s mantle [22]. At high temperatures it is important to identify the thermal and pressure ionization regimes [23], as they modify the properties of the liquid as it becomes partially ionized. Recent ab initio calculations have predicted mixed coordination numbers for silica between the six-fold coordinated pyrite-type phase and the nine-fold coordinated Fe2P-type phase at high pressure, as well as the formation of superoxides such as SiO3 and SiO6, which may exist in the mantle of super-Earth planets [24].
In this study, we perform ab initio simulations on the liquids Mg, MgO, and MgSiO3 using a combination of density functional theory molecular dynamics (DFT-MD) and path-integral Monte Carlo (PIMC), providing a detailed characterization of the structure of these liquids.

2. Simulation Methods

Rigorous discussions of the PIMC [25,26,27] and DFT-MD [28,29,30] methods have been provided in previous works, and the details of our simulations have been presented in several of our previous publications [17,31,32,33]. Following earlier publications on hydrogen and helium, PIMC and DFT-MD simulations have been combined to study the properties of materials with core electrons in the regime of warm dense matter, such as lithium fluoride [34], boron [35], aluminum [31], oxygen [36], silicon [37,38], hydrocarbons [38,39], and superionic water [40,41]. However, the structure of magnesium liquids has not been explored in detail in this regime of extreme conditions. We combine PIMC [42] and and DFT-MD simulations as implemented in the Vienna Ab initio Simulation Package (VASP) [43] to generate a consistent Equation of State (EOS) for Mg, MgO, and MgSiO3 that spans across a wide range of ultrahigh temperatures and pressures.
For DFT-MD simulations, we employ Kohn–Sham DFT simulation techniques as implemented in the Vienna Ab initio Simulation Package (VASP) [43] using the projector augmented-wave (PAW) method [44,45]; and molecular dynamics is performed in the NVT ensemble and regulated with a Nosé thermostat. The time step was adapted to the density and the temperature, ranging from 0.16 to 0.44 fs for simulation times from 1000 to 16,000 time steps, to ensure a reliable estimation of the thermodynamic quantities. The pseudopotentials used in our DFT-MD calculations freeze the electrons of the 1s orbital (He-core), which leaves 10, 12, and 6 valence electrons for Mg, Si, and O atoms, respectively. Exchange-correlation effects are described using the Perdew, Burke, and Ernzerhof [46] (PBE) generalized gradient approximation (GGA). However, for elemental Mg, the provided Mg PBE pseudopotential did not provide proper results for high densities; thus, we switched to the local density approximation (LDA). We proceeded in a similar way with MgO, for which the highest densities were simulated using the LDA functional. As shown in [47], the choice of the pseudopotential in ab initio simulations of Mg has very little effect on the computed thermodynamic properties. We obtained a very good agreement between both functionals for a number of densities. Electronic wave functions were expanded on a plane-wave basis with an energy cut-off as high as 7000 eV in order to converge the total energy. Size convergence tests with up to a 65-atom simulation cell at temperatures of 10,000 K and above indicate that pressures converge to better than 0.6%, while internal energies converge to better than 0.1%. At temperatures above 500,000 K, we find that 15-atom supercells are sufficient to obtain converged results for both energy and pressure, as the kinetic energy far outweighs the interaction energy at such high temperatures [31,48]. The number of bands in each calculation was selected such that orbitals with occupation as low as  10 4  were included, which requires up to 14,000 bands in a 15-atom cell at  2 × 10 6  K and two-fold compression. All simulations were performed at the  Γ  point of the Brillouin zone, which is sufficient for high temperature fluids, converging total energy to better than 0.01% compared to a grid of k-points.

3. Results

In this section, provide a detailed characterization of the magnesium-rich liquids that we have obtained from our ab initio simulations of Mg [33], MgO [32], and MgSiO3 [17], spanning the condensed matter, warm dense matter, and plasma regimes. Computations were performed for a series of densities and temperatures ranging from 0.321–86.11 g cm 3  and 104–108 K, respectively. The full range of our EOS data points is shown in temperature–density and pressure–density space in Figure 1, along with the shock Hugoniot curve of each material.
The ideal mixing approximation has been shown to perform well for temperatures above  10 5  K. [53], and the magnitude of nonideal mixing effects was found to be small in this regime, leading to shock Hugoniot curves of MgO and MgSiO3 that are reproduced with sufficient accuracy by combining the EOSs of the elemental substances with the additive volume rule. This concept was extended to other mixtures [49] and good agreement with the shock Hugoniot curves of H2O and CO2 was found between laboratory measurements and theoretical predictions based on the linear mixing approximation. However, this approximation breaks down at lower temperatures, where chemical bonds play an increasingly important role. These bonds change the structure of the liquid, modifying the atomic coordination. Here, we study how the structure of the liquid changes with density and temperature and demonstrate that coordination of magnesium ions is sensitive to the presence of silicon and oxygen.

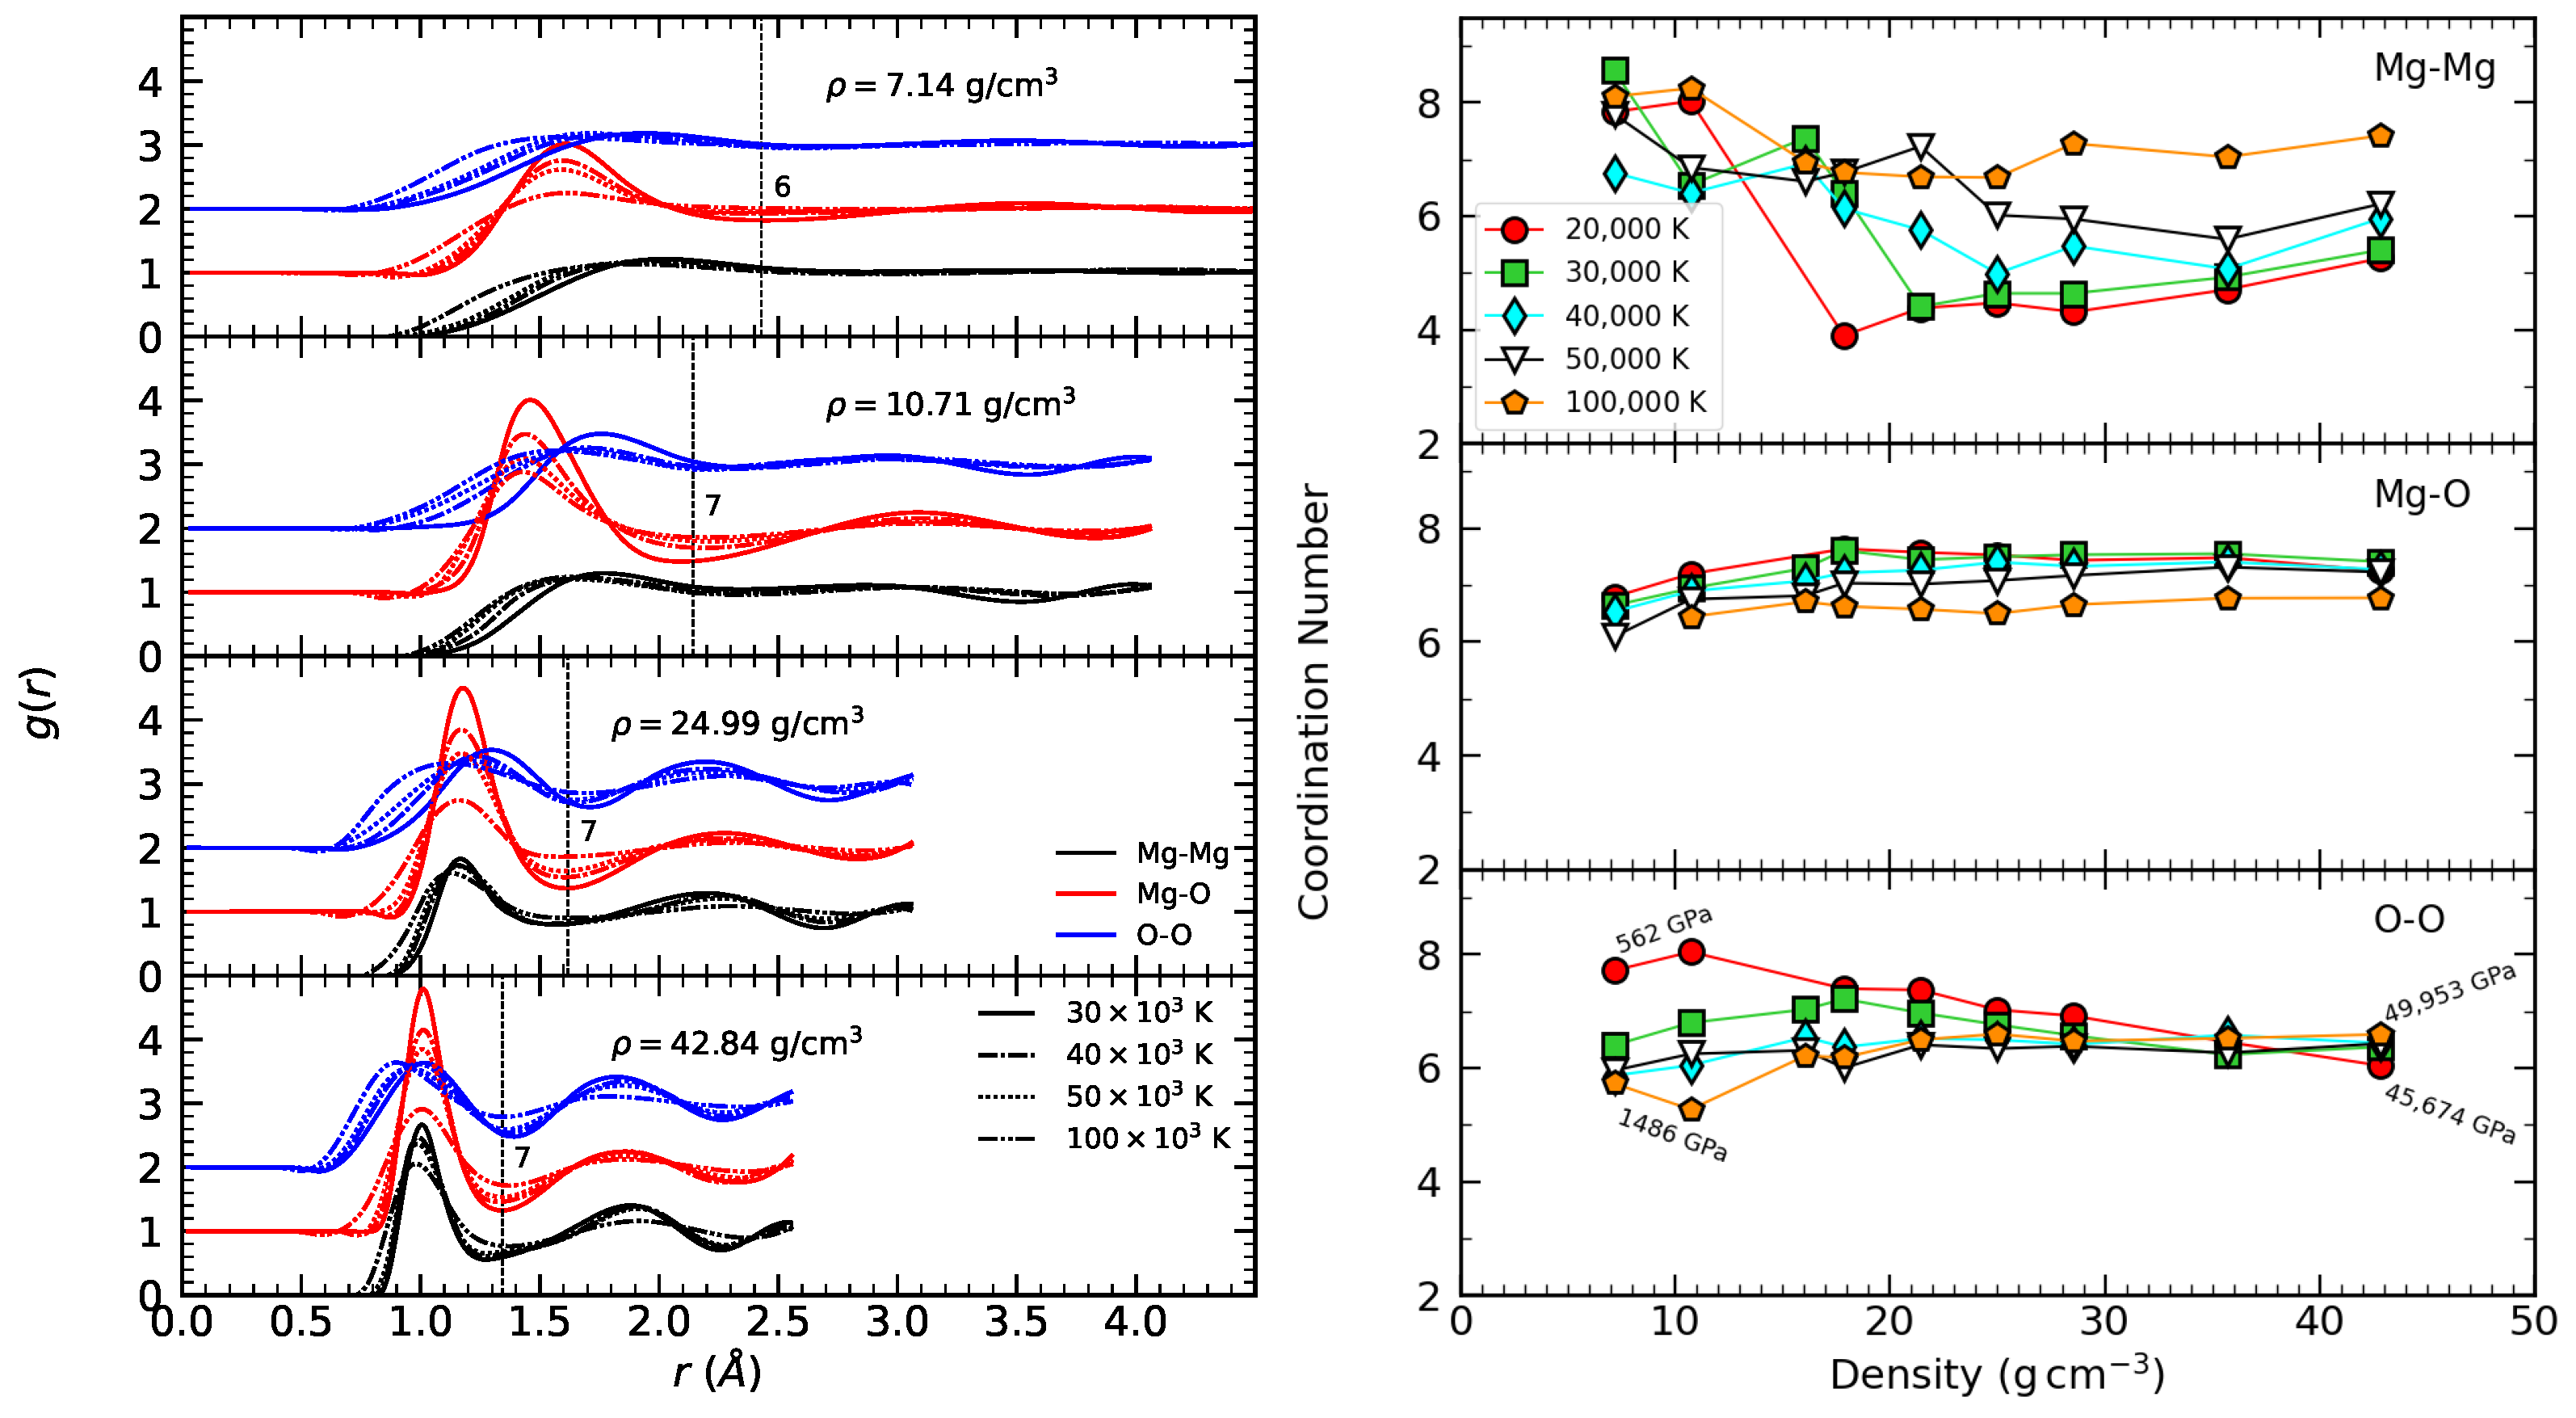
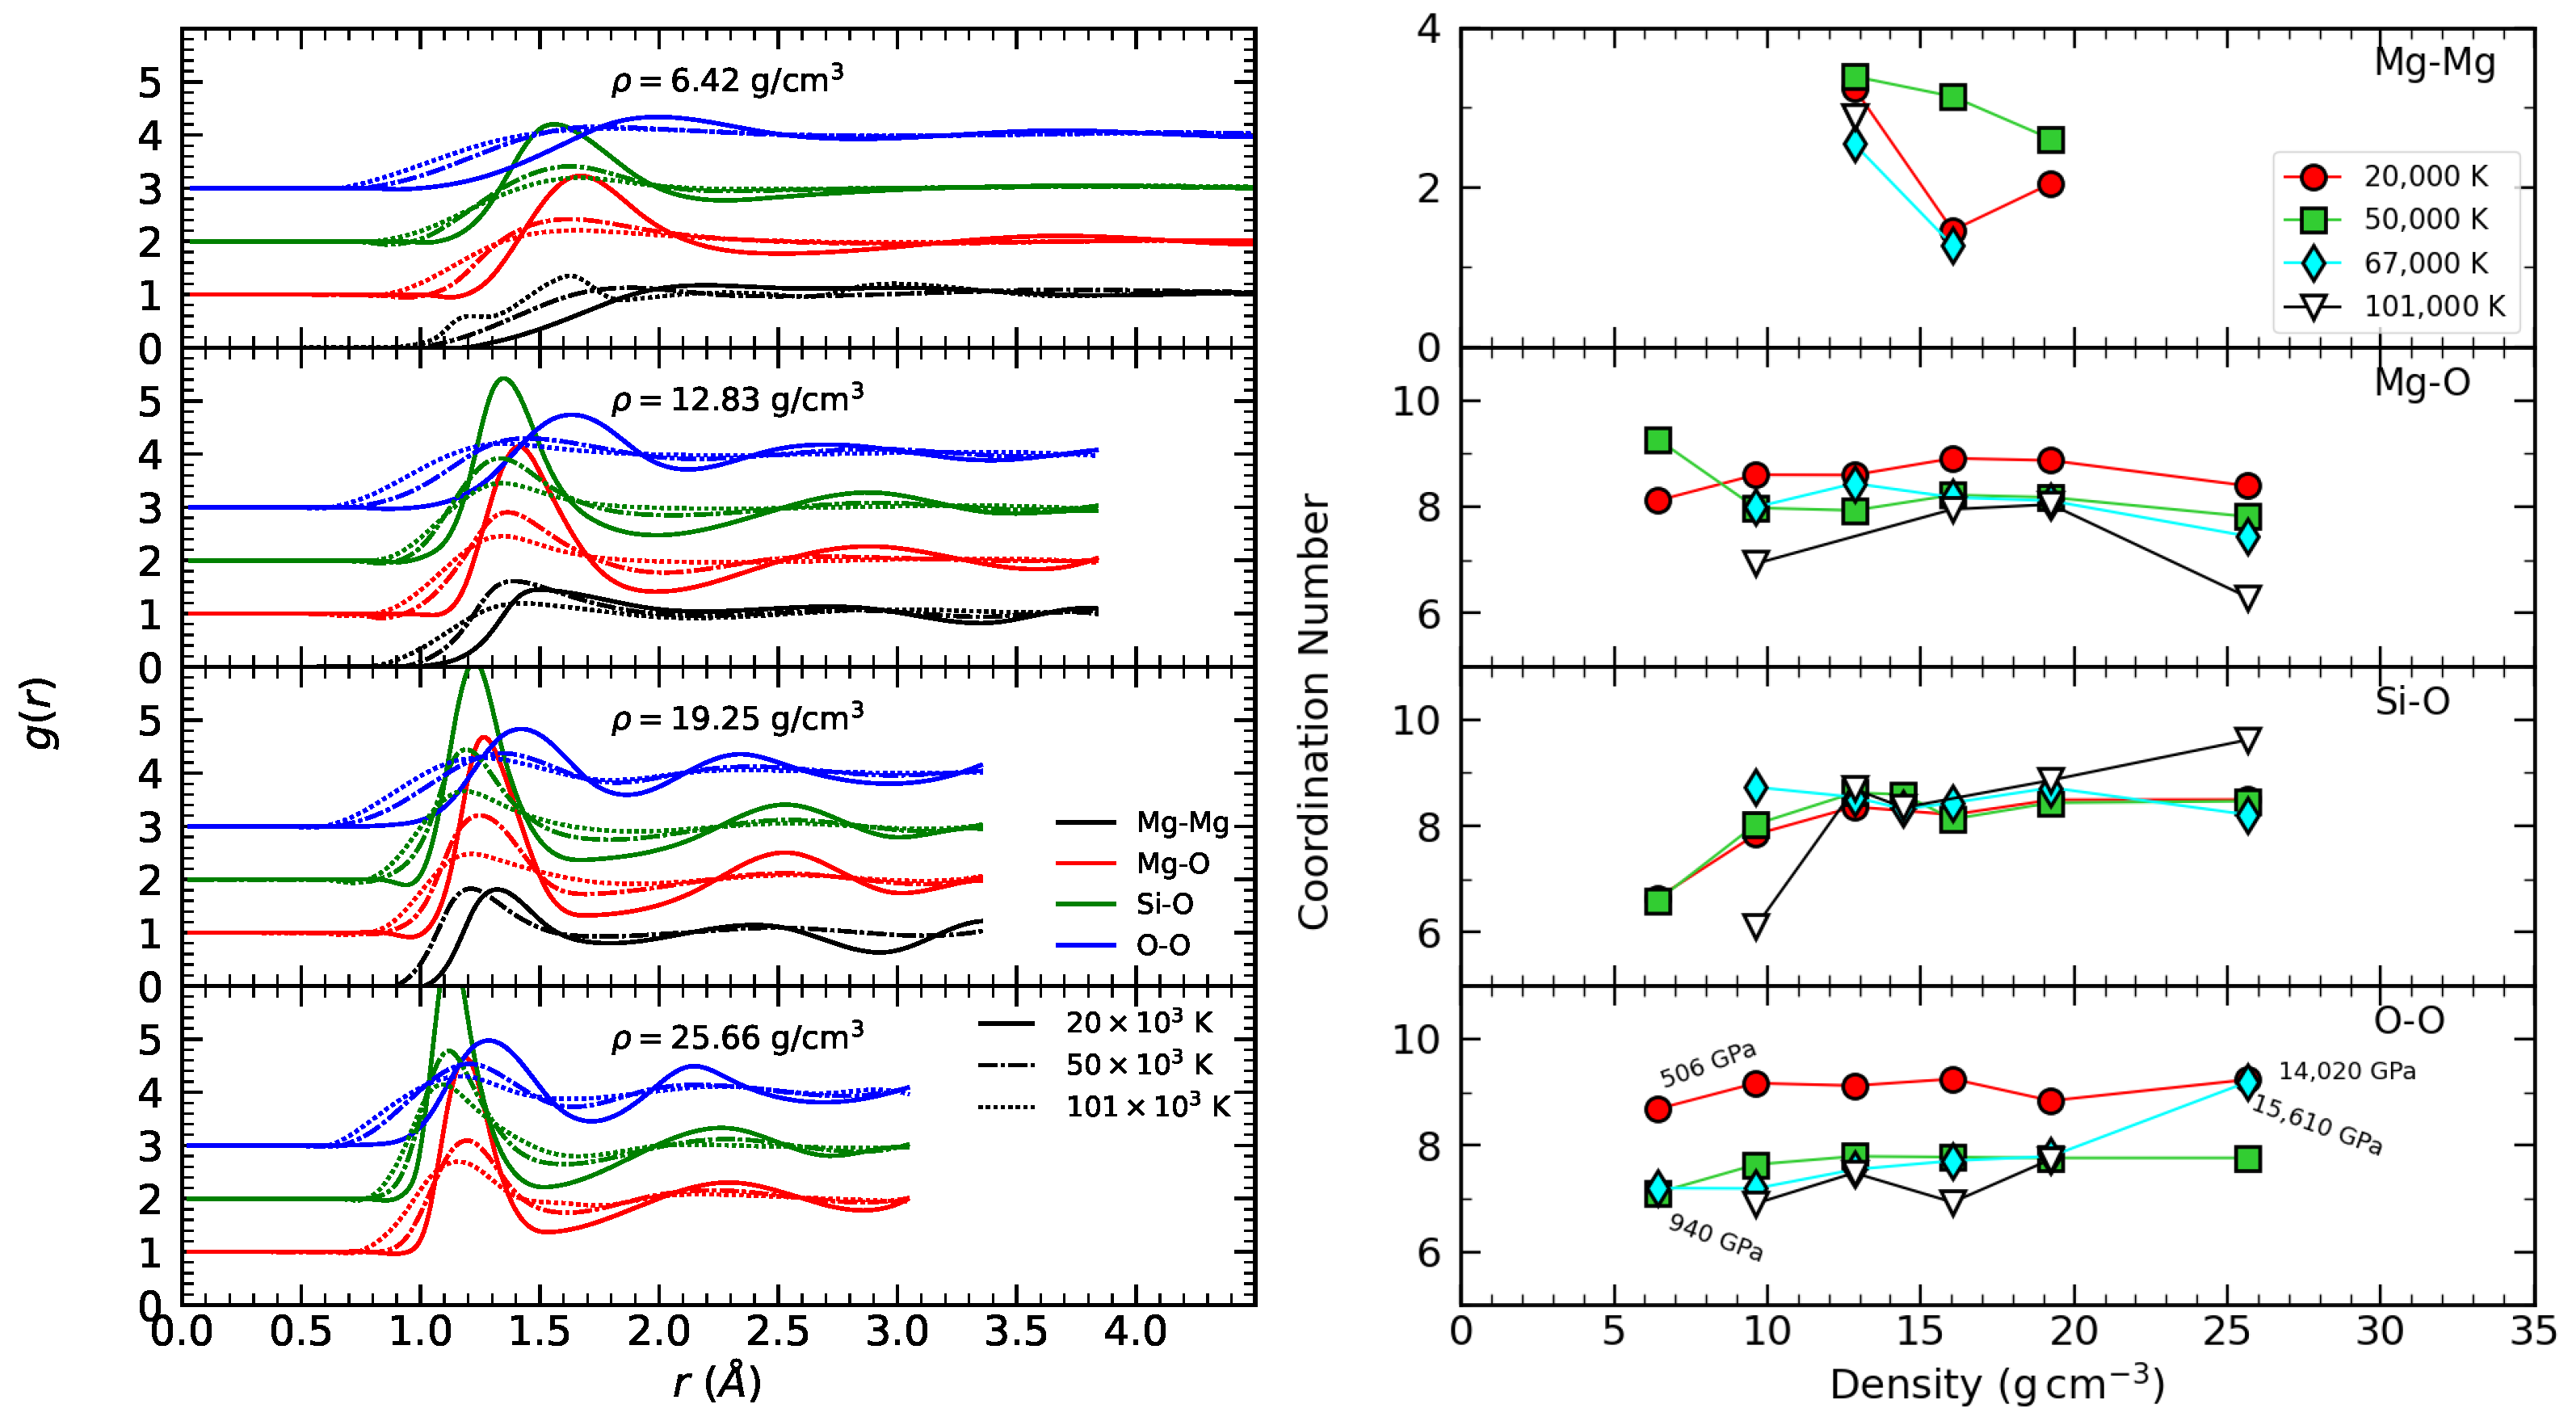
3.1. Radial Distribution Function

The atomic trajectories obtained from DFT-MD simulations can be used to study the local structure of the liquids. Using the radial distribution function, defined by
g α β ( r ) V 4 π r 2 N α N β i = 1 N α j i N β δ r r i j = V 4 π N β r 2 d N β ( r ) d r ,
we can obtain a measure of the structure of the liquid which depends on the temperature and density. Here,  N α  and  N β  are the total number of nuclei of types  α  and  β , respectively, that are contained in the volume V r i j = r i r j  is the separation between nuclei i and j, and  N β ( r )  is the total number of nuclei of species  β  within a sphere of radius r around a nucleus of type  α  [54,55]. This function  g α β ( r )  can be interpreted as the probability of finding a particle of type  α  at a distance r from a particle of type  β .
In Figure 2, we compare the radial distribution functions of liquid magnesium over a wide range of temperatures and densities. For every density, we observe that the average distance to the nearest neighbor provided by the location of the first maximum of  g ( r )  decreases slightly with increasing temperature. At 6.89 g cm 3 , this distance shifts from 1.9 Å at 20,000 K to 1.8 Å at 100,000 K. This 5% decrease is caused by stronger collisions and higher kinetic energy. As expected, the distance to the nearest neighbors depends strongly on density. At the highest density we explored (51.67 g cm 3 ), this distance decreased to 0.96 Å. This value does not depend very much on temperature.
It can be observed in Figure 2 that the shapes of the all  g ( r )  curves at low densities are fairly similar. All curves have two well-defined maxima and two minima. However, for densities of 19.37 g cm−3 and higher, the liquid becomes significantly more structured. The curve develops an additional intermediate local maxima that result in a new local minimum at ∼1.55 Å. As density increases, this intermediate maximum becomes more pronounced. In our simulations at 20,000 K, the system freezes into the simple cubic phase for densities of 34.44 g cm−3 and higher, which corresponds to pressures higher than 24,381 GPa. This simple cubic phase has been observed experimentally at pressures of 1 TPa [56]. Based on crystal structure search methods, a series of other high-pressure structures including body-centered cubic, face-centered cubic, and simple hexagonal and simple cubic phases have been predicted for magnesium [57]. When this crystallization happened in our MD simulations, the subtle features of the liquid  g ( r )  functions became amplified. For temperatures of 30,000 K and above, however, we found that the system remained in a liquid state for all densities. Nonetheless, the local minimum at  r min 1.55  Å persisted. We discuss these changes in terms of the atomic coordination number in the next section.

3.2. Coordination Number

A further measure of the structure of the liquid is the coordination number, provided by
C α β = 4 π N β V 0 r min r 2 g α β ( r ) d r ,
where  C α β  is defined as the number of atoms of type  β  within a spherical region of radius  r min  centered at an atom of species  α  [54]. Here, we adopt the usual convention that  r min  is the location of the first minimum of the radial distribution functions  g α β ( r ) . The integrated nucleus–nucleus pair correlation function provided by  N β ( r )  in Equation (1) can be employed to define a coordination number in Equation (2) when evaluated at the location of the first minimum, that is,  N β ( r min ) = C α β .
In Figure 3, we show the radial distribution functions of liquid elemental magnesium at 30,000 K along with the corresponding integrated nucleus–nucleus pair correlation functions  N ( r ) . The shaded areas in the top panel highlight the interval  [ 0 , r min ]  over which the integration in Equation (2) is performed. As density increases, the position of the first local maximum shifts to smaller distances and the peak becomes narrower, which indicates that the distance to first neighbors is decreasing;  r min  decreases with increasing density as well, reducing the total area below the curve, and consequently the coordination number.
As the atoms grow closer, the liquid develops a new structure, which is reflected in the intermediate local maximum that begins to develop in the  g ( r )  for densities higher than  25.83  g cm 3   at 30,000 K. This can be seen in Figure 3, where it corresponds to a pressure of 13,147 GPa. The typical environment of a magnesium atom after this intermediate local maximum develops is shown at the top of Figure 2, where a new shell of nearest neighbors forms. The slope  ( d E / d ρ ) T  is positive, meaning that pressure ionization is likely to take place [23]. As described in the previous section, a transition occurs in the liquid for higher densities, where a new intermediate maximum appears which abruptly decreases the value of  r min , and as a result reduces the coordination number.
Figure 4 shows the resulting Mg–Mg coordination number in liquid magnesium for a wide range of temperatures and densities. As can be observed in the figure, the coordination number first increases from 14 to 18 at T = 20,000 K, then abruptly drops to 7, consistent with the diagram shown in Figure 2. Something similar occurs at T = 30,000 K, where the coordination number drops from 18 to 8. This is an indication that the system prefers a coordination similar to the simple cubic structure, where the coordination number is 6. For higher temperatures, this intermediate maximum never develops for this range of densities; however, it is likely to appear for  ρ > 60  g cm 3 . For  T >  30,000 K, the coordination number remains between 13 and 18 at all densities.

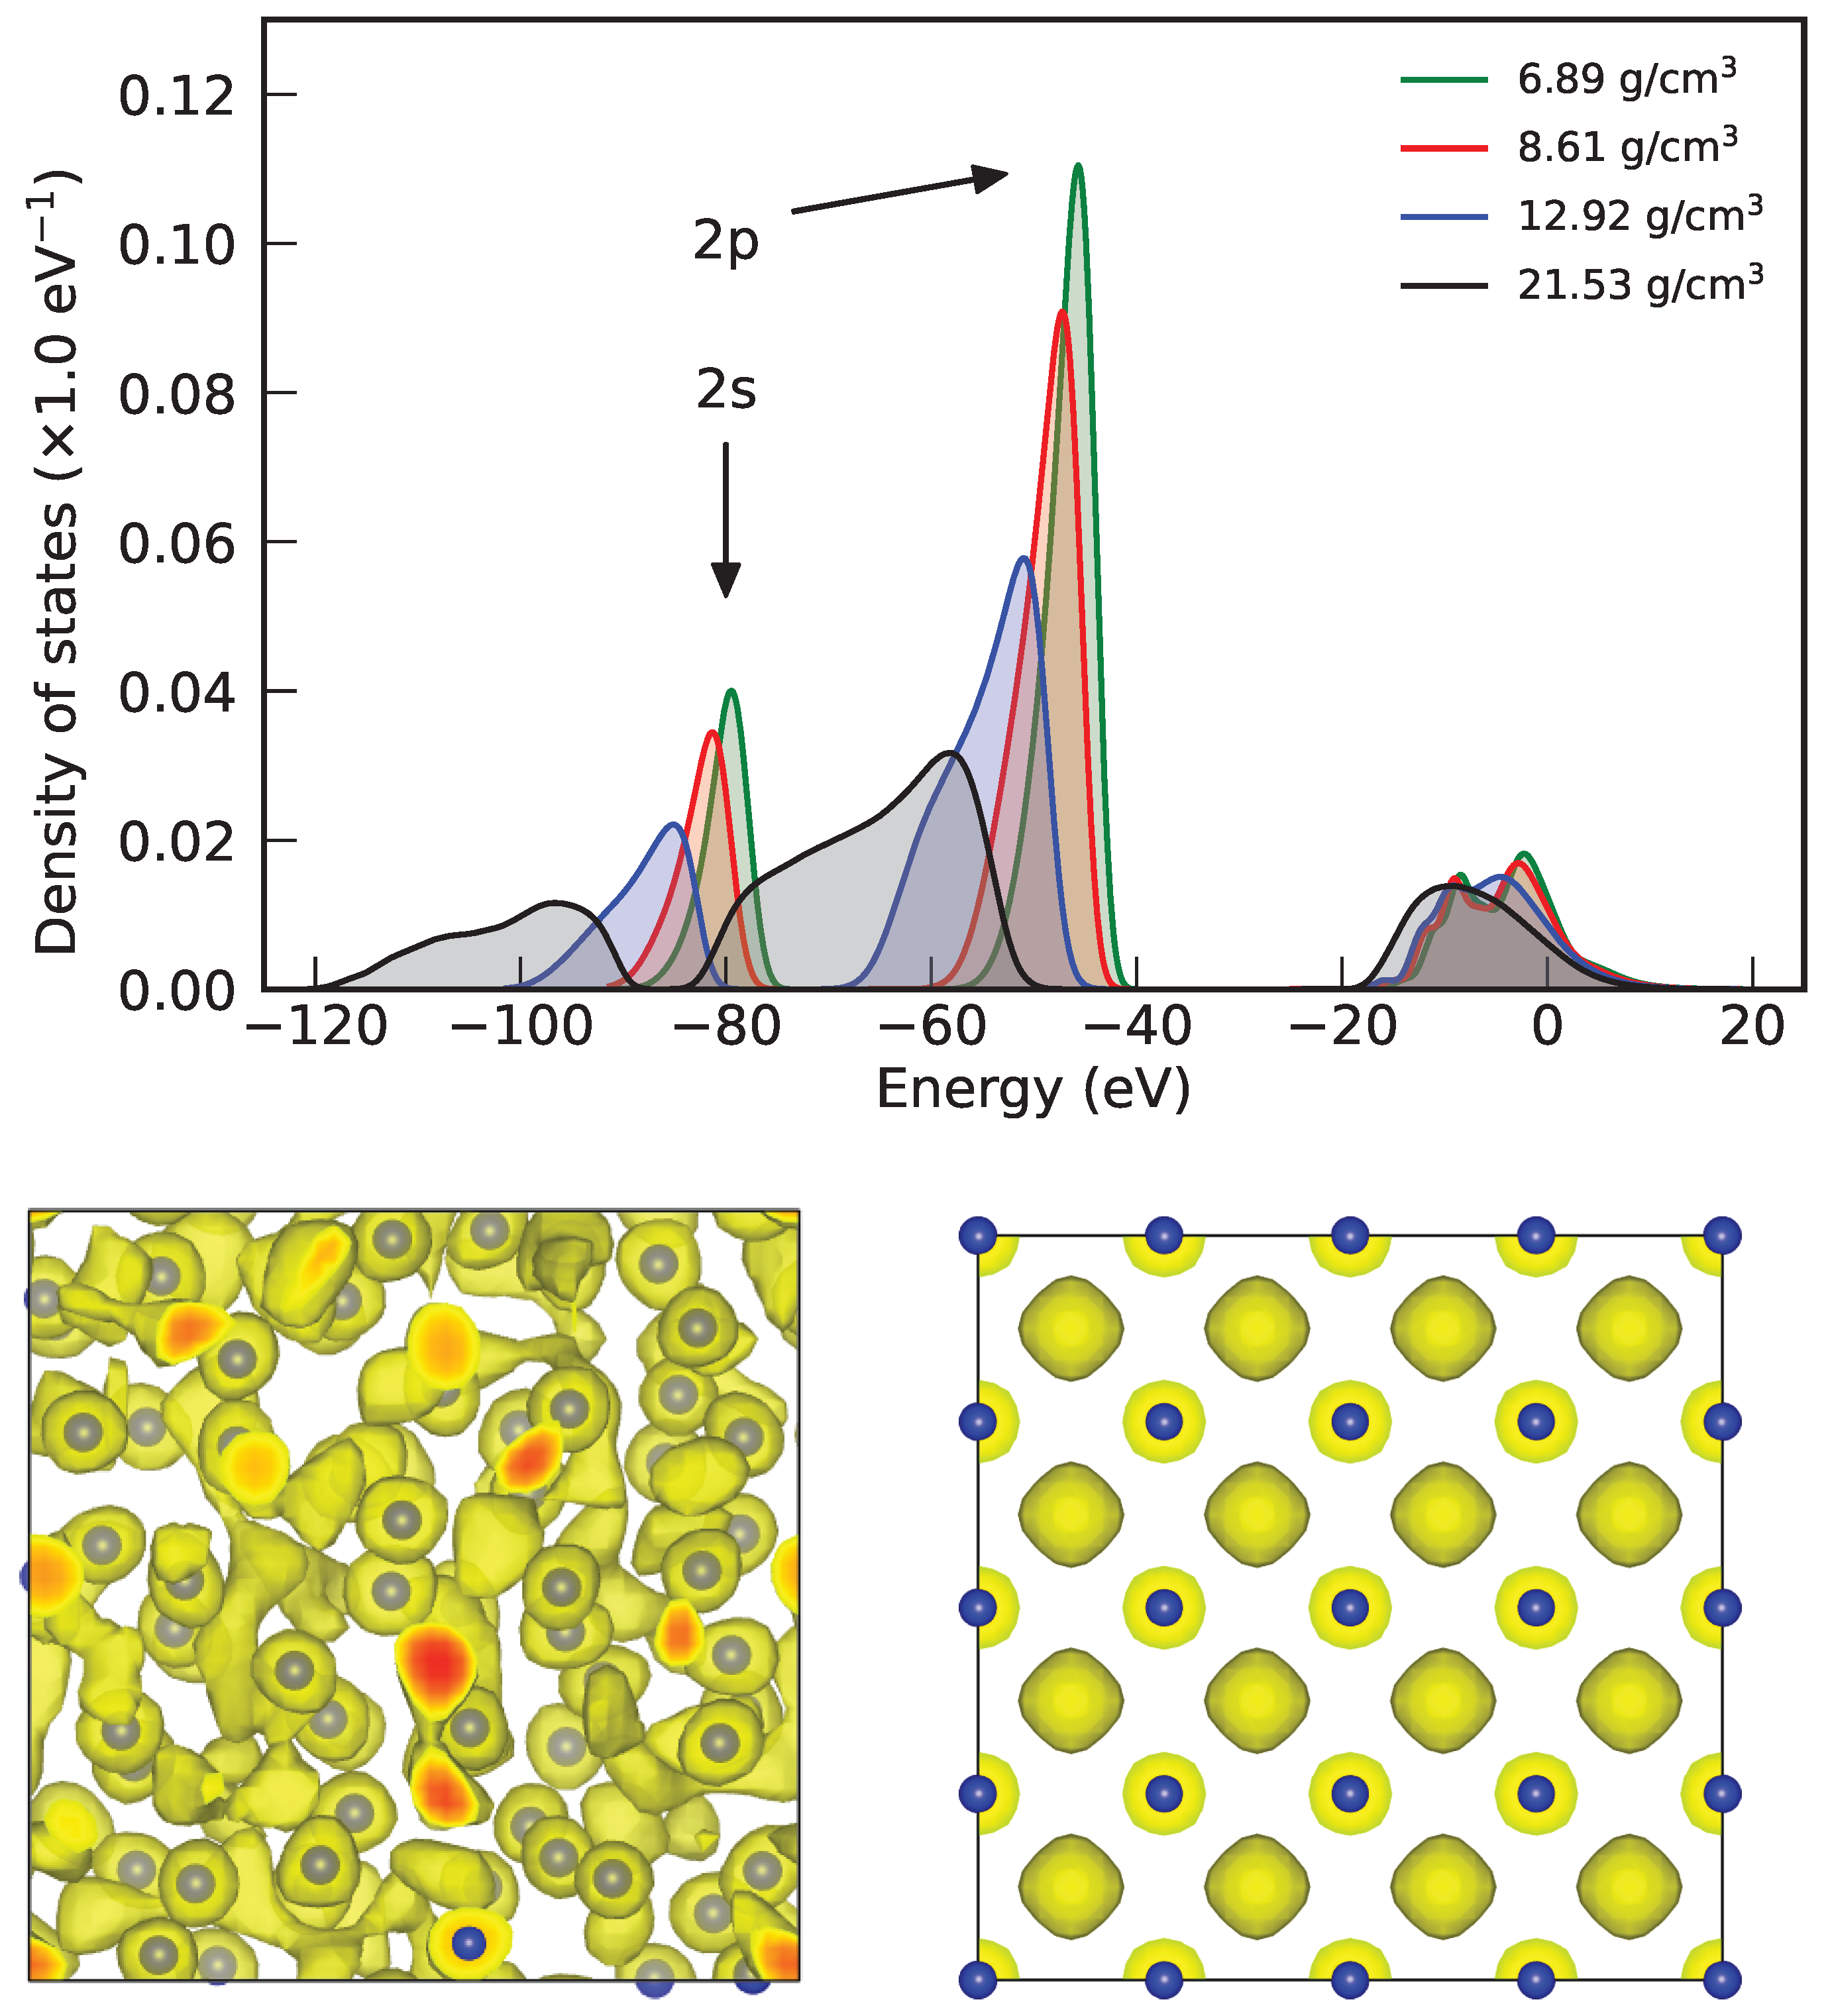
3.3. Electronic Density of States

We identified changes in the electronic structure of Mg at conditions where the structure of the liquid changes and the new intermediate  g ( r )  maximum appears. At ultrahigh pressure, solid magnesium has been predicted to assume an electride structure [56,57,58]. In Figure 5, we show the electronic density of occupied states (DOS) together with the electronic localization function (ELF) for liquid Mg at 30,000 K. In the DOS, with increasing density we observe a clear broadening of the 2s and 2p energy bands and a shift of the eigenvalues towards lower energies. This broadening does not affect the electrons in the conduction band (3s) in a significant way. However, at 21.53 g cm−3 the broadening of the other bands is significant and almost closes the gap between the 2s and 2p bands. According to [33], these conditions fall within the regime of pressure ionization, where the effects of thermal ionization are expected to be small. The ELF depicts location of electronic charge in the between void between the nuclei, which is the typical electride behavior that results from the repulsion of core electrons. For the simple cubic phase of Mg, this has recently been reported by an experimental-theoretical study [56]. With ab initio methods, this has been predicted to occur in many solid structures at high pressure [59]. In Figure 5, we show that the Mg liquid exhibits electride behavior as well, which shares similarities with earlier predictions for liquid iron [60].

3.4. MgO and MgSiO3

We did not observe any intermediate maximum or similar structural changes in our simulations of MgO. In Figure 6, we plot the radial distribution functions (left panel) of MgO, which show that the peaks becomes more pronounced with increasing density; there is no significant change in the topology of these functions such as we observed in elemental Mg, indicating that the structure of the liquid varies smoothly with both temperature and density. At densities of  24.99  g cm 3  and higher, the Mg–Mg and O–O coordination increases, as shown by the separation of the radial distribution function in two distinctive peaks that separate the first nearest neighbors from the second nearest neighbors.
The Mg–Mg coordination number is much higher in liquid elemental Mg (∼14) than in liquid MgO. In the presence of oxygen, the Mg–Mg coordination number decreases from 8 to 4–6 with increasing density, as can be observed in the right-hand panel of Figure 6. However, this lower coordination is comparable to that of elemental Mg (∼7–10) if the density of that system is high and the temperature is low, as shown in Figure 4. The Mg–O coordination number was found to be around 7 for all temperatures and densities, consistent with previous studies of MgO at high temperatures and densities [19]. Similarly, the O–O coordination number remained approximately 6. This is smaller than the value found for the molecular fluid GeO 2  liquid, where the average O–O coordination number was found to be around 9 and the Ge–O coordination number was 2 at 1500 K and low temperatures [63,64]. This is not the case for MgO, which behaves as an atomic fluid. This is comparable to silica, which is predicted to a have a mixed coordination between the six-fold coordinated pyrite-type phase and the nine-fold coordinated Fe2P-type phase at high pressure [24]. Therefore, coordination numbers with oxygen between 6 and 9 are expected at these conditions.
In the case of MgSiO3, the Mg–O coordination number is between 6 and 8, as can be seen in Figure 7, though it is slightly larger than 8 at certain densities. The Mg–Mg  g ( r )  functions in the left panel show that magnesium atoms are not correlated, with no clear signature of a local minimum at most of the conditions that allows a layer of first nearest neighbors to be identified. When identification is possible, the Mg–Mg coordination number in MgSiO3 lies between 2 and 4. While the Mg–O coordination number seems to decrease with density, the Si–O coordination number increases with increasing density regardless of the temperature, moving from 6 to 8. The O–O coordination number is larger in the MgSiO3 liquid than in the MgO liquid, reaching values between 7 to 9 in the latter case, while MgO shows an average of 6 for most conditions. Regarding the distance to nearest neighbors (or bond length), we find that the Mg–O bond length is larger in MgSiO3 than in MgO. For a comparable denisity of ∼25 g cm 3 , this distance is 1.3 Å in MgSiO3, while for MgO the distance is about 1.2 Å. At all conditions, the Si–O bond length is smaller than that for Mg–O, and both are larger than the O–O bond length. As in the case of MgO, there no signature of an abrupt structure transition, as was observed in pure Mg.

4. Conclusions

In this study, we investigated the structural properties of magnesium liquids across a broad range of temperatures and densities using ab initio simulations. We found evidence of a structural transition in liquid Mg around 20 g cm 3 , where the emergence of a new intermediate maximum in the radial distribution function leads to an abrupt decrease in the coordination number with increasing density at low temperatures. This structural change in liquid elemental magnesium is an indication of a transition to electride-type behavior, consistent with recent experimental findings of electride phases of Mg at ultrahigh pressure [56]. This transition does not occur in the other studied magnesium liquids, MgO and MgSiO3, where compression introduces only gradual changes in the coordination. Under no conditions did we find any signature of a stable molecular bond between Mg and O species. However, the Mg and O nuclei exhibit positive correlations that are stronger than those between the other pairs. The presence of silicon increases the O–O coordination number, which is larger in MgSiO3 than in MgO. The Mg–O bond length is smaller in MgO compared to MgSiO3 at similar conditions, and is always larger that the Si–O bond length within the same MgSiO3 liquid. We did not observe the formation of any molecules, making Mg, MgO, and MgSiO3 atomic fluids at the conditions studied.

Author Contributions

Conceptualization, F.G.-C. and B.M.; Methodology, B.M.; Validation, B.M.; Formal analysis, F.G.-C.; Investigation, F.G.-C. and B.M.; Resources, B.M.; Writing—original draft, F.G.-C.; Writing—review & editing, F.G.-C. and B.M.; Visualization, F.G.-C.; Supervision, B.M.; Project administration, B.M.; Funding acquisition, B.M. All authors have read and agreed to the published version of the manuscript.

Funding

This work was supported by the U.S. National Science Foundation (PHY-2020249) as part of the Center for Matter at Atomic Pressures (CMAP).

Data Availability Statement

The equations of state for Mg, MgO, and MgSiO3 can be found in the supplementary materials of [17,32,33], respectively.

Acknowledgments

We thank V.N. Robinson for discussions on electrides.

Conflicts of Interest

The authors declare no conflict of interest.

Abbreviations

The following abbreviations are used in this manuscript:
DFT-MDDensity Functional Theory Molecular Dynamics
PIMCPath-Integral Monte Carlo
VASPVienna Ab initio Simulation Package

References

  1. Labrosse, S.; Hernlund, J.; Coltice, N. A crystallizing dense magma ocean at the base of the Earth’s mantle. Nature 2007, 450, 866–869. [Google Scholar] [CrossRef]
  2. Rogers, L.A. Most 1.6 earth-radius planets are not rocky. Astrophys. J. 2015, 801, 41. [Google Scholar] [CrossRef] [Green Version]
  3. Kovačević, T.; González-Cataldo, F.; Stewart, S.T.; Militzer, B. Miscibility of rock and ice in the interiors of water worlds. Sci. Rep. 2022, 12, 13055. [Google Scholar] [CrossRef] [PubMed]
  4. Kovačević, T.; González-Cataldo, F.; Militzer, B. The homogeneous mixing of MgO and H2O at extreme conditions. Contrib. Plasma Phys. 2023, e202300017. [Google Scholar] [CrossRef]
  5. Soubiran, F.; Militzer, B. Electrical conductivity and magnetic dynamos in magma oceans of Super-Earths. Nat. Commun. 2018, 9, 3883. [Google Scholar] [CrossRef] [PubMed] [Green Version]
  6. Boujibar, A.; Driscoll, P.; Fei, Y. Super-Earth Internal Structures and Initial Thermal States. J. Geophys. Res. Planets 2020, 125, e2019JE006124. [Google Scholar] [CrossRef]
  7. Smith, R.F.; Eggert, J.H.; Jeanloz, R.; Duffy, T.S.; Braun, D.G.; Patterson, J.R.; Rudd, R.E.; Biener, J.; Lazicki, A.E.; Hamza, A.V.; et al. Ramp compression of diamond to five terapascals. Nature 2014, 511, 330–333. [Google Scholar] [CrossRef]
  8. Smith, R.F.; Fratanduono, D.E.; Braun, D.G.; Duffy, T.S.; Wicks, J.K.; Celliers, P.M.; Ali, S.J.; Fernandez-Pañella, A.; Kraus, R.G.; Swift, D.C.; et al. Equation of state of iron under core conditions of large rocky exoplanets. Nat. Astron. 2018, 2, 452–458. [Google Scholar] [CrossRef]
  9. González-Cataldo, F.; Godwal, B.K.; Driver, K.; Jeanloz, R.; Militzer, B. Model of ramp compression of diamond from ab initio simulations. Phys. Rev. B 2021, 104, 134104. [Google Scholar] [CrossRef]
  10. Saumon, D.; Blouin, S.; Tremblay, P.E. Current challenges in the physics of white dwarf stars. Phys. Rep. 2022, 988, 1–63. [Google Scholar] [CrossRef]
  11. Coppari, F.; Smith, R.F.; Wang, J.; Millot, M.; Kim, D.; Rygg, J.R.; Hamel, S.; Eggert, J.H.; Duffy, T.S. Implications of the iron oxide phase transition on the interiors of rocky exoplanets. Nat. Geosci. 2021, 14, 121–126. [Google Scholar] [CrossRef]
  12. Zurkowski, C.; Fei, Y. Mineralogy of Planetary Cores. In Celebrating the International Year of Mineralogy: Progress and Landmark Discoveries of the Last Decades; Springer: Cham, Switzerland, 2023; pp. 207–247. [Google Scholar]
  13. Militzer, B.; Hubbard, W.B.; Wahl, S.; Lunine, J.I.; Galanti, E.; Kaspi, Y.; Miguel, Y.; Guillot, T.; Moore, K.M.; Parisi, M.; et al. Juno Spacecraft Measurements of Jupiter’s Gravity Imply a Dilute Core. Planet. Sci. J. 2022, 3, 185. [Google Scholar] [CrossRef]
  14. González-Cataldo, F.; Wilson, H.F.; Militzer, B. Ab Initio Free Energy Calculations of the Solubility of Silica in Metallic Hydrogen and Application to Giant Planet Cores. Astrophys. J. 2014, 787, 79. [Google Scholar] [CrossRef] [Green Version]
  15. Abu-Shawareb, H.; Acree, R.; Adams, P.; Adams, J.; Addis, B.; Aden, R.; Adrian, P.; Afeyan, B.; Aggleton, M.; Aghaian, L.; et al. Lawson criterion for ignition exceeded in an inertial fusion experiment. Phys. Rev. Lett. 2022, 129, 075001. [Google Scholar] [CrossRef]
  16. de Koker, N.; Stixrude, L. Self-consistent thermodynamic description of silicate liquids, with application to shock melting of MgO periclase and MgSiO3 perovskite. Geophys. J. Int. 2009, 178, 162–179. [Google Scholar] [CrossRef] [Green Version]
  17. González-Cataldo, F.; Soubiran, F.; Peterson, H.; Militzer, B. Path integral Monte Carlo and density functional molecular dynamics simulations of warm dense MgSiO3. Phys. Rev. B 2020, 101, 024107. [Google Scholar] [CrossRef] [Green Version]
  18. Stixrude, L.; Scipioni, R.; Desjarlais, M.P. A silicate dynamo in the early Earth. Nat. Commun. 2020, 11, 935. [Google Scholar] [CrossRef] [PubMed] [Green Version]
  19. Karki, B.B.; Bhattarai, D.; Stixrude, L. First-principles calculations of the structural, dynamical, and electronic properties of liquid MgO. Phys. Rev. B 2006, 73, 174208. [Google Scholar] [CrossRef] [Green Version]
  20. Karki, B.B.; Bhattarai, D.; Stixrude, L. First-principles simulations of liquid silica: Structural and dynamical behavior at high pressure. Phys. Rev. B 2007, 76, 104205. [Google Scholar] [CrossRef] [Green Version]
  21. González-Cataldo, F.; Davis, S.; Gutiérrez, G. Z method calculations to determine the melting curve of silica at high pressures. In Proceedings of the Journal of Physics: Conference Series; IOP Publishing: Bristol, UK, 2016; Volume 720, p. 012032. [Google Scholar]
  22. Mookherjee, M.; Stixrude, L.; Karki, B. Hydrous silicate melt at high pressure. Nature 2008, 452, 983–986. [Google Scholar] [CrossRef] [PubMed]
  23. González-Cataldo, F.; Militzer, B. Thermal and pressure ionization in warm, dense MgSiO3 studied with first-principles computer simulations. AIP Conf. Proc. 2020, 2272, 090001. [Google Scholar] [CrossRef]
  24. Liu, C.; Shi, J.; Gao, H.; Wang, J.; Han, Y.; Lu, X.; Wang, H.T.; Xing, D.; Sun, J. Mixed Coordination Silica at Megabar Pressure. Phys. Rev. Lett. 2021, 126, 035701. [Google Scholar] [CrossRef] [PubMed]
  25. Ceperley, D.M. Fermion nodes. J. Stat. Phys. 1991, 63, 1237–1267. [Google Scholar] [CrossRef]
  26. Ceperley, D.M. Path integrals in the theory of condensed helium. Rev. Mod. Phys. 1995, 67, 279–355. [Google Scholar] [CrossRef]
  27. Ceperley, D. Path integral Monte Carlo methods for fermions. In Monte Carlo and Molecular Dynamics of Condensed Matter Systems; Binder, K., Ciccotti, G., Eds.; Editrice Compositori: Bologna, Italy, 1996; Volume 49, p. 443. [Google Scholar]
  28. Car, R.; Parrinello, M. Unified Approach for Molecular Dynamics and Density-Functional Theory. Phys. Rev. Lett. 1985, 55, 2471–2474. [Google Scholar] [CrossRef] [Green Version]
  29. Payne, M.C.; Teter, M.P.; Allan, D.C.; Arias, T.A.; Joannopoulos, J.D. Iterative minimization techniques for ab initio total-energy calculations: Molecular dynamics and conjugate gradients. Rev. Mod. Phys. 1992, 64, 1045–1097. [Google Scholar] [CrossRef] [Green Version]
  30. Marx, D.; Hutter, J. Ab Initio Molecular Dynamics: Basic Theory and Advanced Methods; Cambridge University Press: Cambridge, UK, 2009. [Google Scholar]
  31. Driver, K.P.; Soubiran, F.; Militzer, B. Path integral Monte Carlo simulations of warm dense aluminum. Phys. Rev. E 2018, 97, 063207. [Google Scholar] [CrossRef] [Green Version]
  32. Soubiran, F.; González-Cataldo, F.; Driver, K.P.; Zhang, S.; Militzer, B. Magnesium oxide at extreme temperatures and pressures studied with first-principles simulations. J. Chem. Phys. 2019, 151, 214104. [Google Scholar] [CrossRef] [Green Version]
  33. González-Cataldo, F.; Soubiran, F.; Militzer, B. Equation of state of hot, dense magnesium derived with first-principles computer simulations. Phys. Plasmas 2020, 27, 092706. [Google Scholar] [CrossRef]
  34. Driver, K.P.; Militzer, B. First-principles simulations of warm dense lithium fluoride. Phys. Rev. E 2017, 95, 043205. [Google Scholar] [CrossRef] [Green Version]
  35. Zhang, S.; Militzer, B.; Gregor, M.C.; Caspersen, K.; Yang, L.H.; Gaffney, J.; Ogitsu, T.; Swift, D.; Lazicki, A.; Erskine, D.; et al. Theoretical and experimental investigation of the equation of state of boron plasmas. Phys. Rev. E 2018, 98, 023205. [Google Scholar] [CrossRef] [Green Version]
  36. Driver, K.P.; Soubiran, F.; Zhang, S.; Militzer, B. First-principles equation of state and electronic properties of warm dense oxygen. J. Chem. Phys. 2015, 143, 164507. [Google Scholar] [CrossRef] [PubMed] [Green Version]
  37. Militzer, B.; Driver, K.P. Development of Path Integral Monte Carlo Simulations with Localized Nodal Surfaces for Second-Row Elements. Phys. Rev. Lett. 2015, 115, 176403. [Google Scholar] [CrossRef] [Green Version]
  38. Driver, K.P.; Soubiran, F.; Zhang, S.; Militzer, B. Comparison of path integral Monte Carlo simulations of helium, carbon, nitrogen, oxygen, water, neon, and silicon plasmas. High Energy Density Phys. 2017, 23, 81–89. [Google Scholar] [CrossRef] [Green Version]
  39. Zhang, S.; Militzer, B.; Benedict, L.X.; Soubiran, F.; Sterne, P.A.; Driver, K.P. Path integral Monte Carlo simulations of dense carbon-hydrogen plasmas. J. Chem. Phys. 2018, 148, 102318. [Google Scholar] [CrossRef] [PubMed] [Green Version]
  40. Wilson, H.F.; Wong, M.L.; Militzer, B. Superionic to Superionic Phase Change in Water: Consequences for the Interiors of Uranus and Neptune. Phys. Rev. Lett. 2013, 110, 151102. [Google Scholar] [CrossRef] [Green Version]
  41. Millot, M.; Hamel, S.; Rygg, J.R.; Celliers, P.M.; Collins, G.W.; Coppari, F.; Fratanduono, D.E.; Jeanloz, R.; Swift, D.C.; Eggert, J.H. Experimental evidence for superionic water ice using shock compression. Nat. Phys. 2018, 14, 297–302. [Google Scholar] [CrossRef]
  42. Militzer, B. Path Integral Monte Carlo Simulations of Hot Dense Hydrogen. Ph.D. Thesis, University of Illinois at Urbana-Champaign, Champaign, IL, USA, 2000. [Google Scholar]
  43. Kresse, G.; Furthmüller, J. Efficient iterative schemes for ab initio total-energy calculations using a plane-wave basis set. Phys. Rev. B 1996, 54, 11169. [Google Scholar] [CrossRef] [PubMed]
  44. Blöchl, P.E. Projector augmented-wave method. Phys. Rev. B 1994, 50, 17953–17979. [Google Scholar] [CrossRef] [Green Version]
  45. Kresse, G.; Joubert, D. From ultrasoft pseudopotentials to the projector augmented-wave method. Phys. Rev. B 1999, 59, 1758–1775. [Google Scholar] [CrossRef]
  46. Perdew, J.P.; Burke, K.; Ernzerhof, M. Generalized Gradient Approximation Made Simple. Phys. Rev. Lett. 1996, 77, 3865–3868. [Google Scholar] [CrossRef] [PubMed] [Green Version]
  47. Mehta, S.; Price, G.; Alfè, D. Ab initio thermodynamics and phase diagram of solid magnesium: A comparison of the LDA and GGA. J. Chem. Phys. 2006, 125, 194507. [Google Scholar] [CrossRef] [Green Version]
  48. Driver, K.P.; Militzer, B. First-principles simulations and shock Hugoniot calculations of warm dense neon. Phys. Rev. B 2015, 91, 045103. [Google Scholar] [CrossRef] [Green Version]
  49. Militzer, B.; González-Cataldo, F.; Zhang, S.; Driver, K.P.; Soubiran, F. First-principles equation of state database for warm dense matter computation. Phys. Rev. E 2021, 103, 013203. [Google Scholar] [CrossRef]
  50. McCoy, C.A.; Marshall, M.C.; Polsin, D.N.; Fratanduono, D.E.; Celliers, P.M.; Meyerhofer, D.D.; Boehly, T.R. Hugoniot, sound velocity, and shock temperature of MgO to 2300 GPa. Phys. Rev. B 2019, 100, 014106. [Google Scholar] [CrossRef]
  51. Root, S.; Shulenburger, L.; Lemke, R.W.; Dolan, D.H.; Mattsson, T.R.; Desjarlais, M.P. Shock Response and Phase Transitions of MgO at Planetary Impact Conditions. Phys. Rev. Lett. 2015, 115, 198501. [Google Scholar] [CrossRef] [PubMed] [Green Version]
  52. Fratanduono, D.E.; Millot, M.; Kraus, R.G.; Spaulding, D.K.; Collins, G.W.; Celliers, P.M.; Eggert, J.H. Thermodynamic properties of MgSiO3 at super-Earth mantle conditions. Phys. Rev. B 2018, 97, 214105. [Google Scholar] [CrossRef] [Green Version]
  53. Militzer, B.; González-Cataldo, F.; Zhang, S.; Whitley, H.D.; Swift, D.C.; Millot, M. Nonideal mixing effects in warm dense matter studied with first-principles computer simulations. J. Chem. Phys. 2020, 153, 184101. [Google Scholar] [CrossRef]
  54. Karki, B.B.; Ghosh, D.B.; Bajgain, S.K. Simulation of Silicate Melts Under Pressure. In Magmas Under Pressure; Elsevier: Amsterdam, The Netherlands, 2018; pp. 419–453. [Google Scholar] [CrossRef]
  55. Allen, M.; Tildesley, D. Computer Simulation of Liquids; Oxford University Press: New York, NY, USA, 1987. [Google Scholar]
  56. Gorman, M.G.; Elatresh, S.; Lazicki, A.; Cormier, M.M.E.; Bonev, S.A.; McGonegle, D.; Briggs, R.; Coleman, A.L.; Rothman, S.D.; Peacock, L.; et al. Experimental observation of open structures in elemental magnesium at terapascal pressures. Nat. Phys. 2022, 18, 1307–1311. [Google Scholar] [CrossRef]
  57. Li, P.; Gao, G.; Wang, Y.; Ma, Y. Crystal structures and exotic behavior of magnesium under pressure. J. Phys. Chem. C 2010, 114, 21745–21749. [Google Scholar] [CrossRef]
  58. Zong, H.; Robinson, V.N.; Hermann, A.; Zhao, L.; Scandolo, S.; Ding, X.; Ackland, G.J. Free electron to electride transition in dense liquid potassium. Nat. Phys. 2021, 17, 955–960. [Google Scholar] [CrossRef]
  59. Miao, M.S.; Hoffmann, R. High pressure electrides: A predictive chemical and physical theory. Accounts Chem. Res. 2014, 47, 1311–1317. [Google Scholar] [CrossRef] [PubMed]
  60. Dai, J.; Kang, D.; Zhao, Z.; Wu, Y.; Yuan, J. Dynamic ionic clusters with flowing electron bubbles from warm to hot dense iron along the Hugoniot curve. Phys. Rev. Lett. 2012, 109, 175701. [Google Scholar] [CrossRef] [PubMed]
  61. Woolman, G.; Robinson, V.N.; Marqués, M.; Loa, I.; Ackland, G.J.; Hermann, A. Structural and electronic properties of the alkali metal incommensurate phases. Phys. Rev. Mater. 2018, 2, 053604. [Google Scholar] [CrossRef] [Green Version]
  62. Ayrinhac, S.; Robinson, V.N.; Decremps, F.; Gauthier, M.; Antonangeli, D.; Scandolo, S.; Morand, M. High-pressure transformations in liquid rubidium. Phys. Rev. Mater. 2020, 4, 113611. [Google Scholar] [CrossRef]
  63. Gutiérrez, G.; Rogan, J. Structure of liquid GeO2 from a computer simulation model. Phys. Rev. E 2004, 69, 031201. [Google Scholar] [CrossRef]
  64. Gutiérrez, G.; Menéndez-Proupin, E.; Loyola, C.; Peralta, J.; Davis, S. Computer simulation study of amorphous compounds: Structural and vibrational properties. J. Mater. Sci. 2010, 45, 5124–5134. [Google Scholar] [CrossRef] [Green Version]
Figure 1. Temperature–density conditions of our PIMC and DFT-MD simulations. The thick dashed lines correspond to the shock Hugoniot curves that we derived for Mg, MgO, and MgSiO3, with initial densities  ρ 0 = 1.736  g cm 3 , 3.570 g cm 3 , and 3.208 g cm 3 , respectively. The full EOS for each material is available in [17,23,32,49]. Shock experiments on MgO from McCoy et al. [50], and Root et al. [51], and shock experiments on MgSiO3 from Fratanduono et al. [52] are included for comparison.
Minerals 13 00885 g001
Figure 2. Radial distribution function of liquid elemental magnesium at eight different densities as a function of temperature. The diagrams on the top correspond to the typical environment of a magnesium atom, which is surrounded by an average of eighteen nearest neighbors within 2.39 Å at 12.92 g cm 3  and 20,000 K (left), and is surrounded by a closer shell of only six to seven neighboring atoms at 25.83 g cm 3  and 20,000 K (right). For the three highest densities in our simulations ( ρ 34.44  g cm 3 ), the system freezes into a simple cubic structure at 20,000 K, which corresponds to the stable phase of Mg observed experimentally at pressures exceeding 1 TPa, the highest pressures ever reported in experiments with Mg to date [56]. The arrows indicate the location of an emerging intermediate local minimum.
Minerals 13 00885 g002
Figure 3. Radial distribution functions  g ( r )  of liquid Mg at  T =  30,000 K (top panel) and the corresponding integrated nucleus–nucleus pair correlation functions  N ( r )  (bottom panel). For densities higher than  25.83  g cm 3 , the  g ( r )  function develops an intermediate maximum which decreases the area below the curves, and consequently reduces the coordination number. The vertical bars indicate the location of the first minimum for the highlighted  g ( r )  functions, corresponding to 6.89, 25.83, and 51.67 g cm 3 .
Minerals 13 00885 g003
Figure 4. Coordination number  C Mg Mg  of liquid magnesium as a function of density for five different temperatures. For densities higher than  25.83  g cm 3 , the  g ( r )  function develops an intermediate maximum, which increases the coordination number. The labels next to the symbols in the right panel indicate the pressure of selected simulations, and the open symbols indicate the coordination number obtained if we ignore the intermediate minimum and perform the integration in Equation (2) up to the next local minimum.
Minerals 13 00885 g004
Figure 5. Top: Electronic density of occupied states of Mg based on our DFT-MD simulations at different densities for a temperature of 30,000 K. The energies of all MD configurations were shifted such that the Fermi energies are aligned at  E = 0  eV. Bottom: ELF function of liquid (left) and solid Mg in the simple cubic phase (right) at 25.83 g cm 3 . In the solid phase (right), the electronic charge (yellow pockets) is localized in the voids between the nuclei, which depicts the typical electride behavior that has been predicted with ab initio methods to occur in many solid structures, including K [58,61,62] and Mg [56]. Here, we find that the Mg liquid exhibits electride behavior (left), which has been predicted to occur in liquid Fe [60].
Minerals 13 00885 g005
Figure 6. Coordination number of liquid MgO (right panel) as a function of density for five different temperatures. The radial distribution functions of MgO (left panel) show the location of the first local minimum (vertical bars for Mg-O) used to calculate the coordination number via Equation (2). The small numbers near the vertical bars indicate the Mg–O coordination number at that local minimum. The Mg–O and O–O  g ( r )  functions have been shifted upwards for clarity. The four text labels in the lowest right panel indicate the pressure in the simulations at the lowest and highest temperatures for two density values.
Minerals 13 00885 g006
Figure 7. Coordination number of liquid MgSiO3 (right panel) as a function of density for four different temperatures. The radial distribution functions of MgSiO3 (left panel) show the location of the first local minimum, used to calculate the coordination number using Equation (2). The Mg–O, Si–O, and O–O  g ( r )  functions have been shifted upwards for clarity. The text labels on top of the symbols in the right panel indicate the pressure of the sample at the corresponding density and temperature.
Minerals 13 00885 g007
Disclaimer/Publisher’s Note: The statements, opinions and data contained in all publications are solely those of the individual author(s) and contributor(s) and not of MDPI and/or the editor(s). MDPI and/or the editor(s) disclaim responsibility for any injury to people or property resulting from any ideas, methods, instructions or products referred to in the content.

