Abstract
X-ray computer tomography (XRT) is a three-dimensional, nondestructive, and thus reproducible examination method that allows for the investigation of internal and external structures of objects. Due to its characteristics, the XRT technique has increasingly established itself as an alternative examination method and is also applied in the field of mineral processing. Within this work, XRT is used to investigate the influence of hydrochloric acid leaching of iron-rich bauxites on grain composition. Acid leaching is a promising method for the beneficiation of iron-rich bauxites for refractories. Many studies have already established that leaching with hydrochloric acid can reduce the Fe2O3 content in bauxites. However, apart from the influence of the leaching process on the composition of the bauxites, aspects such as the influence of the acid on the exact grain constitution or the porosity behavior have rarely been considered so far. To address these open questions, XRT analysis was used to examine and characterize various bauxites. By comparing identical grains before and after leaching, it was observed that in gibbsite bauxites the acid penetration is deeper, and the volume decreases significantly. In diasporic and boehmitic bauxites, clear leaching edges can be seen in which the iron content has been reduced.
1. Introduction
Bauxite as a natural raw material is of great importance for the refractory industry. Despite its essential role and its use in further fields of application, such as aluminum production and the chemical, cement, and abrasives industries [1], the designation “bauxite” is not uniformly defined [2,3,4]. Thus, different bauxites can display vast differences in their chemical and mineralogical composition. Commonalities are defined only by the existence of an aluminum mineral species (usually gibbsite, diaspore, or boehmite) as the main phase, and by the presence of other minerals containing aluminum, silicon, iron, and titanium [2,4,5,6,7]. Explicit proportions for these individual minerals or the presence of other minerals are not specified. The differences between various bauxites, but also the local differences within a bauxite caused by its natural formation, pose a challenge for the selection of suitable bauxite raw materials for specific applications. This is compounded by limited availability of proven raw material sources and compositions [5,7,8]. In particular, the Fe2O3 content is crucial and should be <2%, since a too high iron content reduces the temperature resistance of the materials. At the same time, the Al2O3 content should be as high as possible and range from 80%–85% [9,10]. As a result, raw material availability is severely limited and only a few bauxite raw materials can be used.
In the last years, various studies on the beneficiation of natural raw materials such as bauxites have been carried out to address this issue. In this context, a reduction in iron content is often the focus of investigations [6,11,12]. Among the various processes investigated, acid leaching processes—especially hydrochloric acid leaching—were particularly promising [13,14,15,16,17,18,19]. For example, Dissanayake et al. [17] and Zafar [20] compared the efficiency of HCl and H2SO4 for iron leaching from bauxite and found that HCl dissolves existing iron most effectively. The effect of hydrochloric acid concentration on the amount of dissolved iron was specifically studied by Li et al. [21], for example. Salehi et al. [22] as well as Stein et al. [19] additionally investigated which overall parameter settings are most effective when leaching with hydrochloric acid by applying design of experiment (DoE). However, existing studies and results are often limited to investigation of a single (bauxite) raw material and focus on extracted iron content and kinetic studies as results [16]. In this context, the shrinking core model is often used to describe the kinetics, although contradictory statements can be found in the literature. Swain and Rao [14] and Dissanayake et al. [17] described the dissolution process as a chemically controlled process while Reddy et al. [15] and Zafar [20] described it as diffusion-controlled. Cui et al. [18] report a dependence of the rate-determining step on leaching temperature, such that the process changes from a chemically controlled process to a diffusion-controlled process at T > 90 °C. Valeev et al. [13] also considered the diffusion process to be rate-determining but created their own kinetic model based on the shrinking core model.
A detailed consideration of the raw material in its specific composition and the consideration of the hydrochloric acid influence on individual raw material grains has been neglected in all these studies so far. Thus, it is necessary to investigate the correlation between hydrochloric acid treatment and the physical grain properties of various bauxites, depending on their mineralogical composition. An optimization of the acid leaching process or the determination of suitable process conditions, however, is not the focus of this study.
As many optical 2D investigation methods are limited to the objects’ surface, electrical conductivity, or magnetism, X-ray computer tomography (XRT) has increasingly established itself as a nondestructive and comprehensive 3D testing technique that is not limited to one kind of material. XRT uses X-rays to produce multiple two-dimensional projections of the object from different angular positions that are mathematically reconstructed to a three-dimensional image of the object including its interior geometry [23]. In medical applications, the projections are obtained using a rotating X-ray source and detector around the patient, whereas in industrial applications, both are usually static, with the inspected object rotating between them (Figure 1) [24,25].
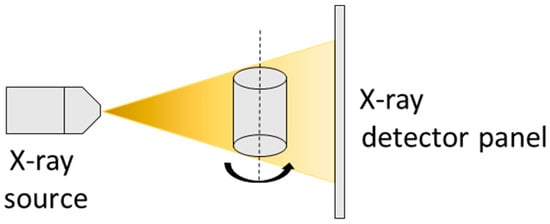
Figure 1.
Schematic diagram of an industrial XRT system.
The technique is based on the variation in image contrast that arises from the attenuation of X-rays by the object it passes. In case of monochromatic X-rays, the attenuation is described by the Lambert–Beer law, or attenuation law:
I0 represents the incident X-ray intensity emitted by the source, while I(L) describes the intensity after the interaction with the object. The line integral with = 0, 1, 2, 3, …, n characterizes the different linear attenuated coefficients for every point of the path L (Figure 2) [24,25,26].
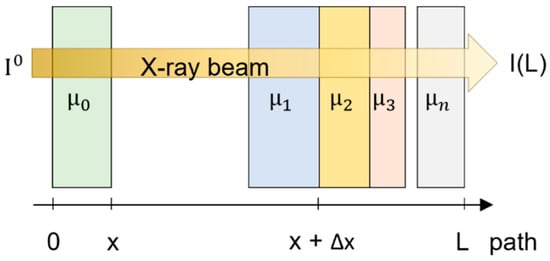
Figure 2.
Attenuation of the X-ray beam for a multi-material object with different attenuation coefficients µ1, µ2, µ3, …, µn by the Lambert–Beer law.
A typical industrial XRT system uses polychromatic X-rays, so the correlation with the energy E of the X-rays must be considered [25,27]:
One 2D-projection basically consists of a map of the linear attenuated coefficient at different positions within the scanned cross-section. The values of are material-specific and vary depending on the thickness L, density ϱ, and atomic number Z of the object [27]. Different linear attenuated coefficients are represented by varying shades of gray ranging from black to white. While areas with low attenuation are depicted in darker shades and black, high attenuations appear in lighter shades and white [28]. As mentioned before, bauxites usually consist of aluminum (Z = 13), silicon (Z = 14), titanium (Z = 22), and iron (Z = 26). Since iron possesses the highest atomic number, it appears as light gray or white in an XRT scan, while air is illustrated as black.
Being nondestructive, noncontact, three-dimensional, and unlimited by the complexity of internal and external surfaces, the XRT technique is appropriate for a wide range of investigations from nano to micro scale. However, despite its advantages, it is generally accepted that the XRT technique is not perfect. Multiple factors affect the quality of an XRT image. They include the limited achievable spatial and voxel resolution, the gray level contrast and the signal-to-noise ratio produced by the X-ray imaging setup. The latter is determined by operating parameters such as X-ray tube accelerating voltage, tube current, detector sensitivity and the size, shape, atomic number, and density of the specimen. Specifically, in a porosity analysis, the highest achievable resolution can impede the detection of the smallest pores. But also, the determination of the measured pore size can be influenced by the voxel size and segmentation errors [29].
Nonetheless, so far, XRT is the only nondestructive method able to measure and investigate the inner and outer geometry and density related distinct regions within the specimen [30] and is thus well suited for the comparative analysis of specimens before and after treatment. Due to these advantages, XRT has already established itself as an investigation method in various fields in the last decades. Promising application possibilities also arise related to the processing of different minerals and raw materials. For example, Spiro et al. [31] studied bacterial removal of pyrite inclusions from coal using XRT to obtain inferences about possible bacterial desulfurization of coal deposits. Lin et al. [32] used the method to kinetically model sulfuric acid leaching from copper sulfides in columns. So far, however, to the best of our knowledge, no specific investigations have been carried out on the influence of hydrochloric acid on the grain properties related to the acid leaching of iron-rich bauxites for the refractory industry. Here, in addition to the iron content, porosity and defect analyses of the treated bauxite raw material for further processing are of special interest.
To have an entire understanding and assessment of the effect of hydrochloric acid treatment on different bauxite grains depending on their chemical and mineralogical composition, three bauxite raw material qualities of different origin were subjected to acid leaching in this study. Due to its nondestructive, three-dimensional, and thus reproducible examination technique, XRT offers the unique possibility to fully examine the same grain before and after treatment, allowing conclusions to be drawn about the depth of penetration of the acid, the leachability of individual iron and aluminum minerals and the influence of acid treatment on the porosity of the grains.
2. Materials and Methods
2.1. Chemical and Mineralogical Characterization of Raw Materials
Within the scope of this study, two grains (A and B) of grain size d > 5.6 mm, each from three different bauxites, IMF1, IMC1, and IMC2, were examined as exemplary samples. The investigated bauxites do not only vary among themselves in their composition, but also within the same bauxite from grain to grain.
X-ray diffraction (XRD) and X-ray fluorescence (XRF) analyses of the starting raw materials were performed for chemical and mineralogical characterization. The XRD analyses were performed qualitatively using a Bruker D8 ADVANCE with Cu-Kα radiation in a range of 5–70° 2Θ. Mineral phases were then assigned using DIFFRAC.EVA V6.0 software by comparing with reference spectra from the Crystallography Open Database and the ICDD PDF−4+ 2022 database.
X-ray fluorescence analyses were performed quantitatively on lithium tetraborate melt tablets in accordance with DIN EN ISO 12677 [33] using a Bruker S8 TIGER wavelength dispersive XRF spectrometer.
2.2. XRT Examination
The investigations of the bauxites before and after leaching were carried out using a ProCon X-Ray CT-Alpha Duo system equipped with a 160 kV nanofocus radiator with a radiation power of 25 W and a 300 kV microfocus radiator with a radiation power of 300 W. The bauxites were evaluated using the nanofocus tube at 125 kV and a radiation power of 25 W. The flat panel detector has a matrix of 2048 × 2048 pixels with a pixel pitch of 200 µm. The reconstruction of the projections, as well as the analysis and visualization of the XRT data were performed using VGStudio Max software from Volume Graphics GmbH. The surface determination of the investigated grains was performed using the VGStudio advanced option. Subsequently, a porosity analysis was carried out for each bauxite grain before and after each leaching using the VGStudio-only threshold algorithm.
2.3. Leaching of Bauxites
After XRT examination, the bauxite grains were leached individually with hydrochloric acid according to the procedure described by Stein et al. [17]. Here, an acid concentration c(HCl) = 9.25 mol/L, a solid–acid ratio s/a = 100 g/L, a leaching temperature Temp = 60 °C, and a leaching time = 60 min were used for all samples. The grains were then washed with demineralized water, dried in air, and the XRT analyses were repeated on the leached samples.
3. Results and Discussion
3.1. Chemical and Mineralogical Characterization of Raw Material Qualities
3.1.1. XRF Results
The XRF results of the three bauxites studied are shown in Table 1. Here, the variability of chemical compositions of bauxites becomes clear. For example, IMF1 and IMC2 have Al2O3 contents in the range of 46%–653%. The Fe2O3 content of both bauxites is relatively high at 23.69% and 21.63%, while the SiO2 contents are comparatively low. IMC1 exhibits significantly higher Al2O3 and SiO2 content. However, the Fe2O3 content of <3% is significantly lower than in the other two bauxites. The weight losses due to ignition also show significant differences. IMF1 shows a very high weight loss of almost 25%, indicating a large content of tri-hydroxides. IMC1 and IMC2 have similar weight losses at nearly 14% and 16%, respectively. Here, the proportion of oxides or mono-hydroxides appears to be significantly higher.

Table 1.
Chemical compositions of bauxites IMF1, IMC1, and IMC2.
3.1.2. XRD Results
The powder X-ray diffraction analyses revealed different mineralogical compositions of the three raw material qualities used (Figure 3). The main component of bauxite IMF1 is gibbsite. Furthermore, kaolinite and boehmite are present as aluminum-bearing minerals. The iron minerals are goethite and hematite. In addition, traces of zircon, quartz, anatase, and rutile could be identified.
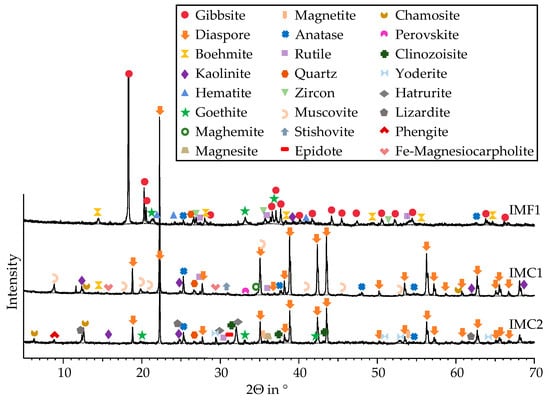
Figure 3.
XRD spectra of bauxites IMF1, IMC1, and IMC2.
In contrast, bauxite IMC1 and bauxite IMC2 contain diaspore as the main mineral component. In bauxite IMC1, muscovite, kaolinite, anatase, stishovite, rutile, quartz, boehmite, perovskite, maghemite, chamosite, and Fe-substituted magnesiocarpholite are also present in minor amounts. In bauxite IMC2, numerous Fe-substituted or Fe-bearing minerals such as epidote, yoderite, clinozoisite, chamosite, goethite, magnetite, hematite, and lizardite can be identified apart from diaspore. Additionally, magnesite, kaolinite, hatrurite, rutile, phengite, quartz, and anatase are present. Thus, bauxite IMC2 in particular has a very complex composition with a large number of different minerals.
3.2. XRT Examination
The reconstructed and analyzed XRT images provide information on the X-ray attenuation of the components, which primarily depends on their intrinsic density ϱ and atomic number Z (Table 2, [34]).

Table 2.
Atomic number Z and intrinsic density ϱ of the elemental components of the bauxites.
Accordingly, elements with a similar atomic number and density like aluminum and silicon have a similar attenuation, which leads to a similar gray value in the reconstructed volume. Both elements are illustrated in darker shades of gray. Consequently, titanium and iron are also represented by a similar light gray value or white due to their similar high atomic number and density.
Since the focus of this investigation is the reduction in iron, the distinguishability of aluminum and silicon is not essential to the analysis of this paper. Nevertheless, aluminum and silicon, with their darker gray values, are clearly distinguishable from iron and titanium, which are visualized in a very bright, almost white color.
Furthermore, the amount of titanium-containing minerals in the bauxites is negligible compared to the iron and, in addition, is not or hardly dissolved by the hydrochloric acid. Thus, by direct comparison before and after leaching, the areas containing titanium-containing minerals can be clearly identified.
The 3D volumes were digitally reconstructed from 1650 to 2000 single 2D-projections and can be holistically investigated not only using optical but also using 3D analysis methods.
The left side of Figures 4, 6 and 9 shows the superimposition of the three-dimensional volumes of each grain before and after acid treatment. To compare the grains before and after leaching, the 3D volumes were color-categorized. The grain before leaching is visualized in red and the grain after leaching in white. Accordingly, the red overlay on the left shows the material superficially removed using acid treatment. In each case, one two-dimensional projection was selected as an example for providing depth information. Thus, on the right, in each case, the two-dimensional view of the grain before the acid treatment is revealed in different gray values. The blue contour represents the outline or surface of the grain after acid treatment, which means that the material outside this contour has been removed using acid treatment. Thus, the influence of the acid treatment on the microstructure of the grain, particularly the penetration depth of the acid into the respective grain, can be fully related in 3D as well as in 2D.
In addition, a porosity analysis was performed for each grain before and after acid treatment to investigate the influence of the acid on the defect volume. Figures 5, 8 and 11 show three-dimensional illustrations of the defect volume before and after leaching. The bauxite itself is completely transparent, revealing only the defect volume. The individual pores were colored according to their size based on the color scale. The left side of the figures represents the defect volume before leaching and the right side shows the defect volume after leaching. It should be noted that the XRT technique is not comparable to other conventional porosity analyses, such as the Archimedes method, as the resolution and accuracy of the XRT-technique are limited by scan settings and the employed thresholding method. Factors influencing the accuracy of porosity determination in both the XRT and Archimedes methods have been described in various publications [35,36]. Nevertheless, due to its nondestructive nature, it is suitable for comparative investigations before and after treatment since the same grains were scanned and analyzed using identical XRT parameters.
The two grains IMC1 A and B in Figure 4 show a different distribution of the lighter, iron-containing phases. While IMC1 A contains larger iron-rich inclusions in the interior grain structure both before and after leaching, the distribution in IMC1 B is finer and more homogeneous. However, in the latter, clear cracks can already be observed throughout the grain before leaching. These are highlighted in white. Bauxite IMC1 exhibits the lowest mass loss due to leaching among the bauxites examined. This can also be confirmed by the XRT reconstructions. The volume removed by leaching is mostly superficial and small for both grain A and grain B. The contours of the surface before and after leaching are almost identical for both grains. The porosity analysis of grain A of the diasporic and boehmite-containing bauxite shows that while the total volume and thus the surface area of the grain hardly changed, the porosity increased by 4.93% due to acid treatment. For grain B, there was no significant change in the defect volume. It increased by only 0.45%. The three-dimensional representation of the defect volume in Figure 5 reveals a fine pore distribution (represented in blue) within both bauxite grains. This remains unchanged after hydrochloric acid leaching. At the surface, the pores slightly increase in size, and the pores displayed in green are now displayed in red for both grains. A potential explanation is the fact that the iron content of this bauxite is very low in comparison (Table 1) and thus few iron phases are dissolved by the acid.
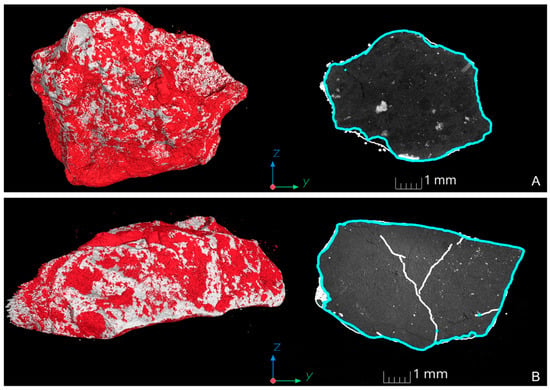
Figure 4.
XRT reconstruction of bauxite IMC1 grains (A,B). Left: Superimposition of the 3D volumes of each grain before (red) and after acid treatment (white). Accordingly, the red overlay on the left shows the material superficially removed using acid treatment. Right: Two-dimensional view of the grain before the acid treatment in different gray values. The blue contour represents the outline or surface of the grain after acid treatment.
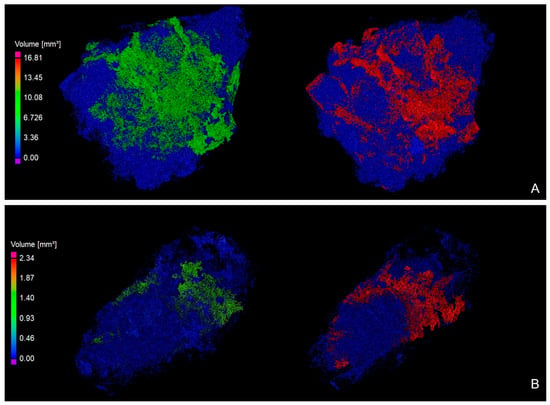
Figure 5.
Three-dimensional illustration of the pore distribution within bauxite IMC1 grains (A,B) before (left) and after leaching (right). The bauxite grains displayed are completely transparent. The pores are visualized in different colors according to their size based on the color scale. Blue represents the smallest and red the largest pore volume.
Figure 6 reveals the inhomogeneity of the bauxite grains due to their formation. Grain A of bauxite IMF1 shows a rather layered but porous structure with a relative defect volume of 7.72%. The dark red color of the three-dimensional visualization of the grain on the left side of Figure 6 displays material removed using acid treatment. In the case of the more porous bauxite containing gibbsite, the acid can penetrate deeper into the grain and dissolve more material. The 2D projection on the right side clearly shows that, especially at the grain surface, brightly displayed iron-rich but also darker represented aluminum-rich phases were thus dissolved. This is also reflected in a comparatively high mass loss due to leaching in bauxite IMF1. A virtual cut of the untreated grain at the location of the 2D projection in Figure 6A reveals the grain’s reconstruction after acid treatment (Figure 7). Thus, a three-dimensional view is gained to provide depth information of the removed volume at this location.
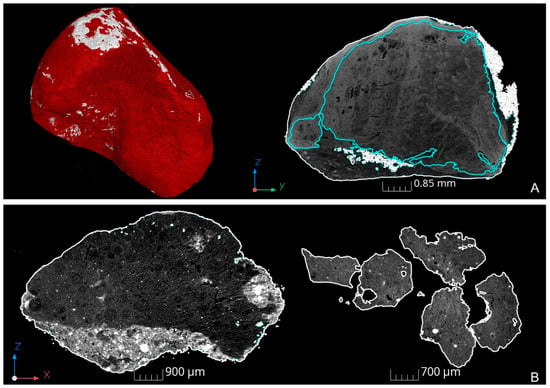
Figure 6.
XRT reconstruction of bauxite IMF1 grains (A,B). (A) Left: Superimposition of the 3D volumes of each grain before (red) and after acid treatment (white). Accordingly, the red overlay on the left shows the material superficially removed using acid treatment. Right: Two-dimensional view of the grain before acid treatment in different gray values. The blue contour represents the outline or surface of the grain after acid treatment. (B) Left: two-dimensional view of the grain before acid treatment in different gray values. Right: two-dimensional view of the grain after the acid treatment in different gray values.
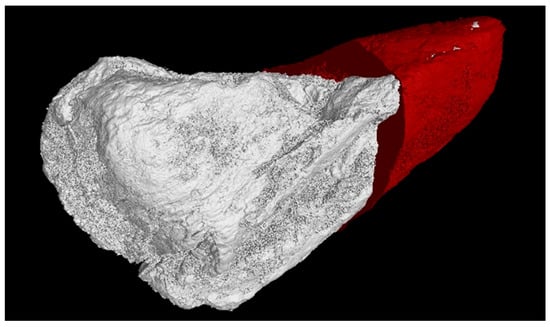
Figure 7.
Virtual section of the XRT reconstruction of untreated bauxite IMF1 grain A shown in red and visualization of grain after acid treatment in white color.
The layered structure of grain A cannot be observed in grain B. Rather, segregated iron-rich and iron-poor regions are present, and the grain exhibits the highest porosity among the studied bauxite grains with a relative defect volume of 30.85%. This high porosity allows for strong and deep penetration of the acid during the leaching process. After leaching, the large iron-rich areas completely disappear. While the low-iron, darker-appearing area is still present, the grain is fragmented due to high porosity and the acid attack.
The three-dimensional display of the pore distribution of the two grains before and after leaching can be seen in Figure 8. It should be noted that the right side of Figure 8B shows the porosity analysis result of the individual fragments, and thus the spatial pore distribution of grain IMF1 B before and after leaching cannot be compared. However, it is possible to compare pore sizes. The areas with larger pores (shown in red) are almost completely dissolved for both grain A and grain B, mainly leaving areas with smaller pores (shown in blue). Accordingly, the defect volume of both grains decreases after acid treatment from 30.85% to 10.57% for grain IMF1 B and from 7.72% to 1.95% for IMF1 A.
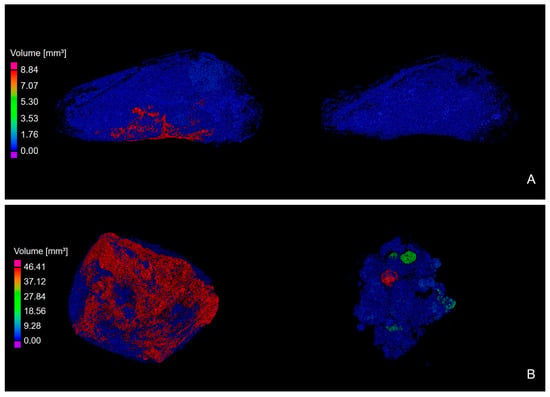
Figure 8.
Three-dimensional illustration of the pore distribution within bauxite IMF1 grains (A,B) before (left) and after leaching (right). The bauxite grains displayed are completely transparent. The pores are visualized in different colors according to their size based on the color scale. Blue represents the smallest and red the largest pore volume.
The bright areas of IMC2 A display iron-rich phases, which are attacked by the hydrochloric acid used during leaching. Figure 9 shows that this area has almost completely been dissolved after leaching. The darker areas of the grain, on the other hand, remain almost unchanged, indicating that the acid could only penetrate poorly due to the higher density of the diaspore-rich bauxite. Here, the relative defect volume before leaching is 3.98%. Diaspore itself is also hardly dissolved by hydrochloric acid compared to gibbsite. This explains why IMC2 A, in contrast to IMF1 B, was not fragmented by the leaching process. As shown in the enlargement in Figure 10, the acid nevertheless penetrates the edge areas of the grain. Therefore, not only the iron-rich phases on the grain surface are dissolved, but also iron-rich phases in the interior of the grain, close to the grain edge. Thus, the lighter areas present before the leaching process disappear after the treatment. The grain appears darker and more porous in the corresponding areas after leaching. Smaller bright areas within this leaching zone that remain unchanged are most likely titanium-containing minerals. This conclusion is supported, among other things, by the fact that the titanium content of the bauxites is very low and is hardly changed by the leaching. The relative defect volume increases to 8.94%. This is also visible in Figure 11 according to the three-dimensional illustration of the defect volume. Before treatment, a finer pore distribution can be observed, which is visualized in blue. After acid treatment, in addition to the finer pores within the grain, larger pores displayed in red can be seen, particularly at the grain surface.
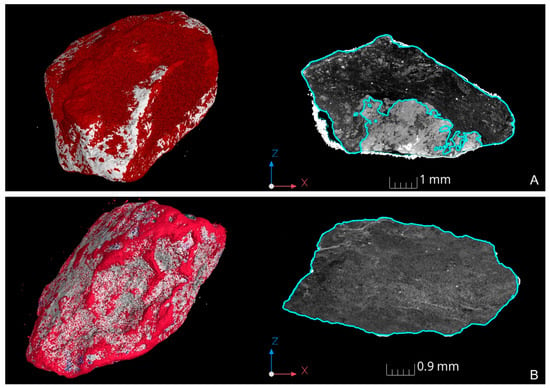
Figure 9.
XRT reconstruction of bauxite IMC2 grains (A,B). Left: Superimposition of the 3D-volumes of each grain before (red) and after acid treatment (white). Accordingly, the red overlay on the left shows the material superficially removed using acid treatment. Right: Two-dimensional view of the grain before acid treatment in different gray values. The blue contour represents the outline or surface of the grain after acid treatment.
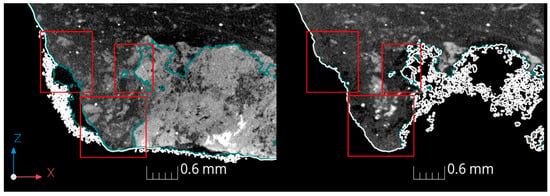
Figure 10.
Magnification of XRT reconstruction of bauxite IMC2 grain A before leaching (left) and after leaching (right).
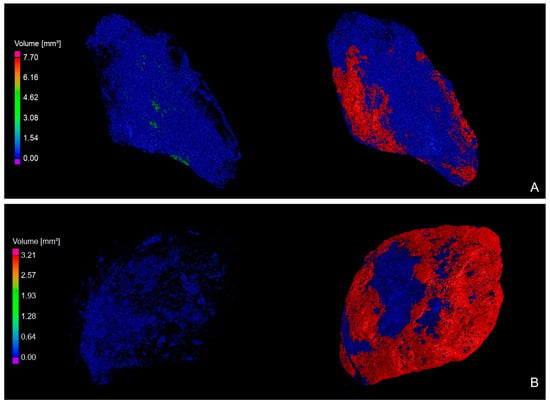
Figure 11.
Three-dimensional illustration of the pore distribution within bauxite IMC2 grains (A,B) before (left) and after leaching (right). The bauxite grains displayed are completely transparent. The pores are visualized in different colors according to their size based on the color scale. Blue represents the smallest and red the largest pore volume.
Due to the low porosity of IMC2 B (0.54%) and the low iron content on the grain surface, hardly any changes due to leaching can be observed (Figure 9). Compared with grain A, the second grain shows a more homogeneous distribution of the high-iron areas, with bright, evenly distributed dots. The surface of the grain was hardly changed by the acid treatment and only a small amount of material was detached from the surface. However, the porosity analysis shows that although the total volume of the grain and thus the surface area has hardly changed due to acid treatment, the acid penetrated the interior of the grain and the relative defect volume increased from 0.54% to 5.57%. For both grains A and B, a fine pore distribution can be seen before leaching, displayed in blue (Figure 11). After acid treatment, larger pores displayed in red on the surface can be observed for both grains.
Figure 12 presents an overview of the results of the porosity analysis of IMC1 grains A and B, IMC2 grains A and B, as well as IMF1 grains A and B untreated (U) and after treatment (T) with hydrochloric acid (X-axis: left to right). The Y-axis illustrates the volume in mm³. The bars represent the total volume of each bauxite grain before and after treatment (U and T). The material volume is displayed in blue and the defect volume in orange color.
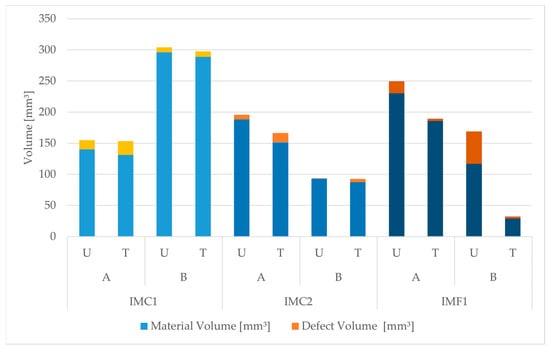
Figure 12.
Illustration of the results of all porosity analyses. From left to right, the X-axis shows the bauxite grains IMC1 A and B, IMC2 A and B, as well as IMF1 A and B untreated (U) and after treatment (T) with hydrochloric acid. The bars, which are displayed in different shades of blue, represent the material volume of the grains, and the defect volume is displayed in varying shades of orange. Here, the two grains A and B of the same bauxite are visualized in the same shade of blue and orange. The Y-axis describes the volume in mm³.
For IMC1, the total volume of both bauxite grains hardly decreased. However, the relative defect volume increased by 4.93% for grain A and 0.45% for grain B due to hydrochloric acid leaching.
It is shown that IMC2 A has both lost total volume and increased porosity (4.96%) due to acid treatment. The porosity of IMC2 B increased by 5.03%.
IMF1 A and B had the highest porosity comparatively before leaching. Due to this and the gibbsite content of the bauxite, the acid treatment greatly reduced the total volume, resulting in IMF1 B dissolving almost completely and remaining in fragments only. Here, it is noticeable that the relative defect volume of both grains has decreased, contrary to the other bauxites, by 5.77% for IMF1 A and by 20.28% for IMF1 B. This is mainly caused by the fact that the acid can easily penetrate the porous part of the bauxite and completely dissolve these areas, resulting in a corresponding reduction in relative defect volume.
4. Conclusions
XRT enables the three-dimensional analytical and visual investigation of the bauxites with very heterogeneous compositions and cavities that are not accessible using other measuring devices. However, despite its advantages, it is generally accepted that the XRT technique is not perfect. Multiple factors affect the quality of an XRT image. Accordingly, XRT cannot be compared with other conventional porosity investigation methods. Nevertheless, it is well suited as a comparative examination method, as it is the only technique that offers the possibility to examine specimens before and after treatment. In this context, the technique allows an exact comparison of the very same bauxite grain before and after leaching. Thus, previously untraceable effects of hydrochloric acid leaching on the composition and porosity distribution of individual bauxite grains can be detected, mapped, and compared.
XRT investigation reveals the dependency of the porosity and main mineral present in the bauxite on the varying degrees of acid penetration. In general, it could be seen that, contrary to expectations, the porosity was not significantly increased using hydrochloric acid leaching. In the case of bauxite IMF1, the relative defect volume even decreased as the very porous areas were completely dissolved.
In gibbsitic and very porous grains, the iron phases in the inner part of the grain can be easily removed but many aluminum-containing phases are also dissolved, which partially destroys the grains. For the application, however, one consequence is that although low iron contents can be achieved by leaching, relatively high quantities of the bauxite’s raw material are lost at the same time.
In diasporic and boehmitic grains, which usually have higher density, the acid cannot penetrate as deeply. Only iron phases at the grain surface and in areas near the edges are dissolved, which leads to increased porosity in these areas after leaching. The contour of the grain after leaching seems nearly unaltered. Furthermore, the XRT reconstructions show that the iron phases in the grain interior cannot be reached in grains of low porosity, so density and composition in the interior remain unchanged. After leaching, grain size and porosity are thus mostly unaffected. However, targeted iron oxide content <2% can hardly be achieved, which means that use of these raw materials in the refractories industry is still limited. The results obtained from the holistic study of the relationships between the mineral distribution, porosity, and acid penetration allow for clear conclusions to be drawn about the influence of hydrochloric acid leaching on the iron content and composition of these raw materials.
Author Contributions
Conceptualization, A.R. and A.S.; methodology, A.R. and A.S.; software, A.R.; validation, A.R. and A.S.; formal analysis, A.R.; investigation, A.R. and A.S.; resources, A.R. and A.S.; writing—original draft preparation, A.R. and A.S.; writing—review and editing, A.R., A.S. and P.Q.; visualization, A.R. and A.S.; supervision, P.Q.; funding acquisition, P.Q. All authors have read and agreed to the published version of the manuscript.
Funding
This research was funded by the European Union of the European Regional Development Fund and Rhineland-Palatinate, project number: 84004803, “Forschungs-kolleg Rheinland-Pfalz” (Max von Laue Institute of Advanced Ceramic Material Properties Studies, CerMaProS) of the Rhineland-Palatinate Ministry for Science and Health and supported by the Open Access Fund of the University of Koblenz.
Data Availability Statement
This study does not include publicly archived datasets.
Conflicts of Interest
The authors declare no conflict of interest.
References
- European Commission. Study on the EU’s List of Critical Raw Materials (2020): Factsheets on Critical Raw Materials; Publications Office of the European Union: Luxembourg, 2020. [Google Scholar] [CrossRef]
- Bárdossy, G. Karst Bauxites: Bauxite Deposits on Carbonate Rocks; Elsevier Scientific Publishing Company: Amsterdam, The Netherlands; Oxford, UK; New York, NY, USA, 1982. [Google Scholar]
- Bárdossy, G.; Aleva, G.J.J. Lateritic Bauxites; Elsevier: Amsterdam, The Netherlands; Oxford, UK; New York, NY, USA; Tokyo, Japan, 1990. [Google Scholar]
- Niggli, P.; Niggli, E. Gesteine und Minerallagerstätten: Zweiter Band: Exogene Gesteine und Minerallagerstätten; Birkhäuser: Basel, Switzerland, 1952. [Google Scholar]
- Arnold, B. Von Rubinen und Implantaten: Aluminiumoxid und Seine Vielfältige Welt; Springer: Berlin/Heidelberg, Germany, 2018. [Google Scholar]
- Sukla, L.B.; Pattanaik, A.; Pradhan, D. Advances in Beneficiation of Low-Grade Bauxite. In Light Metals 2019; Chesonis, C., Ed.; Springer: Cham, Switzerland, 2019; pp. 3–10. [Google Scholar]
- Meyer, F.M. Availability of Bauxite Reserves. Nat. Resour. Res. 2004, 13, 161–172. [Google Scholar] [CrossRef]
- Schönwelski, W. Possible Solutions for the global shortage of refractory bauxite. Refract. Worldforum 2009, 1, 17–19. [Google Scholar]
- Schulle, W. Feuerfeste Werkstoffe: Feuerfestkeramik. Eigenschaften, Prüftechnische Beurteilung, Werkstofftypen, 1. Auflage; Deutscher Verlag für Grundstoffindustrie: Leipzig, Germany, 1990. [Google Scholar]
- Routschka, G.; Wuthnow, H. Praxishandbuch Feuerfeste Werkstoffe: Aufbau—Eigenschaften—Prüfung, 5. Auflage; Vulkan-Verlag: Essen, Germany, 2011. [Google Scholar]
- Kuys, K.; Ralston, J.; Smart, R.; Sobieraj, S.; Wood, R.; Turner, P.S. Surface characterisation, iron removal and enrichment of bauxite ultrafines. Miner. Eng. 1990, 3, 421–435. [Google Scholar] [CrossRef]
- Rao, R.B.; Besra, L.; Reddy, B.R.; Banerjee, G.N. The Effect of Pretreatment on Magnetic Separation of Ferruginous Minerals in Bauxite. Magn. Electr. Sep. 1997, 8, 115–123. [Google Scholar] [CrossRef]
- Valeev, D.; Pankratov, D.; Shoppert, A.; Sokolov, A.; Kasikov, A.; Mikhailova, A.; Salazar-Concha, C.; Rodionov, I. Mechanism and kinetics of iron extraction from high silica boehmite–kaolinite bauxite by hydrochloric acid leaching. Trans. Nonferrous Met. Soc. China 2021, 31, 3128–3149. [Google Scholar] [CrossRef]
- Swain, R.; Rao, R.B. Kinetic study on leaching of iron in Partially Laterised Khondalite rocks for ceramic industrial applications. Int. J. Miner. Process. 2012, 112–113, 77–83. [Google Scholar] [CrossRef]
- Reddy, B.; Mishra, S.; Banerjee, G. Kinetics of leaching of a gibbsitic bauxite with hydrochloric acid. Hydrometallurgy 1999, 51, 131–138. [Google Scholar] [CrossRef]
- Gülfen, G.; Gülfen, M.; Aydın, A.O. Dissolution kinetics of iron from diasporic bauxite in hydrochloric acid solution. Indian J. Chem. Technol. 2006, 13, 386–390. [Google Scholar]
- Dissanayake, D.; Mantilaka, M.; de Silva, R.T.; de Silva, K.; Pitawala, H. Laterite and its potential as an alternative-bauxite. Clean. Mater. 2021, 1, 100016. [Google Scholar] [CrossRef]
- Cui, L.; Guo, Y.; Wang, X.; Du, Z.; Cheng, F. Dissolution kinetics of aluminum and iron from coal mining waste by hydrochloric acid. Chin. J. Chem. Eng. 2015, 23, 590–596. [Google Scholar] [CrossRef]
- Stein, A.; Sax, A.; Quirmbach, P. Iron leaching from nonrefractory grade bauxite: Individual process optimization and prediction by using DOE. Int. J. Ceram. Eng. Sci. 2022, 4, 112–118. [Google Scholar] [CrossRef]
- Afar, Z.I. Determination of semi empirical kinetic model for dissolution of bauxite ore with sulfuric acid: Parametric cumulative effect on the Arrhenius parameters. Chem. Eng. J. 2008, 141, 233–241. [Google Scholar] [CrossRef]
- Li, Z.; Cao, Y.; Han, G.; Fan, G.; Huang, Y. Research on Impurity Removal of Low Grade Bauxite. In Light Metals 2018; Martin, O., Ed.; Springer: Cham, Switzerland, 2018; pp. 23–27. [Google Scholar]
- Salehi, S.; Noaparast, M.; Shafaei, S.Z.; Amini, A.; Heidarnia, A. Iron leaching from bauxite ore in hydrochloric acid using response surface methodology. J. Min. Environ. 2015, 1, 103–108. [Google Scholar] [CrossRef]
- Buzug, T.M. Einführung in Die Computertomographie: Mathematisch-Physikalische Grundlagen der Bildrekonstruktion, Softcover Reprint of the Original, 1st ed.; Springer: Berlin/Heidelberg, Germany, 2004. [Google Scholar]
- Grangeat, P. Tomography; ISTE Ltd. and John Wiley & Sons Inc: London, UK, 2009. [Google Scholar]
- Carmignato, S.; Dewulf, W.; Leach, R. Industrial X-ray Computed Tomography; Springer International Publishing: Cham, Switzerland, 2018. [Google Scholar]
- Baruchel, J.; Buffiere, J.-Y.; Maire, E.; Merle, P.; Peix, G. X-ray Tomography in Material Science: Workshop on the Application of X-Ray Tomography in Material Science, Held Oct. 1999 in Villeurbanne; Hermes Science: Paris, France, 2000. [Google Scholar]
- Phillips, D.H.; Lannutti, J.J. Measuring physical density with X-ray computed tomography. NDT E Int. 1997, 30, 339–350. [Google Scholar] [CrossRef]
- Romans, L.E. Computed Tomography for Technologists: A Comprehensive Text; Wolters Kluwer/Lippincott Williams & Wilkins: Philadelphia, PA, USA, 2011. [Google Scholar]
- Villarraga-Gómez, H.; Herazo, E.L.; Smith, S.T. X-ray computed tomography: From medical imaging to dimensional metrology. Precis. Eng. 2019, 60, 544–569. [Google Scholar] [CrossRef]
- Kruth, J.P.; Bartscher, M.; Carmignato, S.; Schmitt, R.; de Chiffre, L.; Weckenmann, A. Computed tomography for dimensional metrology. CIRP Ann. 2011, 60, 821–842. [Google Scholar] [CrossRef]
- Spiro, C.L.; Holmes, D.S.; Lobos, J.; Maylotte, D.H. Use of x-ray computed tomography to examine microbial desulfurization of lump coal. Energy Fuels 1987, 1, 76–79. [Google Scholar] [CrossRef]
- Lin, Q.; Neethling, S.J.; Courtois, L.; Dobson, K.J.; Lee, P.D. Multi-scale quantification of leaching performance using X-ray tomography. Hydrometallurgy 2016, 164, 265–277. [Google Scholar] [CrossRef]
- DIN EN ISO 12677:2011; Chemische Analyse von feuerfesten Erzeugnissen durch Röntgenfluoreszenz-Analyse (RFA)—Schmelzaufschluss-Verfahren. International Organization for Standardization: Geneva, Switzerland, 2011.
- Demtröder, W. Experimentalphysik 4: Kern-, Teilchen- und Astrophysik, 5. Auflage; Springer: Berlin/Heidelberg, Germany, 2017. [Google Scholar]
- Slotwinski, J.A.; Garboczi, E.J.; Hebenstreit, K.M. Porosity Measurements and Analysis for Metal Additive Manufacturing Process Control. J. Res. Natl. Inst. Stand. Technol. 2014, 119, 494–528. [Google Scholar] [CrossRef] [PubMed]
- Wits, W.W.; Carmignato, S.; Zanini, F.; Vaneker, T.H. Porosity testing methods for the quality assessment of selective laser melted parts. CIRP Ann. 2016, 65, 201–204. [Google Scholar] [CrossRef]
Disclaimer/Publisher’s Note: The statements, opinions and data contained in all publications are solely those of the individual author(s) and contributor(s) and not of MDPI and/or the editor(s). MDPI and/or the editor(s) disclaim responsibility for any injury to people or property resulting from any ideas, methods, instructions or products referred to in the content. |
© 2023 by the authors. Licensee MDPI, Basel, Switzerland. This article is an open access article distributed under the terms and conditions of the Creative Commons Attribution (CC BY) license (https://creativecommons.org/licenses/by/4.0/).