Article

Three-Dimensional Electromagnetic Imaging of Geothermal System in Gonghe Basin

1
College of Geophysics, Chengdu University of Technology, Chengdu 610059, China
2
The Institute of Geophysical and Geochemical Exploration, Langfang 065000, China
3
Key Laboratory of Geophysical Electromagnetic Detection Technology, Ministry of Natural Resources, Langfang 065000, China
4
Chinese Academy of Geological Sciences, Beijing 100081, China
5
Center for Hydrogeology and Environmental Geology, CGS, Baoding 071051, China
*
Author to whom correspondence should be addressed.
Minerals 2023, 13(7), 883; https://doi.org/10.3390/min13070883
Submission received: 13 May 2023 / Revised: 17 June 2023 / Accepted: 27 June 2023 / Published: 29 June 2023
(This article belongs to the Section Mineral Exploration Methods and Applications)

Abstract

:
To better understand the geothermal system of the Gonghe Basin, we deployed 471 magnetotelluric survey points with an average distance of 2~3 km, covering the eastern and southern areas of the Basin. We used ModEM inversion software to carry out 3D inversion of 431 survey points and established a 3D-electrical model at a depth of 50 km in the area. The resistivity model shows that the low resistivity in the shallow part of the basin is related to the Cenozoic loose sedimentary cover, while the resistivity values of the mountains around the basin and the magmatic rock uplift zone are higher. The electrical model also shows that the high-conductivity layer is widely distributed in the middle and lower crust (15~35 km) of the basin, and direction of the high-conductivity layer is consistent with that of NW–SE fault in the basin. These high-conductivity layers may be the principal reason for the high heat flow values in the Gonghe Basin. Our resistivity model also shows that there is an obvious discontinuity between high- and low-resistivity blocks at different depths in the middle and upper crust. These discontinuities are consistent with the faults observed on the surface, which are related to the strong topographic relief. Our electrical model shows that these faults in the middle and upper crust are connected with the high-conductivity layer as the channel of heat transfer to the shallow part. Finally, the heat energy is enriched in the Triassic granite to form dry hot rock (HDR). The 3D-magnetotelluric imaging results depict the 3D-distribution characteristics of the geothermal system in the eastern and southern parts of the Gonghe Basin.

1. Introduction

As a mineral resource, geothermal resources have attracted more and more attention because of their clean, stable, renewable, and abundant reserves [1,2]. Geothermal resources can be divided into hydrothermal geothermal resources and HDR geothermal resources [3]. Hydrothermal geothermal resources, as the main target of development and utilization at this stage, only account for about 10% of the proven geothermal resources, and more than 90% of the available geothermal resources exist in the form of HDR. It is conservatively estimated that the reserves of HDR resources contained in the depths of 3 to 10 km in the global crust are equivalent to 30 times of the energy contained in all oil, natural gas, and coal in the world [4]. Therefore, HDR resources are more attractive than hydrothermal geothermal resources [5,6].
Since the United States launched the world’s first HDR test project, the Fenton Hill test project, in 1973, many countries have invested in HDR geothermal resource research [7]. To date, 47 Enhanced Geothermal System(EGS) engineering projects have been established worldwide [8]. For HDR engineering, the primary task should be to detect potential HDR resources. In this process, in addition to the traditional geological characteristics and geochemical analysis, geophysical exploration methods play an important role in determining potential HDR resources. Among them, electromagnetic (EM) methods are very useful because they are highly sensitive to changes in the resistivity of underground media. The presence of heat, salt, and conductive fluids with good connections will lead to high-conductivity anomalies in underground media [9]. Partial melting or high-temperature anomalies of underground media are also related to high-conductivity or low-resistivity anomalies [10]. In addition, resistivity structural characteristics of underground media can provide stratigraphic and structural information [9]. The magnetotelluric survey (MT) is a passive electromagnetic geophysical method that detects underground resistivity structure by measuring the response of the underground medium in the natural alternating electromagnetic field. This method is highly sensitive to the change of resistivity with depth. Magnetotelluric methods have been widely used in oil and gas exploration, geothermal exploration, metal ore exploration, and groundwater monitoring. In geothermal applications, magnetotelluric survey is often used as an exploration tool to delineate potential geothermal targets [11,12,13,14].
The Gonghe Basin is located at the front of the inland expansion of the northeastern margin of the Tibetan Plateau, which is the junction of the Qinling–Qilian–Kunlun tectonic belt. The Gonghe Basin is characterized by high heat flow with an average geothermal flow of 102.2 mW.m−2 [15,16], far higher than the average geothermal flow in mainland China of 60.4 mW.m−2.
Several geophysical exploration, such as aeromagnetic survey, natural seismic background noise tomography, and magnetotelluric sounding, as well as geothermal survey and numerical simulations have been carried out around the HDR in the western regions of the Gonghe Basin. Some achievements have been made in the characteristics of geothermal flow, the spatial distribution of HDR, and the evaluation of HDR’s geothermal resource potential [16,17,18,19,20,21,22,23,24]. These research work based on geophysical exploration and geological survey has greatly promoted the analysis of heat source in the Gonghe Basin [16] as well as the prediction of geothermal model [25] and the research work of geothermal resources in the Gonghe Basin. However, most research results are presented as two-dimensional profiles. Given the varied focuses of different scholars, merely combining existing research is insufficient to establish a rational, objective, and region-specific geothermal model. Indeed, the study of genetic mechanisms (where does heat come from and is it sustainable?), which constitutes one of the most fundamental and core aspects of HDR research, has yet to reach a consensus [26,27,28,29,30]. This lack of agreement hampers the evaluation, sensible development, and utilization of HDR geothermal resources.
Moreover, the three-dimensional underground structure of the Gonghe Basin, particularly in the eastern region, has not been adequately studied, and the geothermal system is still unclear. In this study, we used 431 points of MT data to carry out 3D-MT imaging measurements in the eastern part of the Gonghe Basin to describe the EGS in the eastern and southern parts of the Gonghe Basin with 3D-resistivity structure. Our primary objective is to obtain the 3D distribution of resistivity bodies in the crust and study the characteristics of resistivity changes and their relationship with the characteristics of geothermal geological indicators.
We first briefly introduce the geological background of the Gonghe Basin and the analysis and processing process of magnetotelluric data. Then, we will present the 3D-MT imaging results and provide some explanations and discussions.

2. Geological Background

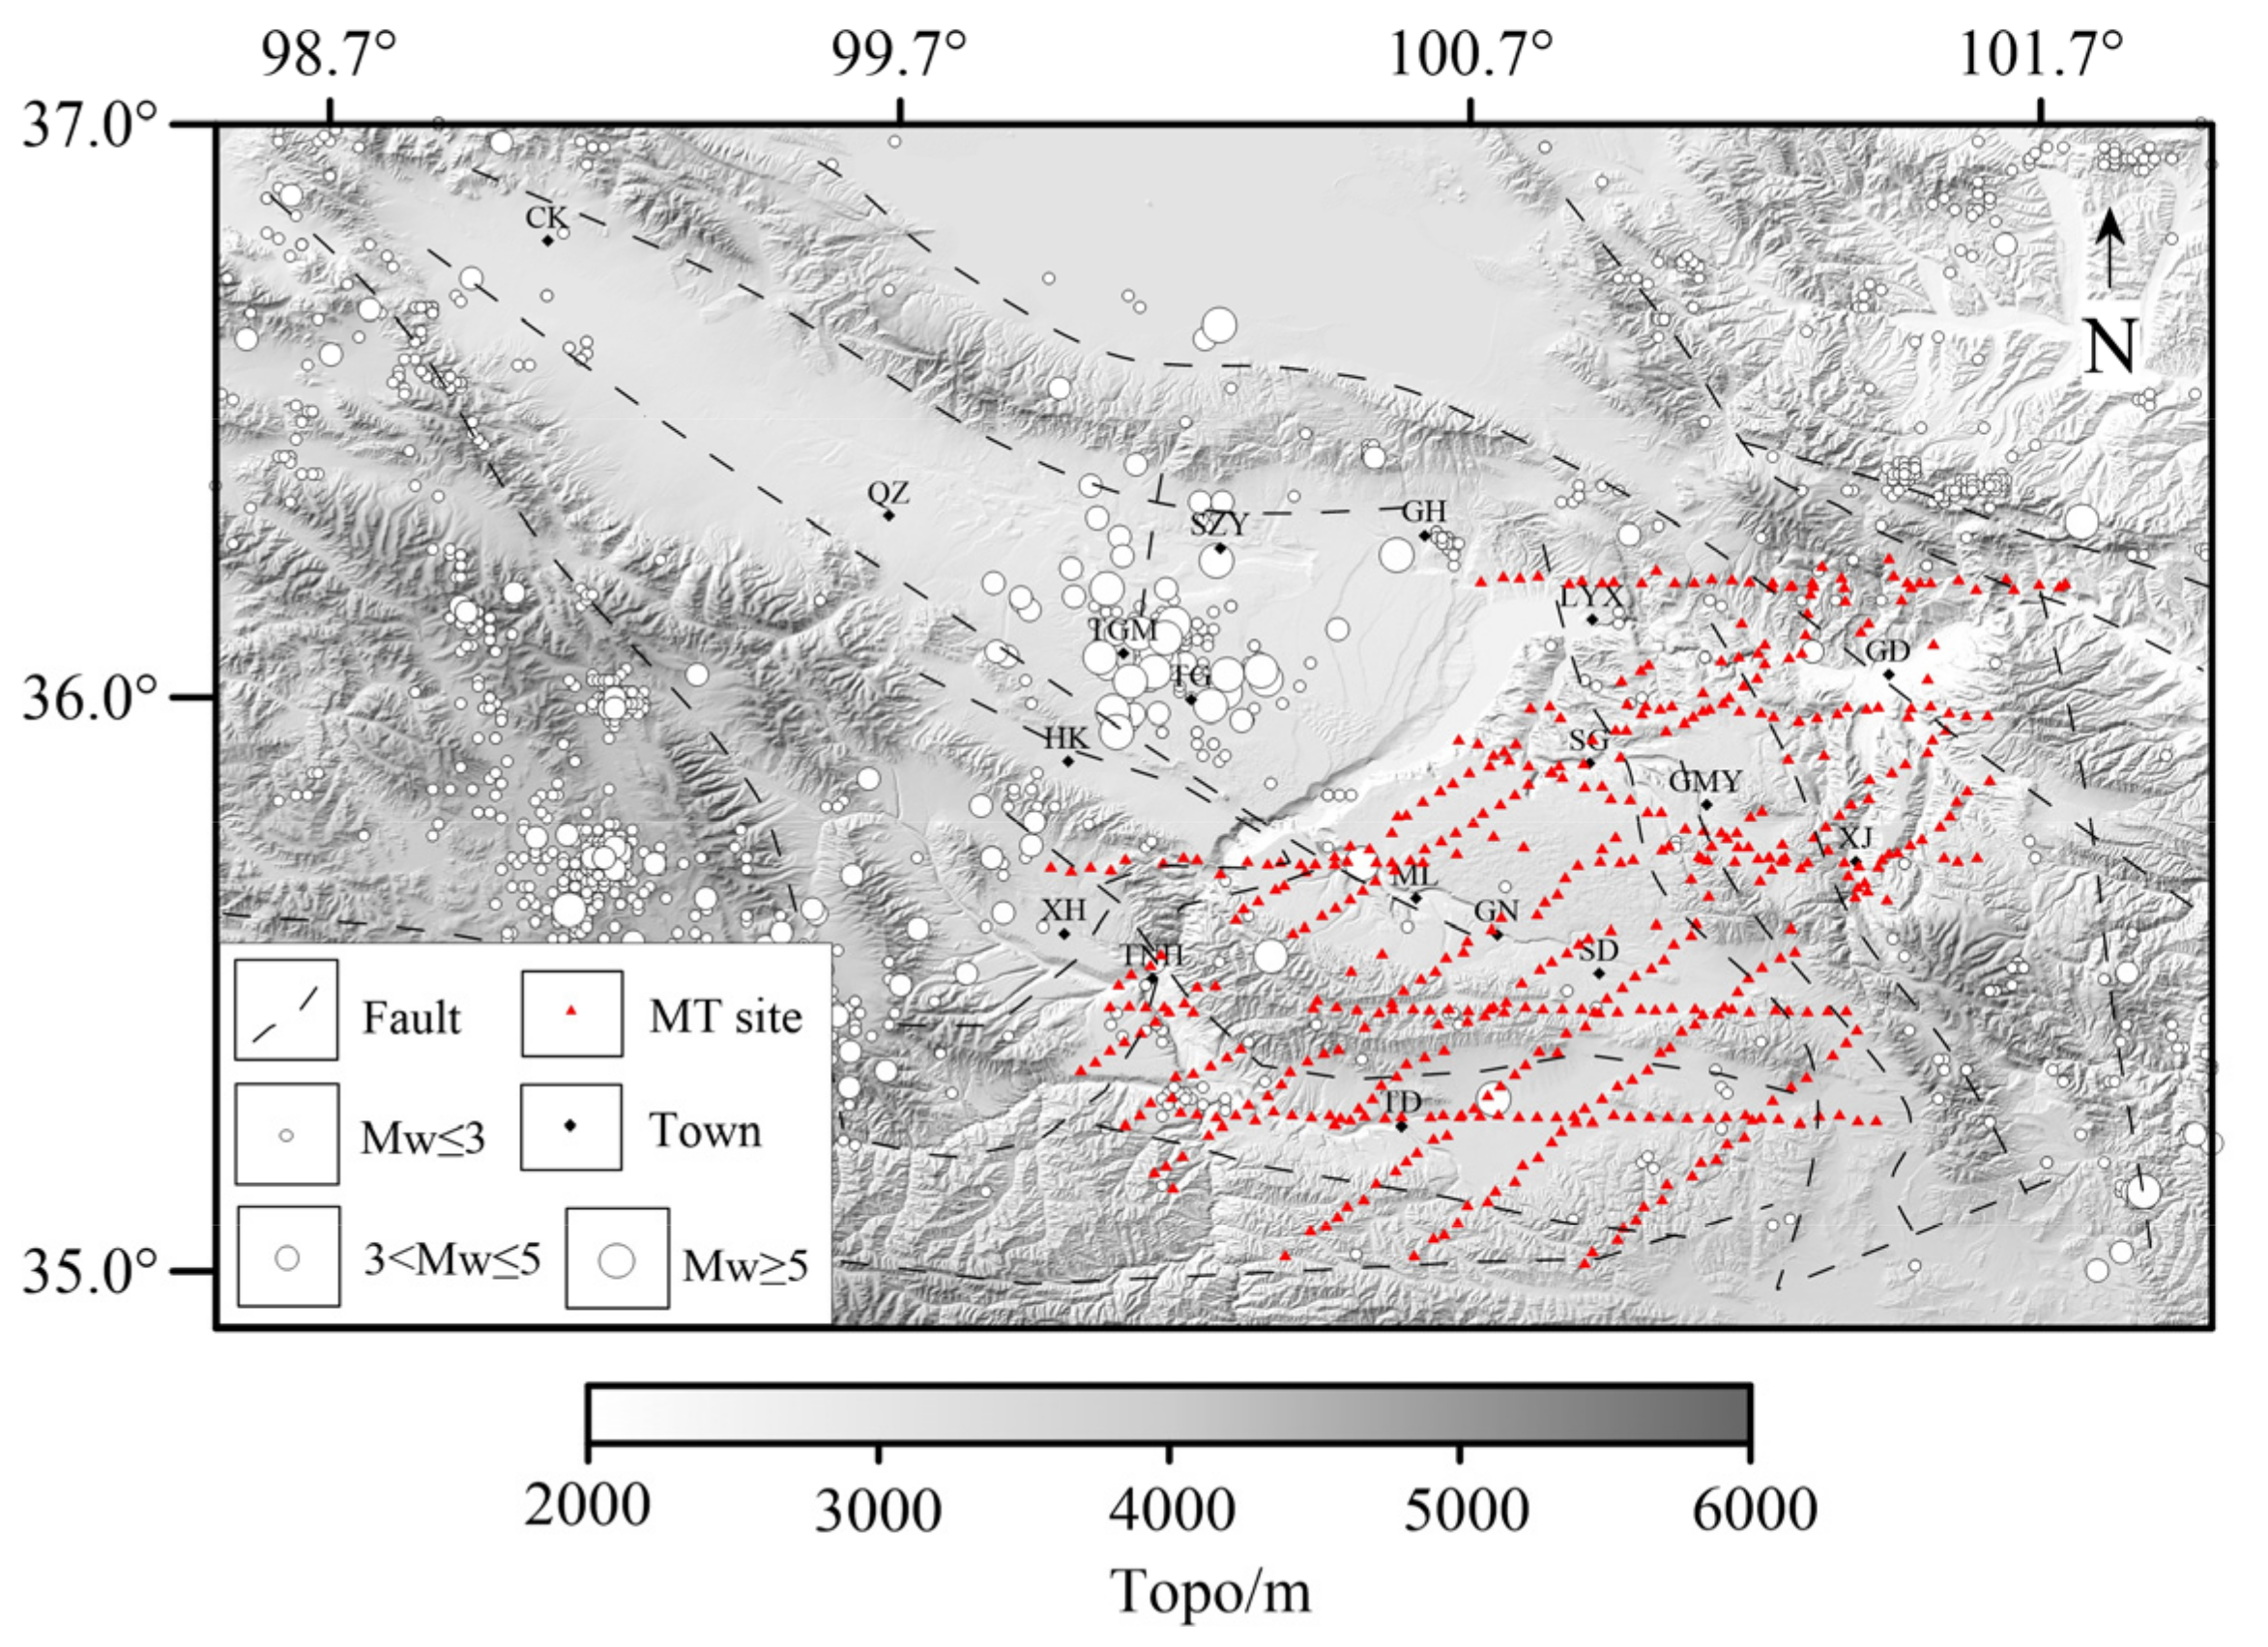
Gonghe Basin is situated at the intersection of the Qinling, Qilian, and Kunlun orogenic belts (Figure 1a,b) [31,32]. Tectonically, it is a typical Cenozoic intermountain basin controlled by the KLF and ATF (Figure 1a). Several secondary thrust strike-slip faults form the boundary of the Gonghe basin between these two first-order strike-slip faults. The QHNSF bounds it to the north, the ELSF to the west, the KLF to the south, and the DMF to the east (Figure 1b). There are 84 geothermal anomaly points found in the basin, with Zhacangsi Hot Spring and Qunaihai Hot Spring having temperatures of 93.5 °C and 96.6 °C higher than the local boiling point, respectively [33,34]. Most of these geothermal anomalies are located along Mount Ela and Mount Waliguan, where faults are well-developed and deeply cut, and Quaternary neotectonic activity is strong, with frequent earthquakes (Figure 2). These faults serve as conduits for convection and migration of deep thermal fluid. In recent years, the China Geological Survey (CGS) and the Qinghai Provincial Department of Land and Resources have drilled several boreholes (DR3, DR4 and GRl, ZR2, GH01) in the area. Temperature measurements from these boreholes indicate that the temperature at the depth of approximately 2700 m in DR3, DR4, and GR1 is above 150 °C, and the maximum temperature at 2886 m can reach 180 °C [16,23]. Based on temperature measurement and borehole rock thermal conductivity data, the large geothermal flow in the Gonghe Basin ranges from 93.3–111.0 mW.m−2, with an average of 102.2 mW.m−2, much higher than the average geothermal flow value of 60.4 mW.m−2 in Mainland China [15,16]. The presence of high-temperature hot spring, high borehole temperatures, and high ground heat flow values all suggest that the Gonghe Basin has abundant HDR geothermal resources.

3. Observation and Data Processing

3.1. MT Method and Data Acquisition

In 2020–2021, the Institute of Geophysical and Geochemical Exploration (IGGE) conducted broadband magnetotelluric surveys at 471 points in the east and south of the Gonghe Basin, with a distance of approximately 2–3 km (Figure 2). The Crystal Global Aether instrument (https://www.crystalglobegeo.com/ (accessed on 25 June 2022)) was used. At each measuring point, two horizontal electric field components ( E X , E y ) and three magnetic field components ( H x , H y , H z ) were recorded for more than 20 h, with a frequency band range of 0.00231–2796.42 s, which corresponds roughly to the depth range of 0.2–256 km in a homogeneous half space with a resistivity of 100 Ω.m and skin depth h = 50 3 ρ / f (where ρ and f are resistivity and frequency).
The magnetotelluric method measures the change of the earth’s surface electric field E ( E x , E y ) and magnetic field H ( H x , H y , H z ) with time. The resistivity information of the medium around the measuring point can be deduced by using the impedance tensor derived from the electromagnetic component [36]. In the frequency domain, the relationship between the horizontal electric field E ( E x , E y ) and the horizontal magnetic field H ( H x , H y ) can be established by the impedance tensor Z ( Z x x , Z x y , Z y y , Z y x ), and the vertical magnetic field Hz can be established by the tipper vector T (Tx, Ty) and the horizontal magnetic field ( H x , H y ). The relationship formula is as follows:
E X E y H z = Z x x Z y x Z x y Z y y T x T y H x H y
Equation (1) shows that the impedance tensor Z and the tipper vector T can be estimated using statistical methods [37].

3.2. Data Processing

We use the prMT software (https://www.crystalglobegeo.com/ (accessed on 3 May 2020)) to process the collected broadband magnetotelluric data. The collected magnetotelluric data were converted from time domain to the frequency domain through a standard robust algorithm [38] and remote reference technology [39]. The impedance tensor was obtained and the power spectrum was selected interactively to obtain better results. After removing 40 measuring points with high noise using MT Pioneer software [40], 431 measuring points were finally used for 3D inversion.

3.3. Dimensional Analysis

We use the phase tensor decomposition technique proposed by [41] to avoid electrical distortion caused by near-surface inhomogeneity. The phase tensor is defined as φ = X 1 Y , where X and Y are the real and imaginary parts of the complex impedance tensor Z , respectively. X 1 is the inverse of X . From the phase tensor, we determined the maximum tensor value ( φ max ), the minimum tensor value ( φ min ), the skew angle ( β ), and the electrical principal axis ( α ) to analyze the electrical structure. The phase tensor ellipse was drawn using the maximum and minimum values of the phase tensor ( φ max ,   φ min ) as the two principal axes. The ellipse along the main axis direction φ max indicated the direction of the conductive structure. The skew angle β was used to determine the dimension of the electrical structure. The phase tensor skew angle (β) is used to define the asymmetry of the phase tensor, which allows the description of the complexity of the subsurface structure.
β = 1 2 tan 1 φ x y φ y x φ x x + φ y y
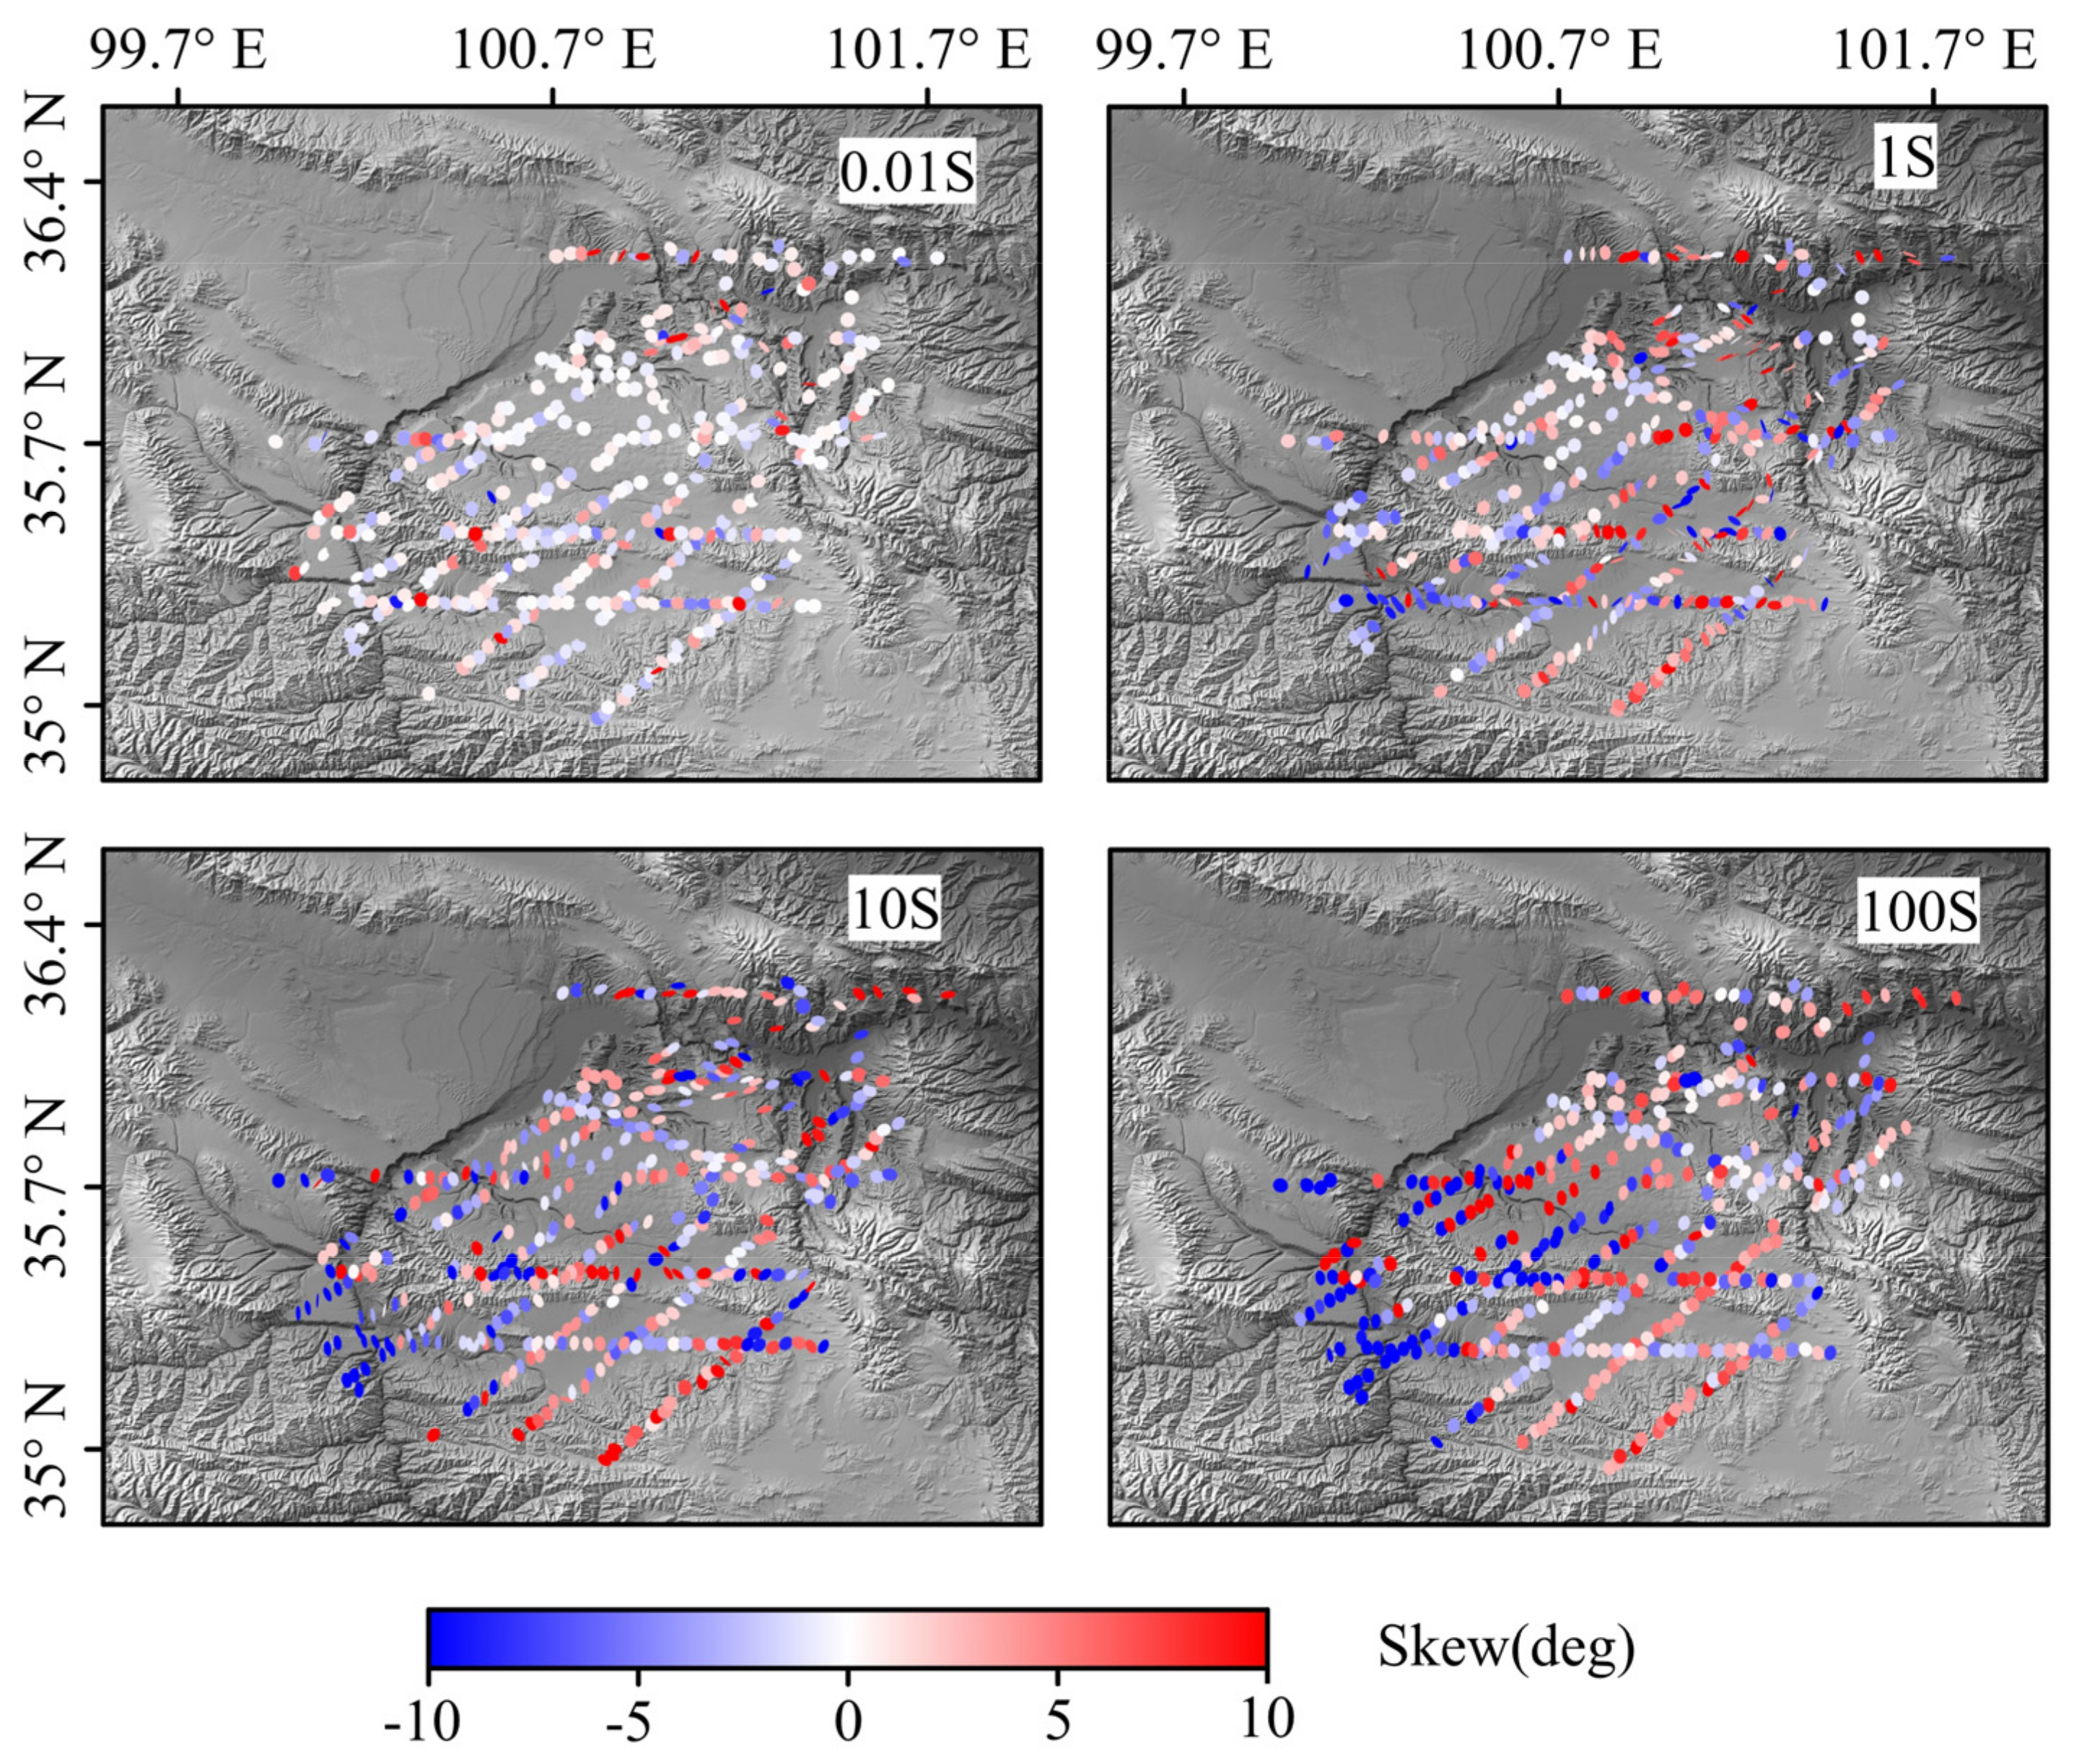
It is generally believed that if the absolute value of β is lower than 3, the underground medium can be considered as 1D or 2D. Otherwise, the structure will be considered as 3D [41]. Figure 3 shows the phase tensor plotted with value β . At 0.01 s, the absolute value of the skew angle of most phase tensor ellipses is less than 3, indicating that the shallow resistivity structure is more likely to be 1D or 2D. In the long period of 1–100 s, the phase tensor shows obvious directionality and more complex characteristics. This shows that the structure in the middle and deep is most likely three-dimensional, so it is necessary to carry out 3D-magnetotelluric sounding inversion in the study area.

3.4. 3D-Magnetotelluric Inversion Results

We use the ModEM software package developed by Egbert and Kelbert [36,42] for 3D inversion. During inversion, we used a 1.5 km × 1.5 km grid in the horizontal direction, with 6 expanded grids and an external expansion factor of 1.5. The number of horizontal grids was 169 × 202, the depth of the first layer in the vertical direction was 25 m, and the layer thickness increment factor is 1.11. The number of expanded grids was 5, the external expansion factor was 1.5, the number of grids was 60, and the bottom grid node is located at 609.56 km.
To obtain a reliable resistivity model, we only use diagonal tensor Z (Zxy and Zyx) for inversion. In fact, the selection of the initial model will have a significant impact on the inversion results. In this study, without prior model constraints, the model settings were set up based on other research work [11,43]. We first conducted a trial comparison of three different uniform half-space initial models, namely 50 ohms, 100 ohms, and 300 ohms. Then, based on the analysis of the geological overview and data-fitting situation in the study area, we ultimately selected the 100 resistivity uniform half space of the initial model’s inversion result as the final explanatory model. Meanwhile, to improve the vertical resolution, we selected 59 frequencies as the inversion period of the final resistivity model in the range of 0.00231–2796.42 s. In the inversion, we set a lower error limit of 5% for the Z x y and Z y x impedance components. In terms of inversion parameter settings, the regularization factor is adaptively reduced in the ModEM program. Therefore, during the inversion process, we set its initial value to 100, and when the change in fitting difference is less than 2 × 10⁻³, the value is updated by dividing by 10. When the regularization factor is less than 10−8 or the fitting difference is less than 1.05, the inversion is stopped.
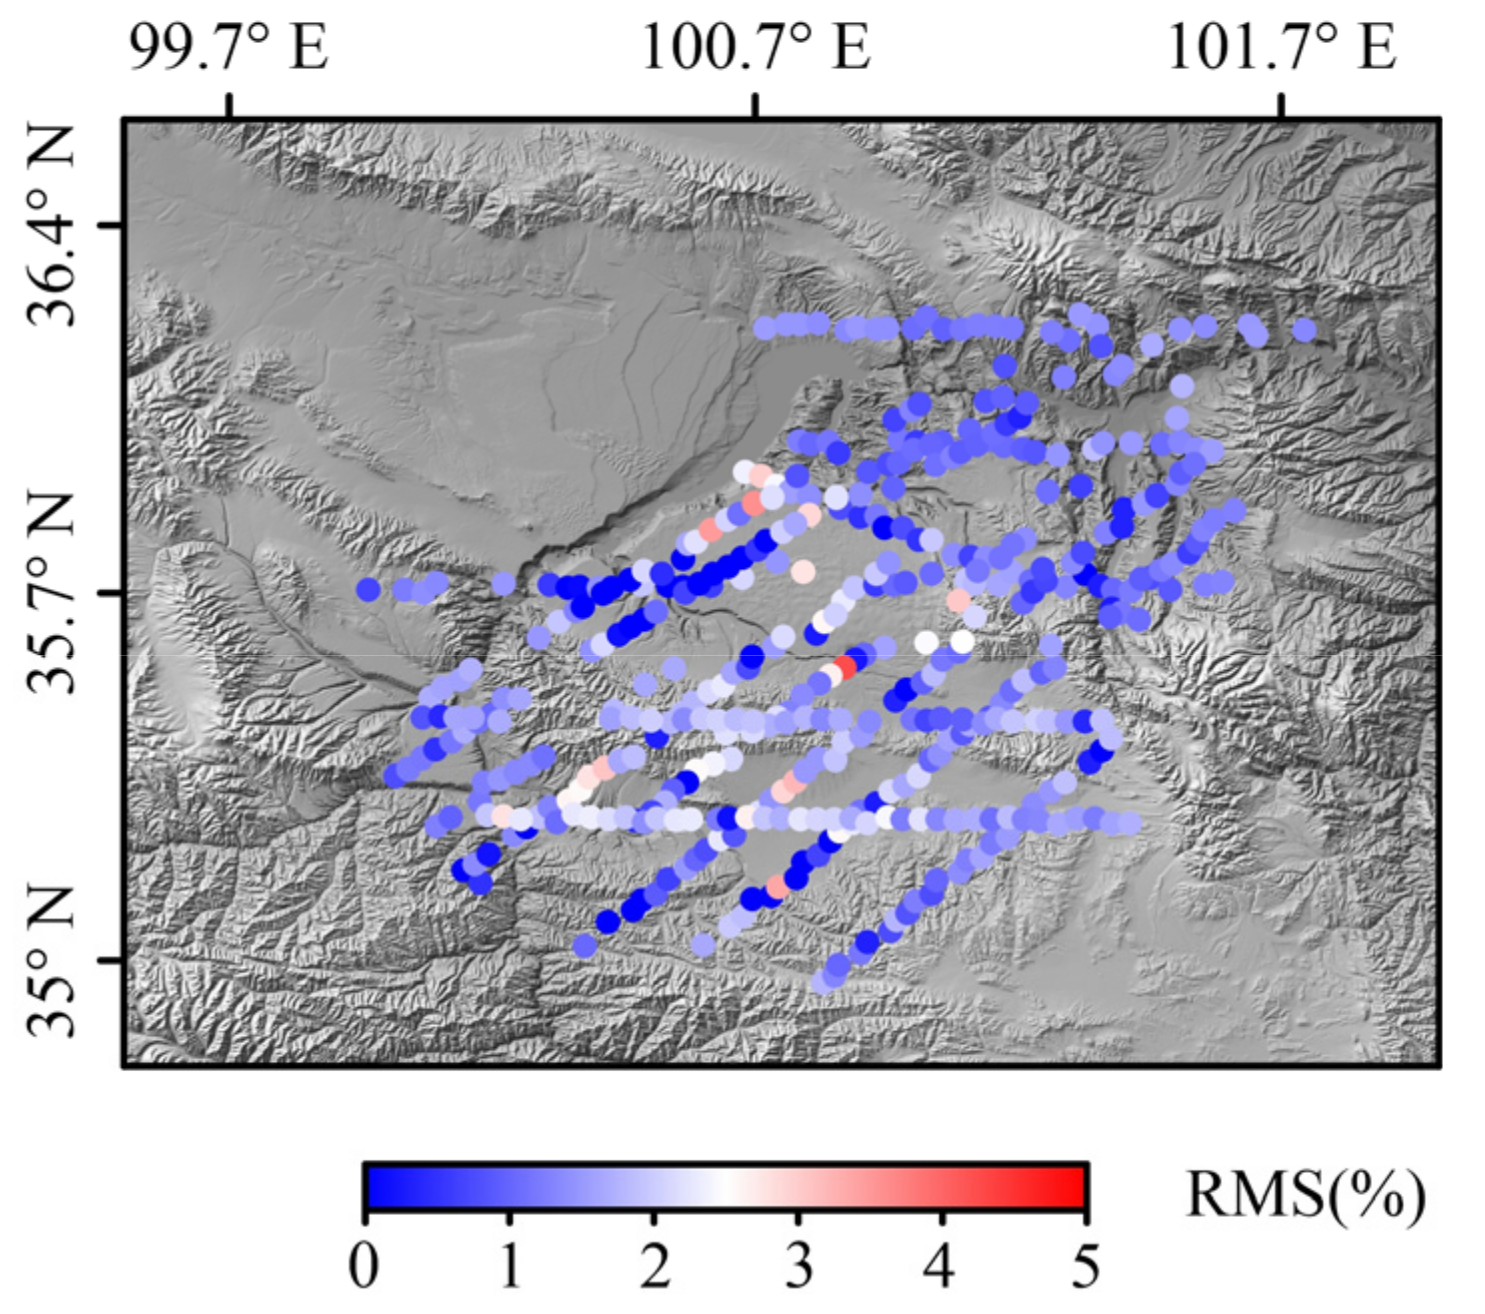
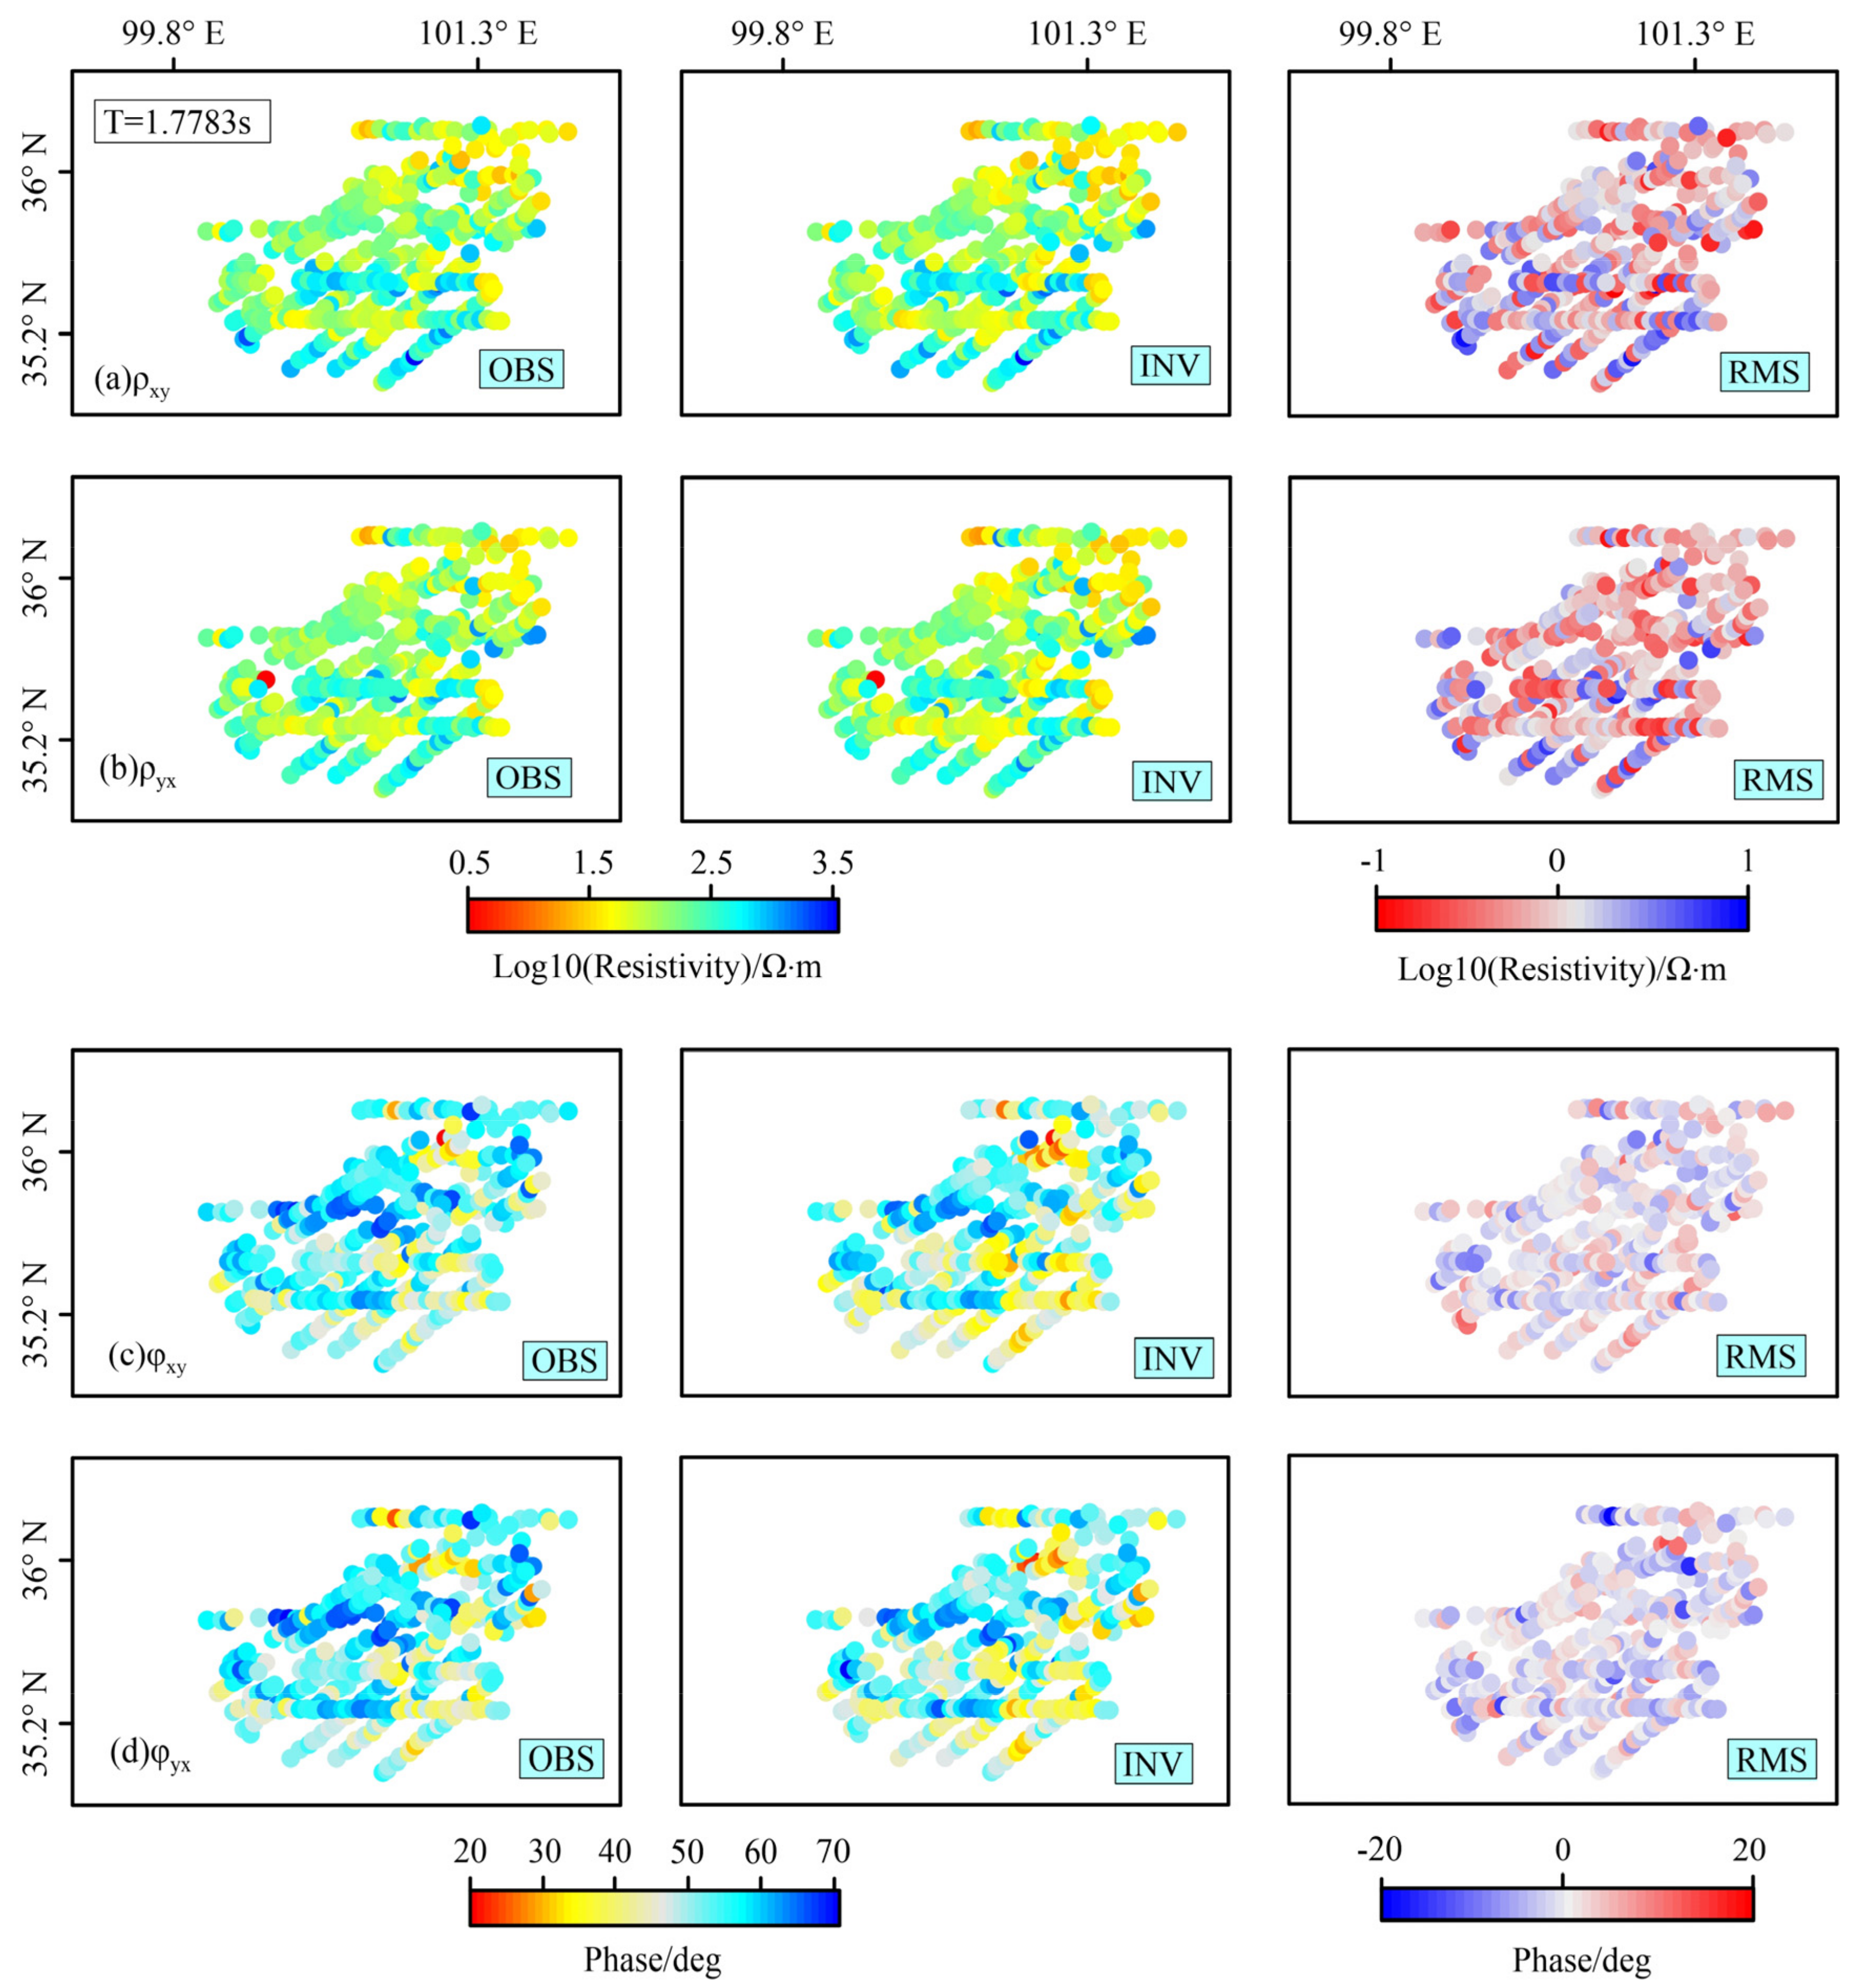
After 84 iterations, the RMS decreased from 21.748 to 1.621. Figure 4 shows the fitting error of the impedance tensor at each measuring point. It can be seen from Figure 4 that the fitting error of most points is below 3%, indicating a good fitting. We selected the measured data of 1.7783 s and the inversion fitting data for comparison. From Figure 5, it can be seen that the inversion resistivity and phase of each measuring point of 1.7783 s are well matched with the observed resistivity and phase, and the residual is small, indicating a good inversion result.

4. Discussion

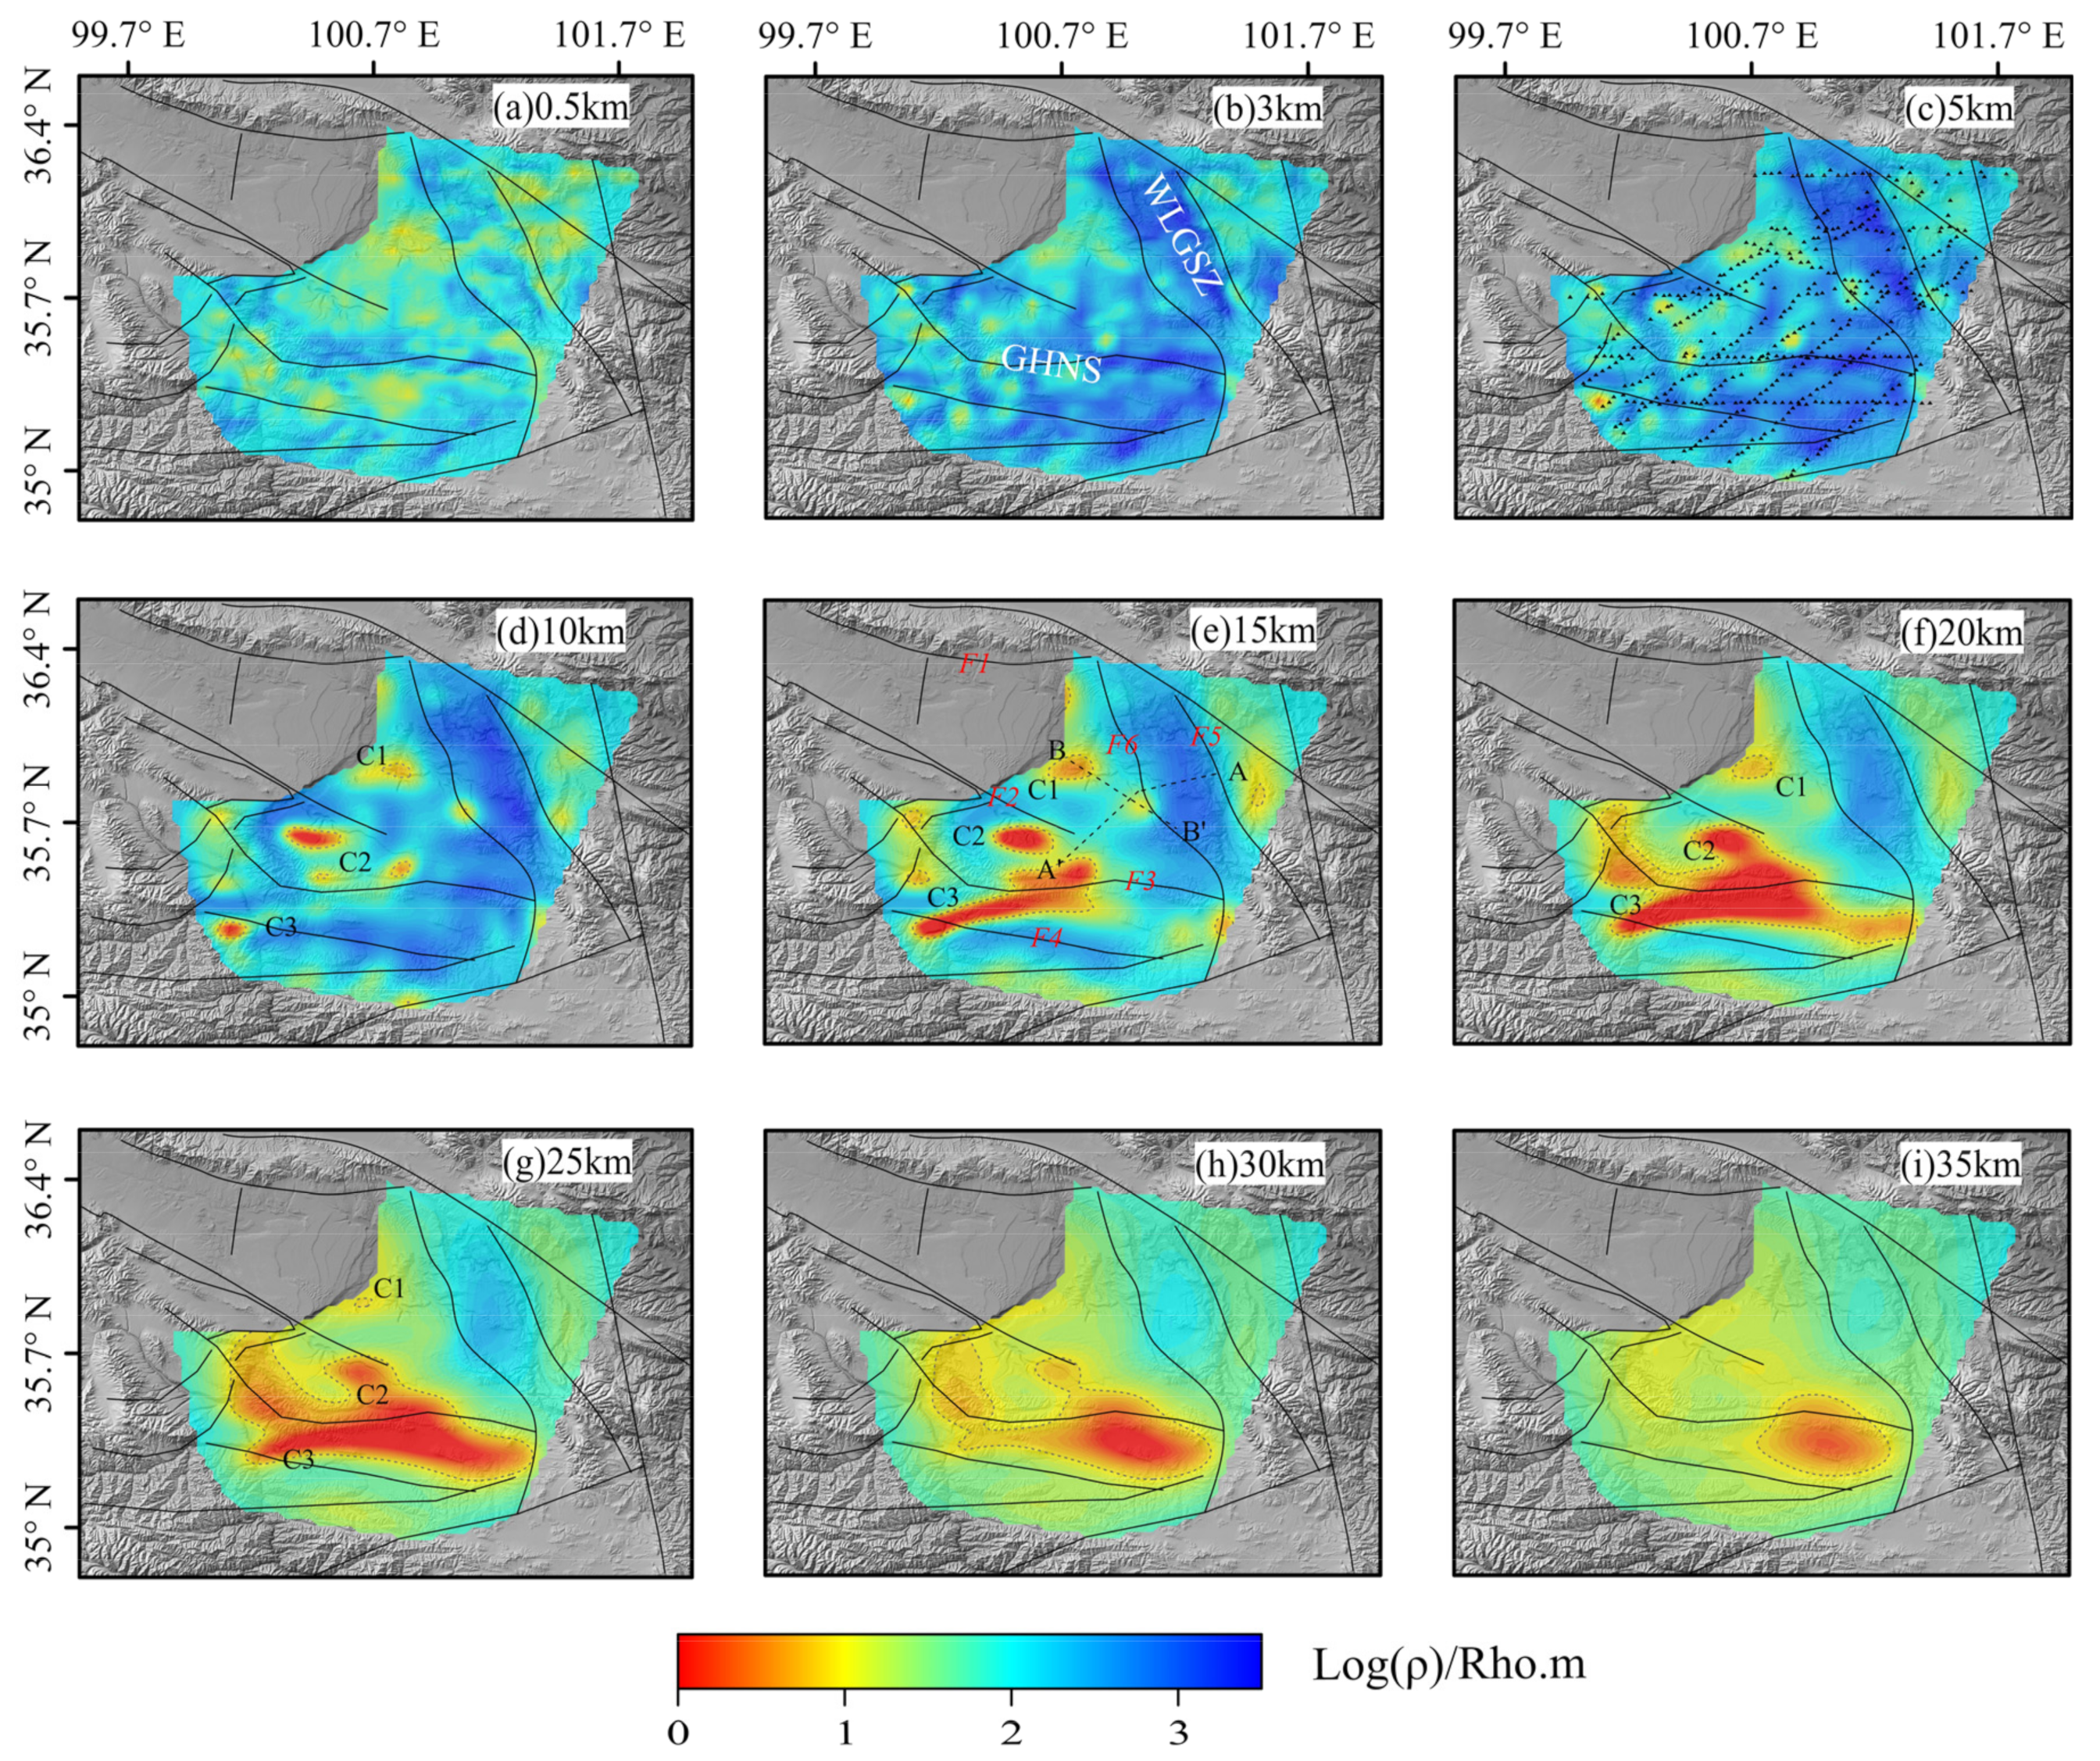
The structural framework of the eastern part of the Gonghe Basin is clearly illustrated in Figure 6a–c of the 3D-inversion resistivity section. The depression in the basin exhibits relatively low resistivity (light blue and yellow) due to the presence of shallow loose sedimentary layers, while the surrounding mountains show high resistivity overall. The WLGSZ divides the basin into two parts, the western side being the traditional Gonghe Basin and the eastern side being the Guide Basin [22]. The resistivity at the basin–mountain junction is steep (Figure 6e), which corresponds well with the fault observed on the surface (Figure 1b). The WLGSZ is generally characterized by high resistivity, extending from the shallow surface to the middle and lower crust (Figure 6b–e). Its west side is controlled by the thrust strike-slip fault SGF, and its east side is controlled by XJF.
To study the coupling relationship between electrical structure and geothermal characteristics, we first discussed the problem of the deep heat source and analyzed the geological conditions and electrical characteristics of the thermal reservoir with typical DHR borehole crossing the survey line. Finally, we established the geothermal model in the eastern part of the Gonghe Basin.

4.1. Heat Source Discussion

Zhang, et al. [2] and Liu, et al. [44] measured that the average value of the radioactive heat generation rate of granite cores obtained from boreholes in the Gonghe Basin is about 3.20 ± 1.07 μW/m3, which is close to the global average value of the radioactive heat generation rate (3.09 ± 1.62 μW/m3) of Mesozoic and Cenozoic granite. This shows that the granite in the Gonghe Basin does not exhibit a strong abnormal radioactive heat generation rate. Although the radioactive elements contribute to the heat flow, they are not the main heat source in the Gonghe Basin. Isotopic dating results show that the zircon crystallization age of granite in the Gonghe Basin is mainly concentrated in the middle and late Triassic (about 240–210 Ma [45]). It is generally believed that the cooling time of granite is 5–8 Ma, and there is no residual heat now. In addition, the gas isotope data of the hot spring group in the Gonghe basin shows that the 3/4He value is 0.04–0.08 Ra [18,46], indicating that the heat source has almost no mantle composition, but all of it comes from the crust. Both rock radioactivity and gas isotope tests show that the contribution of heat flow mainly comes from the crust.
Zhang, et al. [2] estimated that the contribution of radioactive heat generation from granite is about 30.4–40.5 mW/m2. According to the thickened crust thickness, the contribution of heat flow is about 29.6%–39.7% of the average heat flow in the Gonghe Basin. If other additional heat sources are not taken into account, the thickness of the lower crust completely derived from radioactive heat generation is about 51–66 km. However, this theoretical thickness is significantly greater than the thickness of the entire crust of the Gonghe Basin (51–56 km [47]), which is obviously unreasonable. Therefore, there is an additional heat flow contribution from additional heat sources in the region.
The electrical structure obtained from this magnetotelluric survey shows that the low-resistivity layer is widely distributed in the study area. This layer is generally developed at a depth of 15–50 km below the basin. On the horizontal section (Figure 6d–g), C1, C2, and C3 are used to mark relatively significant low-resistivity bodies (resistivity less than 10 Ω.m). Compared with the results of [48], the resistivity distribution obtained by the two inversions is basically similar. However, the scale of the high conductor obtained along the BB ‘section is smaller than that of Gao, and the conductivity is relatively low. It is considered that the density of measuring points in this study is higher, and the constraint on underground media is better.
As the depth increases, C3 extends eastward in a strip shape, and C2 tilts southeast in depth and connects with C3. The low-resistivity layer is continuously distributed at a depth of 15–35 km (Figure 6e–i and Figure 7e,f). According to [49], high-conductivity layers develop below 15 km in the crust of the eastern Tibetan Plateau. These layers have a resistivity of less than 10 Ω.m and are located between the Xianshuihe fault and the Jinshajiang fault, with a zonal extension layer thickness of 20–30 km, which is inferred as a ductile crustal flow. Additionally, noise imaging studies have found a large range of low-velocity anomalies at a depth of 30–50 km below the northeastern edge of the Tibetan Plateau, which is believed to be caused by the activity of the lower crustal flow [50].
Studies of artificial source seismic exploration [51,52,53,54] have confirmed that the lower crust of the northeastern margin of the Tibetan Plateau is thickened, and the seismic wave velocity and Poisson’s ratio of the middle and lower crust are relatively low. Teleseismic receiver function results show that there is an S-wave low-velocity layer between the upper crust and the lower crust in the northeast of the Tibetan Plateau, which may be an intra-crust detachment layer resulting in the decoupling of the upper crust deformation and the lower crust [55].
Research conducted in the Tibetan Plateau using magnetotelluric sounding [10,27,40,49,56,57] has also shown that there are high-conductivity layers of different buried depths and sizes in the crust inside and outside the plateau. The existence of low-velocity and low-resistivity layers suggests that granitization, granite melting, and regional metamorphism are ongoing in the region [58]. Many geotectologists believe that the low-velocity layer in the crust is the detachment surface, while petrologists believe that it is the source of granitic magma. In fact, they are likely both [59]. Rock conductivity experiments show that temperature and pressure are main influencing factors on the conductivity of rocks in crust, with temperature having a far greater influence than that of pressure [48]. When the rock reaches near-melting temperatures, the conductivity can be several orders of magnitude higher than under normal temperature [60], which results in the HDR in the crust and upper mantle becoming more conductive. Therefore, the electrical structure characteristics of the crust and mantle mainly depend on the thermal state of the underground [10].
Based on geological and geophysical data, it is speculated that the high-conductivity layer in the middle and lower crust of the Gonghe Basin may be the main deep heat source.

4.2. Comprehensive Analysis of ZR2 HDR Borehole

Borehole ZR2 (Figure 7a, blue triangle) is located in the eastern part of the Gonghe Basin, at the junction of the WLGSZ and the Guide Basin, with a hole depth of 4703 m. The strata at 0–550 m depth consist of Quaternary and Neogene formations, while the interval of 550–1050 m consists of granodiorite. The strata are affected by thrust and overthrust structures, which caused repetition of the strata. At a depth of 1050–1250 m, the Triassic siltstone is exposed, and from 1250–4703 m, the strata consist of granodiorite. The temperature at a depth of 3470 m is 150 °C, and at 4600 m, it is 205 °C (Figure 8, red curve), which confirms the presence of HDR [22]. The core thermophysical property test of ZR2 [25] shows that the granite, as the thermal reservoir, generally exhibits high thermal conductivity and thermal diffusion coefficient, with a thermal conductivity that is 1.69 times higher than that of Triassic shallow metamorphic rock and 7.5 times higher than that of Cenozoic clastic rock. This indicates that under the same conditions, Triassic granite has better thermal conductivity or heat-accumulation ability, which is conducive to the formation of regional geothermal resources such as HDR. However, the high thermal conductivity also means that the granite area has a relatively high heat dissipation capacity under exposed conditions. The thickness of the Cenozoic clastic rock deposits (2–5 km) is more likely to form regional caprocks, reduce heat dissipation, and provide protection for the accumulation of granite heat (GR1 with thick Cenozoic strata caprocks drilled 236 °C HDR at 3750 m, Figure 1b). According to the magnetotelluric inversion resistivity extracted near the ZR2 (Figure 8, black curve), the electrical characteristics of the Cenozoic formation, as an insulating layer, are mainly characterized by low resistivity, and the lithology consist of loose gravel and clay. The upper and middle Triassic in the transition zone consist of the interbedding of fractured clastic rock and intrusive granite, which is characterized by medium to high resistivity due to water content, and is a typical shallow and middle water thermal reservoir. The strata below 1500 m are dense, complete, and stable granite, almost anhydrous, and have good heat storage and thermal conductivity. Correspondingly, the temperature starts to rise linearly after the depth of 1500 m, reaching 150 °C at 3470 m, and the resistivity is high (up to 4000 Ω.m), which also reflects that the granite is dense and anhydrous. After 3500 m, it is the main granite thermal reservoir (HDR).

4.3. Geothermal Model

The geothermal anomalies in the Gonghe Basin and its surrounding areas are mainly located along the fault zone (Figure 1b), such as the Qunaihai and Zhacang hot spring groups in XJF and the hot spring groups in the DHMF in the east. The connection of hot springs along the fault zone suggests that the fault is a heat conduction channel that runs through the thermal reservoir. These faults are not only important tectonic boundaries of the Gonghe Basin, but also important thermal control structures (Figure 1b, Figure 6, and Figure 7).
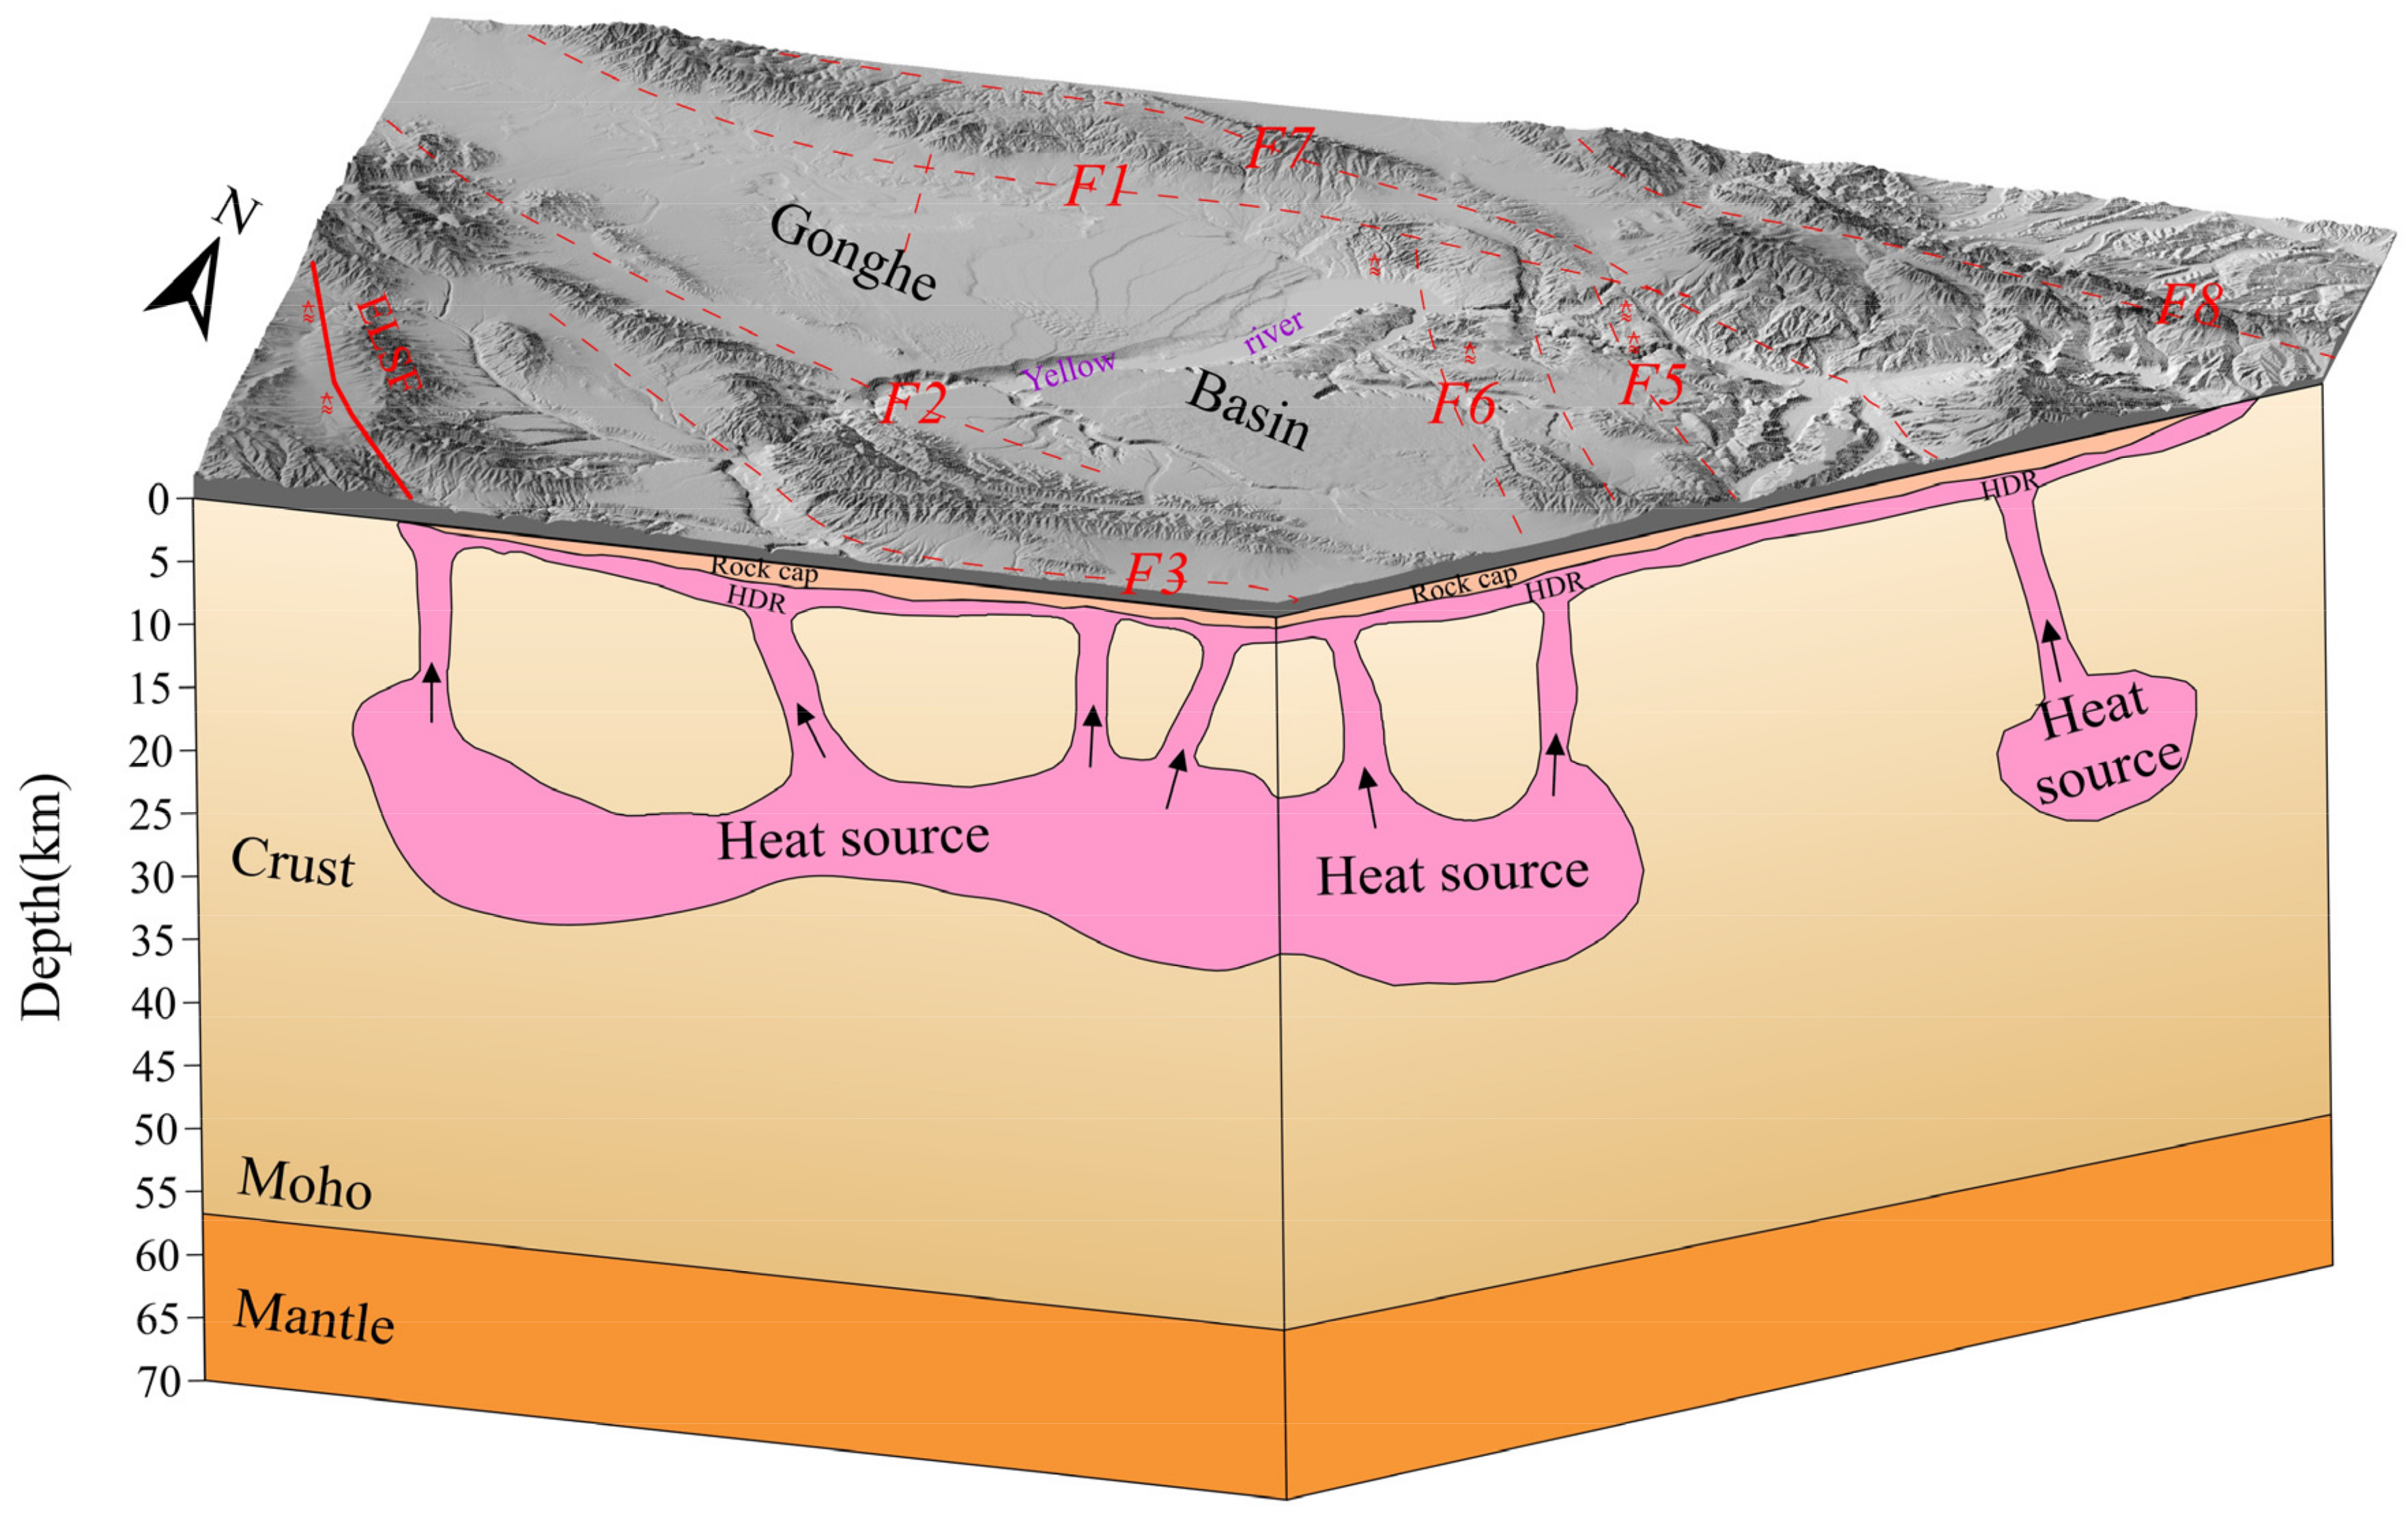
Based on the ZR2 drilling and temperature measurement data, combined with regional geological knowledge, a geothermal model has been established in the eastern part of the Gonghe Basin. According to this model, the high-temperature, high-conductivity layer developed in the Cenozoic middle and lower crust is the main heat source (Figure 6 and Figure 7), which is widely distributed in the basin. The fault, as an important heat conduction and heat control channel, transmits energy to the middle and upper crust (Figure 7). The Middle and Late Triassic granites, characterized by high thermal conductivity and low water content, are widely developed in the basin. Their granites are important thermal conductivity layers and also important HDR reservoirs, with high electrical resistivity (Figure 6, Figure 7 and Figure 8). Cenozoic sedimentary rocks with low thermal conductivity are good caprocks. The shallow surface water infiltrates and circulates to the vicinity of the granite body, forming a clastic rock type hydrothermal system in the middle and shallow part, while the deep granite is a HDR system.
Based on this, a geological model of the Gonghe Basin has been constructed (Figure 9), taking into account the geological features of the region.

5. Conclusions

The study successfully carried out 3D imaging of the geothermal system in the Gonghe Basin using magnetotelluric data of 431 survey points, resulting in 3D-resistivity models of the eastern and southern areas of the basin. This area is situated in the compressional deformation zone of the northeastern margin of the Tibetan Plateau, where the crust is significantly thickened and geothermal resources are abundant, making it crucial to the study of the geothermal model of the Tibetan Plateau. The 3D-inversion resistivity model indicates that a high-conductivity layer widely distributed in the middle and lower crust could be responsible for the high geothermal flow value in the basin, which may be caused by partial melting of the middle and lower crust. This conductive layer can be utilized as a deep heat source, and it is supported by high-temperature HDR boreholes such as GR1 and GR2.
Additionally, resistivity imaging of the faults related to the surface topography in the Gonghe Basin has been conducted. These faults transfer the deep heat energy to the shallow surface by being linked with the high-conductivity layer in the middle and upper crust, further electrical resistivity and good thermal conductivity found in the basin is used as a thermal reservoir to store the heat energy from the deep, while its overlying thermal insulation layer is primarily Cenozoic loose sediments with low resistivity and poor thermal conductivity. The exploration of several high-temperature HDR drilled in the basin indicates a potential HDR system, and the eastern part of the basin with abundant resources and less drilling verification has great potential and requires further exploration.

Author Contributions

Conceptualization, Y.Y. and X.W.; methodology, Y.Y., X.W., M.L. (Mingxing Liang) and Z.J.; software, Y.Y. and M.L. (Meng Liang); validation, L.Q., D.L. and M.L. (Mingxing Liang); formal analysis, M.L. (Mingxing Liang), Z.J., Y.O., X.T., X.L., L.Q., M.L. (Meng Liang), D.L. and J.Z.; investigation, Y.Y., Z.J. and Y.O.; resources, X.L. and X.T.; data curation, Y.Y. and J.Z.; writing—original draft preparation, Y.Y.; writing—review and editing, M.L. (Mingxing Liang), Y.O., X.L. and X.T.; visualization, Y.Y. and M.L. (Meng Liang); supervision, X.W.; project administration, Y.Y.; funding acquisition, X.W. All authors have read and agreed to the published version of the manuscript.

Funding

This research was funded by National Natural Science Foundation of China (grant number 91755215; 42104082) and China Geological survey Project (grant number DD20201105; DD20230548).

Data Availability Statement

Not applicable.

Acknowledgments

We thank Gary Egbert and Anna Kelbert for providing the ModEM package. This work was carried out in the Information Center of IGGE, and the calculations were performed on the Geological Cloud Platform of CGS.

Conflicts of Interest

The authors declare no conflict of interest.

References

  1. Zhang, C.; Hu, S.B.; Zhang, S.S.; Li, S.T.; Zhang, L.Y.; Kong, Y.L.; Zuo, Y.H.; Song, R.C.; Jiang, G.Z.; Wang, Z.T. Radiogenic heat production variations in the Gonghe basin, northeastern Tibetan Plateau: Implications for the origin of high-temperature geothermal resources. Renew. Energy 2020, 148, 284–297. [Google Scholar] [CrossRef]
  2. Zhang, C.; Hu, S.B.; Song, R.C.; Zuo, Y.H.; Jiang, G.Z.; Lei, Y.D.; Zhang, S.S.; Wang, Z.T. Genesis of the hot dry rock geothermal resources in the Gonghe basin: Constraints from the radiogenic heat production rate of rocks. Chin. J. Geophys. 2020, 63, 2697–2709. [Google Scholar] [CrossRef]
  3. Tang, J.Y.; Hu, S.B.; Pang, Z.H.; Pang, Z.H.; He, L.J.; Zhao, P.; Zhu, C.Q.; Rao, S.; Tang, X.Y.; Kong, Y.L.; et al. Estimate of Geothermal Resources Potential for Hot Dry Rock in the continental Area of China. Sci. Technol. Rev. 2012, 30, 25–31. [Google Scholar] [CrossRef]
  4. Xu, T.F.; Yuan, Y.L.; Jia, X.F.; Lei, Y.D.; Li, S.T.; Feng, B.; Hou, Z.Y.; Jiang, Z.J. Prospects of power generation from an enhanced geothermal system by water circulation through two horizontal well: A case study in the Gonghe Basin, Qinghai Province, China. Energy 2018, 148, 196–207. [Google Scholar] [CrossRef]
  5. Mao, X.; Guo, D.B.; Luo, L.; Wang, T. The global development process of hot dry rock (enhanced geothermal system) and its geological background. Geol. Rev. 2019, 65, 1462–1472. [Google Scholar] [CrossRef]
  6. Tester, J.W.; Anderson, B.J.; Batchelor, A.S.; Blackwell, D.D.; Pippo, R.D.; Drake, E.M.; Garnish, J.; Livesay, B.; Moore, M.C.; Nichols, K.; et al. The Future of Geothermal Energy-Impact of Enhanced Geothermal Systems (EGS) on the United States in the 21st Century; MIT Massachusetts Institute of Technology: Cambridge, MA, USA, 2006. [Google Scholar]
  7. Breede, K.; Dzebisashvili, K.; Liu, X.L.; Gioia, F. A systematic review of enhanced(or engineered)geothermal systems: Past, present and future. Geotherm. Energy 2013, 1, 4. [Google Scholar] [CrossRef] [Green Version]
  8. Wang, G.L.; Zhang, W.; Lin, W.J.; Liu, Z.M.; Wang, W.L. Evaluation of Geothermal Resources Potential in China. Acta Geosci. Sin. 2017, 38, 449–459. [Google Scholar] [CrossRef]
  9. Kana, J.D.; Nol, D.Y.; Radandi, D.; Nouck, P.N.; Dadjé, A. A review of geophysical methods for geothermal exploration. Renew. Sustain. Energy Rev. 2015, 44, 87–95. [Google Scholar] [CrossRef]
  10. Wei, W.B.; Jin, S.; Ye, G.F.; Deng, M.; Tan, H.D.; Unsworth, M.; Jones, A.G.; Book, J.; Li, S.H. Conductivity structure of crust and upper mantle beneath the northern Tibetan Plateau: Results of super wide band magnetotelluric sounding. Chin. J. Geophys. 2006, 49, 1215–1225. [Google Scholar] [CrossRef]
  11. Erdoğan, E.; Candansayar, M.E. The conductivity structure of the Gediz Graben geothermal area extracted from 2D and 3D magnetotelluric inversion: Synthetic and field data applications. Geothermics 2017, 65, 170–179. [Google Scholar] [CrossRef]
  12. Peacock, J.R.; Mangan, M.T.; McPhee, D.; Wannamaker, P.E. Three-dimensional electrical resistivity model of the hydrothermal system in Long Valley Caldera, California, from magnetotellurics. Geophys. Res. Lett. 2016, 43, 7953–7962. [Google Scholar] [CrossRef]
  13. Viacheslav, S.; Olga, K.Z.; Goidina, A.G. A new conceptual model of the Icelandic crust in the Hengill geothermal area based on the indirect electromagnetic geothermometry. J. Volcanol. Geotherm. Res. 2013, 257, 99–112. [Google Scholar] [CrossRef]
  14. Yuan, Z.C.; Zhong, H.P.; Yan, L.K.; Chen, X.B.; Wang, G.J. Imaging the heat source of the Kangding high-temperature geothermal system on the Xianshuihe fault by magnetotelluric survey. Geothermics 2022, 102, 10286. [Google Scholar] [CrossRef]
  15. Jiang, G.Z.; Gao, P.; Rao, S.; Zhang, L.Y.; Tang, Y.X.; Huang, F.; Zhao, P.; Pang, Z.H.; He, L.J.; Hu, S.B.; et al. Compilation of heat data in the continental area of China (4th edition). Chin. J. Geophys. 2016, 59, 2892–2910. [Google Scholar] [CrossRef]
  16. Zhang, C.; Zhang, S.S.; Li, S.T.; Jia, X.F.; Jiang, G.Z.; Gao, P.; Wang, Y.B.; Hu, S.B. Geothermal characteristics of the Qiabuqia geothermal area in the Gonghe basin. Chin. J. Geophys. 2018, 61, 4545–4557. [Google Scholar] [CrossRef]
  17. Gao, J.; Zhang, H.J.; Zhang, S.Q.; Chen, X.B.; Cheng, Z.P.; Jia, X.F.; Li, S.T.; Fu, L.; Gao, L.; Xin, H.L. Three-dimensional magnetotelluric imaging of the geothermal system beneath the Gonghe Basin, Northeast Tibetan plateau. Geothermics 2018, 76, 15–25. [Google Scholar] [CrossRef]
  18. Hou, Z.; Xu, T.; Jiang, Z.; Bo, F. Geochemical and isotopic characteristics of geothermal water in the Gonghe Basin of the northeast Tibetan Plateau, China. In Proceedings of the 43rd Workshop on Geothermal Reservoir Engineering Stanford University, Stanford, CA, USA, 12–14 February 2018. [Google Scholar]
  19. Li, Y.G. Hydrogeochemical Characteristics and Its Origin Analysis of Geothermal Water in the Qia Bu-Qia Area, GongHe Basin, QingHai Province. Master’s Thesis, East China University of Tecnology, Nanchang, China, 2016. [Google Scholar]
  20. Xu, T.F.; Hu, Z.X.; Li, S.T.; Jiang, Z.J.; Hou, Z.Y.; Li, F.Y.; Liang, X.; Feng, B. Enhanced Geothermal System: International Progresses and Research Status of China. Acta Geol. Sin. 2018, 92, 1936–1947. [Google Scholar] [CrossRef]
  21. Yue, G.F.; Deng, X.F.; Xing, L.X.; Lin, W.J.; Liu, F.; Liu, Y.G.; Wang, G.L. Numerical simulation of hot dry rock exploitation using enhanced geothermal systems in Gonghe Basin. Sci. Technol. Rev. 2015, 33, 62–67. [Google Scholar] [CrossRef]
  22. Zhang, S.Q.; Yan, W.D.; Li, D.P.; Jia, X.F.; Zhang, S.S.; Li, S.T.; Fu, L.; Wu, H.D.; Zeng, Z.F.; Li, Z.W.; et al. Characteristics of geothermal geology of the Qiabuqia HDR in Gonghe Basin, Qinghai Province. Geol. China 2018, 45, 1087–1102. [Google Scholar] [CrossRef]
  23. Zhang, S.S.; Zhang, L.; Tian, C.C.; Cai, J.S.; Tang, B.C. Occurrence geological characteristics and development potential of hot dry rocks in Qinghai Gonghe Basin. J. Geomech. 2019, 25, 501–508. [Google Scholar] [CrossRef]
  24. Zhao, Z.; Chen, H.J.; Ma, J.Q.; Liang, Z.X. Evaluation and Development of Geothermal Resources in Qiapuqia Region, Gonghe Basin, Qinghai Province. Qinghai Environ. 2009, 19, 81–84. [Google Scholar]
  25. Tang, X.C.; Wang, G.L.; Ma, Y.; Zhang, D.L.; Liu, Z.; Zhao, X.; Cheng, T.J. Geological model of heat source and accumulation for geothermal anomalies in the Gonghe basin, northeastern Tibetan Plateau. Acta Geol. Sin. 2020, 94, 2052–2065. [Google Scholar] [CrossRef]
  26. Li, L.G.; Li, B.X. A discussion on the heat source mechanism and geothermal system of Gonghe-Guide basin and mountain geothermal field in Qinghai Province. Geophys. Geochem. Explor. 2017, 41, 29–34. [Google Scholar] [CrossRef]
  27. Sun, J.; Jin, G.W.; Bai, D.H.; Wang, L.F. Sounding of electrical structure of the crust and upper mantle along the eastern border of Qinghai Tibet Plateau and its tectonic significance. Sci. China (Ser. D) 2003, 46, 243–253. [Google Scholar]
  28. Sun, Z.X.; Li, B.X.; Wang, Z.L. Exploration of the possibility of hot dry rock occurring in the Qinghai Gonghe Basin. Hydrogeol. Eng. Geol. 2011, 38, 119–124. [Google Scholar]
  29. Wang, B.; Li, B.X.; Ma, X.H. Prediction of thermal reservoir temperature and depth in the exploration and evaluation of dry hot rocks in Gonghe Guide, Qinghai. Undergr. Water 2015, 37, 28–30. [Google Scholar]
  30. Yan, W.D. Characteristics of Gonghe Basin hot dry rock and its utilization prospects. Sci. Technol. Rev. 2015, 33, 54–57. [Google Scholar] [CrossRef]
  31. Shi, B.Y.; Zhang, J.T. Discussion on the Gap of Qin Kuntectonic belt. Manag. Strategy Qinghai Land Resour. 1982, 3, 21–29. [Google Scholar]
  32. Zhang, G.W.; Guo, A.L.; Yao, A.P. Western Qinling-Songpan continental tectonic node in China’s continental tectonics. Earth Sci. Front. 2004, 11, 23–32. [Google Scholar] [CrossRef]
  33. Kang, W.H. High-quality hot spring with surface water temperature of 96.6 °C found in Guide, Qinghai. Geotherm. Energy 2016, 1, 17. [Google Scholar]
  34. Xue, J.Q.; Gan, B.; Li, B.X.; Wang, Z.L. Geological-Geophysical Characteristics of Enhanced Geothermal Systems (Hot Dry Rocks) in Gonghe-Guide Basin. Geophys. Geochem. Explor. 2013, 37, 35–41. [Google Scholar] [CrossRef]
  35. Gao, C.Y.; Huang, X.G.; Dai, W.Q.; Chen, Z.A. Experimental study on electrical conductivity of pyrolite at high temperature and high pressure. Chin. J. Geophys. 2020, 63, 3409–3419. [Google Scholar] [CrossRef]
  36. Egbert, G.D.; Kelbert, A. Computational recipes for electromagnetic inverse problems. Geophys. J. Int. 2012, 189, 251–267. [Google Scholar] [CrossRef] [Green Version]
  37. Chave, A.D.; Jones, A.G. The Magnetotelluric Method: Theory and Practice; Cambridge University Press: Cambridge, UK, 2012. [Google Scholar]
  38. Egbert, G.D.; Booker, J.R. Robust estimation of geomagnetic transfer functions. Geophys. J. Int. 1986, 87, 173–194. [Google Scholar] [CrossRef] [Green Version]
  39. Gamble, T.D.; Goubau, W.M.; Clarke, J. Magnetotellurics with a remote magnetic reference. Geophysics 1979, 44, 53–68. [Google Scholar] [CrossRef] [Green Version]
  40. Chen, X.B.; Zhao, G.Z.; Zhan, Y. A visual integrated windows system for MT data process and interpretation. Oil Geophys. Prospect 2004, 39, 11–16. [Google Scholar]
  41. Caldwell, T.G.; Bibby, H.M.; Brown, C. The magnetotelluric phase tensor. Geophys. J. 2004, 158, 457–469. [Google Scholar] [CrossRef] [Green Version]
  42. Kelbert, A.; Meqbel, N.; Egbert, G.D.; Tandon, K. ModEM: A modular system for inversion of electromagnetic geophysical data. Comput. Geosci. 2014, 6, 40–53. [Google Scholar] [CrossRef]
  43. Hill, G.J.; Bibby, H.M.; Ogawa, Y.; Wallin, E.L.; Heise, W. Structure of the Tongariro Volcanic system: Insights from magnetotelluric imaging. Earth Planet. Sci. Lett. 2015, 432, 115–125. [Google Scholar] [CrossRef]
  44. Liu, F.; Lang, X.J.; Lu, C.; Lin, W.J.; Tong, J.; Wang, G.L. Thermophysical parameters and 1ithospheric thermal structure in Guide Basin, Northeast Qinghai-Tibet Plateau. Environ. Earth Sci. 2017, 76, 199. [Google Scholar] [CrossRef]
  45. Yun, X.R.; Chen, X.J.; Cai, Z.H.; He, B.Z.; Zhang, S.S.; Lei, M.; Xiang, H. Preliminary study on magmatic emplacement and crystallization conditions and deep structure of hot dry rock in the northeastern Gonghe basin, Qinghai Province. Acta Petrol. Sin. 2020, 36, 3171–3191. [Google Scholar] [CrossRef]
  46. Tan, H.B.; Zhang, W.J.; Chen, J.S.; Jiang, S.Y.; Kong, N. Isotopeand geochemical study for geothermal assessment of the Xining basin of the northeastern Tibetan Plateau. Geothermics 2012, 42, 47–55. [Google Scholar] [CrossRef]
  47. Jia, S.X.; Guo, W.B.; Mooney, W.D.; Wang, F.Y.; Duan, Y.H.; Zhao, J.M.; Lin, J.Y.; Liu, Z. Crustal structure of the middle segment of the Qilian fold belt and the coupling mechanism of its associated basin and range system. Tectonophysics 2019, 770, 128154. [Google Scholar] [CrossRef]
  48. Gao, J.; Zhang, H.J.; Zhang, H.P.; Zhang, S.Q.; Cheng, Z.P. Three-dimensional magnetotelluric imaging of the SE Gonghe Basin: Implication for the orogenic uplift in the northeastern margin of the Tibetan Plateau. Tectonophysics 2020, 789, 228525. [Google Scholar] [CrossRef]
  49. Bai, D.H.; Unsworth, M.J.; Meju, M.A.; Ma, X.B.; Teng, J.W.; Kong, X.R.; Sun, Y.; Sun, J.; Wang, L.F.; Jiang, C.S.; et al. Crustal deformation of the eastern Tibetan Plateau revealed by magnetotelluric imaging. Nat. Geosci. 2010, 3, 358–362. [Google Scholar] [CrossRef]
  50. Zhang, Z.J.; Yuan, X.H.; Chen, Y.; Tian, X.B.; Kind, R.; Li, X.Q.; Teng, J.W. Seismic signature of the collision between the east Tibetan escape flow and the Sichuan Basin. Earth Planet. Sci. Lett. 2010, 292, 254–264. [Google Scholar] [CrossRef] [Green Version]
  51. Jia, S.X.; Zhang, X.K.; Zhao, J.R.; Wang, P.Y.; Zhang, C.K.; Xu, Z.F.; Pan, J.S.; Liu, Z.; Pan, S.Z.; Sun, G.W. Deep seismic sounding data reveal the crustal structures beneath Zoige basin and its surrounding folded orogenic belts. Sci. China Earth Sci. 2010, 53, 203–212. [Google Scholar] [CrossRef]
  52. Liu, M.; Mooney, W.D.; Li, S.; Okaya, N.; Detweiler, S. Crustal structure of the northeastern margin of the Tibetan plateau from the Songpan-Ganzi terrane to the Ordos basin. Tectonophysics 2006, 420, 253–266. [Google Scholar] [CrossRef]
  53. Wang, Q.; Gao, Y.; Shi, Y.T.; Shi, Y.T.; Wu, J. Seismic anisotropy in the uppermost mantle beneath the northeastern margin of Qinghai-Tibet plateau: Evidence from shear wave splitting of SKS, PKS and SKKS. Chin. J. Geophys. 2013, 56, 892–905. (In Chinese) [Google Scholar] [CrossRef]
  54. Zhang, Z.J.; Klemperer, S.; Bai, Z.M.; Chen, Y.; Teng, J.W. Crustal structure of the Paleozoic Kunlun orogeny from an active-source seismic profile between Moba and Guide in East Tibet, China. Gondwana Res. 2011, 19, 994–1007. [Google Scholar] [CrossRef]
  55. Zhang, H.S.; Gao, R.; Tian, X.B.; Teng, J.W.; Li, Q.S.; Ye, Z.; Liu, Z.; Si, S.K. Crustal S-wave velocity beneath the northeastern Tibetan plateau inferred from teleseismic P-wave receiver functions. Chin. J. Geophys. 2015, 58, 3982–3992. [Google Scholar] [CrossRef]
  56. Wang, X.B.; Yu, N.; Gao, S.; Luo, W.; Cai, X.L. Research progress in research on electrical structure of crust and upper mantle beneath the eastern margin of the Tibetan plateau. Chin. J. Geophys. 2017, 60, 2350–2370. [Google Scholar] [CrossRef]
  57. Xiao, Q.B.; Zhang, J.; Zhao, G.Z.; Wang, J.J. Electrical resistivity Structures northeast of the Eastern Kunlun Fault in the Northeastern Tibet: Tectonic implications. Tectonophysics 2013, 601, 125–138. [Google Scholar] [CrossRef]
  58. Feldman, I.S. On the nature of conductive layers in the earth’s crust and upper mantle. Geoelectr. Geotherm. Stud. 1976, 1, 721–730. [Google Scholar]
  59. Feng, Y.M.; Chao, X.D.; Zhang, E.P.; Hu, Y.X.; Pan, X.P.; Yang, J.L.; Jia, Q.Z.; Li, W.M. Structure, Orogenic Process and Dynamics of the West Qinling Orogenic Belt; Xi’an Map Press: Xi’an, China, 2002. [Google Scholar]
  60. Ma, X.B.; Kong, X.R.; Liu, H.B.; Yan, Y.L. The electrical structure of northeastern Qinghai_Tibet plateau. Chin. J. Geophys. 2005, 48, 689–697. [Google Scholar] [CrossRef]
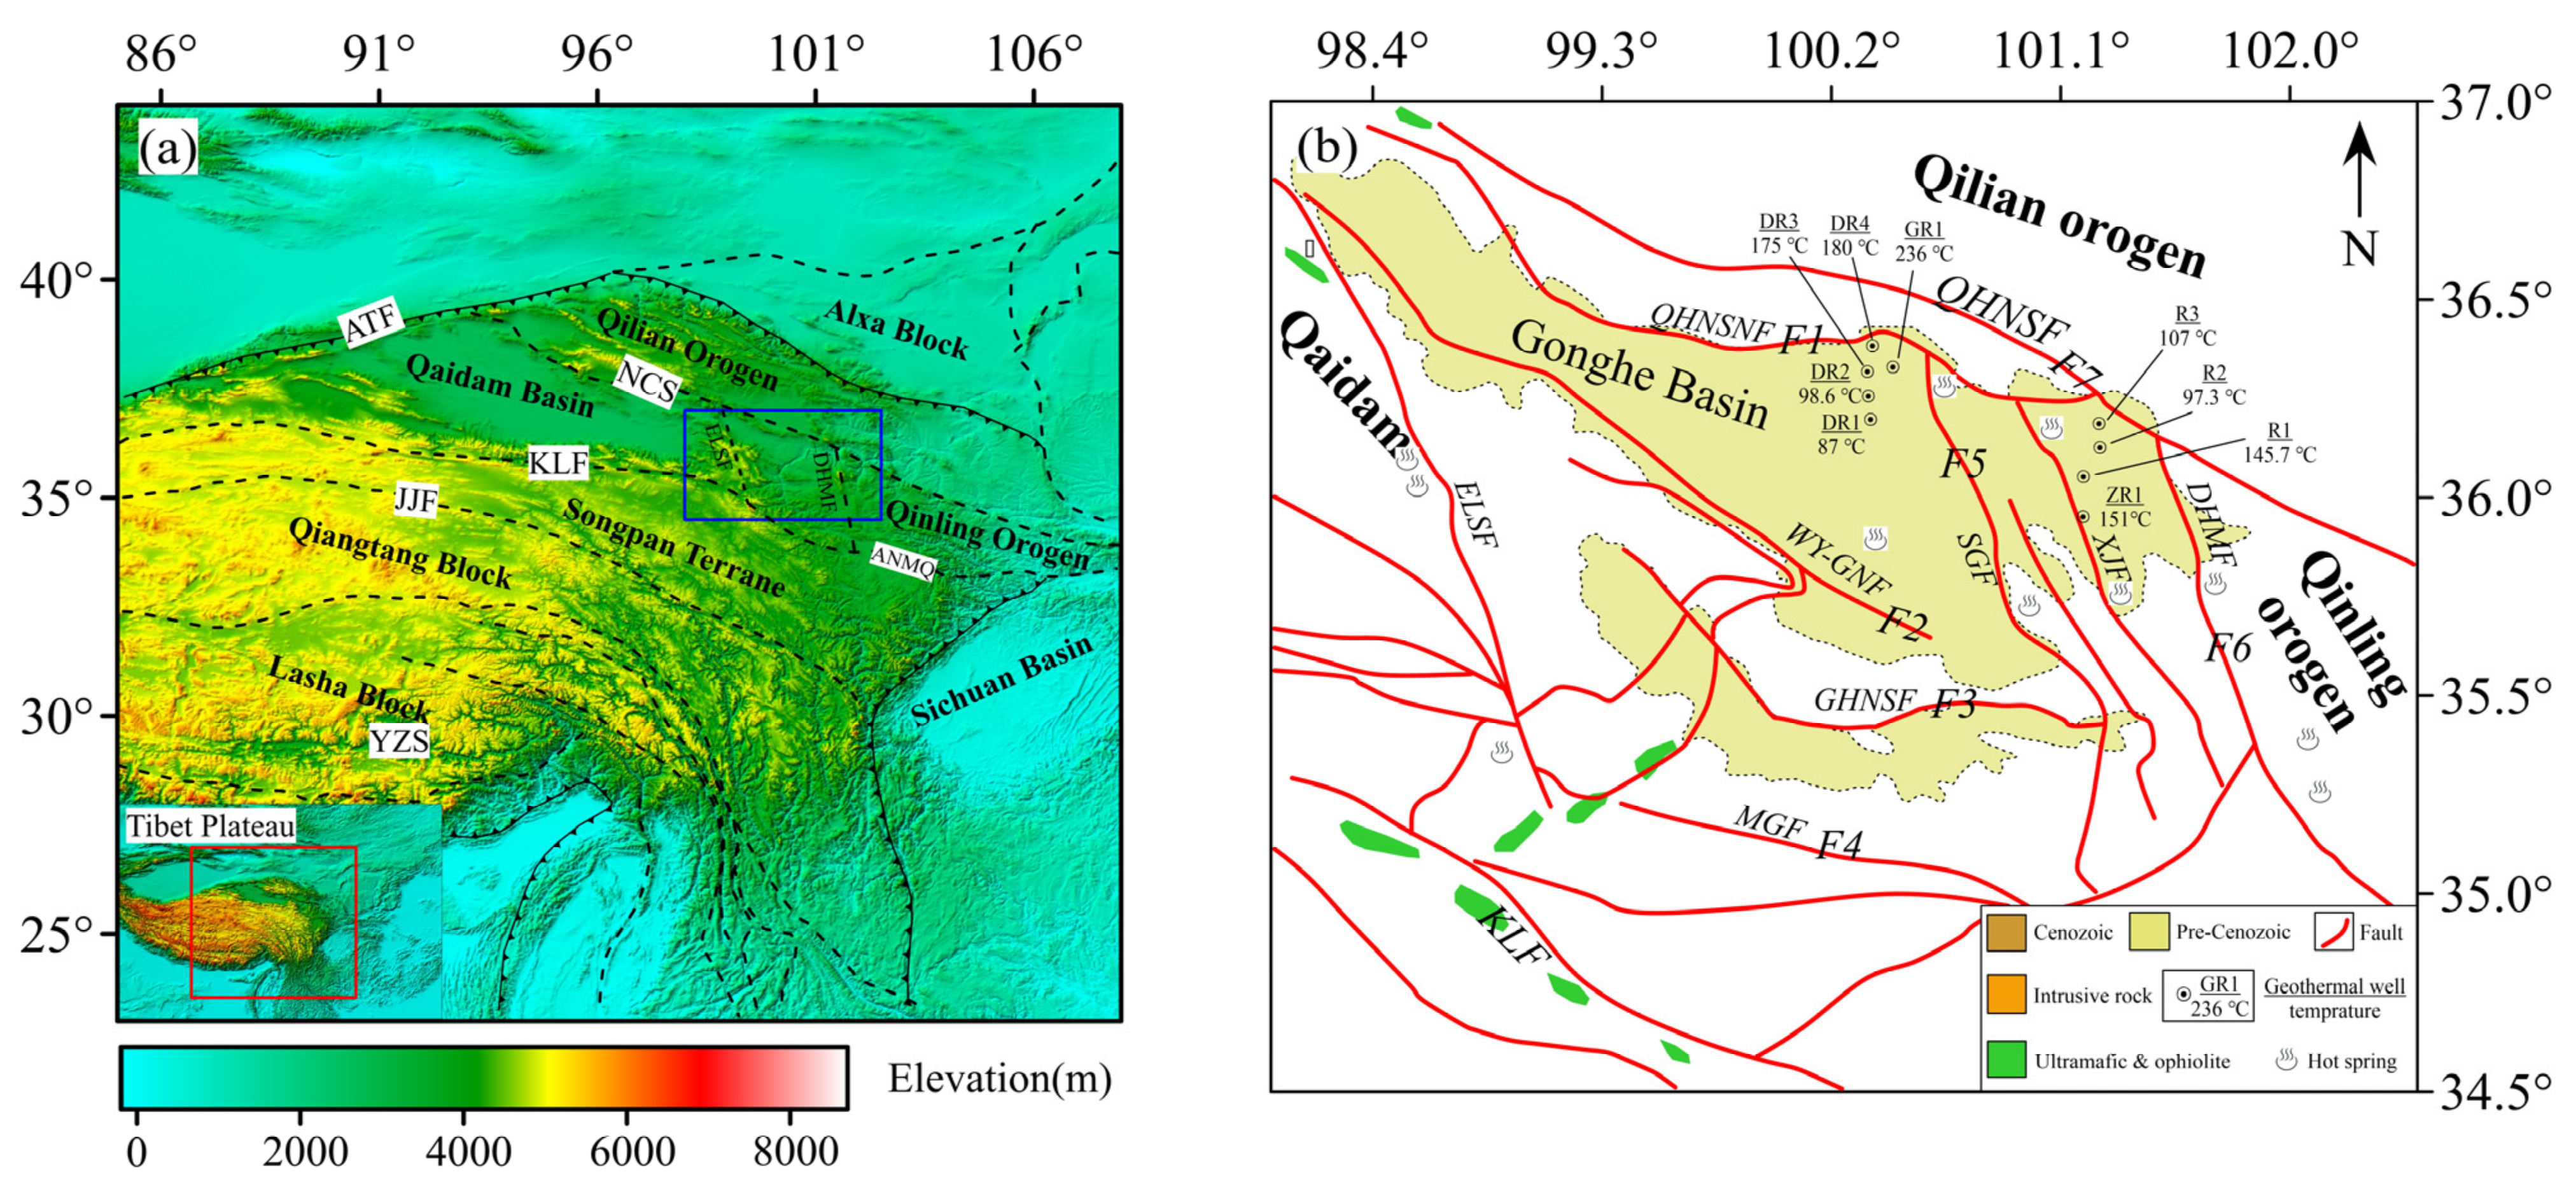
Figure 1. Tectonic setting of Gonghe Basin and Tibetan Plateau. (a) Tectonic setting around the Northeast Tibetan plateau, which is marked by red rectangle in the inset map, and (b) is marked by a blue rectangle and main faults are represented by black dashed lines. (b) Regional geologic structures around Gonghe Basin (modified from [35]. Abbreviations: Kunlun Fault (KLF), North China suture (NCS), Altyn Tagh Fault (AFT), Ainimaqing suture zone (ANMQ), Qinghai–Nan Shan Fault (QHNFS), Duohemao Fault (DHMF), Ela shan fault (ELSF), Shagou Fault (SGF), Xinjie Fault (XJF), Wayuxiangka Fault (WY-GNF), Gonghe–Nan shan Fault (GHNSF), and Moganshan Fault (MGF).
Minerals 13 00883 g001
Figure 2. The distribution of magnetotelluric survey points and seismic events around the study area. The black dotted line in the figure shows the main faults in the basin and its surrounding areas. The circle with white background and black edge refers to the earthquake events since 1964. According to the magnitude of the earthquake, the circle with different sizes is used (the data is from the China Earthquake Catalog, which can be found from http://www.ceic.ac.cn/ (accessed on 10 September 2022)). The red triangle represents the position of the magnetotelluric survey point.
Minerals 13 00883 g002
Figure 3. Skew angle diagrams with different periods.
Minerals 13 00883 g003
Figure 4. RMS of magnetotelluric survey points.
Minerals 13 00883 g004
Figure 5. Measured value, fitting value, and residual error of each measuring point when the period is 1.7783 s. OBS is the observation value, INV is the inversion value, and RMS is the residual. (a) Resistivity in xy direction. (b) Resistivity in yx direction. (c) Phase in xy direction. (d) Phase in yx direction.
Minerals 13 00883 g005
Figure 6. Horizontal slices of 3D-resistivity models at different depths. (c) The black triangle represents the magnetotelluric station. Black solid lines indicate faults. Faults F1–F5 are the same as that in Figure 1b. C1–C3 represents three conductive anomalies below the Gonghe Basin. The magnetotelluric profiles AA’ and BB’ in [35] are shown by the black dotted line in (e). The WLGSZ marked in (b) replaces the Waliguan uplift zone, and GHNS replaces the Gonghe South Mountain.
Minerals 13 00883 g006
Figure 7. Magnetotelluric survey points and resistivity slice in the east of Gonghe Basin. The black dot is the location of magnetotelluric survey point. Faults F1–F8 are consistent with that described in Figure 1b. (a) is a plan view of the slice location. (bh) shows the vertical resistivity slices, with the section position shown in (a). (i) is a 3D resistivity structure model.
Minerals 13 00883 g007
Figure 8. Lithology, temperature measurement, resistivity, and thermal reservoir of ZR2 borehole (modified according to [25]).
Minerals 13 00883 g008
Figure 9. Geothermal model of the Gonghe Basin. The red lines in the figure represents faults, with the solid red line representing ELSF on the western boundary of the Gonghe Basin, and the dashed red line F1–F8 consistent with Figure 1b.
Minerals 13 00883 g009
Disclaimer/Publisher’s Note: The statements, opinions and data contained in all publications are solely those of the individual author(s) and contributor(s) and not of MDPI and/or the editor(s). MDPI and/or the editor(s) disclaim responsibility for any injury to people or property resulting from any ideas, methods, instructions or products referred to in the content.