Article

In Situ Trace Element and Fe-O Isotope Studies on Magnetite of the Iron-Oxide Ores from the Takab Region, North Western Iran: Implications for Ore Genesis

1
Sorbonne Université, CNRS-INSU, Institut des Sciences de la Terre de Paris, ISTeP, 75005 Paris, France
2
CRPG, CNRS, Université de Lorraine, 54500 Vandoeuvre-lès-Nancy, France
3
Sorbonne Université, IPGP, CNRS-INSU, 75005 Paris, France
4
Université Paris-Saclay, CNRS, GEOPS, 91405 Orsay, France
5
Department of Geology, Faculty of Science, University of Zanjan, University Boulevard, Zanjan 45371-38791, Iran
6
Department of Earth Sciences, Institute for Advanced Studies in Basic Sciences (IASBS), Zanjan 45137-66731, Iran
*
Author to whom correspondence should be addressed.
Minerals 2023, 13(6), 774; https://doi.org/10.3390/min13060774
Submission received: 10 March 2023 / Revised: 19 April 2023 / Accepted: 28 May 2023 / Published: 6 June 2023
(This article belongs to the Section Mineral Deposits)

Abstract

:
The early Cambrian Takab iron ore deposit is situated in the northern part of the Sanandaj-Sirjan zone, western Iran. It consists of banded, nodular and disseminated magnetite hosted in folded micaschists. Trace element and Fe and O isotopic experiments reveal various hydrothermal precipitation environments under reduced to slightly oxidizing conditions. Disseminated magnetite has high Ti (945–1940 ppm) positively correlated with Mg + Al + Si, and heavy Fe (+0.76 to +1.86‰) and O (+1.0 to +4.07‰) isotopic compositions that support a magmatic/high-T hydrothermal origin. Banded magnetite has low Ti (15−200 ppm), V (≤100 ppm), Si and Mg (mostly ≤300 ppm) and variable Al. The ∂56Fe values vary from −0.2‰ to +1.12‰ but most values also support a magmatic/high-T hydrothermal origin. However, variable ∂18O (−2.52 to +1.22‰) values provide evidence of re-equilibration with lower-T fluid at ~200–300 °C. Nodular magnetite shows high Mn (≤1%), and mostly negative ∂56Fe values (average, −0.3‰) indicative of precipitation from an isotopically light hydrothermal fluid. Re-equilibration with carbonated rocks/fluids likely results in a negative Ce anomaly and higher ∂18O (average, +6.30‰). The Takab iron ore deposit has, thus, experienced a complex hydrothermal history.

1. Introduction

Magnetite forms in various geological settings and can survive chemical alteration and mechanical breakdown processes. It can accommodate a variety of trace elements and thus may be a useful petrogenetic indicator of the specific environments in which it formed and evolved [1,2,3,4]. Numerous studies have reported that magmatic- and hydrothermal-related magnetite are characterized by different chemical signatures: for example, hydrothermal magnetite contains higher Ca, Al and Mn and lower Ti and V than magmatic magnetite [1,3,4]. Furthermore, iron and oxygen isotope signatures differ in the two ore-forming contexts e.g., [2,5,6,7,8].
In Iran, iron deposits were formed during several metallogenic stages. The Neoproterozoic to Early Cambrian iron deposits are mainly interpreted as Kiruna-type IOA (Iron Oxide-Apatite), whereas the Mesozoic to Cenozoic deposits are mostly interpreted as skarns e.g., [9,10,11,12,13,14]. Their spatial distribution is correlated with the main suture zones of the fragmented Iranian continental block [13,15,16]. The major deposits are located in the Central Iranian zone and interpreted as associated with the evolution of the Paleo-Tethys Ocean, while the deposits in the Alborz magmatic zone, Urumieh–Doktar magmatic arc and the Sanandaj–Sirjan magmatic-metamorphic zone (SSZ) are related to the subduction and the closure of the Neo–Tethys Ocean ([13] and reference therein). The Sanandaj–Sirjan structural zone extends 1500 km from the northwest to the southeast parallel to the Zagros belt, on the East side of the Main Zagros Fault (Figure 1; [15,17,18]). The SSZ hosts numerous Fe and Fe-Mn deposits interpreted as being of volcano-sedimentary, hydrothermal or mixed volcano-sedimentary and skarn in origin: for example the major deposits from Gol Gohar in the south near Sirjan, the Hamekasi deposits near Hamedan (e.g., Baba Ali), Shamsabad near Arak and in the Zanjan district (e.g., Sorkhe Dizaj) from the nearby northwestern Central Iranian Zone (Figure 1; [13,19] and references therein, [20]).
Compared to the above deposits, relatively, little is known about the ore deposits in the northern part of the SSZ. Here we present results from a study of the iron ore deposit of Takab in the NW of SSZ, a hundred kilometers west of Zanjan [21,22,23]. Based on field and petrologial studies it was suggested that these ores are typical for banded iron formation (BIF) environments [21,24]. However, preliminary microtextural and mineralogical studies suggest that these ores have experienced significant fluid events [22,23]. Here we show that an in-situ study of trace elements in magnetite coupled with Fe and O isotopes of magnetite from the Takab iron deposit is powerful to constrain the factors controlling the chemical and isotopic composition of magnetite, and thereby to precise the origin and evolution of this iron deposit.

2. Materials and Methods

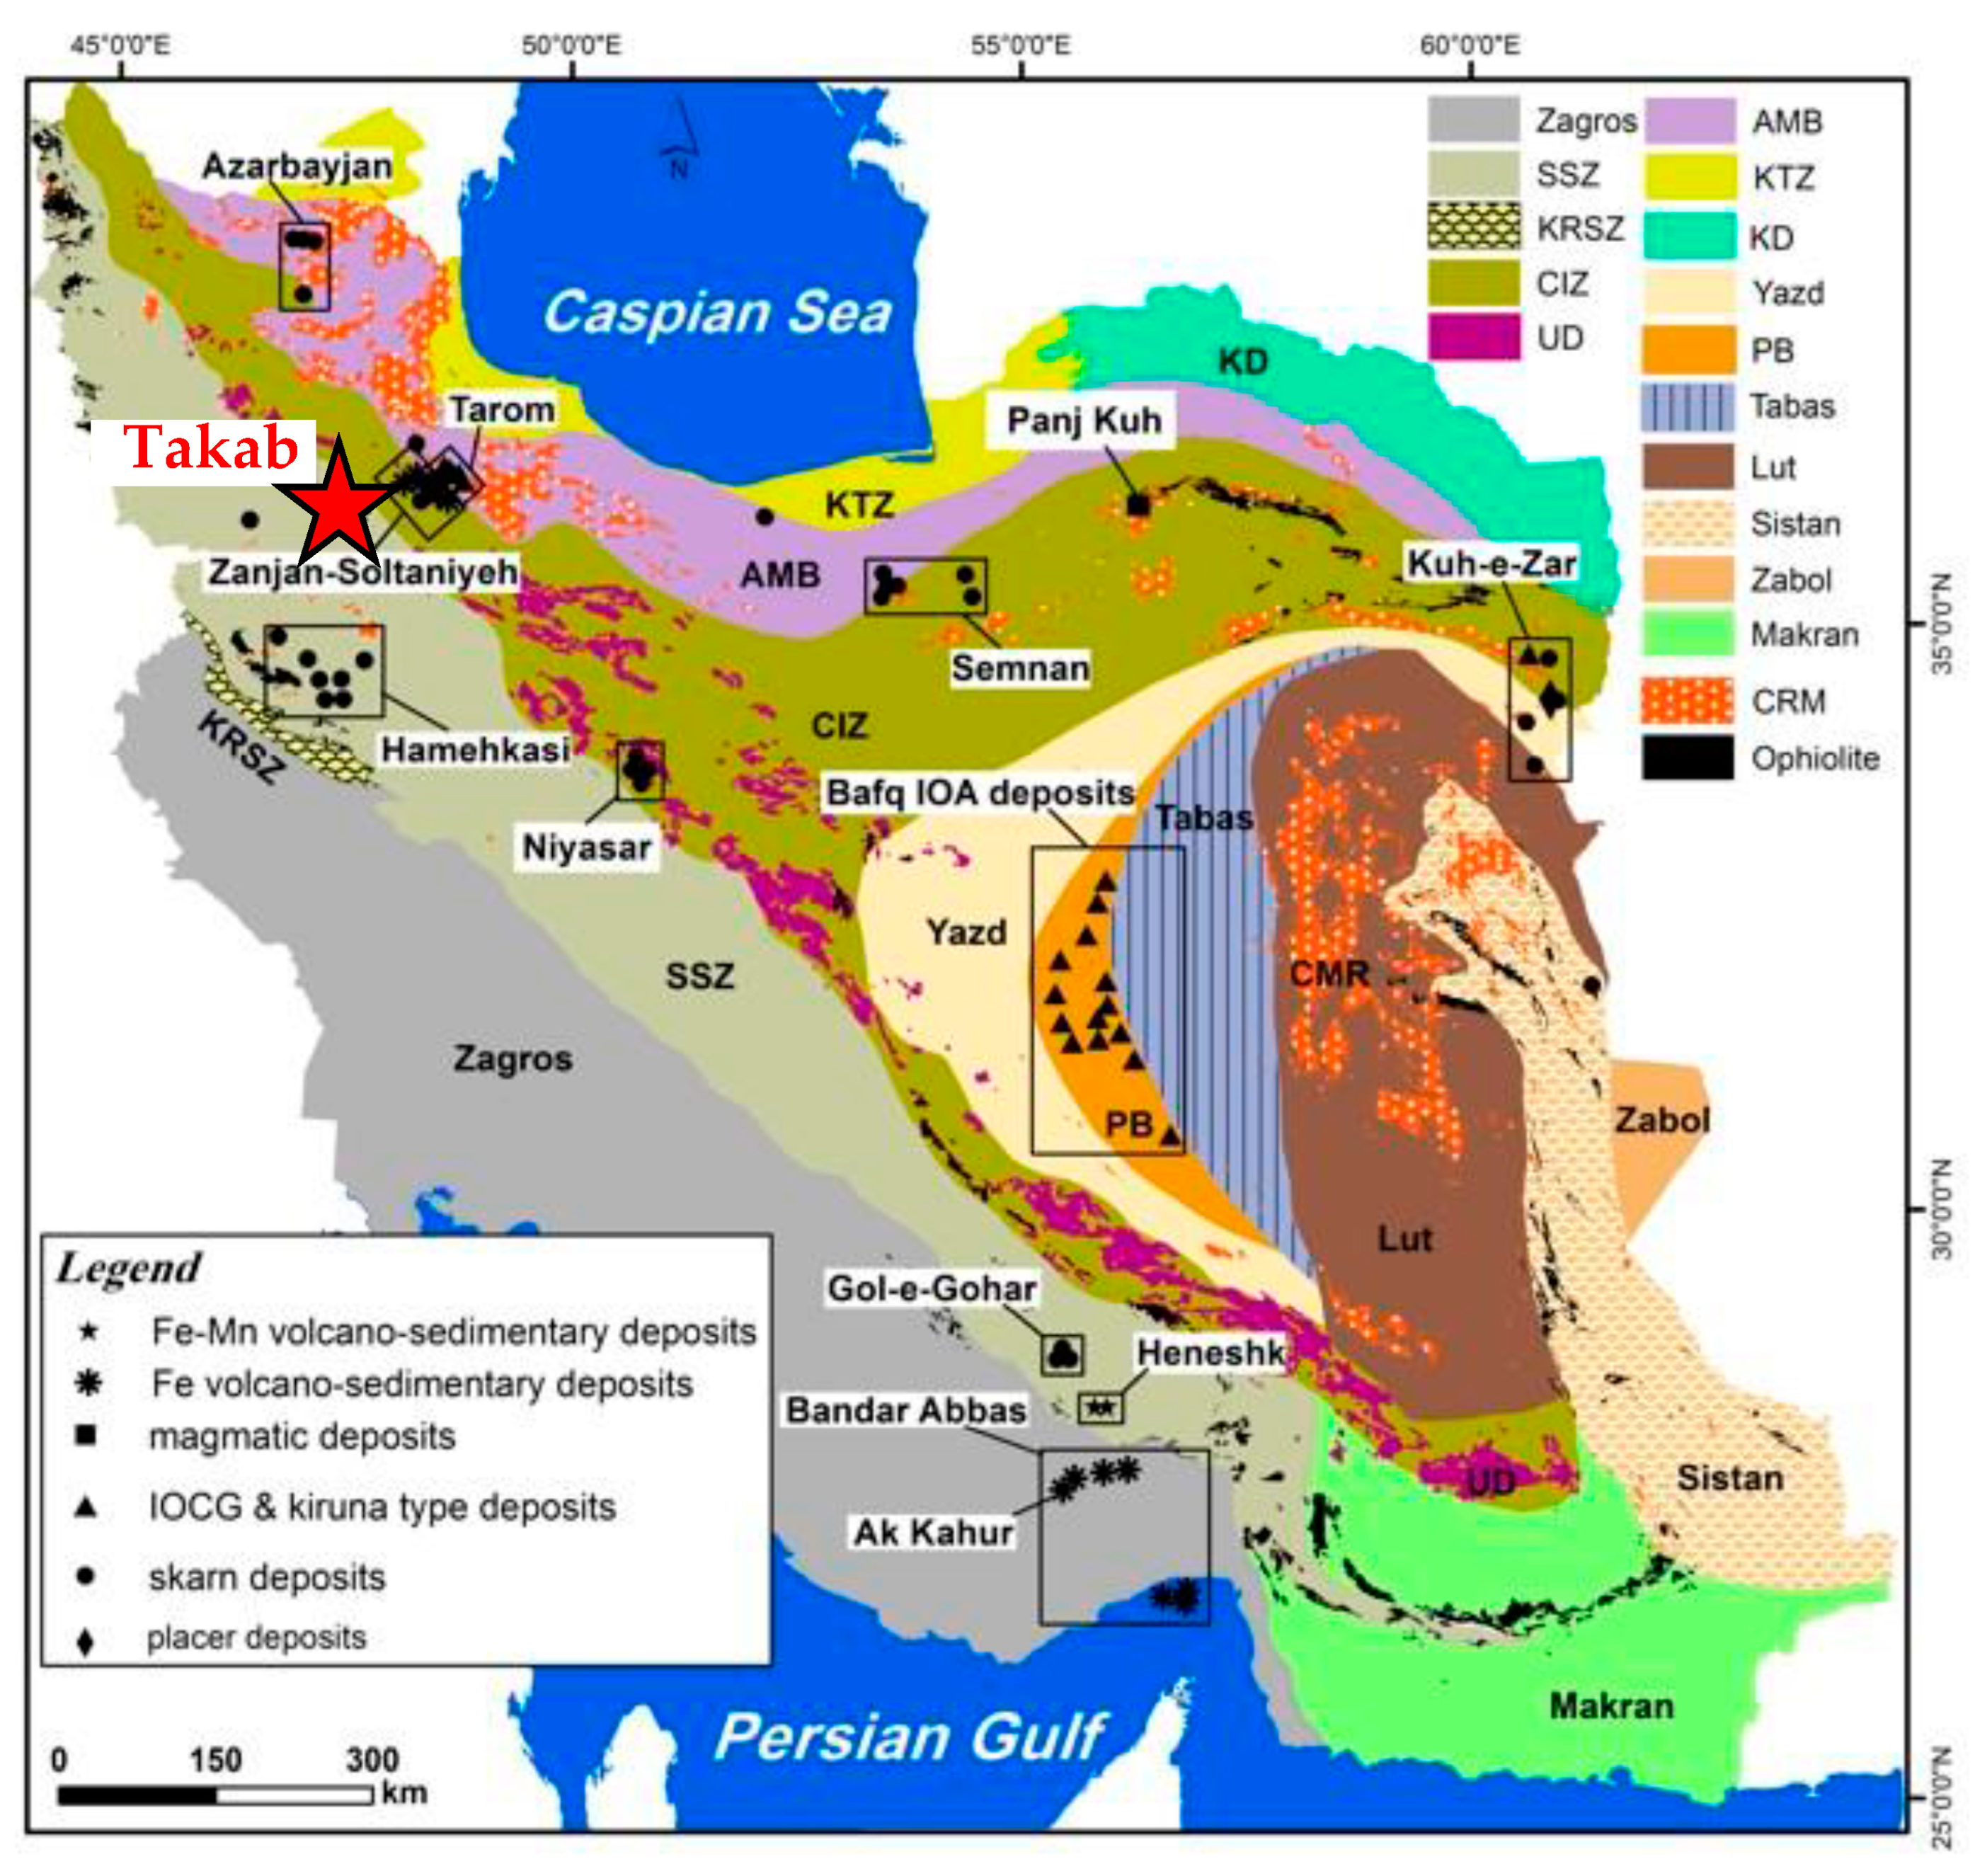
2.1. Geological Settings

The ore deposit is hosted in the Takab complex located in the northern part of the SSZ at 47°45′ to 47°05′ E and 37°30′ to 36°30′ N (Figure 1). The complex basement has been dated at ca. 2961 ± 72 Ma (U-Pb), an age comparable to ages known from the Central Iranian Microcontinent [25]. The Takab complex experienced metamorphism and deformation during the Precambrian and Cenozoic [26]. Exposure of the complex basement is related to Mesozoic (Early to Middle Jurassic) crustal extension and subsequent Cenozoic (Tertiary) exhumation [13,26]. The complex was overthrusted by Miocene volcano-sedimentary rocks [13].
The Takab complex is composed of a variety of rocks. Gneisses are intercalated with micaschists and calcschists, discontinuous layers of metabasite, amphibolite, jaspilite, quartzite and rare granulite. The U-Pb dating on detrital zircons of the schists gives a depositional age of 550 Ma [24].
The iron oxide mineralization studied here, is located ~5 km northwest of Takab. It is hosted in micaschists.

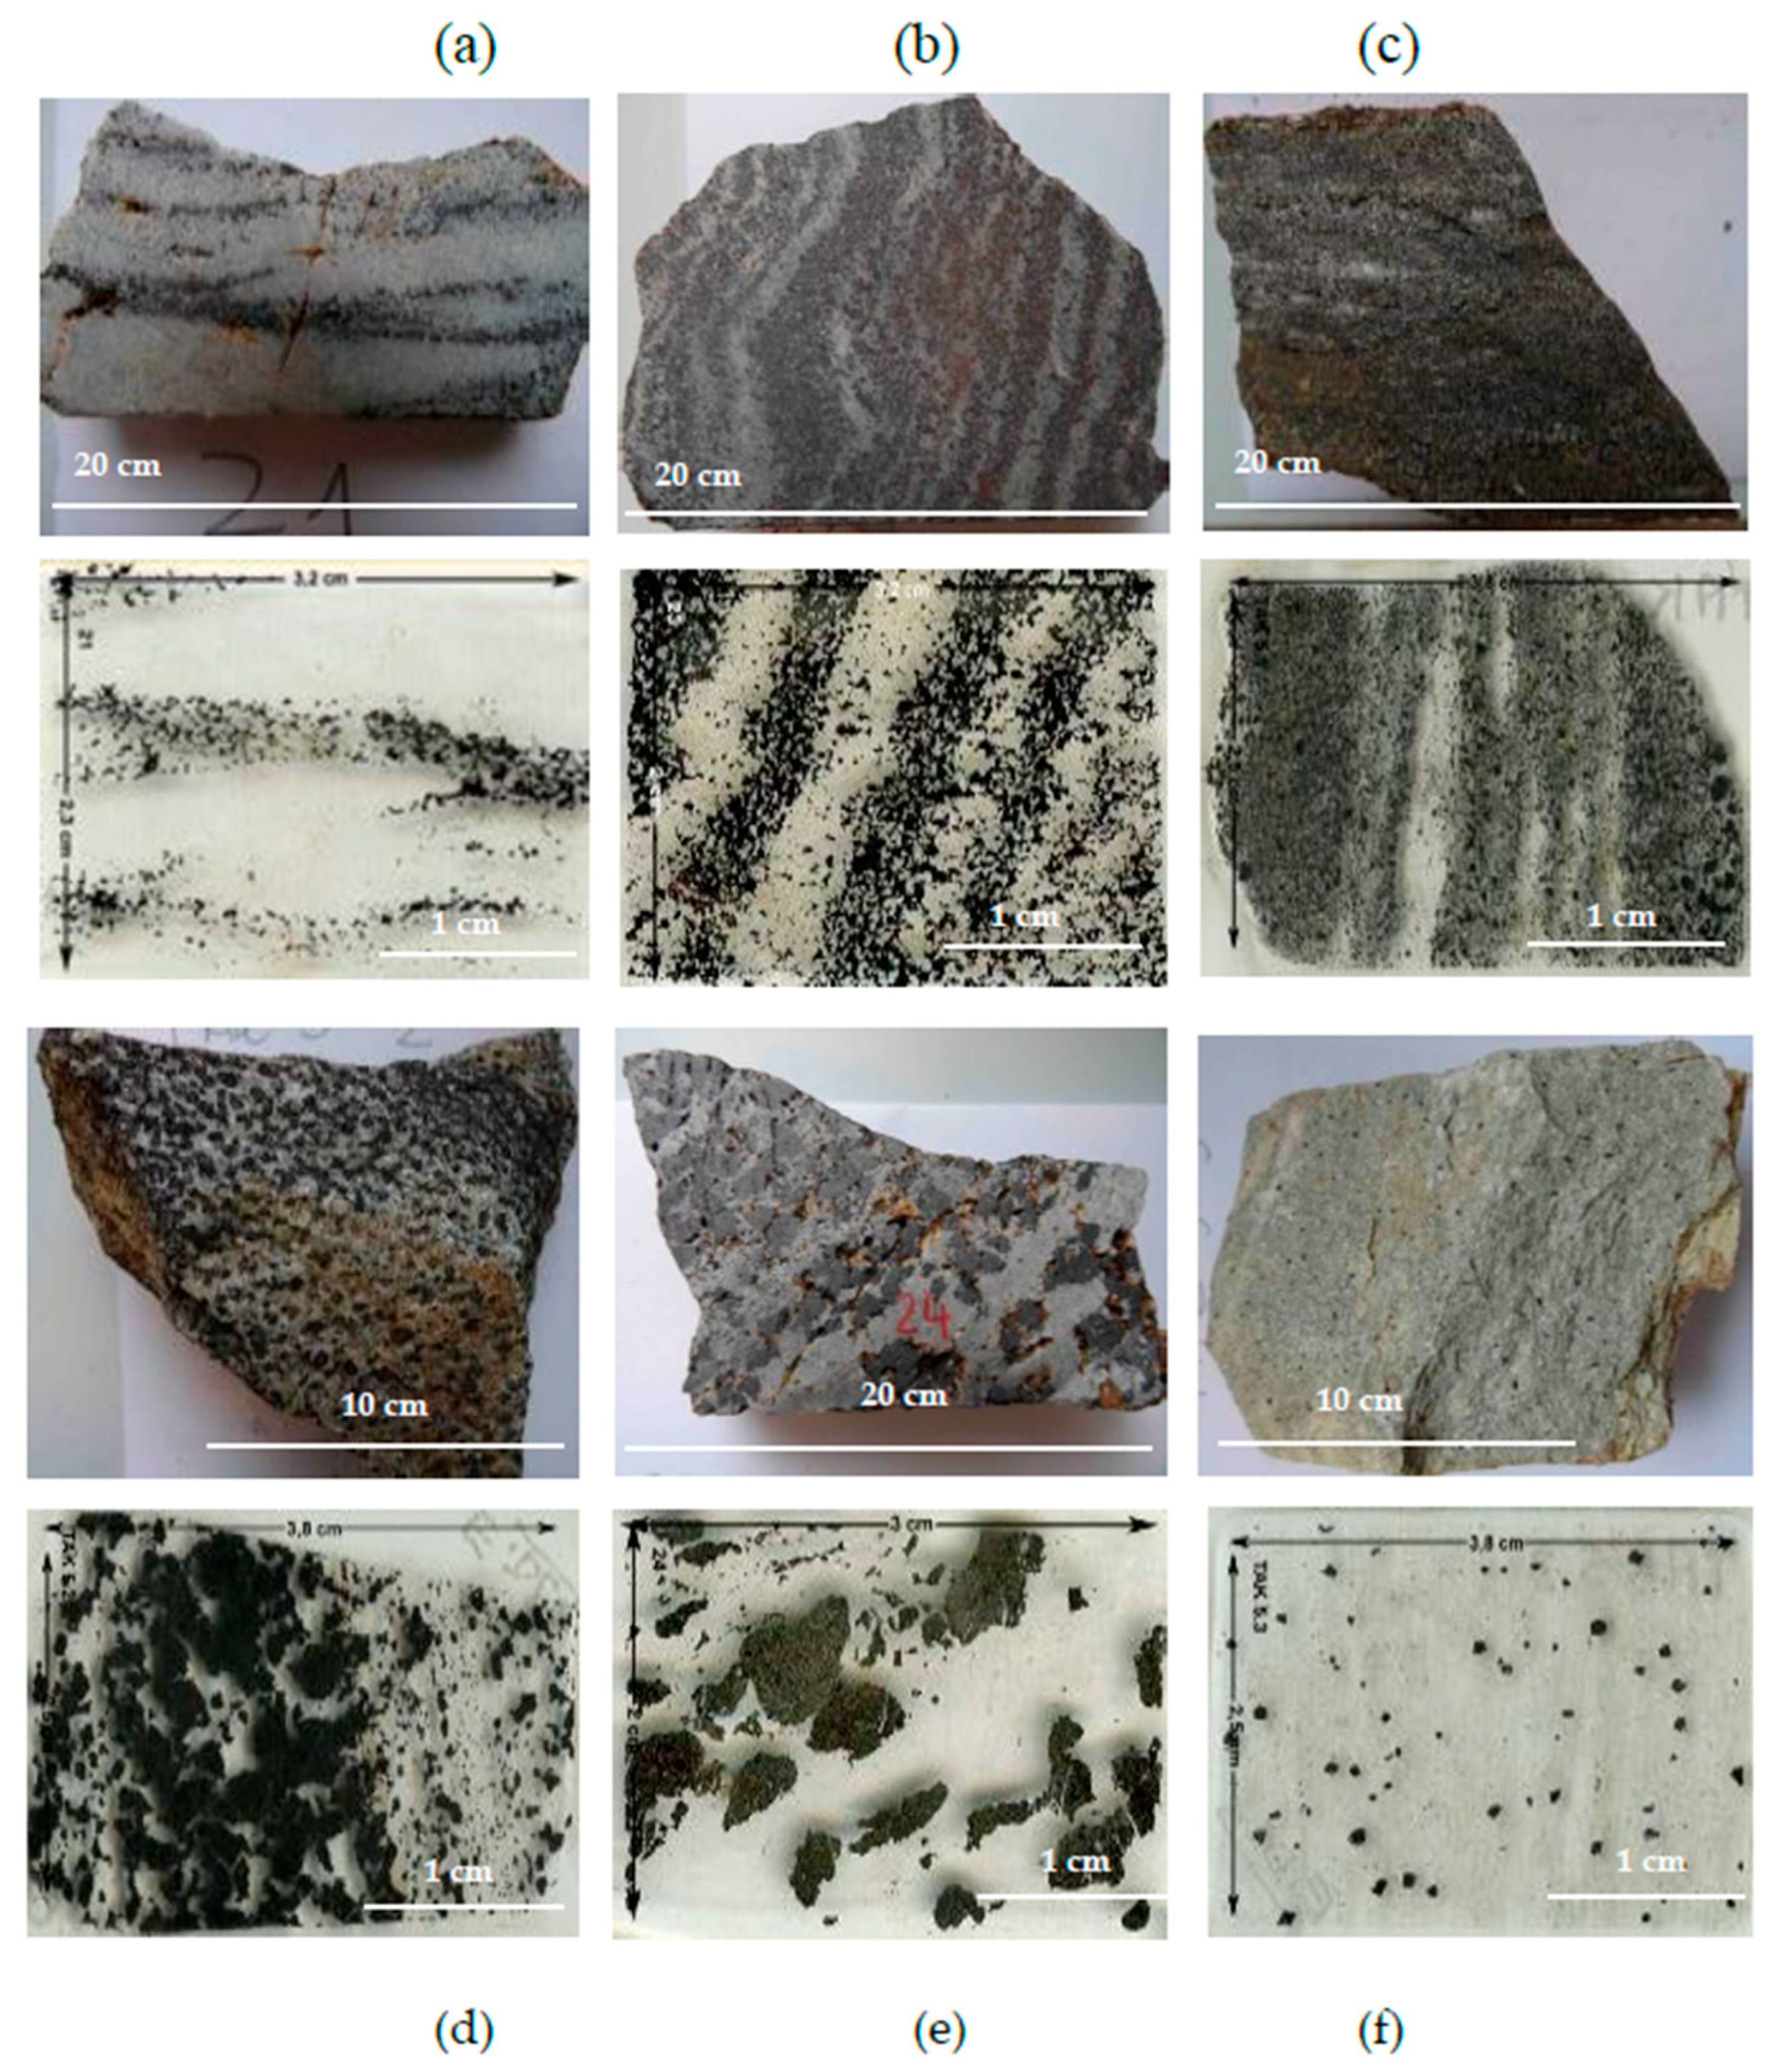
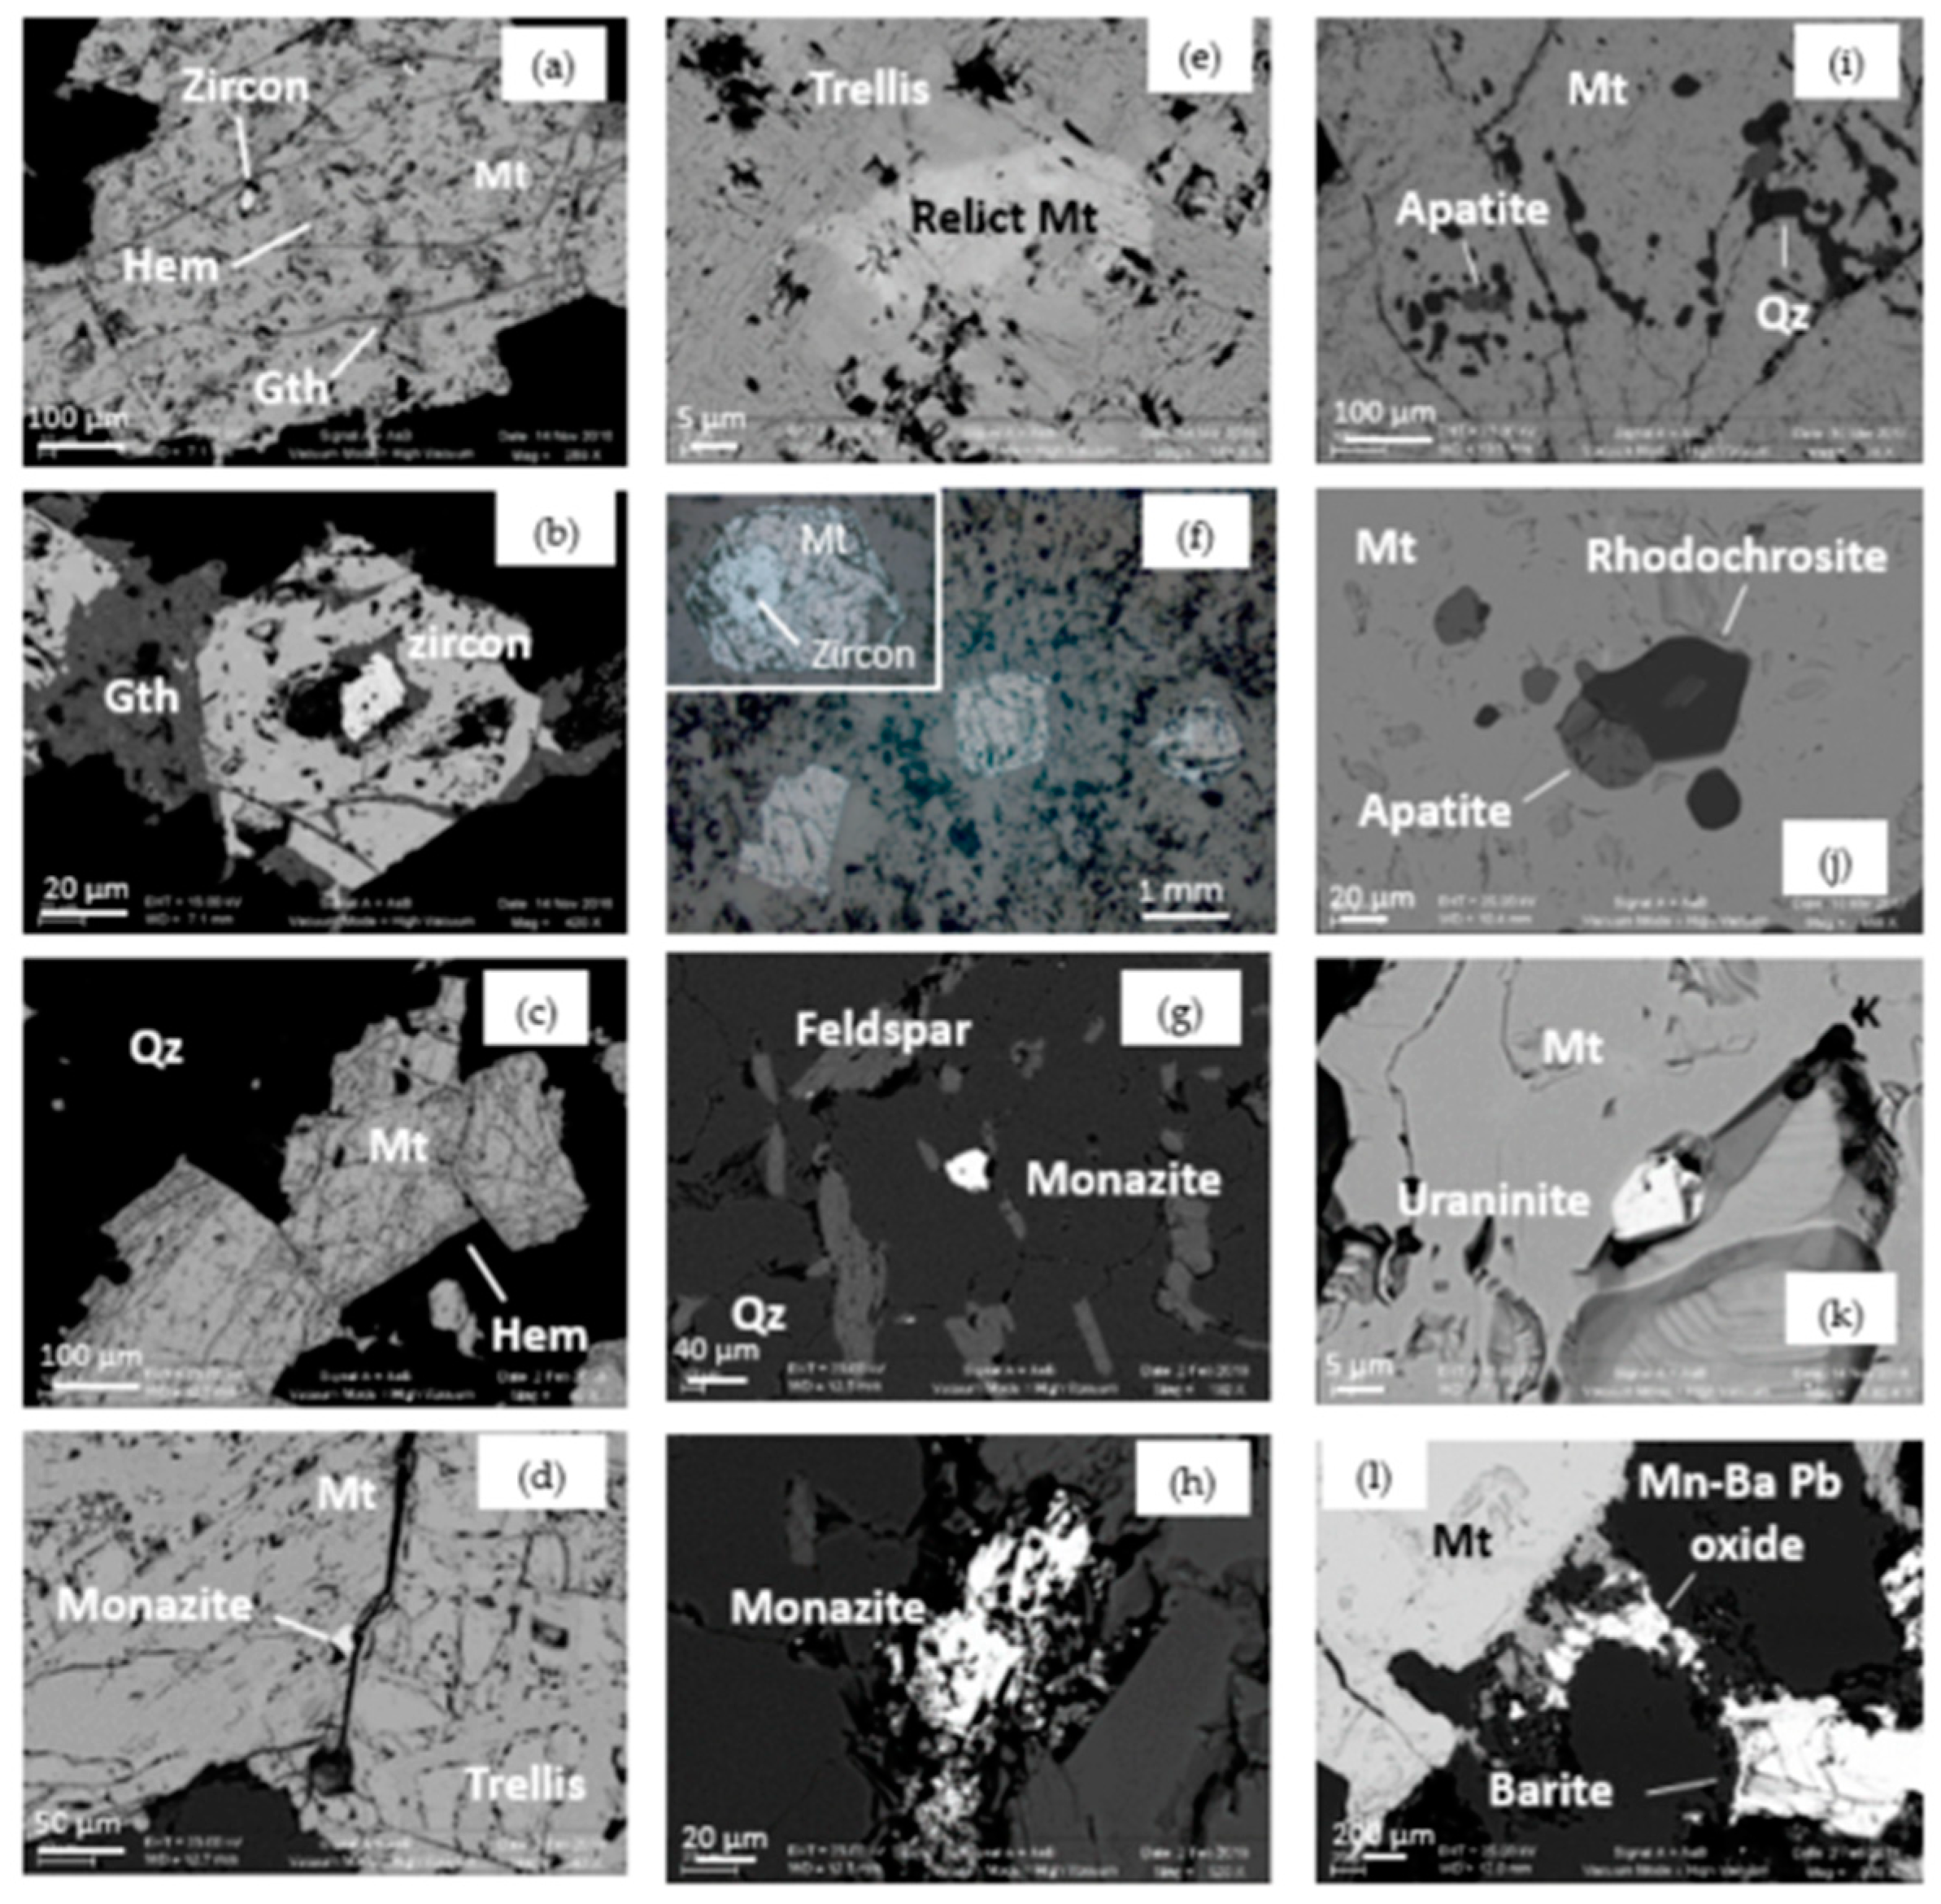
2.2. Magnetite-Bearing Ore Types

After a detailed petrographic investigation, seven samples representing the various iron ore types were selected out of twenty iron ore samples. Photographs and photomicrographs of representative samples are shown in Figure 2 and Figure 3 and Table S1.
The iron oxides, mainly magnetite, are hosted in light grey micaschists. Magnetite and silicates form discontinuous layers or patches showing flow structures. The silicate bands are composed of quartz, K-feldspar, muscovite, and biotite (Figure 2). Magnetite forms mainly bands, but also nodules, and occurs disseminated in the silicate matrix.
In a few samples late hematite forms thin rims, trellis, or micro vein-filling. Rare goethite occurs. The iron oxide mineralogy and the accessory minerals are detailed in Table 1 and Table 2 and briefly summarized below.
The banded iron ore type consists of variably dense magnetite banding intercalated in the quartz K-feldspar ± mica matrix (Figure 2 and Figure 3). The banding is discontinuous in samples TAK21 and TAK22, while sample TAK52 shows fine and coarse magnetite bands. Flow structure is observed in sample TAK23. Magnetite forms grains from ~50 µm to several hundreds of µm in diameter, which frequently host euhedral zircons (sometimes corroded) and less often droplet-like inclusions of galena and sphalerite. In some samples, magnetite is partly altered to hematite. Trellis structures, which are characteristic of martite, are observed in sample TAK23 and a few large grains of sample TAK51 and TAK52. Goethite is interstitial or forms thin veins in magnetite, sometimes hosting minute hematite and phosphate inclusions.
The nodular ore (TAK24) is composed of mm-sized iron oxide agglomerates in a quartz matrix. They are partly elongated and disrupted (Figure 2). Small iron oxide grains sometimes show 120° triple junctions with quartz grains, evidence for static crystallization, and grain boundary migration, indicating dynamic crystallization. Magnetite is not hematized. It hosts inclusions of chlorapatite, Mn- and Fe-carbonates and uraninite. Mn-Ba-oxides and barite partly replace Ba-K feldspar (hyalophane) (Figure 3).
In the disseminated ore (TAK53) magnetite forms euhedral grains (~400 µm–1.5 mm), which host inclusions of monazite and zircon. Altered monazite is also abundant in the matrix. Moreover, the matrix also hosts P-, U- and Th-bearing phosphates, zircon and barite (Figure 3).

2.3. Analytical Methods

After detailed imaging using scanning electron microscopy (SEM) in backscattered electron mode (BSE), we selected five samples representative of the different ore types and of the relative abundance of each ore-type: three banded ore-type (TAK21, TAK51, TAK52), one nodular ore-type (TAK24) and one disseminated ore-type (TAK53). Rare earth elements and Y were determined on whole-rock samples using inductively coupled plasma mass spectrometry (ICP-MS). Major and trace element composition of magnetite were determined using electron microprobe analysis (EMPA). In-situ Fe and O isotope analysis of magnetite were then carried out by secondary ion mass spectrometry (SIMS) on the four samples TAK51 and TAK52 (banded), TAK24 (nodular) and TAK53 (disseminated).

2.3.1. ICP-MS Analysis

ICP-MS analyses were performed at the SARM-CRPG (Service d’analyse des roches et des minéraux, Centre de Recherches Pétrographiques et Géochimiques, Vandoeuvre-lès-Nancy, France). The samples were fused with LiBO2, dissolved with HNO3, and analyzed by ICP-MS for trace element concentrations after calibration by international standards. For more details on the instruments used (ICP and AES), precisions, and detection limits, and, also on the applied analytical procedures, see http://www.crpg.cnrs-nancy.fr/SARM/, accessed on 1 January 2022.

2.3.2. SEM and EMPA Analysis

SEM imaging was carried out using a ZEISS Supra 55 VP at ISTeP (Sorbonne Université, Paris, France). Electron microprobe analyses were performed with a Cameca SX100 electron microprobe equipped with five wavelength dispersive spectrometers at CAMPARIS, Sorbonne-Université, Paris. All analyses were made based on detailed SEM-BSE imaging at high resolution to avoid defects and contamination from other phases. Carbon coating was added simultaneously to standards and samples to ensure the same coating thickness. The operating conditions for major elements, Fe and O were: monochromators LIF for the measurement of Fe and PC1 for oxygen; accelerating voltage 15 kV; beam current 40 nA; counting times, 10 s over the peak and 10 s for background measured on each side of the peak. For trace elements, monochromators were LTAP (Si, Al, Mg), PET (for Ca), and PC1 for oxygen. To decrease the detection limits, Ti, V, Mn, Ni, Cr and Cu were simultaneously analyzed with LIF and LLIF monochromators on three different spectrometers. The operating conditions were: 25 keV, 300 nA, 40 s to 70 s and a beam size of 10 µm. Any damage effects on the samples were checked during analyses. The concentration determined for V using the Kα lines was not affected by the adjacent Ti Kβ line at the observed low Ti concentration. Standards were synthetic metal oxides and natural minerals: Ti, Mn: MnTiO3; Fe, O: Fe2O3; Al; orthoclase; Cr: Cr2O3; Ni: NiO; Mg, Si, Ca: diopside; V: vanadinite; Cu: Cu native. These settings yielded minimum detection limits on the average concentrations as low as ~3–4 for Ca, ~5–9 ppm for Mg, Al, Si and Cr; and ~8–15 ppm for the other trace elements. We found that Cu and in some samples Ni, and Cr have average concentrations below their minimum detection limit and cannot be accurately determined.

2.3.3. SIMS Isotope Analysis

In situ, Fe and oxygen isotopic analyses were performed with the CAMECA IMS 1280 HR2 ion microprobe at the CRPG (Centre de Recherches Pétrographiques et Géochimiques, Nancy, France). The analyses were performed close to the EMP analytical points after a thorough check to assure the absence of defects or contamination from other phases. The samples were gold-coated. In each sample, 4 to 6 grains of magnetite were analyzed, and 3 to 9 points were measured per crystal depending on the crystal size and the quality of the area. Fe isotope analysis measurements were performed first during two days of instrument use, and O isotopes were analyzed close to the existing SIMS pits in another two-day analytical session. SEM imaging was performed after the sessions to ensure that SIMS spots did not penetrate adjacent phases, inclusions, or cracks. Eight analyses were then discarded for questionable Fe or O isotope results.
Iron isotope composition was measured following the procedure described in detail in [27]. Briefly, a 16O primary beam of 10 nA intensity was focused to a spot of 15 µm. The mass resolution was set at ~7000 and 54Fe+ and 56Fe+ were measured in multicollection mode with two off-axis Faraday cups, while the intensity of 52Cr was measured on an electron multiplier. The gains of Faraday cups and amplifiers were determined at the beginning of the analytical session and drift was monitored by analyses of standards interspersed among analyses of the unknowns. The background of each detector was measured for 60 s during pre-sputtering, i.e., at the beginning of each analysis. Ion currents converted to count rates were typically ~5 × 10⁷ counts per second (cps) for 56Fe. Each analysis consisted of 30 cycles, each with 5 s acquisition time. The isobaric interference of 54Cr on 54Fe was corrected using the 54Cr/52Cr ratio but was negligible (less than 0.002‰) in all samples, which have very low chromium levels. The measurements were corrected for the matrix effect (instrumental mass fractionation, IMF) using the international standard magnetite LP204 (from Westin Mine in the Adirondack; [28]), and the in-house standards magnetite “Russie” analyzed before sample measurements, in the middle of the sample suite, and once after all samples. The internal precision for ∂56Fe was typically better than 0.1‰ (2σ), and the external reproducibility based on multiple measurements was ~0.2‰ (2σ).
Oxygen isotope composition was measured following the procedure described in detail in [29]. A Cs+ primary beam of ~10 nA intensity was focused to a spot of about 15 µm. The mass resolution was set at ~4000 and 16O and 18O were detected in multicollection mode using two Faraday cups. The gains of these Faraday cups were determined at the beginning of each analytical session. Typical count rates on 16O and 18O were of ~3 × 10⁹ and ~6 × 10⁶ cps, respectively. Analysis consisted of 30 cycles and 5 s acquisition time after 60 s pre-sputtering. Under these conditions the internal precision for 18O values was 0.1‰ (2σ). The measurements were corrected for the matrix effect (IMF) using the in-house standard magnetite Charroy analyzed before sample measurements, in the middle of the sample suite, and once after all samples. The external reproducibility based on multiple measurements was ~0.2‰ (2σ).
Fe and O isotope data are reported as 56Fe/54Fe and 18O/16O in standard (∂) notation, in units per mil (‰):
56Fesample (‰) = [(56Fe/54Fe)measured/[(56Fe/54Fe)IRMM-14 − 1] × 1000
18Osample (‰) = [(18O/16O)measured/[(18O/16O) SMOW − 1] × 1000

3. Results

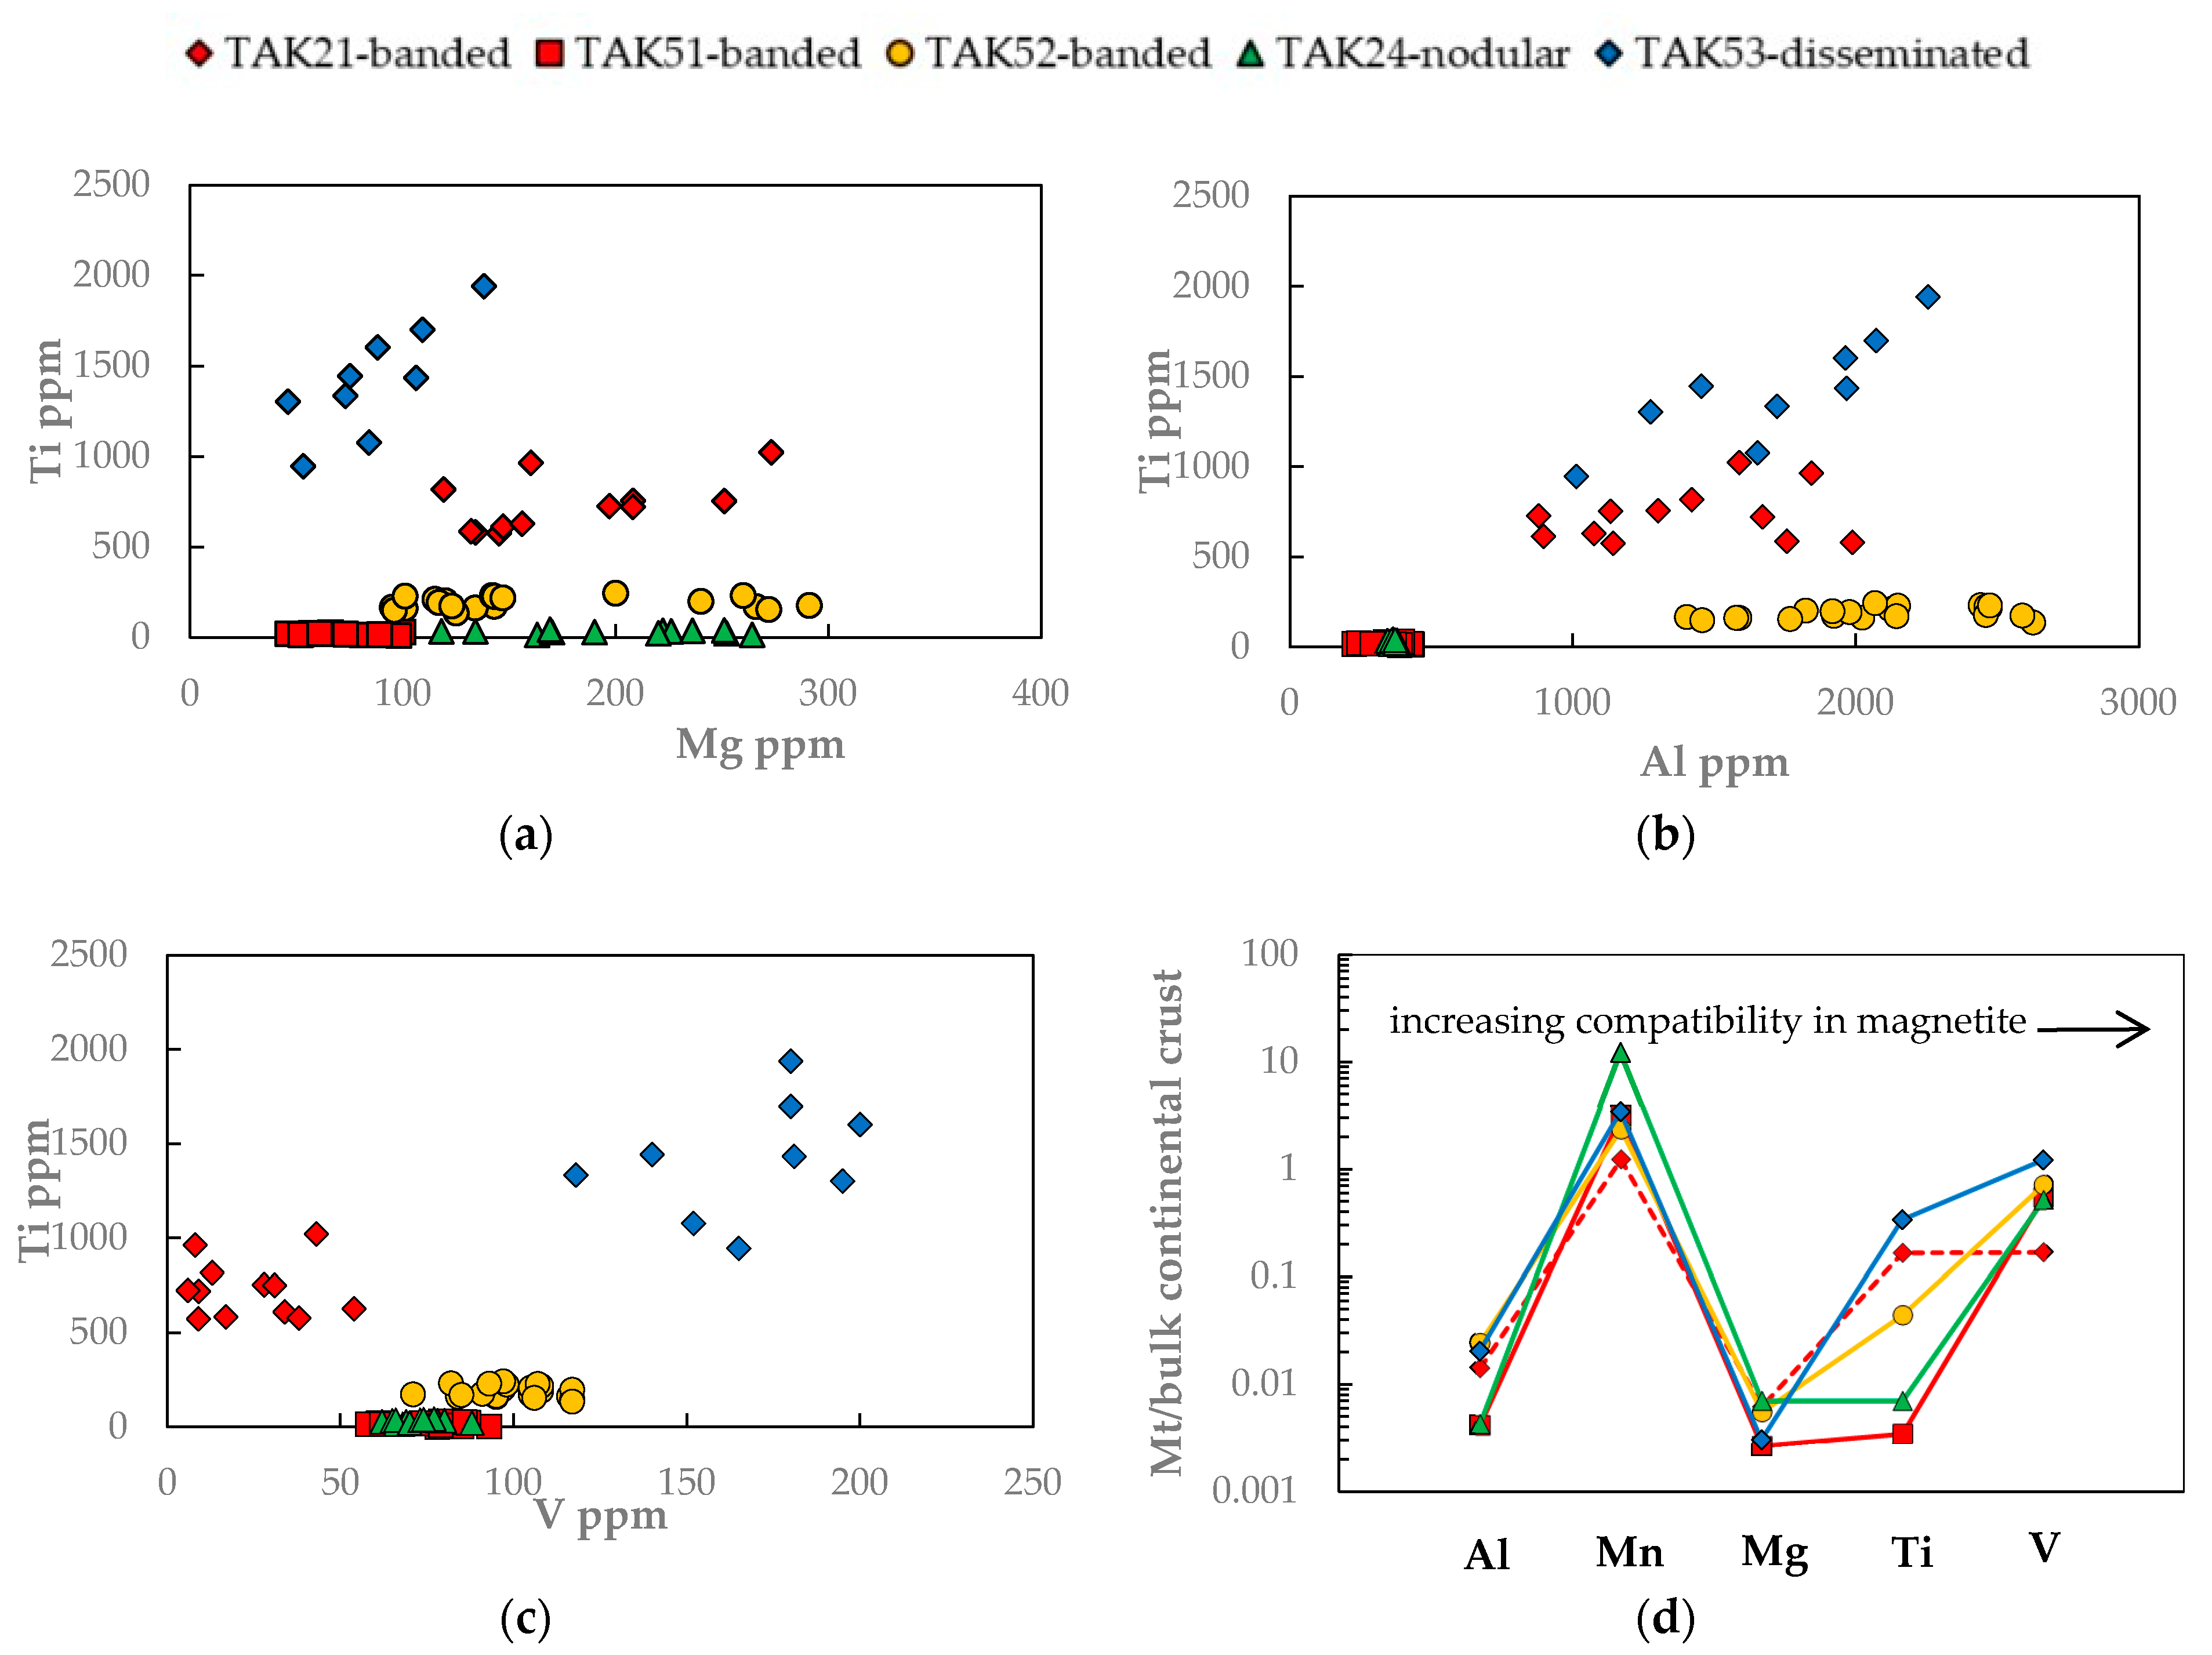
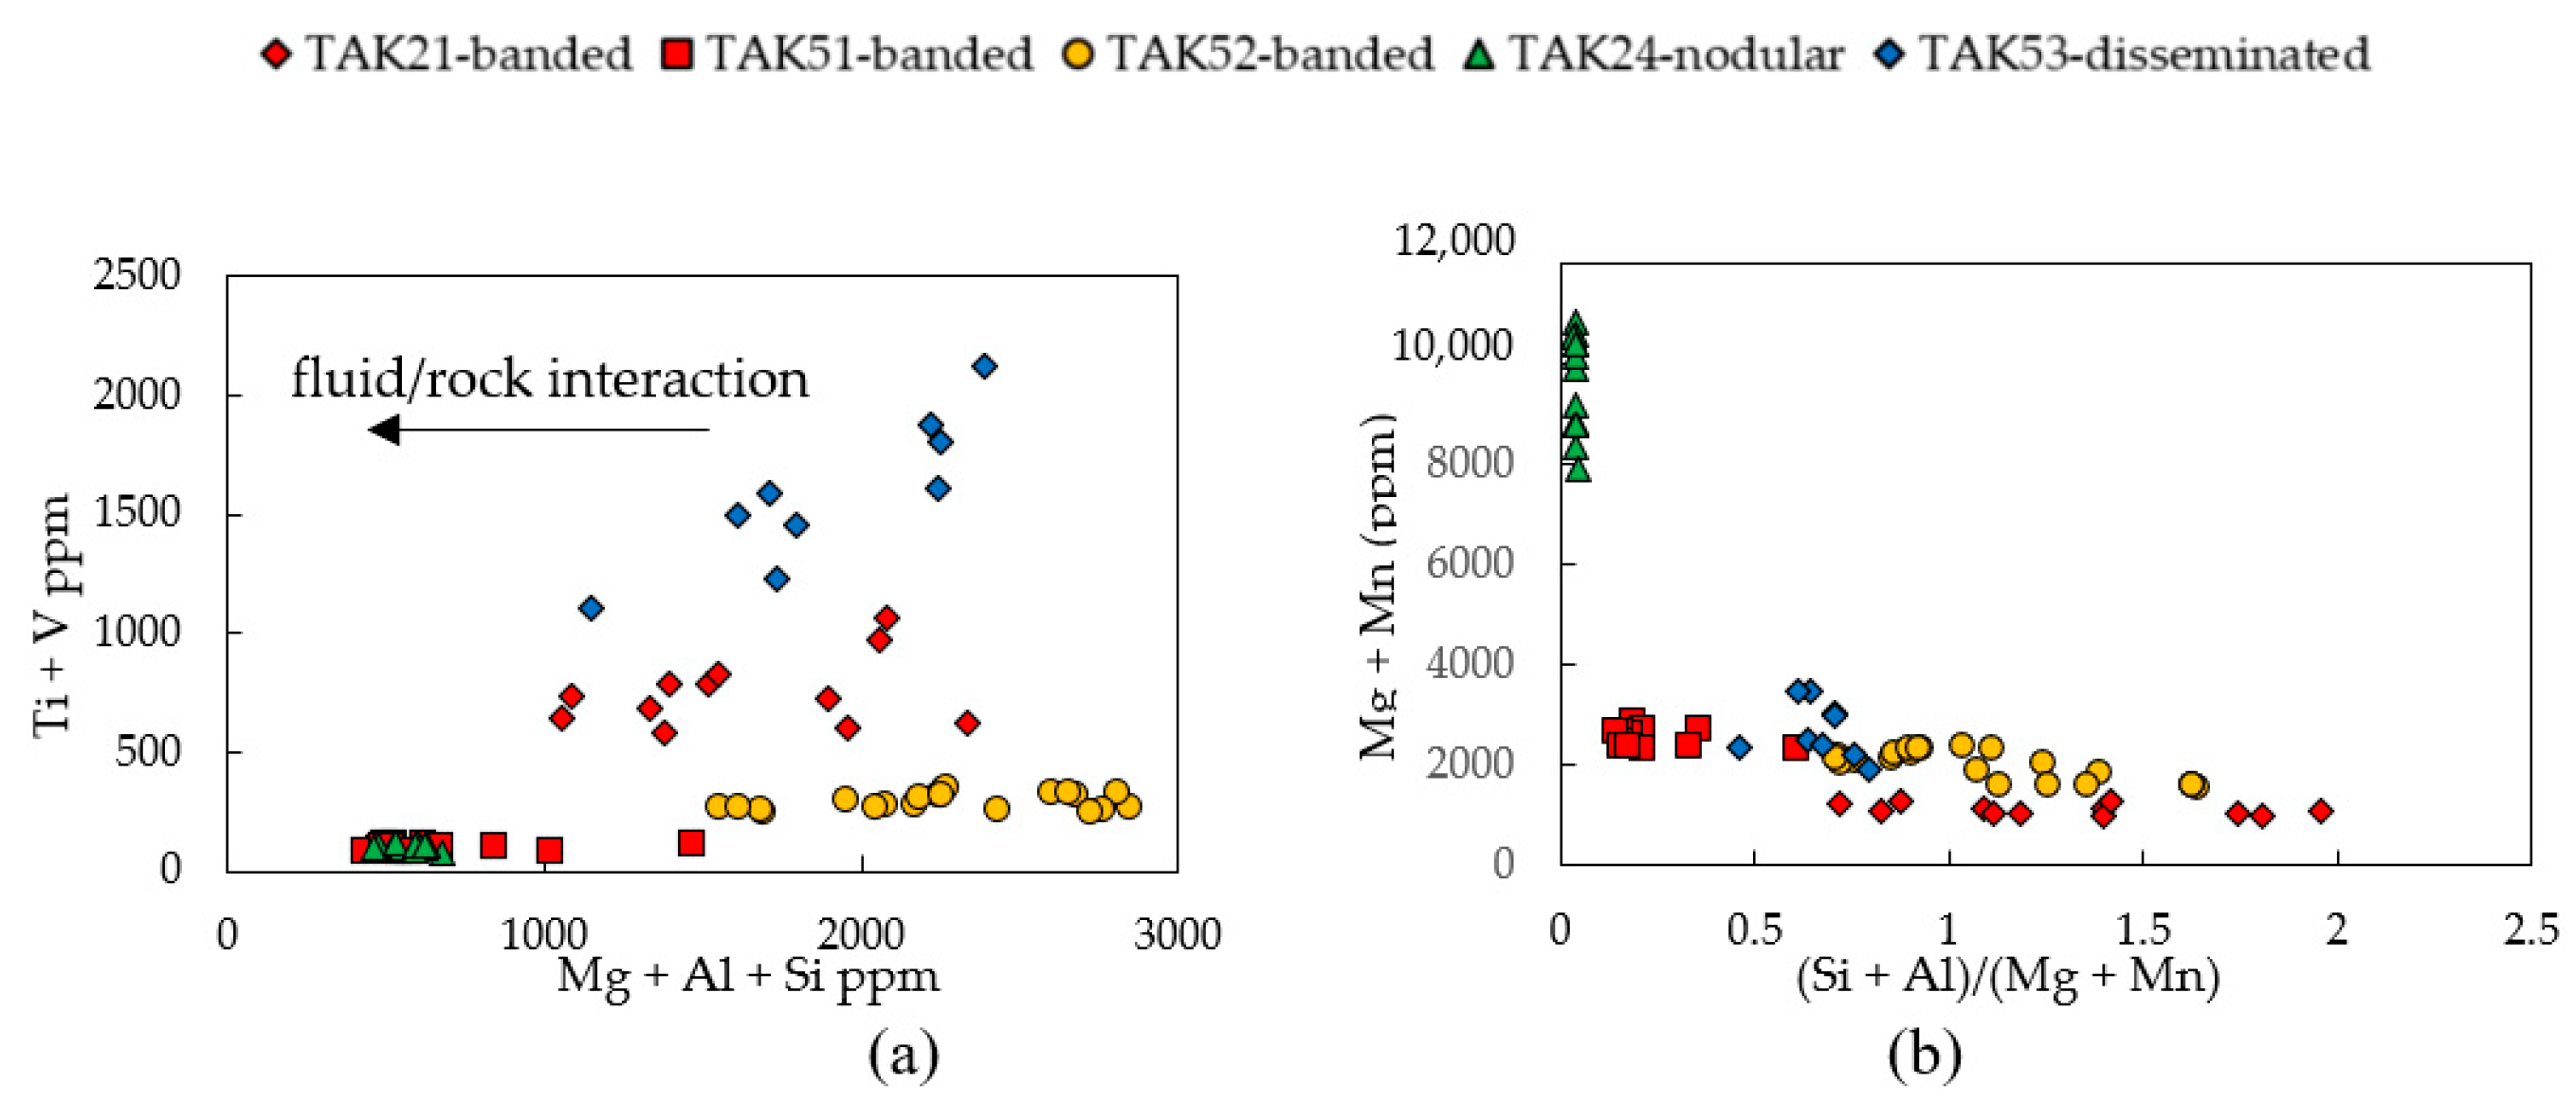
3.1. Magnetite Trace Elements

BSE imaging and chemical mapping showed that the magnetite grains are unzoned and allowed the selection of inclusion-free areas for EMP analysis. The average concentrations, standard deviations and range of values are listed in Table 2. The detailed analytical results are plotted on the different figures hereafter and given in Table S1.
Magnetite grains are rich in Mn (mostly 893–3360 ppm and up to 10,609 ppm in TAK24). Ti contents are low (15–200 ppm) except in two samples 575–1022 ppm in TAK21 and 945–1940 ppm in TAK53. V is below or around 100 ppm, except in TAK53 (118–200 ppm), and Mg ranges from ~50–300 ppm. Cr is mostly in the range of 14–98 ppm, and Ni and Cu are near or below the detection limits (Table 3). However, these three elements show erratic values even within the same grain and the results must be treated with caution in some samples. Ca is mostly below 50 ppm and reaches 218 ppm in TAK21. Si is mostly ≤300 ppm but reaches 1071 ppm in TAK51. The higher Ca and Si values may imply possible contamination from apatite and monazite in TAK21, and zircon in TAK51 from in-depth located inclusions. However, no phosphate or zircon inclusions were observed at the surface.
Ti positively correlates with Al and Mg in disseminated magnetite TAK53 while in other samples no correlation is observed. In most samples, Al and Mg are variable compared to the more restricted range of Ti. Al is low and shows a restricted range in banded magnetite TAK51 and nodular magnetite TAK24 (Figure 4a–c). In all samples, magnetite shows continental crust normalized lithophile element patterns with a peak in Mn, but variable Ti (Figure 4d).

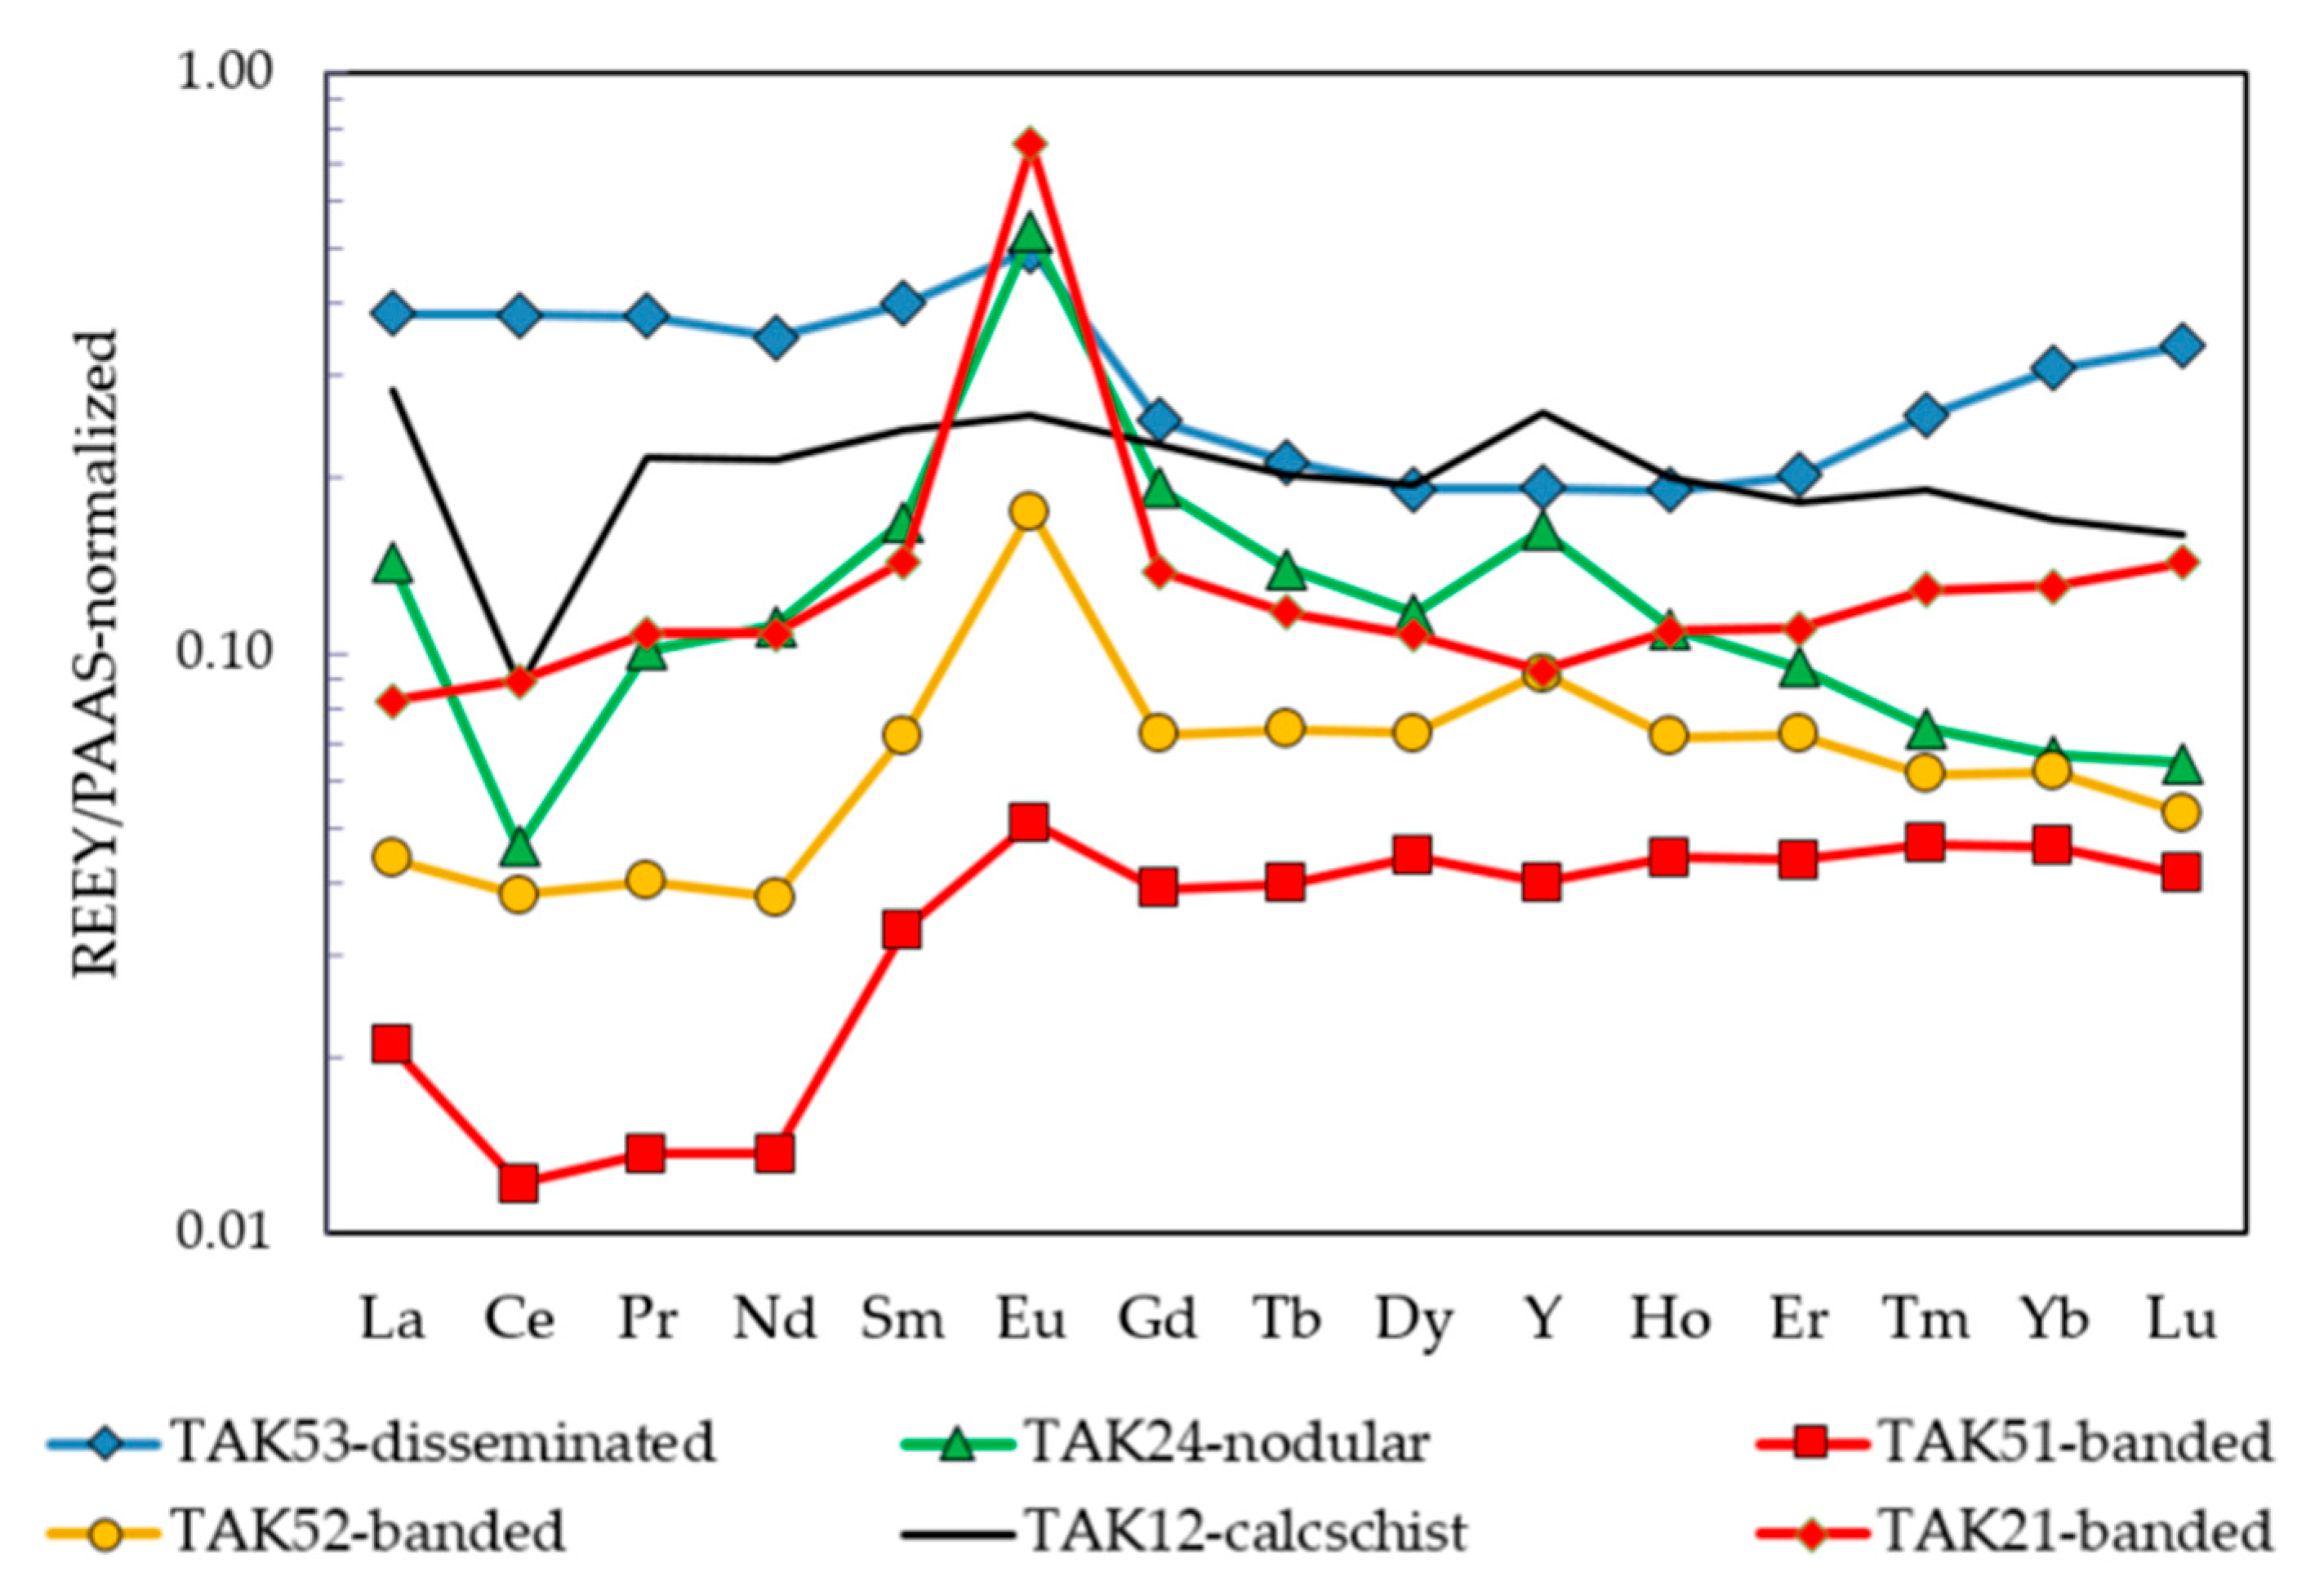
3.2. Rare Earth Element Compositions of Bulk Ore Sample

The REE and Y composition of the bulk ore samples are given in Table 4 and REE + Y patterns normalized to Post-Archean Australian Shale (PAAS) are shown in Figure 5. The composition of the calcschist (TAK12) is given for comparison as it is important for the discussion.
The main characteristic is the positive Eu anomaly in all samples. Magnetite from banded sample TAK52 and nodular sample TAK24 show a positive Y anomaly on the PAAS normalized plot (Figure 5). Y/Ho ratios are variable, but most oscillate around values typical for shales (25–27), except for a higher value (40) in nodular ore TAK24, similar to that of Mid-Ocean-Ridge (MOR)-hydrothermal fluids. The banded ore samples TAK51 and TAK52 are characterized by an HREE enrichment and LREE depletion (La/Yb)PAAS ratios = 0.5–0.7), unlike nodular TAK24 and disseminated TAK53 ores (2.2 and 1.2, respectively). A negative Ce anomaly is only observed in nodular magnetite TAK24, which shows a REE + Y pattern such as that of calcschist TAK12 (Figure 5).

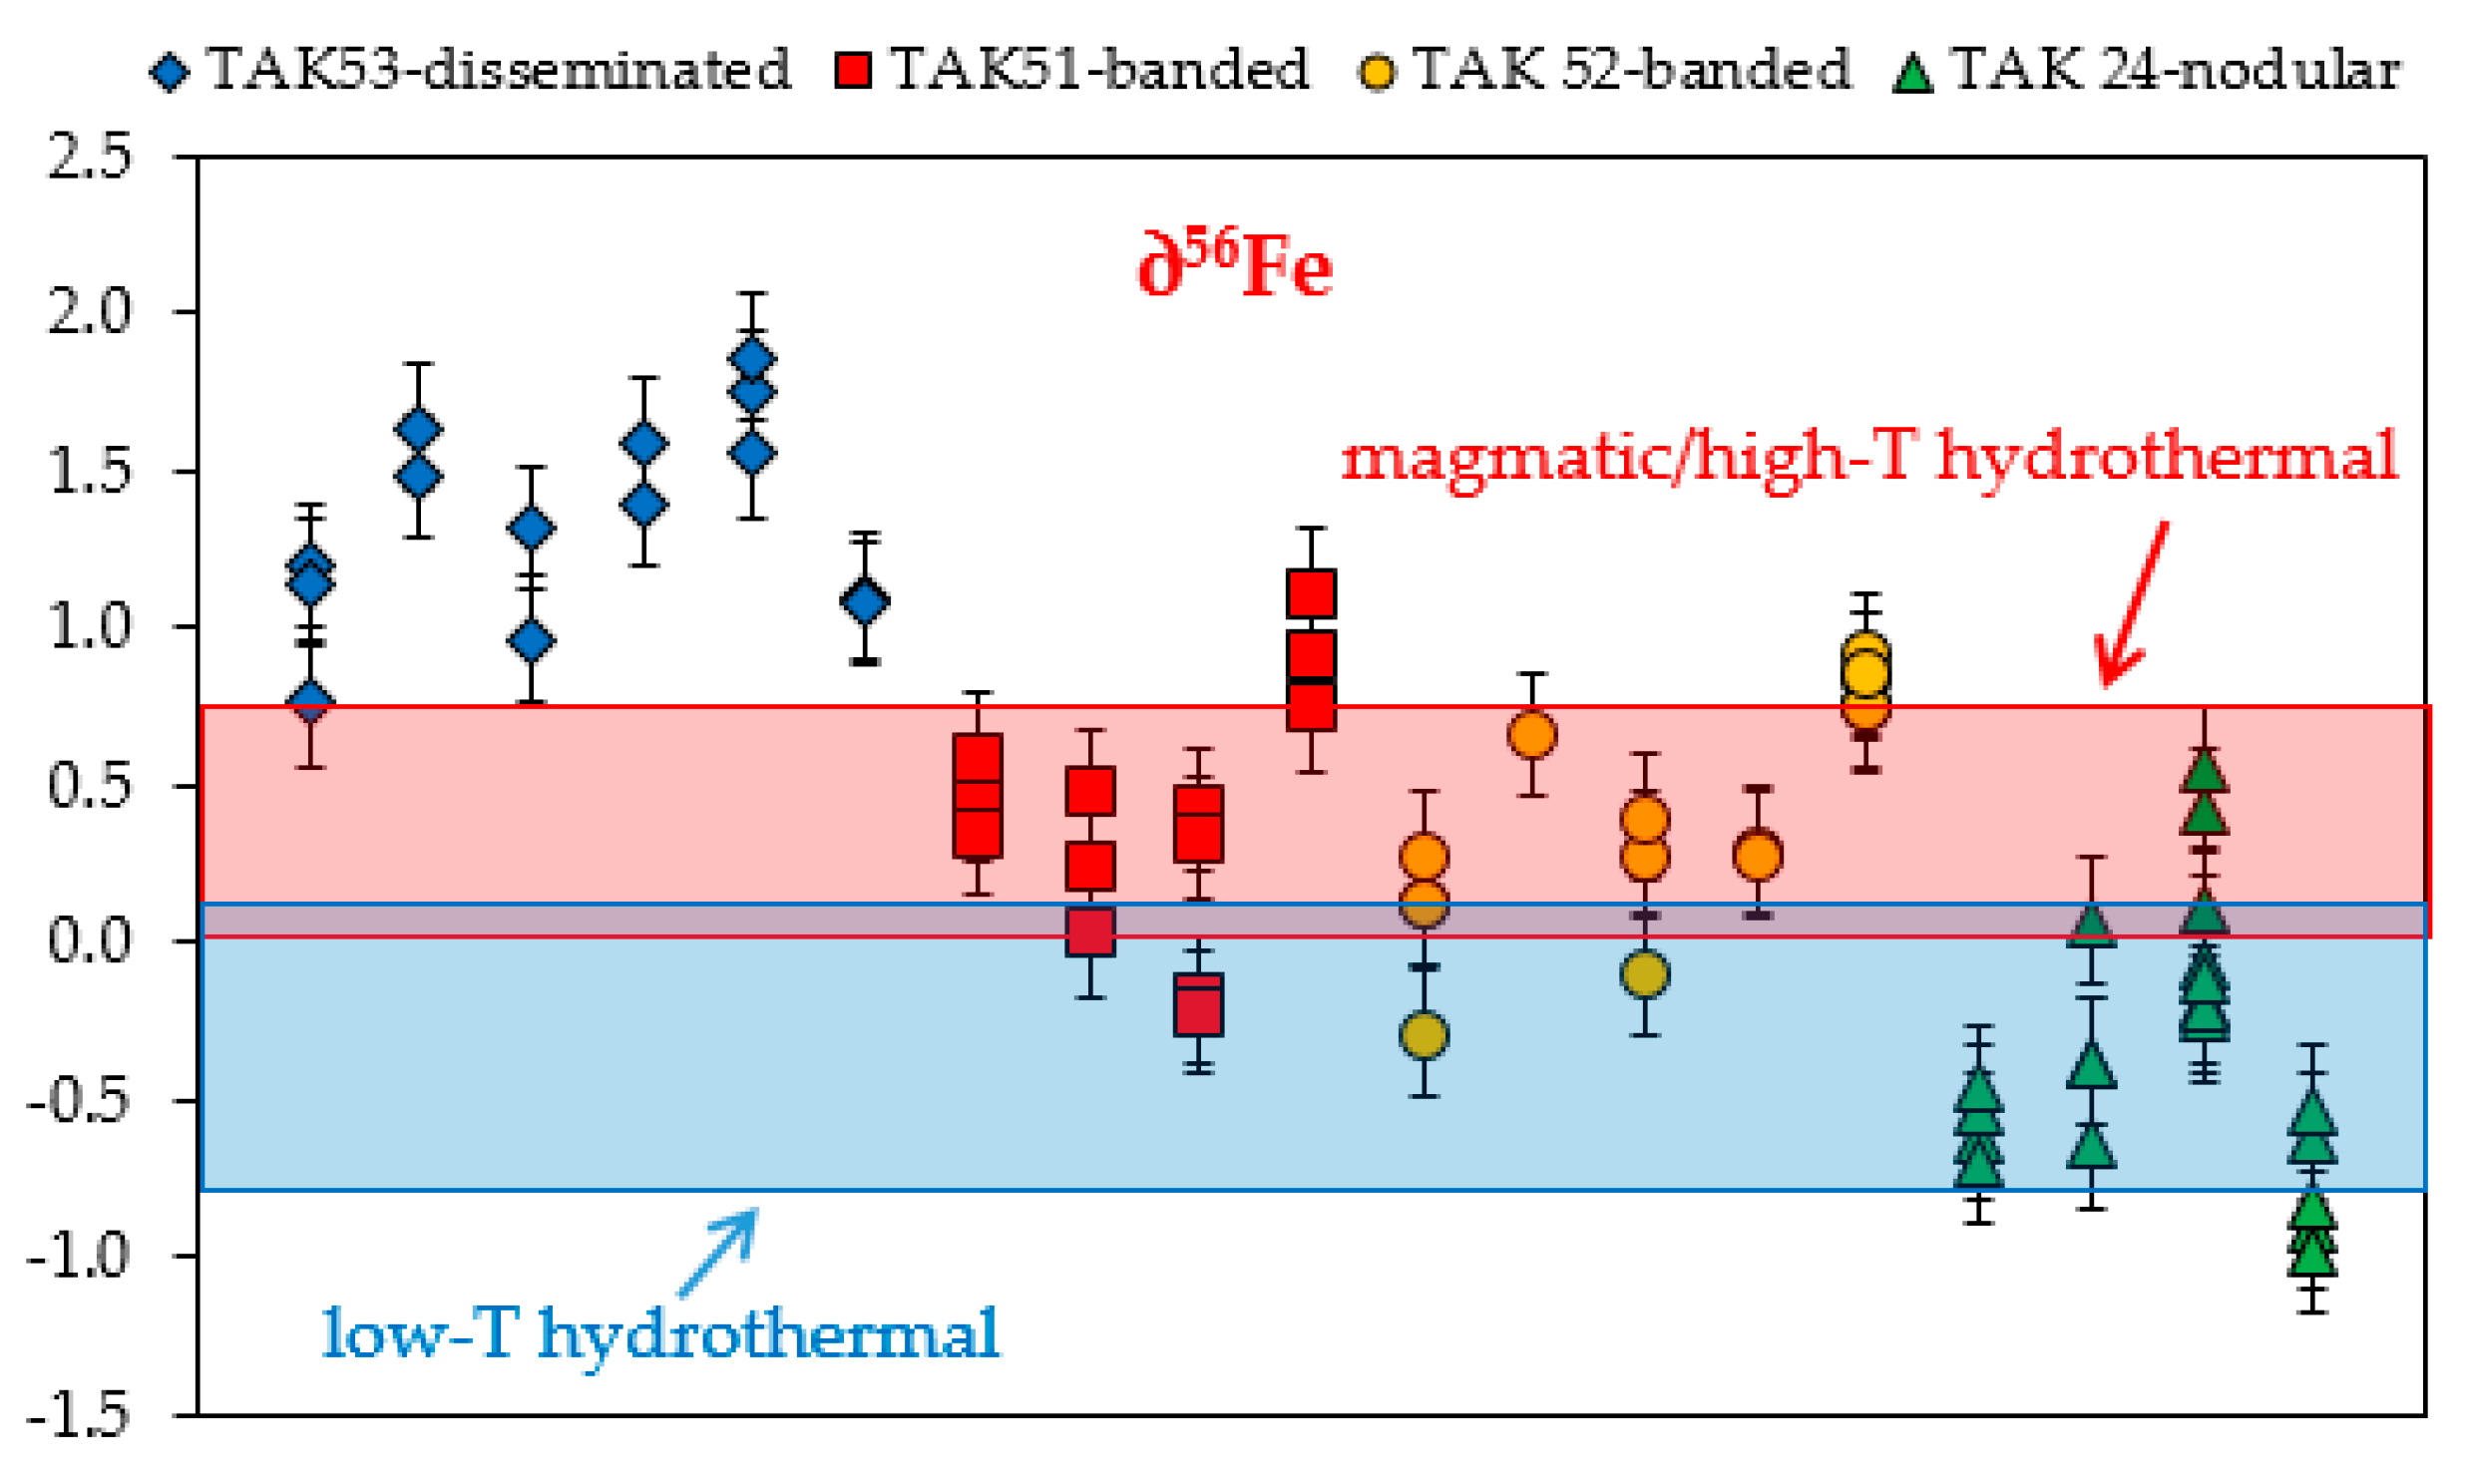
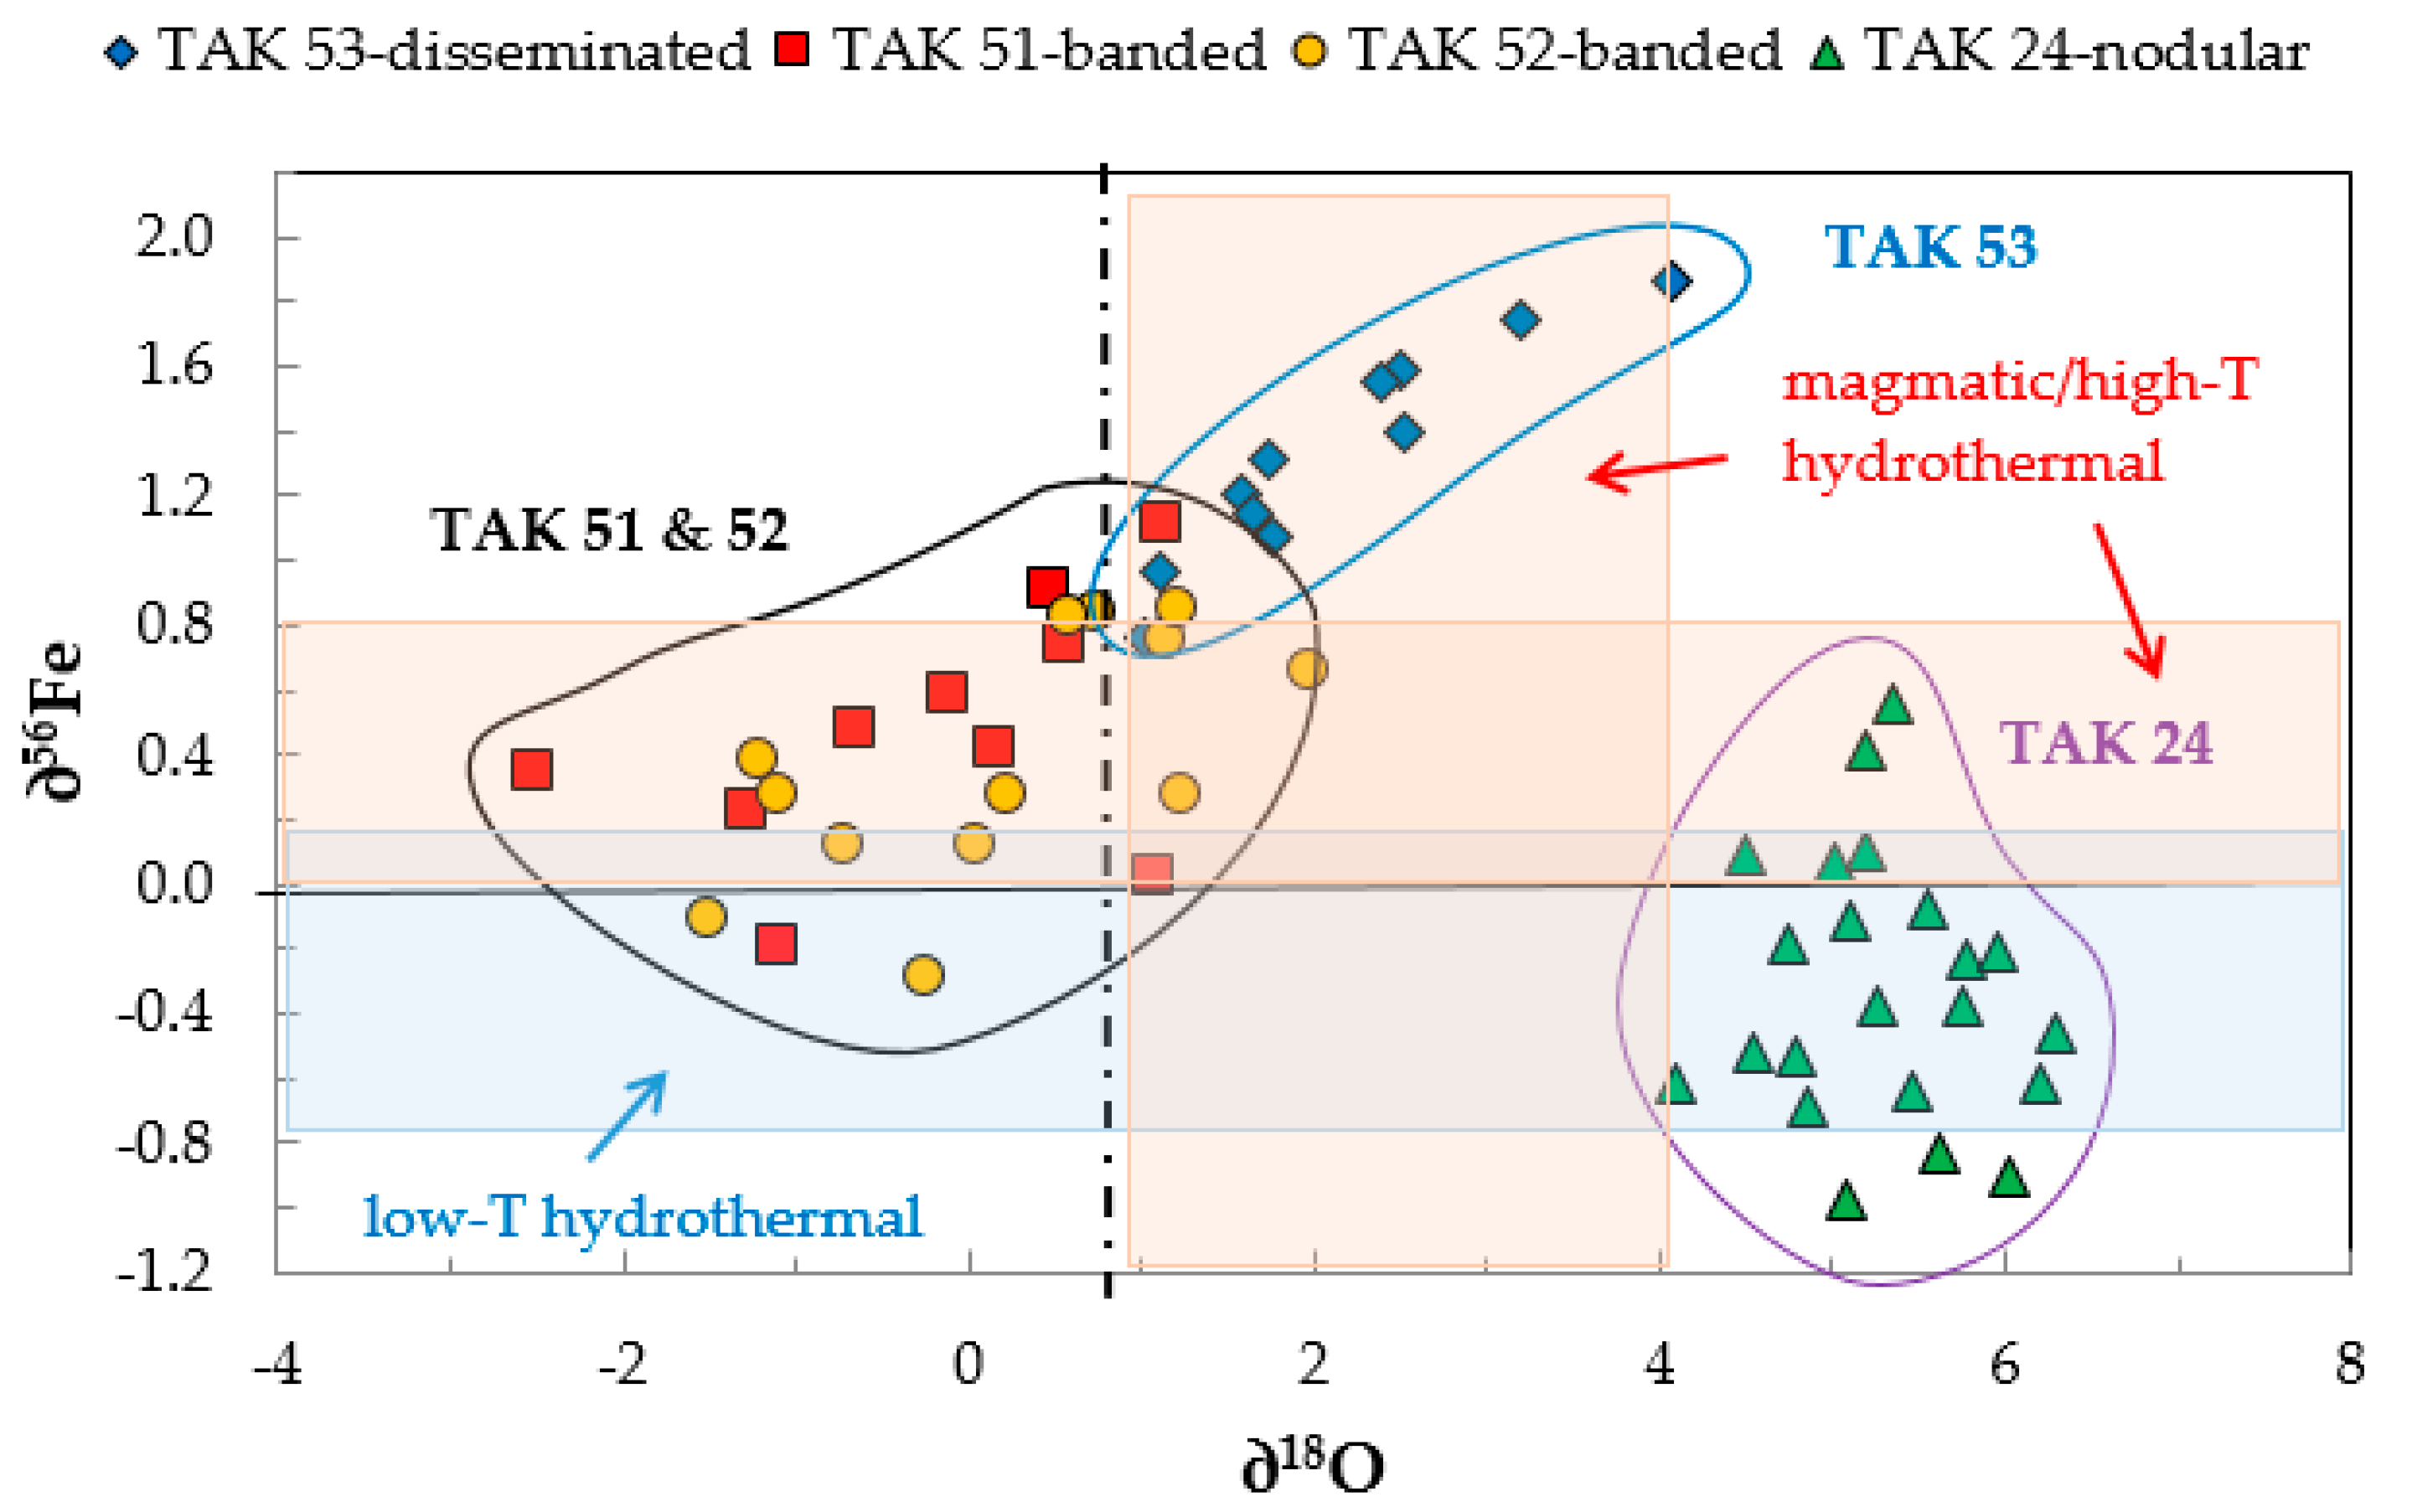
3.3. Fe Isotope Data

Four samples representative of banded (TAK51 and TAK52), nodular (TAK24) and disseminated (TAK53) ore types were selected for Fe and O isotope analyses. Fe isotopic compositions are given in Table 5 and Table S2 and displayed in Figure 6.
In the disseminated ore (TAK53) magnetite forms euhedral grains (~400 µm–1.5 mm). The grains are slightly hematized on the rims and in small cracks. Magnetite ∂56Fe values (n = 14) range from 0.76 ± 0.26‰ to 1.86 ± 0.22‰. In the banded ore (TAK51 and TAK52), magnetite forms individual grains (~50 µm to several hundreds of µm) altered to hematite on the rims and in cracks. Magnetite ∂56Fe values range from -0.28 ± 0.20‰ to 1.12 ± 0.21‰ (n = 28). However, only four points have a negative ∂56Fe value. In the nodular ore (TAK24), magnetite forms mm-sized agglomerates partly elongated and disrupted in the quartz matrix. Magnetite is not hematized. Magnetite ∂56Fe values (n = 22) range from -0.98 ± 0.22‰ to 0.56 ± 0.19‰. Most of the analytical points have negative ∂56Fe values (18/22 spots).
To sum up, magnetite ∂56Fe values are highly positive in disseminated ore (+1.35 ± 0.32‰ on average), mostly positive in banded ore (+ 0.41 ± 0.37‰ on average) and mostly negative in the nodular ore (−0.32 ± 0.41‰ on average).

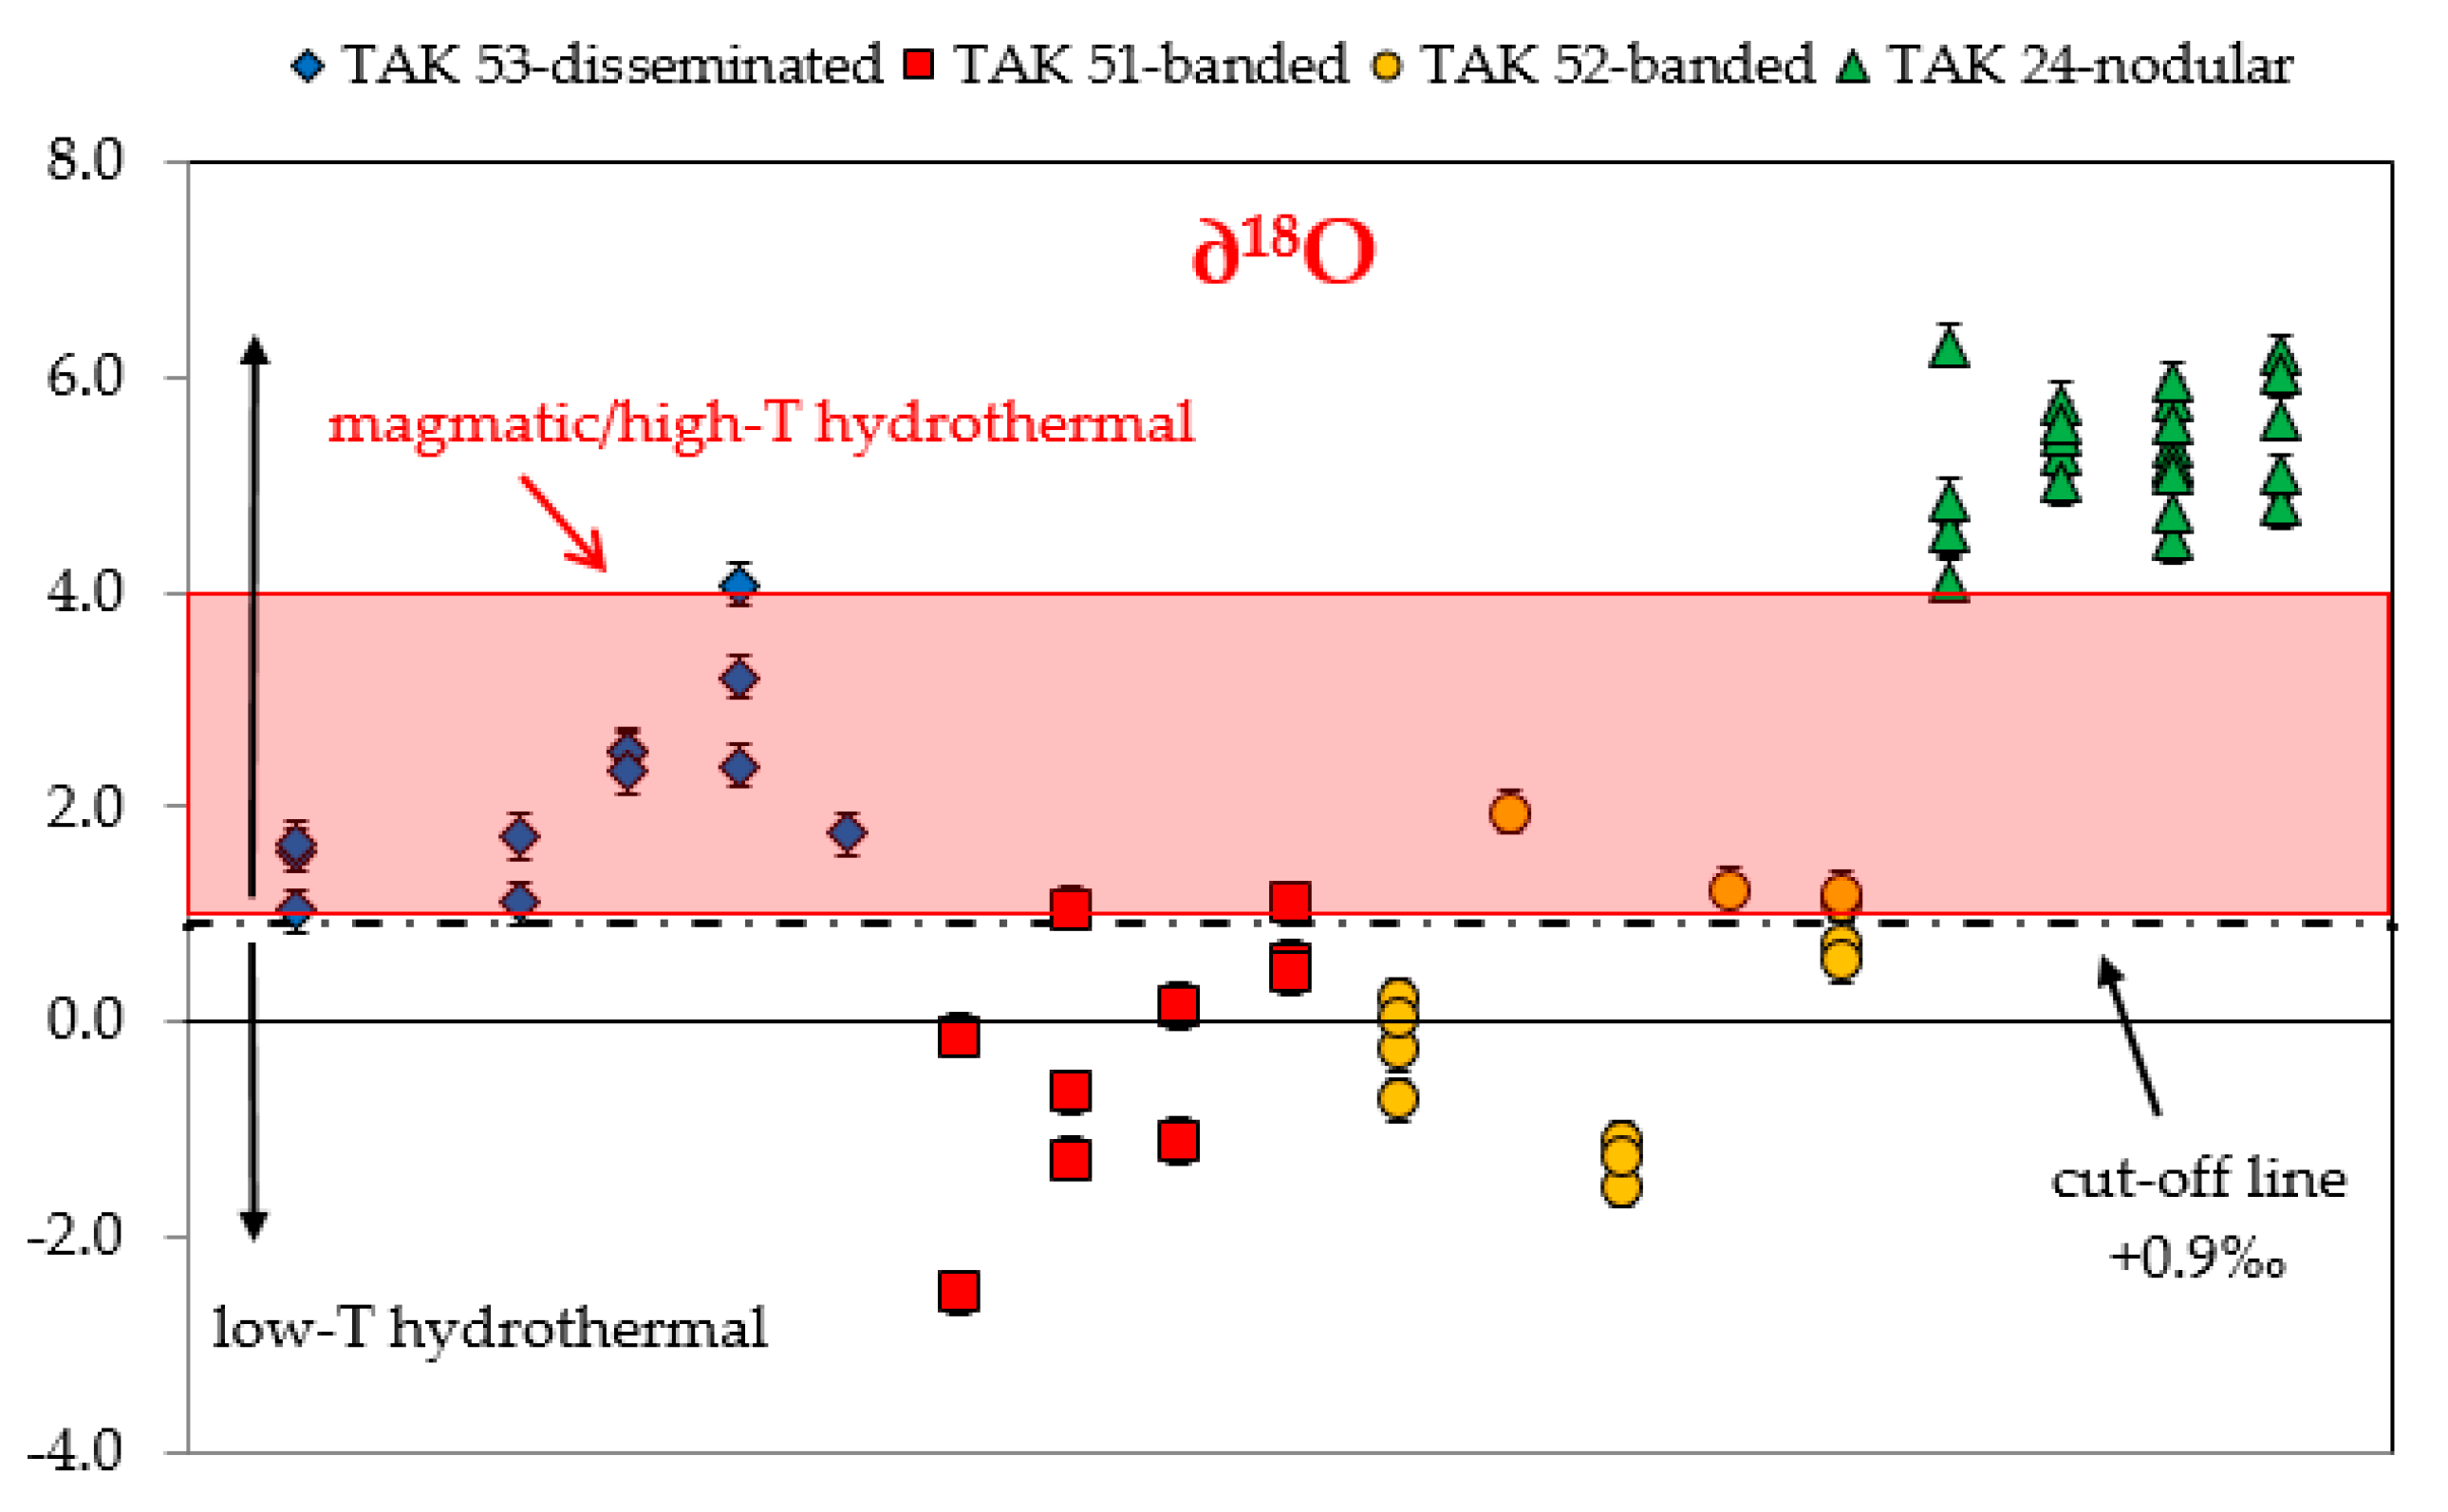
3.4. Oxygen Isotope Data

O isotopic compositions are reported in Table 4 and Table S2 and plotted in Figure 7.
In the disseminated ore (TAK53), magnetite ∂18O values (n = 12) range from 1.02 ± 0.24‰ to 4.07 ± 0.22‰. In the banded ore (TAK51 and TAK52), magnetite ∂18O values (n = 23) vary from −2.52 ± 0.28‰ to + 1.95 ± 0.23‰. In magnetite from sample TAK51 only one of the four analyzed grains shows positive values (average 0.70 ± 0.35‰). All the other grains show negative values (average −0.64 ± 1.15‰). In the nodular ore (TAK24), magnetite ∂18O values (n = 23) range from 4.10 ± 0.22‰ to 6.30 ± 0.23‰, values that are even higher than the proposed range for magmatic/high-T hydrothermal magnetites [2,33].
In summary, magnetite ∂18O values are positive in disseminated and nodular ores (+2.15 ± 0.87‰ and +5.30 ± 0.57‰ on average, respectively), while magnetite ∂18O ratios in banded ores show negative and positive intra-grain or inter-grain values.

4. Discussion

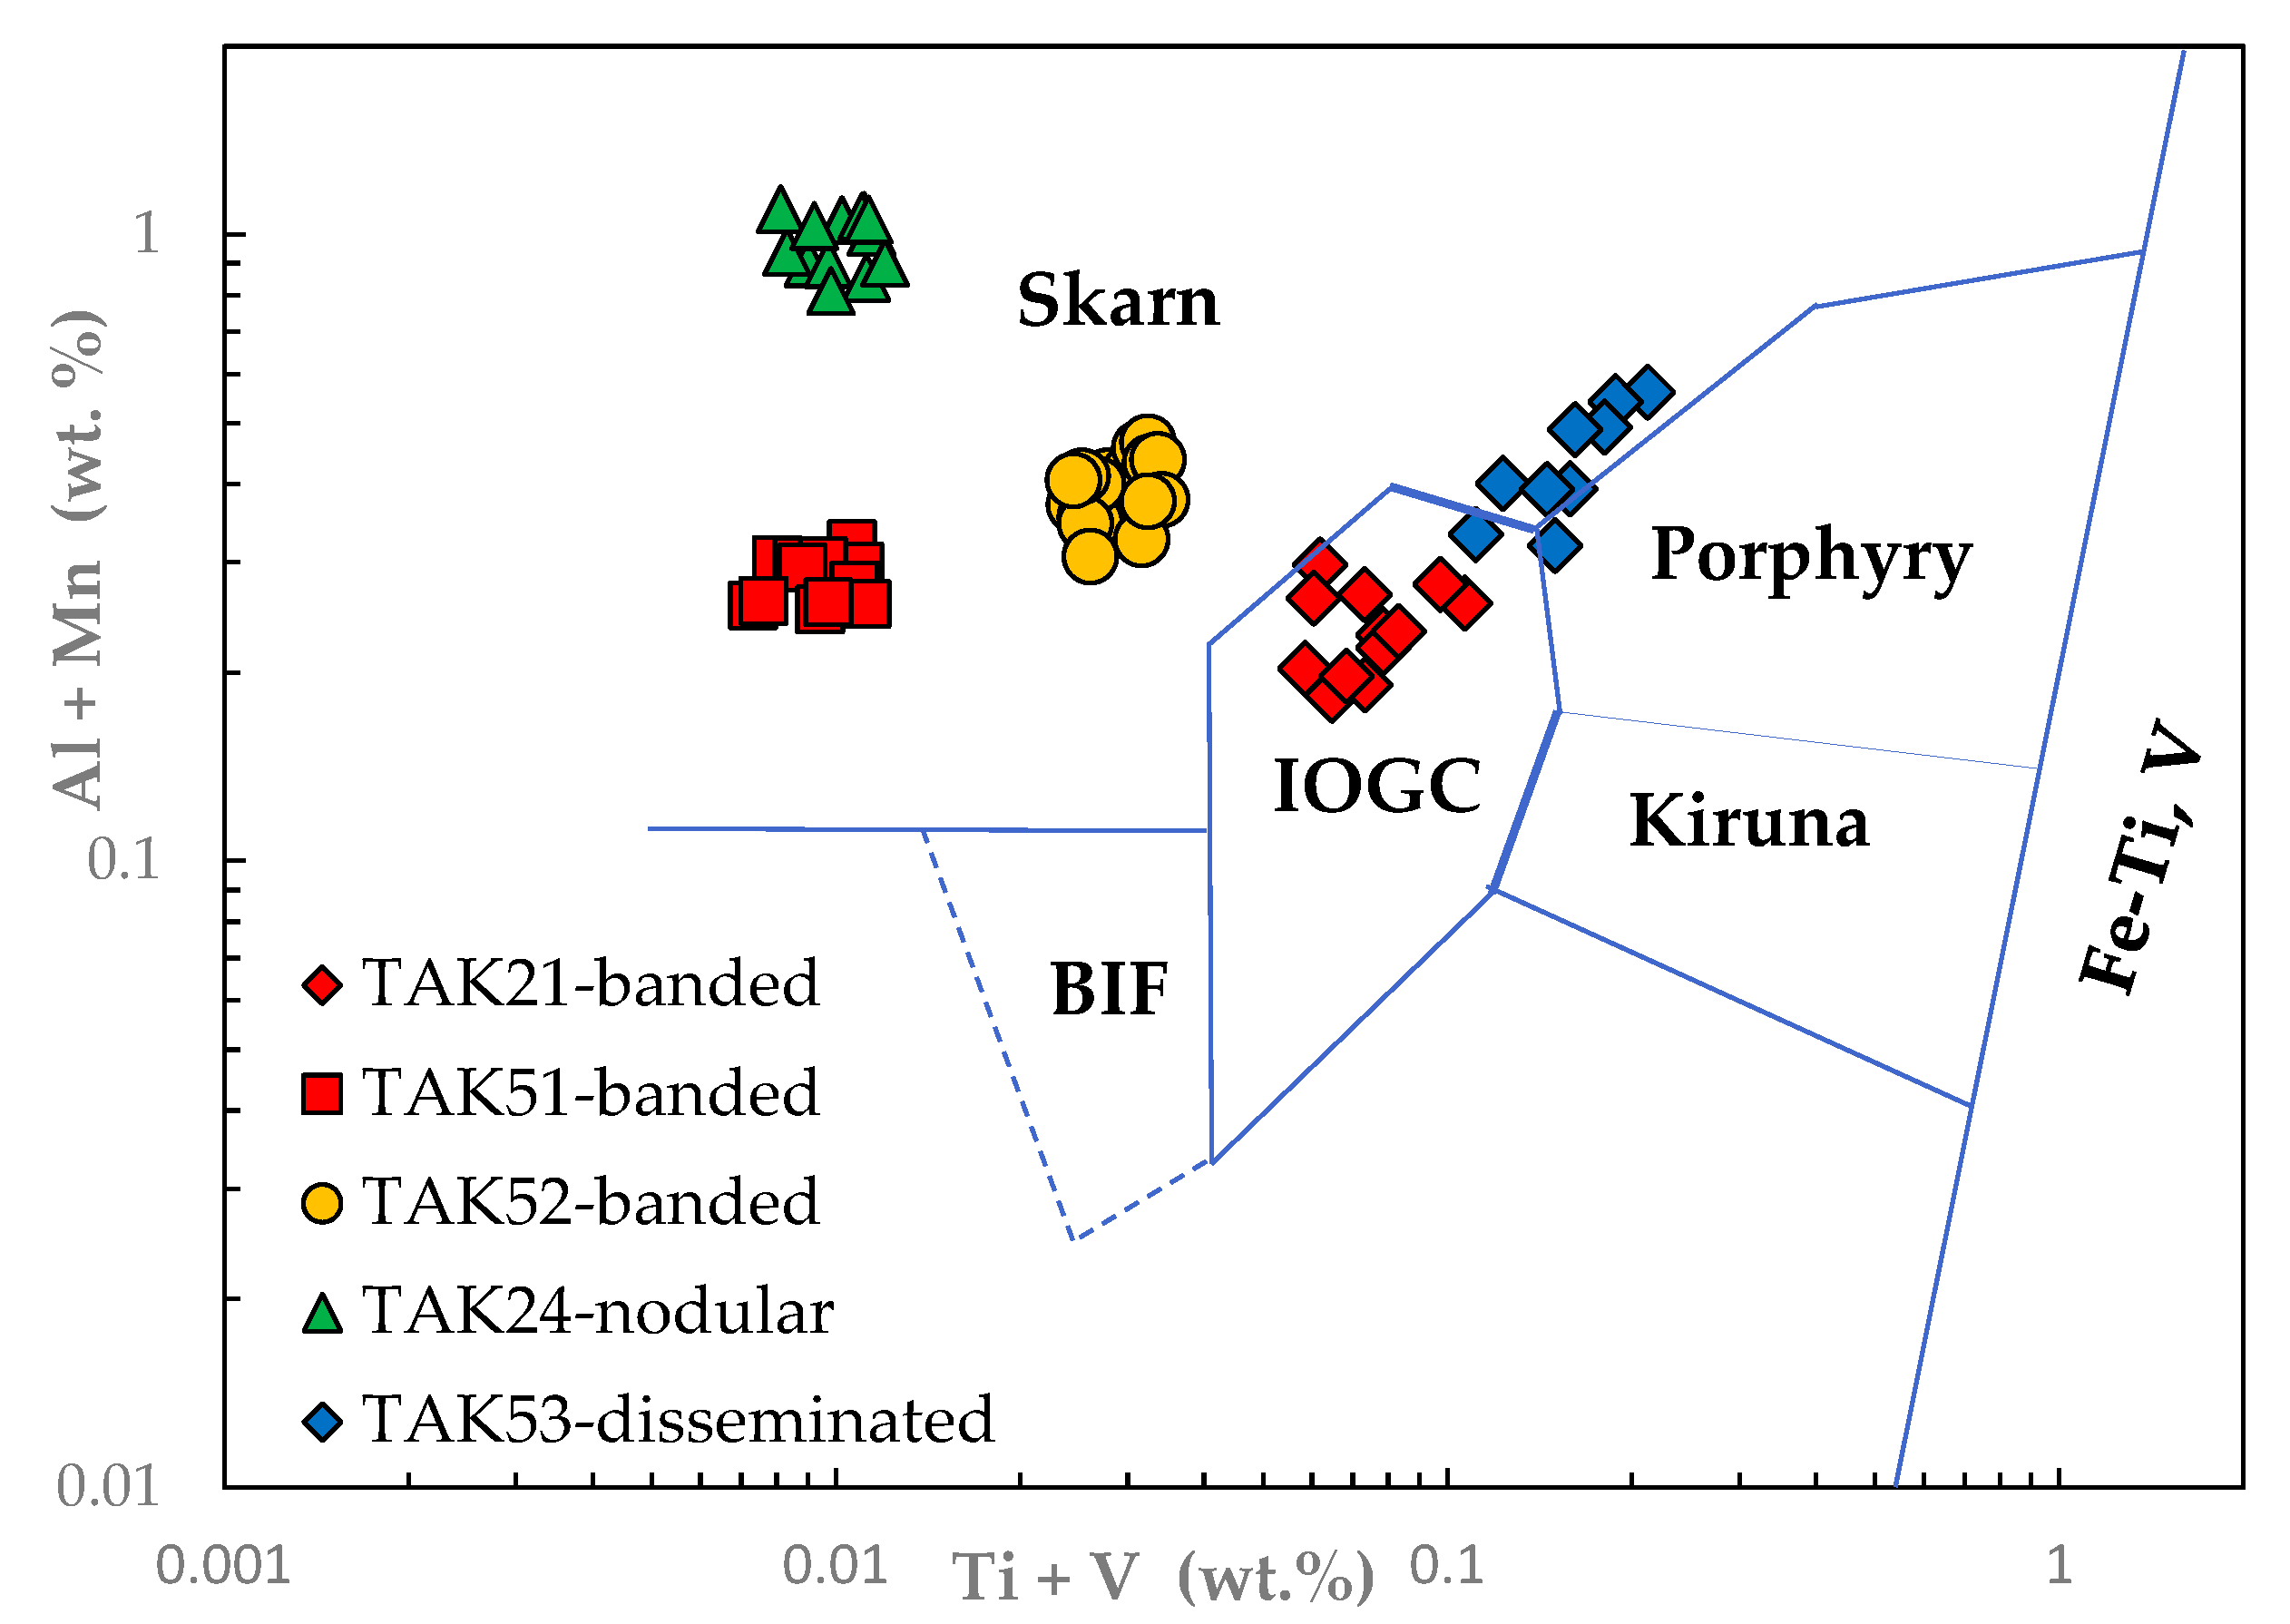
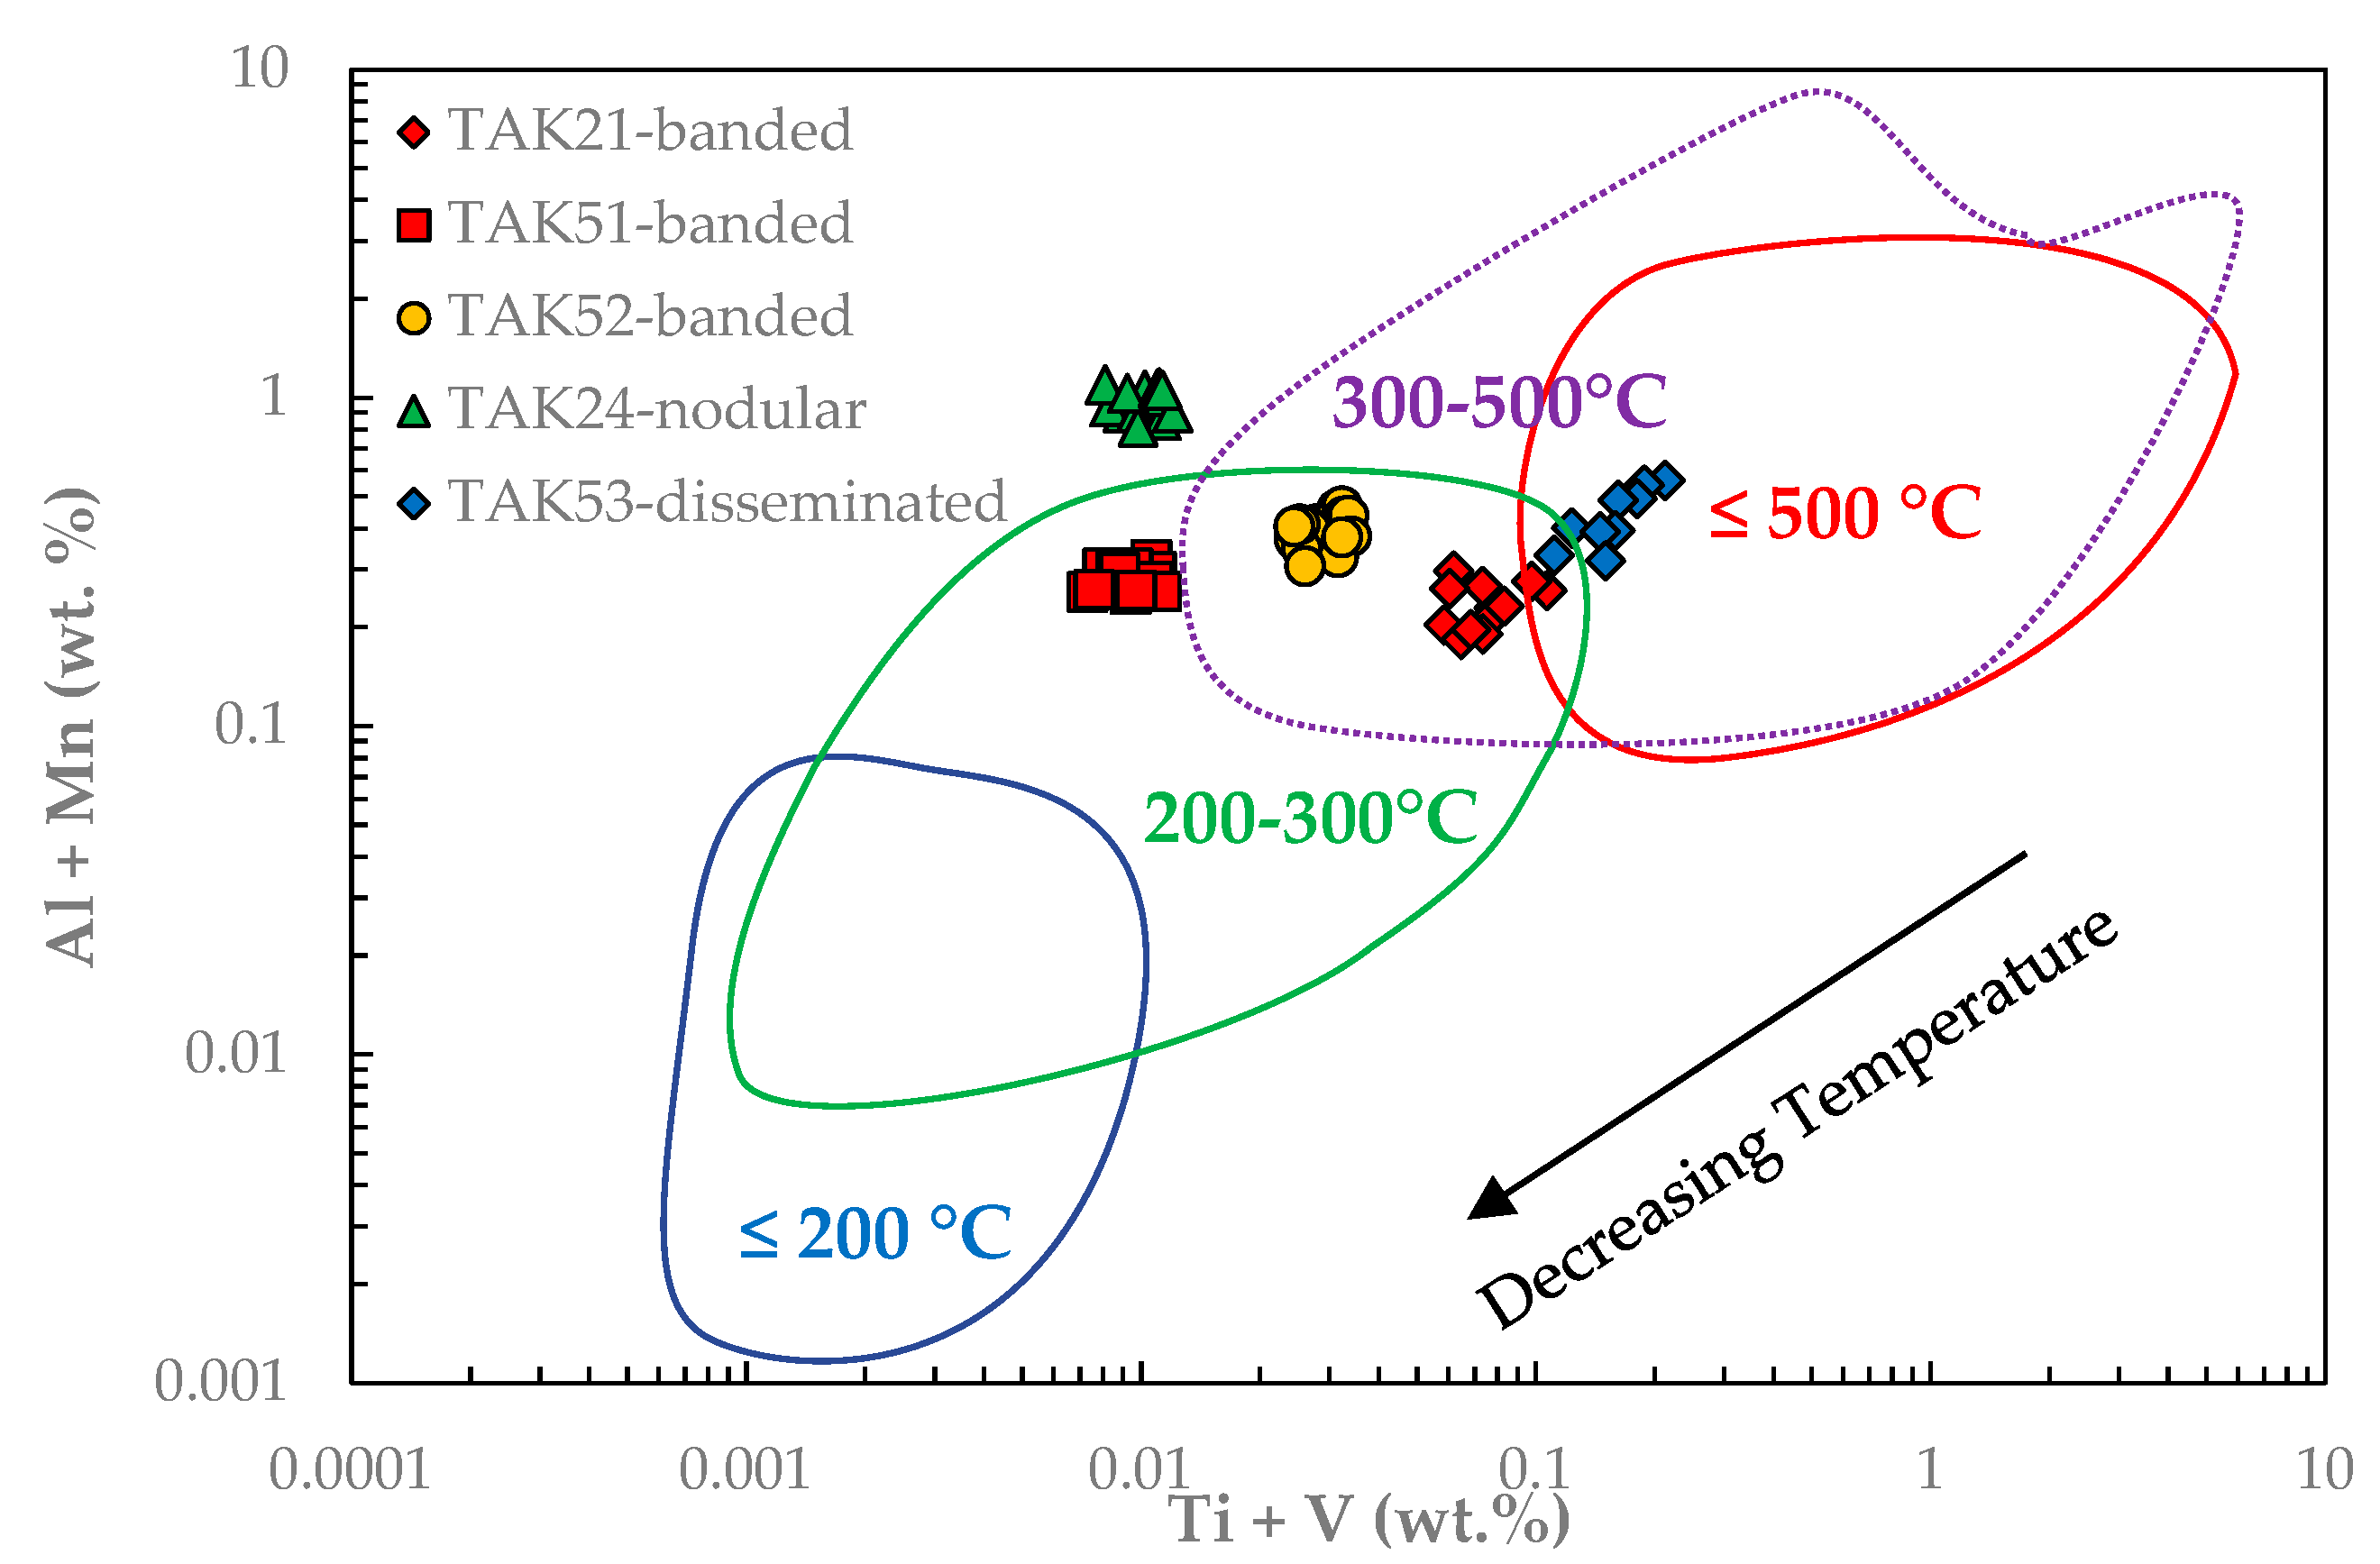
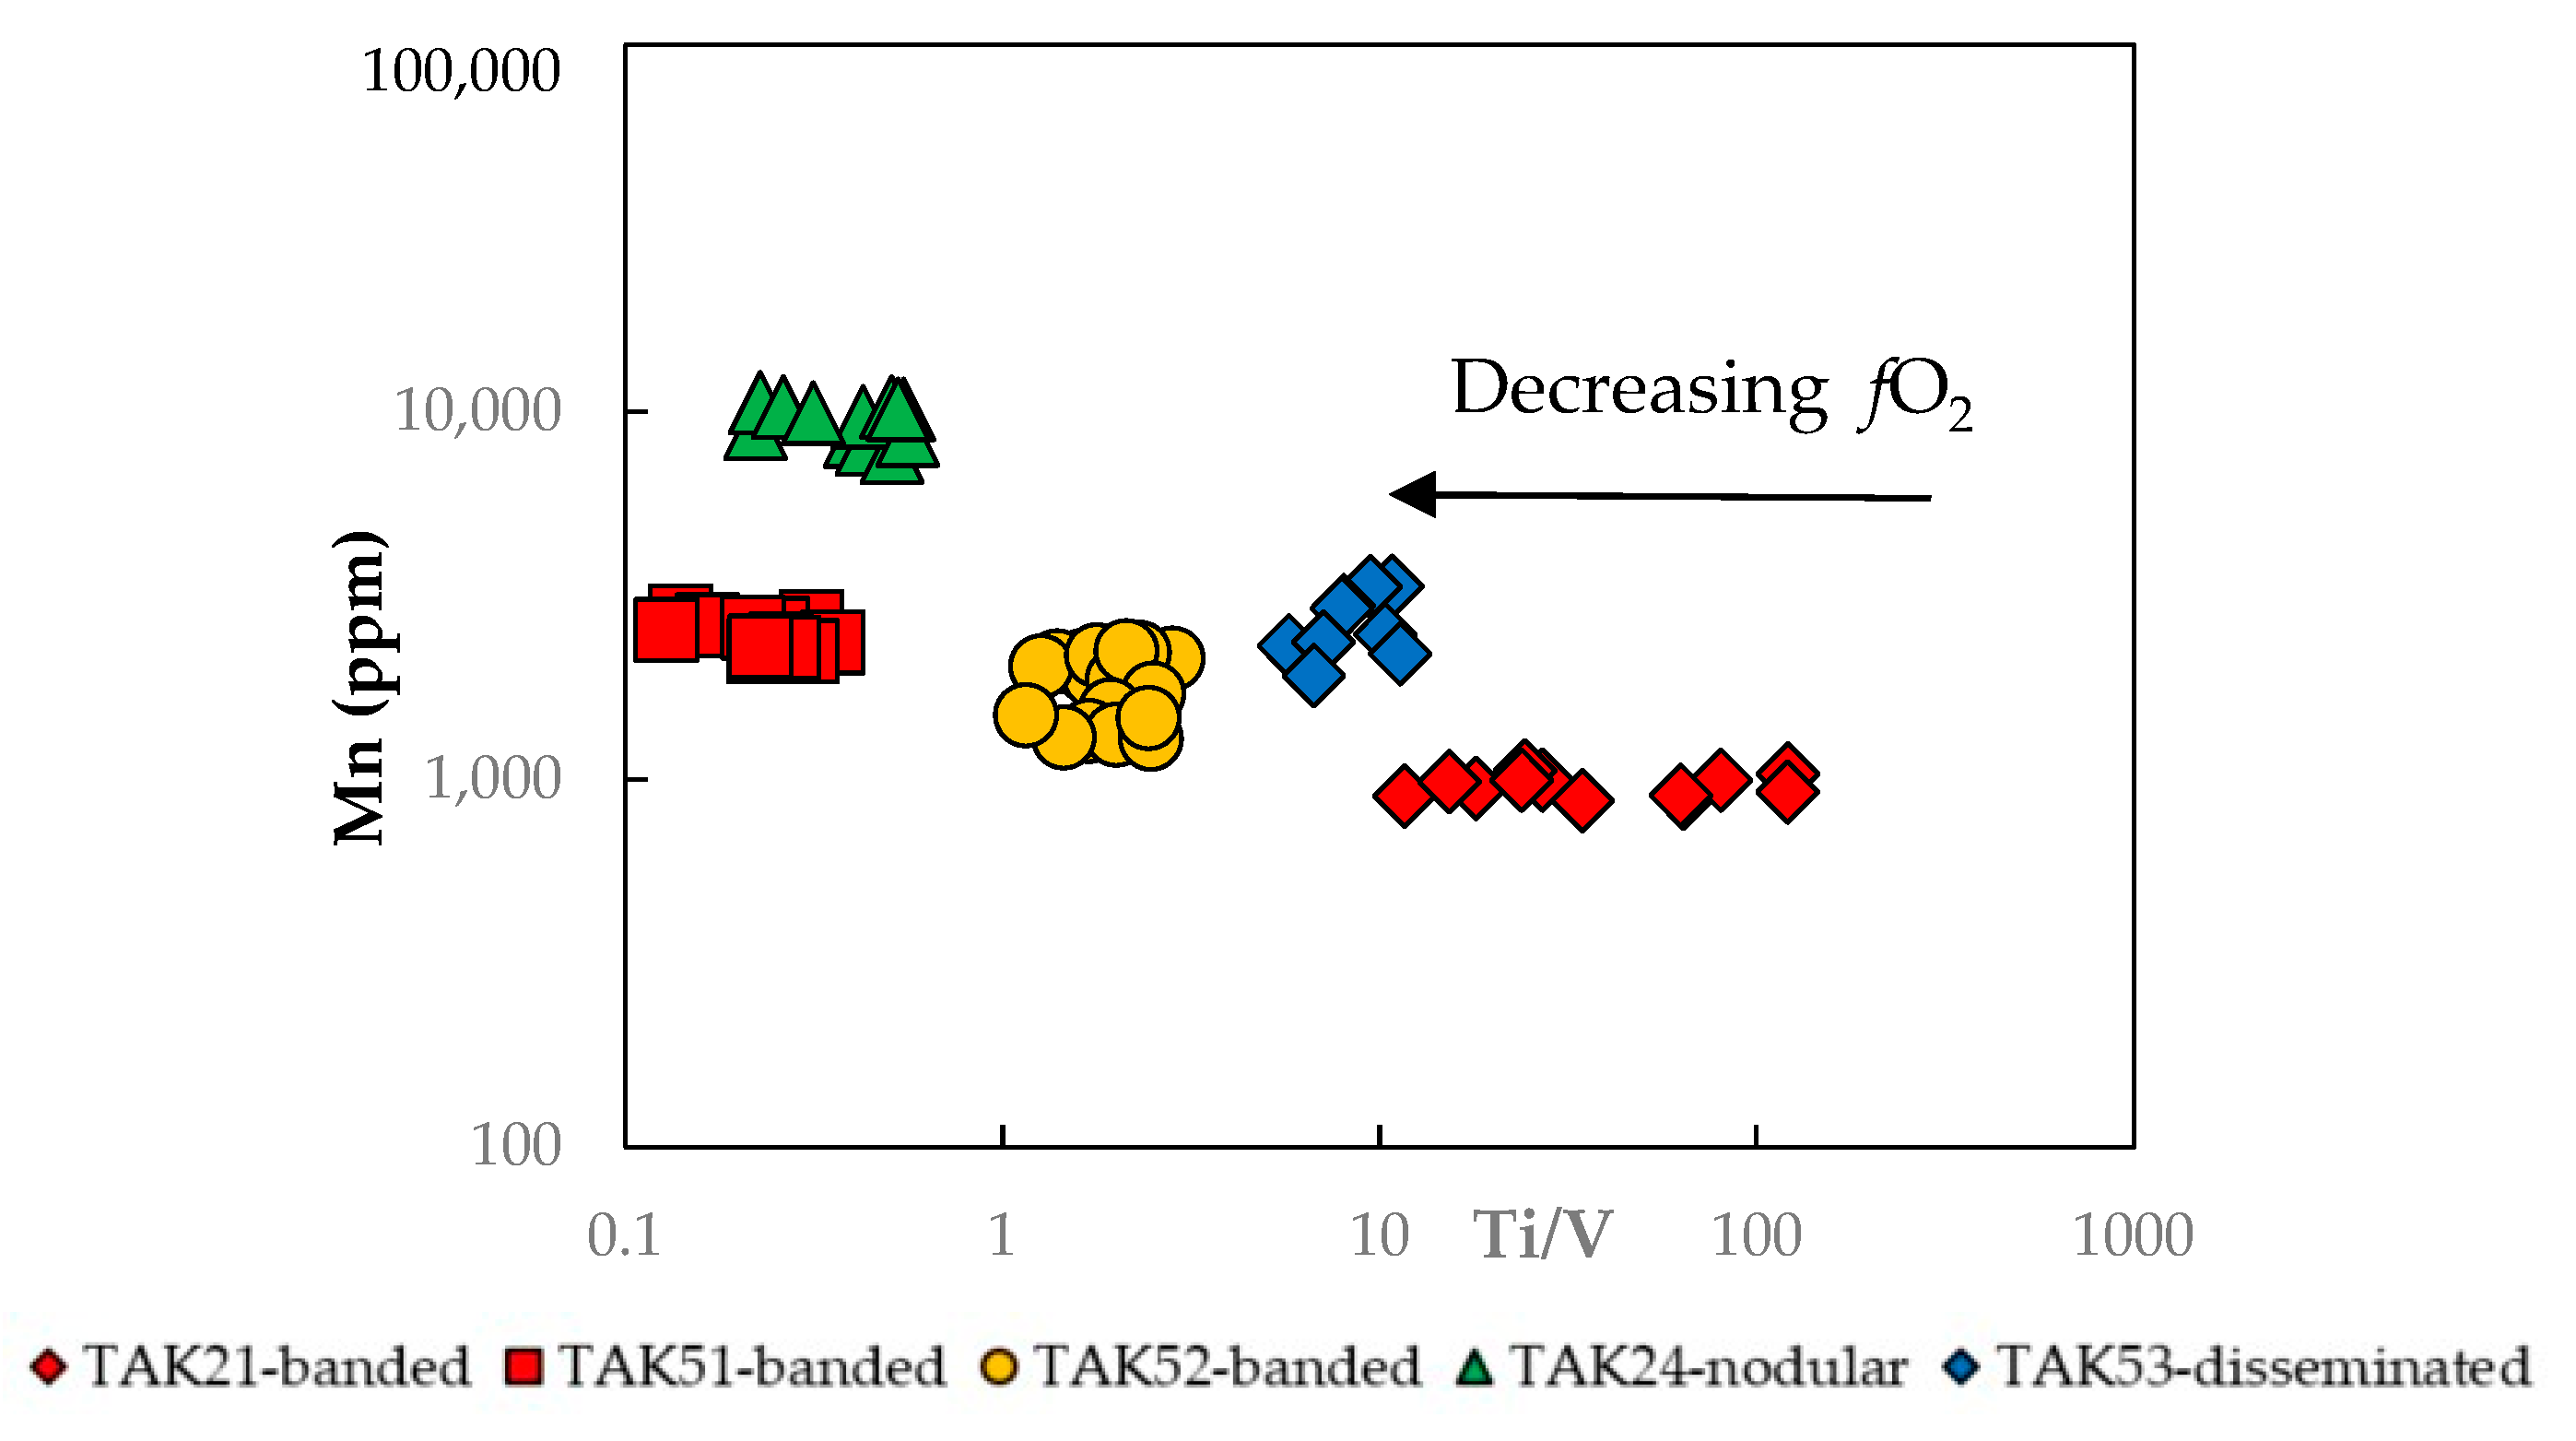
4.1. Magnetite Composition and Ore-Forming Conditions

Banded and nodular ore types show positive Y and Eu anomalies typical for a formation from a mixture of seawater and hydrothermal fluid, respectively [23]. Variations in the intensity of the positive Y anomaly indicate a variable contribution of seawater (Figure 5). In the nodular type (TAK24) the strong negative Ce anomaly is indicative of a reduced environment. Moreover, its contrasting higher La/Yb ratio would signify a contribution of a silica-rich magmatic/high-T hydrothermal fluid. The disseminated type (TAK53) only shows a different REE pattern with higher amounts of REE and a weak Eu anomaly.
The composition of magnetite itself, in particular the trace element composition, is relevant to understanding its environment of formation, despite the complexity of factors and processes that can directly or indirectly affect its composition (melt/fluid composition, melt rock/ratio, temperature, oxygen fugacity, etc.). Trace elements such as Ti, V, Cr, Co, Ni, Mn and Mg have been recognized as good discriminators between hydrothermal and igneous magnetite [1,3,4].
Coexisting phases might affect the composition of magnetite in specific trace elements [4]. However, at Takab, magnetite is mostly associated with quartz and feldspar, which do not significantly incorporate the discriminating elements mentioned above. Furthermore, there are no coexisting sulfides (or very rare inclusions) susceptible to incorporating, for example, Co. Therefore, it is considered that the coexisting phases have not affected the trace element concentrations of magnetite.
Magnetite from Takab is rich in Mn (up to 1 wt. %), has low Ti and V contents (Table 2) and low (Ti + V)/(Al + Mn) ratios between 0.01 and 0.4, characteristics of hydrothermal magnetite [4]. Furthermore, magnetite has very low concentrations of Cr and Ni (mostly below the detection limits) also supporting a hydrothermal imprint.
The hydrothermal imprint is more important in nodular sample TAK24 with low content of Ti + V and higher contents of Mg + Mn (Figure 8a,b; [35,36]). In this sample, the presence of accessory rhodochrosite (MnCO3) may indicate fluid/rock interactions with a nearby Mn-(Mg)-bearing carbonated rock. Only disseminated magnetite TAK53 shows a positive correlation of Ti + V with Mg + Al + Si contents. In magnetite from the other samples, there is no such correlation. Instead, rather constant (or less variable) Ti + V contents for highly variable Mg + Al + Si contents are observed in magnetite from the banded iron type (Figure 8a).
In the discrimination diagram Al + Mn vs. Ti + V (Figure 9 after [1,3,4]) the magnetite, of banded, disseminated and nodular types plot in the field of hydrothermal magnetite defined in skarn deposits, the disseminated magnetite TAK53 plotting close to the porphyry copper field due to its higher amount of Ti. A skarn affinity cannot be totally discarded, although there is a lack of further evidence. Only the banded magnetite TAK21 plots in the upper part of the field of IOGC (iron oxide copper-gold), close to the “skarn field”. However, an IOGC type of deposit is not supported as no Cu-sulfide mineralization is observed and magnetite has low (<10 ppm) Ni content. A possible explanation is that the trace element composition of magnetite TAK21 was modified by a coupled-dissolution-reprecipitation mechanism of primary magnetite (e.g., type 1 CDR process in [37]) induced by changing fluid composition.
The incorporation of Ti, Mg and Al in magnetite is temperature dependent. It increases with high temperature (such as in magmatic systems) and is negligible in low-temperature hydrothermal fluids [38,39]. According to the temperature trend shown in the (Al +Mn) vs. (Ti + V) diagram (Figure 9), the samples from the Takab iron ore mostly plot in the field of medium temperature (200–300 °C) hydrothermal skarn (Figure 10); the nodular magnetite from sample TAK24 plots outside the proposed limit of this field due to its high Mn content. The disseminated magnetite TAK53 may suggest a slightly higher temperature of formation than the other ore types.
Ti and V are also potential proxies for redox conditions. Ti has one valence state (Ti4+) in hydrothermal fluids and a rather constant partition coefficient between magnetite and fluids. In contrast, V has three valences (V3+, V4+ and V5+) and only V3+ enters into magnetite in high abundance. Thus, V is enriched, and Ti/V ratios are lowered in magnetite formed from reducing fluids [4,39]. The low Ti/V average ratios (0.2–0.5) of magnetite from samples TAK51 and TAK24, (2) for magnetite TAK52 and (9) for magnetite TAK53 suggest a rather reduced depositional environment (Figure 11). Only magnetite from sample TAK21 with an average Ti/V ratio of 40 suggests more highly oxidizing conditions.
In summary, the formation of the magnetite from Takab likely results from clear hydrothermal overprint on a volcano-sedimentary sequence, which may have mostly occurred at medium temperature (~200–300 °C) under variable fO2, under mostly reduced to suboxic conditions.

4.2. Magnetite Fe and O Isotope Signature

Fe and O isotope pairs in magnetite are useful to characterize specific (magmatic, magmatic-hydrothermal, or meteoritic) processes and environments of formation of the iron ores. The Fe isotopic composition of magnetite from Takab is variable across the sample suite, pointing to different processes as detailed hereafter (Figure 12).
The distinct heavy Fe and O isotopic composition of the disseminated magnetite TAK53 (Figure 12) testify for an ortho-magmatic origin, which is also suggested by the distinct trace element behaviour (Figure 4, Figure 8 and Figure 9). It can be noticed that the high ∂56Fe values plot outside the ortho-magmatic field (Figure 6) based on literature data (e.g., [2,6,7,32]). However, recent data would support the enlargement of the magmatic field to heavier Fe isotope values [41].
The Fe isotopic composition of magnetite from the banded ore-type samples TAK51 and TAK52 varies from negative to positive values, but most values plot in the magmatic/high-T hydrothermal box (Figure 6 and Figure 12). However, their lighter oxygen isotopic composition mainly plots in the low T-hydrothermal box (Figure 7 and Figure 12). This suggests a subsequent hydrothermal alteration or re-equilibration with low-temperature fluids, which is not recorded by the iron isotopic composition less affected by secondary processes than the oxygen isotope system [5].
The nodular magnetite TAK24 features important differences from the other two types. Magnetite has predominantly light ∂56Fe values, indicative of a low-temperature hydrothermal fluid signature, and heavy ∂18O (4 to 6‰) values consistent with a magmatic/ high-T hydrothermal origin (Figure 6, Figure 7 and Figure 12). Decoupling of ∂56Fe and ∂18O has, indeed, been reported in different contexts, e.g., in iron oxide-copper-gold (IOCG) deposits and in banded iron formation (BIFs) [42] and references therein]. At Takab, the presence of Cl-bearing apatite in the magnetite (Figure 3j) supports the precipitation of low ∂56Fe magnetite from a Cl-bearing hydrothermal fluid. A Cl-bearing hydrothermal fluid is indeed known to preferentially incorporate 54Fe e.g., [43,44,45], and can dissolve a (primary?) magnetite ore and transport iron and precipitated it in an isotopically lighter ore such as the nodular magnetite from sample TAK24. However, the high ∂18O values suggest crystallization at high temperature (magmatic) from a silicate melt or precipitation from a high-temperature hydrothermal fluid, as reported in iron oxide-apatite (IOA) deposits e.g., [2,6,7,34,46] and in IOCG deposits [42,47,48]. Although high ∂18O values of the magnetites from the IOCG deposit of Queensland, Australia was mostly attributed to a magmatic-hydrothermal origin, the authors invoked some local carbonate assimilation for the highest values [42]. The high ∂18O (+5 to +8‰) values of magnetite from the volcano-sedimentary formation of Candelaria, Chile [6], and of magnetite from the Yadz and Sirjan IOA deposits from Central Iran (∂18O > 4‰, [49]) were interpreted as resulting from a re-equilibration of a magmatic-hydrothermal fluid with carbonate rocks or mixing with fluid in equilibrium with the carbonate in the host rock. A similar scenario is likely to have occurred for the Takab nodular magnetite, which reveals a complex process apparently related to the involvement of CO2-bearing hydrothermal fluids produced during the decarbonatization of the close-by calcschist (Figure 5).

5. Conclusions

In-situ trace element and Fe-O isotope analysis indicates that the Takab iron ore deposit clearly shows ortho-magmatic as well as volcano-sedimentary (BIF) signatures. However, the most characteristic feature is the large predominance of the hydrothermal overprint on the volcano-sedimentary sequence throughout the whole formation and evolutionary history of the iron ore deposit. This is also supported by the presence of accessory minerals included in the magnetite and/or in the matrix, for example, monazite, barite, scheelite, and Fe-Mn-carbonates. Banded and disseminated ore types show a magmatic/high-temperature hydrothermal Fe isotope signature. However, although the disseminated ore preserves this signature, the banded ore was affected by low-temperature hydrothermal fluid that decreased the ∂18O values. This event occurred at medium temperature ca. 200–300 °C under variable fO2, i.e., mostly reduced to slightly oxidizing conditions. Magnetite from the nodular ore provides evidence for precipitation from a Cl-bearing fluid and experienced an equilibration with a CO2-rich fluid, which may suggest the following scenario: (1) an initial formation at seafloor condition [23], as observed in e.g., the Biwabik Iron Formation, Minnesota, USA [50]. This would imply a process of banded iron formation; (2) a later equilibration of the magnetite with hydrothermal CO2-rich fluids. Thus, at Takab the variety of the fluids involved and the degree of interactions result in variable chemical and isotopic compositions of the different magnetite ore types.
Finally, late oxidizing fluids transformed the magnetite into martite and hematite, which may also have filled fractures or formed rims on magnetite crystals. Aqueous metal bearing (Ba, Pb, Mn…) solutions, may have formed goethite filling fractures and surrounded magnetite and hematite, and remobilized Mn-Ba-Pb-U as Mn-Pb-Ba oxy-hydroxides, scheelite and barite into veins.
Although currently no final genetic model can be proposed, broader implications of this study are twofold:
From the fundamental point of view: Precambrian terranes in complex tectonic and magmatic settings must be studied at all scales, from outcrop to nanoscale, with complementary tools. Petrology, in-situ Fe and O isotopes coupled with mineral and whole rock chemistry are a key combination that can significantly contribute to the understanding of the evolution of such iron deposits.
From the industrial point of view: knowing formation temperatures of the iron ore types, allows adjustment of pyro metallurgical parameters to optimize processing. This contributes to energy and, thus, greenhouse gas emission savings and cost reduction.

Supplementary Materials

The following supporting information can be downloaded at: https://www.mdpi.com/article/10.3390/min13060774/s1, Table S1: Trace element composition of magnetite from the Takab iron ore samples; Table S2: Iron and oxygen isotopic composition of magnetite from the Takab iron ore samples.

Author Contributions

Conceptualization, C.W. and B.O.; validation, J.V., N.R. and C.W.; formal analysis, J.V., N.R. and O.B.; investigation, C.W., J.V., O.B., N.R. and B.O.; resources, M.H., G.N., I.M. and B.O.; data curation, J.V., N.R. and C.W.; writing—original draft preparation, C.W.; writing—review and editing, C.W. and B.O.; visualization, C.W.; supervision, C.W. and B.O.; project administration, B.O. and C.W.; funding acquisition, B.O. All authors have read and agreed to the published version of the manuscript.

Funding

We thank the Institute of Advanced Sciences of Basic Science and University of Zanjan, Zanjan for logistic support during fieldwork and the stay of BO in Zanjan. Campus France and the French embassy (Gundishapur project N° 40624TK) are thanked for financing the stay of BO at IASBS, Zanjan. The institute ISTeP from Sorbonne Université, is thanked for financial support of the analyses, through the French National TRIGGER project, French-Iranian cooperation.

Data Availability Statement

Not applicable.

Acknowledgments

L. Reisberg (CRPG, Vandoeuvre-lès-Nancy, France) is kindly acknowledged for English revision. We thank R. Mathur, F. Hervé and two anonymous reviewers for their helpful comments.

Conflicts of Interest

The authors declare no conflict of interest.

References

  1. Dupuis, C.; Beaudouin, G. Discriminant diagrams for iron oxide trace element finger printing of mineral deposit types. Miner. Depos. 2011, 46, 319–335. [Google Scholar] [CrossRef]
  2. Childress, T.M.; Simon, A.C.; Day, W.C.; Lundstrom, C.C.; Bindeman, H.N. Iron and oxygen isotope signatures of the Pea Ridge and Pilot Knob magnetite-apatite deposits, Southeast Missouri, USA. Econ. Geol. 2016, 111, 2033–2044. [Google Scholar] [CrossRef]
  3. Dare, S.A.S.; Barnes, S.-J.; Beaudoin, G.; Méric, J.; Boutroy, E.; Potvin-Doucet, C. Trace elements in magnetite as petrogenetic indicators. Miner. Depos. 2014, 49, 785–796. [Google Scholar] [CrossRef]
  4. Nadoll, P.; Angerer, T.; Mauk, J.L.; French, D.; Walshe, J. The chemistry of hydrothermal magnetite: A review. Ore Geol. Rev. 2014, 16, 1–32. [Google Scholar] [CrossRef]
  5. Li, W.; Huberty, J.M.; Beard, B.L.; Kita, N.T.; Valley, J.W.; Johnson, C.M. Contrasting behavior of oxygen and iron isotopes in banded iron formations revealed by in situ isotopic analysis. Earth Planet. Sci. Lett. 2013, 50, 132–143. [Google Scholar] [CrossRef]
  6. Bilenker, L.D.; Simon, A.C.; Reich, M.; Lundstrom, C.C.; Gajos, N.; Bindeman, I.; Barra, F.; Munizaga, R. Fe–O stable isotope pairs elucidate a high-temperature origin of Chilean iron oxide-apatite deposits. Geochim. Cosmochim. Acta 2016, 177, 94–104. [Google Scholar] [CrossRef] [Green Version]
  7. Troll, V.R.; Weis, F.A.; Jonsson, E.; Andersson, U.B.; Majidi, S.A.; Högdahl, K.; Harris, C.; Millet, M.-A.; Chinnasamy, S.S.; Kooijman, E.; et al. Global Fe–O isotope correlation reveals magmatic origin of Kiruna-type apatite-iron-oxide ores. Nat. Commun. 2019, 10, 1712. [Google Scholar] [CrossRef] [Green Version]
  8. Zhou, Z.-J.; Tang, H.-S.; Chen, Y.-J.; Chen, Z.-L. Trace elements of magnetite and iron isotopes of the Zankan iron deposit, westernmost Kunlun, China: A case study of seafloor hydrothermal deposits. Ore Geol. Rev. 2017, 80, 1191–1205. [Google Scholar] [CrossRef]
  9. Foster, H.; Jafarzadeh, A. The Bafq mining district in Central Iran—A highly mineralized Infracambrian volcanic field. Econ. Geol. 1994, 89, 1697–1721. [Google Scholar] [CrossRef]
  10. Mazaheri, S.A.; Andrew, A.S.; Chenhall, B.E. Petrological Studies of Sangan Iron Ore Deposit; Center for Isotope Studies Research Report: Sydney, NSW, Australia, 1994; pp. 48–52. [Google Scholar]
  11. Daliran, F. Kiruna-Type Iron Oxide-Apatite Ores and Apatitites of the Bafq District, Iran, with an Emphasis on the REE Geochemistry of Their Apatites. In Hydrothermal Iron Oxide Copper Gold and Related Deposits. A Global Perspective; Porter, T.M., Ed.; PGC Publishing: Adelaide, SA, Australia, 2002; Volume 2, pp. 303–320. [Google Scholar]
  12. Daliran, F.; Stosch, H.G.; Williams, P.; Jamli, H.; Dorri, M.B. Lower Cambrian Iron Oxide-Apatite-REE (U) Deposits of the Bafq District, East-Central Iran. In Exploring for Iron Oxide Copper-Gold Deposits: Canada and Global Analogues; Corriveau, L., Mumin, H., Eds.; Geological Association of Canada Short Course Notes: St. John’s, NL, Canada, 2010; Volume 20, pp. 143–155. [Google Scholar]
  13. Nabatian, G.; Rastad, E.; Neubauer, F.; Honarmand, M.; Ghaderi, M. Iron and Fe-Mn mineralisation in Iran: Implications for Tethyan metallogeny. Aust. J. Earth Sci. 2015, 62, 211–241. [Google Scholar] [CrossRef]
  14. Nabatian, G.; Li, X.-H.; Honarmand, M.; Melgarejo, J.C. Geology, mineralogy and evolution of iron skarn deposits in the Zanjan district, NW Iran: Constraints from U-Pb dating, Hf and O isotope analyses of zircons and stable isotope geochemistry. Ore Geol. Rev. 2017, 84, 42–66. [Google Scholar] [CrossRef]
  15. Alavi, M. Sedimentary and structural characteristics of the Paleo-Tethys remnants in northeastern Iran. Geol. Soc. Am. Bull. 1991, 103, 983–992. [Google Scholar] [CrossRef]
  16. Jafari, A.; Karimpour, M.H.; Mazaheri, S.A.; Shafaroudi, A.M.; Ren, M. Geochemistry of metamorphic rocks and mineralization in the Gol-Gohar iron ore deposit (No. 1), Sirjan, SE Iran: Implications for Paleotectonic setting and ore genesis. J. Geochem. Explor. 2019, 205, 106330. [Google Scholar] [CrossRef]
  17. Berberian, M.; King, G.C.P. Towards a paleogeography and tectonic evolution of Iran. Can. J. Earth Sci. 1981, 18, 210–265. [Google Scholar] [CrossRef]
  18. Agard, P.; Omrani, J.; Jolivet, L.; Mouthereau, F. Convergence history across Zagros (Iran): Constraints from collisional and earlier deformation. Int. J. Earth Sci. 2005, 94, 401–419. [Google Scholar] [CrossRef]
  19. Sarjoughian, F.; Habibi, I.; Lentz, D.R.; Azizi, H.; Esna-Ashari, A. Magnetite compositions from the Baba Ali iron deposit in the Sanandaj-Sirjan zone, western Iran: Implications for ore genesis. Ore Geol. Rev. 2020, 126, 103728. [Google Scholar] [CrossRef]
  20. Nabatian, G.; Ghaderi, M.; Daliran, F.; Rashidnejad-Omran, N. Sorkhe-Dizaj iron oxide-apatite ore deposit in the Cenozoic Alborz-Azarbaijan magmatic belt, NW Iran. Resour. Geol. 2013, 63, 42–56. [Google Scholar] [CrossRef]
  21. Orberger, B.; Miska, S.; Tudryn, A.; Wagner, C.; Fialin, M.; Boudouma, O.; Derré, C.; Nabatian, G.; Hornamand, M.; Moussef, I.; et al. Iron-Oxide Mineralogy of Banded Iron Formations in the Takab Region, North Western Iran. In Proceedings of the 14th SGA Biannual Meeting, Québec, QC, Canada, 20–23 August 2017. [Google Scholar]
  22. Orberger, B.; Wagner, C.; Boudouma, O.; Villeneuve, J.; Deloule, E.; Fialin, M.; Rividi, N.; Nabatian, G.; Hornamand, M.; Moussef, I.; et al. Mineralogy and Fe-Isotopic Composition of Iron-Oxide Ore Takab Region, North Western Iran. In Proceedings of the 22nd International Mineralogical Association General Meeting, Melbourne, VIC, Australia, 13–17 August 2018. [Google Scholar]
  23. Orberger, B.; Wagner, C.; Boudouma, O.; Derré, C.; Fialin, M.; Rividi, N.; Villeneuve, J.; Deloule, E.; Nabatian, G.; Hornamand, M.; et al. Iron-Oxide Ores in the Takab Region, North Western Iran. In Proceedings of the 15th SGA Biannual Meeting, Glasgow, UK, 27–30 August 2019. [Google Scholar]
  24. Honarmand, M.; Nabatian, N.; Wagner, C.; Monsef, I.; Delpech, G.; Bayon, G.; Orberger, B. Late Ediacaran iron formation, NW Iran: Origin, depositional age and tectonic/climate significance. Precambrian Res. 2023; to be submitted. [Google Scholar]
  25. Moazzen, M.; Hajialioggli, R. Zircon SHRIMP Dating of Mafic Migmatites from NW Iran: Reporting the Oldest Rocks from the Iranian Crust. In Proceedings of the 5th Annual Meeting AOGS, Busan, Republic of Korea, 16–20 June 2008. [Google Scholar]
  26. Hassanzadeh, J.; Stockli, D.F.; Horton, B.K.; Axen, G.J.; Stockli, L.D.; Grove, M.; Schmitt, A.K.; Walker, J.D. U-Pb zircon geochronology of late Neoproterozoic-early Cambrian granitoids in Iran: Implications for paleogeography, magmatism, and exhumation history of Iranian basement. Tectonophysics 2008, 451, 71–96. [Google Scholar] [CrossRef]
  27. Marin-Carbonne, J.; Rollion-Bard, C.; Luais, B. In-situ measurements of iron isotopes by SIMS: MC-ICP-MS intercalibration and application to magnetite crystal from the Gunflint chert. Chem. Geol. 2011, 285, 50–61. [Google Scholar] [CrossRef]
  28. Valley, J.W.; Graham, C.M. Ion microprobe analysis of oxygen isotope ratios in granulite facies magnetites: Diffusive exchange as a guide to cooling history. Contrib. Mineral. Petrol. 1991, 109, 38–52. [Google Scholar] [CrossRef]
  29. Marin, J.; Chaussidon, M.; Robert, F. Microscale oxygen isotope variations in 1.9 Ga Guntflint cherts: Assessments of diagenesis effects and implications for oceanic paleotemperature reconstructions. Geochim. Cosmochim. Acta 2010, 74, 116–130. [Google Scholar] [CrossRef]
  30. Rudnick, R.L.; Gao, S. The Crust; Rudnick, R.L., Ed.; Elsevier Ltd.: Oxford, UK, 2005; pp. 1–64. [Google Scholar]
  31. McLennan, S.M. Rare earth elements in sedimentary rocks: Influence and of provenance and sedimentary processes. Rev. Mineral. 1989, 21, 169–200. [Google Scholar]
  32. Günther, T.; Klemd, R.; Zhang, X.; Horn, I.; Weyer, S. In-situ trace element and Fe-isotope studies on magnetite of the volcanic-hosted Zhibo and Chagangnuoer iron ore deposits in the Western Tianshan, NW China. Chem. Geol. 2017, 453, 11–127. [Google Scholar] [CrossRef]
  33. Taylor, H.P. The oxygen isotope geochemistry of igneous rocks. Contrib. Mineral. Petrol. 1968, 19, 1–71. [Google Scholar] [CrossRef]
  34. Jonsson, E.; Troll, V.R.; Högdahl, K.; Harris, C.; Weis, F.; Nilsson, K.P.; Skelton, A. Magmatic origin of giant “Kiruna-type” apatite-iron-oxide ores in Central Sweden. Sci. Rep. 2013, 3, 1644. [Google Scholar] [CrossRef] [Green Version]
  35. Hu, H.; Li, J.W.; Lentz, D.; Ren, Z.; Zhao, X.F.; Deng, X.D.; Hall, D. Dissolution-re precipitation process of magnetite from the Chengchao iron deposit: Insights into ore genesis and implication for in-situ chemical analysis of magnetite. Ore Geol. Rev. 2014, 57, 393–405. [Google Scholar] [CrossRef]
  36. Liu, Y.; Fan, Y.; Zhou, T.; Xiao, X.; White, N.C.; Thompson, J.; Hong, H.; Zhang, L. Geochemical characteristics of magnetite in Longqiao skarn iron deposit in the Middle-Lower Yangtze Metallogenic Belt, Eastern China. Mineral. Depos. 2019, 54, 1229–1242. [Google Scholar] [CrossRef]
  37. Huang, X.W.; Beaudoin, G. Textures and chemical compositions of magnetite from iron oxide copper-gold (IOCG) and Kiruna-type iron oxide-apatite deposits and their implications for ore genesis and magnetite classification schemes. Econ. Geol. 2019, 114, 953–979. [Google Scholar] [CrossRef]
  38. Nielsen, R.L.; Forsythe, L.M.; Gallahan, W.E.; Fisk, M.R. Major- and trace-element magnetite-melt equilibria. Chem. Geol. 1994, 117, 167–191. [Google Scholar] [CrossRef]
  39. Toplis, M.J.; Caroll, M.R. An experimental study of oxygen fugacity on Fe-Ti oxide stability, phase relations, and mineral-melt equilibria in ferro-basaltic systems. J. Petrol. 1995, 36, 1137–1170. [Google Scholar] [CrossRef]
  40. Deditius, A.P.; Reich, M.; Simon, A.C.; Suvorova, A.; Knipping, J.; Roberts, M.P.; Rubanov, S.; Dodd, A.; Saunders, M. Nanogeochemistry of hydrothermal magnetite. Contrib. Mineral. Petrol. 2018, 173, 46. [Google Scholar] [CrossRef]
  41. Mathur, R. Personal Communication; Juniata College: Huntingdon, PA, USA, 2023. [Google Scholar]
  42. Emproto, C.; Mathur, R.; Simon, A.; Bindeman, I.; Godfrey, L.; Dhnaram, C.; Lisitsin, V. Integrated O, Fe, and Ti isotopic analysis elucidates multiple metal and fluid sources for magnetite from the Ernest Henry Iron oxide copper (IOCG) Deposit, Queensland, Australia. Ore Geol. Rev. 2022, 150, 105170. [Google Scholar] [CrossRef]
  43. Hill, P.S.; Schauble, E.A. Modeling the effects of bond environment on equilibrium iron isotope fractionation in ferric aquo-chloro complexes. Geochim. Cosmochim. Acta 2008, 72, 1938–1958. [Google Scholar] [CrossRef]
  44. Bilenker, L.D.; Simon, A.; Lundstrom, C.C.; Gajos, N.; Zajacz, Z. Experimental Constraints on Fe Isotope Fractionation in Fluid-melt-Oxide-Sulfide Assemblages. In Proceedings of the 23rd Goldschmidt Conference, Florence, Italy, 25–30 August 2013. [Google Scholar]
  45. Bilenker, L.D. Elucidating Igneous and Ore-Forming Processes by using Fe Isotopes through Experimental and Field-Based Methods. Ph.D. Thesis, University of Michigan, Ann Arbor, MI, USA, New Brunswick, NJ, USA, 2015. [Google Scholar]
  46. Tunnell, B.N.; Locmelis, M.; Seeger, C.; Moroni, M.; Dare, S.; Mathur, R.; Sullivan, B. The Sheperd Mountain iron ore deposit in Southeast Missouri, USA—An extension of the Pilot Knob magmatic-hydrothermal ore system: Evidence for iron ore chemistry. Ore Geol. Rev. 2022, 141, 104633. [Google Scholar] [CrossRef]
  47. Rodriguez-Mustafa, M.A.; Simon, A.C.; Del Real, I.; Thompson, J.F.H.; Bilenker, L.D.; Barra, F.; Bindeman, I.; Cadwell, D.A. Continuum from Iron Oxide Copper-Gold to Iron Oxide-Apatite Deposits: Evidence from Fe and O Stable Isotopes and Trace Element Chemistry of Magnetite. Econ. Geol. 2020, 115, 1443–1459. [Google Scholar] [CrossRef]
  48. Zhu, L.; Liu, J.; Bagas, D.; Zhai, D.; Meng, G.; Verrall, M. New insights into the genesis of IOGC deposits: From a case study of the Yinachangd eposit in SW China. Ore Geol. Rev. 2020, 124, 103664. [Google Scholar] [CrossRef]
  49. Peters, S.T.M.; Alibabais, N.; Pack, A.; MsKibbin, S.J.; Raeisi, D.; Nayebi, N.; Torab, F.; Lehmann, B. Triple oxygen isotope variations in magnetite from iron-oxide deposits, central Iran, record magmatic fluid interaction with evaporite and carbonate host rocks. Geology 2019, 48, 211–215. [Google Scholar] [CrossRef] [Green Version]
  50. Frost, C.D.; Von Blankenburg, F.; Schoenberg, R.; Frost, B.R.; Swapp, S.M. Preservation of Fe heterogeneities during diagenesis and metamorphism of banded iron formation. Contrib. Mineral. Petrol. 2007, 153, 211–235. [Google Scholar] [CrossRef] [Green Version]
Figure 1. Tectonic and structural map of Iran (after [13]). The red star indicates the location of the Takab study area. The black boxes correspond to the locations of different types of iron ore deposits in Iran. Zagros, Zagros ranges; KRSZ, Kermanshah Radiolarires subzone; SSZ, Sanandaj-Sirjan zone; UD, Urumieh-Dokhtar magmatic arc; The Central Iranian microcontinent includes Yadz, Posht-e-Badam block (PB), Tabas, and Lut blocks; Alborz, Alborz ranges; KTZ, Khazar-Talesh-Ziveh structural zone; CIZ, Central Iranian zone; Sistan, East Iran ranges; Makran, Makran zone; KD, Kopeh-Dagh ranges; Zabol, Zabol area; CMR, Cenozoic magmatic rocks [13].
Minerals 13 00774 g001
Figure 2. Hand specimens and enlarged views of the different ore-types from Takab showing the magnetite grains and bands (in black) in the silicate matrix (in grey and white). Banded ore: (a) discontinuous bands in TAK21; (b) flow structure in TAK23; (c) continuous and discontinuous bands in TAK51; (d) bands of large or small magnetite grains in TAK52. Nodular ore TAK24 (e). Disseminated ore TAK53 (f).
Minerals 13 00774 g002
Figure 3. Representative photomicrographs (BSE image) of the different ore-types from Takab. TAK21: (a) euhedral magnetite (Mt) with zircon inclusion, partly replaced by hematite (Hem), and crosscuts by goethite (Gth) veinlets; (b) euhedral Mt with corroded zircon inclusion; TAK52: (c) Mt band surrounded by Gth; (d) inclusions of monazite in Mt. TAK23: (e) close-up of a large crystal showing trellis texture and relict Mt. TAK53: (f) euhedral Mt hosting zircon inclusion (insert view); (g) fresh monazite and (h) altered monazite in matrix. TAK24: inclusions in Mt (ik): (i) Qz and apatite; (j) apatite and rhodochrosite; (k) uraninite; (l) barite and Mn-Pb-Ba oxide interstitial to Mt.
Minerals 13 00774 g003
Figure 4. (a) Plots of Ti vs. Mg, (b) Ti vs. Al and (c) Ti vs. V in magnetite from the Takab iron ore. (d) Bulk continental crust normalized patterns of magnetite from the Takab iron ore. The points correspond to the average values reported in Table 2. Trace element abundances in bulk continental crust are from [30].
Minerals 13 00774 g004
Figure 5. REE and Y patterns of the ore samples and calcschist (TAK12) from Takab. Normalization values to Post-Archean Australian Shale (PAAS) from [31].
Minerals 13 00774 g005
Figure 6. Magnetite ∂56Fe values from the Takab iron ore. Each position on the x-axis represents a distinct grain, with different analytical points from the same grain being represented by individual symbols at the same x-axis position: e.g., in sample TAK53 six grains were analyzed and there were three analytical points in the first analyzed grain. Each value is given with the analytical standard error (2σ). The red and blue box show the range of magmatic/high-T hydrothermal (+0.04 to +0.8‰) and low-T hydrothermal (−0.7 to +0.2‰) magnetites after [32].
Minerals 13 00774 g006
Figure 7. Magnetite ∂18O values from the Takab iron ore. Each position on the x-axis represents a distinct grain, with different analytical points from the same grain being represented by individual symbols at the same x-axis position: e.g., in sample TAK53 six grains were analyzed and there were three analytical points in the first analyzed grain. Each value is given with the analytical standard error (2σ). The red box shows the range of magmatic/high-T hydrothermal (+1 to +4‰) magnetites [2,33]. The dash-dot line separates magnetite derived from magmatic or magmatic-hydrothermal fluid at high temperature (∂18O > 0.9‰) from magnetite derived from low temperature (≤400 °C) hydrothermal fluid (∂18O < 0.9‰) for Kiruna-type ore [7,34].
Minerals 13 00774 g007
Figure 8. Plots of Ti vs. (Mg + Al + Si) and Mg + Mn vs. (Si + Al)/(Mg + Mn) respectively (a) and (b). In (a) the arrow indicates increasing fluid/rock interaction after [35,36].
Minerals 13 00774 g008
Figure 9. (Al + Mn) vs. (Ti + V) plots (in wt%) of magnetite from the Takab iron ore. Reference fields are after [1,4]. BIF: banded iron formation; IOGC: iron oxide-copper -gold deposits; Porphyry: porphyry Cu deposits; Kiruna: Kiruna apatite-magnetite deposits; Skarn: Fe-Cu skarn deposits; Fe-Ti, V: Fe-Ti, V oxide deposits of magmatic origin.
Minerals 13 00774 g009
Figure 10. Approximate temperature of formation of magnetite. The different fields of temperature are adapted from [4,40].
Minerals 13 00774 g010
Figure 11. Plot of Mn vs. Ti/V in magnetite from the Takab iron ore.
Minerals 13 00774 g011
Figure 12.56Fe and ∂18O isotopic data for magnetites from Takab. The different samples form three distinct groups according to their Fe-O isotope composition. Red and blue boxes as in Figure 6 and Figure 7 [2,32,33]. The dash-dot line separates magnetite derived from magmatic or magmatic-hydrothermal fluid at high temperature (∂18O > 0.9‰) from magnetite derived from low temperature (≤400 °C) hydrothermal fluid (∂18O < 0.9‰) for Kiruna-type ore [7,34].
Minerals 13 00774 g012
Table 1. Mineralogy of the Takab iron ore.
Sample Iron Ore Type MagnetiteFe-OxideGoethite
Hematite
TAK21bandedxlatesurrounding & in veins in Mt
discontinuous
TAK22bandedx-surrounding & in veins in Mt
discontinuous
TAK23bandedtrellis (martite) lateinterstitial to Mt
flow structurewith relic Mt include minute hematite
TAK51bandedtrellis (martite) late-
in large crystals
TAK52bandedxlate in rim ± crack-
abundant inclusions
TAK24nodularof apatite and Qz--
in some crystals
TAK53disseminatedxlate in rim ± crack-
(x) presence and (-) absence of the mineral; Qz, quartz; Mt, magnetite.
Table 2. Mineralogy of the accessories in the Takab iron ore.
Sample UraniniteFrequent AccessoriesMonaziteZirconRare Accessories
Barite
TAK21in goethite & Mtx-in Mtchalcopyrite
TAK22-in matrix-in Mt & Qzscheelite
TAK23--xin MtMo-Se-(Pb) sulfide in Mt
TAK51-in matrix--
TAK52xvery small (<1 µm) small, fresh in Qz & Mtin MtMo sulfide in Qz
inclusions in feldspar xenotime
-Mn-Ba-Pb oxides in Mt; PbS in Qz
TAK24in Mtin matrixin Mt inclusions of rhodochrosite
and Cl-apatite in Mt
TAK53very small inclusions very small inclusionsabundant, alteredabundantilmenite, rutile, +Ti-Mt in altered Mt
in feldspar in feldspar small, fresh in Qz & Mtin Mt & Qz
(x) presence and (-) absence of the mineral; Qz, quartz; Mt, magnetite.
Table 3. Trace elements (in ppm) of magnetite from the Takab iron ore.
Sample TAK 21TAK 51TAK 52TAK 24TAK 53
Ore Type BandedBandedBandedNodularDisseminated
n Analyses n = 12n = 12n = 21n = 12n = 9
Average1787615820186
Mg SD4720664729
DL = 7Range145–25146–10095–291118–26446–138
Average139035320693631704
AlSD3606737814404
DL = 6Range878–1986227–4311402–2588342–3861011–2254
Average6934041 160
SiSD7433936nc89
DL = 8Range9–2180–10710–990–270–290
Average181819316
CaSD1892346
DL = 4Range9–21810–390–710–136–24
Average72815188301420
TiSD1429329305
DL = 10Range575–10220–28148–24315–43945–1940
Average247710072168
V SD161113727
DL = 9Range1–5458–9382–11762–88118–200
Average9622465183894232658
MnSD58190344942516
DL = 10Range893–10592240–27791293–22367809–10,6091923–3360
Averagenc1012915
NiSD0–1720101110
DL = 12Range230–700–300–334–37
Average232630910
CrSD11251167
DL = 8Range16–460–9815–530–200–20
Average17616514
CuSD151212811
DL = 15Range0–490–400–400–220–27
The average values of the element whose minimum concentrations are below detection limit in some analyses were calculated by assigning all these values to zero. “nc”: The average value of the element was not calculated when only a few analyses show concentration above the detection limit for this element. Ni and Cu contents are near or below the detection limit (DL).
Table 4. REE and Y composition (in ppm) of magnetite from Takab.
ElementTAK 21TAK 51TAK 52TAK 24TAK 53TAK 12
BandedBandedBandedNodularDisseminatedCalcschist
La0.0830.0210.0440.1440.3840.283
Ce0.0890.0120.0380.0460.3820.087
Pr0.1080.0140.0400.1010.3810.218
Nd0.1080.0140.0380.1110.3490.214
Sm0.1440.0330.0720.1690.4010.241
Eu0.7520.0510.1750.5310.4950.256
Gd0.1380.0390.0720.1930.2510.227
Tb0.1180.0400.0740.1400.2130.203
Dy0.1080.0450.0730.1170.1920.196
Y2.511.092.490.0465.197.00
Ho0.1090.0440.0720.1010.1910.200
Er0.1100.0440.0720.1110.2020.182
Tm0.1280.0470.0620.1690.2570.190
Yb0.1300.0460.0620.5310.3100.169
Lu0.1430.0420.0530.1930.3370.159
Table 5. Fe and O isotope composition of magnetite from Takab.
SampleOre Type 56Fe(‰)18O(‰)
Average0.410.39–0.241.15
TAK 51bandedRange−0.22 to +1.12 −2.52 to +1.10
n analyses13 10
Average0.410.370.171.09
TAK 52bandedRange−0.28 to +0.92 −1.52 to +1.95
n analyses15 13
Average–0.320.415.300.57
TAK 24nodularRange−0.98 to +0.56 +4.10 to +6.30
n analyses22 23
Average1.350.322.150.87
TAK 53disseminatedRange+0.76 to +1.86 +1.02 to +4.07
n analyses14 12
Disclaimer/Publisher’s Note: The statements, opinions and data contained in all publications are solely those of the individual author(s) and contributor(s) and not of MDPI and/or the editor(s). MDPI and/or the editor(s) disclaim responsibility for any injury to people or property resulting from any ideas, methods, instructions or products referred to in the content.

