Article

Synchrotron Microanalytical Characterization and K/Ar Dating of the GL-O-1 Glauconite Reference Material at the Single Pellet Scale and Reassessment of the Age of Visually Mature Pellets

1
Department of Earth and Environmental Sciences, Columbia University, New York, NY 10027, USA
2
Lamont Doherty Earth Observatory of Columbia University, Palisades, NY 10964, USA
3
Department of Geosciences, Stony Brook University, Stony Brook, NY 11794, USA
4
National Synchrotron Light Source II, Brookhaven National Laboratory, Upton, NY 11793, USA
5
Department of Environmental Science, Barnard College, 404 Altschul Hall, New York, NY 10027, USA
6
Department of Geosciences, Science Center, Wellesley College, 106 Central Street, Wellesley, MA 02482, USA
7
The Earth Institute, Columbia University, New York, NY 10027, USA
*
Author to whom correspondence should be addressed.
Minerals 2023, 13(6), 773; https://doi.org/10.3390/min13060773
Submission received: 30 April 2023 / Revised: 31 May 2023 / Accepted: 1 June 2023 / Published: 5 June 2023
(This article belongs to the Special Issue Formation and Evolution of Glauconite. New Scale Approach)

Abstract

:
The K/Ar chronology of glauconite pellets is a long-used method for directly dating marine sedimentary deposits. Many papers have explored the processes that form glauconite and the factors that lead to greater reliability in the ages. Although K/Ar ages of glauconite are generally in agreement with other measures of stratigraphic age, there are examples of occurrences with ages too old and examples with ages too young. This paper seeks to build on the accumulated knowledge of glauconite, using synchrotron radiation to non-destructively characterize individual pellets and then consecutively measure the argon and potassium to obtain a K/Ar age. This strategy provides the advantage of measurements on a single aliquot while avoiding recoil loss of 40Ar in the nuclear reactor during irradiation for 40Ar/39Ar dating. We have used the glauconite reference material GL-O-1 to showcase several non-destructive methods for evaluating the maturity of individual pellets. In our argon measurements, we have found that the radiogenic argon concentration of large bulk samples underestimates the values for individual visually mature pellets, and we determined a K/Ar age of 101.0 ± 0.3 Ma (1σ SEM), M.S.W.D. 0.54 from 15 of 16 visually mature individual pellets. This age is 6% older than the reference value of 95.03 ± 1.11 Ma (1σ), and it is in good agreement with constraints from the U-Pb dating of volcanic minerals near the Albian–Cenomanian boundary.

1. Introduction

Harnessing the sedimentary record of Earth’s history requires the development of robust chronology. Volcanic layers intercalated in sedimentary sequences provide minerals that can be used to precisely and accurately date the successions, but volcanic layers are not found in all sedimentary deposits. The K/Ar dating of glauconite has a long history in the development of the Geologic Time Scale (e.g., [1,2,3]), with some contention (e.g., [4,5]). Glauconite is widely found in shallow marine sedimentary deposits, and it has a high K content.
To develop methods to be routinely used for measuring the K/Ar ages of individual glauconite pellets, we started with GL-O-1 as a glauconite reference material [6,7] and conducted a series of synchrotron, Ar, and K measurements. We compare our synchrotron measurements on individual pellets with previously published mineralogic and geochemical data on GL-O-1. Seminal work by Odin (e.g., [6]) has demonstrated that the best material for K/Ar dating purposes is mature glauconite, and their paper provided diagnostic strategies for identifying the degree of maturity including X-ray diffraction (XRD) as well as K concentration. The crystallinity and stoichiometry are tightly coupled, and Odin and Morton [8] documented the highly correlated trend of XRD and K concentration, especially for samples with K above 4% (Figure 1). These observations have inspired the study presented here.
GL-O-1 glauconite is a robust reference material for both K and Ar abundances measured in large aliquots (6.56 ± 0.06% K and 1.109 ± 0.011 nmol/g Ar) [2], but questions have been raised about its applicability at the single pellet level [5,7], and further questions have been raised about the accuracy of its estimated age of 95.03 ± 1.11 Ma (1σ) [4,8]. We have been using small, one to ten pellet (30 to 500 μg), samples of GL-O-1 to create Ar concentration calibrations for sediment K/Ar studies over more than 20 years [9,10,11,12,13,14], and we have been very impressed with the reliable reproducibility at the 2% level. Based on this positive assessment, we have been seeking to refine and improve our screening and methodology to be able to extend the application of GL-O-1 as a standard for the dating of individual unknown glauconite pellets. The recent paper by Boulesteix et al. [7] has made important advances in the evaluation of GL-O-1 at the single pellet scale, suggesting that >90% of the GL-O-1 pellets are reliable. However, they also reported the presence of older detritus in some pellets as well as lower radiogenic 40Ar (40Ar*) yield in some of the lighter colored pellets, and they further noted some instances of carbonate in cracks as well as a significant occurrence of apatite or francolite inclusions. They concluded that it is necessary to use sample weights of 5 to 10 mg to mitigate against the demonstrated heterogeneity (hundreds of pellets). However, their reported single pellet results were mostly within a small range of 40Ar* concentrations, and we hypothesized that with scrutiny of the chemistry and mineralogy of pellets with non-destructive methods prior to K/Ar dating, it still might be possible to obtain robust K/Ar results on individual pellets. In this paper, we explore the potential for improved sample selection with microscale examination of individual pellets using the National Synchrotron Light Source II (NSLS-II)) at Brookhaven National Laboratory, which is ideally followed by Ar and then K measurements on the same pellets.
In the study presented here, we explore potential techniques for screening individual single pellets, here applied to the GL-O-1 glauconite reference material, with the goal of developing a diagnostic tool for selecting the best pellets for K/Ar dating and for correlation to environmental variables. Because the synchrotron measurements are non-destructive and can be applied on whole pellets, this approach provides the potential for screening at a much-refined level and thus allows for selection of the most mature and thus presumably the best pellets for further analysis. Initial characterization focused on micro-XRD and micro-XRF (X-ray Fluorescence) to quantify the crystallinity and K concentration, respectively. In order to establish and correlate these measurements, we performed a more expansive study of GL-O-1 that included analysis by micro-X-ray absorption spectroscopy (XAS) of K and Fe, X-ray fluorescence (XRF) mapping of elemental distributions and associations, comparison of whole and sectioned pellets, and measured XRD by two different instruments.

2. Methods

2.1. Synchrotron Measurements

XRF images of Mg, Al, Si, P, S, and K were collected at the Tender Energy X-ray microspectroscopy (TES) beamline 8-BM at NSLS-II [15] and processed using IDL software. Potassium 1-s X-ray absorption near-edge structure (XANES) measurements were collected at TES and processed using Athena [16]. All measurements from TES were collected using a Canberra Ge ultralow energy germanium detector and the Si 111 double crystal monochromator.
XRF images of Fe, Ca, and K and Fe 1-s XAS XANES measurements were collected at the X-ray Fluorescence Microprobe (XFM) beamline 4-BM at NSLS-II. Measurements at XFM were collected using a 7-element silicon drift detector and the S111 double crystal monochromator. The monochromator energy for the Fe K edge was calibrated to 7110.75 eV using a metallic iron foil [17]. Images were processed using the Larch software package [18], and XAS data were processed using Athena.
Diffraction data were collected at both the XFM beamline and the Complex Materials Scattering (CMS) beamline 11-BM at NSLS-II. XRD measurements at XFM were collected using a Perkin Elmer 2-D area detector in transmission mode at 18 keV and converted to 2-theta using Dioptis [19]. XRD data at CMS were collected as wide angle X-ray scattering (WAX) data at an incident energy of 13.5 keV using a Pilatus 800 k detector. The data reduction into 1D plots was performed using SciAnalysis software [20] and converted from q-spacing to 2-theta to compare with published data.

2.2. Argon Measurements

Details on the instrument and procedures for Ar measurements are provided in the Supplementary Materials. The application of naked pellets of GL-O-1 as a monitor standard to calibrate instrument sensitivity is reported in other papers (e.g., [10,11]) and briefly reviewed here. For the application as a sensitivity standard, one to ten pellets are generally weighed for each sample to produce a range of weights, and for each disk run, three or more pits are loaded with GL-O-1. These GL-O-1 analyses are used as a check on the instrument sensitivity. We calculate the 40Ar* abundance of each GL-O-1 based on its weight and concentration information from Odin et al. [2] and use the resulting signal intensity as a calibration of the abundance of Ar in the air pipette. We use the air pipettes for both consistency of sensitivity and for correcting for drift and evaluating the quality of the isotope ratios measured. To calculate the 40Ar*, we subtract 36Ar times the 40Ar/36Ar measured on air pipettes from the total 40Ar. It is important to note that for 40Ar/39Ar dating (the primary purpose of this instrument), the accuracy of the abundances is not as important as the relative isotope abundances. Thus, our mass spectrometer sensitivity estimate has relied on the measurements of GL-O and the assumption of 1.109 ± 0.011 nmol/g Ar [2].
Leading up to this study, our method is to weigh pellets of GL-O-1 or small sediment samples with a microbalance and load them as naked pellets or clods (as in [9]). However, because our goal for the study reported here is to measure K on the same aliquots as Ar in order to mitigate against sample heterogeneity, we have explored other options that avoid direct coupling between the laser and sample. These tests include applications of Ta foil to wrap the pellets, Ta capacitor tubes, smaller Nb tubes, and a glass rod pouch. While all these methods worked from the standpoint of degassing the pellets while retaining their integrity, the approach that has the lowest Ar backgrounds and easiest manipulation is small Nb tubes (technical details in the Supplementary Materials), so we follow that procedure here.
Two disk runs were conducted for this study—one using the Nb microfurnaces and the diode laser and the other with naked grains and the CO2 laser. Disk run 1428 was loaded with sixteen empty Nb tubes interspaced with sixteen Nb-tubed, visually well-evolved dark green GL-O-1 pellets. Each of the 32 tubes was heated to 750 ± 5 °C for 2 min with the diode laser. All tubed GL-O-1 grains remained intact after degassing. In order to test the Ar concentration of single pellets of visually mature dark green GL-O, another disk run, 1442, included naked grains of GL-O-1 [2], GA-1550 [21,22], and MMhb [22,23] standards. These mineral grains were fused at 7 watts for 3 min with the CO2 laser to insure a complete degassing of Ar.

2.3. Potassium Measurements

Some samples of visually mature, dark green pellets were analyzed on a CAMECA SX100 electron microprobe at the American Museum of Natural History in New York City. The probe is equipped with a fully automated WD spectrometer, operated at 15 kV accelerating voltage with a beam current of 20 nA, and calibrated against natural and synthetic oxides (Wakefield diopside for Mg and Si; K-spar for Al, K; RKFAYb7 for Fe). Each element was measured using a beam size of 20 µm with counting time of 20 s. Four spot measurements on the K-spar standard yielded a mean value of 12.37 ± 0.09% for K (recommended value is 12.39%), indicating accuracy better than 2% for the K measurements.
In order to have K on the same aliquot as Ar, our preferred strategy for measuring K is to dissolve the degassed pellet with an enriched 41K spike for isotope dilution analysis. For measurement of the K concentrations, the degassed pellets are transferred into Teflon vials. Based on an estimate of the K abundance from the weight of the pellet, the optimum amount of 41K-spike is pipetted into each sample vial and weighed. The sample-spike mix is slowly dried down on a hotplate (100 °C), and then, a 0.3 to 0.6 mL concentrated HF-HNO3 (3:1 ratio) acid mix is added to each vial for digestion. The vials are closed and placed on the hotplate set at 165 °C for over 48 h. After opening, the samples are dried, redigested and dried, and then dissolved in 0.4 mL of 0.5 M HNO3 for chromatographic separation of K from the matrix, which is followed by measurement on a Nu Instruments Sapphire MC-ICPMS (SP005), using cold plasma mode (RF power = 900 W) (details provided in the Supplementary Materials).

3. Results

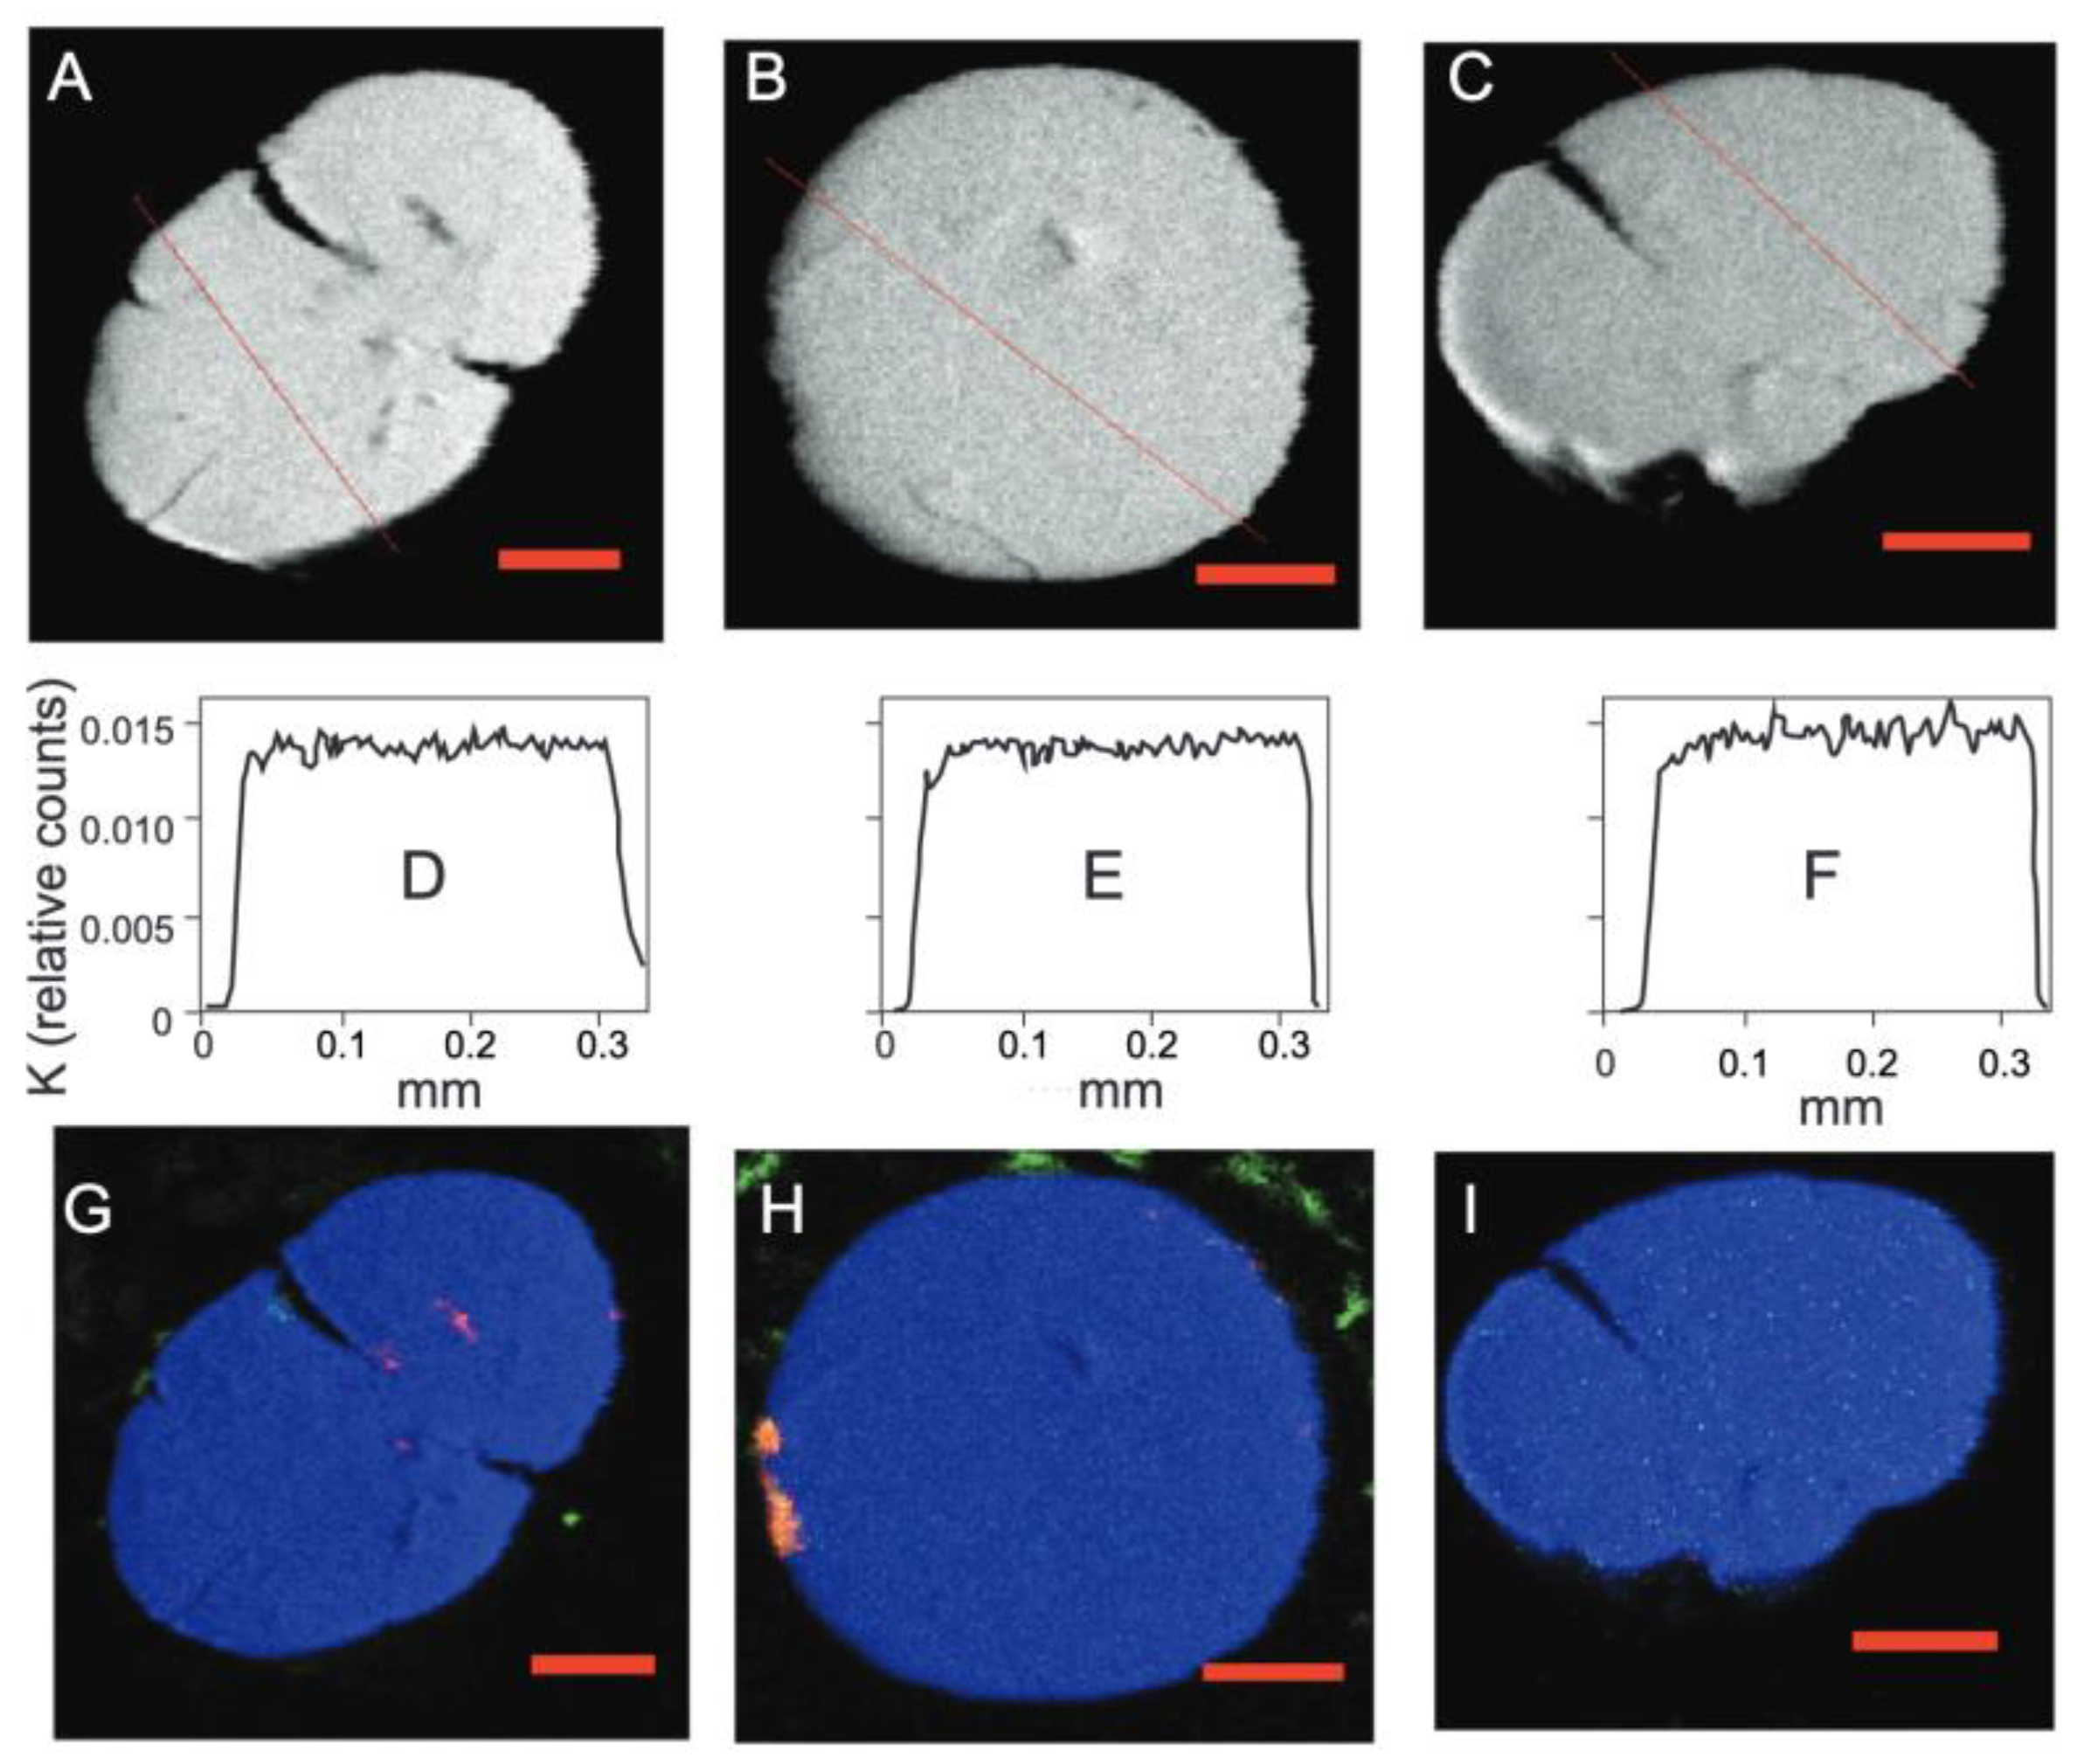
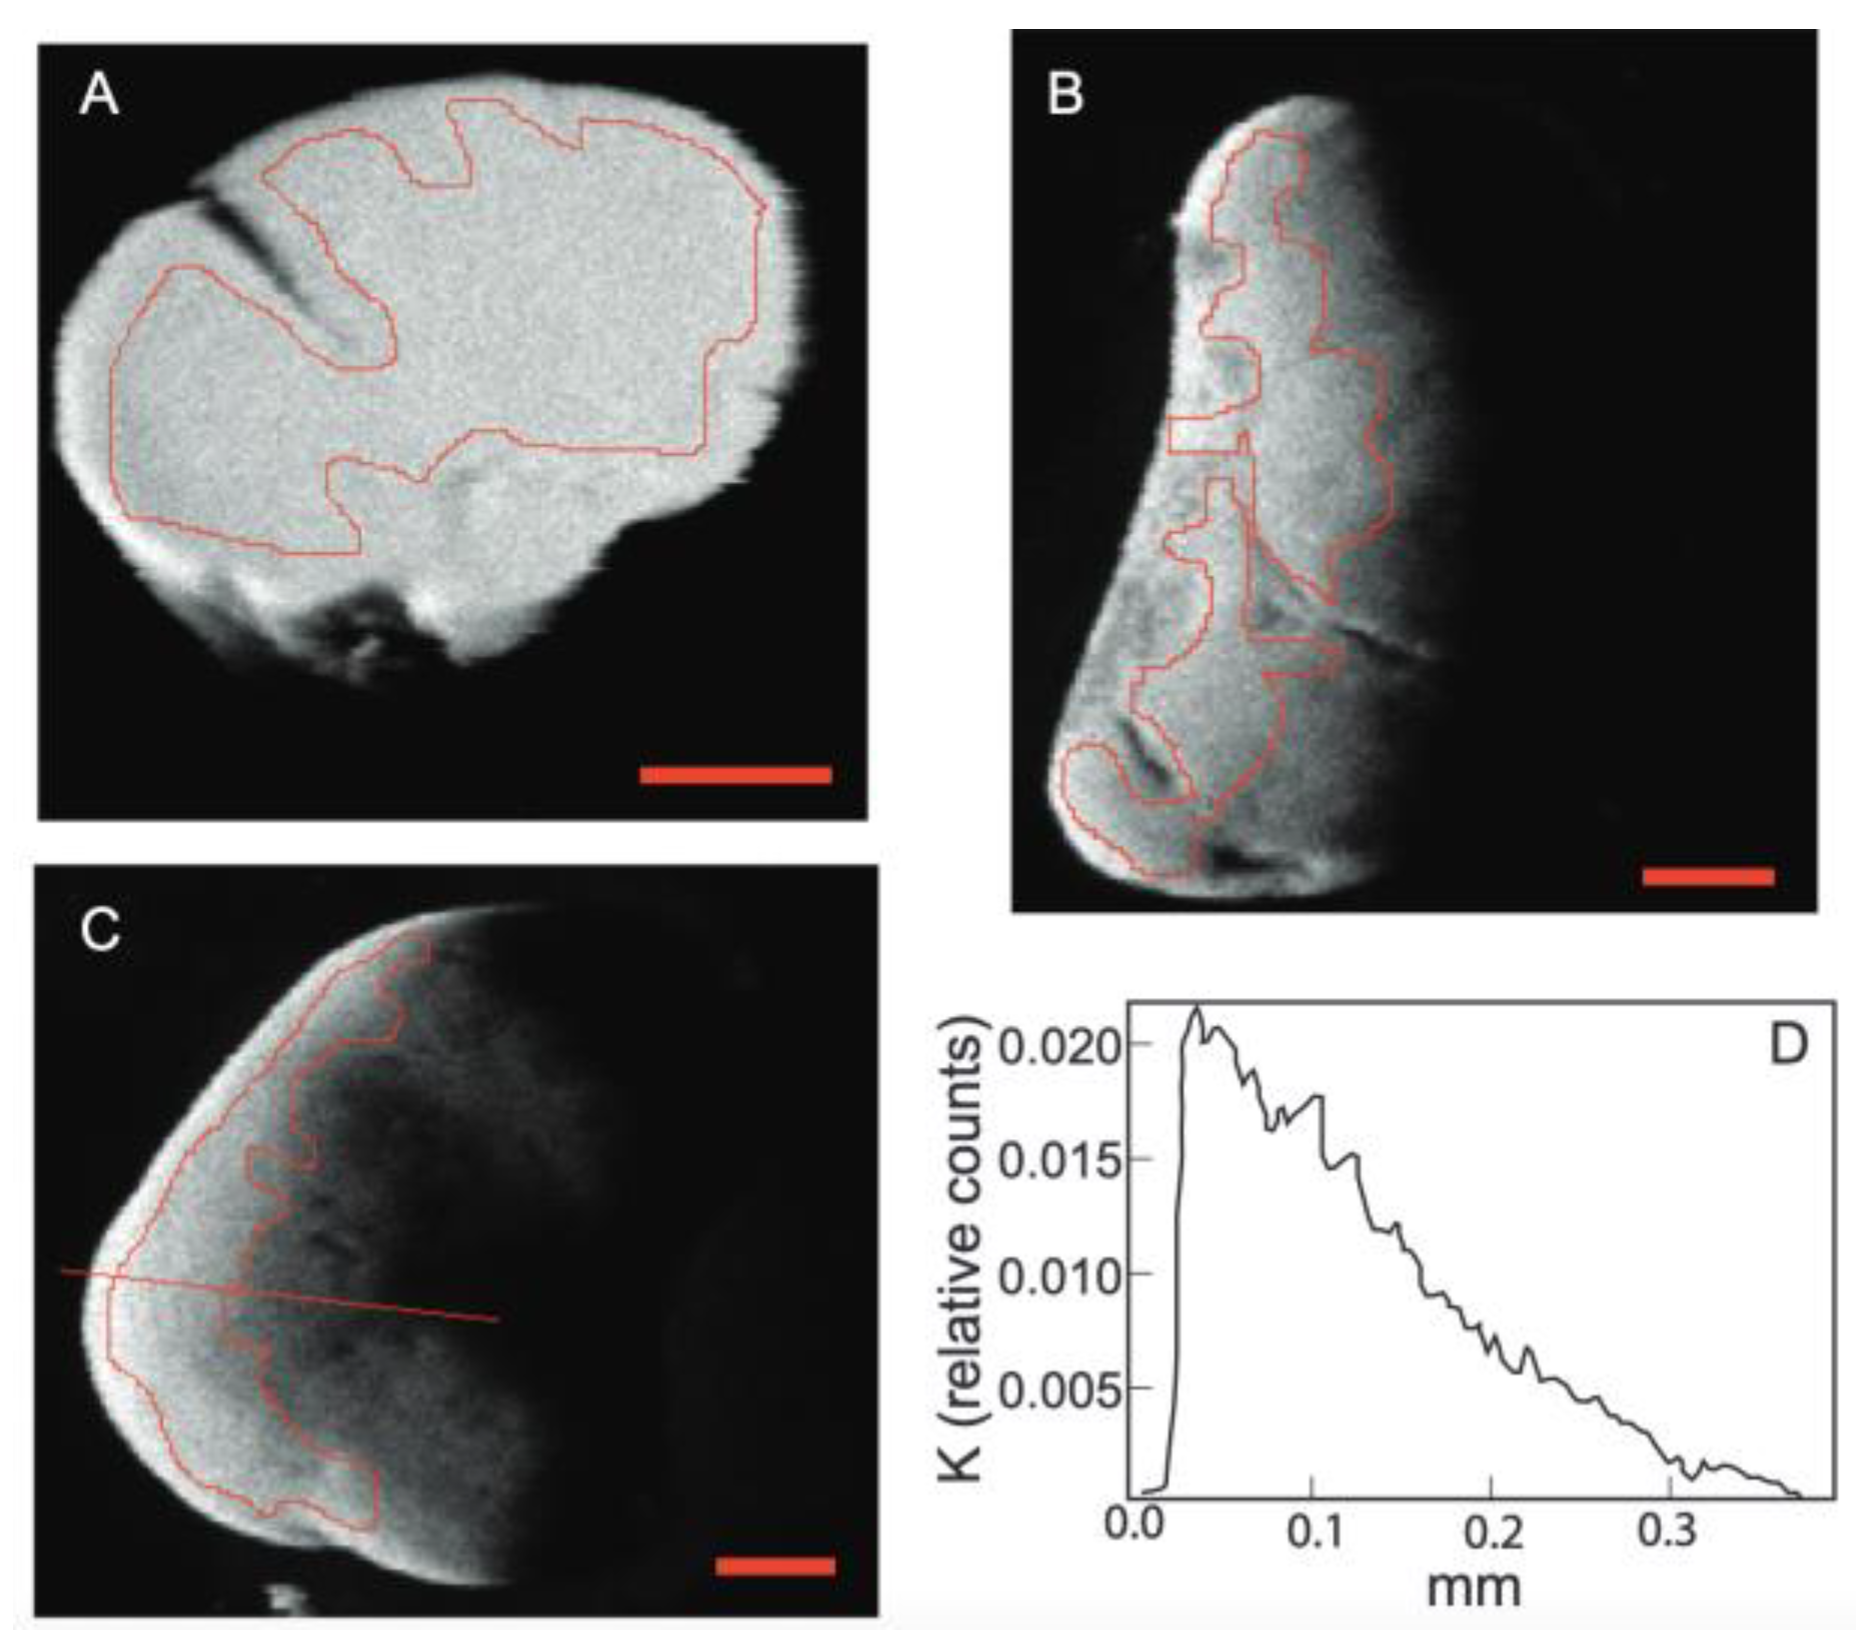
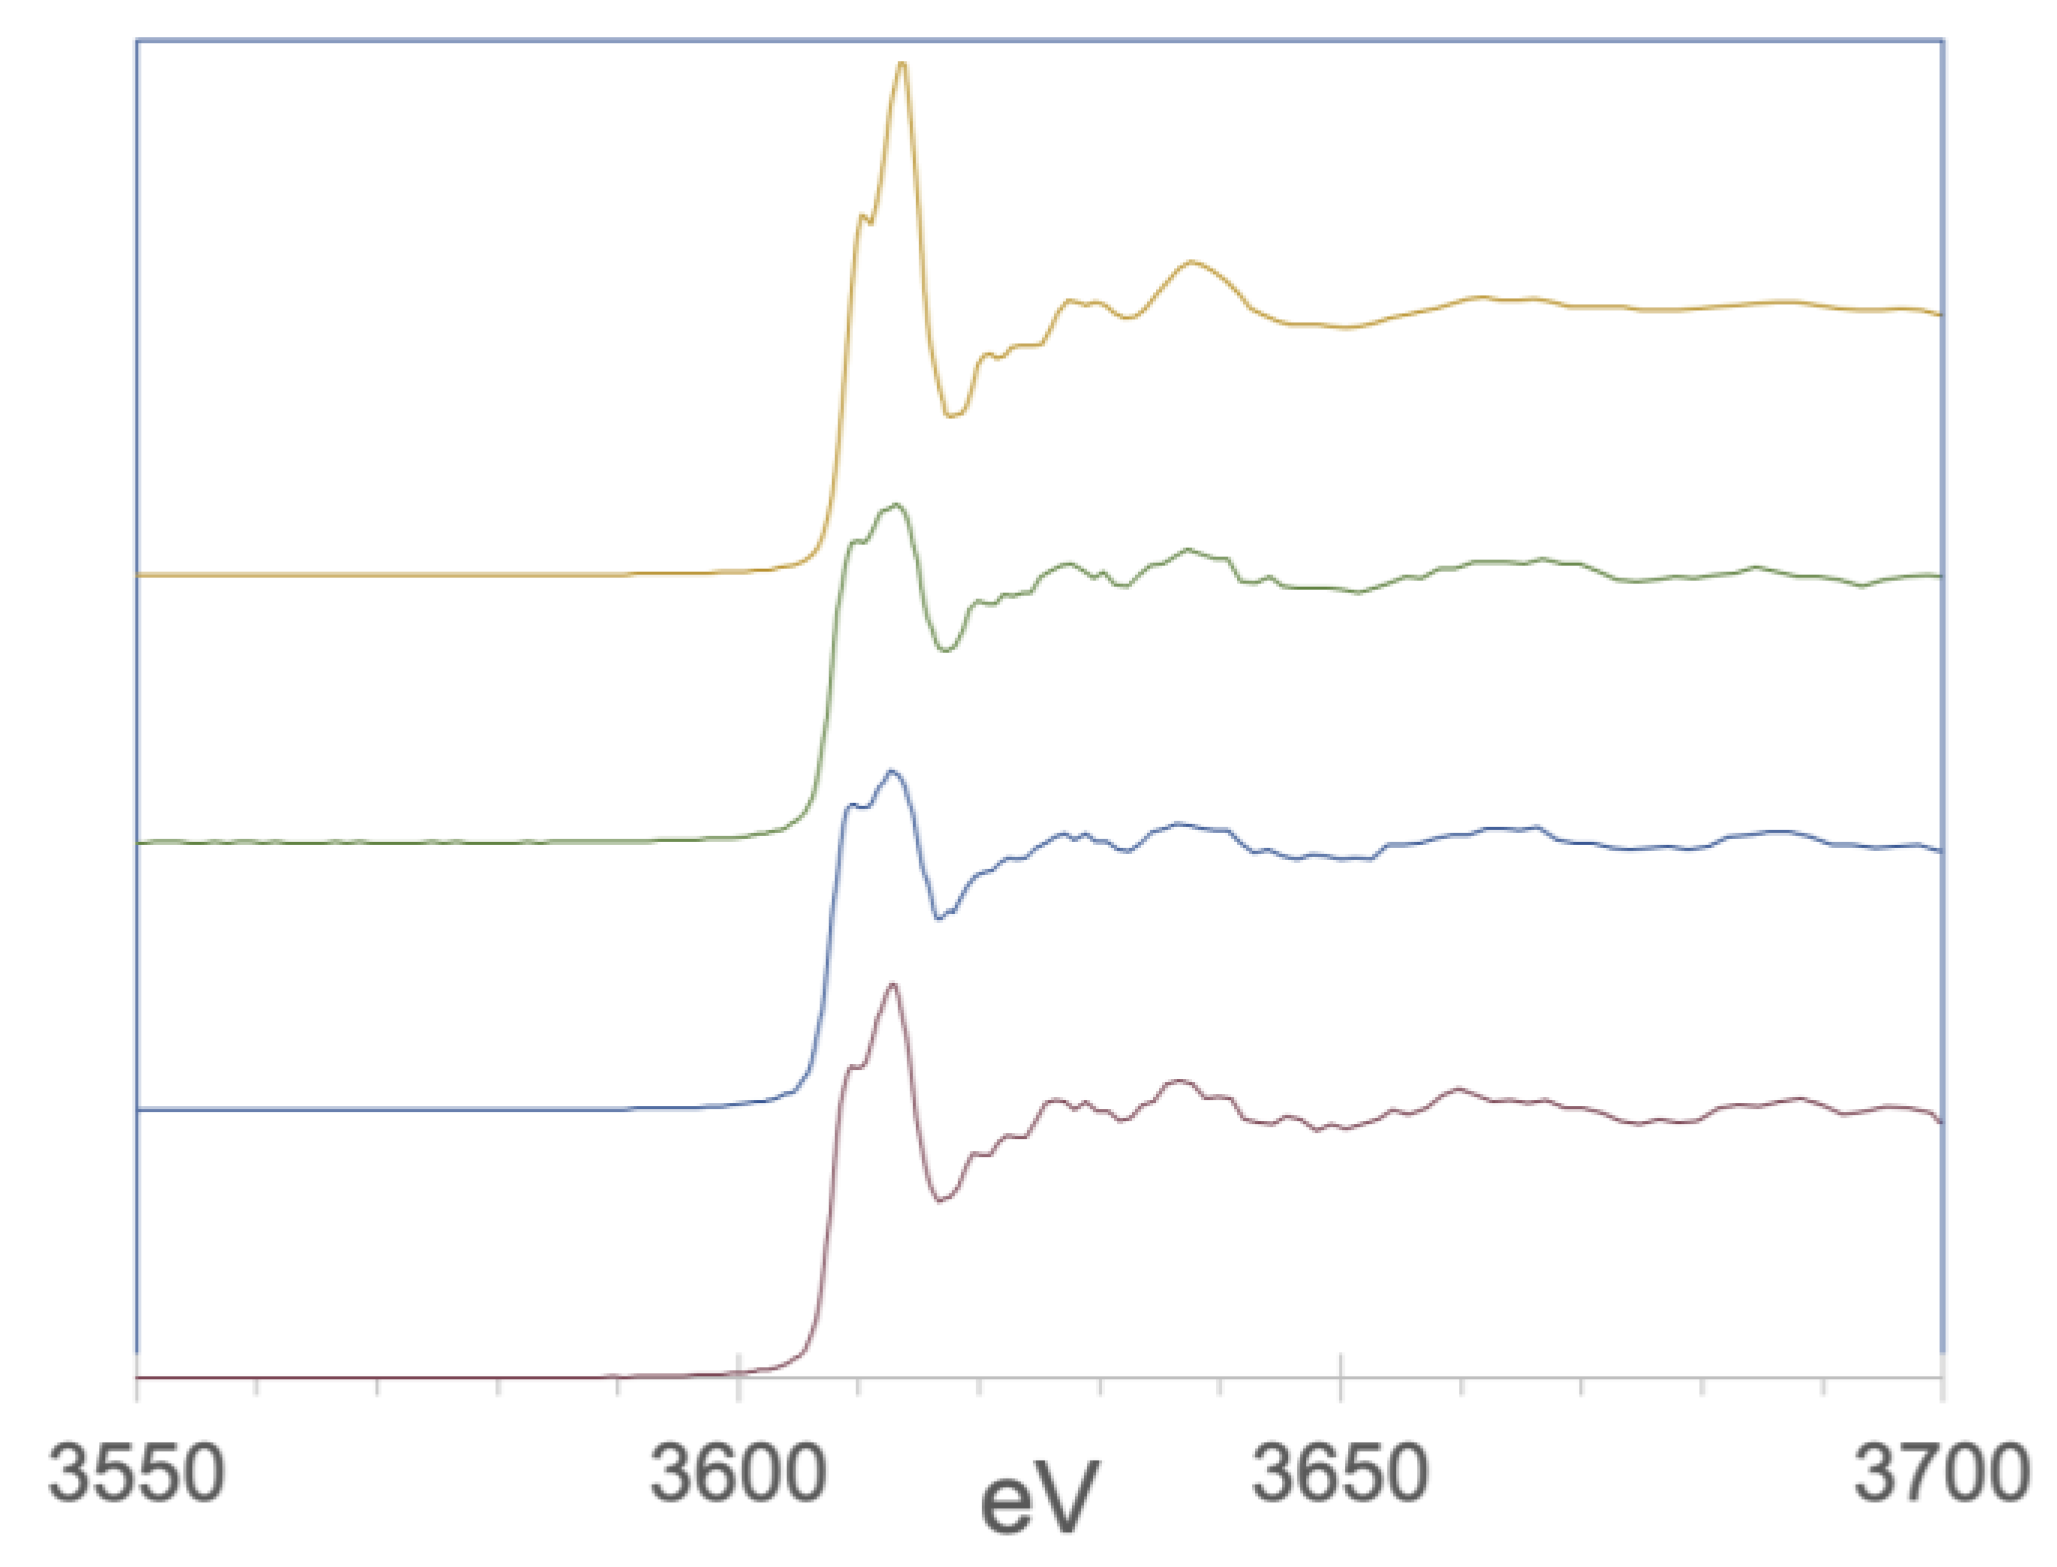
3.1. Synchrotron Results

XRF maps of K, P, S, Si and Al on polished cross-sections of three GL-O-1 pellets were made on the TES beamline. As shown in Figure 2, the K concentration is quite homogeneous across an individual grain and between GL-0-1 grains, but as also noted by Boulesteix et al. [7], there are a few patches showing P content that are likely apatite inclusions. It also appears that there are some fine-scale inclusions of S; sulfur K-edge XANES identified these as organic matter.
The same mapping approach was also applied to whole pellets (Figure 3). Here, more variation in the K intensity can be seen, although most if not all of this variation is due to the geometric effects of measuring a rounded pellet. This is analogous to viewing the Moon at 90 degrees to the Sun’s illumination; the spherical Moon appears as a half-circle. As in the polished pellets, there are patches of high P interpreted to be apatite inclusions (Figure 3C). Since our goal is to use non-destructive approaches to evaluate the quality of glauconite pellets for K/Ar dating, we compare the averages of K intensity over regions of interest (ROI) for polished (Figure 4A) with those on the surfaces of whole pellets (Figure 4B,C). Based on models of a spherical object in this measurement geometry, selecting a ROI to capture the area with K intensity between 50 and 85% of the maximum intensity will approximate that of a flat area having the same concentration. As can be seen from the statistics, if the ROI is selected on a relatively smooth surface with minimum topographic relief and avoiding cracks or inclusions, the intensity of K on the whole pellets is well matched to that on the polished flat surface. Figure 4D shows a line profile of the K signal across the curved surface of the pellet. Tested on multiple grains of GL-O-1, this demonstrates the efficacy of mapping K on single grains to quantify K concentration relative to a known standard, and we intend to use GL-O-1 as that standard in future studies.
In addition to the elemental mapping at TES, we also obtained X-ray absorption near-edge structure (XANES) spectra of K in GL-O-1. XANES provides information about a specific element’s chemical speciation and local structure, which is most often used as a fingerprinting technique. K-XANES analysis from a polished surface of GL-O-1 and several from the surfaces of whole pellets are shown in Figure 5. The highly structured spectra reflect a crystalline environment for K as opposed to a disordered, adsorbed or interstitial environment. These patterns are therefore consistent with the known high maturity of GL-O-1. With further work to build a database of patterns that can be calibrated with measures of maturity such as K content and XRD pattern, K-XANES could be an alternative screening tool in addition to providing a K concentration estimate.
With the XFM beamline, we conducted an elemental mapping of two of the same GL-O-1 pellets as measured at TES. Combined maps of Fe, Ca and K are shown in Figure 6 along with Fe-XANES data. The Fe distribution is quite uniform, as its intensity shows only the geometric effects of the round pellet; the K map is not optimal at the high energy of XFM. Fe-XANES data can be very important in the study of glauconite maturity because the valence of Fe is a significant factor in the maturation process (e.g., [24]). Figure 6 shows that the Fe in these two pellets is uniform in its speciation and, with reference to the Fe foil for calibration, is all in the Fe3+ oxidation state. Calcium indicates the presence of apatite. Figure 6A is the same pellet as Figure 4C, although in a different orientation, and the patches of high Ca are the same areas as the high P in Figure 3C.
A really exciting capability at the NSLS 2 at both XFM and 11-BM (CMS) is the ability to make micro-XRD measurements of the single pellets. In Figure 7, we compare the XRD measurements from Boulesteix et al. [7] and from XFM and CMS. Although the position and sharpness of other peaks may also be significant in the interpretation of the maturity, the position of the 001 peak between 10 and 14 angstroms is known to be an important measure of maturity [6,26].

3.2. Argon Measurement Results/Nb Tubes

Data for the measurements in Nb tubes are presented in Table S5. Sixteen pre-degassed empty Nb tubes (#1, 3, 5, …, 31) were measured for 40Ar and 36Ar during the disk run 1428. 40Ar signals from those tubes are within the range of 0.003 to 0.051 nA with a mean value of 0.021 ± 0.015 nA that is comparable to the cold procedural blank 40Ar level of 0.03 ± 0.013 nA during this interval. The associated 36Ar signals are around the level of 0.0005–0.0006 nA. In two exceptions, high 40Ar signals of 0.1532 and 0.1745 nA were observed on two empty Nb tubes (#17 and #27).
Sixteen Nb-tubed GL-O-1 grains (#2, 4, 6, …, 32) weighing from 0.082 to 0.219 mg were measured for Ar in the disk run 1428, and the data are presented in Table S5. The radiogenic Ar (40Ar*) of those Nb-tubed single GL-O grains ranges from 93.7 to 97.8%, which is similar to the 86.9–97.1% measured on 14 (out of 15) single mature GL-O pellets by Smith et al. [5] and to the 72.8–98.8% measured on 20 single GL-O grains by Boulesteix et al. [7]. Using these tubed GL-O grains for sensitivity calibration of our mass spectrometer, we obtain a mean sensitivity of 4.0088 ± 0.0222 × 10⁻¹⁴ mol/nA (1σ SE). These results demonstrate the potential applicability of our proposed protocol for Nb-tubed single GL-O or other glauconites, but we note that the concentrations are set by our standardization with GL-O [9], and thus, this approach does not test the Ar concentration but instead it only tests the reproducibility of these individual pellets.

3.3. Argon Measurement Results/Compared with Other Ar Standards

Similar to how we have been using GL-O-1 for sediment measurements over the years, Wang et al. [27] used GA-1550 biotite as a reference material to calibrate their instrument sensitivity and analyzed three other standards (FC sanidine, MMhb hornblende, and B4M biotite) as “unknowns”. Their data demonstrate that it is possible to obtain a reliable cross-calibration between small aliquots of those standards, and the implied instrument sensitivity using each of these is statistically indistinguishable at the 2σ level. Following their approach, for our study, we measured GL-O-1 against two other primary standards (MMhb, and GA-1550). These standards are well calibrated and have been used as K-Ar dating standards for decades [22,28,29,30]. For the purpose of this test, we loaded 8 aliquots of naked grains for each of the standards with 1 grain per aliquot for GA-1550 and GL-O-1 and 1–5 grains per aliquot for MMhb (due to small weights of single hornblende crystal around 0.01–0.045 mg). The single-step fusions of these naked grains were carried out using the CO2 laser heated at 7 W for 3 min, which yielded a melted ball for each of these samples. The measurement results for the cross-calibration experiment in disk run 1444 are presented in Table S6 and Figure 8.
When MMhb and GA-1550 are each treated as reference material using the recommended values for 40Ar* contents of 1.626 ± 0.005 nmol/g for MMHb [23] and 1.342 ± 0.07 n mol/g [31] for GA-1550, we obtain 1.167 ± 0.036 nmol/g (relative to GA-1550) and 1.171 ± 0.037 nmol/g (relative to MMhb) for GL-O-1, and the corresponding K/Ar ages are 99.2 ± 0.8 and 100.0 ± 0.8 Ma, respectively (both 1σ SE). These apparent K/Ar ages are older than the recommended value of 95.0 ± 1.1 Ma for bulk GL-O-1 [2]. Importantly, these data suggest that the recommended 40Ar* content of 1.109 ± 0.011 nmol/g for bulk GL-O-1 grains of ~100 mg quantities may be an underestimate when it is applied to single GL-O-1 grains carefully selected for the most mature appearance.

3.4. Results from K Measurements by Electron Microprobe

Microprobe chemical analysis on three natural, non-degassed dark green GL-O-1 pellets (6 spots of 20 µm beam size on grain-1 and grain-2 and 17 on grain-3) yields K contents of 6.48 ± 0.31, 6.72 ± 0.13, and 6.52 ± 0.20% on the micrometer scale, with an error-weighted mean of 6.59 ± 0.07% (Table S7). These mean values are overlapping with the previously reported K contents of 6.56 ± 0.11% for GL-O-1 grains of 20 mg quantities measured by ICP-OES and 6.56 ± 0.07% for GL-O-1 grains of 100 mg quantities measured by XRF [7]. They are also concordant with the recommended K value of 6.56 ± 0.06% for bulk GL-O-1 grains of ~100 mg quantities [2].

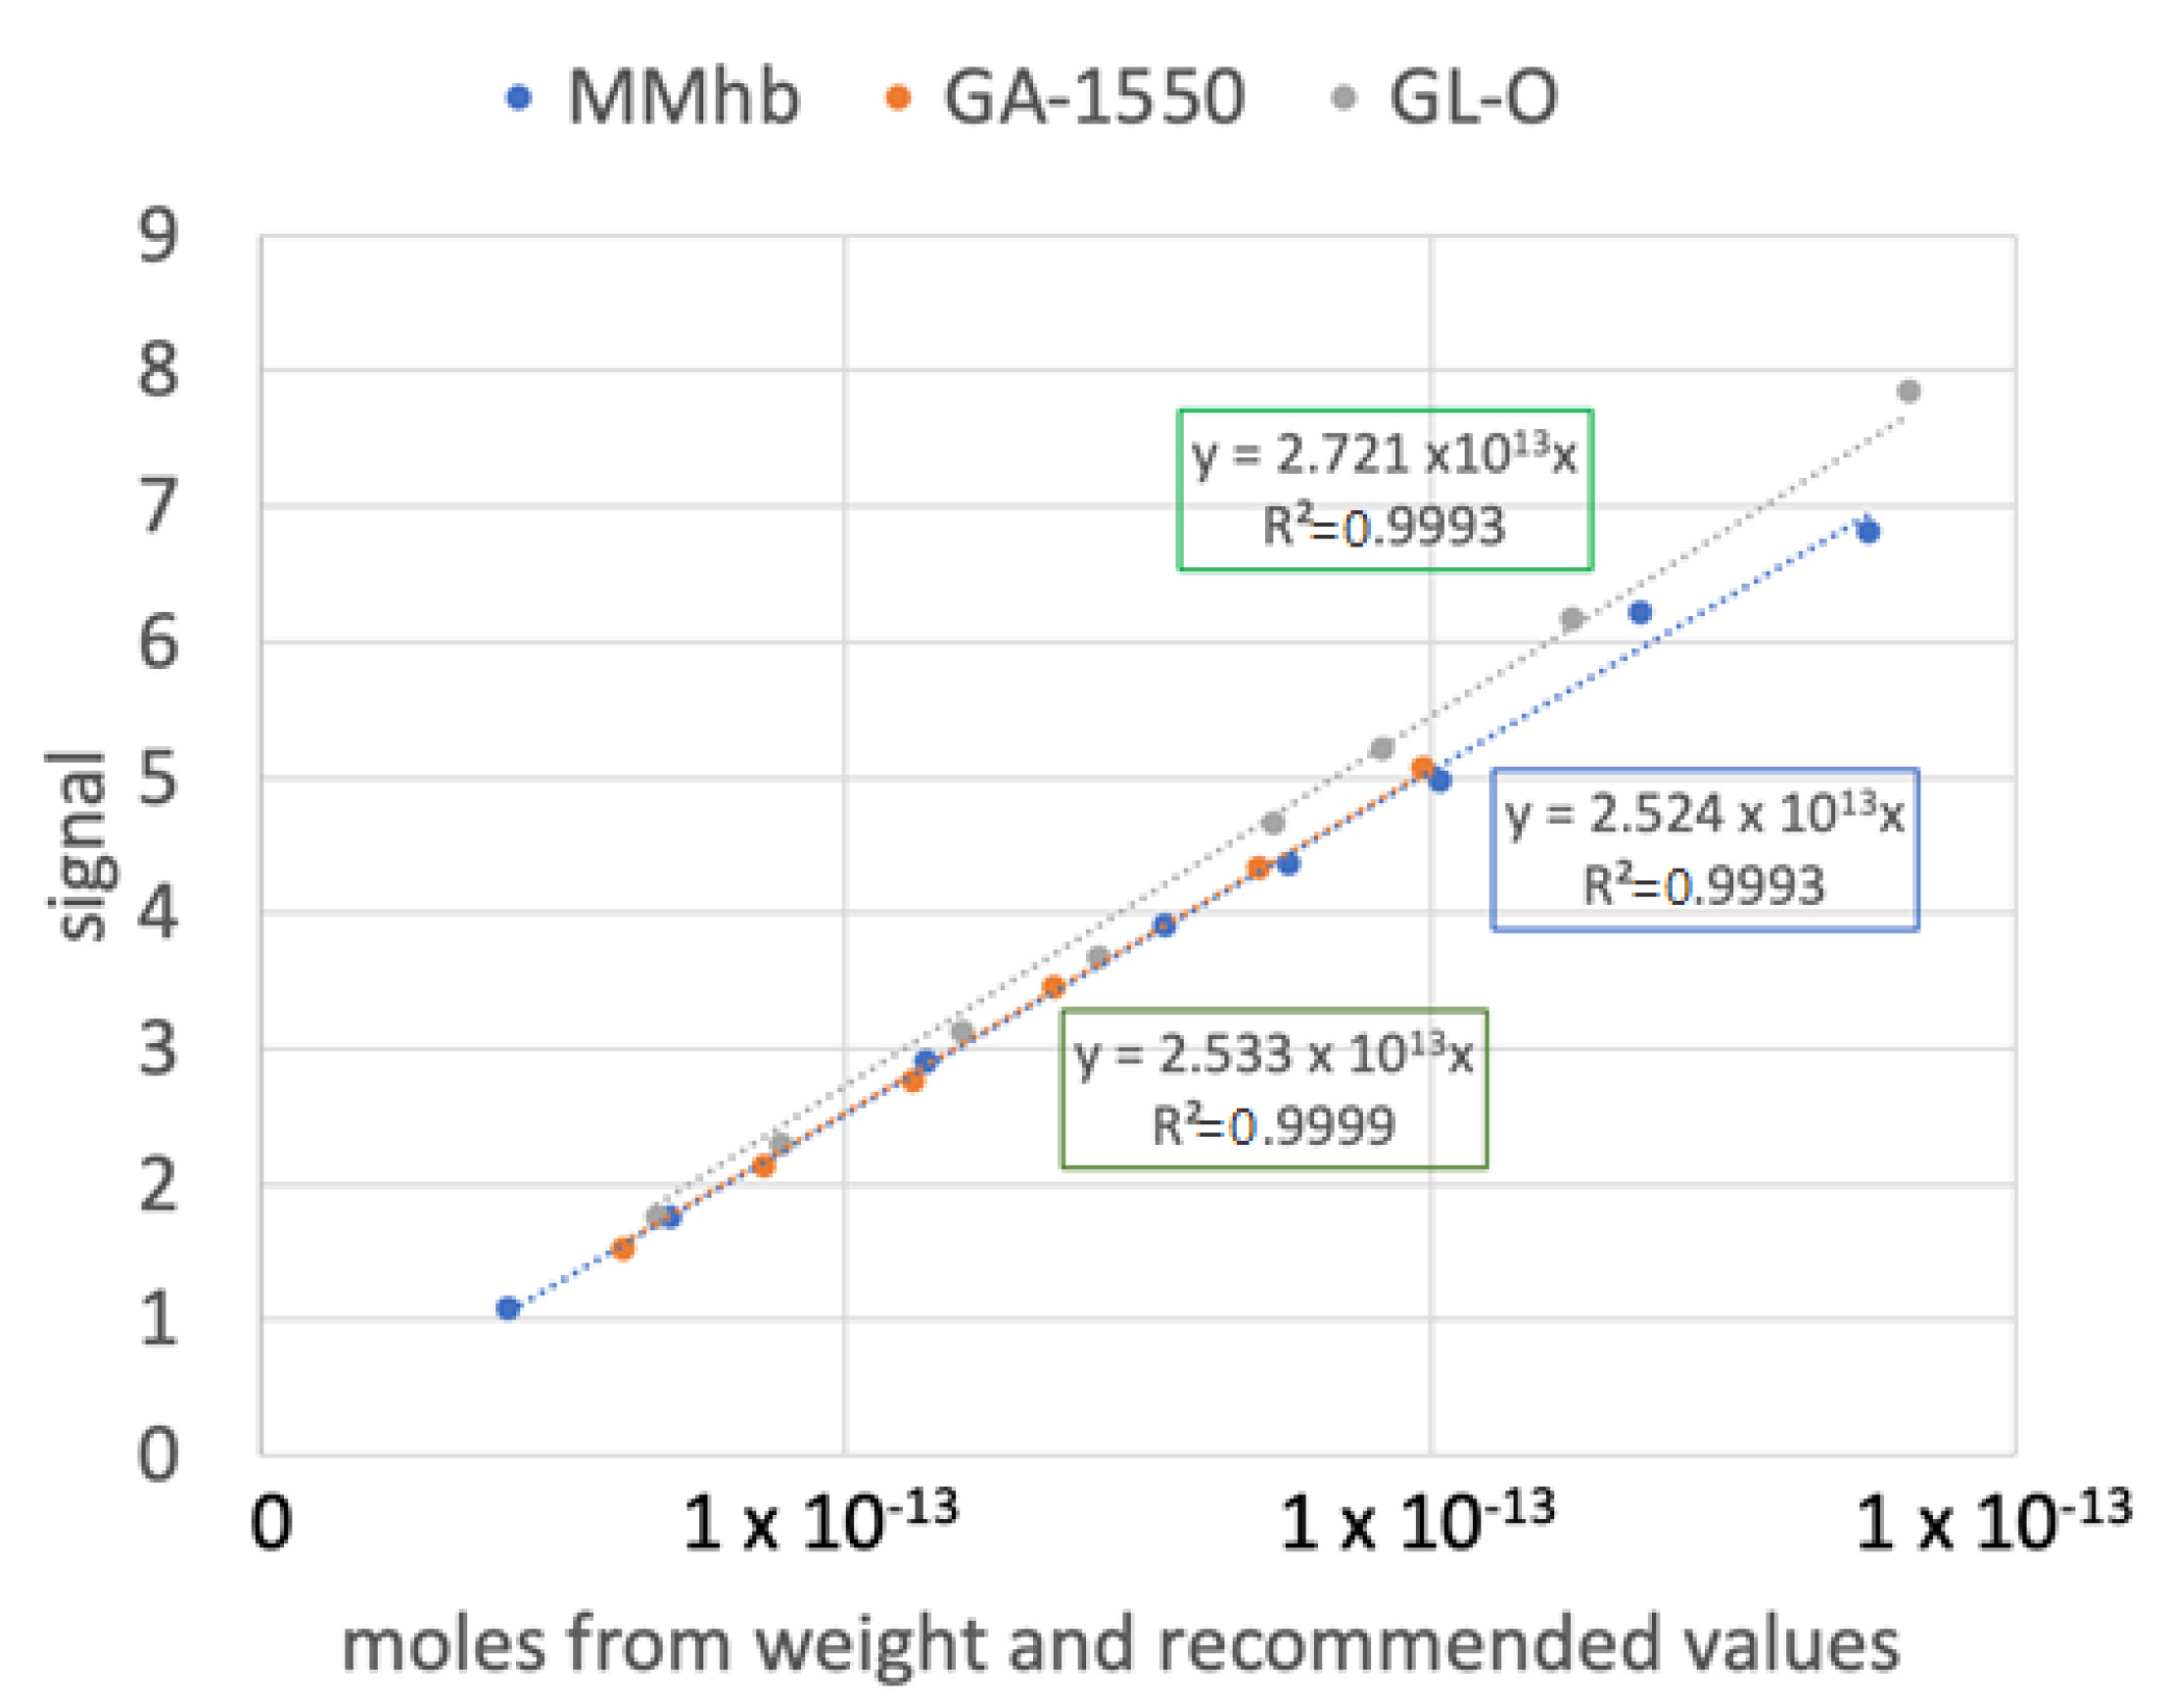
3.5. Results from K Measurements by Isotope Dilution

The K contents of sixteen degassed, dark green GL-O-1 grains in disk run 1428 measured by isotope dilution range from 6.178 to 6.674% with a weighted mean value of 6.490 ± 0.029% (Table S8). These data indicate that the K concentrations of those well-evolved, dark green GL-O-1 grains analyzed in this study are statistically indistinguishable at the 2σ level from the published bulk K value of 6.56 ± 0.06%.

4. Discussion

Traditional K/Ar dating involves analyses of Ar and K in separate aliquots and by separate methods. The 40Ar/39Ar method uses 39Ar produced in a nuclear reactor from reactions on 39K to yield a proxy for the 40K parent, which is measured in the same mass spectrometer run as the natural Ar isotopes. Obtaining results for Ar and K simultaneously is an obvious advantage, but glauconite pellets are formed of crystallites that are clay size particles, and thus, recoil loss during the irradiation process is a significant factor. For example, Smith et al. [5] encapsulated their individual pellets prior to irradiation and measured the 39Ar lost to recoil. They found 13.6% to 29.7% recoil loss on the GL-O-1 pellets measured and a range of age estimates from 88.3 to 99.2 Ma. Pellets that were dark green (this is the type we have selected) gave a smaller range of ages from 92.6 to 95.6 Ma (93.2–96.3 Ma using the decay constants of Min et al. [32] and the Fish Canyon sanidine age of 28.201 Ma from Kuiper et al. [32]; using ArAR recalculator—http://group18software.asu.edu/, URL accessed on 1 April, 2023) except for one grain with a rough surface that yielded 99.2 Ma and was interpreted as a relict. The four pellets with <15% recoil loss ranged from 92.4 to 94.7 Ma (93.0–95.3 Ma with decay constants from Min et al. [33] and Fish Canyon sanidine age of 28.201 from Kuiper et al. [34]). Two of those grains were black and two were dark green.
Boulesteix et al. [7] made visual observations and found that green to dark green pellets represent the greatest portion, with light green grains making up <10% and black grains making up 10%–15%. They found that black grains are coarser and mostly have a perfectly smooth outer surface. Their XRD measurements of powdered samples demonstrated a high degree of maturity, but they also found the presence of a less evolved component that constitutes ~6% by weight of the powder, which is consistent with the evaluation of mature Antarctic glauconites by Lopez-Quiros et al. [24]. Additionally, Boulesteix et al. [7] documented a peak at the most intense reflection for apatite, estimated to be about 1.5% by weight, and they further confirmed with microprobe analyses that hydroxyapatite is present. Of greatest relevance to the current study, Boulesteix et al. [7] measured Ar from 20 individual pellets that ranged from 21 to 222 μg and found an average concentration of 1.15 ± 0.093 nmol/g (7.8%). This result is in good agreement with our error-weighted mean of 1.169 ± 0.026 nmol/g.

4.1. Caveats and Potential for Future Improvements

This study was a learning process, and within the study timeframe, we were not able to achieve the ultimate goal of first picking the visually most mature samples, then characterizing them with non-destructive methods at the synchrotron, and then making the Ar and K measurements. The data reported here for the K/Ar are different samples than those measured at the synchrotron. The puck containing pellets that have been measured on TES and XFM has been misplaced (now found but not analyzed for Ar and K), and thus, the pellets were not available for K/Ar. The Ar measurements were made on GL-O pellets that were carefully selected under a microscope as visually mature pellets. Additionally, as pointed out by a reviewer, a complete survey would include both visually mature and less mature pellets in order to probe the full spectrum of results that could be found at the single pellet scale. This ideal workflow will have to be completed in a future study.

4.2. The Age of GL-O-1 and the Albian-Cenomanian Boundary

The age of GL-O-1 is important as the deposit is located very close to the Albian–Cenomanian boundary. The original 95.03 ± 1.11 Ma (1σ) from Odin et al. [2] (corrects to 95.26 Ma with the Min et al. [33 decay constants) is significantly younger than estimates of the boundary age based on volcanic deposits. Ando [4] determined an age of 100.8 ± 1.4 Ma for the boundary age in Hokkaido, Japan, which is consistent with the GTS2012 boundary estimate of 100.5 ± 0.4 Ma.
The GL-O-1 reference material was collected from a 2 m thick stratigraphic section at the Albian–Cenomanian boundary in Normandy, France [2]. Glauconite from a 2.5 m Cretaceous shelfal sequence from Langenstein, northern Germany, was characterized using petrographical, geochemical (EMP), and mineralogical (XRD) screening methods and in situ Rb-Sr dating via LA-ICP-MS/MS [35,36,37]. The obtained glauconite ages (~101 to 97 Ma) partly overlap with the depositional age of the Langenstein sequence (±3 Ma) but without the expected stratigraphic age progression, which the authors attributed to detrital and diagenetic illitic phase impurities inside the glauconites.
Our error-weighted mean result of 101.0 ± 0.3 Ma (1σ SEM, M.S.W.D. 0.54, n = 15/16, discarding one value that is 4σ SEM from mean; with all included, the value is 100.6 ± 0.3 Ma (1σ SEM, M.S.W.D. 2.04)) is shown in Figure 9, and the result is consistent with the in-situ Rb-Sr ages from Scheiblhofer et al. [37] and the U-Pb stratigraphic age control of 100.8 ± 1.4 or 99.6 ± 0.9 Ma for the Albian–Cenomanian boundary [4,8].
For the 16 visually mature pellets, all but one yielded a consistent age, but we did not see anything about the sample that would allow us to interpret this outlying result. If we had been able to make synchrotron measurements on these grains prior to the measurements, they might have revealed the reason for the one outlier. It is also puzzling that our K/Ar age estimates are not overlapping with the 40Ar/39Ar results of Smith et al. [5]. Future work is needed to resolve this apparent discrepancy. We suggest that it could be related to uncertainties in their monitor standard Hb3-gr, although they did tie it to a Fish Canyon sanidine age of 28.02 Ma, and we have taken this into account in the recalculations.

5. Conclusions

GL-O-1 has been used as a primary standard in K/Ar dating for some 30+ years, using the recommended 50–100 mg of GL-O-1 pellets [2]. However, the recommended 40Ar* and K contents by Odin et al. [2] may not be valid when single pellets are used. At the single pellet scale, the ages of GL-O-1 grains (including light green, green, dark green and black pellets) vary in the range of 109.1 to 80.8 Ma, as demonstrated by our recalculated K-Ar ages of these grains from the data of Boulesteix et al. [7] (Table S9), assuming K = 6.56% for each GL-O-1 grain and omitting the oldest age of 230.7 Ma. By carefully selecting those visually mature waxy, dark green pellets that contain no visible microscale veins or fractures on grain surfaces, we are able to significantly narrow this age distribution. We are optimistic that with additional initial screening using the synchrotron methods described here, as well as using newer noble gas instrumentation to improve the Ar precision, that we may be able to further reduce the scatter. Because our age estimate is nearly identical to the Albian–Cenomanian boundary of 100.8 ± 1.4 Ma in Hokkaido, Japan and the GTS2012 boundary of 100.5 ± 0.4 Ma [4], our data also lead us to suggest that the 3–5 Ma interval to form mature glauconite as stated in the literature (e.g., [5]) may actually be partly due to sample selection where immature grains may have residual detritus and may also be more subject to Ar loss. Although undoubtedly this is not the last word on it, our data suggest some promise for carefully selected GL-O pellets as a reference material for 40Ar calibration and the K/Ar dating of single glauconite grains.

Supplementary Materials

The following supporting information can be downloaded at: https://www.mdpi.com/article/10.3390/min13060773/s1, Analytical Details S1: Supplementary Ar and K ID detail; Table S1: K-XANES; Table S2: Fe-XANES; Table S3 and S4: XRD data from XRM and CMS; Tables S5–S9: details of Ar and K data and calculations.

Author Contributions

Conceptualization, S.R.H.; Data curation, T.L. and P.N.; Funding acquisition, S.R.H.; Investigation, S.R.H., T.L., S.N., E.T.R., H.C., A.C., R.L., R.T., S.W., M.D. and B.B.; Methodology, S.R.H., T.L., P.N., S.N., H.C., A.W., R.L., R.T., S.E.C. and J.E.; Project administration, S.R.H.; Resources, A.N.H.; Supervision, S.R.H.; Visualization, S.R.H., E.T.R. and A.W.; Writing—original draft, S.R.H. and T.L.; Writing—review and editing, S.R.H., T.L., P.N., S.N., E.T.R. and H.C. All authors have read and agreed to the published version of the manuscript.

Funding

This research was funded by The American Chemical Society Petroleum Research Fund, grant number ACS-ACSPRF PRF 62372-ND8 to SH. Additionally, NSF ANT Earth Sciences provided an EAGER grant to SH to develop glauconite measurement strategies, including partial support for the diode laser (1241574), NSF ANT Glaciology provided an EAGER grant to SH evaluate the combined K/Ar and multi-proxy geochemical provenance study of ice core and other small terrigenous sediment samples which requires similar encapsulation strategies (2032849). The Lamont Climate Center provided a pilot grant to HC to set up the K isotope dilution method.

Data Availability Statement

The data will be made fully available in Supplementary Materials when published.

Acknowledgments

This project has been gestating for a long time, and many people have helped with various aspects. We thank BGC (Tim Becker and Nicholas D Fylstra) for being the source of capacitor tubes, Pete Reiners for niobium tubes, Dave Barbeau for inspiration to develop glauconite K/Ar measurements, Chason Goldsmith for doing some initial tests of the tantalum foil packets, Art Lerner-Lam in the LDEO Directorate for partial support for the diode laser, Joerg Schaefer for contributing partial support for the diode laser, Lamont’s Climate Center for partial support of the diode laser, including a glauconite pilot project, TEMC (Tender Energy Microspectroscopy Consortium) for beamtime allocation and support at TES, Yonghua Du at the TES beamline, and Celine Martin for help with the AMNH microprobe. This research used beamlines 11-BM, 8-BM, and 4-BM of the National Synchrotron Light Source II, a U.S. Department of Energy (DOE) Office of Science User Facility operated for the DOE Office of Science by Brookhaven National Laboratory under Contract No. DE-SC0012704. The authors also thank two anonymous reviewers and guest editor for their critical reviews of the manuscript.

Conflicts of Interest

The authors declare no conflict of interest. The funders had no role in the design of the study; in the collection, analyses, or interpretation of data; in the writing of the manuscript; or in the decision to publish the results.

References

  1. Harland, W.B.; Armstrong, R.L.; Cox, A.L.; Craig, L.E.; Smith, A.G. A Geologic Time Scale 1989; Cambridge University Press: Cambridge, UK, 1990. [Google Scholar]
  2. Interlaboratory Standards for Dating Purposes. In Numerical Dating in Stratigraphy; Gilles, O. (Ed.) Wiley: Chichester, UK, 1982; pp. 123–148. [Google Scholar]
  3. Craig, L.E.; Smith, A.G.; Armstrong, R.L. Calibration of the Geologic Time Scale: Cenozoic and Late Cretaceous Glauconite and Nonglauconite Dates Compared. Geology 1989, 17, 830. [Google Scholar] [CrossRef]
  4. Ando, A. Recent Contributions to the Standard Albian/Cenomanian Boundary Chronology from Hokkaido, Japan: A Review for Data Reintegration and Numerical Age Recalibration. Cretac. Res. 2016, 64, 50–58. [Google Scholar] [CrossRef]
  5. Smith, P.E.; Evensen, N.M.; York, D.; Odin, G.S. Single-Grain 40Ar-39Ar Ages of Glauconies: Implications for the Geologic Time Scale and Global Sea Level Variations. Science 1998, 279, 1517–1519. [Google Scholar] [CrossRef]
  6. Odin, G.S.; Morton, A.C. Chapter 4 Authigenic Green Particles From Marine Environments. In Developments in Sedimentology; Elsevier: Amsterdam, The Netherlands, 1988; Volume 43, pp. 213–264. ISBN 978-0-444-42922-3. [Google Scholar]
  7. Boulesteix, T.; Solé, J.; Pi, T.; Cathelineau, M. Reappraisal of the GL-O Reference Material for K-Ar Dating: New Insight from Microanalysis, Single-Grain and Milligram Ar Measurements. Geostand. Geoanal. Res. 2020, 44, 287–306. [Google Scholar] [CrossRef]
  8. Selby, D. U-Pb Zircon Geochronology of the Aptian/Albian Boundary Implies That the GL-O International Glauconite Standard Is Anomalously Young. Cretac. Res. 2009, 30, 1263–1267. [Google Scholar] [CrossRef]
  9. Hemming, S.R.; Hall, C.M.; Biscaye, P.E.; Higgins, S.M.; Bond, G.C.; McManus, J.F.; Barber, D.C.; Andrews, J.T.; Broecker, W.S. 40Ar/39Ar Ages and 40Ar* Concentrations of Fine-Grained Sediment Fractions from North Atlantic Heinrich Layers. Chem. Geol. 2002, 182, 583–603. [Google Scholar] [CrossRef]
  10. Gombiner, J.H.; Hemming, S.R.; Hendy, I.L.; Bryce, J.G.; Blichert-Toft, J. Isotopic and Elemental Evidence for Scabland Flood Sediments Offshore Vancouver Island. Quat. Sci. Rev. 2016, 139, 129–137. [Google Scholar] [CrossRef]
  11. Hemming, S.R. New K/Ar Age Values and Context from Published Clay Mineralogy and Sr and Nd Isotopes as Tracers of Terrigenous Atlantic Ocean Sediments. Mar. Geol. 2019, 411, 36–50. [Google Scholar] [CrossRef]
  12. Portier, A.M.; Thierens, M.; Martin, E.E.; Hemming, S.R.; Gombiner, J.H.; Raymo, M.E. Late Pleistocene Emergence of Crystalline Canadian Shield Sources in Sediments of the Northern Gulf of Mexico. Paleoceanogr. Paleoclimatol. 2021, 36, e2020PA004082. [Google Scholar] [CrossRef]
  13. Bailey, I.; Hole, G.M.; Foster, G.L.; Wilson, P.A.; Storey, C.D.; Trueman, C.N.; Raymo, M.E. An Alternative Suggestion for the Pliocene Onset of Major Northern Hemisphere Glaciation Based on the Geochemical Provenance of North Atlantic Ocean Ice-Rafted Debris. Quat. Sci. Rev. 2013, 75, 181–194. [Google Scholar] [CrossRef]
  14. Coffey, G.L.; Savage, H.M.; Polissar, P.J.; Cox, S.E.; Hemming, S.R.; Winckler, G.; Bradbury, K.K. History of Earthquakes along the Creeping Section of the San Andreas Fault, California, USA. Geology 2022, 50, 516–521. [Google Scholar] [CrossRef]
  15. Northrup, P. The TES Beamline (8-BM) at NSLS-II: Tender-Energy Spatially Resolved X-Ray Absorption Spectroscopy and X-Ray Fluorescence Imaging. J. Synchrotron Radiat. 2019, 26, 2064–2074. [Google Scholar] [CrossRef] [PubMed]
  16. Ravel, B.; Newville, M. ATHENA, ARTEMIS, HEPHAESTUS: Data Analysis for X-Ray Absorption Spectroscopy Using IFEFFIT. J. Synchrotron Radiat. 2004, 12 Pt 4, 537–541. [Google Scholar]
  17. Kraft, S.; Stumpel, J.; Becker, P.; Kuetgens, U. High-Resolution X-Ray Absorption Spectroscopy with Absolute Energy Calibration for the Determination of Absorption Edge Energies. Rev. Sci. Instrum. 1996, 67, 681–687. [Google Scholar] [CrossRef]
  18. Newville, M. Larch: An Analysis Package for XAFS and Related Spectroscopies. J. Phys. Conf. Ser. 2013, 430, 12007. [Google Scholar] [CrossRef]
  19. Prescher, C.; Prakapenka, V.B. DIOPTAS: A Program for Reduction of Two-Dimensional X-Ray Diffraction Data and Data Exploration. High Press. Res. 2015, 35, 223–230. [Google Scholar] [CrossRef]
  20. Yager, K. SciToolsSciAnalysis 2.6.5. 2015. Available online: https://pypi.org/project/SciToolsSciAnalysis/ (accessed on 1 June 2023).
  21. McDougall, I.; Roksandic, Z. Total Fusion 40Ar/39Ar Ages Using Hifar Reactor. J. Geol. Soc. Aust. 1974, 21, 81–89. [Google Scholar] [CrossRef]
  22. Renne, P.R.; Swisher, C.C.; Deino, A.L.; Karner, D.B.; Owens, T.L.; DePaolo, D.J. Intercalibration of Standards, Absolute Ages and Uncertainties in 40Ar/39Ar Dating. Chem. Geol. 1998, 145, 117–152. [Google Scholar] [CrossRef]
  23. Samson, S.D.; Alexander, E.C. Calibration of the Interlaboratory 40Ar 39Ar Dating Standard, MMhb-1. Chem. Geol. Isot. Geosci. Sect. 1987, 66, 27–34. [Google Scholar] [CrossRef]
  24. López-Quirós, A.; Escutia, C.; Sánchez-Navas, A.; Nieto, F.; Garcia-Casco, A.; Martín-Algarra, A.; Evangelinos, D.; Salabarnada, A. Glaucony Authigenesis, Maturity and Alteration in the Weddell Sea: An Indicator of Paleoenvironmental Conditions before the Onset of Antarctic Glaciation. Sci. Rep. 2019, 9, 13580. [Google Scholar] [CrossRef]
  25. Marcus, M.A.; Westphal, A.J.; Fakra, S.C. Classification of Fe-Bearing Species from It K-Edge XANES Data Using Two-Parameter Correlation Plots. J. Synchrotron Radiat. 2008, 15, 463–468. [Google Scholar] [CrossRef] [PubMed]
  26. Chen, H.; Saunders, N.J.; Jerram, M.; Halliday, A.N. High-Precision Potassium Isotopic Measurements by Collision Cell Equipped MC-ICPMS. Chem. Geol. 2021, 578, 120281. [Google Scholar] [CrossRef]
  27. Wang, F.; Shi, W.; Guillou, H.; Zhang, W.; Yang, L.; Wu, L.; Wang, Y.; Zhu, R. A New Unspiked K-Ar Dating Approach Using Laser Fusion on Microsamples. Rapid Commun. Mass Spectrom. 2019, 33, 587–599. [Google Scholar] [CrossRef] [PubMed]
  28. Jourdan, F.; Renne, P.R. Age Calibration of the Fish Canyon Sanidine 40Ar/39Ar Dating Standard Using Primary K–Ar Standards. Geochim. Et Cosmochim. Acta 2007, 71, 387–402. [Google Scholar] [CrossRef]
  29. Jourdan, F.; Verati, C.; Féraud, G. Intercalibration of the Hb3gr 40Ar/39Ar Dating Standard. Chem. Geol. 2006, 231, 177–189. [Google Scholar] [CrossRef]
  30. Charbit, S.; Guillou, H.; Turpin, L. Cross Calibration of K–Ar Standard Minerals Using an Unspiked Ar Measurement Technique. Chem. Geol. 1998, 150, 147–159. [Google Scholar] [CrossRef]
  31. McDougall, I.; Wellman, P. Calibration of GA1550 Biotite Standard for K/Ar and 40Ar/39Ar Dating. Chem. Geol. 2011, 280, 19–25. [Google Scholar] [CrossRef]
  32. Min, K.; Mundil, R.; Renne, P.R.; Ludwig, K.R. A Test for Systematic Errors in 40Ar/39Ar Geochronology through Comparison with U/Pb Analysis of a 1.1-Ga Rhyolite. Geochim. Et Cosmochim. Acta 2000, 64, 73–98. [Google Scholar] [CrossRef]
  33. Redaa, A.A. New Geochronological Tool for Cu-Au Mineralisation in the Arabian Shield, Saudi Arabia: Testing In-Situ Rb-Sr Dating via LA-ICP-MS/MS. Ph.D. Thesis, The University of Adelaide, Adelaide, Australia, 2022. [Google Scholar]
  34. Kuiper, K.F.; Deino, A.; Hilgen, F.J.; Krijgsman, W.; Renne, P.R.; Wijbrans, J.R. Synchronizing Rock Clocks of Earth History. Science 2008, 320, 500–504. [Google Scholar] [CrossRef]
  35. Baldermann, A.; Warr, L.N.; Letofsky-Papst, I.; Mavromatis, V. Substantial Iron Sequestration during Green-Clay Authigenesis in Modern Deep-Sea Sediments. Nat. Geosci. 2015, 8, 885–889. [Google Scholar] [CrossRef]
  36. Baldermann, A.; Dietzel, M.; Mavromatis, V.; Mittermayr, F.; Warr, L.N.; Wemmer, K. The Role of Fe on the Formation and Diagenesis of Interstratified Glauconite-Smectite and Illite-Smectite: A Case Study of Upper Cretaceous Shallow-Water Carbonates. Chem. Geol. 2017, 453, 21–34. [Google Scholar] [CrossRef]
  37. Scheiblhofer, E.; Moser, U.; Löhr, S.; Wilmsen, M.; Farkaš, J.; Gallhofer, D.; Bäckström, A.M.; Zack, T.; Baldermann, A. Revisiting Glauconite Geochronology: Lessons Learned from In Situ Radiometric Dating of a Glauconite-Rich Cretaceous Shelfal Sequence. Minerals 2022, 12, 818. [Google Scholar] [CrossRef]
Figure 1. (left) XRD patterns for glaucony with various degrees of K enrichment. Note the increasing sharpness and decreasing distance of the 001 peak from the 020 peak, which was interpreted by Odin and Morten [8] as a measure of glauconite maturity. These data were presented by Odin and Morten [6] without numerical values on the X-axis, and the 2-theta values were estimated by correlating the trace with 6.59% K with published GL-O-1 XRD data [7]. The data from Boulesteix et al. [7] are shown in the top profile, with CoKa radiation produced at an accelerating voltage of 45 kV and a filament current of 40 mA. (right) Plot of D-spacing of 001 (calculated from the estimated 2-theta) and K concentration of glaucony using the values shown in the left graph for open symbols and GL-O-1 data from Boulesteix et al. [7] for the solid symbol.
Minerals 13 00773 g001
Figure 2. Elemental mapping of 3 polished pellets of GL-O-1. Pixel size 2.4 μm, incident energy 3850 eV, focused beam size 2 × 3 μm. (AC) Maps of K. Red lines indicate the transects shown in (DF). (DF) K scans across the lines shown in (AC). (GI) Maps of P (red), S (green) and Si (blue) from the same pellets as in (AC). Red bar is 0.1 mm.
Minerals 13 00773 g002
Figure 3. Elemental mapping of 2 whole pellets of GL-O-1. Pixel size 2.4 μm, incident energy 3850 eV, focused beam size 2 × 3 μm. (A,B) Maps of K. (C,D) Maps of P (red), S (green) and Si (blue) on the same pellets as in (A,B). Red bar is 0.1 mm.
Minerals 13 00773 g003
Figure 4. To estimate the homogeneity of the K, regions of interest (ROI) are drawn to include the smooth portions of the pellets. (A) Map of K on the polished pellet surface. The ROI was defined to avoid cracks and pits, and it yielded the following statistics: area 0.0495 μm2, 8762 pixels, mean signal 0.01422 ± 0.00063 (1σ). (B) Map of K on whole grain sample. Two ROIs picked to avoid pits and cracks yielded average intensities of 0.0140 ± 0.0030 and 0.0137 ± 0.0029. (C) Map of a second whole pellet. ROI avoiding pits and cracks yielded area 0.432 μm2, 2893 pixels, mean 0.01414 ± 0.00304. Transect for (D) is shown as the diagonal red line. (D) Transect of K signal across the pellet in (C).
Minerals 13 00773 g004
Figure 5. K XANES from a polished grain of GL-O-1 (top curve, same pellet as in Figure 2C), focused beam size 2 × 3 μm. Bottom three curves are K XANES from the surfaces of whole GL-O-1 pellets (including the pellet in Figure 4C). Full data provided in Table S1.
Minerals 13 00773 g005
Figure 6. (A,B) XRF map collected at XFM showing the distribution of Fe, Ca, and K on two GL-O-1 pellets. Diamond symbols mark the spots where Fe XANES measurements and XRD patterns (Figure 7) were collected. (C) Fe XANES from the surfaces of the pellets shown in (A,B). Fe XANES reference spectra of ferrosmectite, pyrite, biotite, ferrihydrite 2 L, and illite are also shown [25]. Full data provided in Table S2.
Minerals 13 00773 g006
Figure 7. XRD scans of GL-O-1. Y-axes omitted for clarity. Data provided in Tables S3 and S4. The black curve in the middle is the powdered sample from Boulesteix et al. [7]. (Top curves) are 9 traces measured at the CMS beamline from individual GL-O-1 pellets. D-spacing values were multiplied by 10/10.2 to make the peaks from CMS line up with the other scans. (Bottom curves) are 11 traces measured at the XFM beamline from the same two individual whole pellets as shown in Figure 3, Figure 4, Figure 5 and Figure 6. Traces have been flattened based on measurements of the holder.
Minerals 13 00773 g007
Figure 8. Apparent sensitivity of the mass spectrometer based on recommended values of GA-1550, MMhb, and GL-O-1. Note the ~10% higher apparent sensitivity of GL-O-1 compared to the other two. Data are reported in Table S6.
Minerals 13 00773 g008
Figure 9. K/Ar ages of 16 individual pellets analyses for this study (run disk 1428). Error bars are shown at 1σ. The average of all 16 values is 100.6 ± 0.3 Ma (1σ SEM), M.S.W.D. 2.04, and leaving out the outlier, the average is 101.0 ± 0.3 Ma (1σ SEM), M.S.W.D. 0.54. The blue-shaded box marks the 2σ SEM for the 15 accepted samples. Data are reported in Table S5.
Minerals 13 00773 g009
Disclaimer/Publisher’s Note: The statements, opinions and data contained in all publications are solely those of the individual author(s) and contributor(s) and not of MDPI and/or the editor(s). MDPI and/or the editor(s) disclaim responsibility for any injury to people or property resulting from any ideas, methods, instructions or products referred to in the content.

