Article

Phosphate Petrochronology of the Belcina REE Mineralization (Ditrău Alkaline Massif, Romania)

1
Department of Lithospheric Research, University of Vienna, Josef-Holaubek-Platz 2, 1090 Vienna, Austria
2
Institute of Earth Sciences, Faculty of Natural Sciences, University of Silesia in Katowice, 41-200 Sosnowiec, Poland
3
Department of Geology, University Alexandru Ioan Cuza of Iasi, Boulevard Carol I, 20 A, 700506 Iasi, Romania
*
Author to whom correspondence should be addressed.
Minerals 2023, 13(6), 739; https://doi.org/10.3390/min13060739
Submission received: 3 May 2023 / Revised: 17 May 2023 / Accepted: 23 May 2023 / Published: 30 May 2023
(This article belongs to the Section Mineral Geochemistry and Geochronology)

Abstract

:
A notable REE mineralization in Europe is associated with the Ditrău Alkaline Massif (DAM) in the Eastern Carpathians (Romania). It is an expression of the latest hydrothermal phase in the DAM and is found in the form of mineralized carbonate veins cross-cutting the complex in the NW (Jolotca region) and the SE (Belcina region) parts of the DAM. In the Belcina veins monazite-(Ce), xenotime-(Y) and apatite, together with Fe-Mg-rich carbonate, thorite, thorogummite, gedrite and plagioclase are rock-forming. Three different textural and chemical types of the monazite-(Ce) and the xenotime-(Y) document a three-stage evolution. The relative phosphate age succession (from older to younger) thereby is xnt1 > xnt2 (>)+ mnz1 + Fe2O3 + Fe-gedrite > mnz2 + Fe-dolomite (+ plagioclase) > mnz3 + xnt3 + apatite. Phosphate chemistry shows that these crystallized from hydrothermal fluids, whereby each phosphate type follows a separate evolutionary path suggesting growth from (at least) three independent and successive hydrothermal fluids. Chemistry and pathways within the DAM suggest that these hydrothermal fluids could be derived from a subsurface carbonatitic intrusion. Mnz1,2 and xnt1,2 ages are tightly clustered at 215.8 ± 0.7 Ma (Norian, Upper Triassic). The third-generation phosphate ages are younger, but are associated with large analytical uncertainties and did not deliver geologically useful ages. The mean age of ca. 216 Ma is interpreted as the timing of the Belcina REE mineralization, which together with the fluid chemistry, supports a model of the presence of a late-stage, independent carbonatitic intrusion about 10 Ma after the main igneous activity (ca. 235–225 Ma) forming the DAM, synchronous with extension-related magmatism in the region.

1. Introduction

Alkaline rocks are a minor but important component of the continental crust. They usually contain significant amounts of rare metals such as Li, Be, Nb, Ta, Zr, Th, REE and volatile components, mainly F and Cl. One of the most notable REE mineralization in Europe, having significant economic importance, is associated with the ca. 235–225 Ma Ditrău Alkaline Massif DAM) in the Eastern Carpathians of Romania (Figure 1, [1,2]). REE-rich mineralized veins are found within the alkaline complex at Jolotca, and outside the complex in the Belcina region (Figure 2).
The Belcina carbonate vein REE mineralization is localized in the ESE of the DAM within the metamorphic Cambrian Putna Nappe (Figure 2; e.g., [3,4,5,6]). The first mineralogical description of the Belcina carbonate vein REE mineralization was given by [7] that was subsequently complemented by [8], and references therein. A thorite ((Th,U)SiO4), thorogummite ((Th,U)(SiO4)1−x(OH)4x), xenotime-(Y) (YPO4) paragenesis represent the characteristic mineral association of the Belcina mineralization. Other common minerals are monazite-(Ce) and Th-rich apatite, zircon, Nb-rutile, ferrocolumbite, Y-fluorite, and minor amounts of Nb-Ta-pyrochlores, brabantite, allanite, REE(Y)-carbonates (e.g., bastnaesite), Fe-oxides and hydroxides (magnetite, hematite, goethite, lepidocrocite), sulfides (pyrite, arsenopyrite, galena, sphalerite, chalcopyrite, tetrahedrite, molybdenite, cinnabar) and native mercury. The gangue associated with the mineralization is formed by feldspars (microcline, albite, orthoclase), quartz, different carbonates of at least two generations (calcite, ferrodolomite, siderite), natrolite, pectolite and chlorites [8]. According to [9] the mineral succession found in the Belcina mineralization is apatite > xenotime-(Y) > thorite. The Belcina mineralization is genetically linked to the Lăzarea nepheline syenite suite [4,6]. However, [5] stated that the fluid responsible for the mineralization is connected to a late-stage hydrothermal overprinting event. Preliminary mineral data suggest that xenotime-(Y) has a constant and relatively pure composition with about Y2O3 ~ 60–62 weight-% and P2O5 ~ 38–40 weight-% [8]. On the other hand, [9] reports that the xenotime-(Y) is rich in HREE with up to 6 weight-% Dy, 5 weight-% Yb, 4 weight-% Gd and Er. A more detailed mineralogical description of the Belcina veins is given in [8,9].
Figure 1. Geological sketch map of the Ditrău Alkaline Massiv modified after [2,5]. The location of the Belcina sample is indicated by the yellow star. The inset shows the position of the Ditrău Alkaline Massiv within the Eastern Carpathians of Romania.
Minerals 13 00739 g001
Figure 2. Detailed geological sketch map of the SE part of the Ditrău Alkaline Massiv modified after [5,6]. The location of the investigated carbonate mineralized vein sample in the Belcina valley is indicated by the red star.
Minerals 13 00739 g002
The total concentration of REE in an average bulk continental crust is ca. 125 ppm [10]. Enrichment of the REE may occur through primary processes such as magmatic processes and hydrothermal fluid mobilization and precipitation or through secondary processes such as sedimentary concentration or weathering [11]. What remains to be understood are the specific relations between the degree of mineralization and the underlying processes, the petrology and the age systematics of such rock suites. Monazite-(Ce) and xenotime-(Y) belong to the most important carriers of REEs. A detailed study of their composition, stability and breakdown processes provides us with an understanding of REE relationships and processes that occur during petrogenesis and evolution of the parental rock ([12,13,14,15,16,17,18,19] and references therein). Although numerous geochronological studies have been published from the DAM (for reviews see [1,2]) no dating of the Jolotca and Belcina REE mineralizations has yet been undertaken.
Here, we report the mineral chemistry and the growth-age systematics of monazite-(Ce) and xenotime-(Y) from a late-stage REE mineralized carbonate vein situated in the contact aureole of the DAM in the Belcina region, and then integrate and discuss these data into existing evolutionary models of the DAM [1,2,5,20].

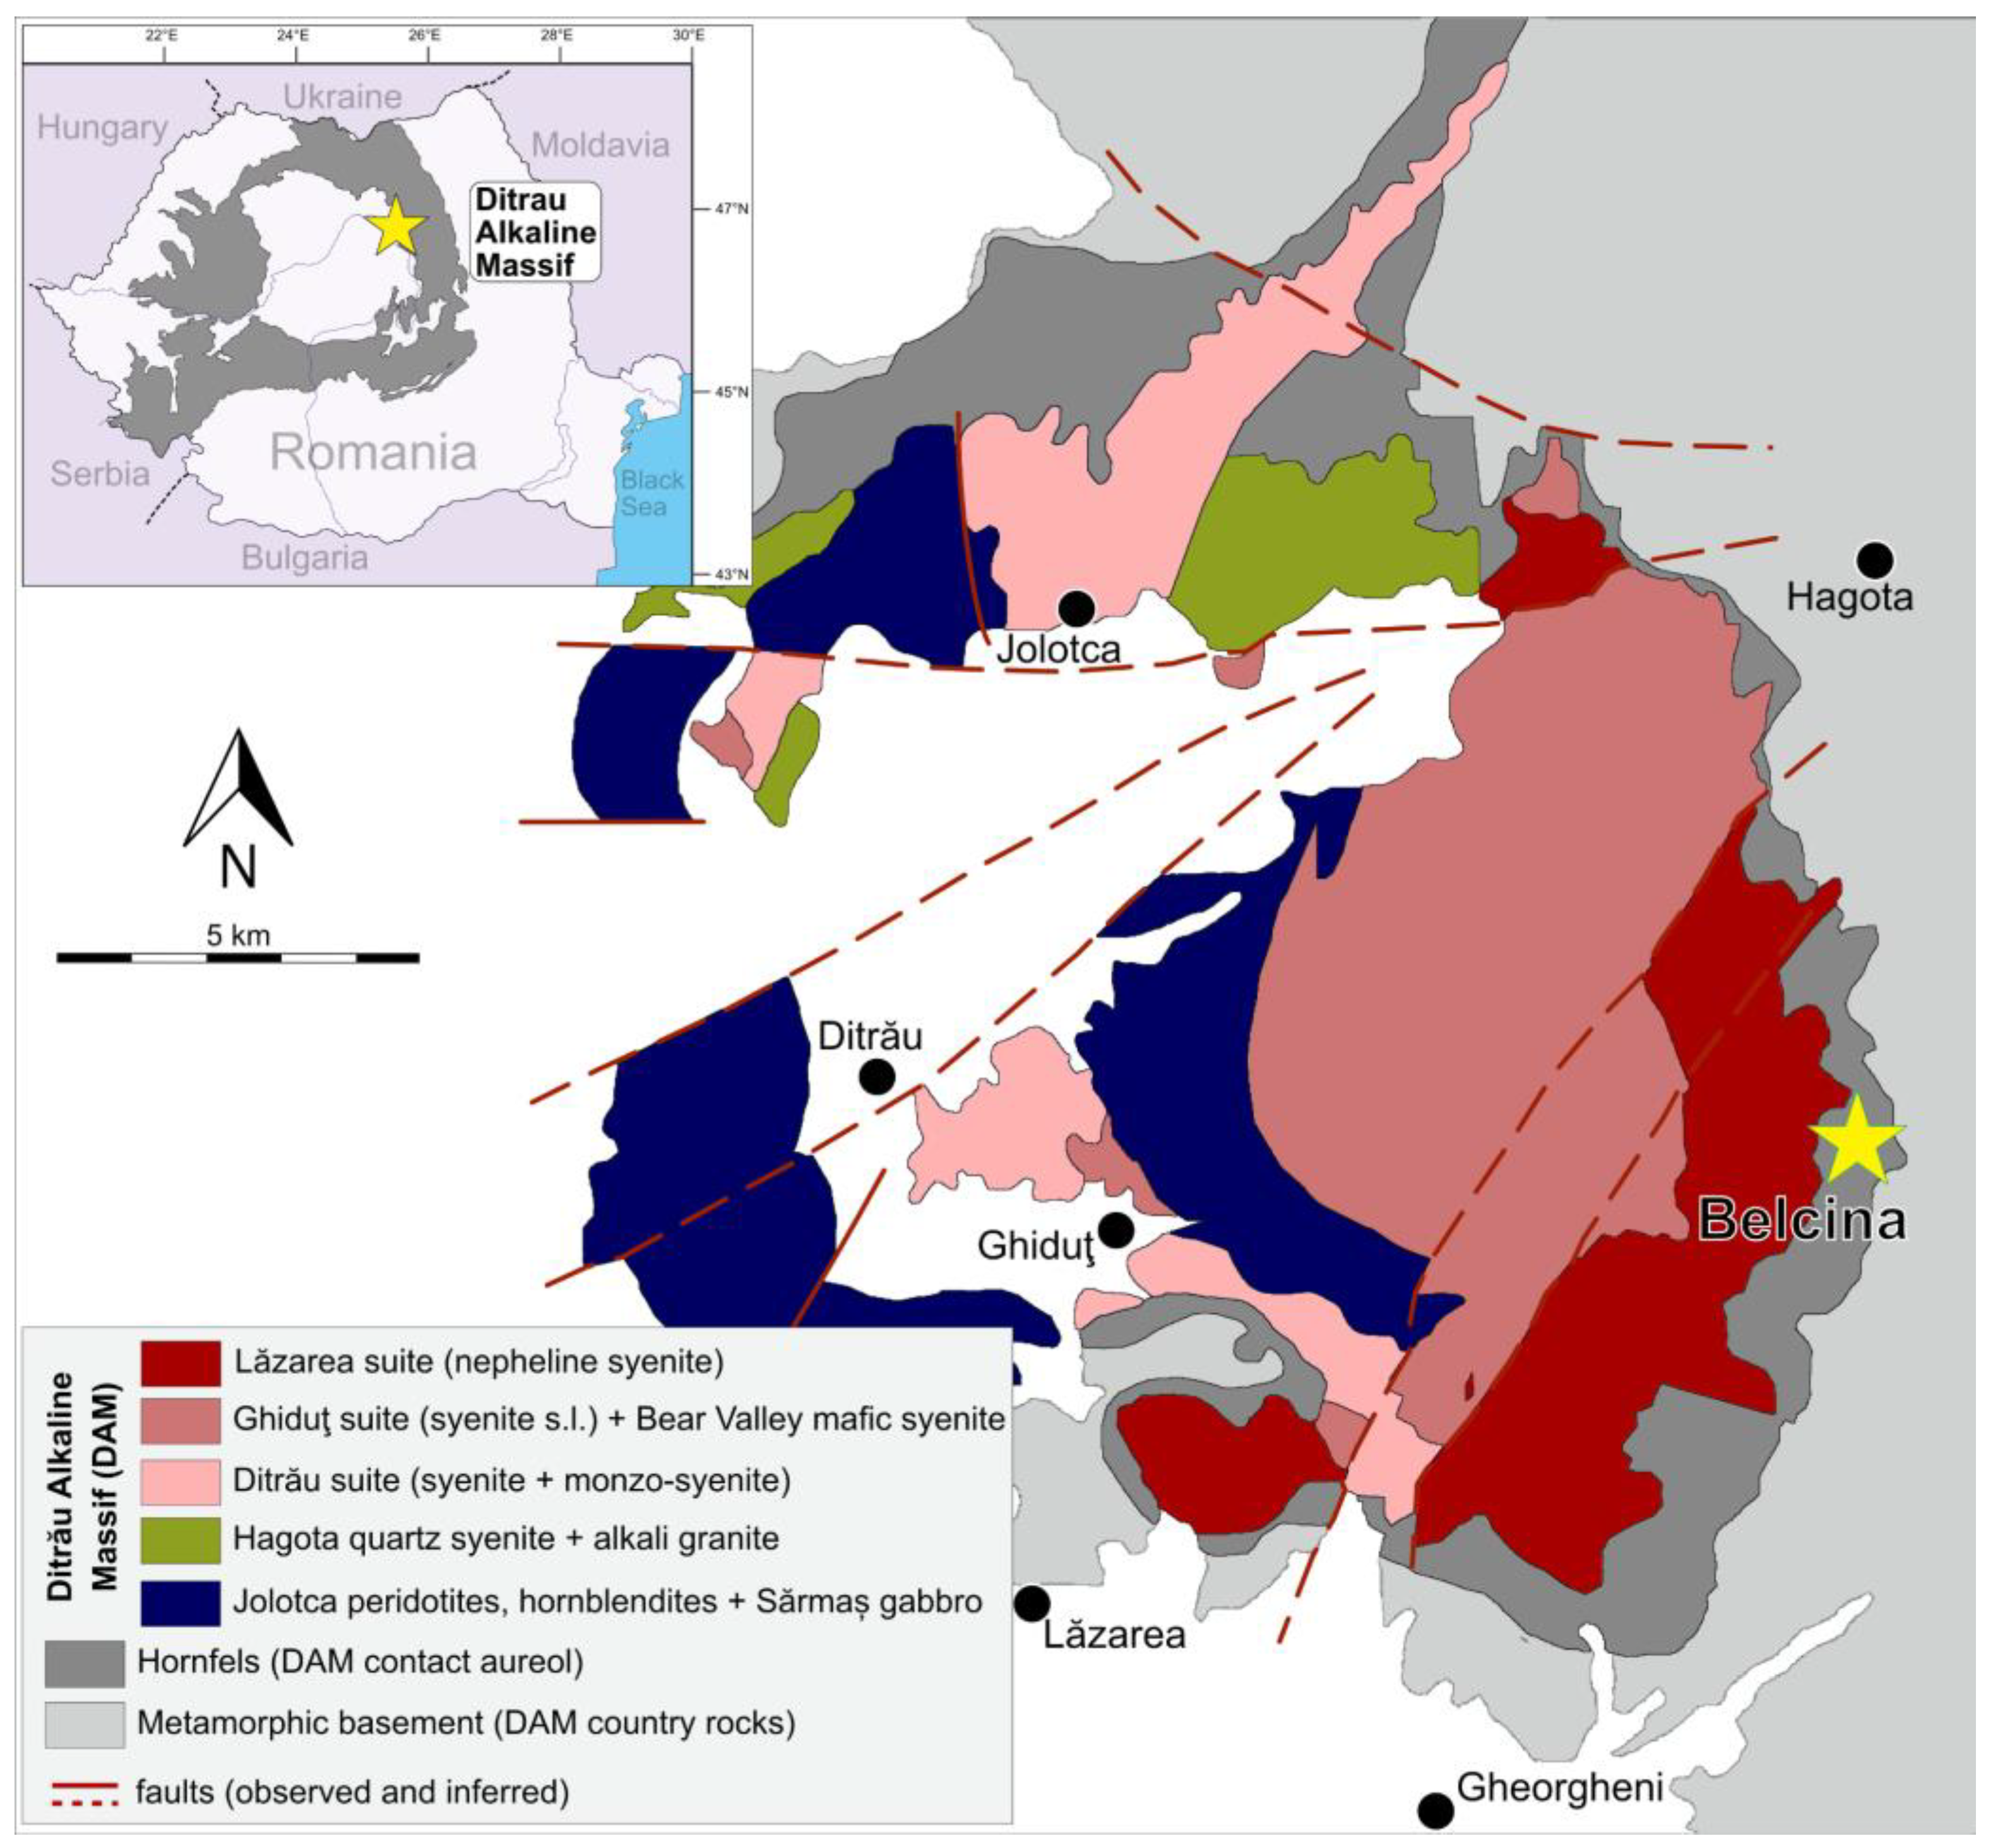
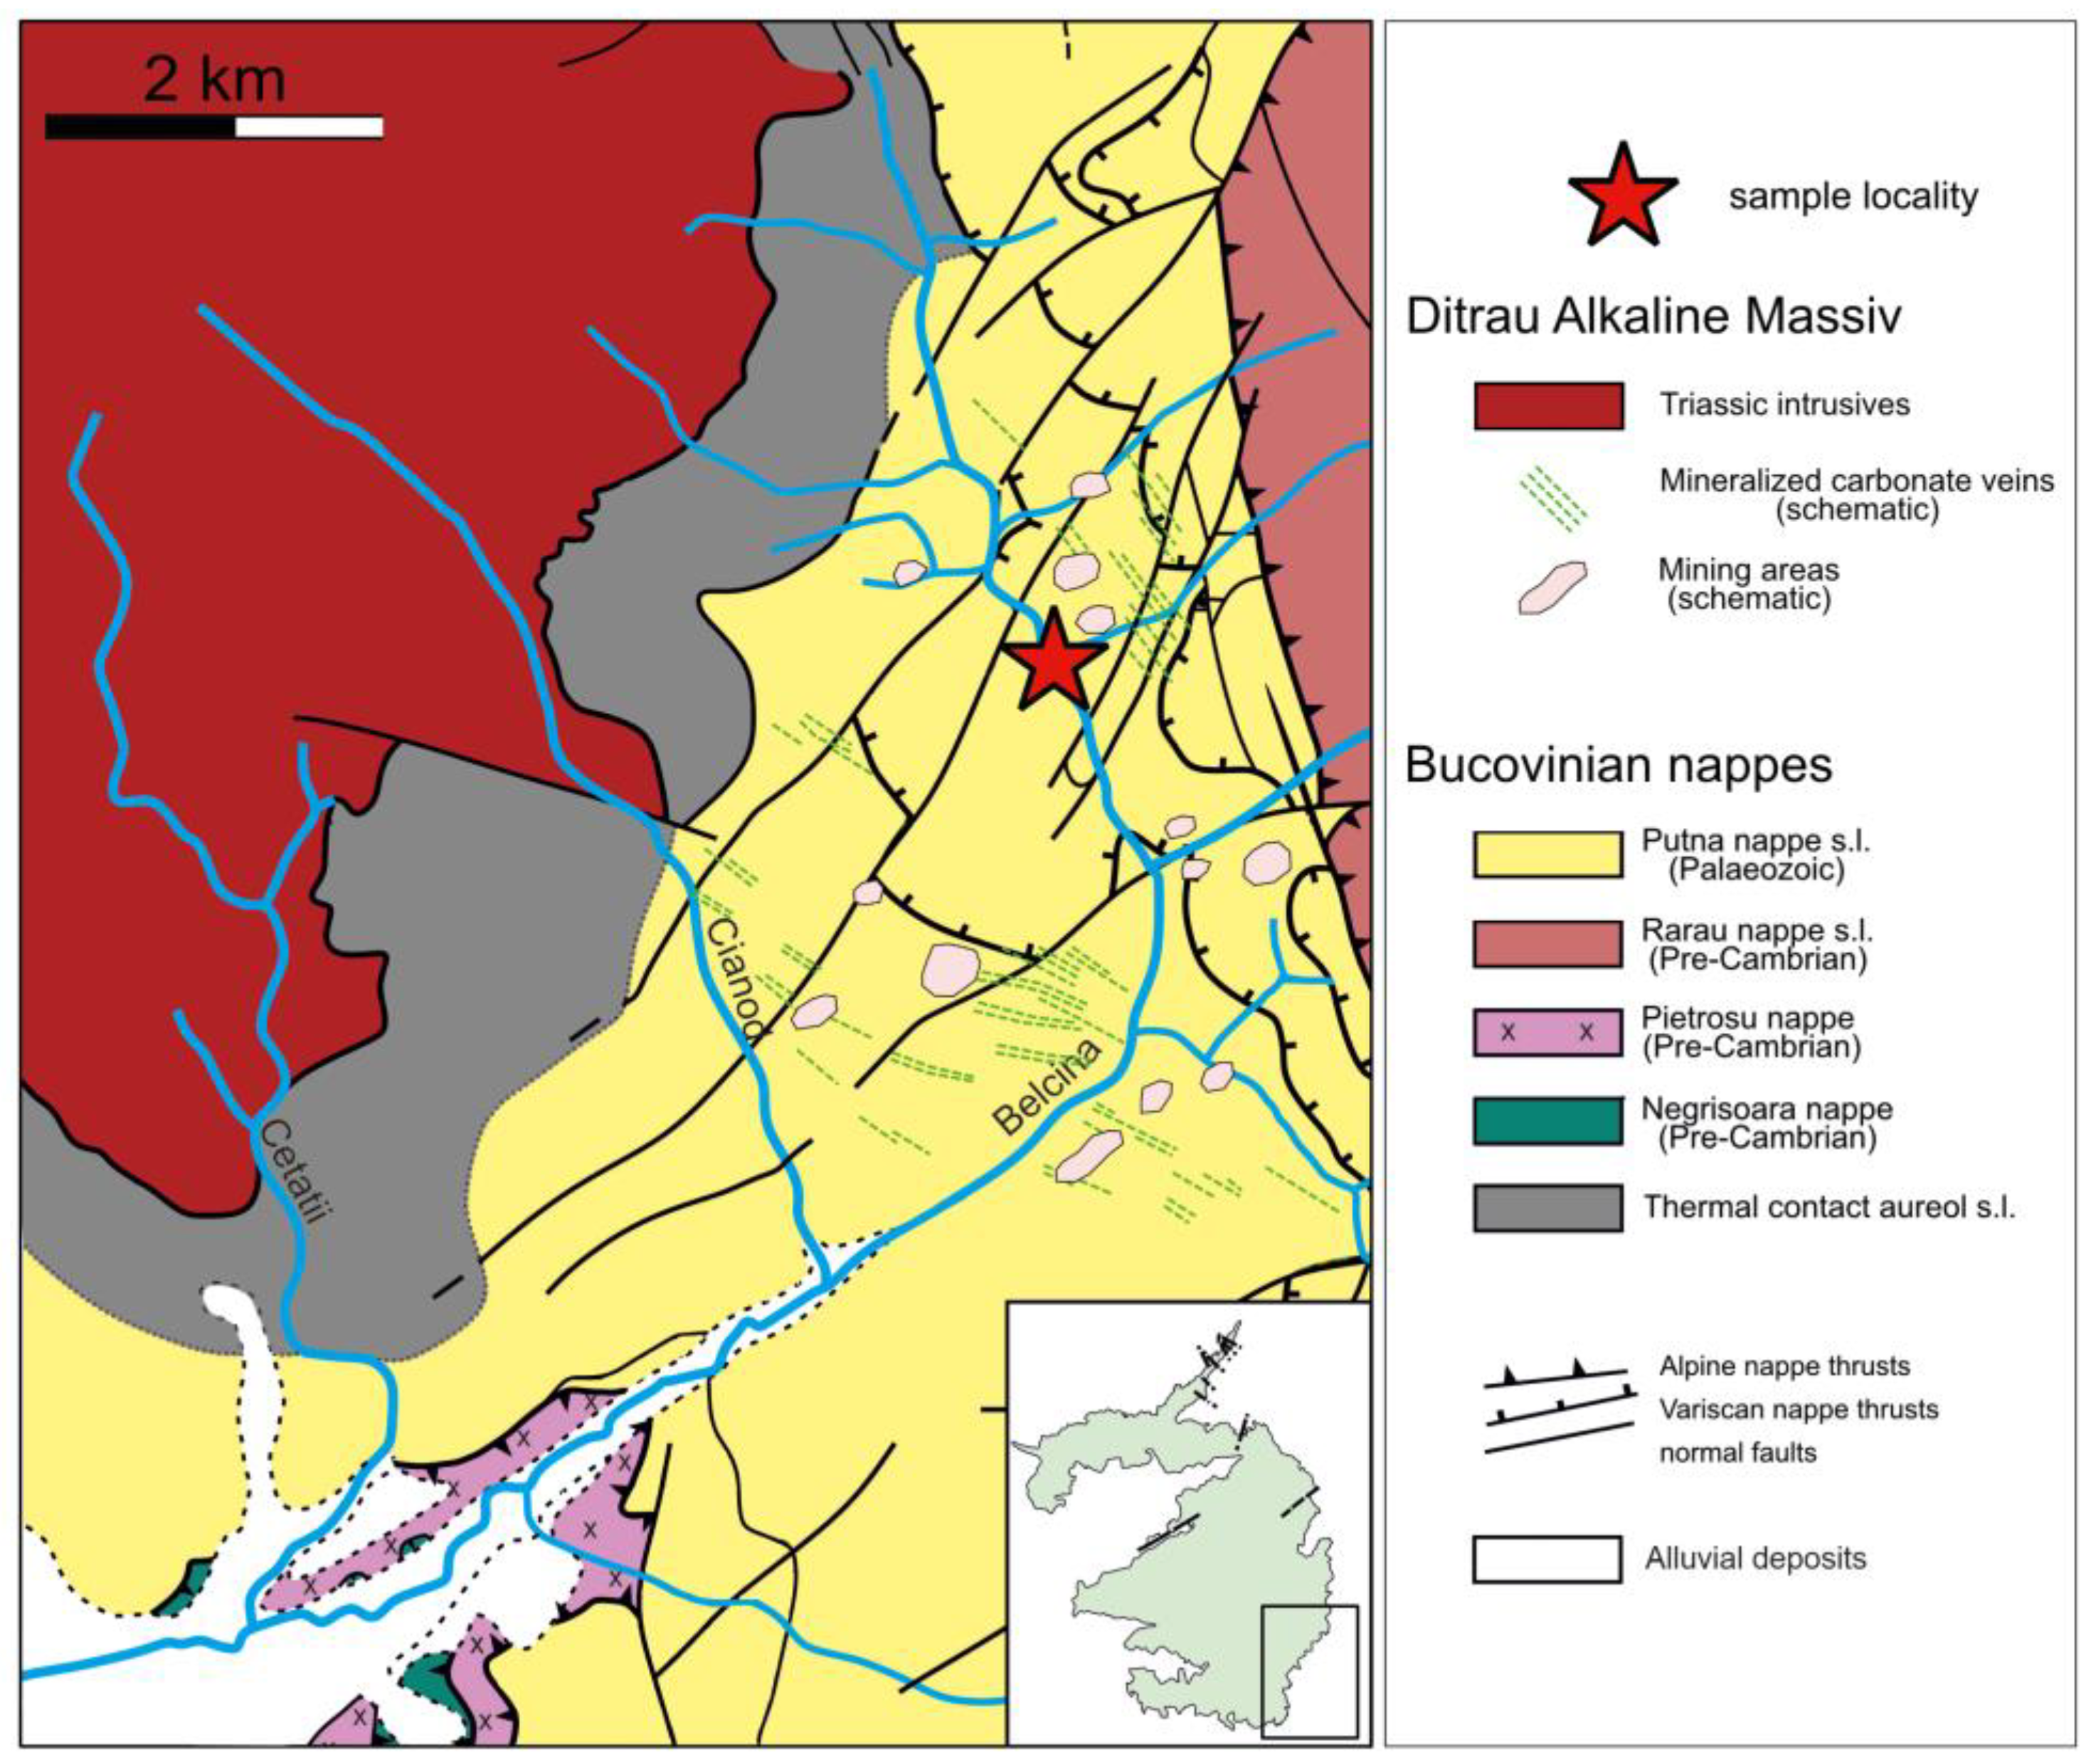
2. Geological Background

Overview

The Ditrău Alkaline Massif (DAM) is an alkaline igneous massif in the Eastern Carpathian Mountains in Romania (Figure 1).It was emplaced in an extensional, rift-related continental intraplate setting related to the opening of the Meliata-Hallstatt Ocean in the Middle to Upper Triassic [21]. The country rocks of the DAM are pre-Middle Triassic metamorphic rocks of the Alpine Bucovinian Nappe (e.g., [22]). The complex is partially covered by Neogene volcanics and Pliocene-Pleistocene lacustrine sediments [5,6]. The detailed petrography and petrology of the DAM rocks have formerly been described by (e.g., [2,5,20] and references therein).
The following main lithologies can be distinguished (Figure 1): In the western and northern part of the DAM mafic–ultramafic cumulate rocks ranging from peridotites, pyroxenites, and hornblendites (Jolotca hornblendites [5,23]) to alkali gabbros (Sărmaș gabbro [5]) and alkali diorites (Bear-valley mafic syenite [24]) occur. Quartz syenites and alkali granites are found in the Jolotca area and in the north-eastern DAM (Hagota quartz syenite [5]). East of a line joining Jolotca–Ditrău–Lăzarea–Gheorgheni, the DAM is dominated by alkaline intrusive suites. Based on geochemical and geochronological data three suites can be distinguished [2]:
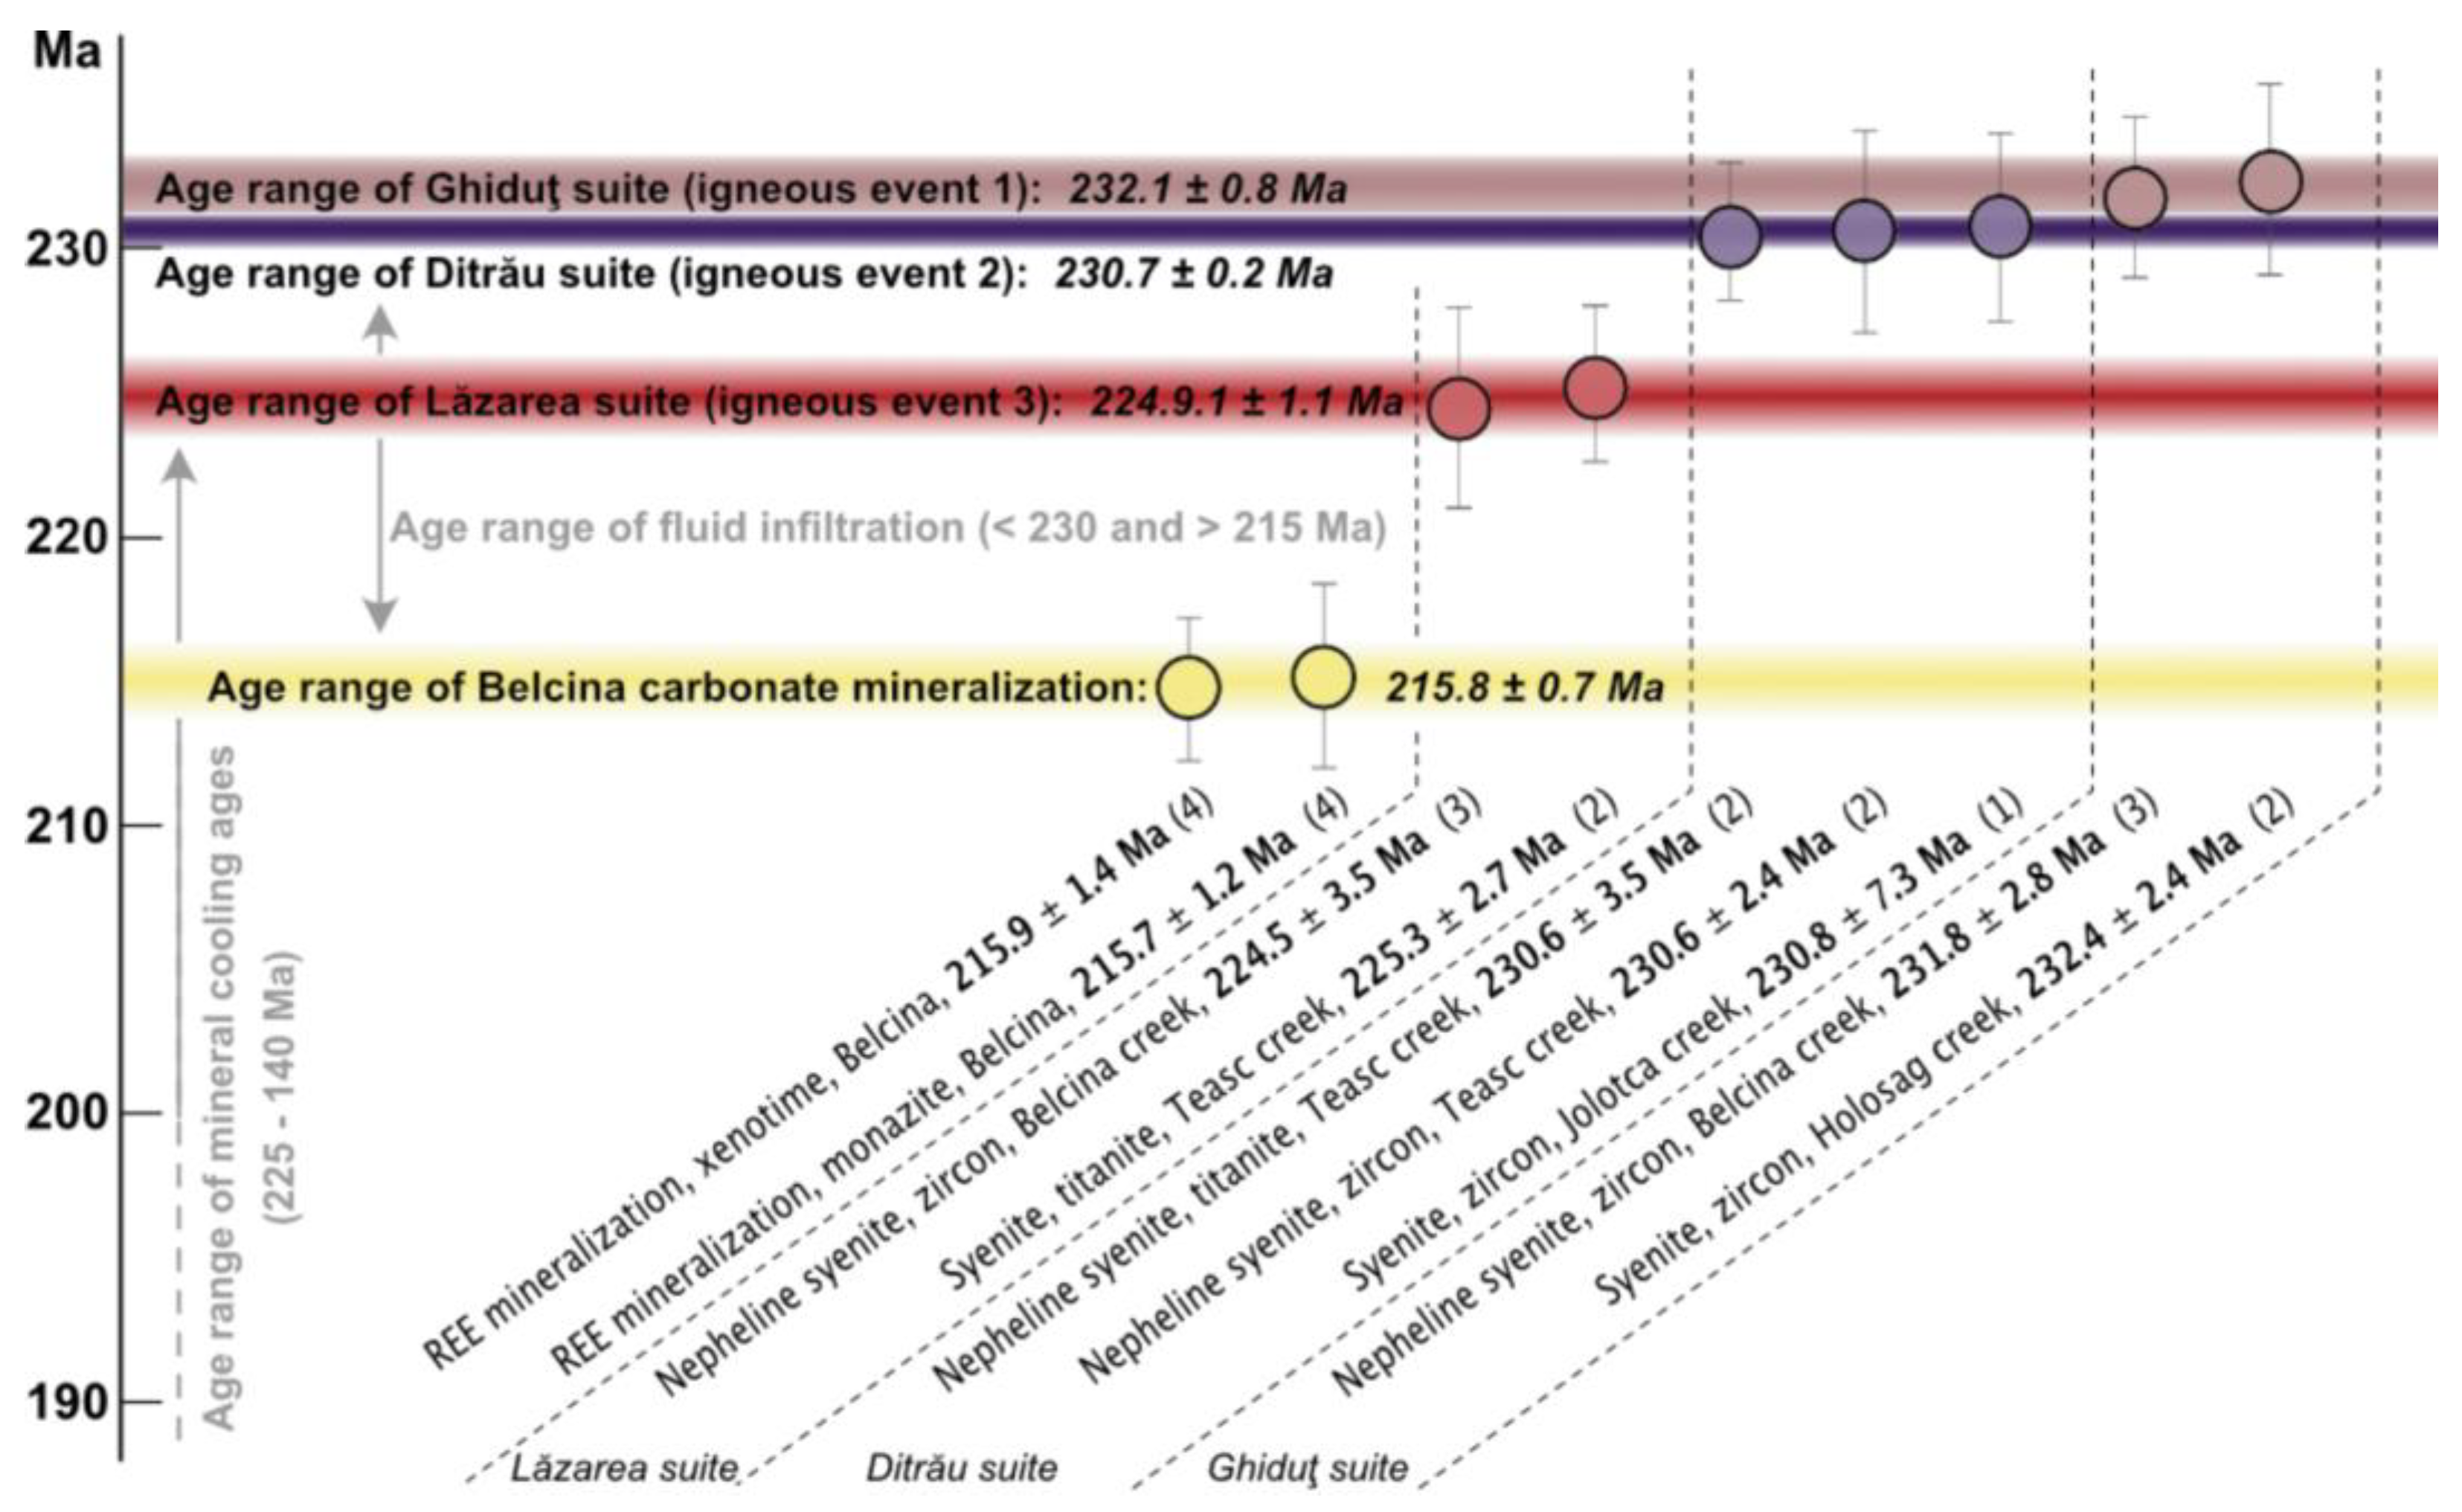
Ditrău suite, comprising syenites to monzo-syenites (equivalent to the ‘Ditrău syenite’ of [5]) dated at 230.7 ± 0.2 Ma;
Ghiduţ suite, comprising nepheline syenites, subordinate syenites and monzo-syenites (equivalent to the former ditroite and the white nepheline syenite [6,24,25] and the ‘Ghiduţ nepheline syenite’ [5]) dated at 231.1 ± 0.8 Ma;
Lăzarea suite, comprising weakly to very strongly altered nepheline syenites (formerly red syenite [7] or red, hydrothermally altered variety [24]) dated at 224.9 ± 1.1 Ma.
The DAM is surrounded by a thermal contact aureole (labeled as ‘Hornfelses’ in Figure 1) which developed in the low-grade metasedimentary country rocks [21].
All lithological suites have been significantly modified by near-solidus to sub-solidus interaction with late-stage magmatic fluids and were cut by secondary mafic dykes [20,26,27,28]. The hydrothermal system is believed to have developed within the DAM magma chamber during the later stages of magmatic crystallization [5,25], causing the localized alteration of nepheline syenites by a Na-rich fluid. In addition, mafic dykes allowed the upward migration of late-stage K-rich fluids, thereby leaching REE and HFSE from the Ghiduţ suite [5,20]. The DAM and country rocks were subsequently also invaded by carbonate- and REE-enriched fluids forming veins. which contain rock-forming monazite-(Ce) and xenotime-(Y) among a complex suite of other minerals. These veins mostly crosscut the complex in the north-western (Jolotca region) and the south-eastern (Belcina region) parts of the DAM [3,4,5].
A number of genetic models have been published, but no consensus as to the evolution of the DAM has been reached so far (see [2] and references therein).

3. Analytical Methods

3.1. Optical Microscopy

The petrography and thin-section imaging was carried out using a Leica DM4500 P petrographic microscope and a Keyence VHX-5000 digital microscope at the Department of Lithospheric Research, University of Vienna, Austria.

3.2. Backscattered Electron Imaging (BEI)

The textures and chemical zonations of the Belcina phosphates were revealed by backscattered electron imaging using a FET Philips 30 electron microscope, an accelerating voltage of 15 kV and a beam current of 20 nA at the Institute of Earth Sciences, University of Silesia in Katowice, Poland. The most suitable location of the spots for the EMP mineral analyses and (U+Th)-Pb dating were selected based on these images.

3.3. EMP Mineral Analyses

Mineral chemical analyses of monazite-(Ce) and xenotime-(Y) were performed using a Cameca SX 100 electron microprobe equipped with five wavelength dispersive spectrometers (WDS) at the Micro-area Analyses Laboratory of the Polish Geological Institute (Warsaw, Poland), using a 15 keV acceleration voltage, 40 nA beam current and 1 µm beam width. The counting times for peaks were set to 30–60 s for REEs and As, 20 s for others. The counting times for the background positions were a half time for each peak; Pb Mβ, Th Mα and U Mβ were determined using 15 keV, 300 nA, 1 µm, counting time for peaks for monazite-(Ce) analysis: 60 s for Th, 160 s for U and 240 s for Pb and for xenotime-(Y) analysis: 200 s for Th, 160 s for U and 300 s for Pb. The counting time for measured U, Th and Pb background was the same as for each peak, wherein two background positions were measured for each element. Calibration was conducted on natural and synthetic standards: REEs and Y were obtained from synthetic orthophosphates [XPO4], Th and U from synthetic glasses enriched with Th and U, Pb from pyromorphite, Fe from hematite, Zr from synthetic ZrO2, P from apatite, As from arsenopyrite, S and Sr from synthetic celestite [SrSO4], Ca and Si from wollastonite and K and Al from orthoclase [29].
Peak overlaps were deconvoluted following the method described by [29]: U Mb corrected for Th Mγ, K Kα; Lu Lβ corrected for Ho Lγ, Yβ Lβ2; Tm Lβ, corrected for Tn Lγ, Gd Lγ2; As Lβ, corrected for Dy Mβ; Hf Lα, corrected for Er Mγ; Zr Lα, corrected for P Kα. No correction for overlapping Zr Lα by P Kα was made because both peaks were measured using PET crystals, where peaks are well separated. The reported concentration values are either given as weight-% or µg/g.

3.4. EMP (U+Th)-Total Pb Dating

(U+Th)-total Pb spot ages were calculated using the mathematical expressions of [30,31]. A 2-standard deviation uncertainty on the apparent age was estimated from each single spot analysis by propagating the 1-standard deviation absolute weight-% uncertainty of the Pb, Th and U abundances, respectively, as computed by the Cameca SX100 software, through the (U+Th)-total Pb age equation. The CHIME (Chemical (U+Th)-total Pb Isochron Method) ages and uncertainties were calculated using the mathematical formulations of [32] and the regression functions of IsoplotR [33]. The accuracy of (U+Th)-total Pb dating is contingent upon the occurrence of negligible amounts of common Pb (Pbc)in the dated mineral. Its influence on the (U+Th)-total Pb ages is readily illustrated on isotopically dated monazite-(Ce) and xenotime-(Y) (e.g., [34,35], in which the 204Pb content is typically less than 1 weight-% of the total Pb. This small Pbc abundance contributes only hundreds to thousands of years for Paleozoic phosphates, well within the overall analytical uncertainties. Hence, any minor Pbc is ignored in the (U+Th)-total Pb age computation in this study [36]. No excess or deficit 230Th corrections were made for the (U+Th)-total Pb monazite-(Ce) and xenotime-(Y) ages. Any such effects are thought to be insignificant for the age range of interest here.

4. Results

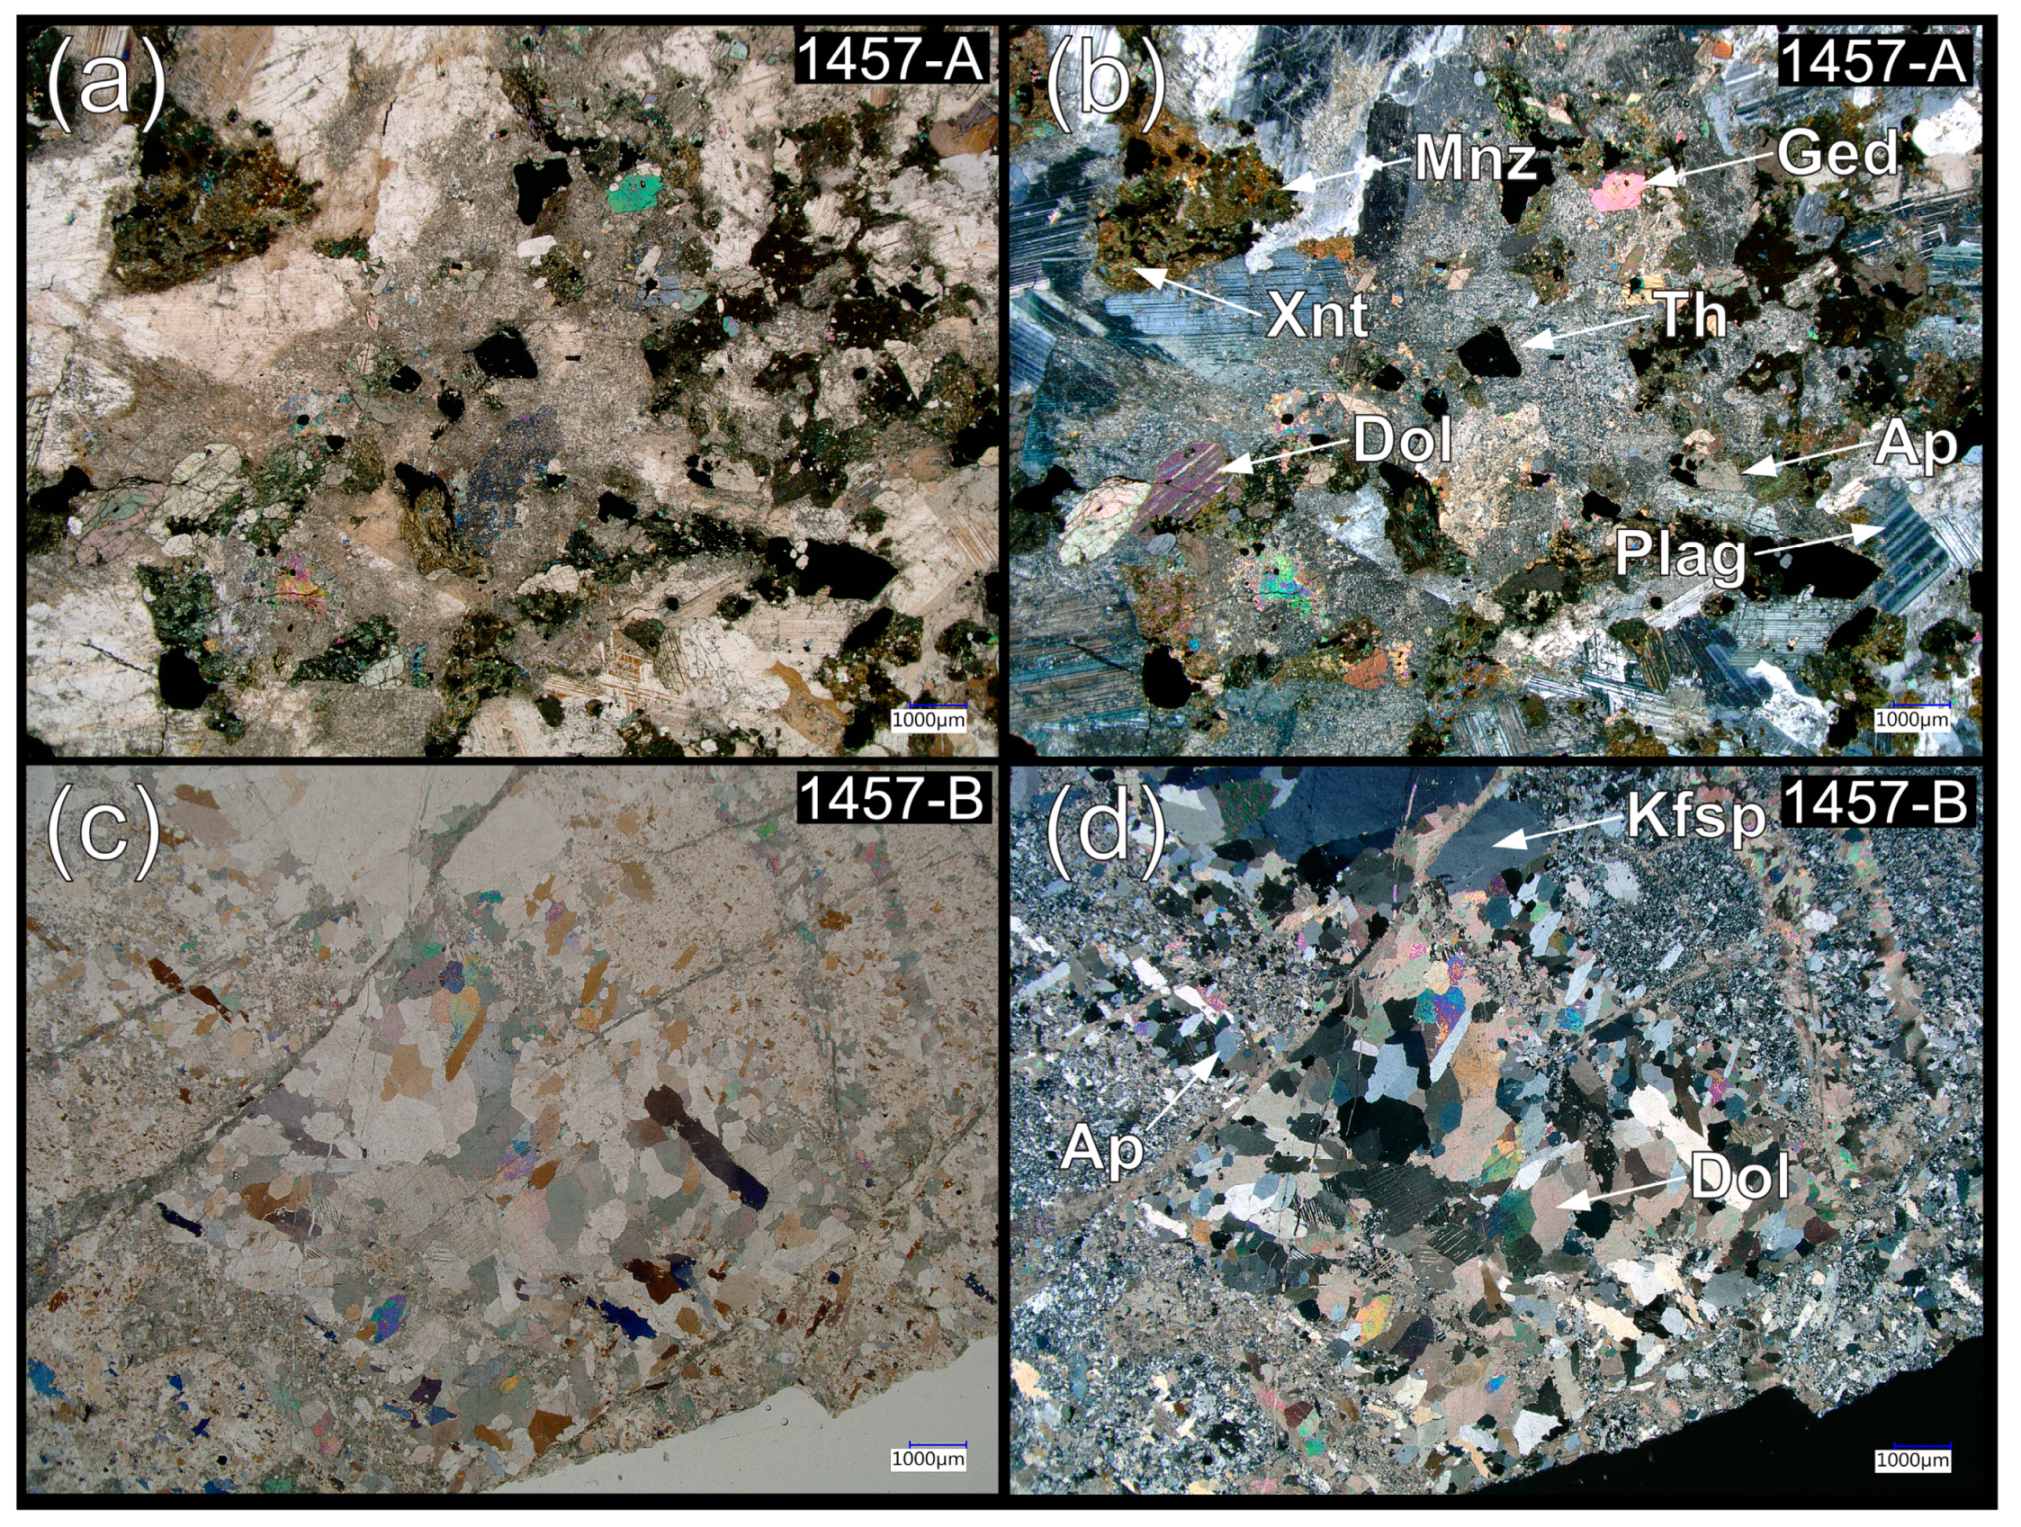
4.1. Sampling and Petrography

The phosphates of the Belcina carbonate REE mineralized veins, together with carbonate, thorite, thorogummite and plagioclase, are rock-forming. The investigated sample though is somewhat aberrant in its modal composition, as in general, in the Belcina veins thorite, thorogummite, zircon and xenotime-(Y) abundances are higher and monazite-(Ce) is less common than in our sample.
We choose the sample based on the fact that the seemingly straight-forward approach of dating the rock-forming and usually most abundant thorite and/or thorogummite is not practicable. Both minerals are strongly prone to accumulate considerable amounts of metamictization, most certainly rendering any dating attempt unsuccessful. In contrast to the observations of [4,8], zircon is not present in all our Belcina samples. Additionally, [8] states that the zircon from the Jolotca and Belcina mineralizations has a different chemical composition. In the Belcina samples zircon tends to show a very high ThO2 content (>20 weight-%), thus rendering it to be highly metamict, while in the Jolotca samples, the ThO2 content is generally low (<1 weight-%). Obviously, any attempt to date zircon from the Belcina mineralized carbonate veins would not be successful. Consequently, for our geochronological investigations, we have chosen a sample which guaranteed the highest possibility of successfully dating monazite-(Ce) and xenotime-(Y) by in situ (U+Th)-total Pb EMP analyses.
The dated sample (lab no.1457) was taken from a mineralized carbonate vein located at the confluence of the Kisgyör tributary to the Belcina river (Figure 1 and Figure 2; 46°46′37.47″ N/25°41′26.27″ E).
The sample is very heterogeneous in composition. Strongly mineralized domains (Figure 3a,b) are coarse-grained with crystal sizes around 0.5 mm–10 mm. Macroscopically the composition is approx. 20 vol-% monazite-(Ce), 30 vol-% carbonate, 10 vol-% plagioclase, 20 vol-% thorite-thorogummite and the rest is xenotime-(Y), apatite, Fe oxides and amphibole. The fabric is magmatic with no preferred crystal orientation, but brittle fracturing, especially of the monazite-(Ce), is ubiquitous. Non-mineralized domains (Figure 3c,d) are strongly brecciated with angular coarse-grained (0.5 mm–5 mm) carbonate-K-feldspar-apatite ± white mica clasts in a fine-grained (<0.1 mm) matrix of presumably identical composition. Sub-millimeter-thick carbonate veinlets cross-cutting the domains are frequent.

4.2. Phosphate Morphology and Zonation

Based on the assemblage and texture, three different types of monazite-(Ce) and xenotime-(Y) occurrences can be distinguished in the mineralized parts of the investigated sample.

4.2.1. Monazite-(Ce)

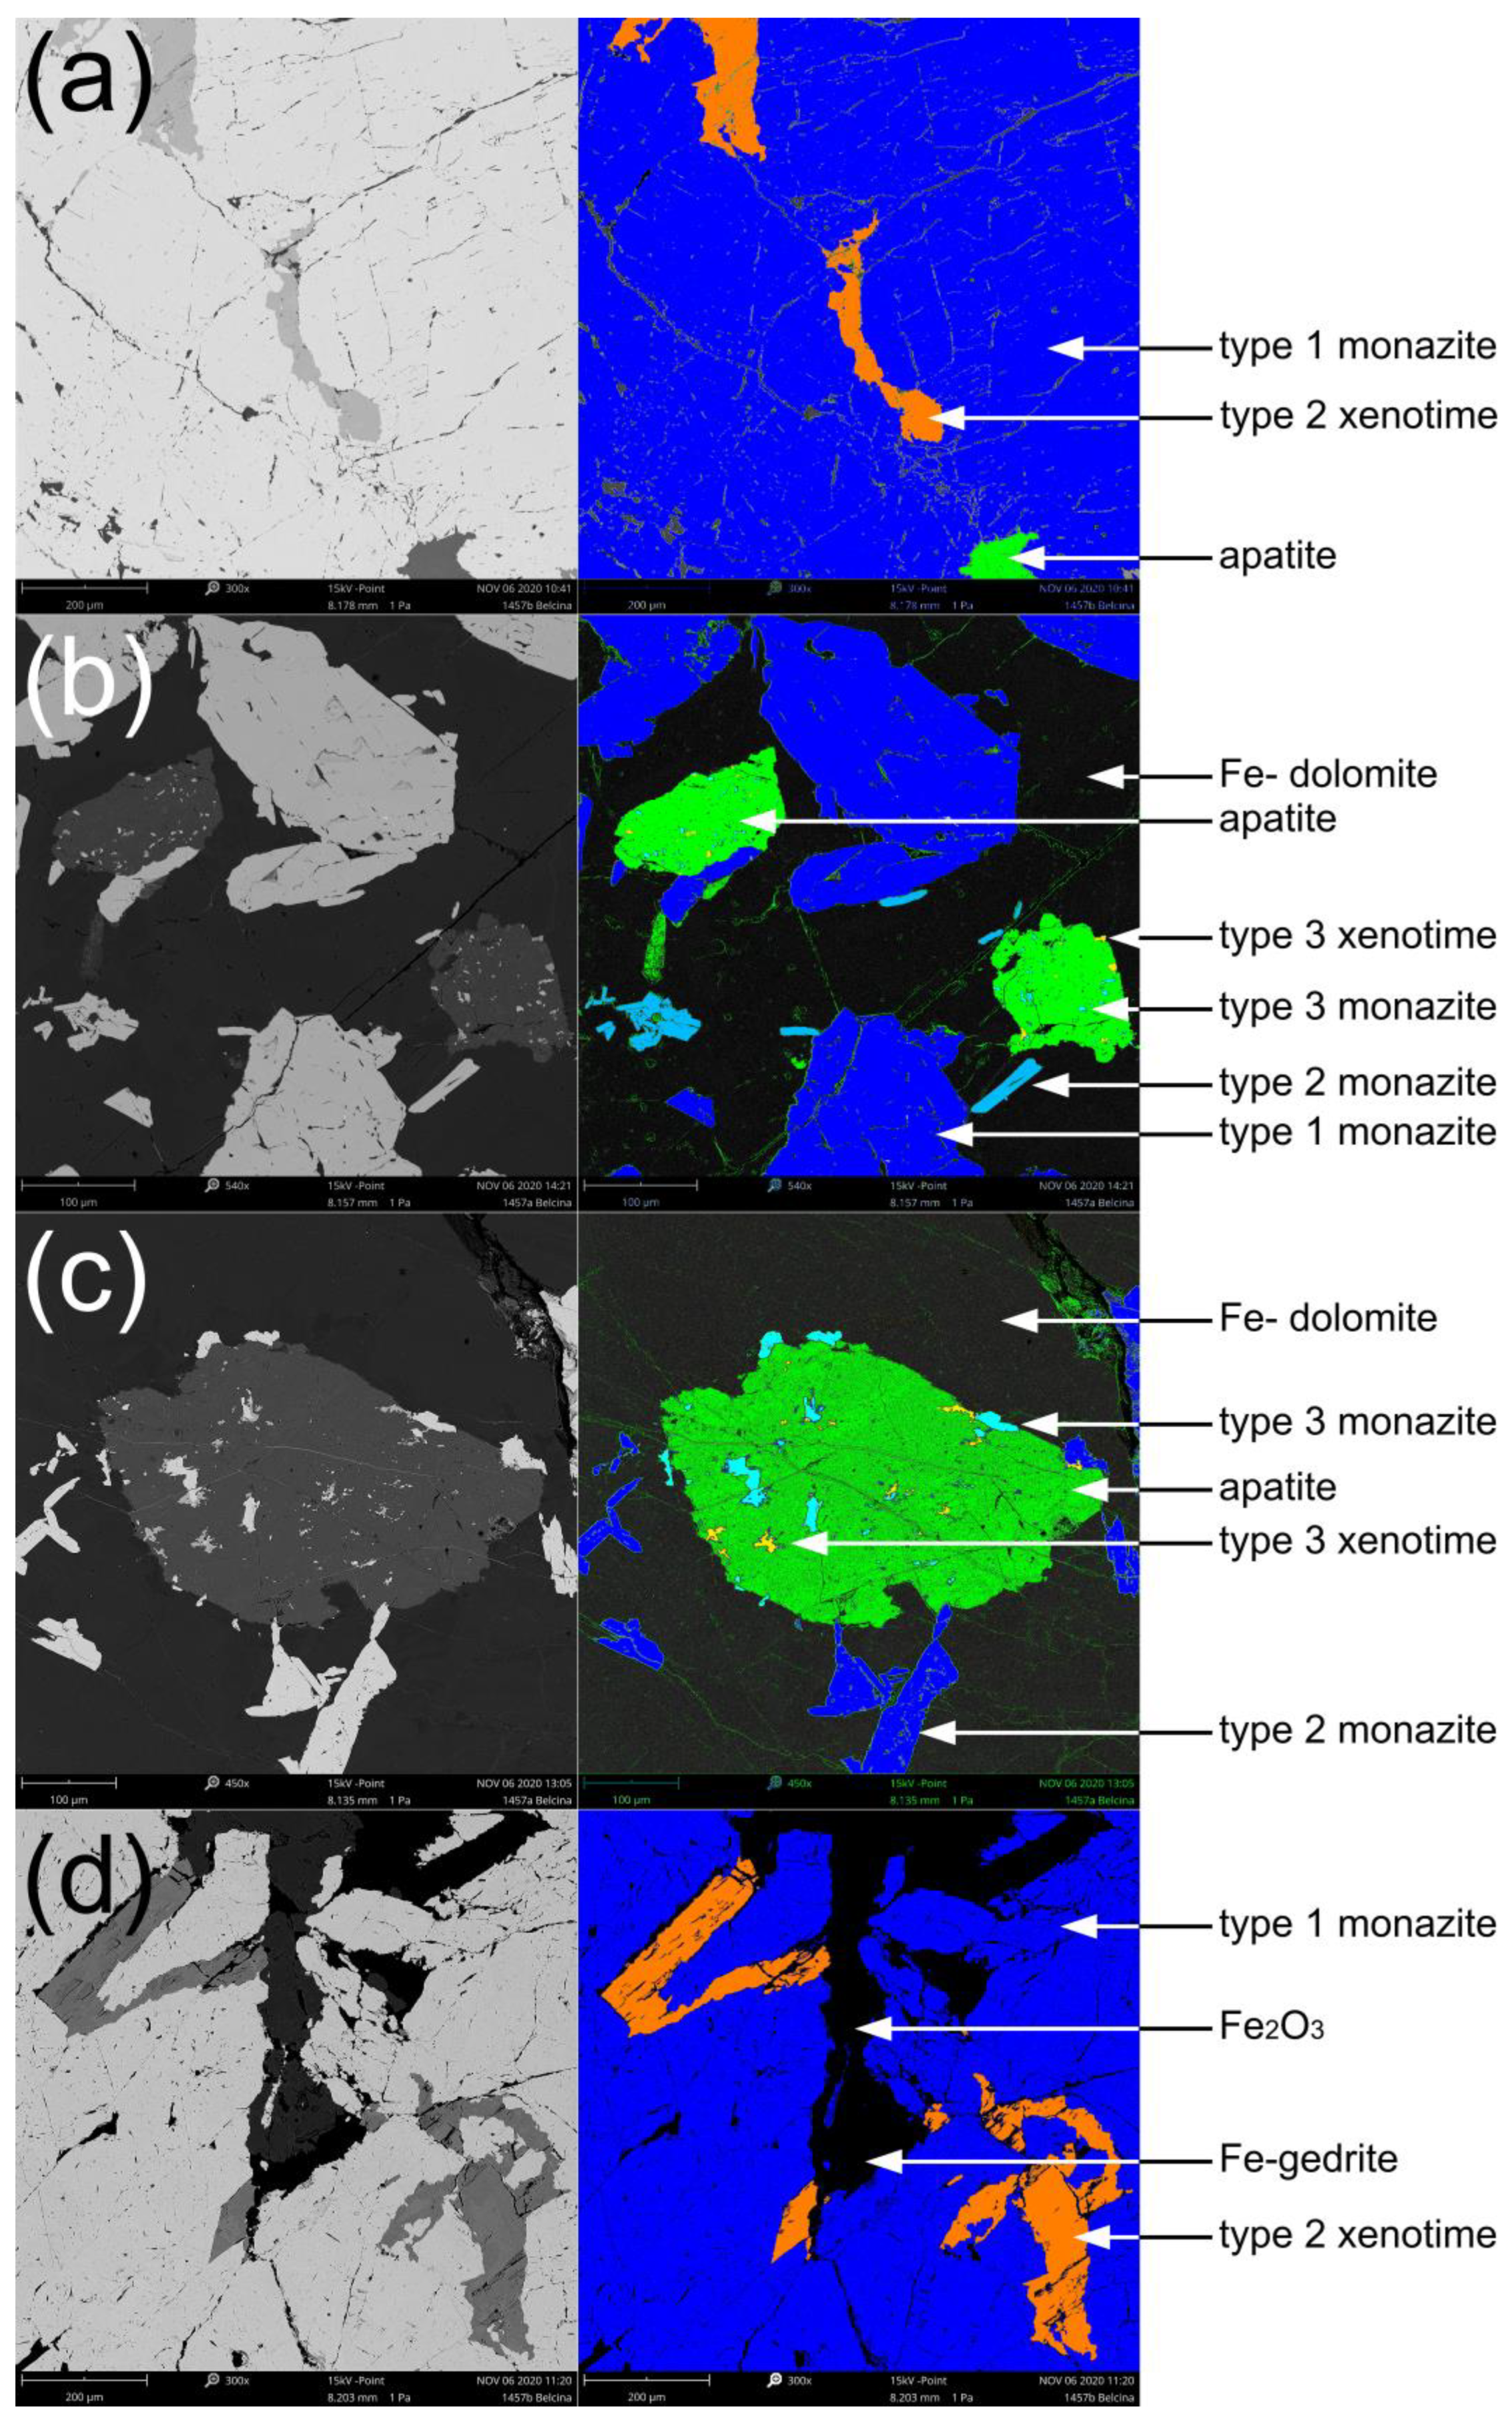
Type 1 monazite-(Ce) (mnz1) is rock-forming making up ca. 20 vol-% of the rock. It either forms xenomorphic to hypidiomorphic aggregated mineral clusters of ca. 1 cm size or independent 100 µm–500 µm sized crystals. It also is found as (relict) cores in type 2 monazite-(Ce) (Figure 4a,b,d and Figure 5a).
Type 2 monazite-(Ce) (mnz2) forms independent small crystals (<200 µm), always enclosed by Fe-dolomite (Figure 4c), often elongated and hypidiomorphic to idiomorphic in shape (Figure 4b,c and Figure 5a).
Type 3 monazite-(Ce) (mnz3) is mostly found as inclusions in apatite or sometimes bordering apatite, tens of microns in size, and randomly oriented (Figure 4b,c and Figure 5a). It is xenomorphic to hypidiomorphic in shape. Grain boundaries of mnz3 with the host apatite are either straight and crystallographically oriented or lobate.
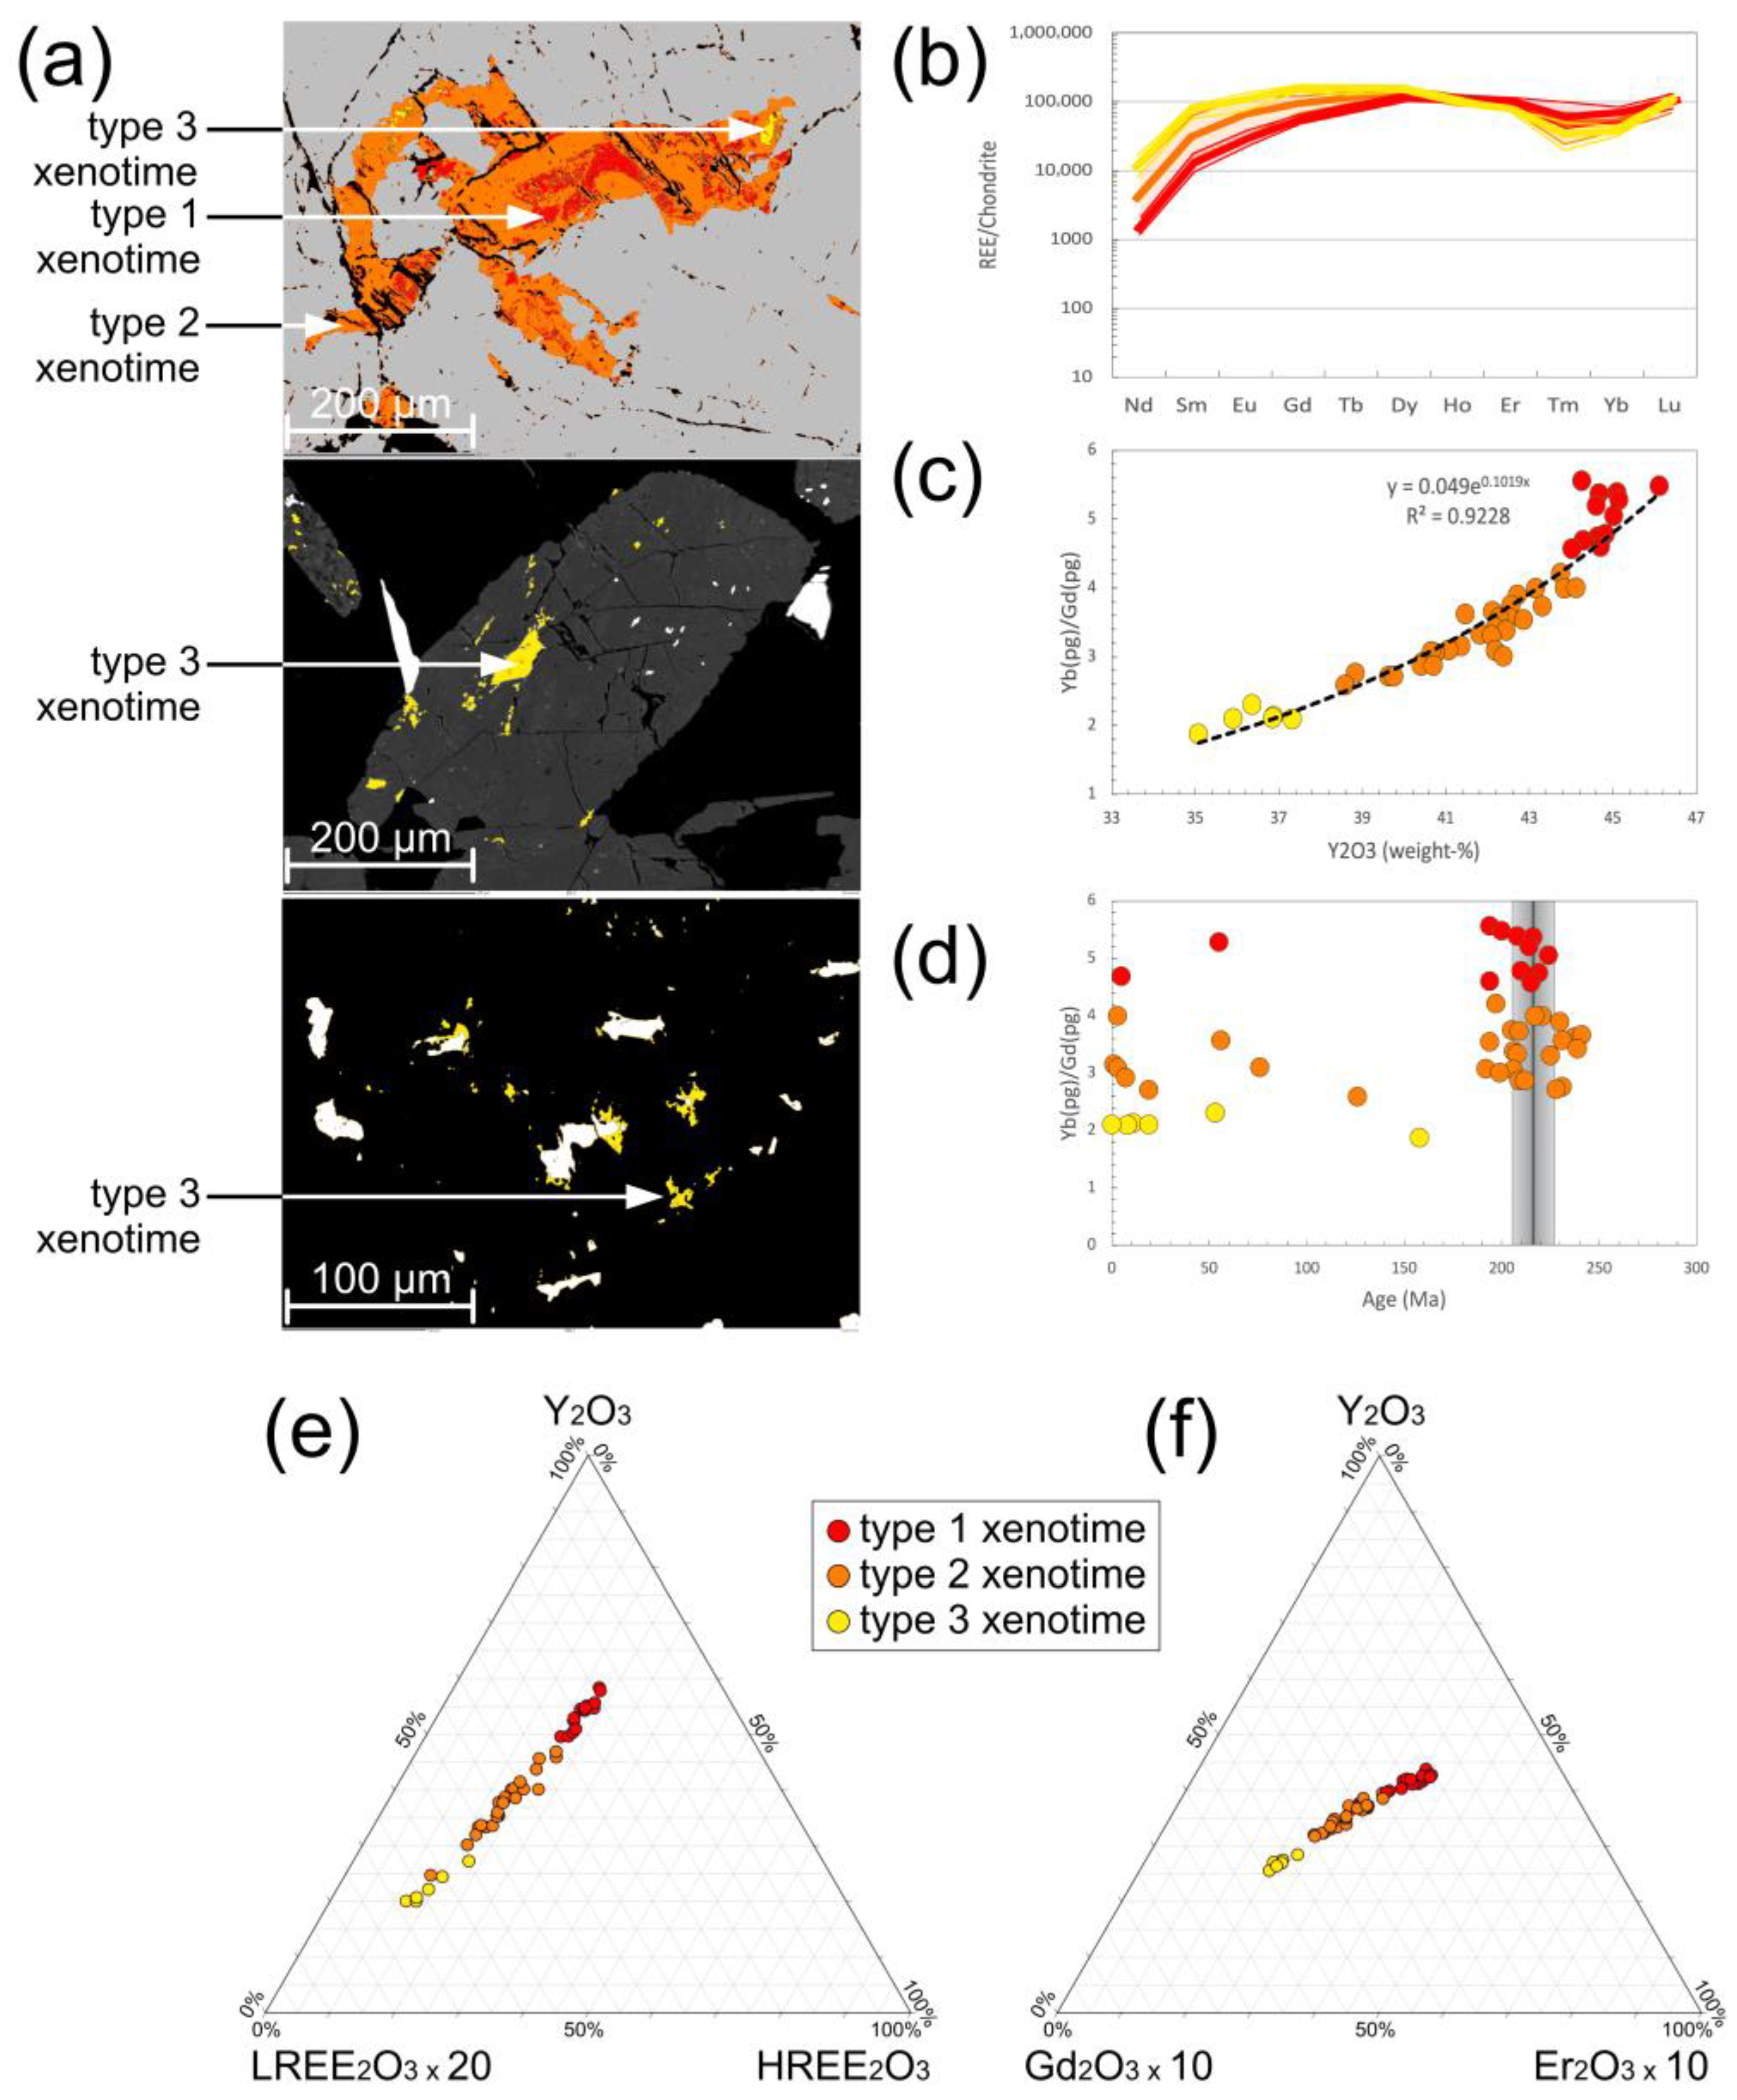
4.2.2. Xenotime-(Y)

Type 1 xenotime-(Y) (xnt1) is only present as distinct domains in the cores of type 2 xenotime-(Y) (Figure 6a). It can only be identified by mineral chemical means and not texturally (see below).
Type 2 xenotime-(Y) (xnt2) forms a characteristic mineral assemblage with mnz1 within which it forms skeletal inclusions of >100 µm size (Figure 4a,d and Figure 6a). Xnt2 is never found as independent crystals. Grain boundaries of the xenotime-(Y) with the host monazite-(Ce) are either straight and crystallographically oriented or lobate. Xnt2 does not show any preferred orientation within the host but is often related to fractures in mnz1.
Type 3 xenotime-(Y) (xnt3), is tens of microns in size, randomly oriented, mainly found as inclusions in apatite, seldomly in xnt2 (Figure 4b,c and Figure 6a). It is xenomorphic to hypidiomorphic in shape. Grain boundaries of xnt3 with the host apatite are either straight and crystallographically oriented or lobate. In appearance, xnt3 is identical to mnz3.

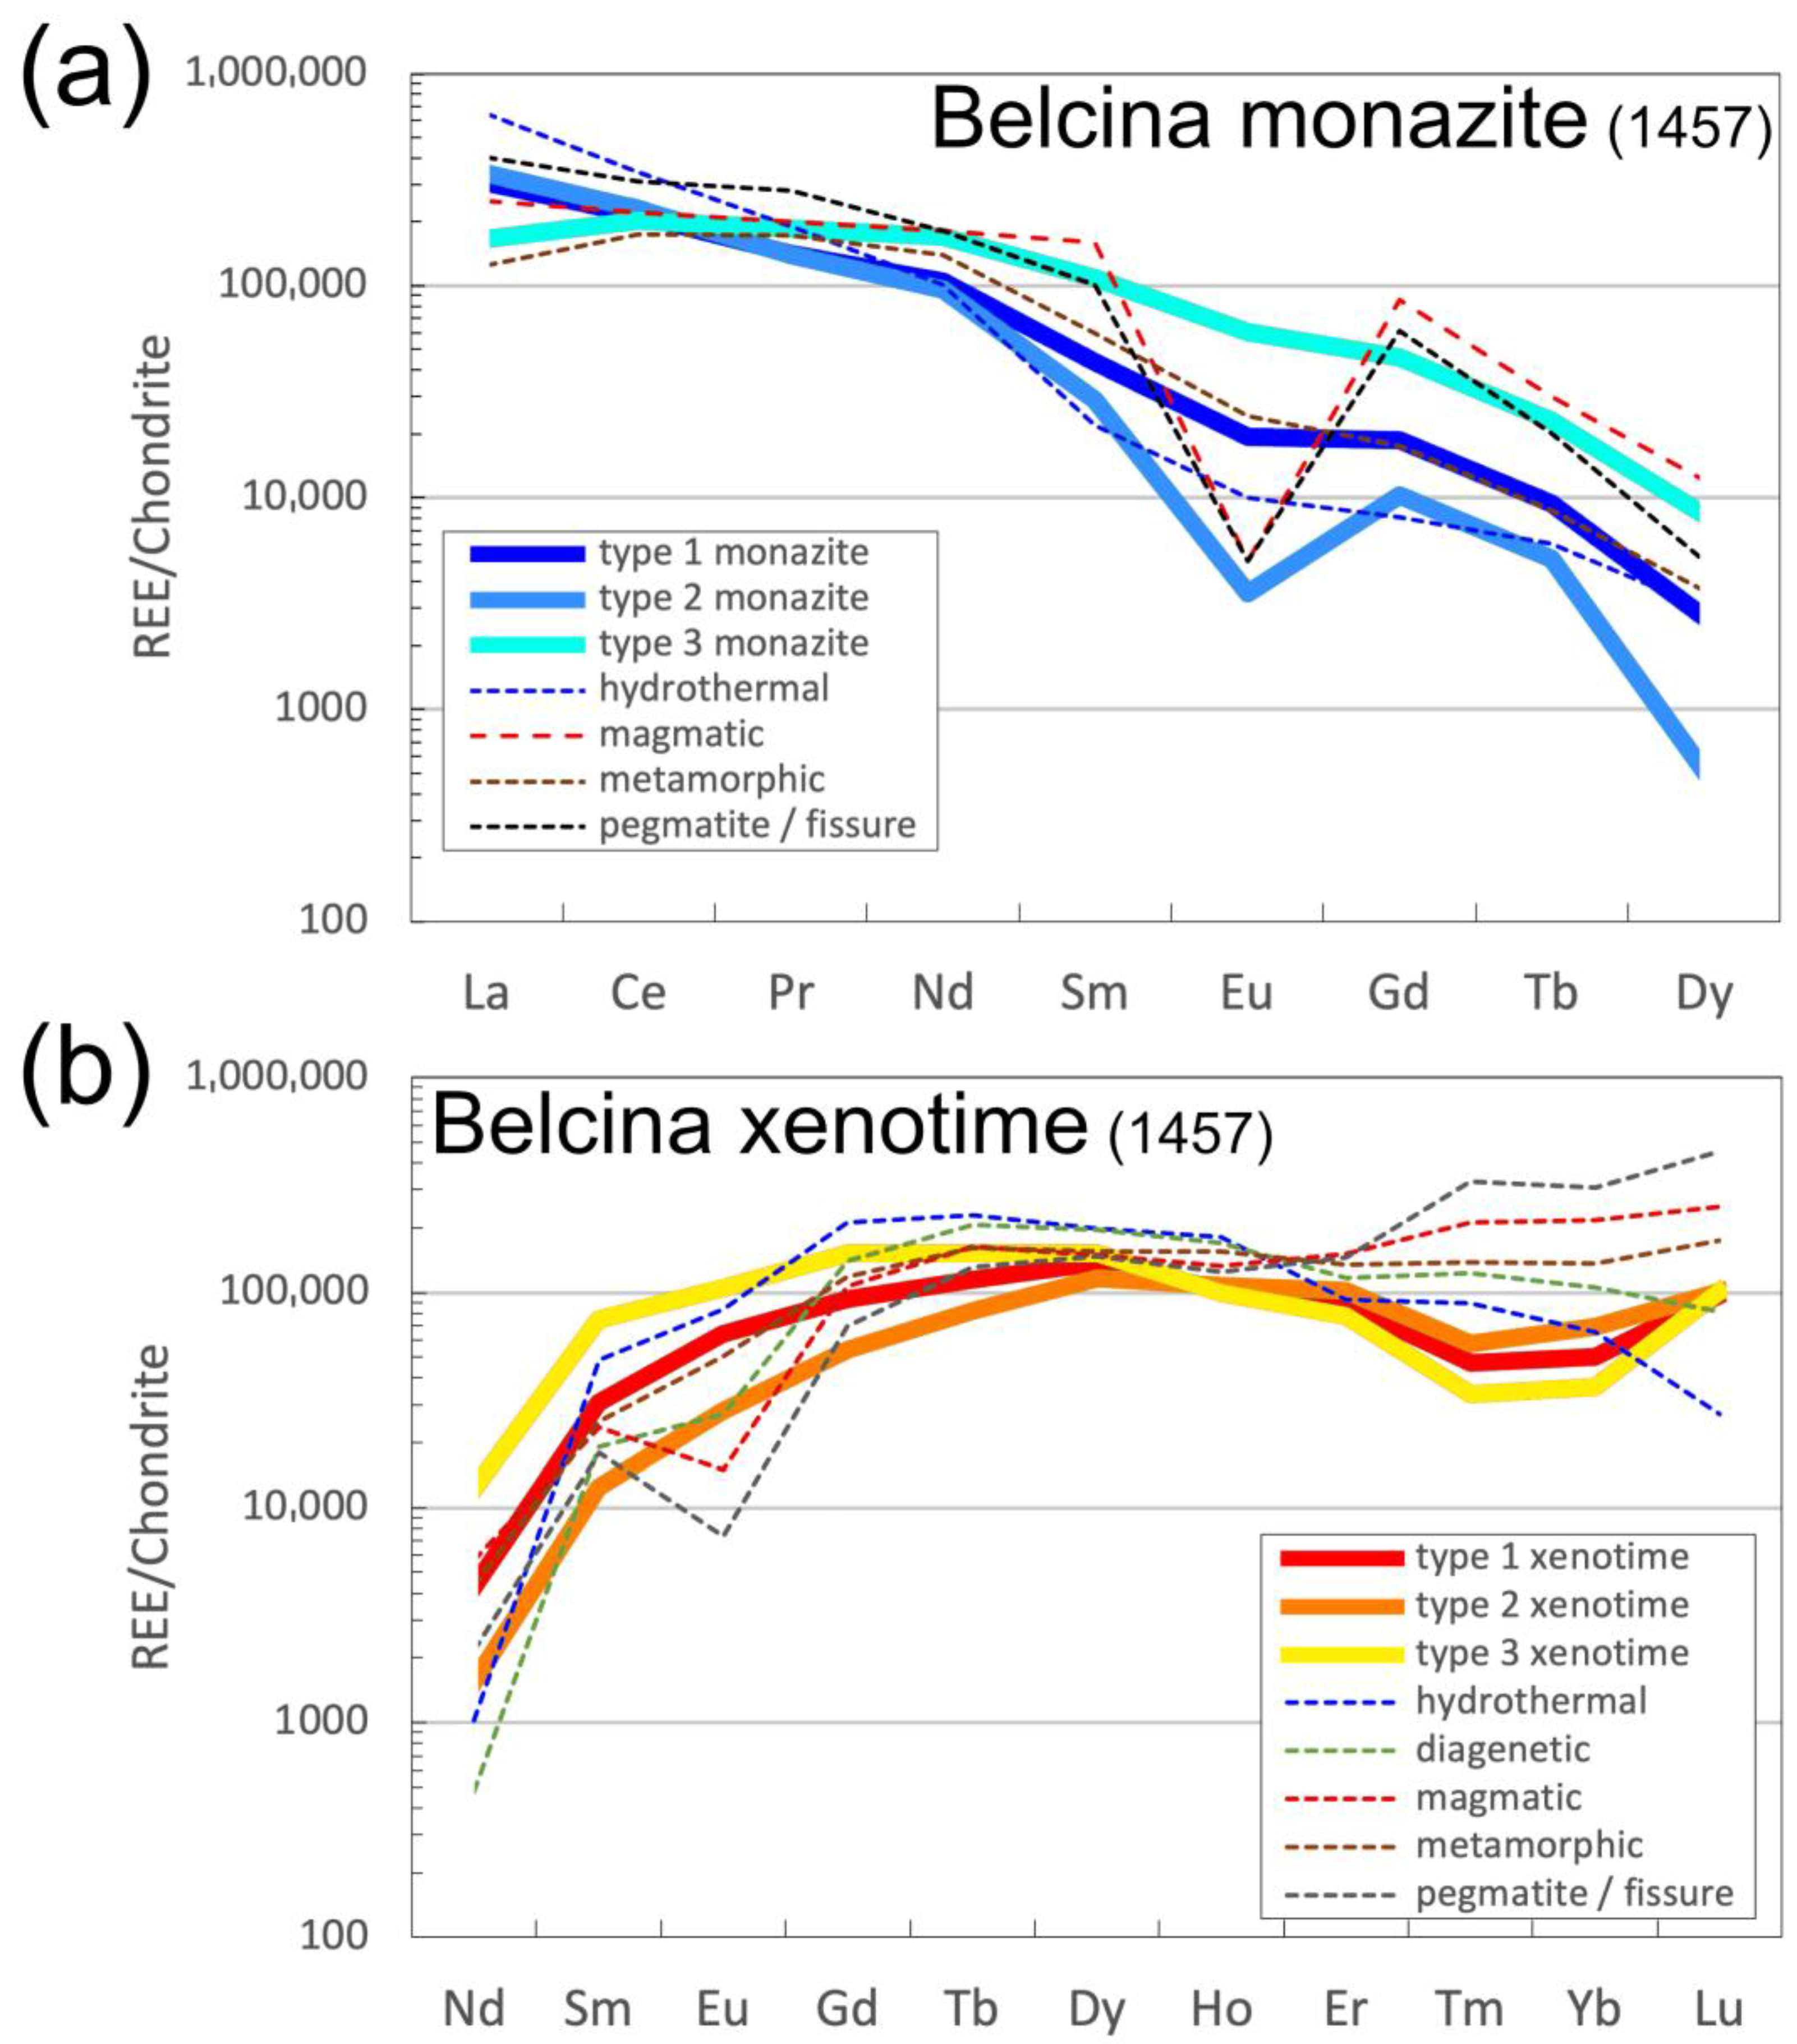
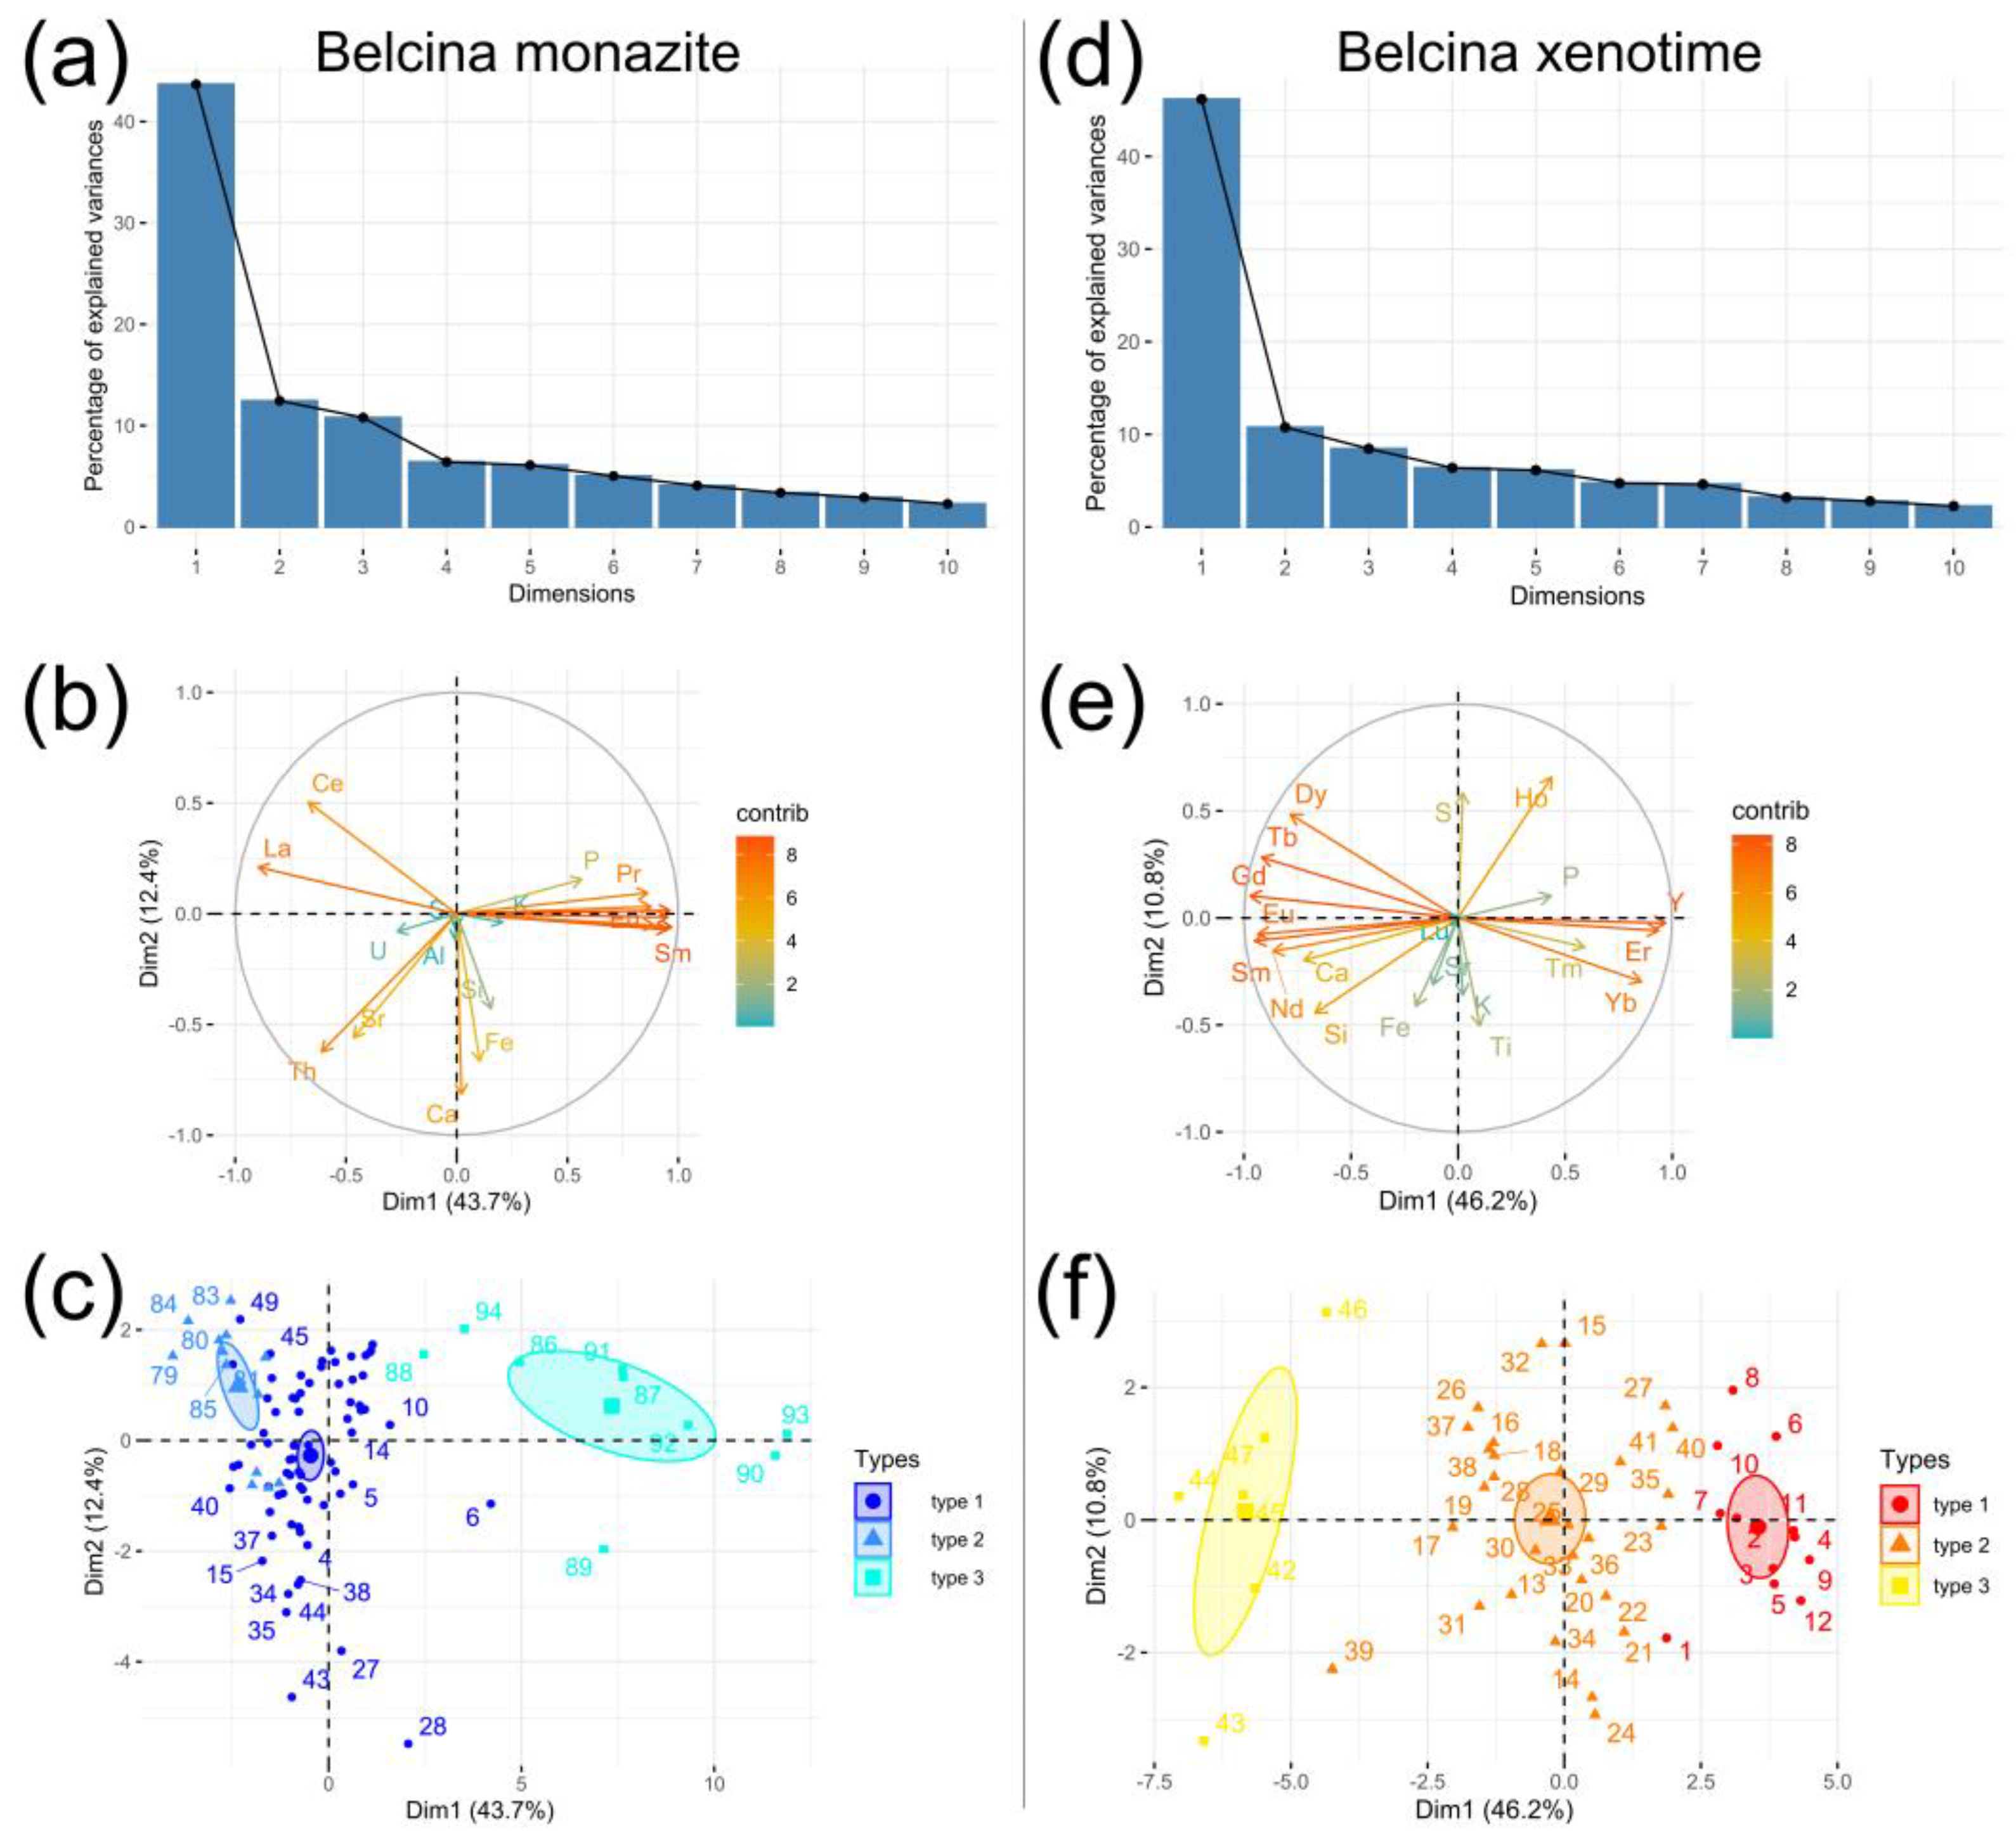
4.3. Phosphate Mineral Chemistry

All REE concentrations (Tables S1 and S2) are either reported as REE2O3 weight-% or µg/g or as REE concentrations normalized to the chondrite values of [37].
Eu and Tm anomalies are calculated as: (Eu/Eu*)N = EuN/(SmN*GdN)0.5, (Tm/Tm*)N = TmN/(ErN*YbN)0.5. The paragenetic groups in xenotime-(Y) of [38] are calculated as Yb(pg) = (Ho2O3 + Er2O3 + Yb2O3 + Lu2O3 + Nd2O3) and Gd(pg) = (Gd2O3 + Tb2O3 + Dy2O3 + Eu2O3 + Sm2O3).

4.3.1. Monazite-(Ce)

Type 1 monazite-(Ce) (mnz1): The average REE2O3 content is 65.3 weight-%. The average (La/Ce)N = 1.42, (La/Dy)N = 202, Eu/Eu* = 0.66 (Figure 5b,c). On the LREE2O3-(HREE2O3 + Y2O3)-(ThO2 + UO2) ternary diagram two trends are present (Figure 5e):
Trend 1 shows a relative actinide enrichment at constant xenotime-(Y) component;
Trend 2 shows enrichment in the xenotime-(Y) component at constants actinides.
Trend 1 is perpendicular to trend 2. Overall, the REE patterns of mnz1 closely resemble those of average metamorphic monazite-(Ce) and to a lesser extent hydrothermal monazite-(Ce) [14,15,16,17,18,19] with some MREE enrichment (Figure 7a; Table S1).
Type 2 monazite-(Ce) (mnz2): The average REE2O3 content is 64.5 weight-%. The average (La/Ce)N = 1.46, (La/Dy)N = 152′757, Eu/Eu* = 0.09 (Figure 5b,c). Mnz2 is depleted in MREE and HREE compared to mnz1 (Figure 5b). On the LREE2O3-(HREE2O3 + Y2O3)-(ThO2 + UO2) ternary diagram one trend showing varying actinide enrichment at constant xenotime-(Y) component is visible (Figure 5e). This trend runs parallel to the mnz1 trend 1 albeit at lower (ThO2 + UO2)/LREE2O3 ratios. The mean mnz2 REE pattern runs parallel to the average hydrothermal monazite-(Ce) REE trend but with a more pronounced negative Eu anomaly and a LREE depletion (Figure 7a).
Type 3 monazite-(Ce) (mnz3): The average REE2O3 content is 64.1 weight-%. The average (La/Ce)N = 0.82, (La/Dy)N = 25, Eu/Eu* = 0.84 (Figure 5b,c). Compared to the two former, monazite-(Ce) varieties mnz3 is depleted in La and Ce and strongly enriched in MREE and HREE (Figure 5b,c), (Figure 7a). On the LREE2O3-(HREE2O3 + Y2O3)-(ThO2 + UO2) ternary diagram no specific trend is perceptible, but compared to mnz1 and mnz2 the relative actinides contents are lowered. The mean mnz3 REE pattern runs parallel to the mnz1 one but with a ca. five-fold MREE+HREE enrichment.
On the LREE2O3-HREE2O3-Y2O3 ternary diagram the three monazite-(Ce) varieties define one constant trend (Figure 5f) from purer mnz2 to mnz3 with higher xenotime-(Y) component and a constant Y2O3/HREE2O3 ratio. All five compositional trends on the LREE2O3-(HREE2O3 + Y2O3)-(ThO2 + UO2) (Figure 5e) and LREE2O3-HREE2O3-Y2O3 ternary diagrams (Figure 5f) are not related to any particular textural position in the monazite-(Ce)s.
Principal component analysis (Figure 8) using La, Ce, P, Y, Si, Al, K, Ca, S, Fe, Sr, Pr, Nd, Sm, Eu, Gd, Dy, U and Th shows that 56.1% of the total observed variance in the monazite-(Ce) chemistry is attributed to Dim1 and Dim2 (Figure 8a). Dim1 (43.7% of total variance) is formed by the positive association of Pr, Nd, Sm, Eu, Gd, Dy, Y, and P, whereas La and Ce are negatively associated with the former elements. Dim2 (12.4% of total variance) is dominated by strongly positively associated Ca, Si and Fe and to a lesser amount by Th and Sr. U, S, Al, K do not contribute significantly to the compositional variance (Figure 8b). Notably, a very strong positive association of Th with Sr, and Ca with Fe are evident.
Dim1 internal variance is the strongest for mnz3 (ca. 20%), whereas mnz1 and mnz2 show the same amount of Dim1 variance. Dim2 variance is the strongest in mnz1 (ca. 8%), followed by mnz3 and mnz2 (Figure 8c).

4.3.2. Xenotime-(Y)

Type 1 xenotime-(Y) (xnt1): The average REE2O3 content is 64.8 weight-%. The average (Nd/Lu)N = 0.02, Eu/Eu* = 1.08, Tm/Tm* = 0.69 (Figure 6b). The average paragenetic group weight-% values are Yb(pg) = 53.1, Gd(pg) = 10.5, Yb(pg)/Gd(pg) = 5.06 (Figure 6c,d). The mean xnt1 REE pattern runs parallel to the average hydrothermal/metamorphic xenotime-(Y) REE trends [14,15,16,17,18,19] but with a positive Eu anomaly, a pronounced negative Tm anomaly and Lu enrichment (Figure 7b; Table S2).
Type 2 xenotime-(Y) (xnt2): The average REE2O3 content is 64.5 weight-%. The average (Nd/Lu)N = 0.05, Eu/Eu* = 1.21, Tm/Tm* = 0.71 (Figure 6b). The average paragenetic group weight-% values are Yb(pg) = 49.1, Gd(pg) = 14.9, Yb(pg)/Gd(pg) = 3.34 (Figure 6c,d). The mean xnt2 REE pattern also runs parallel to the average hydrothermal/metamorphic xenotime-(Y) REE trends. It shows lower concentrations of Nd-Tb than xnt1 and higher Er-Lu than xnt1 but also the pronounced negative Tm anomaly and Lu enrichment of xnt1 (Figure 7b).
Type 3 xenotime-(Y) (xnt3): The average REE2O3 content is 64.1 weight-%. The average (Nd/Lu)N = 0.13, Eu/Eu* = 0.98, Tm/Tm* = 0.64 (Figure 6b). The average paragenetic group values are Yb(pg) = 43.7, Gd(pg) = 20.9, Yb(pg)/Gd(pg) = 2.10 (Figure 6c,d). The mean xnt3 REE pattern also runs parallel to the average hydrothermal/metamorphic xenotime-(Y) REE trends. It shows higher concentrations of Nd-Tb than xnt1 and xnt2 and the most pronounced negative Tm anomaly, Yb depletion and Lu enrichment (Figure 7b).
All three xenotime-(Y) types follow a well-defined exponential relationship of Y2O3 with Yb(pg)/Gd(pg), xnt1 having the highest value and xnt3 the lowest. In contrast to this, no relationship with the xenotime-(Y) mineral chemistry, characterized by Yb(pg)/Gd(pg), with the (Th+U)-total Pb age is detectable (Figure 6d). On the LREE2O3-HREE2O3-Y2O3 ternary diagram, the three xenotime-(Y) varieties define one constant trend with a continuous increase in the REE2O3 concentration and of the monazite-(Ce) component from xnt1 to xnt3 (Figure 6e). On a Gd2O3-Er2O3-Y2O3 ternary diagram the three xenotime-(Y) varieties also define a constant trend with a continuous increase in Gd2O3 at a virtual constant Er2O3/Y2O3 (Figure 6f).
Principal component analysis (Figure 8) using Y, P, Si, Ti, Ca, S, Ho, Sr, K, Fe, Nd, Sm, Eu, Gd, Tb, Dy, Er, Tm, Yb and Lu shows that 57.0% of the total observed variance in the xenotime-(Y) chemistry is attributed to Dim1 and Dim2 (Figure 8d). Dim1 (46.2% of total variance) is formed by the positive association of Y, Yb, Er and, to a lesser extent, P and Tm, whereas the other REE-Ca-Si are negatively associated with the former. Dim2 (10.8% of total variance) is dominated by S, K, Ti, Fe and, to a lesser amount, K and Sr (Figure 8e). There is a very strong positive association of Si and Ca (cheralite–huttonite substitution) and no positive association of P and Ca. Lu does not contribute to Dim1 or Dim2. Ho shows a significant aberrant behavior when compared to the other REEs showing a strong positive correlation of Dim1 with Dim2.
The three textural xenotime-(Y) types can also be clearly resolved by their Dim1-Dim2 values (Figure 8f). The mean values and their 1-sigma confidence limits show that the three types can be distinguished solely on the basis of Dim1, i.e., their REE systematics. Dim2 (Ti, K, Fe, Sr, S) do not discriminate the xenotime-(Y) types. As has been shown by the element–element relationships xnt1 shows the purest xenotime-(Y) composition, i.e., the strongest positive Dim1 component, whereas xnt3 shows the highest amount of LREE and MREE (in parts as monazite-(Ce) component) contribution having strongly negative Dim1 values. The xnt3 composition is dominated by the Dim2 components, i.e., the non-stoichiometric elements Ti, K, Fe, Sr and S.
Dim1 internal variance is the strongest for xnt2 (ca. 6%), whereas xnt1 and xnt3 show the same amount of Dim1 variance (ca. 3%). Dim2 variance is the largest in xnt2 and xnt3 (ca. 6%), lest in xnt1 (Figure 8f).

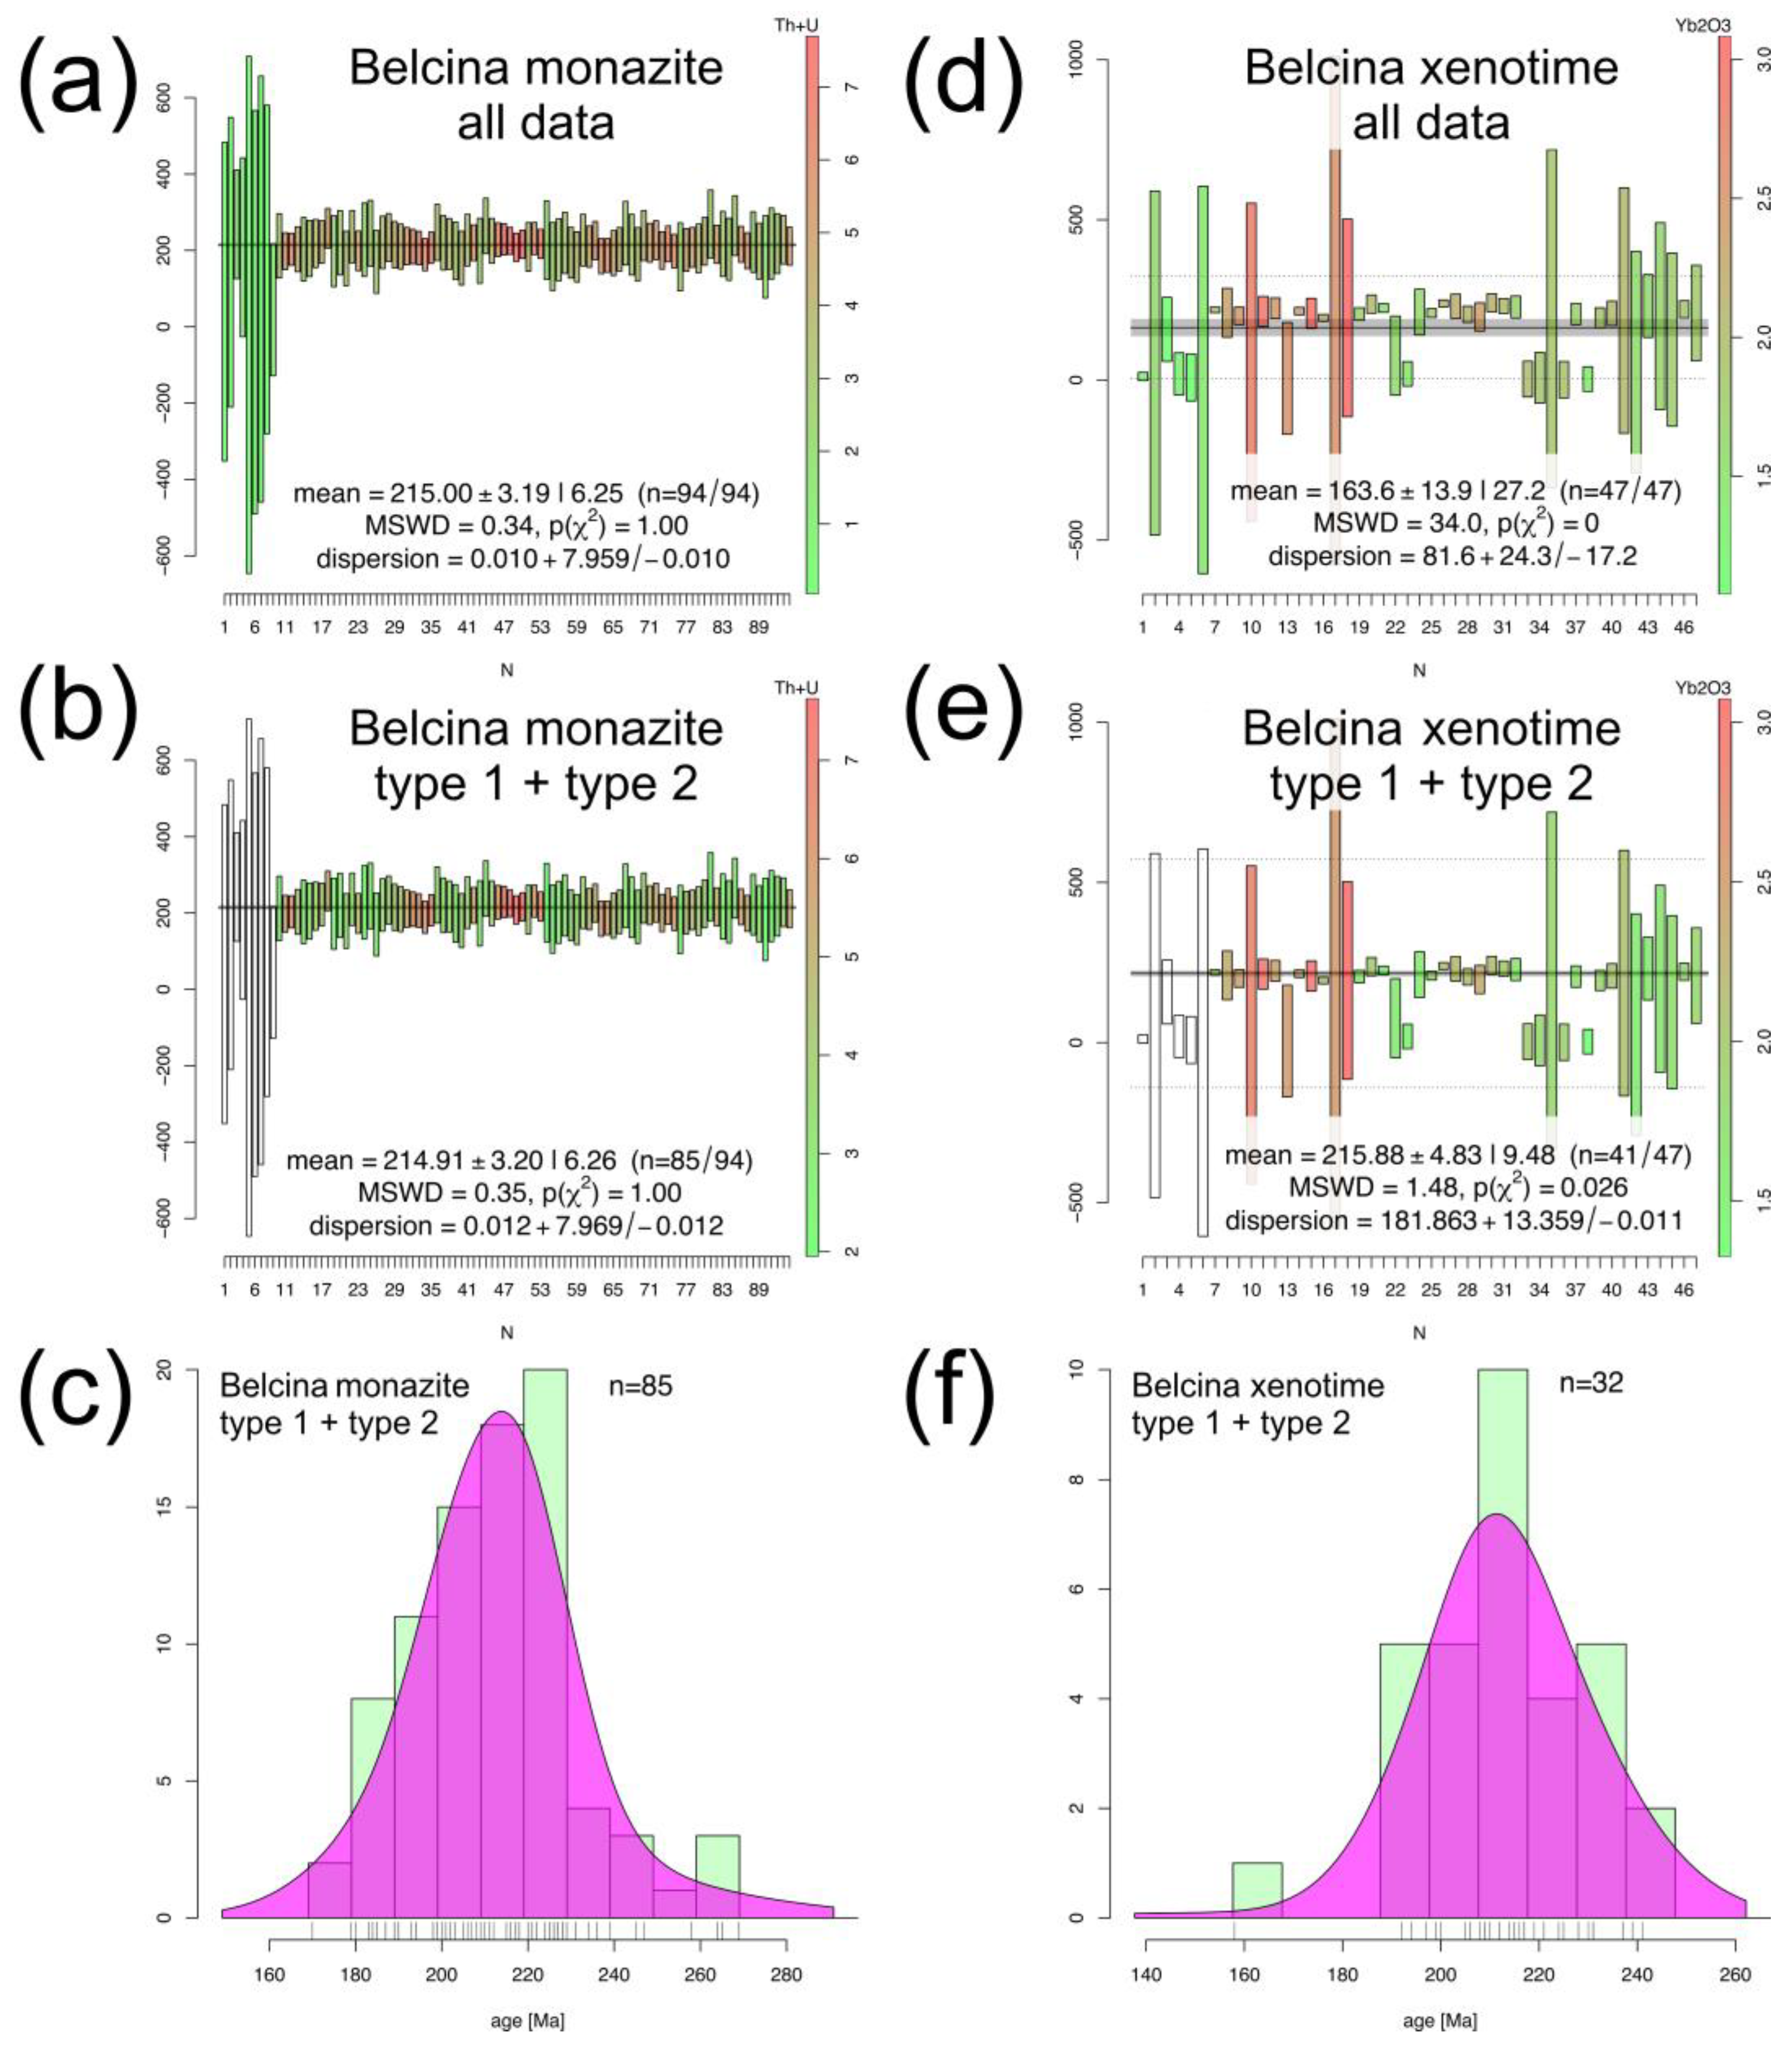
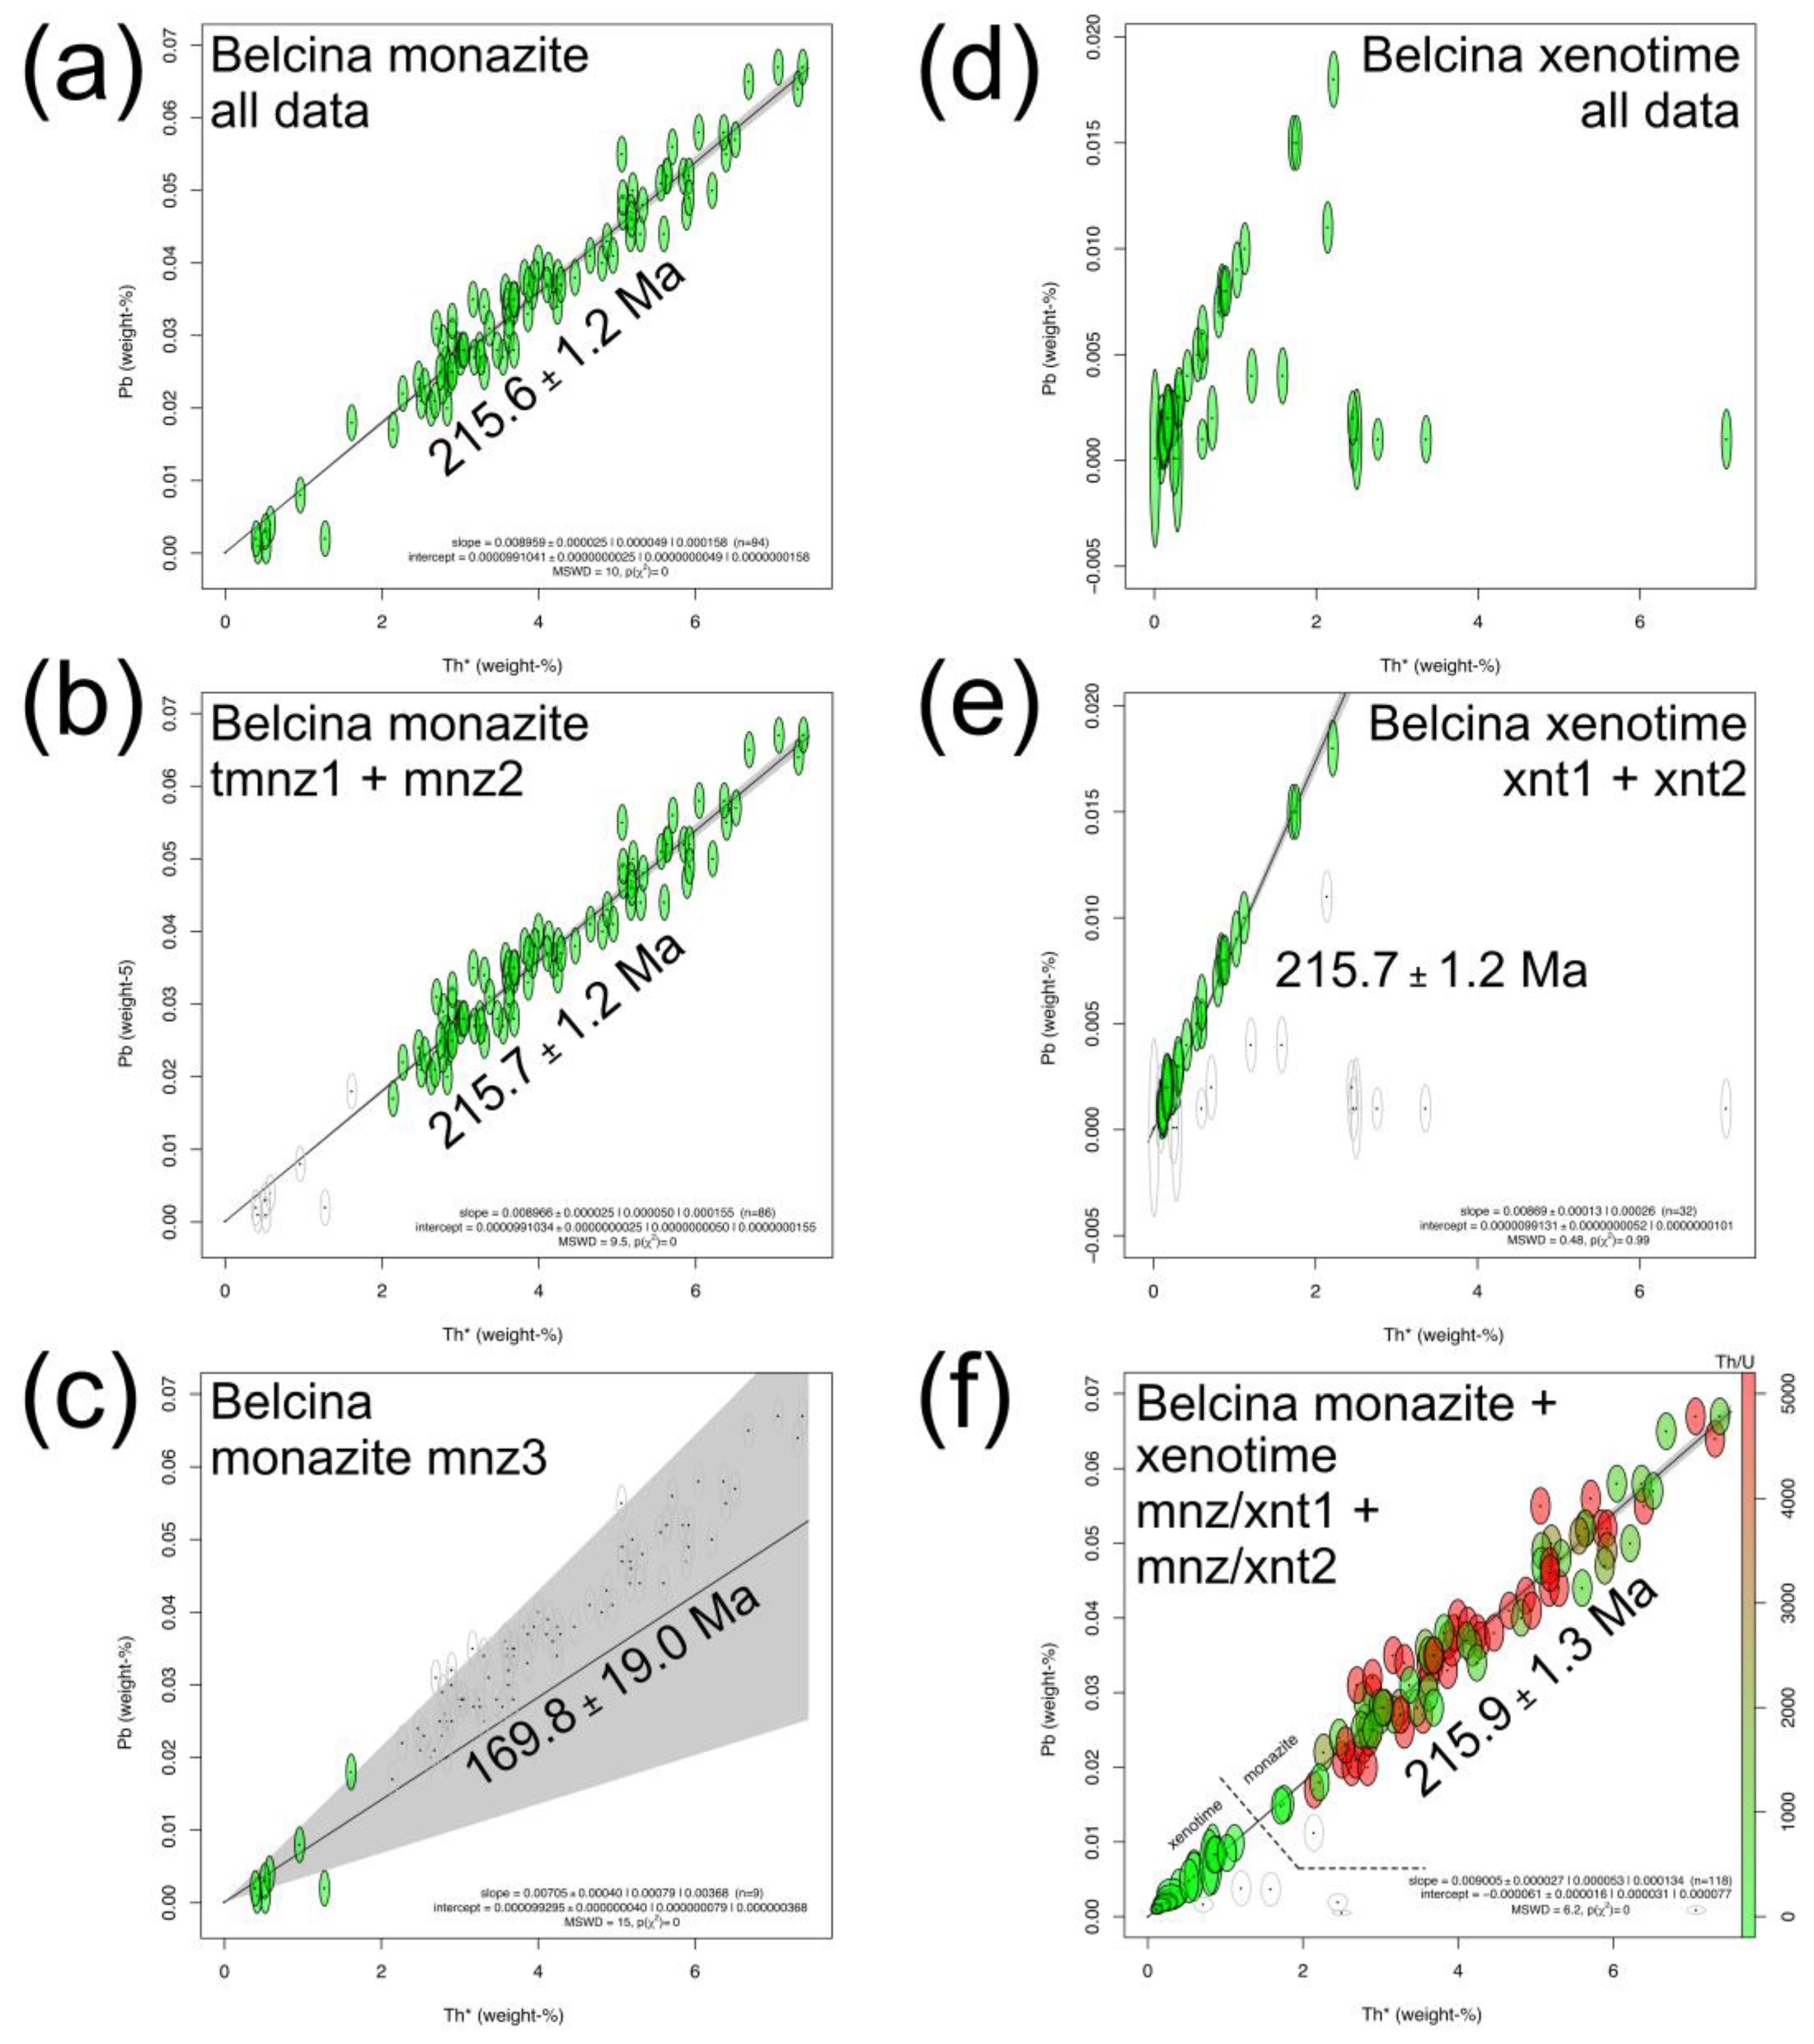
4.4. EMP (U+Th)-Total Pb Ages

4.4.1. Monazite-(Ce)

The monazite-(Ce) EMP (U+Th)-total Pb age data are presented in Figure 9 and Figure 10 and Table S1.
A total 97 of spots were analyzed on 11 crystals. The UO2 contents vary from below the EMP detection limit to 110 µg/g with an average of 21 µg/g. ThO2 varies from 0.29 weight-% to 7.35 weight-% with an average of 3.75 weight-%. PbO contents vary from below the EMP detection limit to 670 µg/g with an average of 340 µg/g. Out of the 97 analyzed spots, 94 delivered analytically useful ages in the range between 0 ± 113 Ma (1457b-04-01_mnz_1) to 717 ± 793 Ma (1457b-03-02-mnz_1). The weighted mean age of all 94 spots is 215.0 ± 6.3 Ma (Figure 9a). Compared to mnz1 and mnz2 the mnz3 ages (nine spots) show a strongly reduced analytical precision due to the lower U and Th contents (Figure 5e). The weighted mean age of the mnz3 spots is 238.4 ± 108.9 Ma. Taking only mnz1 and mnz2 spots into account (85 spots) the weighted mean age is 214.9 ± 6.3 Ma (Figure 9b). Both ages are identical within the two standard deviation uncertainties.
The mnz1 CHIME age calculated by a free regression is 216.7 ± 4.3 Ma (MSWD = 10.0). When calculated by a regression forced through the origin it is 215.4 ± 1.3 Ma (MSWD = 9.8). Mnz2 CHIME ages are 204.3 ± 11.5 Ma (MSWD = 8.1) and 218.2 ± 3.4 Ma (MSWD = 7.9), respectively. Mnz3 CHIME ages are 248.6 ± 40.4 Ma (MSWD = 14.0) and 169.8 ± 19.0 Ma (MSWD = 15.0, Figure 10c). Combining mnz1 and mnz2 results in a forced regression CHIME age of 215.7 ± 1.2 Ma (MSWD = 9.5; Figure 10b). Combining all 94 monazite-(Ce) analyses, a CHIME age of 215.6 ± 1.2 Ma (MSWD = 10.0; Figure 10a) when forced through the origin is found.
All intercepts of the free regression CHIME calculations pass within the 2-sigma uncertainty of the origin justifying the use of the forced regression CHIME age for further discussion [31,39].
Mnz3 shows reduced precision due to the comparable low actinide contents and the resulting low Pb contents.

4.4.2. Xenotime-(Y)

The xenotime-(Y) EMP (U+Th)-total Pb age data are presented in Figure 9 and Figure 10 and Table S2.
A total 47 of spots were analyzed. UO2 contents vary from below the EMP detection limit to 130 µg/g with an average of 100 µg/g. ThO2 varies from below the EMP detection limit to 770 µg/g with an average of 105 µg/g. PbO contents vary from below the EMP detection limit to 90 µg/g with an average of 70 µg/g.
All 47 spots delivered useful ages in the range of 0 ± 617 Ma (1457b-04-02_xnt_04) to 241 ± 29 Ma (1457b-02-02_xnt_12). The weighted mean age of all 47 spots is 163.6 ± 27.2 Ma (Figure 9d). Taking only xnt1 and xnt2 into account (41 spots) the weighted mean age is 215.9 ± 9.5 Ma (Figure 9e).
CHIME age systematics are: Xnt1 ages are respectively: 204.1 ± 9.3 Ma (MSWD = 0.51; free regression) and 208.7 ± 6.5 Ma (MSWD = 0.56; forced regression). Xnt2 CHIME ages are 208.7 ± 34.3 Ma (MSWD = 0.25) and 214.9 ± 24.9 Ma (MSWD = 0.26). The xnt3 data do not allow to calculate the CHIME age (Figure 10d). Combining xnt1 and xnt2 results in a CHIME age of 204.6 ± 8.9 Ma (MSWD = 0.43) and 209.1 ± 6.2 Ma (MSWD = 0.48; Figure 10e), respectively. All intercepts of the free regression CHIME calculations are within the 2-sigma uncertainty of the origin justifying the use of the forced regression CHIME age for further discussion [31,39].
Combining the monazite-(Ce) (mnz1, mnz2) and xenotime-(Y) (xnt1, xnt2) data, a forced regression CHIME age of 215.9 ± 1.3 Ma (MSWD = 6.2, Figure 10f) results.

5. Discussion

5.1. Phosphate Textures and Chemistry

5.1.1. Common Features

Both phosphates show a specific three-stage evolution depicted by both mineral chemistry and textures. A relative phosphate crystallization succession xnt1 > xnt2 > and/or + mnz1 > mnz2 > mnz3 + xnt3 + apatite can thus be derived.
Texturally, xnt1 is the oldest phosphate, only found in patchy domains and cores in the xnt2 crystals (Figure 6). We cannot unambiguously decide whether xnt1 is merely overgrown or replaced by xnt2. However, in view of the characteristics of the chemical boundaries, xnt1 was likely first partially resorbed and then subsequently overgrown by xnt2. Within the SEM spatial resolution (ca. 2 µm) no transition of xnt1 to xnt2 is visible, supporting the above interpretation. Xnt2 on the other hand is only found within mnz1 and is the most abundant xenotime-(Y) type. Xnt2 is never in contact with apatite, Fe-dolomite or the Th silicates. It is, however, in contact with Fe2O3 and the Fe-gedrite.
The most abundant rock-forming phosphate is mnz1, making up ca. 20 vol-% of the rock. It either forms xenomorphic to hypidiomorphic aggregated mineral clusters of ca. 1 cm size or independent 100 µm–500 µm sized crystals. It also is found in (relict) cores in mnz2. The two chemical trends seen on the LREE2O3-(HREE2O3 + Y2O3)-(ThO2 + UO2) ternary diagram are not related to any textural patterns. Especially, the rock-forming mnz1 and the relict mnz1 cores within the mnz2 crystals cannot be distinguished. This speaks in favor of mnz2 having overgrown mnz1. The chemical trend 1 (Figure 5e) indicates a decrease in the actinide activity in the mineralizing fluid, whereas trend 2 is related to the contemporaneous growth of xnt2 (and xnt1?) thus reducing the fluid’s HREE activity. Mnz2 always forms independent crystals of medium size and is always associated with Fe-dolomite. Chemically the two monazite-(Ce) types are similar, albeit mnz2 is somewhat REE richer and having a more pronounced Eu anomaly. However, as with the xnt1-xnt2 pair (see below), the monazite-(Ce) types form chemically independent groups without any chemical transition between them. This strongly speaks in favor of an immediate change in the REE composition and activity of the mineralizing fluid after this has evolved over some time consciously in two phases leading to the observed two trends in mnz1. Xnt3 and mnz3 are always in contact with apatite and never found as isolated crystals. They are the least abundant phosphate types, forming only comparably small crystals and are interpreted, at least in parts, as exsolution products of apatite resulting from dissolution–reprecipitation processes during metasomatic alteration of the apatite: (Ca + REE)5(PO4)3 − > Ca5(PO4)3 + (LREE)5(PO4)3 + (HREE)5(PO4)3 (e.g., [17,40,41,42]). Such an origin of xnt3 and mnz3 is also substantiated by the fact that these show the highest number of impurities. The extended paragenetic succession of the Belcina phosphates is thus xnt1 > xnt2 (>)+ mnz1 + Fe2O3 + Fe-gedrite > mnz2 + Fe-dolomite > mnz3 + xnt3 + apatite.

5.1.2. Monazite-(Ce) Chemistry

The three monazite-(Ce) types are chemically independent as they show very distinct compositional features (Figure 5c–e) without any transition of one type to the other. However, it is also important to state that each monazite-(Ce) type shows an individual chemical evolution, exemplified, for instance, by the chemical trends seen on the LREE2O3-(HREE2O3 + Y2O3)-(ThO2 + UO2) ternary diagram (Figure 5e). Strongly generalizing, an overall trend from purer monazite-(Ce) to monazite-(Ce) with a higher xenotime-(Y) and a lower actinide component is evident.
This evolutionary succession is further substantiated by the PCA.
The three monazite-(Ce) types can also clearly be resolved by their PCA Dim1-Dim2 values, where Dim1 primarily stands for the REE variance, whereas Dim2 mainly reflects the cheralite (CaTh[PO4])-huttonite (Th2[SiO4]) substitutions (Figure 8).
The mean values and their 1-sigma confidence limits show that the three monazite-(Ce) types actually can be distinguished solely on the basis of Dim1 (REE, P) contributing to 43.7% of the total compositional variance. Dim2 (Ca, Si, Fe) does not discriminate the monazite-(Ce) types as well (12.4% variance). A significant apatite (Ca5[(PO4)3]) component in mnz1 is not directly conceivable as the PCA analysis shows that there is no direct association of P and Ca. Therefore, all Ca must reside in either the cheralite or some other not identified component. Mnz1 shows the highest variation in the amount of the cheralite–huttonite substitutions, whereas mnz3 shows the highest variation in the variability of the REE composition.
As has been shown by the element–element relationships mnz1 shows the purest monazite-(Ce) composition, i.e., the highest Dim1 component of the main-constituents LREE-P, whereas mnz3 shows the highest amount of non-main-constituents contribution.
In general, the variations in the crystal-chemical compositions of the Belcina carbonate vein monazite-(Ce)s reveal that three different fractionations trends can be distinguished and that these trends are distinct for each textural monazite-(Ce) type. For instance, the xenotime-(Y) component decreases from mnz1 to mnz2, but increases in mnz3 to even higher values than in mnz1 (Figure 5e,f). These geochemical trends show that the fluids from which the various types of monazite-(Ce) crystallized had dissimilar and possibly not even related compositions.

5.1.3. Xenotime-(Y) Chemistry

The three xenotime-(Y) types are chemically independent as they show very distinct compositional features (Figure 6c–e) without any transition of one type to the other. Each xenotime-(Y) type shows an individual chemical evolution exemplified for instance by the chemical trends seen on the LREE2O3-HREE2O3-Y2O3 or Gd2O3-Er2O3-Y2O3 ternary diagrams (Figure 6e,f). Xenotime-(Y) shows a decrease in the pure YPO4-component from xnt1 to xnt3 with a concomitant increase in the monazite-(Ce) component. Notable is the very strong positive association of Si and Ca (cheralite–huttonite substitution) and the attribution of P only to xenotime-(Y) and not to apatite, as there is no positive association between P and Ca. The REE discrimination shown by the PCA can be related to the paragenetic groups:
Yb(pg) = (Ho2O3 + Er2O3 + Yb2O3 + Lu2O3 + Nd2O3): All Dim1 positive and Dim2 negative with the exception of Nd which in Dim1 negative. Lu is not significant.
Gd(pg) = (Gd2O3 + Tb2O3 + Dy2O3 + Eu2O3 + Sm2O3): All Dim1 negative and Dim2 positive with the exception of Sm which is negative in Dim2.
The aberrant behavior of Sm and Nd is attributed to the fact that both elements belong to the monazite-(Ce) component in xenotime-(Y) and thus should not be included in the paragenetic groups of xenotime-(Y).

5.1.4. Overall Interpretation

Although no systematic chemical zonations such as concentric growth zonations are visible in the investigated phosphates, we interpret all mineral chemistry data as reflecting growth conditions and not post-growth alteration. As such these mineral chemical characteristics are interpreted as giving evidence for mineral growth in at least three independent events with no transition of one event into the other.
The xenotime-(Y) and monazite-(Ce) REE mineral chemistry definitely indicates a hydrothermal origin (Figure 7a,b). However, there are certain characteristics of the REE systematics which remain to be explained. One such feature is the prominent negative mnz2 Eu anomaly. Traditionally this is explained by plagioclase fractionation from the igneous source or the coeval growth of plagioclase in a magmatic melt system [43]. As the Belcina REE carbonate mineralization can be interpreted as a hydrothermal-dominated magmatic system with plagioclase as an important phase, we can tentatively interpret mnz2 as crystallizing in the presence of plagioclase as the coeval Fe-dolomite growth probably did not lead to the formation of a negative Eu anomaly in mnz2 [44]. Texturally mnz2 is not associated with any of the three xenotime-(Y) types. This is perfectly reflected in the absence of any marked Eu anomaly in the xenotime-(Y) which could be expected to be present if any of the xenotime-(Y) would be paragenetically associated with mnz2 or plagioclase.
Other interesting features are the negative Tm and the positive Lu anomalies in the xenotime-(Y). Such anomalies have not been documented yet for hydrothermal xenotime-(Y). The only literature data suggesting the presence of a negative Tm anomaly in xenotime-(Y) comes from a sample from the peraluminous Ehrenfriedersdorf granite (Erzgebirge, Germany [45]). However, this sample is missing the positive Lu anomaly present in the Belcina xenotime-(Y). On the other hand, pegmatitic xenotimes sometime show a positive Lu fractionation, albeit at far higher HREE concentrations (Figure 7b). Additionally, pegmatitic xenotime-(Y) also show a well-developed negative Eu anomaly, which obviously is not present in the Belcina xenotime-(Y). We propose that the observed HREE anomalies are related to a typical W-type tetrad effect in xenotime-(Y). In hydrothermal phosphates, HREE tetrad effects are suggested to be caused by complexation in F-rich fluids [45,46,47]. As xnt3 is formed by the exsolution from fluorapatite, we assume the contemporary presence of such F-rich fluids in equilibrium with apatite having caused the tetrad effect in xnt3. However, such a scenario would imply, that the xnt3 and mnz3 grew contemporaneously with apatite and that they thus were not the result of a post-growth exsolution from apatite as is commonly assumed in the literature [48].
We thus propose the presence of at least three distinct mineral parageneses indicative of a three-stage hydrothermal evolution of the REE carbonate mineralization:
(a)
xnt1 + xnt2 + mnz1
(b)
mnz2 + plagioclase
(c)
xnt3 + mnz3 + apatite + Fe-dolomite
The question arises whether the phosphate mineral chemistry can directly be correlated with the crystallization temperature. Such a relation has been found in a number of investigations [13,19,49,50]. If such a relation is applicable to the Belcina REE carbonate mineralization, the observed trends in the phosphate compositions would imply that the succession xnt1/xnt2/mnz1 to xnt3/mnz3/apatite/Fe-dolomite was formed during rising temperatures. However, this interpretation cannot be unambiguous as the mineral chemistry of xnt2 and mnz2 are not directly intermediate to xnt1–xnt3 and mnz1–mnz3, respectively, as would be the case in a simple rising temperature scenario.
It is also noteworthy that at least in our samples the Belcina phosphates were not altered by post-growth processes as are often found in the form of a secondary porosity and/or secondary mineral growth (e.g., [48]).

5.2. Phosphate Ages

Mnz1, mnz2, xnt1, and xnt2 show a statistically significant weighted mean CHIME age of 215.9 ± 1.3 Ma (Norian, Upper Triassic). For a further discussion, we prefer to use this as geologically relevant. The third-generation phosphate ages are tentatively younger but associated with large analytical uncertainties and thus did not deliver geologically useful age data.
Comment on Pbc: EMP (U+Th)-total Pb ages are often thought of as not providing very reliable age information, as any non-radiogenic Pbc contribution cannot easily be detected [30,31,36]. Any undetected Pbc would render the ages to be too old, so the true (Pbc) ages would be younger, making the age difference between the phosphate-bearing veins and the intrusives even larger. However, we judge the Pbc contribution in our phosphate analyses to be insignificant. This is based on the argument that all CHIME ages show within analytical uncertainty a regression intercept at Pb (µg/g) = 0 [30,31,51]. Thus, we state that the 215.9 ± 1.3 Ma age for the phosphate-bearing veins is accurate.

5.3. Geological Implications

All published data on the DAM rocks suggest that these have experienced hydrothermal/metasomatic overprinting to strongly various degrees involving different processes and evolutionary stages. Thereby, it is stated that hydrothermal fluids particularly leached REE, HFSE and actinides from the nepheline syenites of the DAM [5,25]. The fluid source could be a late-stage carbonatite body emplaced below the DAM sensu stricto, as seen in the Spitskop Complex or Kovdor intrusions [5]. Field evidence shows that most likely mafic dykes provided the conduits for the upward migration of these hydrothermal fluids to the roof zone of the DAM. We postulate that the mineralized carbonate-phosphate veins at Belcina were derived from the same REE- and carbonate-rich hydrothermal fluid source.
The absolute ages for hydrothermal phosphate growth at Belcina (ca. 216 Ma, Middle Norian) show that the three hydrothermal stages followed rapidly after each other, as within the ascribed uncertainties no age trend could be observed for the three phosphates generations. We suggest a duration of less than 1 Ma for the complete vein formation at Belcina. On the other hand, the igneous activities in the DAM took place in the time from ca. 235 Ma (Carnian) to ca. 225 Ma (Lower Norian) [2] (Figure 11). The obvious age gap of ca. 10 Ma between the latest known igneous phase and the hydrothermal activity in Belcina (and possibly also Jolotca) is too long to support a derivation of the hydrothermal fluids directly from the youngest alkaline DAM melts. The age gap rather supports the above model that the hydrothermal fluids leading to the formation of the mineralized carbonate veins stem from a late-stage intrusion, possibly carbonatitic in composition, but at present not visible at the outcrop level. This is supported by the late-stage REE-HFSE-actinides mineralization in combination with the carbonates as such, the significant amounts of Fe oxides/hydroxides and minor sulfides of Fe, Pb, Zn, Mo and Hg, all these being typical carbonatite features. The occurrence of carbonates of different generations as gangue minerals is specific to some mineralizations generated by hydrothermal carbonatite fluids [3,4,8,23].

6. Conclusions

The Belcina REE mineralized carbonate veins situated in the contact aureole of the Ditrău Alkaline Massiv show rock-forming phosphates (monazite-(Ce), xenotime-(Y)), together with apatite, Fe-Mg-rich carbonate, thorite, thorogummite, gedrite and plagioclase. Mineral chemistry, textures and growth ages of monazite-(Ce) and xenotime-(Y) confirm that the vein formation follows a distinctive three-stage hydrothermal evolution. We propose the presence of at least three distinct mineral paragenesis indicative of the three-stage hydrothermal development of the REE carbonate mineralization:
(a)
xnt1 + xnt2 + mnz1
(b)
mnz2 + plagioclase
(c)
xnt3 + mnz3 + apatite + Fe-dolomite
The relative phosphate age succession (from older to younger) thereby is xnt1 > xnt2 > and/or + mnz1 > mnz2 > mnz3 + xnt3 + apatite. Taking into account the other mineral phases the extended paragenetic succession is xnt1 > xnt2 (>)+ mnz1 + Fe2O3 + Fe-gedrite > mnz2 + Fe-dolomite + plagioclase > mnz3 + xnt3 + apatite. Mineral chemistry shows that the phosphates crystallized from hydrothermal fluids whereby each phosphate type follows an independent evolutionary path suggesting growth from (at least) three independent and successive hydrothermal events. Chemistry and pathways with the DAM suggest that these hydrothermal fluids could be derived from a (subsurface) carbonatitic intrusion.
Mnz1, mnz2, xnt1 and xnt2 ages are tightly clustered at 215.9 ± 1.3 Ma (Norian, Upper Triassic). The third-generation phosphate ages are tentatively younger but associated with large analytical uncertainties and thus did not deliver geologically useful age data.
The three hydrothermal stages followed rapidly after each other as within the ascribed uncertainties no age trend could be observed for the three phosphates generations. We suggest a duration of less than 1 Ma for the complete vein formation at Belcina. The phosphates were not altered by post-growth processes as for instance no porosity was developed and no secondary minerals are found, i.e., fluid infiltration after the growth of the phosphates did not overprint the existing phosphates, possibly with the exception of the xnt1 generation which partly shows slight resorption effects.
The mean age of ca. 216 Ma is interpreted as timing the carbonate vein formation at Belcina. This, in line with the fluid chemistry, supports a model of the presence of a late-stage, independent carbonatitic intrusion about 10 Ma after the main igneous activity forming the DAM.

Supplementary Materials

The following supporting information can be downloaded at: https://www.mdpi.com/article/10.3390/min13060739/s1, Table S1: Monazite-(Ce) EMP data; Table S2: Xenotime-(Y) EMP data.

Author Contributions

All authors have contributed equally to the design of the study. U.K. and J.B. conducted the analytical work. All authors contributed equally to data interpretation, presentation and preparation of the manuscript. All authors have read and agreed to the published version of the manuscript.

Funding

The research activities were co-financed by the funds granted under the Research Excellence Initiative of the University of Silesia in Katowice (ZFIN11651022).

Data Availability Statement

The data presented in this study are available in Supplementary Materials, Tables S1 and S2.

Acknowledgments

Gyula Jakab (I.G. Mineral Land, Romania) and Lucian Ionescu (Romanian Waters, S.G.A Harghita, Romania) are thanked for their help in the field and discussions. Franz Biedermann (University of Vienna, Austria) is thanked for the help in sample preparation. Grzegorz Zieliński (Micro-Area Analyses Laboratory, Polish Geological Institute, Warszawa, Poland) helped with the EMP mineral analyses.

Conflicts of Interest

The authors declare no conflict of interest. The funders had no role in the design of the study; in the collection, analyses or interpretation of data; in the writing of the manuscript; or in the decision to publish the results.

References

  1. Pál-Molnár, E.; Kiri, L.; Lukács, R.; Dunkl, I.; Batki, A.; Szemerédi, M.; Almási, E.; Sogrik, E.; Harangi, H. Timing of magmatism of the Ditrău Alkaline Massif, Romania—A review based on new U–Pb and K/Ar data. Cent. Eur. Geol. 2021, 64, 18–37. [Google Scholar] [CrossRef]
  2. Klötzli, U.; Burda, J.; Li, Q.L.; Liu, Y.; Jakab, G.; Ionescu, L.; Tibuleac, P. Petrochronological evidence for a three-stage magmatic evolution of nepheline syenites from the Ditrău Alkaline Massif, Romania. Minerals 2022, 12, 657. [Google Scholar] [CrossRef]
  3. Hîrtopanu, P.; Andersen, J.C.; Fairhurst, R. Nb, Ta, REE (Y), Ti, Zr, Th, U and Te rare element minerals within the Ditrău alkaline intrusive complex, eastern Carpathians, Romania. In Mineralogy of Székelyland, Eastern Transylvania, Romania; Csik County Nature and Conservation Society: Miercurea Ciuc, Romania, 2010; pp. 89–128. [Google Scholar]
  4. Hîrtopanu, P.; Andersen, J.C.; Fairhurst, R. Thorite, thorogummite and xenotime-(Y) occurrence in Ditrău alkaline intrusive massif, East Carpathians. Proc. Rom. Acad. Sci. Ser. B 2013, 15, 111–132. [Google Scholar]
  5. Honour, V.C.; Goodenough, K.M.; Shaw, R.A.; Gabudianu, I.; Hîrtopanu, P. REE mineralisation within the Ditrău Alkaline Complex, Romania: Interplay of magmatic and hydrothermal processes. Lithos 2018, 314, 360–381. [Google Scholar] [CrossRef]
  6. Jakab, G. Geneza Masivului Alcalin Ditrau; Editura Mark House: Gheorgheni, Romania, 2017; pp. 1–166. [Google Scholar]
  7. Jakab, G. Geologia Masivului alcalin de la Ditrău; Editura Mark House: Gheorgheni, Romania, 1998; pp. 1–95. [Google Scholar]
  8. Hîrtopanu, P. New Minerals and Mineral Varieties for Romania. Vergiliu 2018, 1–395. [Google Scholar]
  9. Săbău, G. HFSE and REE vein mineralization associated to the Ditrău Alkaline Massif. In Proceedings of the XXXII International Conference on Alkaline Magmatism of the Earth and Related Strategic Metal Deposits, Apatity, Russia, 7–14 August 2015; pp. 1–2. Available online: http://alkaline.web.ru/2015 (accessed on 2 May 2023).
  10. Rudnick, R.L.; Gao, S. Composition of the Continental Crust. In The Crust. Vol 3. Treaties of Geochemistry; Elsevier: Amsterdam, The Netherlands, 2005; pp. 1–64. [Google Scholar]
  11. Goodenough, K.M.; Schilling, J.; Jonsson, E.; Kalvig, P.; Charles, N.; Tuduri, J.; Deady, E.A.; Sadeghi, M.; Schiellerup, H.; Müller, A.; et al. Europe’s rare earth element resource potential: An overview of REE metallogenetic provinces and their geodynamic setting. Ore Geol. Rev. 2016, 72, 838–856. [Google Scholar] [CrossRef]
  12. Bea, F. Controls on the trace element composition of crustal melts. Trans. R. Soc. Edinb. Earth Sci. 1996, 87, 33–41. [Google Scholar]
  13. Gratz, R.; Heinrich, W. Monazite-xenotime thermobarometry: Experimental calibration of the miscibility gap in the binary system CePO4-YPO4. Am. Mineral. 1997, 82, 772–780. [Google Scholar] [CrossRef]
  14. Spear, F.S.; Pyle, J.M. Apatite, monazite, and xenotime in metamorphic rocks. In Phosphates: Geochemical, Geobiological, and Materials Importance; Kohn, M.J., Rakovan, J., Hughes, J.M., Eds.; Mineralogical Society of America: Washington DC, USA, 2002; volume 48, pp. 293–335. [Google Scholar]
  15. Janots, E.; Engi, M.; Berger, A.; Allaz, J.; Schwarz, J.O.; Spandler, C. Prograde metamorphic sequence of REE minerals in pelitic rocks of the Central Alps: Implications for allanite-monazite-xenotime phase relations from 250 to 610 degrees C. J. Metamorph. Geol. 2008, 26, 509–526. [Google Scholar] [CrossRef]
  16. Berger, A.; Rosenberg, C.; Schaltegger, U. Stability and isotopic dating of monazite and allanite in partially molten rocks: Examples from the Central Alps. Swiss J. Geosci. 2009, 102, 15–29. [Google Scholar] [CrossRef]
  17. Harlov, D.E.; Wirth, R.; Hetherington, C.J. Fluid-mediated partial alteration in monazite; the role of coupled dissolution-reprecipitation in element redistribution and mass transfer. Contrib. Mineral. Petrol. 2011, 162, 329–348. [Google Scholar] [CrossRef]
  18. Ondrejka, M.; Putiš, M.; Uher, P.; Schmiedt, I.; Pukančík, L.; Konečný, P. Fluid-driven destabilization of REE-bearing accessory minerals in the granitic orthogneisses of North Veporic basement (Western Carpathians, Slovakia). Mineral. Petrol. 2016, 110, 561–580. [Google Scholar] [CrossRef]
  19. Engi, M. Petrochronology Based on REE-Minerals: Monazite, Allanite, Xenotime, Apatite. Rev. Mineral. Geochem. 2017, 83, 365–418. [Google Scholar] [CrossRef]
  20. Ódri, Á.; Harris, C.; Le Roux, P. The role of crustal contamination in the petrogenesis of nepheline syenite to granite magmas in the Ditrău Complex, Romania: Evidence from O-, Nd-, Sr- and Pb-isotopes. Contrib. Mineral. Petrol. 2020, 175, 100. [Google Scholar] [CrossRef]
  21. Höck, V.; Ionescu, C.; Balintoni, I.; Koller, F. The Eastern Carpathians “ophiolites” (Romania): Remnants of a Triassic ocean. Lithos 2009, 108, 151–171. [Google Scholar] [CrossRef]
  22. Balintoni, I.; Balica, C.; Ducea, M.N.; Hann, H.P. Peri-Gondwanan terranes in the Romanian Carpathians: A review of their spatial distribution, origin, provenance, and evolution. Geosci. Front. 2014, 5, 395–411. [Google Scholar] [CrossRef]
  23. Pál-Molnár, E.; Batki, A.; Almási, E.; Kiss, B.; Upton, B.G.; Markl, G.; Odling, N.; Harangi, S. Origin of mafic and ultramafic cumulates from the Ditrău Alkaline Massif, Romania. Lithos 2015, 239, 1–18. [Google Scholar] [CrossRef]
  24. Morogan, V.; Upton, B.G.J.; Fitton, J.G. The petrology of the Ditrău alkaline complex, Eastern Carpathians. Mineral. Petrology. 2000, 69, 227–265. [Google Scholar] [CrossRef]
  25. Fall, A.; Bodnar, R.J.; Szabó, C.; Pál-Molnár, E. Fluid evolution in the nepheline syenites of the Ditrău Alkaline Massif, Transylvania, Romania. Lithos 2007, 95, 331–345. [Google Scholar] [CrossRef]
  26. Batki, A.; Pál-Molnár, E.; Dobosi, G.; Skelton, A. Petrogenetic significance of ocellar camptonite dykes in the Ditrău Alkaline Massif, Romania. Lithos 2014, 200, 181–196. [Google Scholar] [CrossRef]
  27. Batki, A.; Pál-Molnár, E.; Jankovics, M.É.; Kerr, A.C.; Kiss, B.; Markl, G.; Heincz, A.; Harangi, S. Insights into the evolution of an alkaline magmatic system: An in situ trace element study of clinopyroxenes from the Ditrău Alkaline Massif, Romania. Lithos 2018, 300, 51–71. [Google Scholar] [CrossRef]
  28. Pană, D.; Balintoni, I.; Heaman, L.M. Precise U-Pb zircon dating of the syenite phase from the Ditrău Alkaline Igneous Complex. Stud. Univ. Babes-Bolyai Geologia. 2000, 45, 79–89. [Google Scholar]
  29. Pyle, J.M.; Spear, F.S.; Wark, D.A. Electron microprobe analysis of REE in apatite, monazite and xenotime: Protocols and pitfalls. In Phosphates: Geochemical, Geobiological, and Materials Importance; Kohn, M.J., Rakovan, J., Hughes, J.M., Eds.; Mineralogical Society of America: Washington DC, USA, 2002; Volume 48, pp. 337–362. [Google Scholar]
  30. Montel, J.M.; Foret, S.; Veschambre, M.; Nicollet, C.; Provost, A. Electron microprobe dating of monazite. Chem. Geol. 1996, 131, 37–53. [Google Scholar] [CrossRef]
  31. Cocherie, A.; Albarède, F. An improved U-Th-Pb age calculation for electron microprobe dating of monazite. Geochim. Cosmochim. Acta 2001, 65, 4509–4522. [Google Scholar] [CrossRef]
  32. Suzuki, K.; Adachi, M. Middle Precambrian detrital monazite and zircon from the Hida Gneiss on Oki-Dogo Island, Japan; their origin and implications for the correlation of basement gneiss of Southwest Japan and Korea. Tectonophysics 1994, 235, 277–292. Available online: http://search.proquest.com/docview/50210704?accountid=14682 (accessed on 2 May 2023). [CrossRef]
  33. Vermeesch, P. IsoplotR: A free and open toolbox for geochronology. Geosci. Front. 2018, 9, 1479–1493. [Google Scholar] [CrossRef]
  34. Dahl, P.S.; Hamilton, M.A.; Jercinovic, M.J.; Terry, M.P.; Williams, M.L.; Frei, R. Comparative isotopic and chemical geochronometry of monazite, with implications for U-Th-Pb dating by electron microprobe; an example from metamorphic rocks of the eastern Wyoming Craton (U.S.A.). Am. Mineral. 2005, 90, 619–638. [Google Scholar] [CrossRef]
  35. Klötzli, U.; Klötzli-Chowanetz, E.; Košler, J. Characterization of a new laser ablation xenotime U-Pb age standard. Geochim. Cosmochim. Acta 2010, 74, A524. [Google Scholar]
  36. Konečný, P.; Kusiak, M.A.; Dunkley, D.J. Improving U-Th-Pb electron microprobe dating using monazite age references. Chem. Geol. 2018, 484, 22–35. [Google Scholar] [CrossRef]
  37. McDonough, W.F.; Sun, S. The composition of the Earth. Chem. Geol. 1995, 120, 223–253. [Google Scholar] [CrossRef]
  38. Repina, S.A. Fractionation of REE in the xenotime and florencite paragenetic association from Au-REE mineral occurrences of the Nether-Polar Urals. Geochem. Int. 2011, 49, 868–887. [Google Scholar] [CrossRef]
  39. Suzuki, K.; Adachi, M.; Kajizuka, I. Electron microprobe observations of Pb diffusion in metamorphosed detrital monazites. Earth Planet. Sci. Lett. 1994, 128, 391–405. [Google Scholar] [CrossRef]
  40. Harlov, D.E.; Förster, H.J. Fluid-induced nucleation of (Y+REE)-phosphate minerals within apatite: Nature and experiment. Part II. Fluorapatite. Am. Mineral. 2003, 88, 1209–1229. [Google Scholar] [CrossRef]
  41. Harlov, D.E.; Prochazka, V.; Foerster, H.J.; Matejka, D. Origin of monazite-xenotime-zircon-fluorapatite assemblages in the peraluminous Melechov granite massif, Czech Republic. Mineral. Petrol. 2008, 94, 9–26. [Google Scholar] [CrossRef]
  42. Alves, F.E.A.; Neumann, R.; Ávila, C.A.; Faulstich, F.R.L. Monazite-(Ce) and xenotime-(Y) micro-inclusions in fluorapatite of the pegmatites from the Volta Grande mine, Minas Gerais state, southeast Brazil, as witnesses of the dissolution–reprecipitation process. Mineral. Mag. 2019, 83, 595–606. [Google Scholar] [CrossRef]
  43. Lipin, B.R.; McKay, G.A. Geochemistry and Mineralogy of Rare Earth Elements. In Reviews in Mineralogy; Walter de Gruyter GmbH & Co KG: Berlin, Germany, 1989; Volume 21. [Google Scholar]
  44. Chen, W.; Liu, H.Y.; Lu, J.; Jiang, S.Y.; Simonetti, A.; Xu, C.; Zhang, W. The formation of the ore-bearing dolomite marble from the giant Bayan Obo REE-Nb-Fe deposit, Inner Mongolia: Insights from micron-scale geochemical data. Miner. Depos. 2020, 55, 131–146. [Google Scholar] [CrossRef]
  45. Irber, W. The lanthanide tetrad effect and its correlation with K/Rb, Eu/Eu*, Sr/Eu, Y/Ho, and Zr/Hf of evolving peraluminous granite suites. Geochim. Cosmochim. Acta 1999, 63, 489–508. [Google Scholar] [CrossRef]
  46. Duc-Tin, Q.; Keppler, H. Monazite and xenotime solubility in granitic melts and the origin of the lanthanide tetrad effect. Contrib. Mineral. Petrol. 2015, 169. [Google Scholar] [CrossRef]
  47. Anenburg, M.; Williams, M.J. Quantifying the Tetrad Effect, Shape Components, and Ce–Eu–Gd Anomalies in Rare Earth Element Patterns. Math. Geosci. 2022, 54, 47–70. [Google Scholar] [CrossRef]
  48. Tramm, F.; Wirth, R.; Budzyń, B.; Sláma, J.; Schreiber, A. LA-ICP-MS and TEM constraints on the magmatic and post-magmatic processes recorded by the zircon-xenotime intergrowth in pegmatite (Piława Górna, Góry Sowie Block, SW Poland). Lithos 2021, 404, 106480. [Google Scholar] [CrossRef]
  49. Daniel, C.G.; Pyle, J.M. Monazite-xenotime thermochronometry and Al2SiO5 reaction textures in the Picuris range, northern New Mexico, USA: New evidence for a 1450-1400 Ma orogenic event. J. Petrol. 2006, 47, 97–118. [Google Scholar] [CrossRef]
  50. Daniel, C.G.; Pyle, J.M. Integrating monazite and xenotime thermochronology to determine the timing and nature of the Al2SiO5 triple-point metamorphism in the Picuris mountains, New Mexico, USA. Geochim. Cosmochim. Acta 2010, 74, A206. [Google Scholar]
  51. Suzuki, K.; Adachi, M.; Kato, T.; Yogo, S. CHIME dating method and its application to the analysis of evolutional history of orogenic belts. Geochemistry 1999, 33, 1–22. [Google Scholar]
Figure 3. Thin section images of the Belcina carbonate mineralized vein sample. The sample can be divided into a coarse-grained part (1457-A) and a brecciated part (1457-B). Mineral phases identified by optical microscopy are labeled. The fine-grained aggregates, often forming pseudomorphoses, are only to be characterized by BEI or EMP analyses and are not labelled. (a) 1457-A plane-polarized light and (b) crossed-polarized light. (c) 1457-B plane-polarized light and (d) crossed-polarized light. Mineral abbreviations are: Ap = apatite, Dol = Fe-dolomite, Ged = Fe-gedrite, Kfsp = K-feldspar, Mnz = monazite, Plag = plagioclase, Th = thorite, Xnt = xenotime.
Minerals 13 00739 g003
Figure 4. (ad) True and false color BEI of the Belcina carbonate mineralized vein sample 1457 showing the different mineral parageneses and assemblages. Due to the reduced contrast resolution of these images, xnt1 is not visible but is situated in the cores of the xnt2 crystals.
Minerals 13 00739 g004
Figure 5. BEI and chemistry of monazite-(Ce) from the Belcina carbonate mineralized vein sample 1457 (Table S1). (a) False color BEI of the three characteristic textural monazite-(Ce) occurrences; (b) Normalized REE diagram using normalization values from [37]. The blue-shaded areas define the overall variation in REE contents. The thick blue lines denote the average REE composition of the three textural monazite-(Ce) types. (Note: The heavy REEs Ho to Lu are not shown as these were not determined due to EMP analytical limitations); (c) La/Ce versus Eu anomaly diagram depicting the distinctly different chemical composition of the three textural monazite-(Ce) types; (d) Age versus Eu anomaly diagram); (e) LREE2O3-(HREE2O3 + Y2O3)-(ThO2 + UO2) ternary diagram. Note that there are two linear trends seen in the mnz1 data; (f) REE2O3-HREE2O3-Y2O3 ternary diagram.
Minerals 13 00739 g005
Figure 6. BEI and chemistry of xenotime-(Y) from the Belcina carbonate mineralized vein sample 1457 (Table S2). (a) False color BEI of three characteristic textural xenotime-(Y) occurrences; (b) Normalized REE diagram (normalization values are from [37]. Red- to yellow-shaded areas define the overall variation in REE contents. The thick red-yellow lines denote the average REE composition of the three textural xenotime-(Y) types. (Note: The light REEs La to Pr are not shown as these were not determined due to EMP analytical limitations); (c) Plot of Y2O3 versus the ratio of the isomorphous mixtures of the paragenetic groups of [38]: Yb(pg) = (Y2O3 + Ho2O3 + Er2O3 + Yb2O3 + Lu2O3 + Nd2O3); Gd(pg) = (Gd2O3 + Tb2O3 + Dy2O3 + Eu2O3 + Sm2O3); (d) Age versus paragenetic group ratio diagram; (e) LREE2O3-HREE2O3-Y2O3 ternary diagram; (f) Gd2O3-Er2O3-Y2O3 ternary diagram.
Minerals 13 00739 g006
Figure 7. Chondrite normalized REE plots showing a comparison with the mean chondrite normalized REE literature values of hydrothermal, magmatic, metamorphic and pegmatite monazite-(Ce) and xenotime [14,15,16,17,18,19], respectively. Due to detection limit restrictions of the EMP analyses, only the La-Dy data for monazite-(Ce) and the Nd-Lu data for xenotime-(Y), respectively, are available. (a) Monazite-(Ce): mnz1 and mnz3 follow a hydrothermal trend, to a lesser extent a metamorphic one, albeit at somewhat higher absolute concentrations of the MREE and HREE. Both trends are characterized by having only a small negative Eu anomaly (0.66 and 0.84, respectively). Mnz2 is not following this picture as having a marked negative Eu anomaly (0.09) more akin to a magmatic or pegmatitic origin. Normalization values are from [37]. (b) Xenotime-(Y): xenotime-(Y) shows an increase in LREE and MREE from xnt1 to xnt3, a cross-over of the trend at Ho and a corresponding decrease in the heaviest REEs (Er-Lu) from xnt1 to xnt3. Xnt1 has a very small positive Eu anomaly, xnt2 has none, whereas xnt3 has a small negative one. Compared to the mean trends from the literature, the Belcina xenotime-(Y) is strongly enriched in Nd and strongly depleted in Tm and Yb. Otherwise, they follow a trend similar to the trend of hydrothermal xenotimes-(Y) and less the one for metamorphic xenotime. Notable is the enrichment of all three xenotime-(Y) types in Lu.
Minerals 13 00739 g007
Figure 8. Principal component analysis (PCA) of the Belcina carbonate mineralized vein sample 1457. Elements used for the monazite-(Ce) PCA are: Y, Si, Al, K, Ca, P, S, Fe, Sr, La, Ce, Pr, Nd, Sm, Eu, Gd, Dy, U, Th. Elements used for the xenotime-(Y) PCA are: Si, Ti, Ca, S, Ho, Y, Sr, K, P, Fe, Nd, Sm, Eu, Gd, Tb, Dy, Er, Tm, Yb, Lu. All other analyzed elements (Tables S1 and S2) were not included in the PCA. (a) Monazite-(Ce); (d) xenotime-(Y): Screen plots showing the 10 most important variance components (eigenvalues). Components (principal dimensions) Dim1 and Dim2 allow us to statistically characterize the three monazite-(Ce) types found in the sample adding up to >50% of the total variance, whereas components 1 to 3 make up for more than 65% of the total variance. (b) Monazite-(Ce); (e) xenotime-(Y): Polar plots showing the element contribution to the most important variance dimensions Dim1 and Dim2. The length and coloring of the element vectors indicate their relative variance contribution. Parallel vectors indicate a positive correlation of the respective element concentrations whereas anti-parallel vectors indicate a negative correlation. (c) Monazite-(Ce); (f) xenotime-(Y): Dim1-Dim2 scatter plot of all analyses delineating the three different phosphate types, their mean value and a 1-sigma uncertainty ellipse.
Minerals 13 00739 g008
Figure 9. Belcina monazite-(Ce) and xenotime-(Y) (U+Th)-total Pb spot ages (Tables S1 and S2). (a) Histogram of all 94 monazite-(Ce) spots. (b) Histogram of the 85 spots from mnz1 and mnz2. (c) Kernel density function of the 85 spots from mnz1 and mnz2 showing a near-perfect normal distribution of the (U+Th)-total Pb spot ages. (d) Histogram of all 47 xenotime-(Y) spots. (e) Histogram of the 41 spots from xnt1 and xnt2. (f) Kernel density function of the 32 most precise spots from xnt1 and xnt2 showing a near-perfect normal distribution of the (U+Th)-total Pb spot ages. The (U+Th)-total Pb spot ages are color-coded according to the Th/U ratio. The mean ages are weighted means without any outlier detection. Kernel density functions are calculated with a kernel density bandwidth of 7 Ma and the adaptive KDF option of IsoplotR [33].
Minerals 13 00739 g009
Figure 10. Belcina monazite-(Ce) and xenotime-(Y) (U+Th)-total Pb CHIME (Chemical Isochron Method) ages [32] (Tables S1 and S2). (a) Monazite-(Ce) CHIME age calculated for all 94 spots. (b) Monazite-(Ce) CHIME age calculated for the 85 mnz1 and mnz2 spots. (c) Monazite-(Ce) CHIME age calculated for 9 mnz3 spots. (d) Xenotime-(Y) CHIME diagram for all 47 spots. (e) Xenotime-(Y) CHIME age calculated for the 32 xnt1 and xnt2 spots. (f) CHIME diagram showing the combination of mnz1 + mnz2 + xnt1 + xnt2. The spots are color-coded according to the Th/U ratio.
Minerals 13 00739 g010
Figure 11. Compilation of the postulated formation age of the Belcina carbonate mineralized veins, the mean intrusion ages for the alkaline rocks of the DAM and the age ranges for metasomatic/hydrothermal overprinting and mineral cooling ages. Data is from (1)—[28]; (2)—[1]; (3)—[2]; (4)—this work.
Minerals 13 00739 g011
Disclaimer/Publisher’s Note: The statements, opinions and data contained in all publications are solely those of the individual author(s) and contributor(s) and not of MDPI and/or the editor(s). MDPI and/or the editor(s) disclaim responsibility for any injury to people or property resulting from any ideas, methods, instructions or products referred to in the content.

