Article

Mechanism for the Combined Li–Na Ionic Conductivity in Sugilite (Fe2Na2K[Li3Si12O30])-Type Compounds

1
Department of Geo- and Environmental Sciences, Section of Crystallography, Ludwig-Maximilians-Universität München (LMU), Theresienstr. 41C, 80333 Munich, Germany
2
Department of Earth System Sciences, Institute of Mineralogy and Petrography, University of Hamburg, Grindelallee 48, 20146 Hamburg, Germany
3
Heinz Maier-Leibnitz Zentrum (MLZ), Technische Universität München, Lichtenbergstr. 1, 85748 Garching, Germany
4
Mineralogische Staatssammlung München (SNSB), Theresienstr. 41C, 80333 Munich, Germany
*
Author to whom correspondence should be addressed.
Minerals 2023, 13(5), 620; https://doi.org/10.3390/min13050620
Submission received: 23 March 2023 / Revised: 26 April 2023 / Accepted: 27 April 2023 / Published: 28 April 2023

Abstract

:
This study explains the ionic conductivity in the mineral sugilite (idealized formula: Fe2Na2K[Li3Si12O30]) by resolving the dynamic disorder of both Li and Na cations using synchrotron X-ray single-crystal diffraction from 298 K to 1023 K. Non-zero anharmonic atomic displacement parameters at Na and Li sites at 1023 K adumbrated long-range charge transport routes for Li and Na cations commonly parallel to the (ab) plane. Temperature-enhanced diffuse residuals in Fourier maps could unambiguously localize two interstitial sites suitable for Li, as well as three for Na. Each two-dimensional (2D) network of Li and Na interstitials was formed parallel to each other, providing Li and Na hopping pathways. The higher concentration of Na cations hopping in short distances of 2.0962(4)–2.3015(5) Å could be the main reason for the higher bulk conductivity values evaluated by impedance spectra of sugilite in comparison to those of its structural relatives with low Na contents, e.g., the mineral sogdianite ((Zr,Al,Fe)2Na0.36K[Li3Si12O30]). Bond valence sum landscape maps supported the critical role of dynamic disorder of Na+ over densely packed 2D interstitial networks for combined ionic conductivity along with mobile Li+ in sugilite-type compounds.

Graphical Abstract

1. Introduction

Over the last three decades, enormous efforts have been devoted to advancing Li+- and Na+-based all-solid-state batteries by exploiting a variety of electrode and electrolyte materials ([1,2,3,4,5,6,7,8,9], literature therein). Considering the limitation and shortage of Li resources on the one hand and the molar weight of Na being much heavier than Li on the other hand, the use of combined Li–Na ionic conductors can help manufacture alternative, superior systems with a high number of charge carriers for energy storage and conversion. In this respect, it is worthwhile to continue research for prototype structures containing both Li and Na. A desired solid-state electrolyte based on combined Li–Na ionic conductivity may exhibit several relevant properties, such as: the presence of short pathways available for the hopping of Li+ and Na+; the presence of a crystal-chemical basis for the formation of solid solutions and defect engineering; a high mechanical and thermal stability; a high number of charge carriers conducting in the same direction; etcetera.
In exploring prototype structures for Li–Na ionic conductors [10,11], the milarite family is regarded as a highly interesting candidate due to a highly flexible choice for its framework and non-framework constituents with general formula A2B2C[T(II)3T(I)12O30] (A = Sn4+, Ti4+, Zr4+, Fe3+, Al3+; Mg2+; Zn2+; B = Na+, H2O, vacancy; C = Na+, K+; T(I) = Si4+, Al3+; T(II) = Li+, Be2+, Mg2+, Zn2+) [12,13,14,15,16]. These structure group members show the hexagonal space group symmetry P6/mcc with a ≈ 10 Å and c ≈ 14 Å.
Among Li-bearing milarite-type compounds [10,11,17,18,19,20,21,22], sogdianite contains Zr4+ as the main element at the octahedral A site but is mostly empty at the B site (6+3)-coordinated with framework oxygens, while sugilite is Fe3+-rich at the A site (Figure 1a), and Na fully occupies the B site (Figure 1b). A DC conductivity value of 1.7 × 10⁻³ S·cm−1 of sugilite at T = 943 K, which was estimated from a frequency-independent part on Bode plots of impedance spectra (IS) ([23] and this study), is two orders of magnitude higher than that of sogdianite [10]. Hence, the ionic conductivity in this topology can be dictated by the amount of Na at the B site for the same amount of Li at the T(II) site. Na cations compensate electrostatically the negative-charged framework unit [Fe2Li3Si12O30]3− but also may play a critical role for the charge transport in sugilite.
To simplify the chemical content at the A site exclusively with Fe3+ while having the maximal Na content at the B site, a sugilite analogue, Fe3+Na2K[Li3Si12O30], was synthesized under mild hydrothermal conditions [11]. In this previous study, we detected diffuse density distribution of neutron scattering lengths (nsl) of Li and Na from difference Fourier (ΔF) maps evaluated with high-resolution neutron powder diffraction (HRNPD) data from 298 to 1123 K. This observation pointed to a high dynamic disorder of Li and Na in Fe3+Na2K[Li3Si12O30] and their 2D hopping paths, which were strongly anisotropic parallel to the (ab) plane. In the sugilite structure, there were several interstitials around 12-membered rings (MRs) of LiO4–FeO6 polyhedra (Figure 2a), other spacious interstitial sites around K at the C site (Figure 2b), and empty 6MRs in the middle of two neighboring B sites (Figure 2c). Using HRNPD, we could resolve only two interstitial sites: one Li interstitial site possibly at (0.3333, 0, 0.25) around 12MRs of LiO4–FeO6 and another one for the Na interstitial at (0.5, 0.5, 0) between neighboring B sites.
Furthermore, atomic displacement parameters (ADPs) of Li and Na in Fe3+Na2K[Li3Si12O30] could not be described even by harmonic terms as there were triangle-like residual diffuse nsl densities around the B site on the (ab) plane. In addition, depletion of Na in the upper and lower direction from the B site was speculated, with a large value of ADP in the crystallographic c axis (U33). However, HRNPD data did not allow determination of the high orders of anharmonic ADPs of Na, and second anharmonic ADPs (non-distorted thermal ellipsoids) of Li could not be refined without high correlations.
Determination of such relevant structural parameters demands neutron single-crystal diffraction (NSD) with a large single crystal. However, no synthetic sugilite crystals that were large enough and of high quality were available. Fortunately, we obtained a rarely occurring single crystal of the mineral sugilite. Its size was not sufficient for NSD but large enough for X-ray single-crystal diffraction (XSD). To refine anharmonic ADPs in the present study, synchrotron XSD was performed with a short wavelength of 0.6 Å. Analyses with XSD data sets gave more reliable structural information and accurate locations of the Li and Na interstitials available for hopping Li+ and Na+. Consequently, the charge transport mechanism in sugilite could be understood, as follows.

2. Materials and Methods

2.1. Materials

Two different mineral samples of sugilite were characterized by this study. One sample was a high-quality single crystal with a size of 0.3 mm diameter and 1 mm length (denoted Sugilite#1), originating from Wessels Mine, Kalahari, South Africa. Sugilite#1 was used to collect synchrotron XSD data sets for structure analyses. Another dense mass of fine crystalline sugilite sample (denoted Sugilite#2) from Dara-i-Pioz Massif, Tajikistan, was used to carry out IS and HRNPD, which required a high sample amount.

2.2. Electron Probe Micro Analysis (EPMA)

EPMA was carried out using an electron microprobe (Camebax SX100). It was operated at 15 keV acceleration voltage and 20 nA beam current. Synthetic periclase (Mg), hematite (Fe), natural ilmenite (Mn, Ti), synthetic wollastonite (Si), natural albite (Na, Al), and orthoclase (K) were used as standards, and matrix correction was performed by using the PAP procedure [24]. Unlike traditional ZAF procedures, PAP is a general model for the calculation of X-ray intensities. Raw data processed by ZAF software are usually lower by ca. 1%, as demonstrated by Hunt et al. [25]. The reproducibility of standard analyses was <1% for each element routinely analyzed. The light element Li was not determined by EPMA.

2.3. High-Resolution Neutron Powder Diffraction (HRNPD)

HRNPD was conducted at the instrument SPODI [26] (neutron facility FRM2, Garching near Munich, Germany) to identify phases in the natural mass sample Sugilite#2 ahead of IS data acquisition. About 1 g of powder taken from Sugilite#2 was finely ground, packed into a V can, and positioned within a high-temperature furnace under vacuum at 973 K. Using a wavelength of 1.5481 Å (Ge(551) monochromator), HRNPD data were collected on 80 vertically aligned PSDs with 300 mm high collimators in a 2θ range of 1°–155° in steps of 0.05°.

2.4. Impedance Spectroscopy (IS)

A thin plate (1 mm thickness, 3.5 × 5 mm2 in area) was cut from the mass of Sugilite#2. The plate surface area was covered with Pt paste and tempered at 473 K to remove organic glue. The sample was positioned between two Pt electrodes and brought into a homemade HT probe to acquire impedance spectra using a Hewlett Packard 4284A LCR meter. A NiCr–Ni thermocouple located next to the sample was connected to a temperature controller maintaining a constant sample temperature with the accuracy of ±1 K. For data evaluation with less grain boundary effect, we used the IS recorded at cooling from 1064 K down to 300 K in steps of 30 K in the frequency interval of 20 Hz to 1 MHz.

2.5. Synchrotron X-ray Single-Crystal Diffraction (XSD)

The single crystal in a size of 0.036 mm3 cut from Sugilite#1 was fixed tightly with fibrous glass wools within a silica glass capillary for XSD data collection from 298 K up to 1023 K using a N2 gas stream heater.
XSD was performed on a four-circle kappa single-crystal diffractometer at the instrument F1 (DORIS, HASYLAB, DESY). Intensities were registered with a CCD camera (marCCD 165) positioned 60 mm from the crystal with a wavelength of 0.6 Å (Si(111) monochromator). To ensure a high-resolution range up to 0.4 Å and a high redundancy, several φ scans were conducted at 2θ = 0°, ω = 0, χ = 0°, and Δφ = 1° with an exposure time of 10 s/frame; 2θ = −60°, ω = 0, χ = 0°, Δφ = 1° with 30 s/frame; and 2θ = −60°, ω = 30, χ = 60°, Δφ = 1° with 30 s/frame.
Using the software package XDS [27], data reduction was performed for indexing, Lorentz–polarization correction, integration, scaling, and cell parameter refinements. The obtained hkl files were corrected for oblique phosphor incidence using the program PHOSCOR [28]. An anisotropic absorption correction was performed semi-empirically with direction cosines of reflections using the program SORTAV [29]. Data reduction of XSD data sets resulted in data quality residual Rmerge, as given with experimental parameters in Table 1.

2.6. Structure Analysis

Rietveld refinements with HRNPD at 973 K were carried out using the program package JANA2006 [30] with an initial starting model delivered by the Rietveld analyses with HRNPD data at 923 K from our previous study [11]. The background was fitted with a Legendre polynomial. Profile parameters were described by pseudo-Voigt function. The occupancy parameter (OCC) at the A site was fixed with respect to a normalized nsl value of Fe coexisting with Mn and Al based on their atomic ratios resulting from EPMA analyses on Sugilite#2. The other OCCs were fixed to full occupation according to the idealized formula unit (see Results and Discussion). Under this condition, all possible free atomic parameters, including anisotropic ADPs at all sites, were refined with a small negative nsl of Li (−1.90 fm) and allowed determination of a direction-independent ADP at T(II) only.
Structure refinements with XSD data were carried out by the least-squares method against the squared structure factor (F2) with an option for difference Fourier (ΔF) synthesis implemented in JANA2006. As a starting model in structure refinements with 298 K XSD data, we took the structure model refined by Rietveld analysis with HRNPD of Fe3+Na2K[Li3Si12O30] at 300 K [2]. The resulting model was used as the successive starting models for further analyses with XSD data sets collected at higher temperatures. For each structure refinement, all atomic sites were constrained to be fully occupied based on results from EPMA. The occupancy parameter at the A site was fixed to 0.925, which corresponds to full occupation of Fe statically distributed with Mn, Al, and Mg according to their chemical contents in Sugilite#1. Anisotropic ADPs for all atomic sites at all measuring temperatures could be refined. In addition, non-zero third order anharmonic ADPs of Li at the T(II) site and third and fourth anharmonic ADPs of Na at B sites were determined at the highest measuring temperature, 1023 K.
Bond valence sum (BVS [31]) values were derived from individual bonding distances of the refined structure models. The isosurfaces of energy landscape maps [32] for Li+ and Na+ were obtained from BVSs from 1023 K XSD data analyses using an interface, BondStr, imbedded in the package FullProf Suite [33]. Refined structure models were visualized using the program VESTA [34].

3. Results and Discussion

3.1. Results from EPMA

EPMA on the single crystal sample Sugilite#1 resulted in the atomic ratios of Na2.0(1):K0.98(2):Fe1.67(3):Mn0.11(2):Al0.13(1):Mg0.04(3):Si12.000(1) with a trace of Mg. The light species Li could not be determined reliably using EPMA, but it is well known that there are 12 Si and 3 Li atoms at T(I) and T(II) sites, respectively, for 30 O per formula unit (pfu) in sugilite–sogdianite solid solutions [10,11,17,18,19,20,21,22]. Fe3+ is the main species occupying the A site in sugilite with various minor species such as Mn3+, Al3+, and Mg2+. Considering a high uncertainty in the minor component Mg and ensuring the electrostatic neutrality, we could suggest an idealized formula unit (Fe1.7Mn0.1Al0.1Mg0.1)Na2K[Li3Si12O30] for Sugilite#1.
EPMA on the crystalline mass sample Sugilite#2 gave rise to K1.03(1):Na2.0(2):Fe1.3(3):Mn0.3(1):Al0.4(1) without Mg trace and, hence, an idealized formula unit (Fe1.3Mn0.3Al0.4)Na2K[Li3Si12O30].
Both mineral compounds showED the maximal number of Na at the B site with varied static disorder at the A site, belonging to the Fe-rich endmember Fe2Na2K[Li3Si12O30] of the sugilite–sogdianite solid solution.

3.2. Phase Identification of Sugilite#2 Using HRNPD

The aim of Rietveld analysis with 973 K HRNPD data was to check the pure phase along with the thermal stability of the sample Sugilite#2, on which IS were probed up to 1064 K. HRNPD data analysis confirmed the sugilite compound (Fe1.3Mn0.3Al0.4)Na2K[Li3Si12O30] as the single phase in Sugilite#2, graphically presented in Figure 3 with a good agreement factor, wRprofile = 0.052. Lattice parameters of Sugilite#2 were a = 10.0794(7) Å and c = 14.1057(19) Å at 973 K. Refined atomic parameters are listed in Supplementary S1.

3.3. Thermally Activated Relaxation Modes and Activation Energies from IS

Nyquist plots (the real part Z’ against imaginary part Z” of impedance Z acquired on Sugilite#2) showed incomplete, large semicircles for high resistivity below 550 K, but, above 550 K, at least two semicircles superimposed from high- to low-frequency (LF) regions were visible (Supplementary S2). Both HF and LF semicircles decreased at elevated temperatures, indicating thermally activated charge transport processes. Both resonances were associated with the HF and LF relaxation modes ν (HF) and ν (LF), respectively. Their shifts toward higher-frequency regions at elevated temperatures could also be clearly seen by plotting Z” against the logarithmic scale of frequencies (Figure 4).
As shown in Supplementary S2a,b, IS from 615 K up to 827 K could be fitted to two serially connected RC circuits where R represents resistance of the mobile species, and Q is the frequency-independent constant phase element. The latter derives from a capacitor with phase angle shift in the impedance complex planes with depressed semicircles [35]. The HF mode is associated with the bulk conductivity [11]. The LF mode is probably related to the grain boundary resistance with a discrete nature in our compact sample Sugilite#2. The subscript ‘1’ of R1 and Q1 represents the ν(HF) mode of the bulk intragrain conductivity, while the subscript ‘2’ of R2 and Q2 is the ν(LF) mode assigned to the charge transport in grain boundaries. As an example, Figure 5 presents results from fitting the IS of Sugilite#2 ((Fe1.3Mn0.3Al0.4)Na2K[Li3Si12O30]) at 646 K.
In Figure 4, it can be clearly seen that ν(LF) moved fast into the regime of ν(HF) above 700 K, and both resonance modes were nearly out of the measuring frequency range above 900 K. The inductive tail at the LF end was very possibly due to relaxation from electrode interface effects. Accordingly, IS in the high-temperature region 857–1064 K (Supplementary S2c) could be fitted with an additional Warburg impedance element (W). This describes a contribution of electron diffusion to/from the Pt electrode to impedance. This supported ionic bulk conductivity in our sugilite powder sample.
DC ionic conductivity values estimated from fitted HF semicircles increased from 3.08 × 10⁻⁸ S·cm−1 at 585 K to 6.18 × 10⁻⁵ S·cm−1 at 827 K. Those from fitted LF semicircles showed higher conductivity values, i.e., 9.30 × 10⁻⁷ S·cm−1 and 2.46 × 10⁻⁴ S·cm−1 at 585 and 827 K, respectively. One might mention that IS acquired on a fragile pellet of the synthetic powder sample of Fe2Na2K[Li3Si12O30] [11] resulted in lower bulk conductivity values, e.g., 1.2 × 10⁻⁵ S·cm−1 at 923 K. A comparable value resulted from the HF semicircle at 767 K on Sugilite#2. This discrepancy can be assigned to fast intergrain charge transport in the naturally occurring compact mass of Sugilite#2, implying that the intergrain charge transport process dictates the bulk conductivity in pressings of fine crystallites.
Arrhenius plots with DC conductivity values from fitted HF and LF semicircles allowed the delivery of the respective activation energies (Ea), as shown in Figure 6: Ea(HF) = 1.39(1) eV in 585–916 K and Ea(LF) = 1.49(7) eV in 676–827 K. The former was associated with the energy barrier for intrinsic ionic motions in Sugilite#2, and the latter with extrinsic charge transport over grain boundaries. An ionic conductivity value of 2.04 × 10⁻³ Scm−1 was estimated at 1064 K with Ea(HF) = 1.06(3) eV for the bulk ionic conductivity in the high-temperature range of 946–1064 K.
The IS study concluded that sugilite-type materials are suited for electrochemical cells operated at high temperatures ([36], references therein). The bulk ionic conductivity in sugilite is much higher than that in its narrowly related silicates with six-membered rings (6MRs) and chains (6MCs) so far investigated [10,11,23,37,38,39,40]. This can be explained by the unique topology of sugilite, described in the following sections.

3.4. Results from XSD

3.4.1. Thermal Stability

The lattice metrics expanded by 0.34% and 0.40% in a and c from 298 K to 1023 K with a small volume change of 1.1% (Table 1; Supplementary S3). This was comparable to the synthetic counterpart of the pure-Fe endmember Fe2Na2K[Li3Si12O30], showing 0.30% and 0.48% expansions from 298 K to 1123 K in a and c, respectively [11]. Such direction-dependent thermal behavior in the sugilite-type compounds reflects the (2+1)-dimensional framework properties as the double 6MRs of rigid [SiO4] tetrahedra were connected to each other strongly in the (ab) plane via [LiO4–AO6] chains. Sugilite-type compounds were thermally persistent at least up to 1123 K while retaining the hexagonal space group symmetry P6/mcc (#192) ([11], this study]).

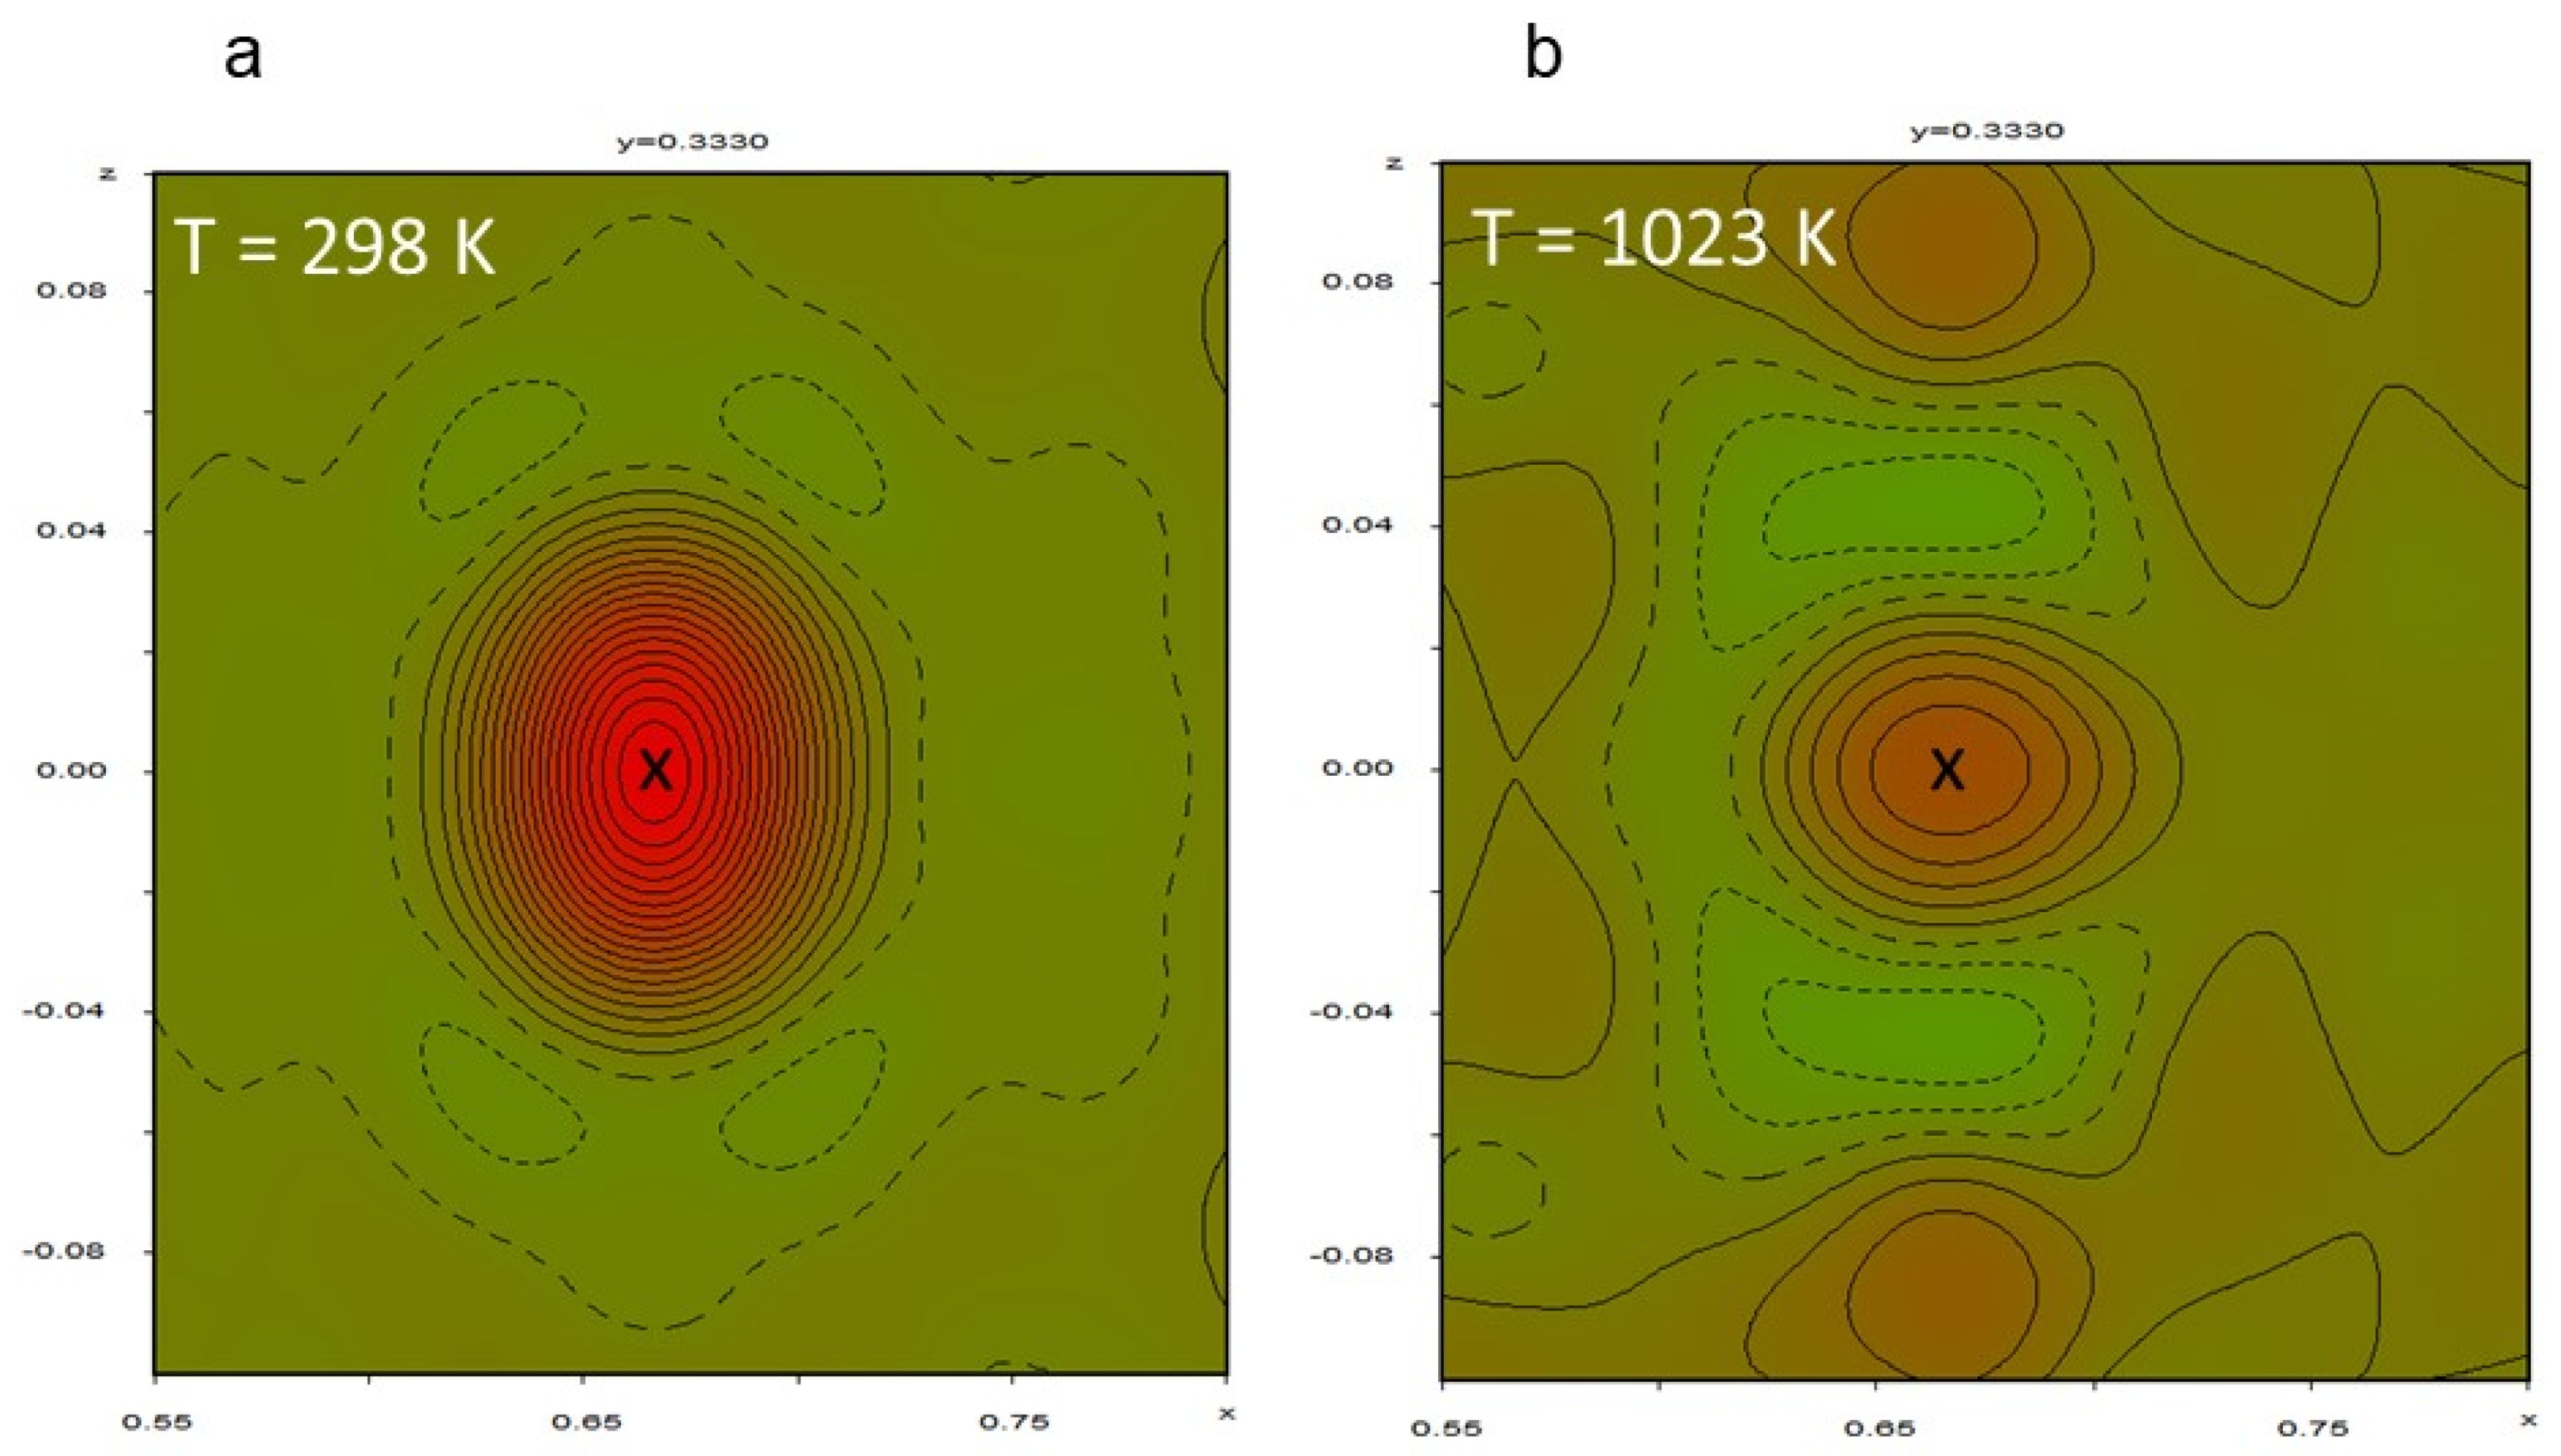
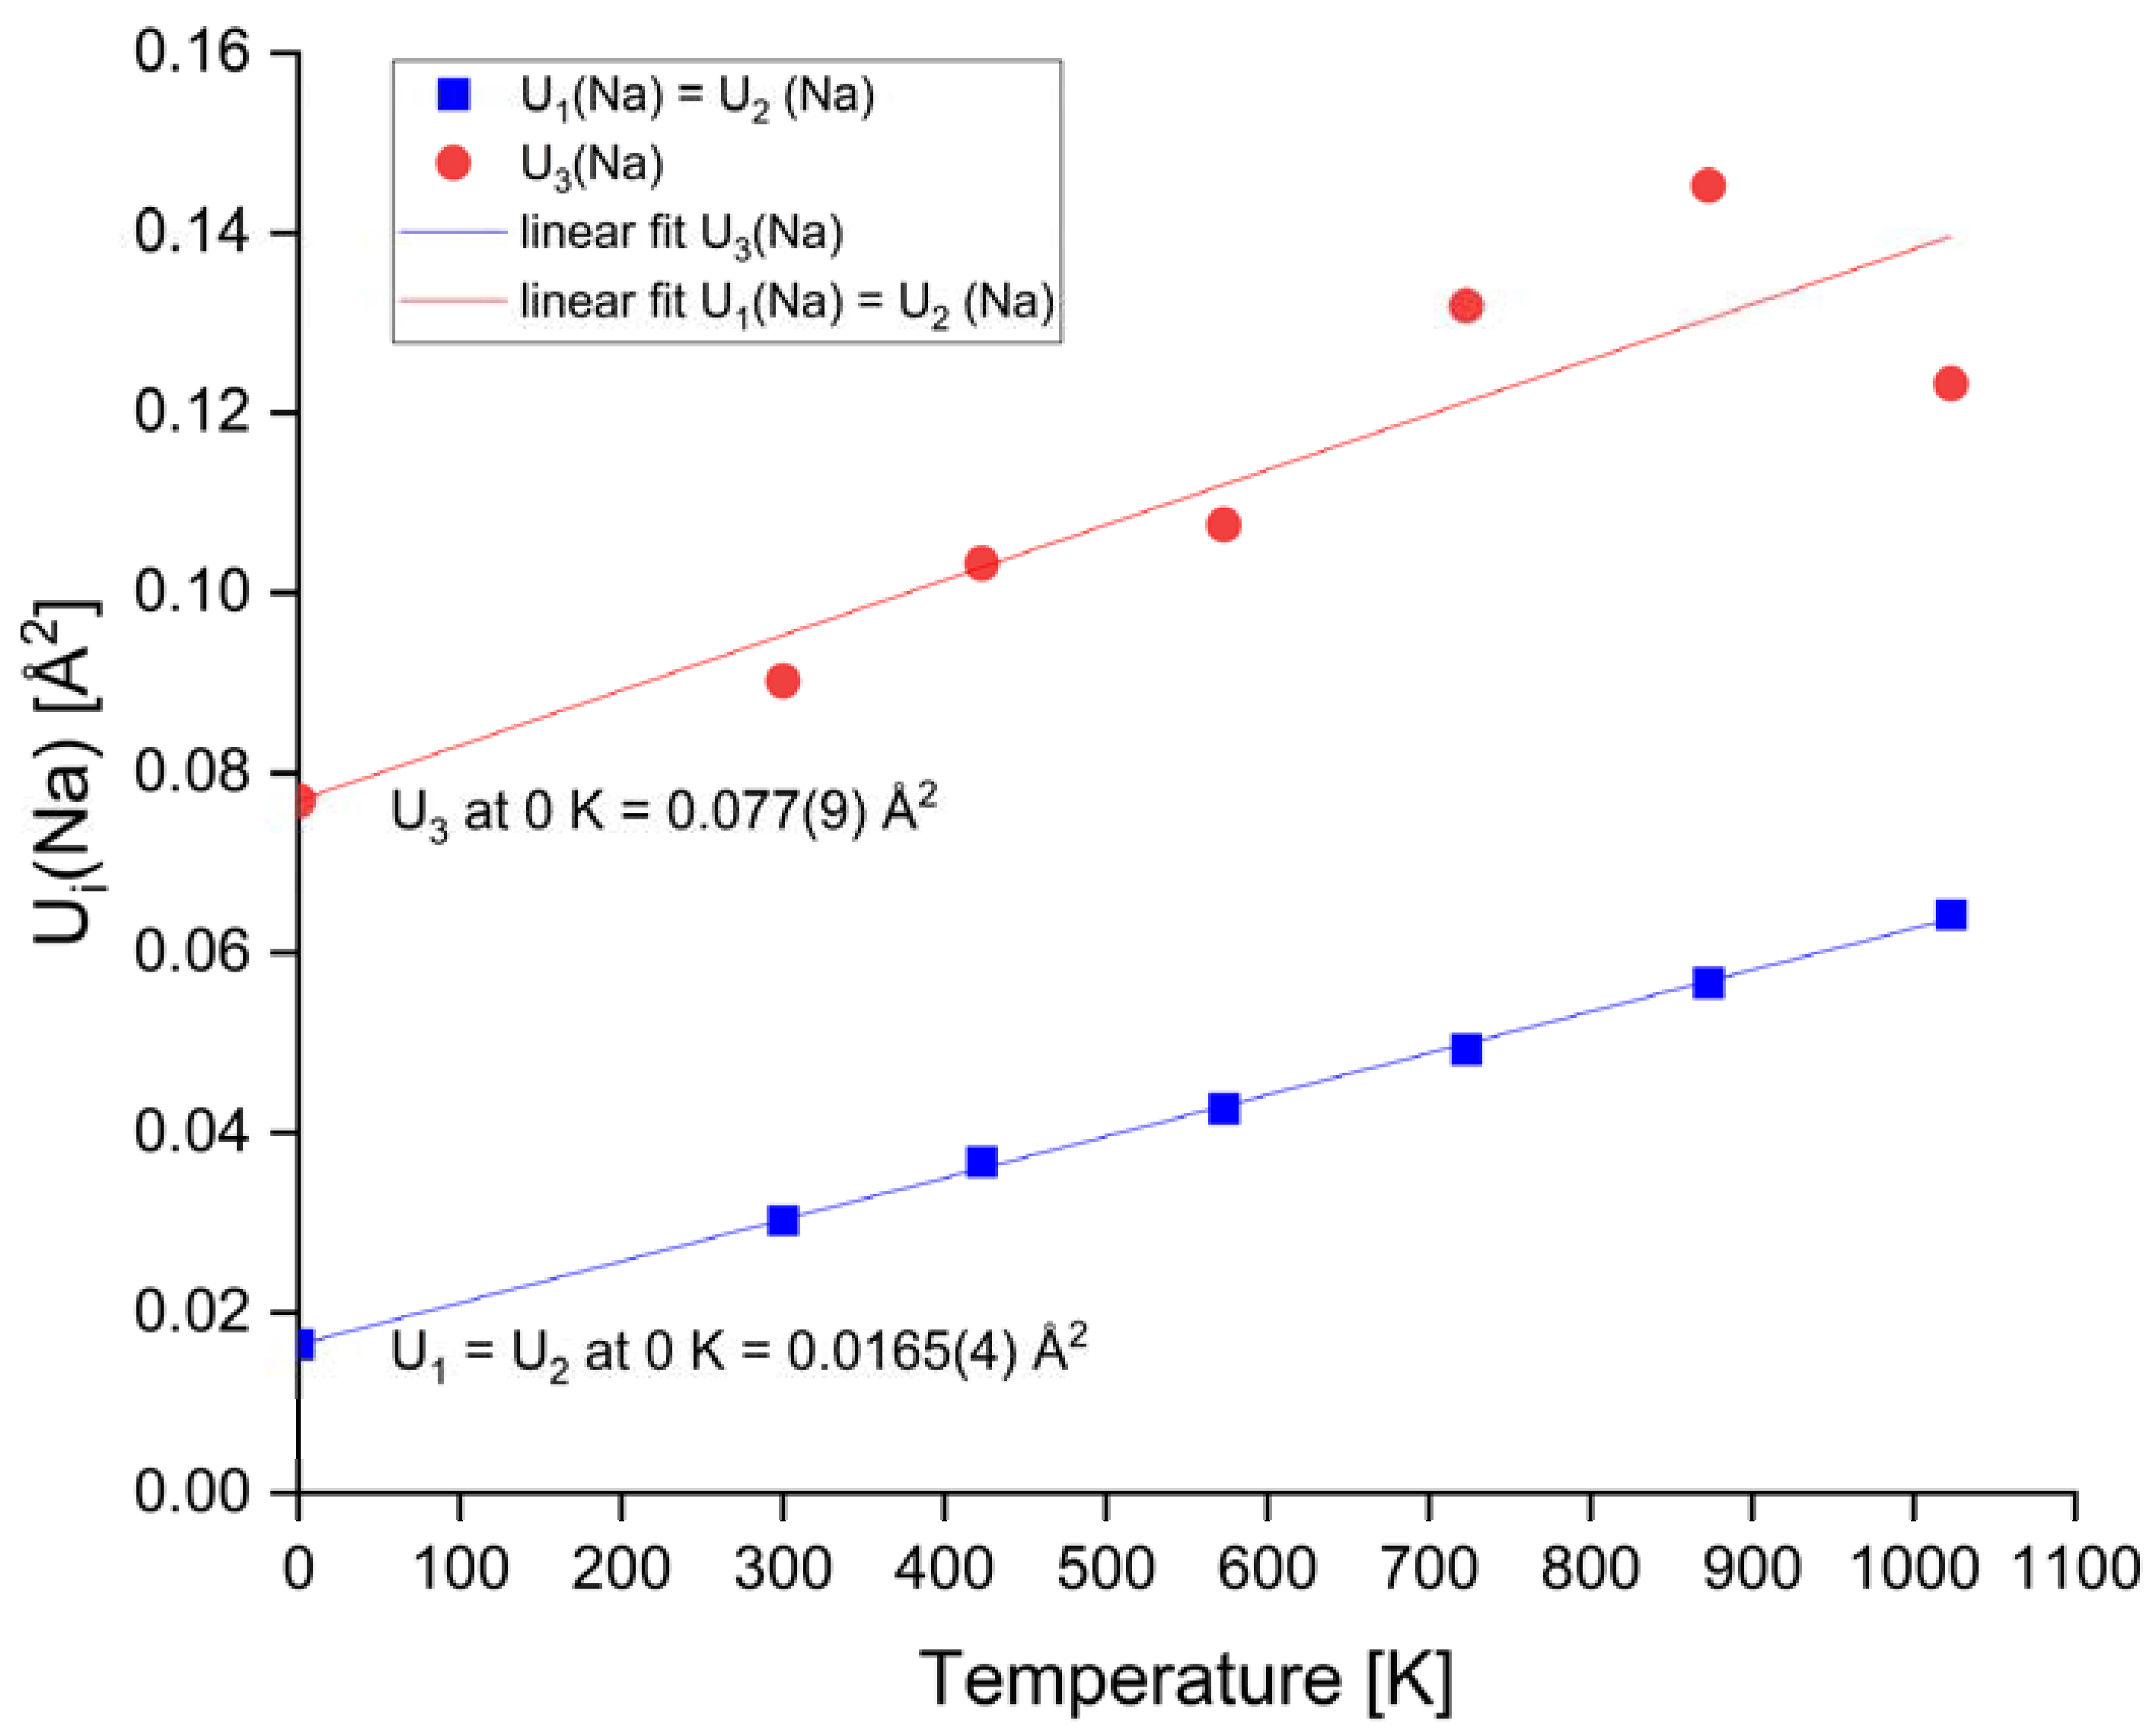
3.4.2. Site Symmetry of Na and Thermal Motions

The refined structure model of (Fe1.7Mn0.1Al0.1Mg0.1)Na2K[Li3Si12O30] (Sugilite#1) had Na at a special site at (2/3, 1/3, 0) with the Wyckoff letter 4d in P6/mcc, not like sogdianite, which had Na at 8h (2/3, 1/3, z) and z = 0.481(4) at 300 K with a splitting probability. In the sogdianite case, the determination of the Na location was an ambiguous try because of the low site occupancy with an extremely low atomic ratio of Na: vacancy = 0.36: 1.64 pfu at the B site [10]. Furthermore, the ADPs of Na in c (U33) were much larger than those perpendicular to c in synthetic sugilite [11], indicating a high correlation of z and U33. In the current study, using synchrotron XSD data, we could unambiguously determine the correct Na site 4d. Fourier synthesis without Na was executed to inspect the maximum electron density (ρ (e/Å3)) distribution at and around the expected Na site. As highlighted by ‘X’ in Figure 7a, the highest ρ value was found exactly at 4d with z = 0. Accordingly, this special site at (1/3, 2/3, 0) could be assigned to the right position for Na at 298 K. The ρ distribution around the Na site was elongated in the c direction. However, the fashion of ρ distributions around Na showed several characteristic changes at elevated temperatures such that (1) its ρ distribution became elongated on the (ab) plane (Figure 7b); (2) there were several temperature (T)-induced diffuse ρ peaks around Na (Figure 7b). However, the maximal ρ value was located at z = 0, valid for all measuring temperatures (Supplementary S4). Hence, Na was fixed to the special site at (1/3, 1/2, 0) with full occupation while refining all atomic parameters (Table 2), including their harmonic ADPs, for all measuring temperatures (Supplementary S5). The resulting ADPs at the B site commonly showed large values parallel to c, i.e., U33 >> U11 = U22 from 298 K up to 1023 K, even though the direction of the elongated ρ distribution around Na changed from parallel to perpendicular in the c direction with increasing temperatures (Supplementary S4). In this regard, along with the T-enhanced diffuse peaks around Na in the Fourier maps, two conclusions can be drawn: (1) dynamic disorder of Na is the main reason for diffuse electron density residuals around Na rather than static disorder; (2) thermal motion of Na cannot be described by harmonic ADP terms. The current study delivered third and fourth anharmonic terms of Na and the third ADPs of Li only at 1023 K. At lower measuring temperatures, these anharmonic ADPs values were too small, with large errors. The determined non-zero anharmonic ADP terms at 1023 K (Table 3) were indicative of dynamically disordered Li and Na on the (ab) plane. Furthermore, U33(Na) at 1023 K was smaller than at 873 K (Supplementary S5). These unusual thermal motions adumbrated the onset of long-range dynamic disorder of Na cations parallel to the (ab) plane at elevated temperatures.
The principle mean square ADPs (Ui, i = 1–3) of all atomic sites with respect to the Cartesian system are listed in Supplementary S6. Na at the B site showed much larger Ui than Li at the T(II) site at every measuring temperature, indicating high dynamic disorder of Na. It is worthwhile to mention that the regression lines of Ui(Na) towards 0 K gave non-zero Ui terms at 0 K, i.e., U1 = U2 = 0.0165(4) Å2 and U33(Na) = 0.077(9) Å2 (Figure 8). This indicates the presence of static disorder, i.e., a splitting probability of Na, particularly in the c direction if the anharmonic ADPs terms are ignored. As aforementioned, our XSD data sets gave no clear sign for static disorder of Na within the experimental resolution (Figure 7a). Fourier peak mapping around Na obviously represented anharmonic dynamic disorder of Na heaving from its equilibrium site X at (1/3, 2/3, 0) once thermally activated. Indeed, the maximal ρ height at X at 1023 K was only about 25% of that at 298 K (Figure 7b), and there were several diffuse peaks located away from X. These observations show that the thermal motion of Na is not locally restricted at elevated temperatures. More interestingly, relatively strong ρ residuals were seen at z ± 0.04 above and below X at z = 0, which is indicative of thermal depletion of a part of Na from its equilibrium position at 1023 K. This is a relevant finding because we found hopping paths for Na cations over interstitials not only at z = 0 but also at z ≈ 0.04, as described in the following section.
The probability density function (PDF) corresponds to the distribution of the space- and time-averaged atomic density as the Fourier-transformed Debye–Waller factor (DWF) including anharmonic terms ([41,42,43,44,45], literature therein). The possible migration pathways of mobile species can be expressed by the so-called one-particle potential (OPP) V(x), which is related to the PDF by Boltzmann statistics V(x) = −kB T ln[PDF(x)/PDF(xo)], where kB T >> V(x); x is the displacement vector; xo is the equilibrium position; kB is the Boltzmann constant; and T is the absolute temperature. Non-zero anharmonic ADP terms of Li and Na for the distortion of simple Gaussian distributions were included in their DWFs via Gram–Charlier expansion [41,45] using XSD data at 1023 K to describe their complex migration pathways. The joint probability density function (jPDF) was obtained from a superposition of individual atomic PDFs in a Cartesian system, leading to a continuous distribution of density between adjacent sites [46]. In Figure 9a, a jPDF is drawn with the second, third, and fourth anharmonic ADP terms of Na, exhibiting a migration direction towards interstitials located between two neighboring B sites. In Figure 9b, a jPDF is evaluated with the second and third ADPs of Li, and the harmonic terms of Fe (i.e., its second anharmonic ADPs) resolves Li hopping over interstitials between T(II) sites. This jPDF does not show site-exchanging Li between T(II) and A sites.
Assuming that the diffusion of ions is governed solely by the OPP V(x), the minimum density in the deformation map of V(x) corresponds to a maximum potential accounting for the barrier for charge transport. Hence, from mapping OPP V(x) we can estimate the activation energy for migration Em comparable with the activation energy Ea from IS [46]. In the sugilite case at 1023 K, OPP V(x) evaluated with jPDF of Na (Figure 10a) and that of Li (Figure 10b) gave rise to unrealistic, high energy barriers of 5–6 eV for hopping Na and Li cations over the respective large distances 5.8 and 5.0 Å. This is unrealistically far for the bulk ionic conductivity at Ea = 1.06(3) eV, as evaluated with IS in the high-temperature range of 946–1064 K (Figure 6). This large discrepancy between Em from OPP V(x) and Ea from conductivity measurements demands another concept for Na and Li dynamics. The current XSD study reveals a common mechanism for diffusion of Na and Li cations over several interstitials present in the sugilite topology.

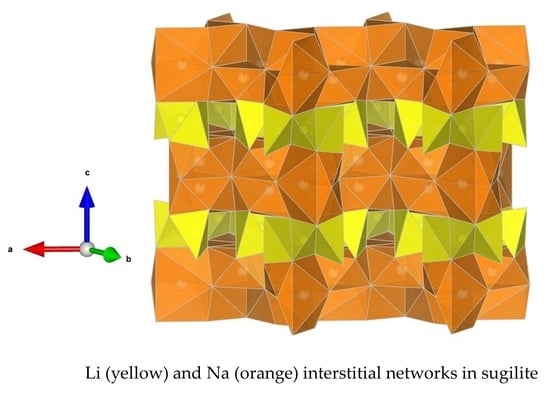
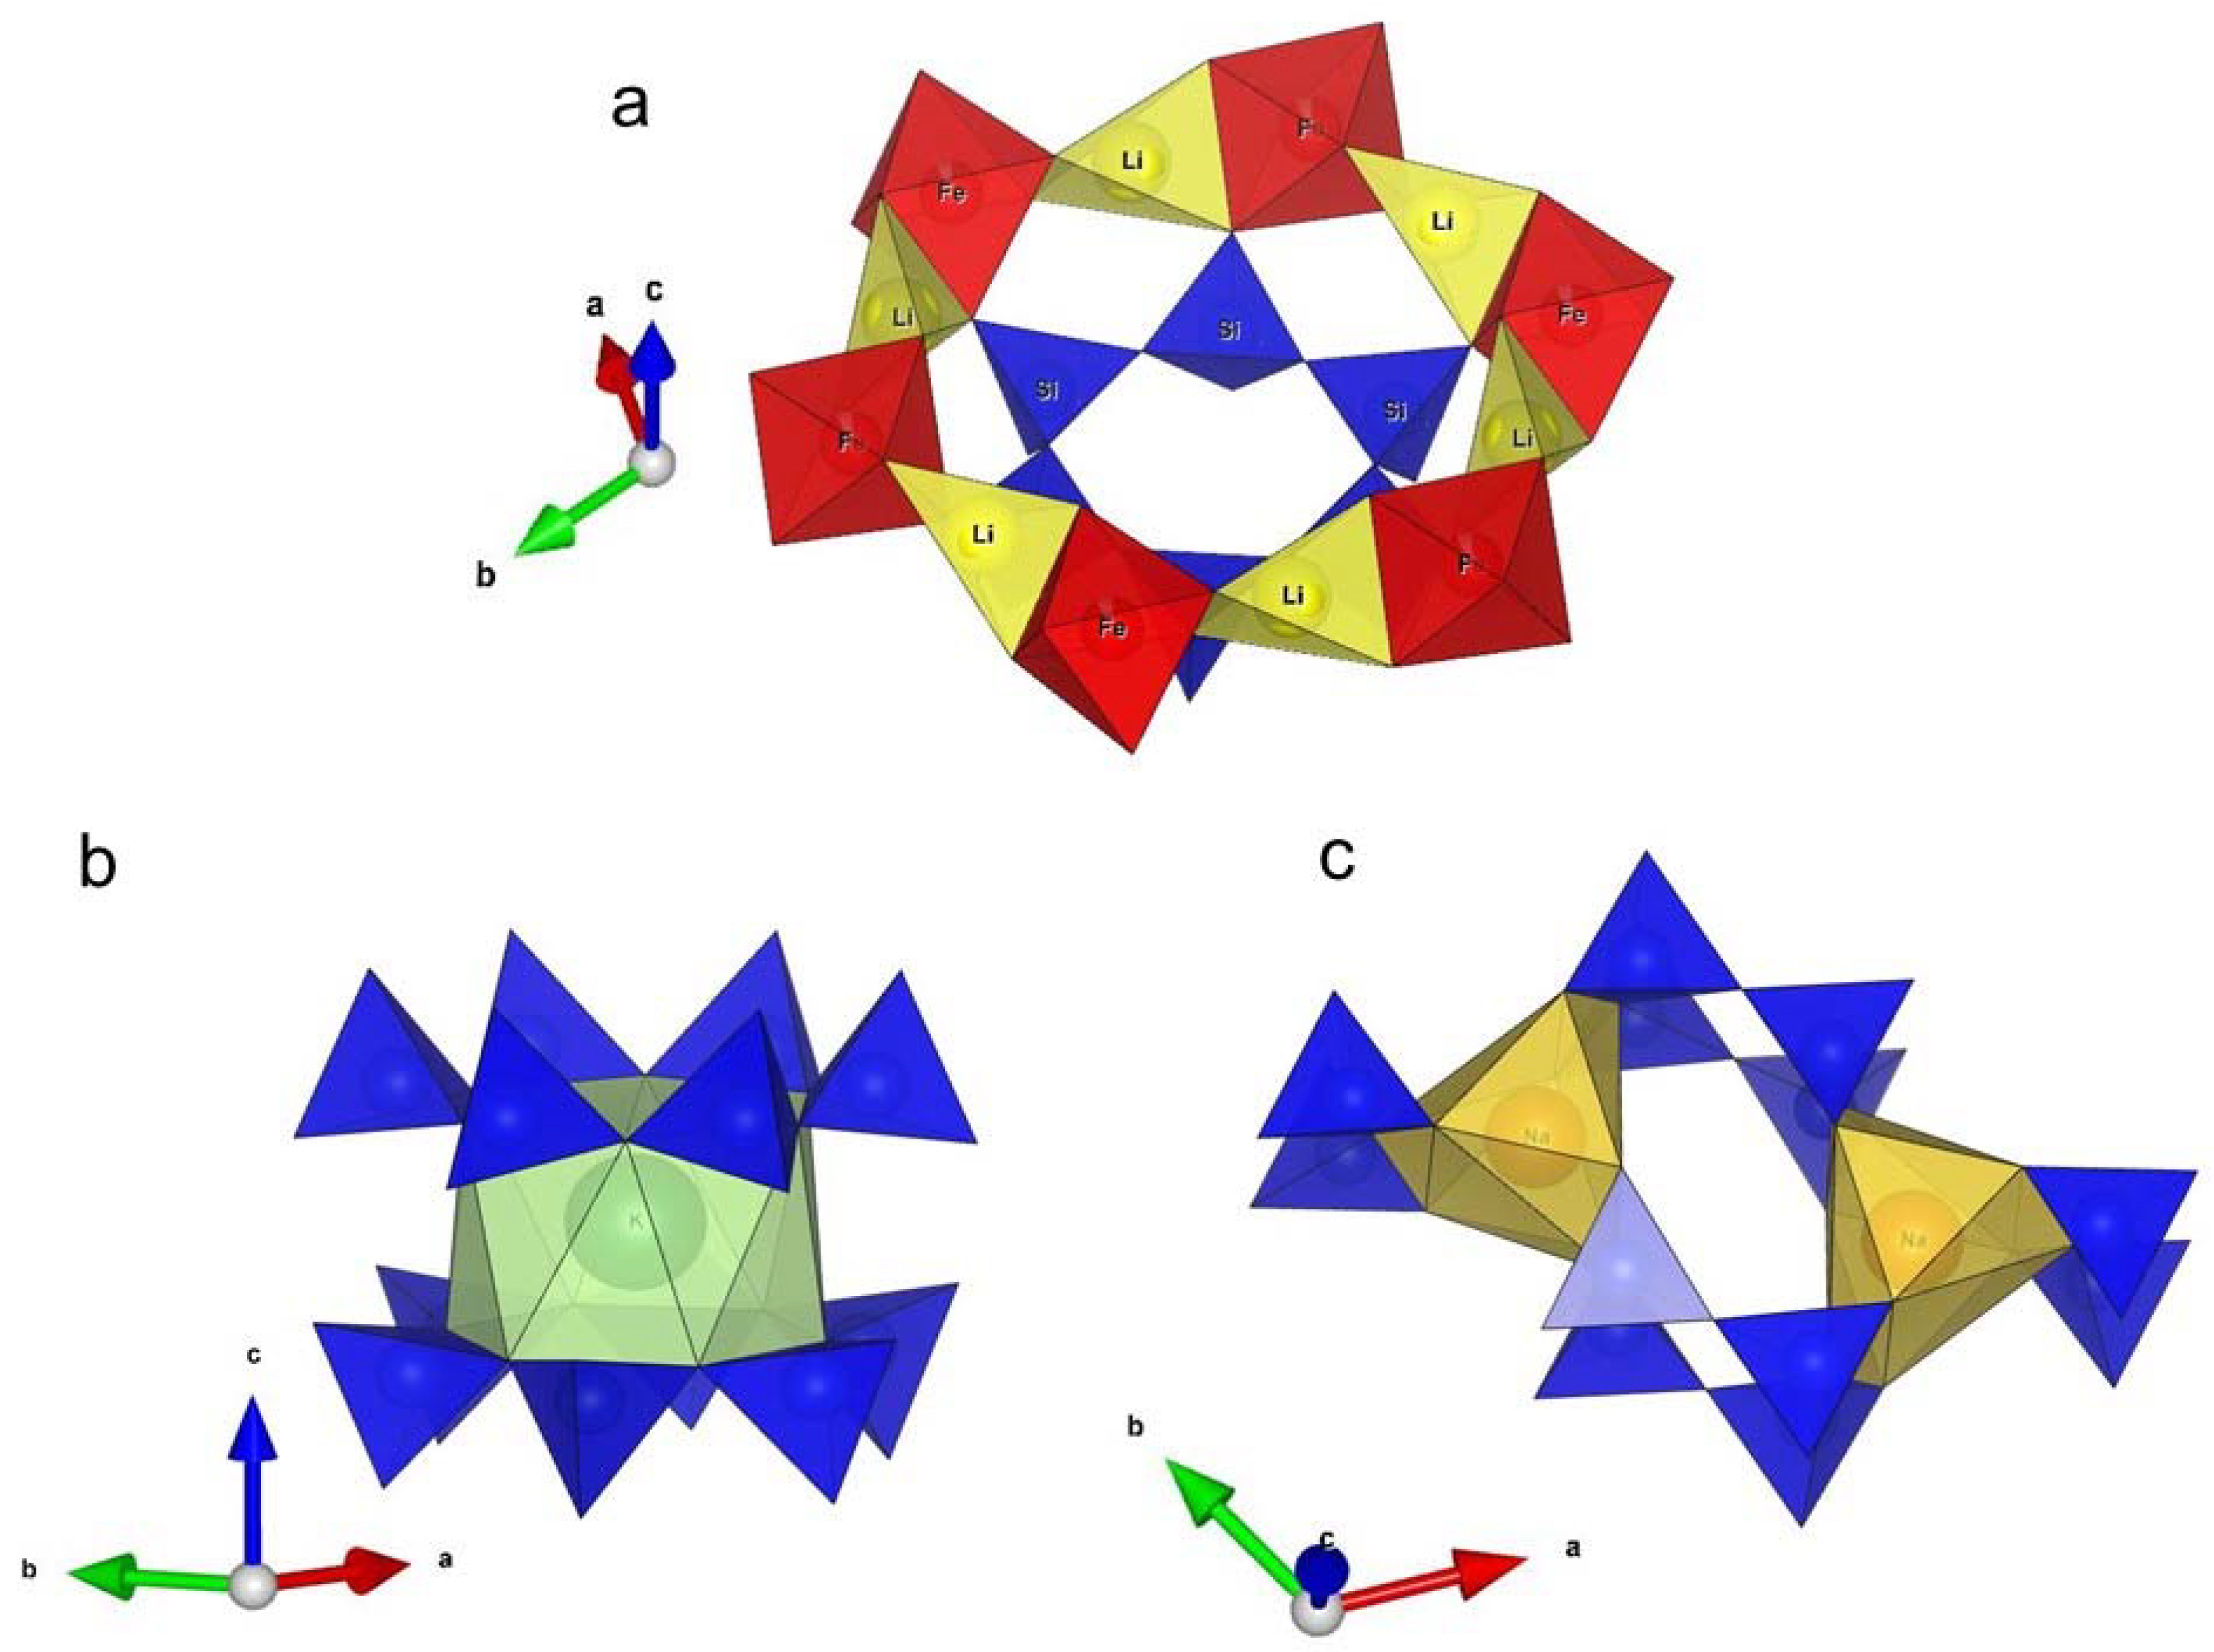
3.4.3. Locations of Interstitials

Careful inspection of difference Fourier (ΔF) maps obtained from XSD data at 1023 K allowed us to find electron density residuals at two interstitial sites: LiX1 at (0.3397, 0, 0.25) and LiX2 at (0.7230, 0.8630, 0.25). These are four-fold coordinated with framework oxygens and were suitable for residing Li (Figure 11a). Highly distorted tetrahedral LiO4 (i.e., Li at T(II)), LiX1O4, and LiX2O4 moieties were connected by common edges and faces to form a densely connected 2D network parallel to the (ab) plane, as illustrated in Figure 11b. Accordingly, small interatomic distances (d) were present in this 2D network as possible paths for hopping Li+ over d(Li–LiX1) = 1.6147(4) Å and d(LiX1–LiX2) = 1.7818(1)~1.8106(4) Å. These are much shorter than 5.0 Å based on the OPP V(x) model.
As Na interstitials, three different sites could be found: NaX1 at (0.66667, 0.33333, −0.0372), NaX2 at (0.6193, 0.1084, 0.4389), and NaX3 at (0.5, 0.5, 0), as shown in Figure 12. NaX3 was located between two neighboring B sites at the level z = 0 (Figure 12a), while NaX1 and NaX2 were at the offsite z = ±0.04 (Figure 12b). NaX1 was located directly above the B site and was regarded as the T-induced depletion of a part of Na. It is to be stressed that no splitting probability was introduced in the refined model. Thus, the OCC at the B site was fixed to full occupation in our analyses even with high-temperature XSD data sets. It was possible to refine the occupancy parameters (OCC) at B, NaX1, NaX2, and NaX3 with a constraint: OCC(B) + OCC(NaX1) + OCC(NaX2) + OCC(NaX3) = 1. However, low and diffuse ρ distributions, particularly connecting NaX1 and NaX2 interstitials, did not allow this strongly constrained OCC refinement. The more relevant finding was that, parallel to the 2D (Li–LiX1–LiX2) network, there were two other 2D layers for Na hopping over the interstitial sites in the short distances d(NaX2–NaX1) = 2.0962(4) Å and d(NaX2–NaX2) = 2.3015(5) Å at z = ±0.04 (Figure 13a), and, in between, there was another 2D layer at z = 0 with a hopping distance d(Na–NaX3) = 2.9078(4) Å (Figure 13b). The latter corresponds to half of the jumping distance 5.8 Å in the OPP model.
The presence of these pristine interstitials makes it easy for long-range dynamic disorder, i.e., charge transport by mobile Li and Na cations. Based on results from XSD, their diffusion paths are commonly parallel to the (ab) plane in the sugilite structure, requiring an activation energy much lower than the energy barrier 5–6 eV according to OPP. An Ea of 1.06(3) eV was obtained from the HF mode in the IS of Sugilite#2. Hence, interstitial hopping mechanisms can explain a combined Li-/Na ionic conductivity in sugilite-type compounds.

3.4.4. BVS Landscape Maps

The respective bond valence sum (BVS) values of 0.865 and 0.946 valence units (v.u.) for Na+ at the B site and Li+ at the T(II) site were lower than their common oxidation state 1+ (Table 4). On the other hand, BVS values at the interstitial sites found from XSD near to 1+ (Table 5) support the suitability of those interstitials for residing Li and Na cations. More importantly, BVS landscape isosurfaces of Li+ and Na+ (Figure 14) traced the 2D networks of Li–LiX1–LiX2, Na–NaX3, and NaX1–NaX2. However, the BVS landscape isosurface of Li+ with a potential threshold ∆V = 1.0 v.u. exhibited a broken isosurface only around the T(II) site (Figure 14a). This simply implies possible localities for local dynamic disorder of Li+ at 1023 K. At ∆V = 0.5 v.u., a continuous 2D isosurface of Li+ was realized, where Li+ was not highly bonded to framework oxygens (Figure 14b) and, hence, moved over the 2D network in the (ab) plane. In contrast, the fashion of the continuous BVS landscape isosurface of Na+ featured no differences between a potential threshold ∆V = 1.0 (Figure 14c) and 0.5 v.u. (Figure 14d), which is an indirect proof, for ease, of long-range dynamic disorder of Na cations. Those BVS landscape isosurface maps support that the charge transport can happen by hopping Li and Na cations toward the common direction parallel to the (ab) plane in the sugilite topology (Figure 15). Hence, sugilite-type compounds can be regarded as an interesting material class of combined Li/Na ionic conductors.
At last, it is worth noting the structural parameters impacting the bulk ionic conductivity in Li-bearing six-membered-ring (6MR) and -chain (6MC) silicates related to sugilite (Table 6). In comparison to sogdianite, sugilite shows a two orders of magnitude higher ionic conductivity value, mainly for the higher Na content. The topology of zektzerite is like sugilite, with the same Na content (2 pfu), but shows much smaller ionic conductivity values. This is due to its framework property with double 6MCs of SiO4 connected by ZrO6–LiO4 chains where one of three Li pfus is not occupied. Under this circumstance, in comparison to sugilite, the hopping distance for Li+ is large for the small number of charge carriers. Pezzottaite exhibits a framework with single 6MRs of [(Al,Si)O4], and there is only one Li pfu without the additional charge transporting Na+, having the lowest ionic conductivity values of those shown in Table 6. Such a comparison makes it clear that Li-bearing double 6MRs-containing framework structures are geometrically and chemically advantageous for the pristine 2D layers of Na and Li interstitials.

4. Conclusions

The current XSD study, using a synchrotron radiation source, could comprehend details of dynamic disorder of Li and Na cations in the sugilite structure, especially with anharmonic ADP terms at 1023 K. ΔF maps and BVS calculations supported thermally activated hopping mechanisms for both Li and Na cations over the several interstitial sites found in this study. At an activation energy of 1.06(3) eV, long-range dynamic disorder of both cations contributed to the bulk ionic conductivity 1.7·10−3 S·cm−1 at 943 K. This high conductivity value has not been obtained at ambient conditions with the sugilite so far investigated. However, sugilite-type compounds can be further developed as combined Li–Na ionic conductors, providing several pristine, short-distance interstitials, making 2D networks parallel to the (ab) plane over which Li and Na cations can move quickly. Such a structure-related unique property may be desired when manufacturing thin-film electrolytes with a combined Li–Na cationic conductor where direction-dependent, fast charge transport across the electrolyte might overcome the thin-film phase boundaries.

Supplementary Materials

The following supporting information can be downloaded at: https://www.mdpi.com/article/10.3390/min13050620/s1. S1: Atomic parameters refined with HRNPD at 973 K of (Fe1.3(2)Mn0.3(0.1)Al0.4(0.1))Na2.0(2)K1.03(1)[Li3Si12.000(3)O30], refined with HRNPD at 973 K; S2: Observed and simulated impedance spectra of Sugilite#2; S3: Change of the lattice metrics a and c in Å in sugilite with increasing temperatures, determined by synchrotron X-ray single-crystal diffraction data of Sugilite#1; S4: Observed Fourier maps evaluated with synchrotron X-ray single-crystal diffraction data of Sugilite#1 without Na at B sites at all measuring temperatures from 298 up to 1023 K; S5: Components of harmonic ADP parameters Uij, refined with synchrotron XSD data of Sugilite#2; S6: Principle mean square APDs from XSD data of Sugilite#1; S7: The bond valence parameters (d0, B0) for Zachariasen formula (s = exp{(d0 − d)/B0}) applied in this study.

Author Contributions

S.-H.P. is the responsible person for conceptualization and methodology. She collected and analyzed all XSD, HRNPD, and IS data for this study. C.P. and M.H. operated XSD and HRNPD, respectively. R.H. mainly contributed to EPMA. The original draft, including the main text, tables, and figures, as well as Supplementary were written and edited by S.-H.P. All authors have read and agreed to the published version of the manuscript.

Funding

This research was supported by DFG (Deutsche Forschungsgemeinschaft) funding, PA1222/1-2. The access to synchrotron XSD and HRNPD was achieved by regular beamtime proposals allocated by the facility Deutsches Elektronen-Synchrotron (DESY) and Forschungs-Neutronenquelle Heinz Maier-Leibnitz (FRM2), respectively.

Data Availability Statement

All crystallographic information files (cif) can be provided by S.-H.P. upon request.

Acknowledgments

S.-H.P. thanks Ines Kaiser-Bischoff for supporting XSD data collection during the beamtime at DESY.

Conflicts of Interest

The authors declare no conflict of interest.

References

  1. Tarascon, J.-M.; Armand, M. Issues and challenges facing rechargeable lithium batteries. Nature 2001, 414, 359–367. [Google Scholar] [CrossRef]
  2. Hull, S. Superionics: Crystal structures and conduction processes. Rep. Prog. Phys. 2004, 67, 1233–1314. [Google Scholar] [CrossRef]
  3. Tarascon, J.M.; Recham, N.; Armand, M.; Chotard, J.N.; Barpanda, P.; Walker, W.; Dupont, L. Hunting for Better Li-Based Electrode Materials via Low Temperature Inorganic Synthesis. Chem. Mater. 2010, 22, 724–739. [Google Scholar] [CrossRef]
  4. Kamaya, N.; Homma, K.; Yamakawa, Y.; Hirayama, M.; Kanno, R.; Yonemura, M.; Kamiyama, T.; Kato, Y.; Hama, S.; Kawamoto, K.; et al. A lithium superionic conductor. Nat. Mater. 2011, 10, 682–686. [Google Scholar] [CrossRef] [PubMed]
  5. Wang, Y.; Richards, W.D.; Ong, S.P.; Miara, L.J.; Kim, J.C.; Mo, Y.; Ceder, G. Design principles for solid-state lithium superionic conductors. Nat. Mater. 2015, 14, 1026–1031. [Google Scholar] [CrossRef] [PubMed]
  6. Kato, Y.; Hori, S.; Saito, T.; Suzuki, K.; Hirayama, M.; Mitsui, A.; Yonemura, M.; Iba, H.; Kanno, R. High-power all-solid-state batteries using sulfide superionic conductors. Nat. Energy 2016, 1, 16030. [Google Scholar] [CrossRef]
  7. He, X.; Zhu, Y.; Mo, Y. Origin of fast ion diffusion in super-ionic conductors. Nat. Commun. 2017, 8, 15893. [Google Scholar] [CrossRef]
  8. Janek, J.; Zeier, W.G. A solid future for battery development. Nat. Energy 2016, 1, 16141. [Google Scholar] [CrossRef]
  9. Bhardwaj, R.K.; Zitoun, D. Recent Progress in Solid Electrolytes for All-Solid-State Metal(Li/Na)–Sulfur Batteries. Batteries 2023, 9, 110. [Google Scholar] [CrossRef]
  10. Park, S.-H.; Hoelzel, M.; Boysen, H.; Schmidbauer, E. Lithium conductivity in an Li-bearing double-ring silicate mineral, sogdianite. J. Solid State Chem. 2007, 180, 1306–1317. [Google Scholar] [CrossRef]
  11. Röska, B.; Akter, I.; Hoelzel, M.; Park, S.-H. Na+/Li+-ionic conductivity in Fe2Na2K[Li3Si12O30]. J. Solid State Chem. 2018, 264, 98–107. [Google Scholar] [CrossRef]
  12. Forbes, W.C.; Baur, W.H.; Khan, A.A. Crystal Chemistry of milarite-type minerals. Am. Mineral. 1972, 57, 463–472. [Google Scholar]
  13. Armbruster, T.; Oberhänsli, R. Crystal chemistry of double-ring silicates: Structures of Sugilite and Brannockite. Am. Mineral. 1988, 73, 595–600. [Google Scholar]
  14. Hawthorne, F.C.; Kimata, M.; Cerny, P.; Ball, N.A.; Rossman, G.R.; Grice, J.D. Crystal chemistry of the milarite-group minerals. Am. Mineral. 1991, 76, 1836–1856. [Google Scholar]
  15. Sokolova, E.V.; Hawthorne, F.C.; Pautov, L.A. The crystal chemistry of Li- bearing minerals with the milarite-type structure: The crystal structure of end- member sogdianite. Can. Mineral. 2000, 38, 835–859. [Google Scholar] [CrossRef]
  16. Gagné, O.C.; Hawthorne, F.C. Chemographic Exploration of the Milarite-Type Structure. Can. Mineral. 2016, 54, 1229–1247. [Google Scholar] [CrossRef]
  17. Murakami, N.; Kato, T.; Miura, Y. Sugilite, a new silicate mineral from Iwagi Islet, Southwest Japan. Mineral. J. 1976, 8, 110–121. [Google Scholar] [CrossRef]
  18. Kato, T.M.; Miura, Y.; Murakami, N. Crystal structure of sugilite. Mineral. J. 1976, 8, 184–192. [Google Scholar] [CrossRef]
  19. Dunn, P.J.; Brummer, J.J.; Belsky, H. Sugilite, a second occurrence: Wessels mine, Kalahari manganese field, Republic of South Africa. Can. Mineral. 1980, 18, 37–39. [Google Scholar]
  20. Clark, A.M.; Fejer, E.E.; Couper, A.G.; Bearne, G.S.; Din, V.K. Additional data on Sugilite. Mineral. Mag. 1980, 43, 947–949. [Google Scholar] [CrossRef]
  21. Cooper, M.H.; Hawthorne, F.C.; Grew, E.S. The crystal chemistry of sogdianite, a milarite-group mineral. Am. Mineral. 1999, 84, 764–768. [Google Scholar] [CrossRef]
  22. Ferraris, G.; Prencipe, M.; Pautov, L.A.; Sokolova, E.V. The crystal structure of darapiosite and a comparison with Li- and Zn-bearing minerals of the milarite group. Can. Mineral. 1999, 37, 769–774. [Google Scholar]
  23. Park, S.-H. Development of a new type of Li-battery materials based on the milarite-family. Acta Cryst. 2008, A64, C532. [Google Scholar] [CrossRef]
  24. Pouchou, J.L.; Pichoir, F. Un nouveau modèle de calcul pour la microanalyse quantitative par spectrométrie de rayons X. Partie I: Application à l’analyse des échantillons homogènes. La Rech. Aérospatiale 1984, 3, 167–192. [Google Scholar]
  25. Hunt, J.B.; Clift, P.D.; Lacasse, C.; Vallier, T.L.; Werner, R. Interlaboratory comparison of electron microprobe microanalysis of glass geochemistry. In Proceedings, Ocean Drilling Program, Scientific Results; Saunders, A.D., Larsen, H.C., Wise, S.W., Eds.; 1998; Volume 152, pp. 85–91. [Google Scholar] [CrossRef]
  26. Hoelzel, M.; Senyshyn, A.; Juenke, N.; Boysen, H.; Schmahl, W.; Fuess, H. High- resolution neutron powder diffractometer SPODI at research reactor FRM I-I. Nucl. Instrum. Methods Phys. Res. Sect. A Acceler Ators Spectrometers Detect. Assoc. Equip. 2012, 667, 32–37. [Google Scholar] [CrossRef]
  27. Kabsch, W.J.J. Automatic processing of rotation diffraction data from crystals of initially unknown symmetry and cell constants. Appl. Crystallogr. 1993, 26, 795–800. [Google Scholar] [CrossRef]
  28. Paulmann, C.; Phoscor. Department of Earth System Sciences, Institute of Mineralogy and Petrography, University of Hamburg, Grindelallee 48, 20146 Hamburg, Germany. Personal Communications, 2007.
  29. Blessing, R.H. SORTAV. Acta Cryst. 1995, A51, 33–38. [Google Scholar] [CrossRef] [PubMed]
  30. Petříček, V.; Dušek, M.; Palatinus, L. Crystallographic Computing System JANA2006: General features. Z. Krist. Cryst. Mater. 2014, 229, 345–352. [Google Scholar] [CrossRef]
  31. Brown, I.D. The Chemical Bond in Inorganic Chemistry—The Bond Valence Model; IUCr monographs on Crystallography 12; Oxford University Press: Oxford, UK, 2002. [Google Scholar]
  32. Adams, S. From bond valence maps to energy landscapes for mobile ions in ion-conducting solids. Solid State Ion. 2006, 177, 1625–1630. [Google Scholar] [CrossRef]
  33. Rodríguez-Carvajal, J. Fullprof Program. Phys. B 2011, 55, 192. [Google Scholar]
  34. Momma, K.; Izumi, F. VESTA: A three-dimensional visualization system for electronic and structural analysis. J. Appl. Cryst. 2008, 41, 653–658. [Google Scholar] [CrossRef]
  35. Kumar, M.; Shankar, S.; Brijmohan; Kumar, S.; Thakur, O.P.; Ghosh, A.K. Impedance spectroscopy and conductivity analysis of multiferroic BFO–BT solid solutions. Phys. Lett. 2017, A381, 379–386. [Google Scholar] [CrossRef]
  36. Hueso, K.B.; Armand, M.; Rojo, T. High temperature sodium batteries: Status, challenges and future trends. Energy Environ. Sci. 2013, 6, 734–749. [Google Scholar] [CrossRef]
  37. Duba, A.G.; Ghose, S. Electrical conductivity and ionic conduction mechanism in NaLiZrSi6O15 single crystals. Solid State Ion. 1983, 9–10, 813–816. [Google Scholar] [CrossRef]
  38. Shaikh, A.M.; Ghose, S. A first-order phase transition in zektzerite, NaLiZrSi6O15: High-temperature single-crystal X-ray diffraction study. Phys. Chem. Miner. 2015, 42, 747–759. [Google Scholar] [CrossRef]
  39. Park, S.-H.; Chucholowski, C.J.; Lara, L.G.B.; Hoelzel, M.; Paulmann, C. Investigation of a new willemite-type compound, (Li, Na, H)0.16Zn1.92SiO4. J. Solid State Chem. 2013, 200, 328–340. [Google Scholar] [CrossRef]
  40. Park, S.-H.; Pedersen, B.; Meven, M.; Krüger, H. Cation dynamics in six-membered ring and -chain lithosilicates. In Proceedings of the DGK (Germany Crystallographic Meeting), Hannover, Germany, 24–27 February 2010. [Google Scholar]
  41. Zucker, U.H.; Schulz, H. Statistical Approaches for the Treatment of Anharmonic Motion in Crystals. I. A Comparison of the Most Frequently Used Formalisms of Anharmonic Thermal Vibrations. Acta Cryst. 1982, A38, 563–568. [Google Scholar] [CrossRef]
  42. Zucker, U.H.; Schulz, H. Statistical Approaches for the Treatment of Anharmonic Motion in Crystals. II. Anharmonic Thermal Vibrations and Effective Atomic Potentials in the Fast Ionic Conductor Lithium Nitride (Li3N). Acta Cryst. 1982, A38, 568–576. [Google Scholar] [CrossRef]
  43. Kuhs, W.F. The Anharmonic Temperature Factor in Crystallographic Analysis. Aust. J. Phys. 1988, 41, 369–382. [Google Scholar] [CrossRef]
  44. Kuhs, W.F. Generalized Atomic Displacements in Crystallographic Structure Analysis. Acta Cryst. 1992, A48, 80–98. [Google Scholar] [CrossRef]
  45. Trueblood, K.N.; Bürgi, H.-B.; Burzlaff, H.; Dunitz, J.D.; Gramaccioli, C.M.; Schulz, H.H.; Shmueli, U.; Abrahams, S.C. Atomic displacement parameter nomenclature. Report of a subcommittee on atomic displacement parameter nomenclature. Acta Cryst. 1996, A52, 770–781. [Google Scholar] [CrossRef]
  46. Boysen, H. The determination of anharmonic probability densities from static and dynamic disorder by neutron powder diffraction. Z. Krist. 2003, 218, 123–131. [Google Scholar] [CrossRef]
Figure 1. Representative plots of structural properties of sugilite: (a) double six-membered rings (6MRs) of T(I)O4 (T(I) = Si) in blue are interconnected to each other via LiO4 (yellow) and FeO6 (red) units to form a 3D framework. K cations (green) reside in the middle of large cages bounded by double 6MR cages; (b) Na cations (orange) are in 6MR opening channels directly below FeO6 moieties.
Minerals 13 00620 g001
Figure 2. Interstitials and large cages found in sugilite-type compounds: (a) there are several interstitials suitable for small Li cations around 12MRs of LiO4–FeO6-units; (b) large K+ species are 12-fold coordinated with oxygens of double 6MRs of SiO4; (c) Na is (6+3)-fold coordinated with oxygens of neighboring double 6MRs of SiO4. Between the two nearest NaO9 polyhedra, there are 6MR interstitials suitable for conducting Na+.
Minerals 13 00620 g002
Figure 3. Rietveld calculation with HRNPD data of Sugilite#2 confirmed the pure sugilite compound (Fe1.3Mn0.3Al0.4)Na2K[Li3Si12O30].
Minerals 13 00620 g003
Figure 4. Plots of imaginary parts Z’’ of impedance against the logarithmic scale of AC frequency f, probed on Sugilite#2 ((Fe1.3Mn0.3Al0.4)Na2K[Li3Si12O30]). ν(HF) and ν(LF) peaks shifted towards higher frequencies at elevated temperatures and, hence, were assigned to thermally activated motions in the bulk sample. (a) In the low-temperature range, ν(HF) and ν(LF) were well resolved; (b) ν(LF) moved fast into the regime of ν(HF) above 700 K; (c) both resonances started to move out of the measuring frequency range above 900 K.
Minerals 13 00620 g004
Figure 5. An impedance spectrum of Sugilite#2 probed at 646 K (squares) was fitted (line) well with two serially connected RC circuits. ν(HF) was assigned to the bulk conductivity, while ν(LF) was probably assigned to intergrain relaxation processes. Further IS observed and fitted are provided in Supplementary S2.
Minerals 13 00620 g005
Figure 6. Arrhenius plots with DC conductivity values evaluated from HF and LF modes from impedance spectra of Sugilite#2 ((Fe1.3Mn0.3Al0.4)Na2K[Li3Si12O30]).
Minerals 13 00620 g006
Figure 7. Fourier synthesis maps observed using synchrotron X-ray single-crystal diffraction data on Sugilite#1 without Na in the model. Positive (reddish) and negative electron density (greenish) contours (e/Å3) are presented by solid and broken lines, respectively: (a) at 298 K, a strong positive electron density (red) was exactly centered at a special position X (0.6667, 0.3333, 0), suitable for Na atoms. The electron distribution around this site was extended along z; (b) diffuse electron densities (reddish) around X (0.6667, 0.3333, 0) were obviously seen at 1023 K. A complicated thermal motion of Na could be described with anharmonic ADPs, but there was a strong correlation of site depletion with dynamic disorder of Na at B sites with increasing temperature.
Minerals 13 00620 g007
Figure 8. Principle mean square APDs Ui (i = 1–3) of Na at the B site (1/3, 2/3, 0) were linear fitted against the measuring temperatures and extrapolated down to 0 K. Interestingly, at the highest measuring temperature 1023 K, U3 became smaller than at 873 K, which is related to the non-zero anharmonic thermal motions on the (ab) plane for long-range dynamic disorder.
Minerals 13 00620 g008
Figure 9. Plots jPDF at 1023 K, indicating site-exchanging directions: (a) Na at the B site with the second, third, and fourth anharmonic ADPs; (b) jPDF of Li with the second and third anharmonic ADPs along with the second anharmonic ADPs of Fe.
Minerals 13 00620 g009
Figure 10. Deformation maps of OPP V(x) in the sugilite structure at 1023 K: (a) V(x) evaluated from jPDF of Na; (b) V(x) evaluated from jPDF of Li. These give rise to unrealistic, high activation energies 5–6 eV according to one-particle potential mechanisms with large hopping distance 5.8 and 5 Å for Na+ and Li+, respectively.
Minerals 13 00620 g010
Figure 11. Interstitial sites LiX1 and LiX2 available for hopping Li cations: (a) These interstitial sites were found by residual electron density distribution around AO6–T(II)O4 chains in ΔF maps after refinement of harmonic ADPs of all atoms at 1023 K. Fe at A and Li at T(II) are highlighted in red and yellow, respectively; (b) the Li+ diffusion succeeded over the 2D network (yellow), which was configured by edge- and face-sharing LiO4–LiX1O4–LiX2O4 in the (ab) plane in sugilite.
Minerals 13 00620 g011
Figure 12. ΔF maps around Na at B sites (orange) evaluated using XSD data at 1023 K: (a) at z = 0, high-electron-density residuals were located at one interstitial site available for Na: NaX3 at (0.5, 0.5, 0), as highlighted in yellow; (b) there were two further Na interstitials: NaX1 at (2/3, 1/3, −0.0372) directly below B sites and NaX2 at (0.6193, 0.1084, 0.4389) indicating dynamical depletion of a part of Na from z = 0.
Minerals 13 00620 g012
Figure 13. Two different 2D networks allowed charge transport via Na+: (a) at z = 0, Na at B sites and NaX3 formed a 2D network involving a hopping distance, d(Na–NaX3) = 2.9078(4) Å; (b) at z = −0.04, there was another 2D network involving short distances d(NaX2–NaX1) = 2.0962(4) Å and d(NaX2–NaX2) = 2.3015(5) Å available for easy Na+ hopping.
Minerals 13 00620 g013
Figure 14. Isosurface of Li+ and Na+ based on BVS calculations with the structure model refined with 1023 K XSD data of a sugilite single crystal (Sugilite#1): (a) isosurface with a potential threshold ∆V = 1.0 of Li+ (Li at T(II) sites is presented by large spheres in pale yellow); (b) continuous isosurface of Li+ at ∆V = 0.5; (c) isosurface of Na+ (small spheres in yellow) at ∆V = 1.0 v.u.; (d) isosurface of Na+ at ∆V = 0.5 v.u.
Minerals 13 00620 g014
Figure 15. Sugilite exhibited 2D layers available for the combined Li–Na ionic conductivity over several interstitials parallel to the (ab) plane.
Minerals 13 00620 g015
Table 1. Experimental and refinement parameters of synchrotron XSD on a sugilite single crystal (Sugilite#1) using a wavelength of 0.6 Å (Si(111) monochromator). The space group symmetry P6/mcc (#192) was valid for this compound at all the measuring temperatures below. Semi-empirical absorption correction was applied to obtain minimal and maximal transmission Tmin and Tmax, respectively.
Temperature (K)2984235737238731023
Lattice metrica (Å)10.039 (3)10.039 (2)10.046 (3)10.055 (1)10.062 (1)10.073 (2)
c (Å)14.050 (5)14.053 (3)14.063 (9)14.080 (1)14.0940 (1)14.106 (1)
DensityV (Å3)1226.3 (7)1226.5 (4)1229.1 (9)1232.8 (2)1235.8 (2)1239.5 (4)
(g/cm3)2.7812.7802.7742.7662.7592.751
Data range h−25~12 −23~12−25~25−25~25−25~24−17~24
k−24~24−20~13−25~25−25~24−22~25−25~25
l−24~23−16~21−19~23−23~21−21~23−23~21
Total reflections48,02024,12546,77848,63048,95149,317
Unique reflections 288724462828284428572865
Absorption correction Tmin/Tmax0.6983
0.7093
0.7437
0.7530
0.7437
0.7531
0.7437
0.7532
0.7437
0.7532
0.6983
0.7094
Rmerge0.0240.0480.0400.0300.0260.025
Goodness of fit2.8672.9952.6093.7503.7102.254
wR (against I)0.0730.0570.0680.0450.0450.034
Weighting w 1/σ2(I)1/σ2(I)1/σ2(I)1/σ2(I)1/σ2(I)1/σ2(I)
sinθ/λ (Å−1)1.24961.24961.24991.24961.24981.2493
Δρmax; Δρmin (e/Å3)0.11; −0.170.34; −0.581.15; −1.020.21; −0.310.17; −0.200.12; −0.07
Table 2. Atomic parameters of a single-crystal sugilite sample, Sugilite#1 (Fe1.7Mn0.1Al0.1Mg0.1)KNa2[Li3Si12O30]), refined with synchrotron XSD data at 298 K, followed by the measuring-temperature-dependent atomic coordinates for Si and three O positions.
T (K)SiteTypeCoordinatesOccupancyMultiplicity
xyz
298AFe0.3333330.6666670.250.925 §4
BNa0.3333330.666667014
CK000.2512
TIILi0.500.2516
TISi0.35553 (1)0.11899 (1)0.38711 (1)124
O1O0.39699 (6)0.13771 (6)0.5112
O2O0.22207 (3)0.94497 (3)0.36246 (3)124
O3O0.50823 (3)0.16506 (3)0.33023 (3)124
423TISi0.35535 (1)0.11910 (1)0.38727 (1)
O1O0.39686 (9)0.13753 (9)0.5
O2O0.22217 (4)0.94518 (3)0.36274 (4)
O3O0.50785 (3)0.16526 (4)0.33030 (3)
573TISi0.35519 (2)0.11916 (1)0.38734 (1)
O1O0.3968 (1)0.1380 (1)0.5
O2O0.22223 (5)0.94532 (4)0.36282 (5)
O3O0.50773 (4)0.16543 (4)0.33036 (4)
723TISi0.35492 (1)0.11939 (1)0.38756 (1)
O1O0.3966 (1)0.1374 (1)0.5
O2O0.22220 (4)0.94560 (3)0.36276 (4)
O3O0.50725 (3)0.16570 (3)0.33061 (3)
873TISi0.35471 (1)0.11963 (1)0.38772 (1)
O1O0.3969 (1)0.1381 (1)0.5
O2O0.22234 (5)0.94590 (3)0.36273 (5)
O3O0.50689 (3)0.16604 (4)0.33064 (4)
1023TISi0.35435 (1)0.11991 (1)0.38778 (1)
O1O0.3974 (1)0.1387 (1)0.5
O2O0.22248 (5)0.94620 (3)0.36241 (4)
O3O0.50637 (3)0.16624 (4)0.33073 (3)
§ Corresponding to full occupation of Fe at A sites, as normalized by the atomic number of Fe according to the atomic ratios Fe; Mn: Al: Mg from EPMA.
Table 3. Non-zero third (Cijk) and fourth (Dijkl) anharmonic ADPs of Li at T(II) and Na at A sites at 1023 K, refined with synchrotron XSD data of Sugilite#1. Refinements of these anharmonic ADPs gave rise to a slightly improved structure model with the agreement factors wR (against F2) = 0.032 and goodness of fit = 2.230 in comparison to refinements of harmonic ADPs (Table 1).
Li at T(II)C113 = 0.0008(3); C123 = C113 = 0.0008
Na at AC111 = 0.0034(2); C112 = 0.0033(2); C122 = C112C111 = −0.00007; C222 = −C111 = −0.0034
D1133 = −0.00047(8); D1233 = 0.5; D1133 = −0.00023; D2233 = D1133 = −0.00047; D3333 = −0.0005(2)
Table 4. Interatomic distances, individual bond valences (BV), and bond valence sum (BVS) of each cation, resulting from XSD data analysis at 1023 K (* = symmetry equivalent sites). The bond valence parameters d0 and B0 applied in this study are given in Supplementary S7.
Site (Type)LigandsBonding Distance (Å)BV (v.u.)BVS (v.u.)
A (Fe)O3 (×6)2.0048 (4)0.515 (1) ×63.088 (1)
B(Na)O1 (×3)2.4257 (10)0.186 (1) ×3
O3 (×9)2.9023 (4)0.051 (0) ×90.865 (1)
C (K)O2 (×12)3.0074 (5)0.094 (0) ×121.126 (0)
TI (Si)O11.6271 (3)0.992 (1)
O2×1.6217 (3)1.006 (1)
O2 *1.6207 (5)1.009 (1)
O31.5797 (4)1.127 (1)4.134 (2)
TII (Li)O3 (×4)1.9994 (4)0.237 (1) ×40.946 (0)
Table 5. Interatomic distances between framework oxygens and Li interstitial sites LiX1 at (0.3397, 0, 0.25) and LiX2 at (0.7230, 0.8630, 0.25), as well as Na interstitial sites NaX1 at (0.66667, 0.33333, −0.0372), NaX2 at (0.6193, 0.1084, 0.4389), and NaX3 at (0.5, 0.5, 0), are given with theoretical BVS values for hypothetical 100% occupation at each interstitial site. These interstitials could be unambiguously localized in ΔF maps evaluated with XSD data at 1023 K (* = symmetry equivalent sites).
Site (Type)LigandsBonding Distance (Å)BV (v.u.)BVS (v.u.)
LiX1 (Li)O2 (×2)1.8874 (5)0.320 (0) ×2
O3 (×2)2.0269 (3)0.220 (0) ×21.080 (1)
LiX2 (Li)O22.3354 (4)0.095 (0)
O2 *1.8061 (5)0.399 (1)
O2 *2.3568 (5)0.090 (0)
O2 *1.7918 (5)0.415 (1)
O32.4579 (4)0.069 (0)
O3 *2.4686 (3)0.067 (0)1.134 (1)
NaX1(Na)O1 (×3)2.4818 (12)0.160 (1) ×3
O3 (×3)2.4886 (4)0.157 (0) ×30.949 (1)
NaX2 (Li)O12.5528 (13)0.132 (0)
O1 *2.2990 (9)0.262 (1)
O1 *2.5592 (11)0.130 (0)
O22.2098 (5)0.391 (0)
O32.1504 (4)0.333 (0)
O32.7205 (3)0.084 (0)
O32.8429 (4)0.060 (0)1.391 (1)
NaX3(Na)O1 (×2)2.1133 (9)0.432 (1) ×2
O3 (×4)2.8986 (4)0.052 (0) ×41.072 (2)
Table 6. Comparison of bulk DC conductivity of sugilite relatives along with the Na:Li ratio pfu. Note that the contribution of grain boundary charge transport to the bulk conductivity is significant to the compact microstructure of Sugilite#2, when comparing to [11].
CompoundIonic Conductivity
(S·cm−1)
Na:Li Ratio
(pfu)
SiO4
Configuration
Sugilite mass (Fe,Al,Mn)2Na2K[Li3Si12O30] ([23], this study)1.7·10−3 at 943 K2:3double 6MR
Sogdianite (Zr,Al,Fe)2Na0.36K[Li3Si12O30] ⊥ [001] [10]4.1·10−5 at 923 K0.36:3double 6MRs
Synthetic powder sample Fe2Na2K[Li3Si12O30] [11]1.2·10−5 at 923 K2:3double 6MRs
Zektzerite Zr2Na2Li2Si12O30 highest || [001] [37,38]3·10−5 at 1173 K2:2double 6MCs
Pezzottaite Cs[(Be2Li)Al2Si6O18] [40] ⊥ [001]
|| [001]
8.3·10−6 at 1093 K
1.1·10−5 at 1093 K
0:1single 6MRs
Disclaimer/Publisher’s Note: The statements, opinions and data contained in all publications are solely those of the individual author(s) and contributor(s) and not of MDPI and/or the editor(s). MDPI and/or the editor(s) disclaim responsibility for any injury to people or property resulting from any ideas, methods, instructions or products referred to in the content.

