Article

Rheological and Strength Properties of Steel-Slag Cemented Paste Backfill: Link to Gypsum Type and Dosage

1
State Key Laboratory of High-Efficient Mining and Safety of Metal Mine, Ministry of Education, University of Science and Technology Beijing, Beijing 100083, China
2
School of Civil and Resources Engineering, University of Science and Technology Beijing, Beijing 100083, China
3
School of Energy and Mining Engineering, China University of Mining and Technology Beijing, Beijing 100083, China
*
Author to whom correspondence should be addressed.
Minerals 2023, 13(3), 421; https://doi.org/10.3390/min13030421
Submission received: 9 February 2023 / Revised: 4 March 2023 / Accepted: 14 March 2023 / Published: 16 March 2023
(This article belongs to the Special Issue Cemented Mine Waste Backfill: Experiment and Modelling)

Abstract

:
This paper aims to study the effects of gypsum type and dosage on the rheological and strength properties of steel-slag cemented paste backfill (SSB-CPB) using fluorogypsum (FG), phosphogypsum (PG), and desulfurization gypsum (DG). Experimental results indicate that the yield stress and the viscosity of fresh SSB-CPB are the smallest when using FG, followed by PG, and the highest when using DG. The strength of hardened SSB-CPB is the lowest when using PG, regardless of curing time, and is the highest when using DG after 3 and 7 days of curing or FG after 14 and 28 days of curing. With the increase of DG dosage, yield stress and viscosity of fresh CPB increase, while the strength of hardened CPB first increases and then decreases. For the rheological properties, the zeta potential changes the yield stress of fresh SSB-CPB, while the internal particle size and pH affect its viscosity. For the strength property, regardless of the effect of gypsum type or dosage, the changes in the results of microscopic experiments for hardened paste and SSB-CPB are critical indicators that the strength of SSB-CPB varies. When steel slag dosage is 35%, the best gypsum dosage is 24% and gypsum type is DG in the SSB for backfill. The findings of this study contribute to an enhanced understanding of the backfill binder material, which has beneficials of lower greenhouse gas emission, avoidance of natural raw materials excavation, saving environmental taxes, and reducing backfill costs.

1. Introduction

Cemented paste backfill (CPB) can effectively solve many problems caused by mining, such as surface subsidence [1,2], land reduction [3,4], and reduced ore recovery [5,6], which are increasingly common in mines worldwide. CPB [7,8] is a homogeneous mixture of aggregate (tailings, waste rock, or Gobi sand), binder (cement, slag, or fly ash), and water (tap water or mine processed water) with a solid mass concentration of 60%~85%, and a binder to aggregate mass ratio that usually varies from 2% to 9% in foreign countries [9], but varies from 10% to 20% in China due to the conditions of rock-crushing [10].
Ordinary Portland cement (OPC) is the main binder used in CPB at present, which accounts for 3/4 of the cost of CPB [11,12,13], and generates a large amount of carbon dioxide in production [14,15]. Therefore, the use of OPC in CPB cannot meet the requirements of economic rationality, environmental friendliness, and sustainable development. Many scholars have attempted to eliminate the disadvantages of OPC by exploring alternative binders, including slag–cement [16,17], fly ash–cement [16,18], alkali-activated slag binder [19,20,21], and alkali-sulfate-activated slag binder [22]. The alkaline activators include cement clinker, sodium hydroxide, sodium silicate, and quicklime, while sulfate activators mainly involve sodium sulfate, dihydrate gypsum, hemihydrate gypsum, and anhydrite.
Steel slag (SS), known as “overburned cement clinker”, is the main solid waste of iron and steel plants and shares similar chemical and mineral compositions to cement clinker, including abundant dicalcium silicate and tricalcium silicate [23,24]. Although the formation temperature of SS is high and most are naturally cooled, SS has potential cementitious activity and can be used as an alkaline activator [25,26,27]. Desulfurization gypsum (DG), fluorogypsum (FG), and phosphogypsum (PG) are the main solid wastes of thermal power plants [28], the fluorine chemical industry [29], and the phosphorus chemical industry [30], respectively. They are sulfate activators, with the main mineral phase of CaSO4·nH2O (n = 0/0.5/2). Ground granulated blast furnace slag (referred to as slag henceforth) [31,32] is composed of amorphous glass, and the glass content is generally more than 80%. Due to its high potential cementitious activity, slag is widely used in various industries worldwide. Steel-slag binder (SSB) is composed of steel slag, slag, and gypsum in varying proportions, which will be discussed further in Section 2.2. The production capacity of SS, DG, FG, and PG in China in 2019 was 149.5, 115.2, 5.6, and 72.5 thousand trillion mg, respectively [33]. It can be inferred that these solid wastes can be partially consumed by using SSB in CPB, which will reduce resource waste and alleviate environmental pollution.
Rheological properties and strength are crucial indicators to evaluate the efficiency, safety, and sustainability of CPB [6,8,34,35,36,37]. Fresh CPB is usually transported to an underground goaf from the surface paste-fill plant through pipeline reticulation under gravity or pump pressure. This process cannot occur if a blockage or other failure of the pipelines occurs, and the performance of CPB pipeline transportation is mainly affected by rheological properties. Hardened CPB must have a certain strength in order to provide a safe working platform [7,38,39]. Yield stress and viscosity are the main parameters to determine rheological properties of fresh CPB, and uniaxial compressive strength (UCS) can be used to characterize the mechanical properties of hardened CPB. Previous studies of the backfill mining industry mainly focused on the performance of ordinary Portland cement [11,12,13,14,15,16], slag–cement [16,17], fly ash–cement [16,18], alkali-activated slag binder [19,20,21], and alkali-sulfate-activated slag binder [22] in CPB or cemented tailings backfill (CTB).
Unlike the aforementioned binders, SS-incorporated binder is mainly used as supplementary cementitious material during the manufacture of cement or concrete. However, the utilization ratio of SS is very low due to technical barriers, including low hydration, volume expansion, and degradation of mechanical properties [40,41,42]. Compared with the SS-incorporated binder that has been extensively researched in other fields, fewer studies have explored the use of SSB in CPB. Some scholars [43,44] have already investigated the effects of SS content, binder content, concentration, and aggregate grain size on the rheological and strength properties of SSB-CPB and its application in mine backfill. However, the effect of gypsum, one of the components of SSB, has not yet been analyzed. Therefore, it is necessary to study the effect of gypsum on the performance of SSB-CPB to expand the understanding of SSB-CPB. The change laws of the rheological and strength properties of SSB-CPB using different gypsum types and dosages are studied and demonstrated in this work.

2. Experimental Programs

2.1. Materials

2.1.1. Aggregate

While natural tailings (NTs) are most commonly used as aggregate in backfill mines, they can have a negative impact on CPB. For example, strength loss was observed in CPB due to the formation of expansive secondary minerals when copper–zinc tailings were used as aggregate [45], and the leaching of toxic elements may have serious environmental consequences using polymetallic tailing aggregates [46,47]. Therefore, in order to eliminate the influence of the chemical and mineral compositions of NTs on the uncertainty of CPB, we use artificial silica tailings (STs) as aggregate in this study. The chemical composition and grain size distribution (GSD) of STs are shown in Table 1 and Figure 1, respectively. The STs are mainly composed of quartz, which is the main mineral in NTs [48]. Meanwhile, the coefficient uniformity (Cu) and coefficient of curvature (Cc) of STs are 8.04 and 1.12, respectively, illustrating that the GSD of STs is relatively good.

2.1.2. Binder

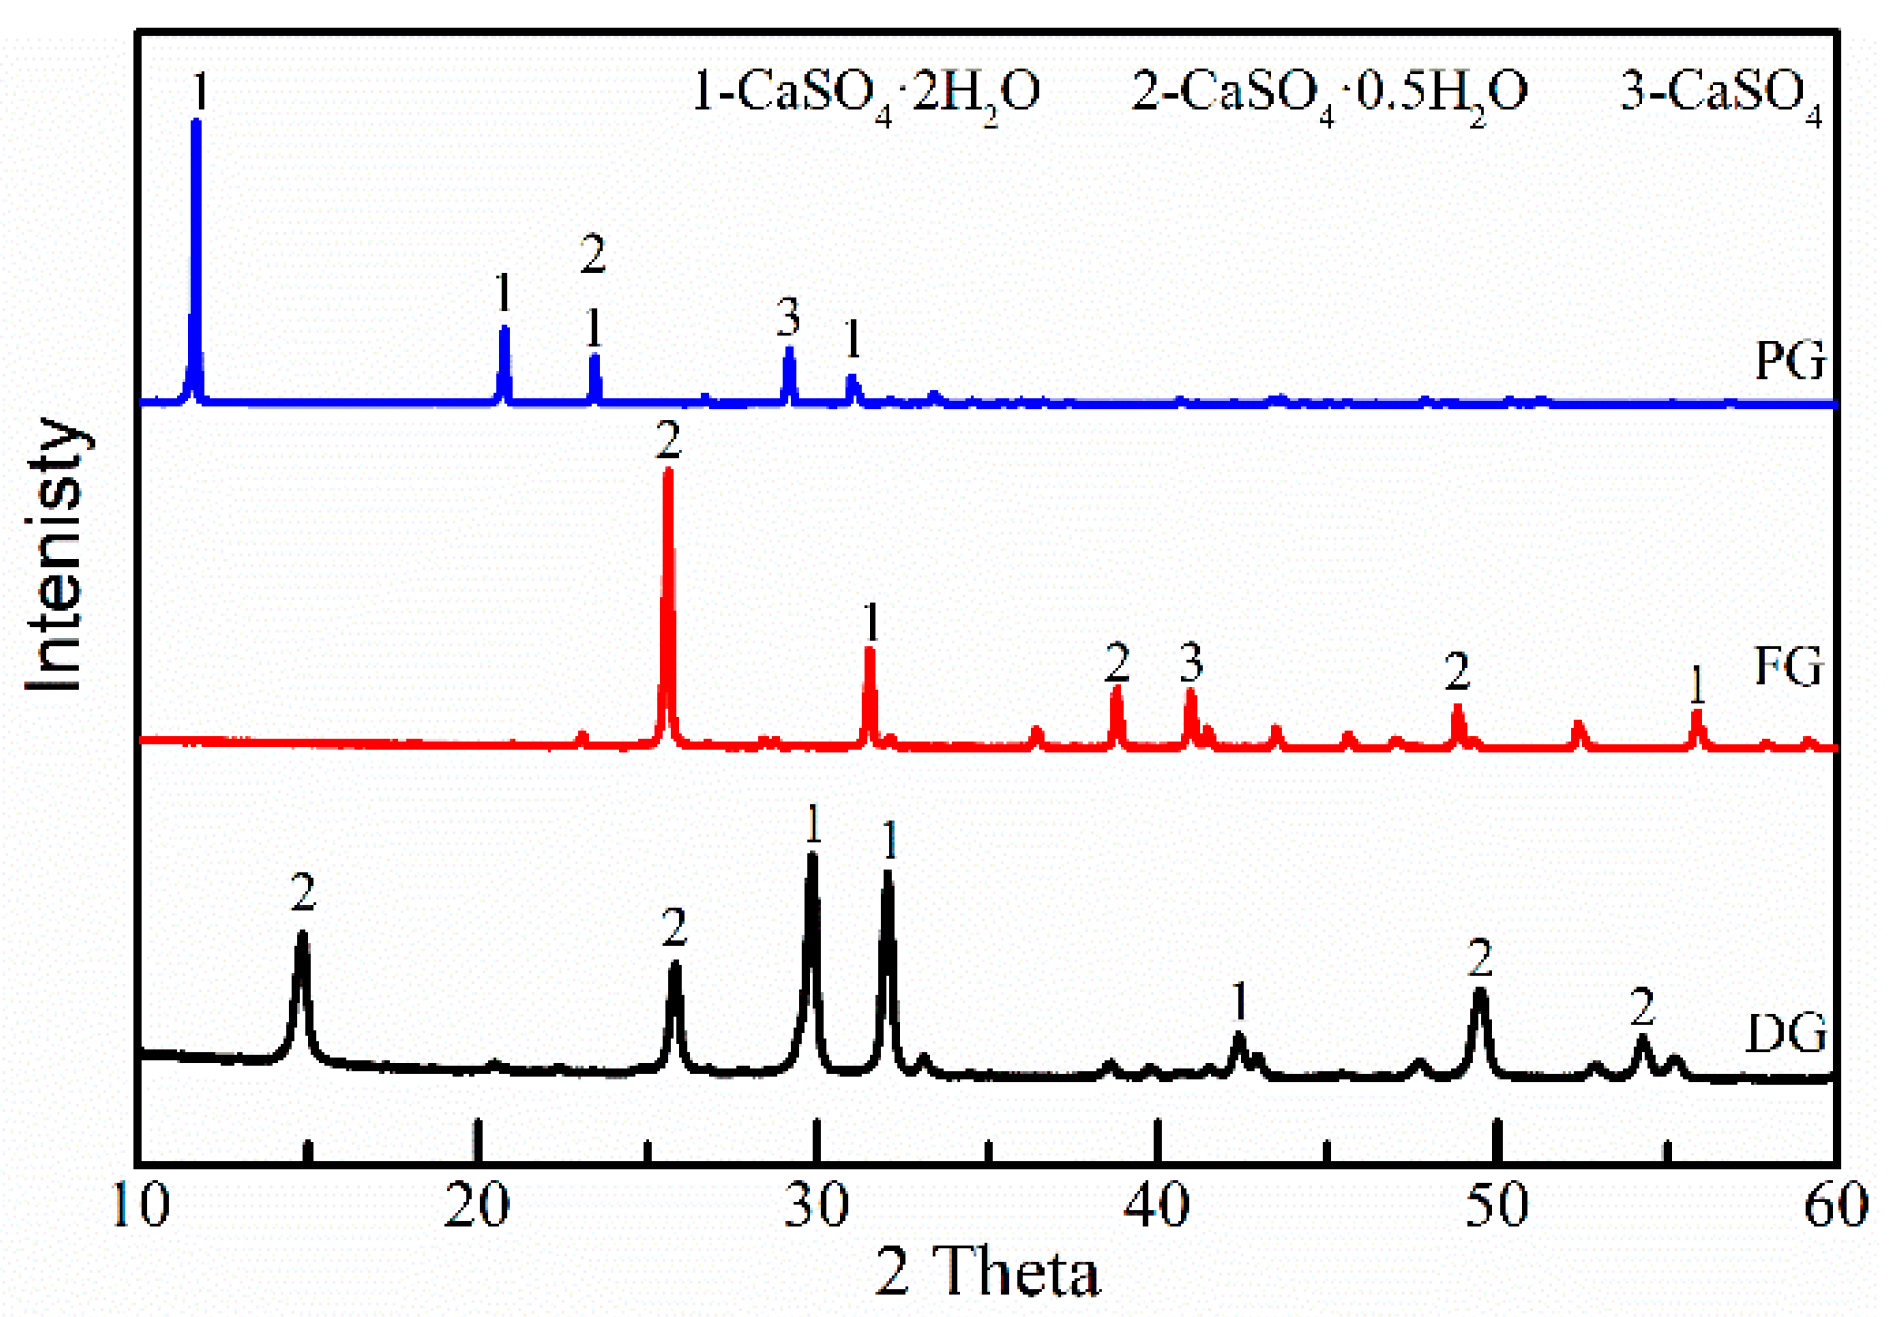
In this study, SSB is a ternary cementitious material composed of SS, slag, and gypsum (DG, FG, or PG), and the chemical composition and GSD of each component are shown in Table 1 and Figure 1, respectively. The basicity value of SS R = CaO/(SiO2 + P2O5) = 2.43 illustrates that SS is a medium-basicity slag with high hydraulic activity [49]. The mass coefficient K = (CaO + MgO + Al2O3)/(SiO2 + MnO + TiO2) = 2.03 and basicity coefficient M0 = (CaO + MgO)/(SiO2 + Al2O3) = 1.51 indicate that the slag in this study is high-activity alkaline slag. As shown in Table 1 and Figure 2 (X-ray diffraction (XRD) patterns of different gypsums), the main mineral compositions of DG, FG, and PG are CaSO4·2H2O and CaSO4·0.5H2O. There is also a small amount of CaSO4 in FG and PG. The gypsum particle sizes from small to large are FG, NG, and PG, as shown in Figure 1. The SEM diagram in Figure 3 shows the particle morphologies of DG and PG at the same magnification (300 times), where DG has a smaller particle size than PG. FG can only be observed by increasing magnification to 3000 times, indicating that the particle size of FG is the smallest, which is consistent with the results obtained in Figure 1. The three gypsums are predominantly plate or flake, as shown in Figure 3. The PG used in this study was sourced from Gansu Wengfu Chemical Co., and the rest of the materials were from Fujian Sanming Iron and Steel (Group) Co., Ltd.

2.1.3. Water

Tap water was used in the experiments, and the effect of tap water chemistry on the performance of CPB was negligible to ensure that the effect of gypsum type and dosage was the focus of the study.

2.2. Sample Preparation

Performance tests of CPB with different mixing proportions were carried out to explore the effect of gypsum type and dosage on the rheological and strength properties of SSB-CPB. The results are shown in Table 2. The SSB mixing proportions were selected because, with the increase of SS content in the case of a fixed DG dosage of 24%, both the yield stress and viscosity of fresh SSB-CPB increased, while the UCS of hardened SSB-CPB was optimal when SS content was 35% and then decreased in [43]. However, the rheological and strength properties of SSB-CPB using a different type of gypsum or dosage are unclear. Therefore, the SS content for all samples was kept at 35%, and the rheological and strength properties of SSB-CPB were investigated under the effect of gypsum types and dosages. Similar to the study in [43], the binder content of all samples was 4.5%, and the water–cement ratio was 7.35, which are frequently used proportions in backfill mines worldwide. In addition, the STs content for the CPB samples was total solid content (100%) minus binder content (4.5%), equaling 95.5%.
The required amounts of STs, SSB, and water were mixed by a small mixer for about 5 min to obtain a homogeneous CPB mixture (see Table 2). The prepared fresh CPB was then poured into different beakers to test rheological properties, zeta potential, and pH value, and the remaining fresh CPB was poured into 70.7 mm × 70.7 mm × 70.7 mm molds. Similar to in the literature [20,31,50], the molds were manually vibrated to remove the entrapped air in the CPB samples and then sealed with plastic caps and tape to prevent the evaporation of the water in CPB samples. After curing for 24 h, all CPB samples were demolded and sealed with a plastic cover and tape. The hardened CPB samples were cured at a temperature of 20 °C and a humidity of 95%. After a predetermined curing time (3, 7, 14, and 28 days), the hardened CPB samples were subjected to UCS, scanning electron microscopy (SEM), and mercury intrusion porosimetry (MIP) tests to determine their strength and microstructure. The SSB-cemented paste (SSB-CP) samples with a fixed water–cement ratio of 0.4 were also subjected to X-ray diffraction (XRD) and thermal gravity/differential thermal gravity (TG/DTG) tests with the same curing time.

2.3. Testing of Samples

2.3.1. Rheology Tests

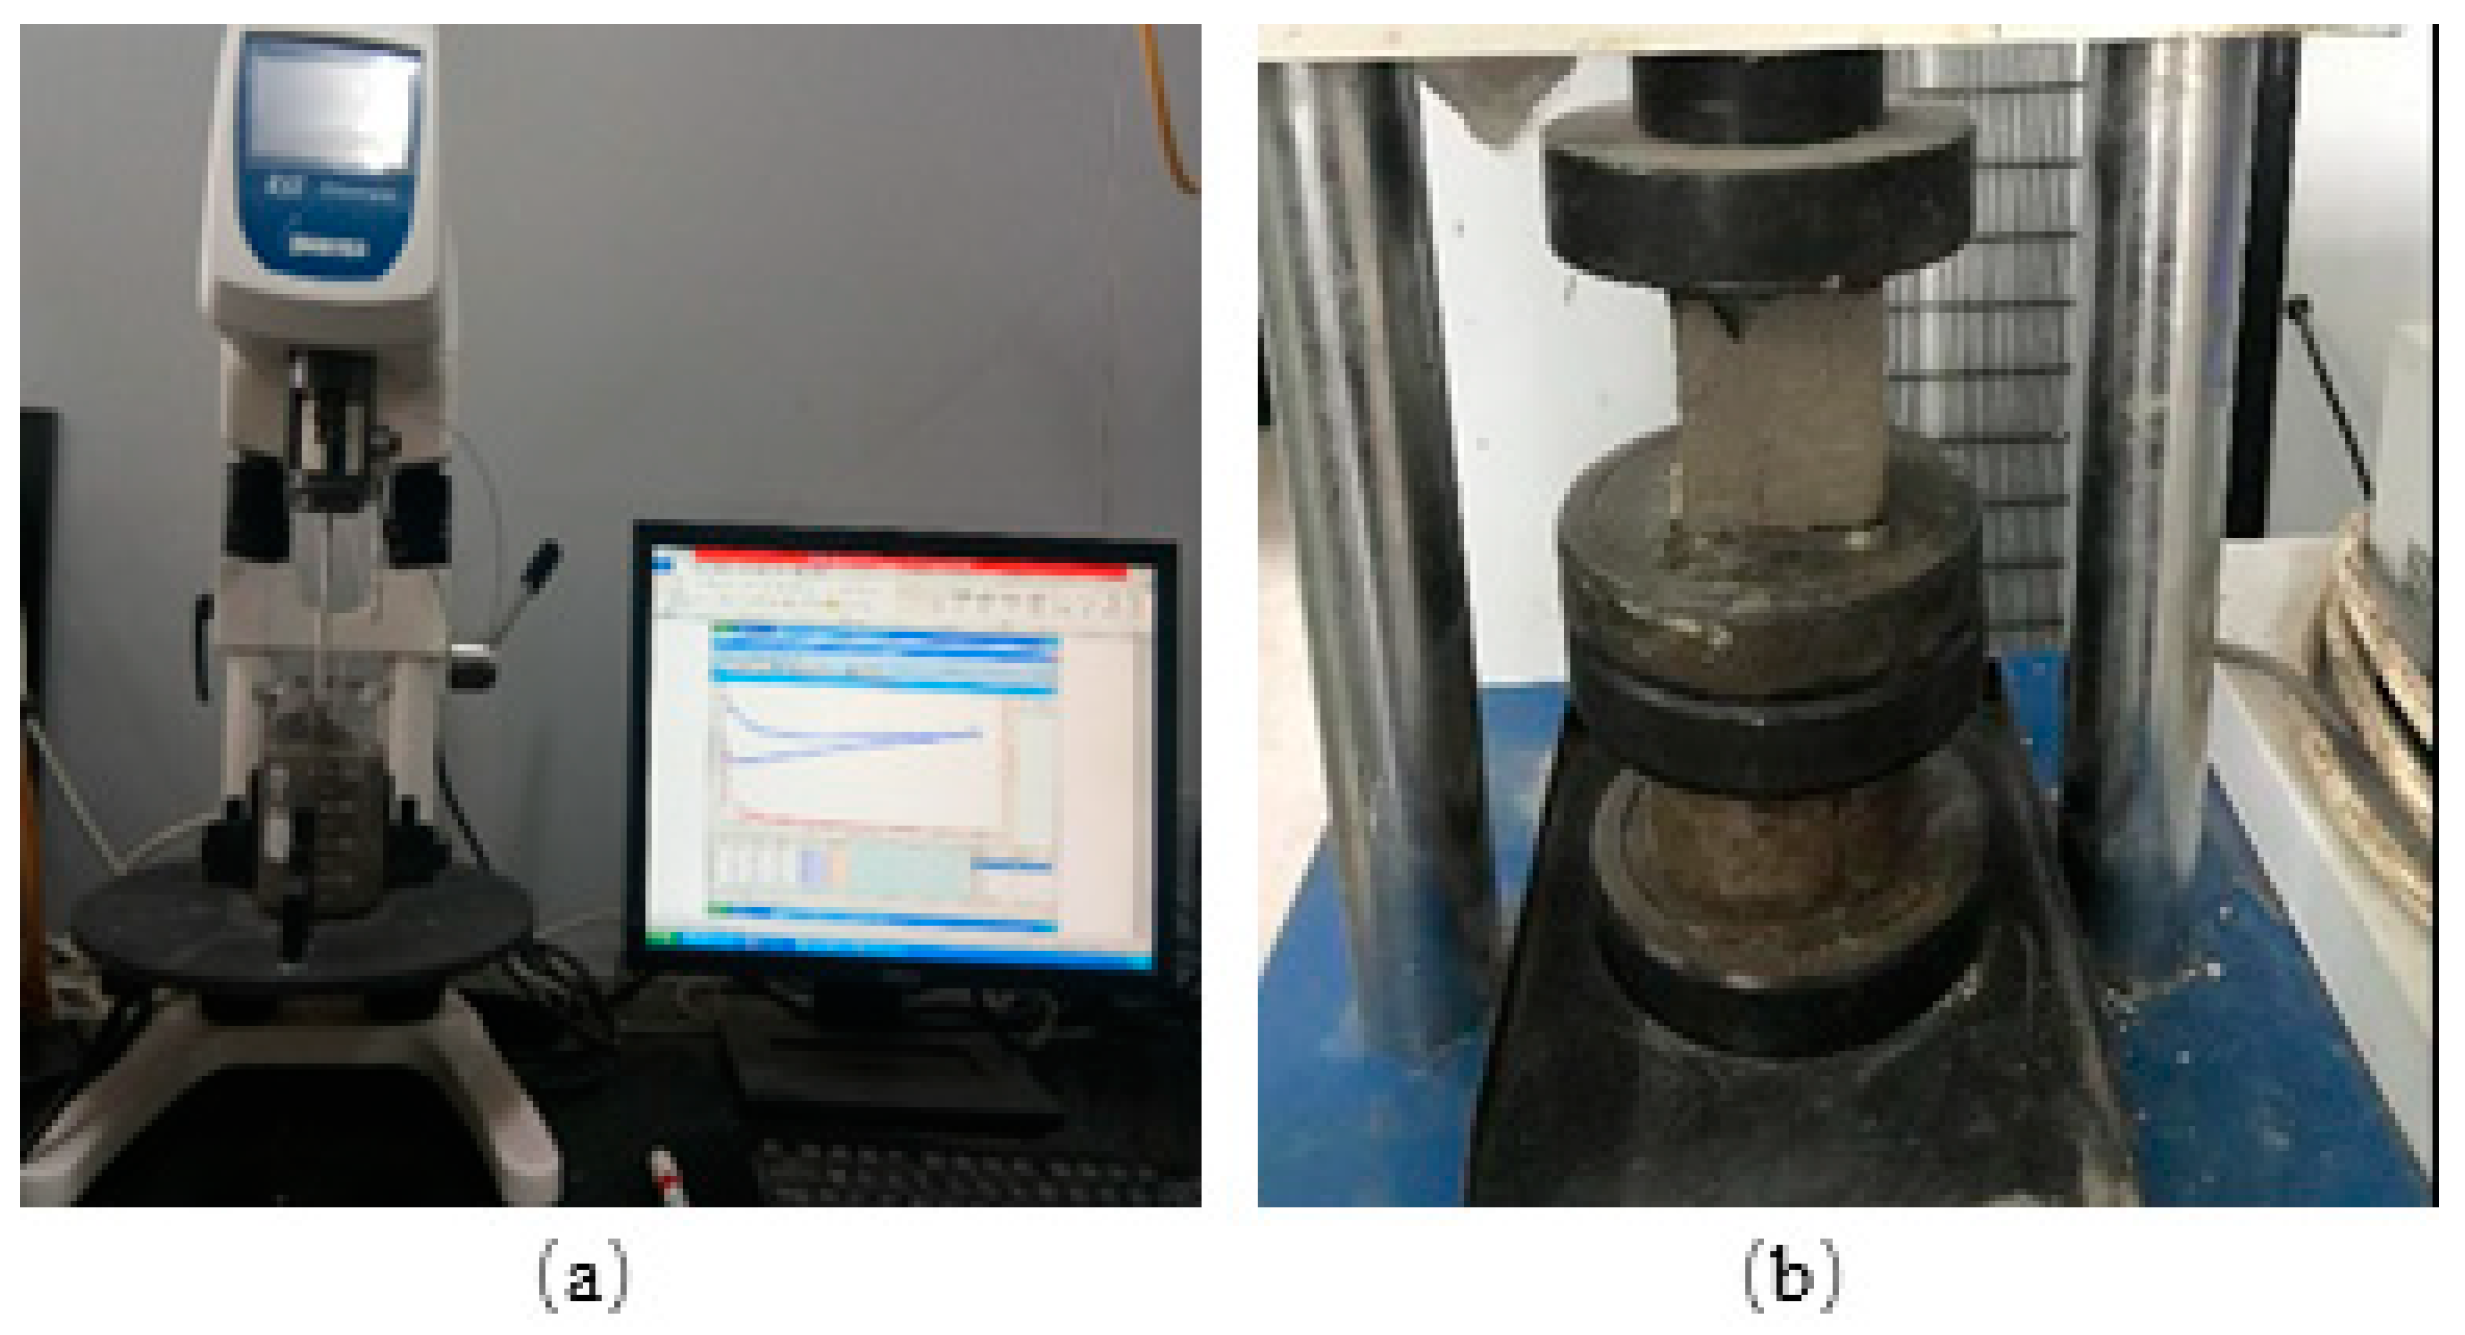
Rheology tests of the fresh CPB samples were carried out using a Brookfield R/S Plus soft solids rheometer, which was set to controlled shear rate mode and equipped with a V40-20 vane spindle. The shear time of the rheometer was 0–240 s−1, consisting of two stages in which the shear rate was first increased from 0 to 120 s−1 and then decreased to 0 s−1. The rheological properties of CPB can be described accurately by the Bingham model [51], and it is homogeneously mixed at surface paste-fill plants before it is transported to underground goaf [38,39]. The 5 min mixing time described in Section 2.2 and the first shear stage from 0 to 120 s−1 of the samples simulate the shear period of stirring before the CPB is directly dumped into pipeline reticulation rather than silencing. Thus, it is reasonable to fit a second shear stage from 120 to 0 s−1 using the Bingham model to acquire CPB’s yield stress and viscosity. Three tests were performed on the fresh CPB to ensure accuracy, and the mean values of yield stress and viscosity were regarded as the results of the rheological properties. The procedure of the rheology tests is shown in Figure 4.

2.3.2. Uniaxial Compressive Strength Tests

After curing for 3, 7, 14, and 28 days, in accordance with ASTM C109, UCS tests of the hardened CPB samples were performed using a computer-controlled loading machine (WE-100; Jinan, China), with a loading capacity of 100 kN and a loading rate of 1 mm/min. Each test was repeated three times, and the average UCS results were calculated. The procedure of the UCS tests is shown in Figure 4.

2.3.3. Zeta Potential and pH Measurements

The surface chemistry of the particles has a critical influence on the rheological properties of suspensions [52]. In order to study the surface chemistry of the particles in a sample, it was necessary to measure the pH and zeta potential values of fresh CPB samples. The zeta potential of the fresh CPB samples was acquired using a Zetasizer Nano ZS90 potentiometer. The pH value was measured by a Metrohm 704 pH meter with an accuracy of ±0.003. The pH was obtained after the electrode was inserted into a sample of fresh CPB for 1 min. The detailed procedures of zeta potential and pH measurements can be obtained in the literature [52]. Each measurement was duplicated at least twice to ensure the validity of the results.

2.3.4. Microstructural Analysis

Four microstructural analysis techniques were employed to verify the effect of gypsum type and dosage on the UCS of SSB-CPB, including XRD, TG/DTG, SEM, and MIP. The hardened paste samples were tested by XRD and TG/DTG, and the hardened CPB samples were tested by SEM and MIP. All samples mentioned above were oven-dried at 45 °C for 24 h to remove the free water [32,53,54].
The XRD and TG/DTG tests were mainly used to analyze the mineralogical composition and thermal decomposition characteristics of the hydration products for hardened CP samples. The experimental instruments used for XRD and TG/DTG were the Bruker D8 advance diffractometer and TA Q50 thermal analyzer. The scanning of XRD was carried out at a 2θ range of 10–60° (Cu Kα radiation source) with a step width of 0.02° and a scanning speed of 1°/min. As for the TG/DTG test, about 10 mg of paste sample was heated in an inert nitrogen atmosphere from room temperature to 1000 °C at the rate of 10 °C per minute.
The SEM and MIP tests were employed to, respectively, analyze the microscopic morphology and porosity of the hardened CPB samples. The experimental instruments used for SEM and MIP testing were an LEO 1450 field-emission scanning electron microscope and a Micromeritics Autopore III 9420 mercury porosimeter, respectively. The SEM observations were performed at 10.0 kV acceleration with a resolution of 1.0 μm, and the samples for MIP test were chunks.

3. Results and Discussion

3.1. Effect of Gypsum Type on Rheological Properties of SSB-CPB

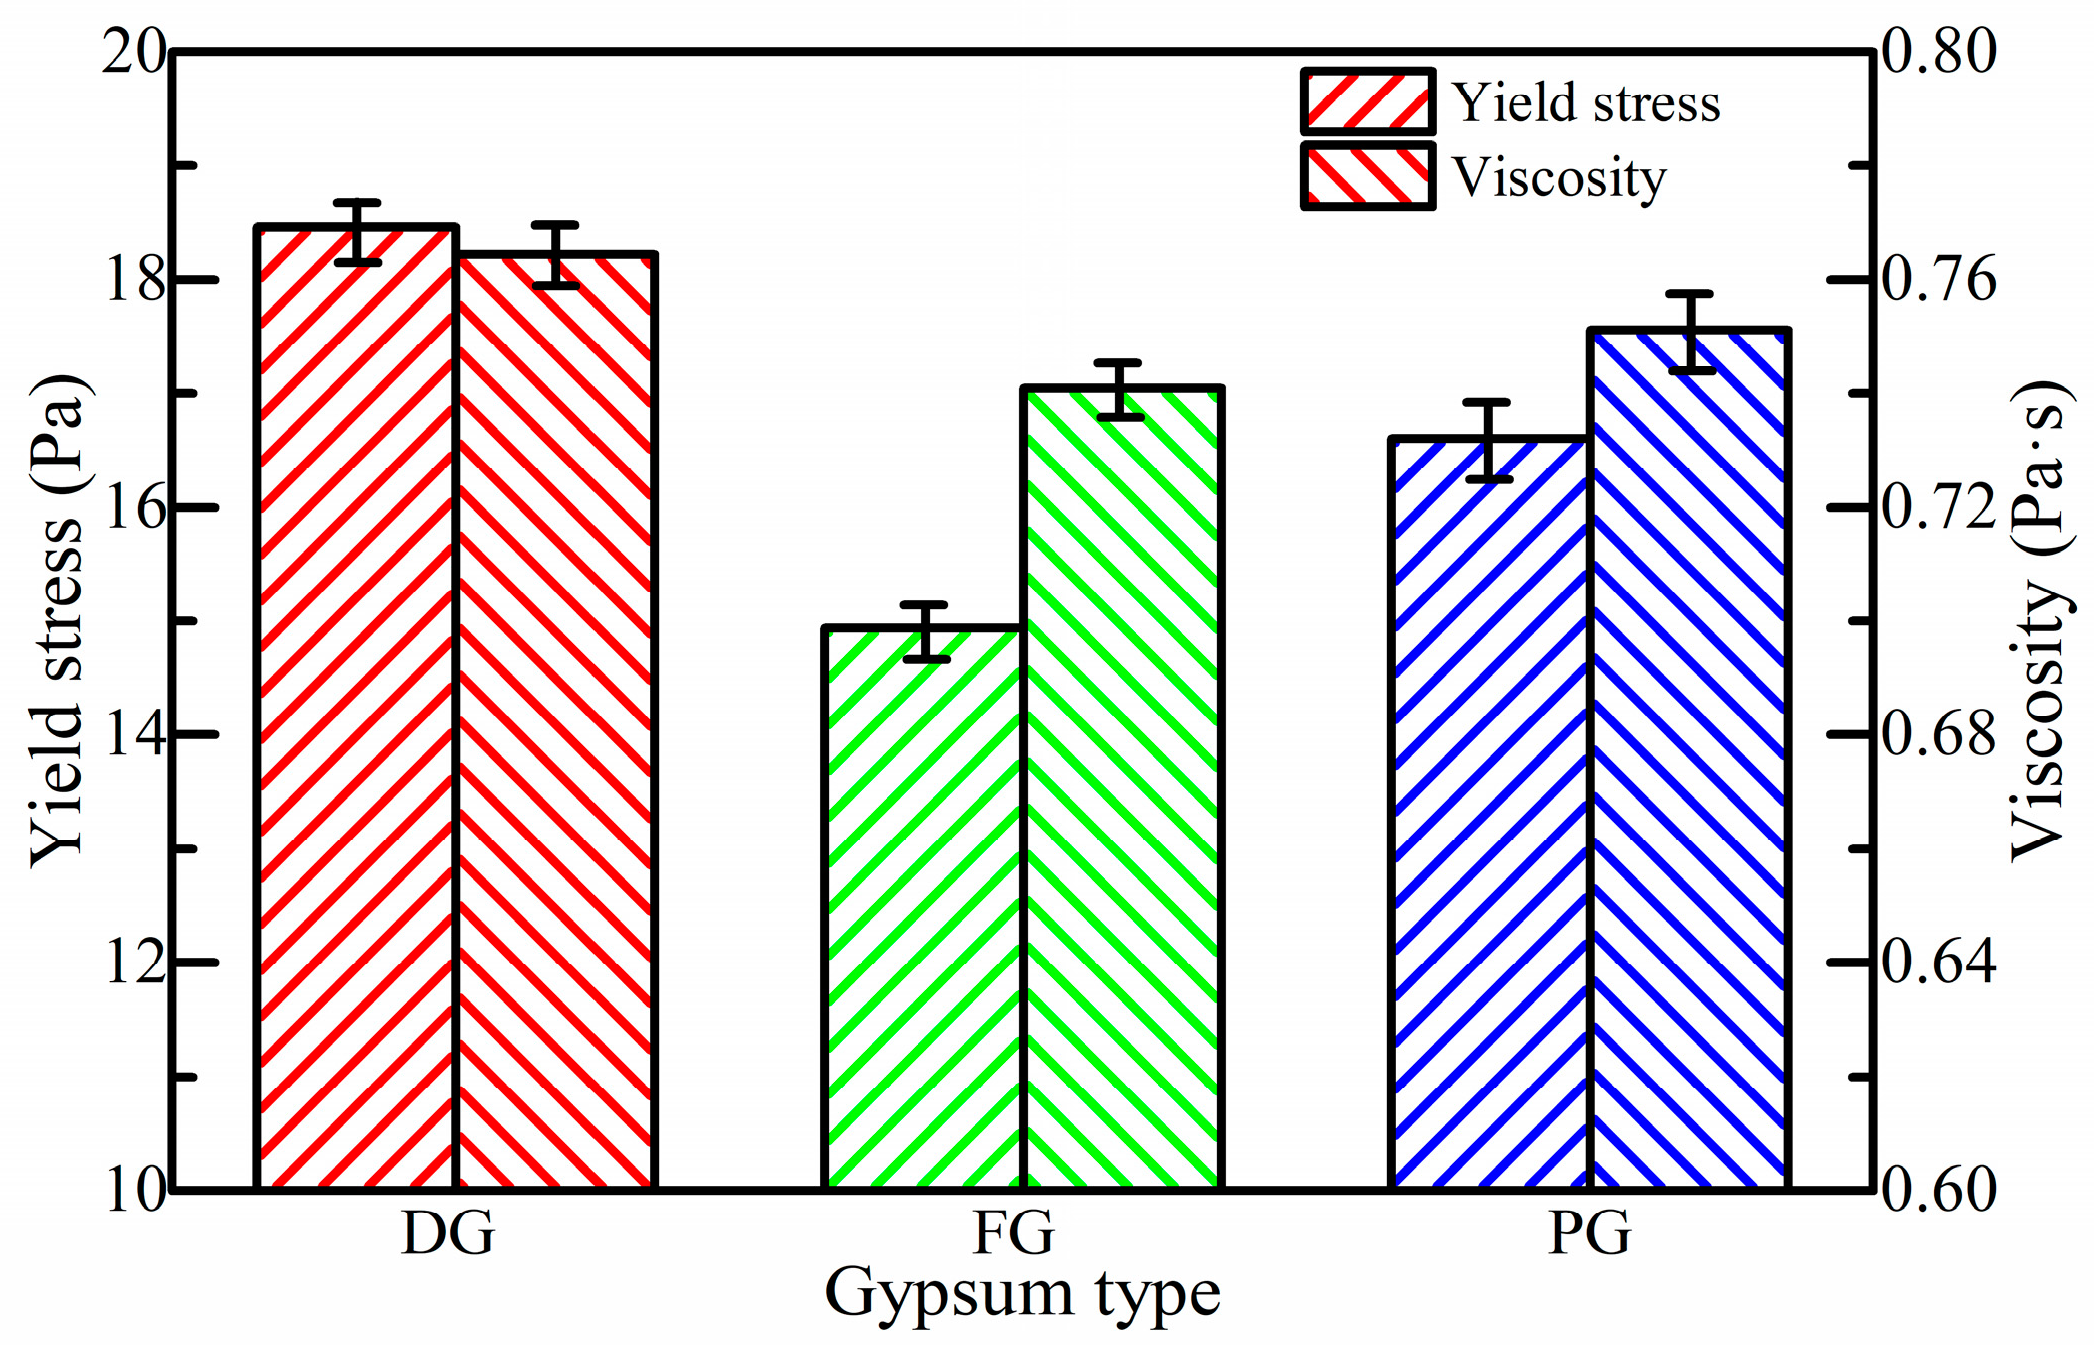
The test results of the rheological properties for fresh SSB-CPB with different types of gypsum are shown in Figure 5. It can be seen that the yield stress is 18.46, 14.94, and 16.60 Pa for DG24-SSB-CPB, FG24-SSB-CPB, and PG24-SSB-CPB, and the viscosity is 0.76, 0.74, and 0.75 Pa·s, respectively. Therefore, yield stress and viscosity for fresh SSB-CPB with different types of gypsum have the same change rule, and the order from small to large is FG, PG, and DG. However, the yield stress and viscosity influence mechanisms differ and require further discussion.
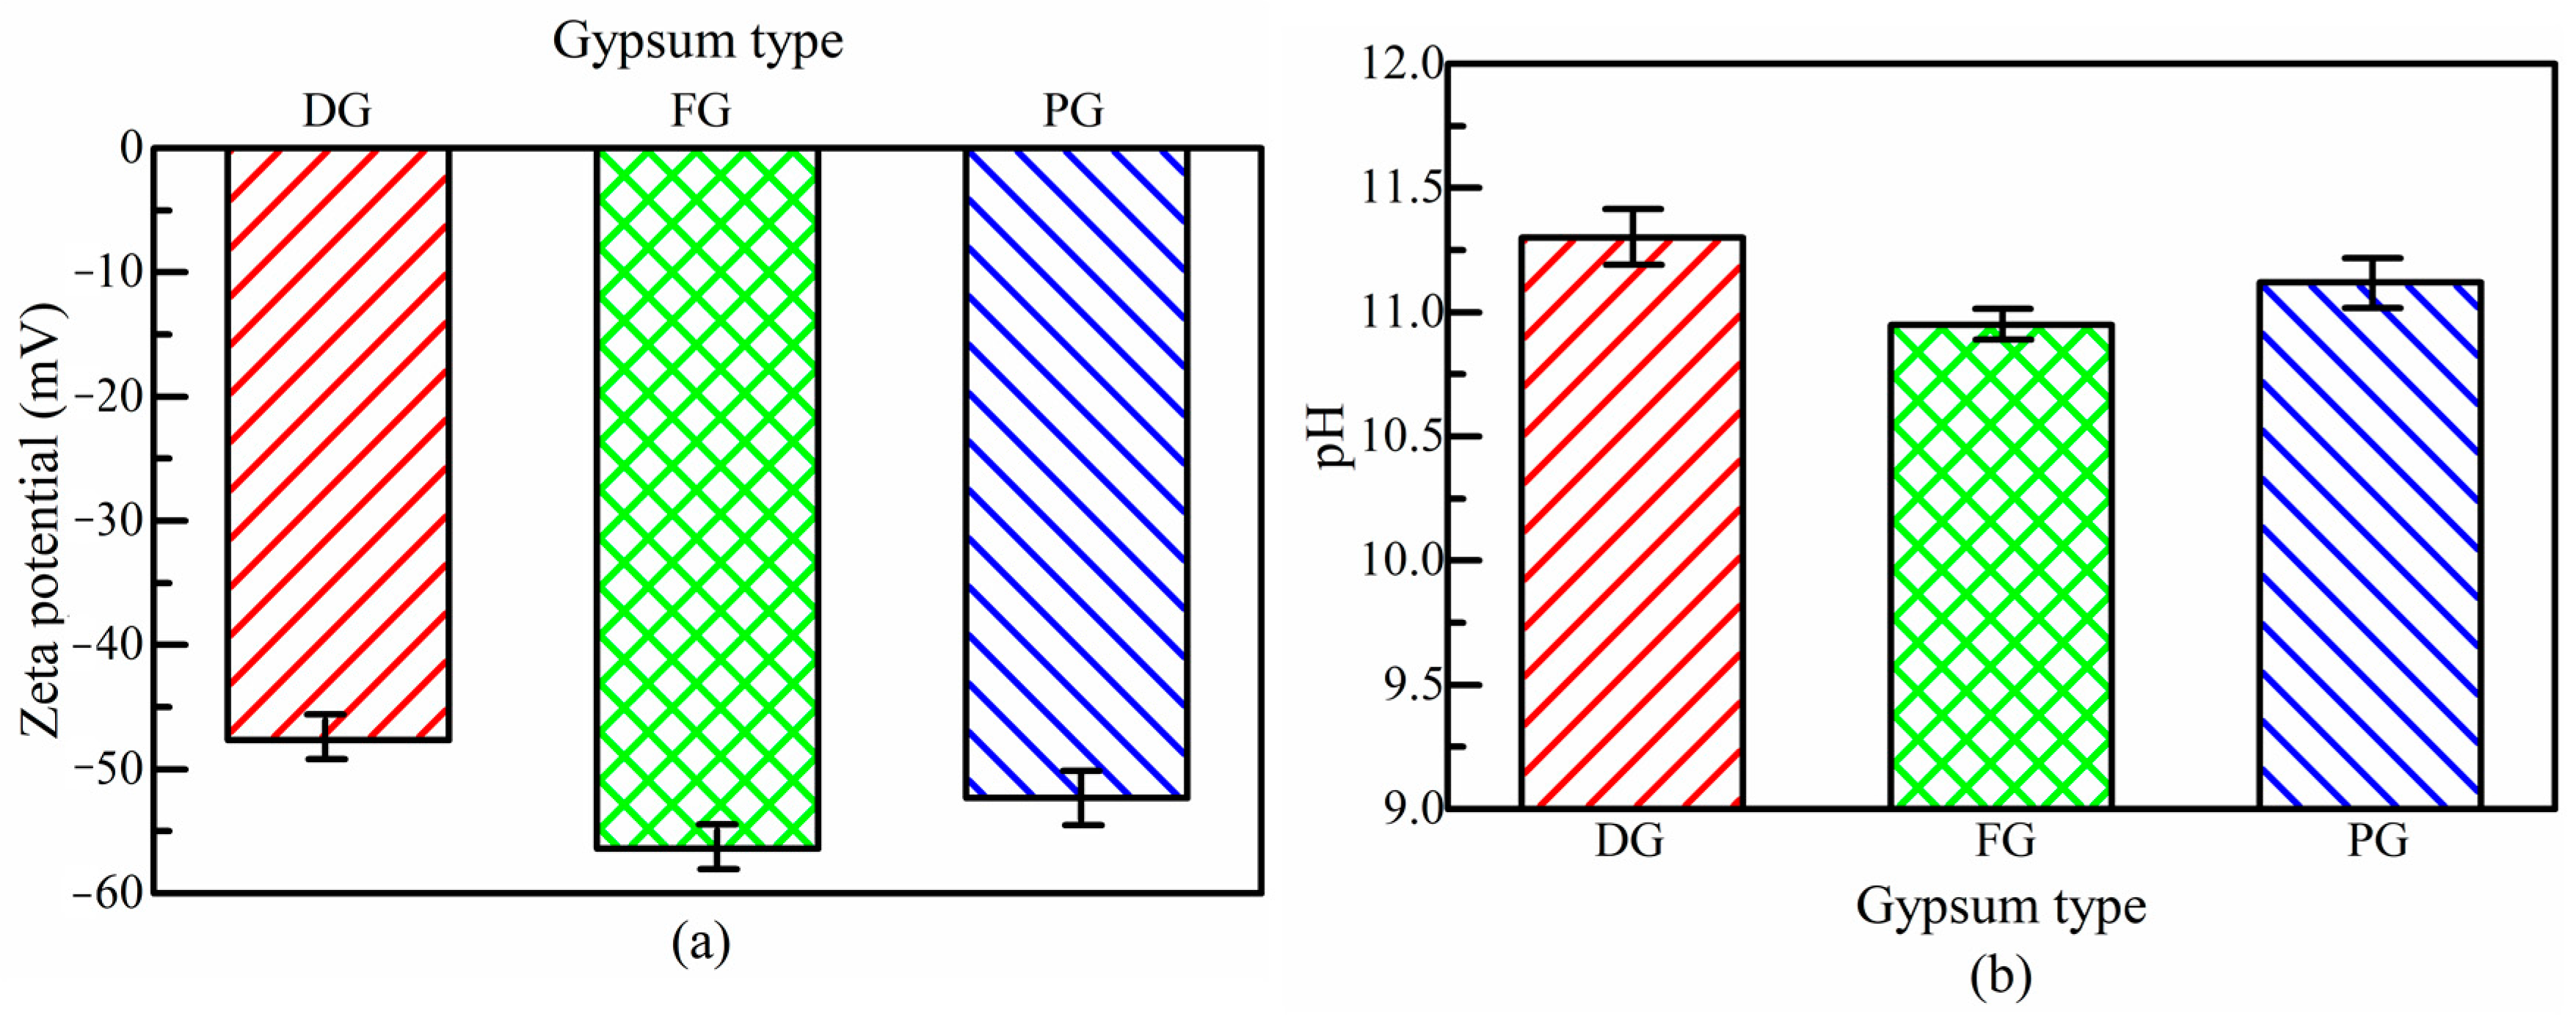
As previous studies determined [37,43,50], the yield stress of CPB mainly depends on the size of the zeta potential. In Figure 6a, it can be observed that the negative zeta potential of SSB-CPB with different gypsums is −56.4 mV (FG24-SSB-CPB), −52.3 mV (PG24-SSB-CPB), and −47.7 mV (DG24-SSB-CPB) from large to small. With the decrease of zeta potential, the electric double layer repulsive force is reduced, and the particles in SSB-CPB are more attractive, contributing to higher yield stress. This finding is consistent with those in Figure 5 and the results of slag-CPB [32]. Meanwhile, in view of the DVLO theory [55,56], a “secondly minimum” phenomenon can be observed in pace with the drop of zeta potential, in which there is a weaker and reversible cohesion between particles in the CPB. These weak flocs are not broken up by Brownian motion and must be broken by some extra force. The above two reasons influence the yield stress of fresh SSB-CPB, which is lowest using FG, followed by PG, and the highest using DG.
If the internal solid particles of CPB are larger, the friction between particles will be intensified in the moving state, which results in higher viscosity [32,56,57]. The average particle size of DG, FG, and PG is 47.5, 40.9, and 110.6 µm, respectively, as shown in Figure 1. Thus, the particle size of different gypsums from small to large is FG, DG, and PG, which is consistent with the results in Figure 3. Therefore, it can be speculated that the order of viscosity of fresh SSB-CPB with different gypsums from small to large will be FG, DG, and PG. However, it is interesting to see that the viscosity of DG24-SSB-CPB is higher than PG24-SSB-CPB (see Figure 3), and the reason for this requires further discussion. As pointed out in previous research [58], the external environment required for ettringite growth is pH = 10.8~12.5, and the optimal pH is 11.8. In addition, with the increase of pH, the hydration reaction is accelerated, and more hydration products (e.g., ettringite) are formed, which leads to larger internal solid particles of CPB and more severe friction between particles [43]. Figure 6b shows that the pH value of SSB-CPB is 11.30, 10.95, and 11.12 when DG, FG, and PG are used, respectively, which is in accordance with the viscosity. It can be speculated that DG24-SSB-CPB has more hydration products and severe friction because DG24-SSB-CPB has a higher pH value than PG24-SSB-CPB. As the viscosity change of the former caused by pH exceeds that of the latter, the viscosity of G24-SSB-CPB is higher than PG24-SSB-CPB.

3.2. Effect of Gypsum Type on Strength Property of SSB-CPB

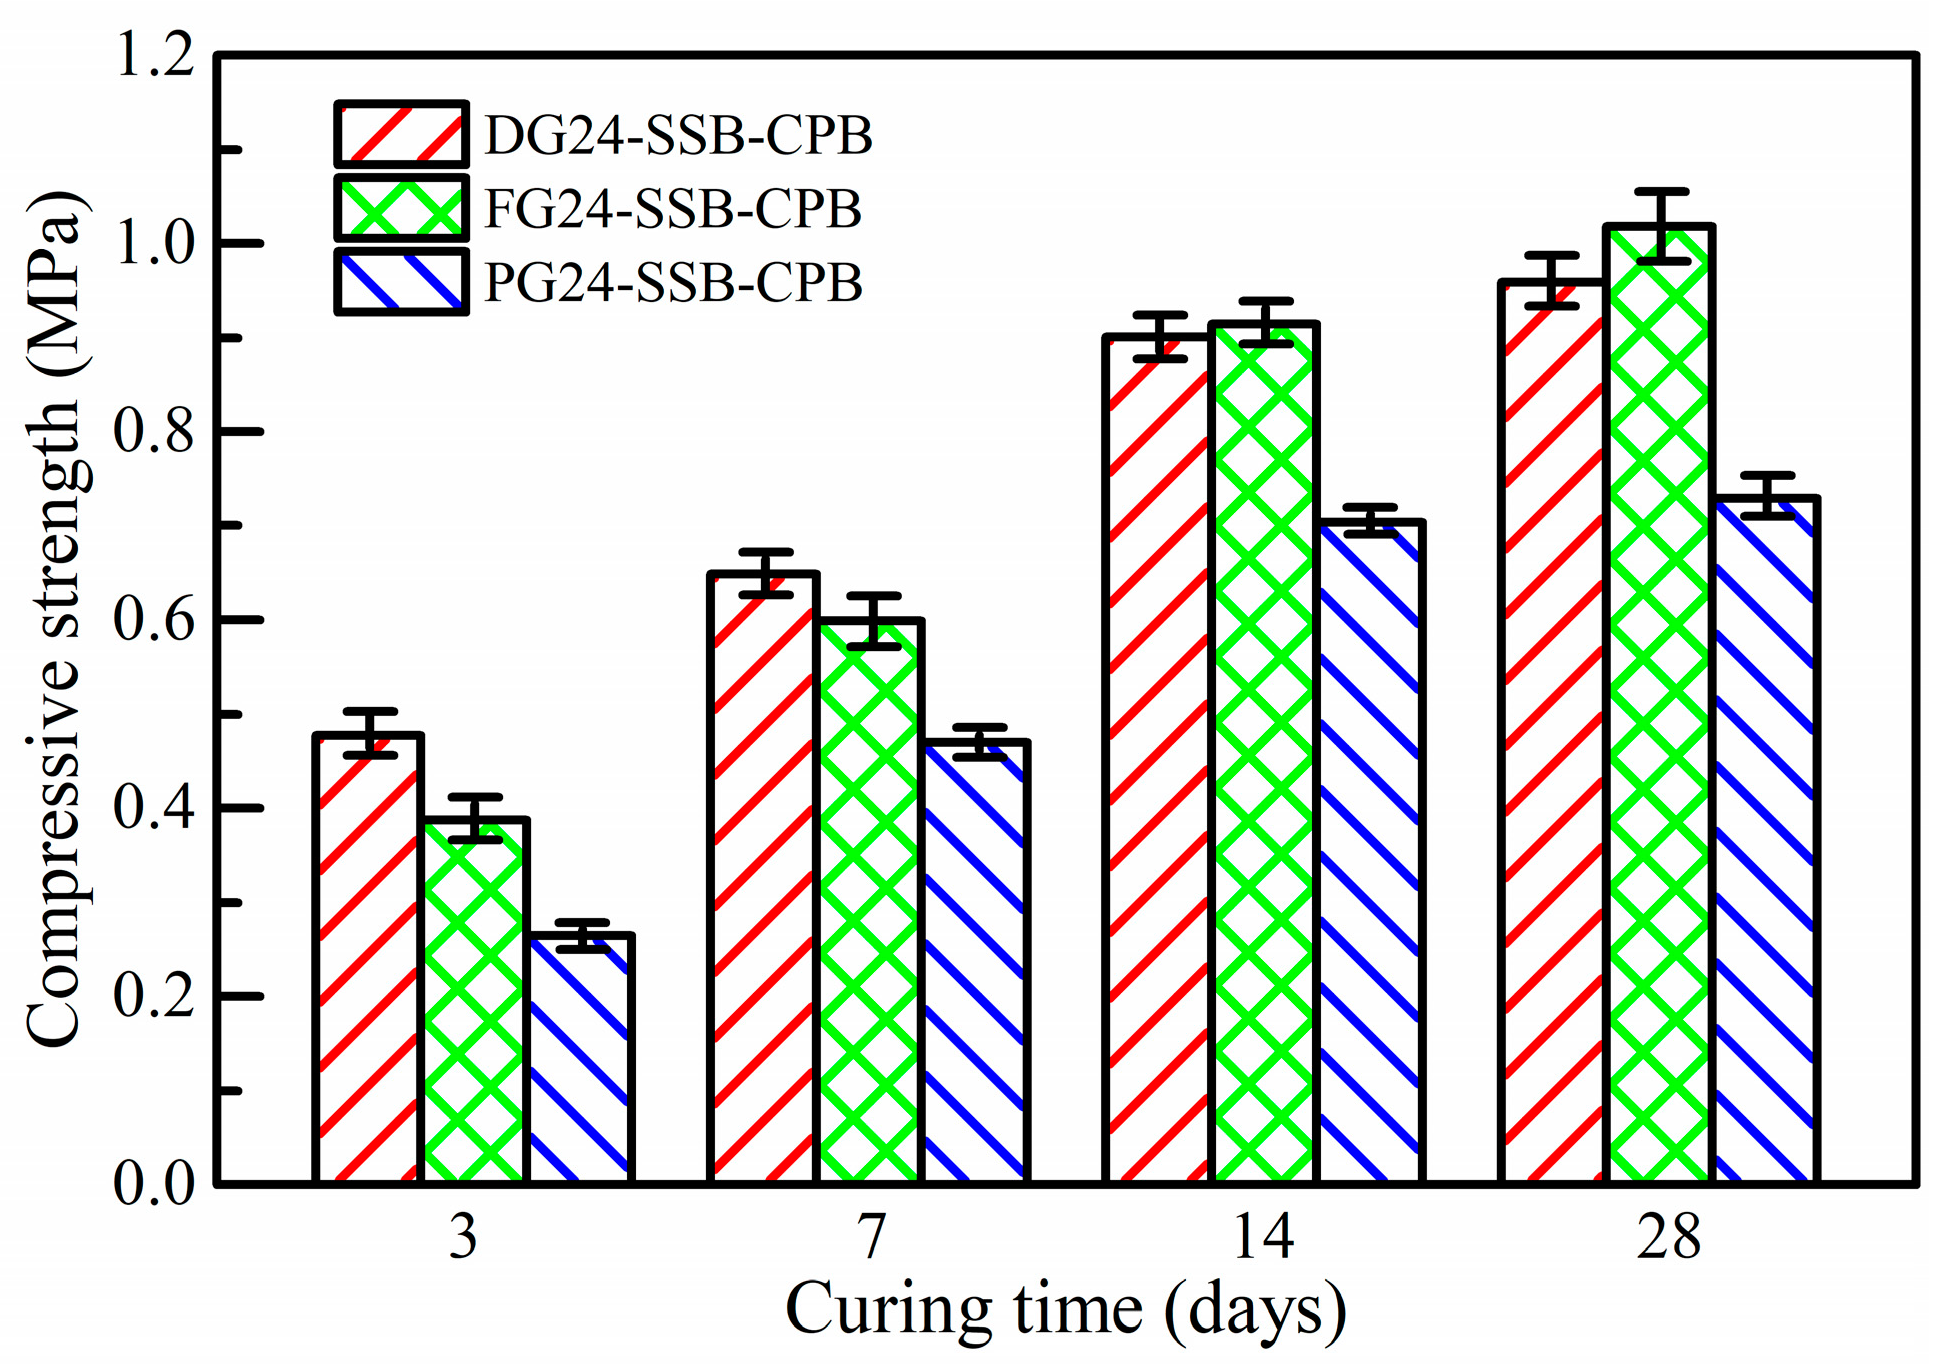
Figure 7 shows the effect of gypsum type on the strength property of SSB-CPB. Compared with other gypsums, the UCS of hardened SSB-CPB is the lowest when gypsum is used as PG, regardless of curing time. Under 3, 7, 14, and 28 days of curing, the strength is 0.26, 0.47, 0.70, and 0.73 MPa, respectively. Similarly, the strength of hardened DG24-SSB-CPB is 0.48, 0.65, 0.90, and 0.96 MPa under all curing times, which is 0.39, 0.60, 0.91, and 1.02 MPa, correspondingly, when FG is used in SSB-CPB. Thus, hardened DG24-SSB-CPB has the highest strength using 3 or 7 days of curing time. When the curing time is increased to 14 or 28 days, the strength of hardened FG24-SSB-CPB becomes the highest, which is slightly higher than DG24-SSB-CPB.
Although the effects of gypsum type on the strength property of SSB-CPB have been described macroscopically, the mechanisms of this are still unrevealed and will be explained next. As shown in Figure 7, the strength change law of SSB-CPB under 3 and 14 days of curing is consistent with that at 7 and 28 days, respectively. Thus, we analyzed hardened SSB-CP(B) samples with different gypsums under 3 and 28 days to explore the mechanisms.
Figure 8 shows the XRD patterns of hardened SSB-CP with different gypsums, where it can be clearly observed that there are some similarities between hardened SSB-CP samples. The three similarities are as follows: (i) The main mineral phases of all samples include CaSO4·2H2O, ettringite, calcium carbonate (CaCO3), dicalcium silicate (C2S), RO phase, and tricalcium silicate (C3S), while the C2S, RO phase, and C3S come from SS, which is documented in previous studies [41,44,59]. (ii) When curing time increases from 3 to 28 days, the intensity of the ettringite peaks increases and the CaSO4·2H2O peaks decrease, regardless of the kind of gypsum. This indicates that the hydration reaction of SSB-CP is continuous during curing time [60]. (iii) When the hardened SSB-CP samples of the three gypsums are cured for 28 days, a relatively obvious “convex hull” appears in the 2q range from 25° to 35°. This can be attributed to the amorphous phase, a kind of hydration product that is a calcium silicate hydrate (C–S–H) gel [43,44]. However, two differences exist in the XRD patterns of the hardened SSB-CP samples. First, under 3 or 28 days of curing, the intensity of the peaks is different between the samples, and the quantity of hydration products cannot be determined, which requires further analysis. Second, comparing Figure 8 and Figure 2, under a 2q range from 10° to 15°, CaSO4·2H2O is found in DG24-SSB-CP and PG24-SSB-CP but not in FG24-SSB-CP. This can be attributed to the solubility of gypsum, as DG is easily dissolved in water to form CaSO4·2H2O, and the main mineral phase of PG is CaSO4·2H2O, while FG is not easily soluble owing to impurities. It participates directly in the hydration reaction as CaSO4·0.5H2O [58].
The XRD pattern reveals similarities and differences in the types of hydration products of the hardened SSB-CP samples. As it is a qualitative study, it cannot reflect the quantitative difference of hydration products under the effects of different gypsum [61]. As such, TG/DTG tests of the hardened SSB-CP samples were conducted, and the results are shown in Figure 9. Three endothermic peaks can be observed in the samples, regardless of gypsum type and curing time, and are located in the ranges of 60–160, 650–750, and 850–910 °C, respectively. The first endothermic peak is due to the dehydration of hydration products, such as ettringite, CaSO4·2H2O, and C–S–H gel [43,44,62]. The second endothermic peak is caused by the decomposition of CaCO3, which can be attributed to the carbonation effect of SS [63,64]. The last endothermic peak is ascribed to the transformation of β-C2S to α-C2S in SS [59,65,66]. The compounds of the SSB-CPB samples acquired by the above endothermic peaks are the same as the mineral phases shown in the XRD patterns (Figure 8), illustrating that the qualitative analysis results are reliable. The total mass loss for SSB-CP at 3 and 28 days of curing is determined to be 12.92% and 23.40%, respectively, when DG is used. Under the same curing time, the total mass loss for SSB-CP is 11.58% and 24.68% using FG, and 10.46% and 21.61% using PG. As PG24-SSB-CP has the fewest hydration products at 3 and 28 days, its strength is the lowest during all curing times. Meanwhile, the total mass loss of DG24-SSB-CP hydration products is 1.34% higher than FG24-SSB-CP at 3 days of curing. Conversely, the former is 1.28% lower than the latter at 28 days of curing. This indicates why the highest strength of hardened SSB-CPB after increasing curing time varies with gypsum type, which is illustrated in Figure 7.
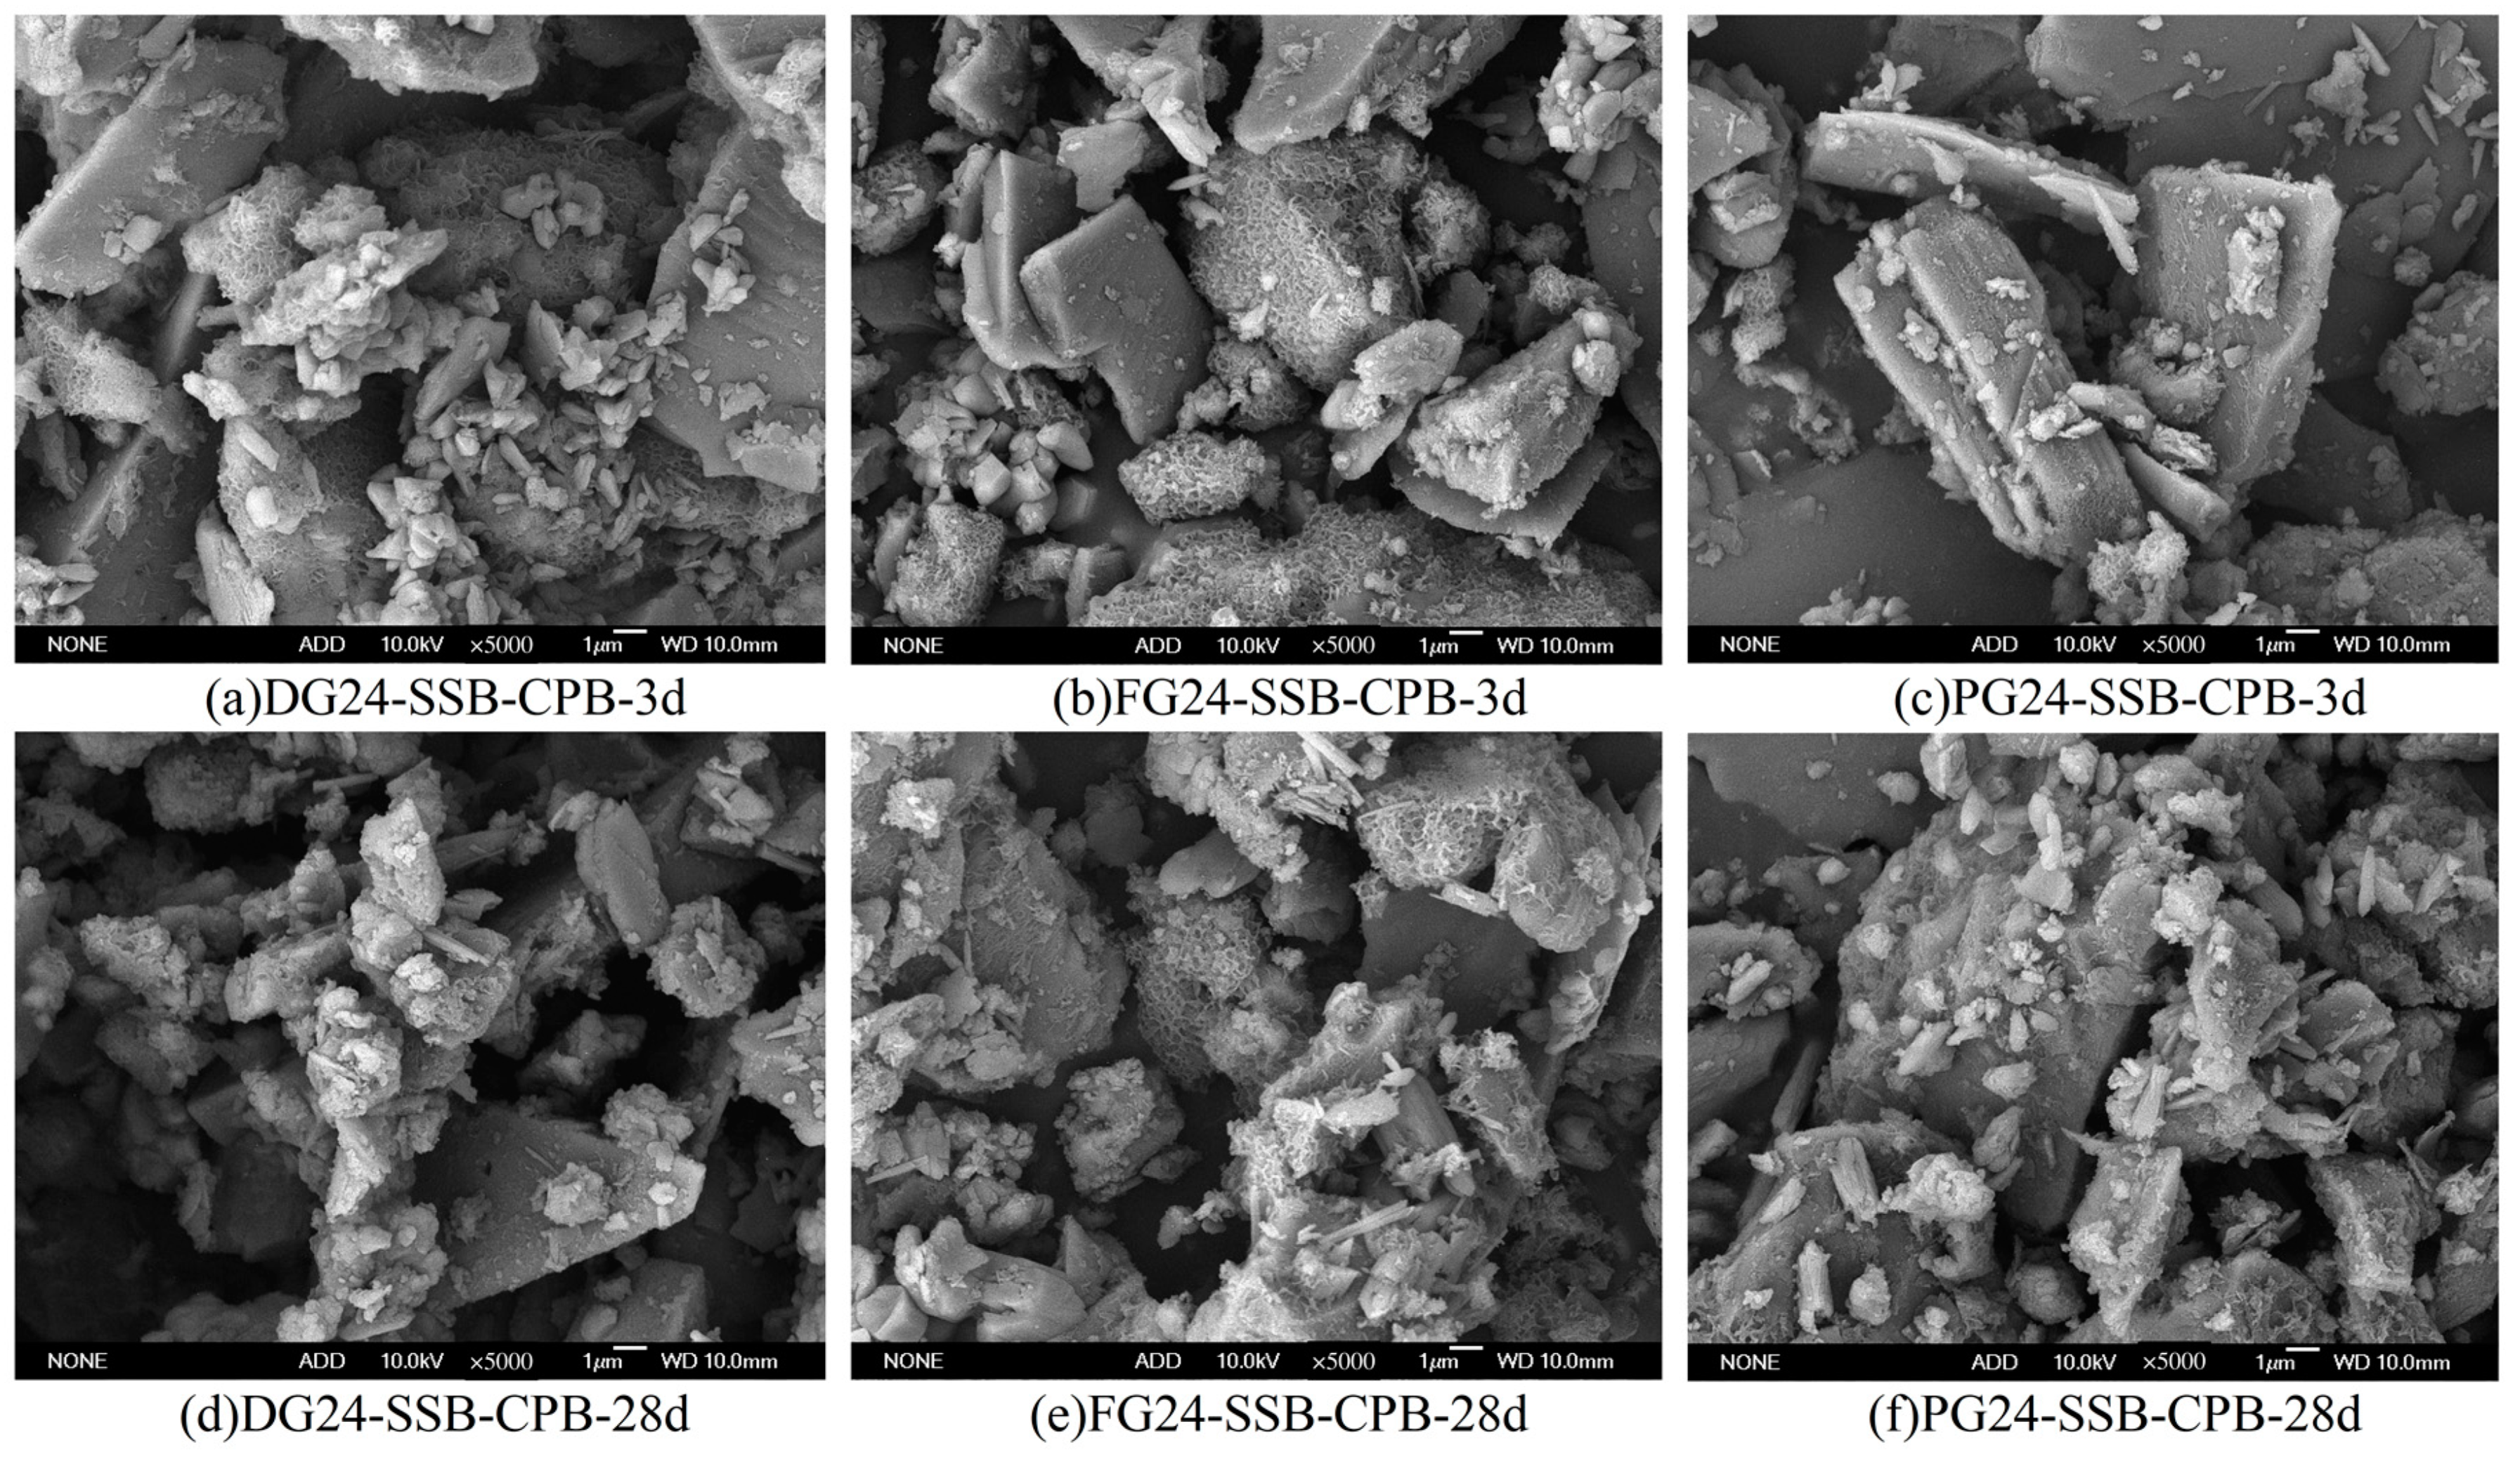
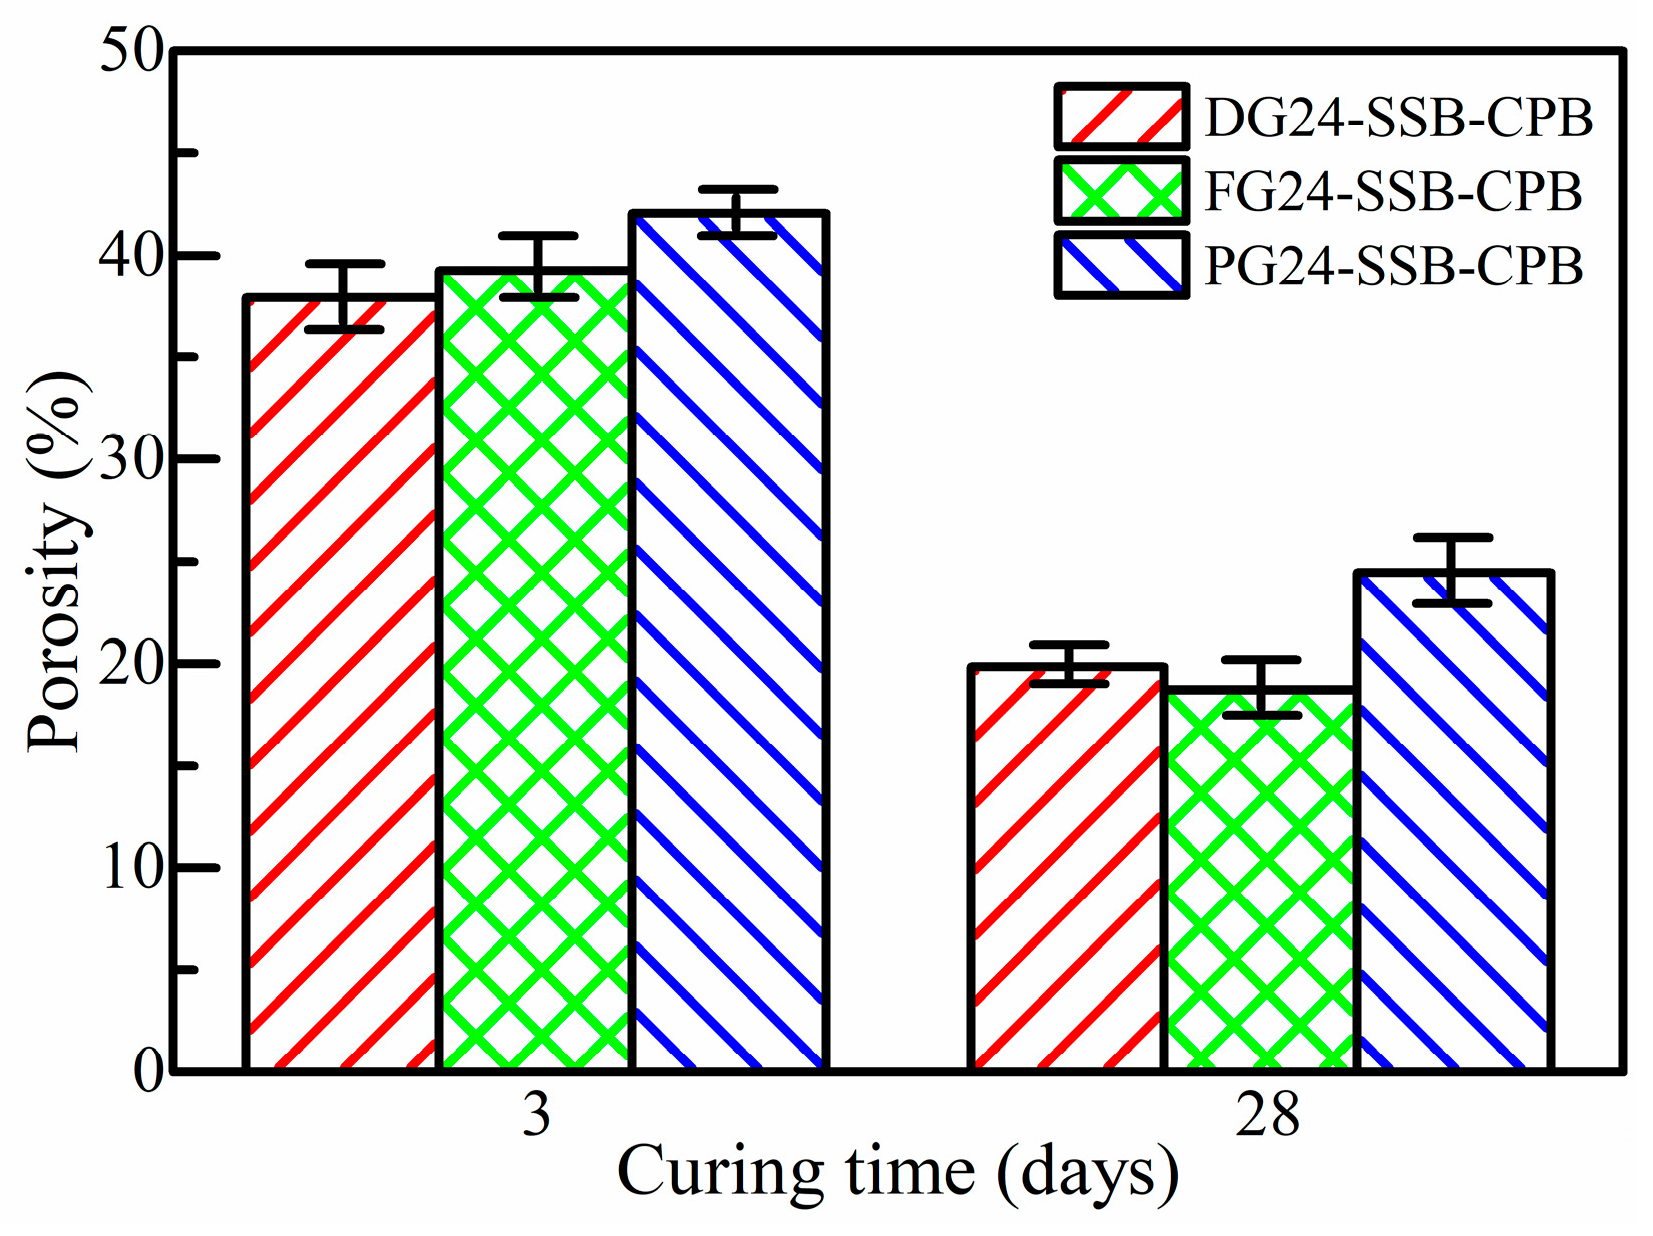
The hydration products of SSB-CP with different gypsums were qualitatively and quantitatively analyzed by XRD and TG/DTG. To confirm the above conclusions, SEM and MIP tests of hardened SSB-CPB samples with different gypsums were conducted to analyze the microscopic morphology and porosity. The results are shown in Figure 10 and Figure 11. The SEM micrographs of hardened SSB-CPB in Figure 10 verify the hydration products of hardened SSB-CP, such as needle-shaped ettringite, amorphous C–S–H gel, and block CaSO4·2H2O, regardless of gypsum type or curing time. It is well documented in previous studies [10,19,20,21,31,44,59,67,68] that fewer voids, denser structure, and more developed hydration products lead to higher-strength CPB. DG24-SSB-CPB has the densest structure and the most developed hydration products, while the structure and hydration products of PG24-SSB-CPB are the worst under 3 days of curing. The porosities of SSB-CPB are 37.90%, 39.26%, and 42.04% when DG, FG, and PG are used, respectively (Figure 11). Consequently, the results of SEM and MIP analyses verify the XRD and TG/DTG findings and support the macroscopical conclusion that SSB-CPB has the highest strength using DG, followed by FG and then PG, under 3 days of curing time. Figure 11 also shows that when the curing time is 28 days, the porosity of SSB-CPB is 19.84%, 18.70%, and 24.44%, using DG, FG, and PG, respectively. Similarly, the results of the SEM micrographs (Figure 10) and porosity confirm the strength property change law of SSB-CPB under the effect of different gypsum types after 28 days of curing. In conclusion, the four microstructural analysis methods confirm the accuracy of the SSB-CPB strength property.
It is worth mentioning that the strength of hardened SSB-CPB increases with curing time, regardless of gypsum type. Using DG24-SSB-CPB as an example, the influence mechanism of the strength increase can be explained by the following two points: (i) As the curing time increases, the calomel diffraction peak increases and the gypsum dihydrate diffraction peak decreases, indicating that the hydration reaction inside the CPB is continuing from Figure 8. (ii) The total mass loss for DG24-SSB-CP increases from 12.92% at 3 days to 23.40% at 28 days, as shown in Figure 9. Thus, the hydration products increase with curing time. (iii) Figure 10 and Figure 11 illustrate that the structure of DG24-SSB-CPB becomes denser, and porosity decreases from 37.90% to 19.84%. This is consistent with the relationship between UCS and curing time in past studies [10,12,50].
Section 3.1 and Section 3.2 indicate that the rheological properties of SSB-CPB with different gypsums are not significantly different, but the strength property varies depending on the gypsum type. PG24-SSB-CPB has the lowest strength for all time, but DG24-SSB-CPB and FG24-SSB-CPB have the highest strength at 3, 7, 14, and 28 days, respectively. The following three aspects are considered: (i) The strength of FG24-SSB-CPB is slightly higher than DG24-SSB-CPB when the curing time is 14 or 28 days. (ii) The effect of SS content on the rheological and strength properties of SSB-CPB was researched in [43], in which materials including SS, slag, and DG were the same as in this study. (iii) Compared with FG, the cost of DG is cheaper, and its total storage is much higher in China [33]. In the case of a nickel mine in Gansu, about 500,000 tons of binders are required for the mine per year. In other words, using SSB as a binder would require the consumption of 120,000 tons of DG per year, and the production capacity of DG in China is 115.2 million tons. It is capable of satisfying the underground filling of about 1000 similar mines. Therefore, the reserves of DG are enough to carry out backfilling operations in mines. At the same time, if industrial solid waste such as DG, SS, and slag is consumed, it will also be beneficial to reduce the CNY thousands in environmental taxes for companies. In addition, the cost of SSB can vary geographically, but in China, it is generally CNY 100/ton cheaper than OPC [44]. Therefore, it can be inferred that if more DG can be consumed by backfill, it will be of great significance in environmental pollution and economic development. As a result, DG is selected rather than FG or PG to analyze the effect of gypsum dosage on the rheological and strength properties of SSB-CPB.

3.3. Effect of Gypsum Dosage on Rheological Properties of SSB-CPB

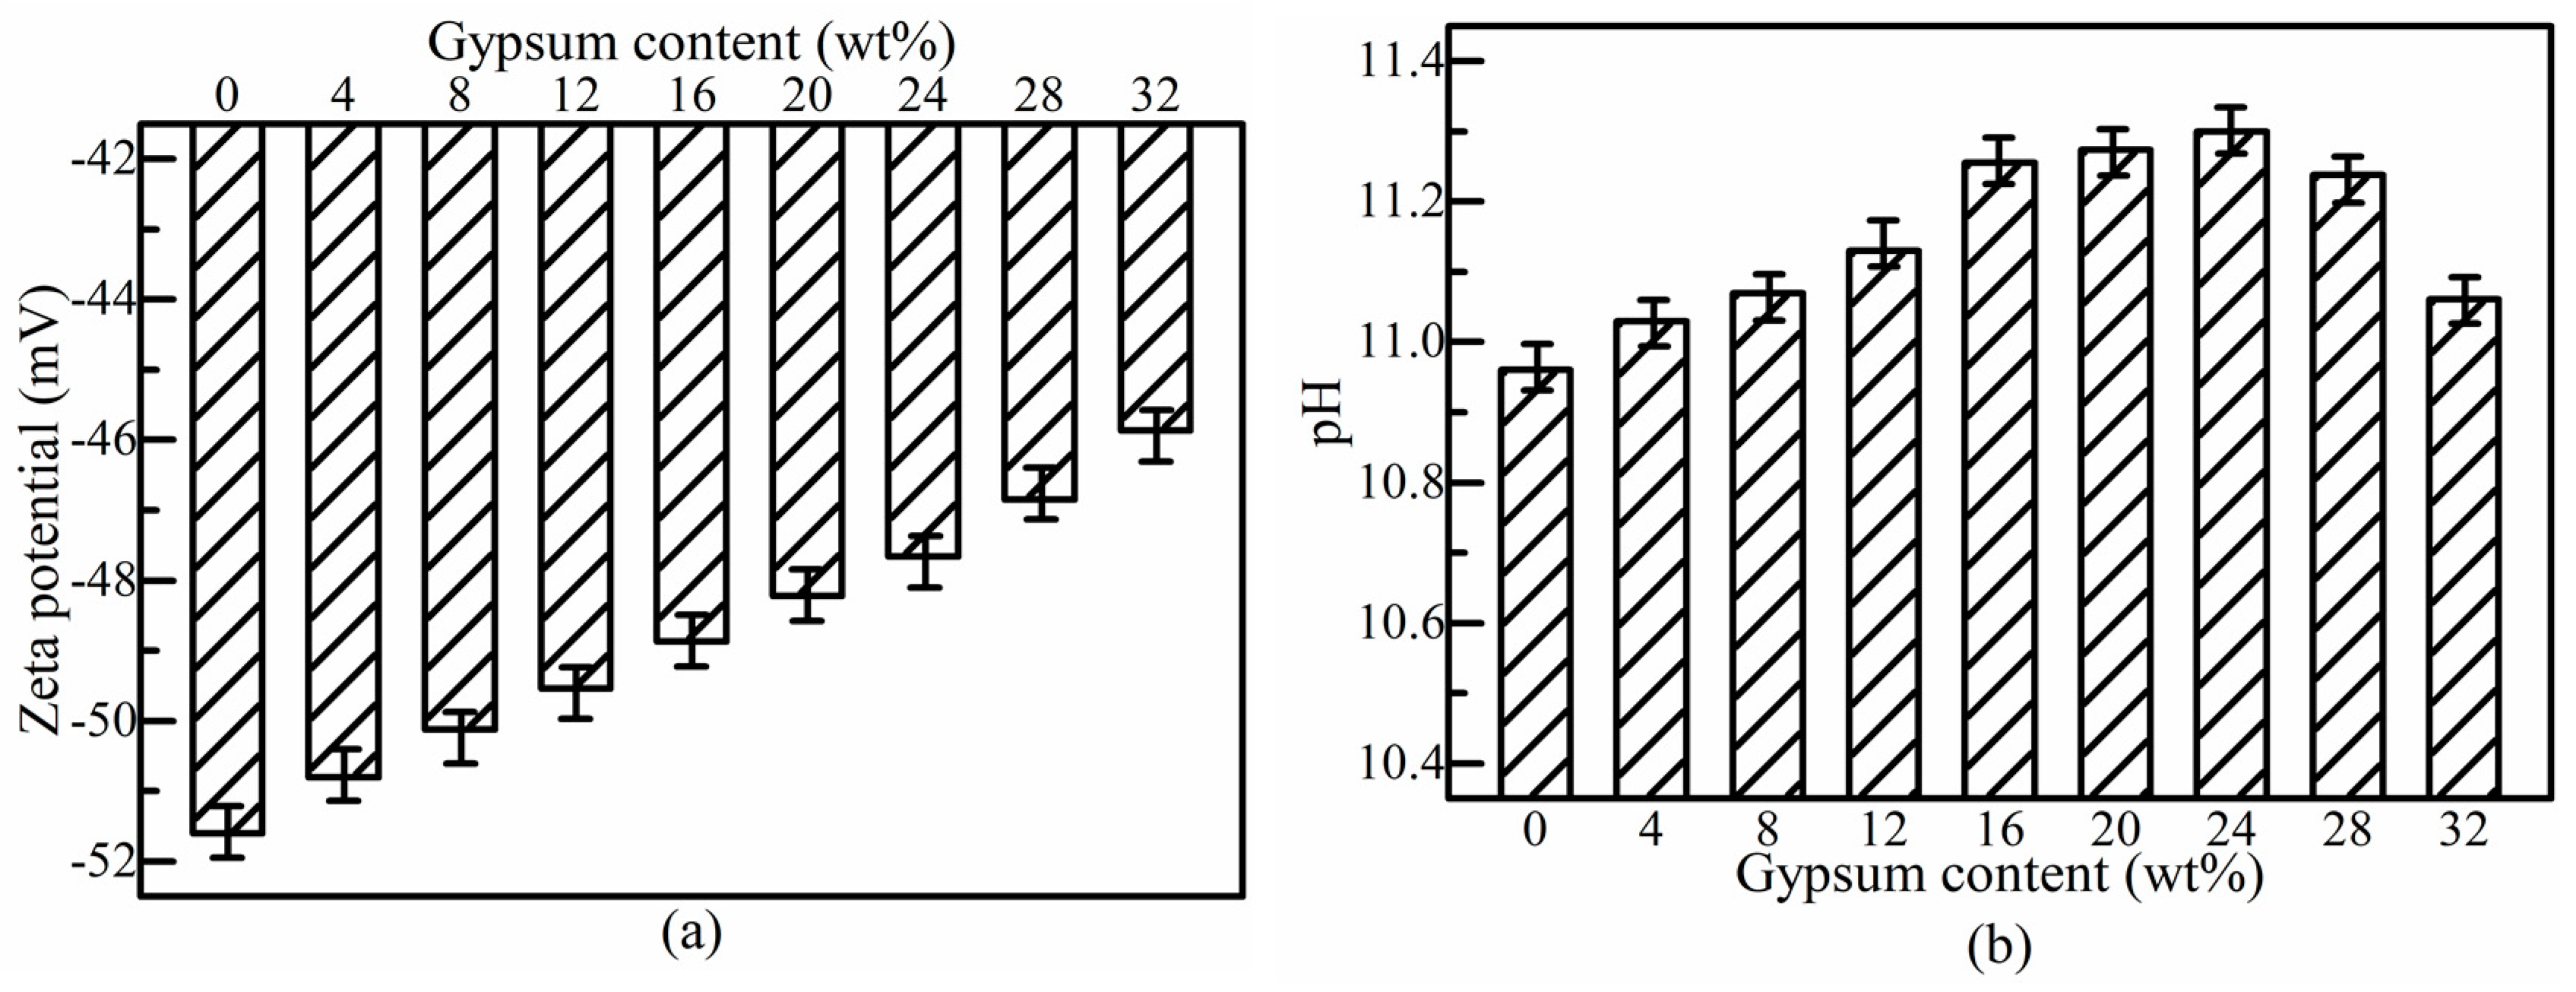
To illustrate the influence of gypsum dosage on the rheological properties of fresh SSB-CPB, both yield stress and viscosity are plotted against gypsum content (0%–32%) in Figure 12. When DG dosage increases from 0% to 32%, the yield stress increases from 17.61 to 19.02 Pa, and the viscosity increases from 0.740 to 0.774 Pa·s. Therefore, both yield stress and viscosity rise with the increase of gypsum content. Figure 13 shows the results of zeta potential and pH value tests of the fresh SSB-CPB to reveal the influence mechanism of the abovementioned conclusion.
Figure 13a shows that a rise in DG dosage yields a lower negative zeta potential of SSB-CPB, and zeta potential varies from −51.6 to −45.9 mV as gypsum content increases from 0% to 32%. Similar to in Section 3.1, a decrease in zeta potential causes more attraction between particles and requires extra force to destroy flocs, thereby resulting in higher yield stress. This conclusion is consistent with previous research on red-mud-slag-based grouting materials under the effects of gypsum content [60].
Moreover, drawing on Section 3.1 and previous studies [32,43,56,57,58], two findings illustrate the influence mechanism of viscosity for SSB-CPB with different DG dosages: (i) The average particle sizes of DG and slag are 47.5 and 23.0 µm, respectively (see Figure 1). It is obvious that with an increase in gypsum content, the internal solid particles in SSB-CPB become larger, and the friction between particles is improved, which results in an increase in the viscosity of SSB-CPB. (ii) The pH of SSB-CPB is 10.96, 11.30, and 11.06 when gypsum content is 0%, 24%, and 32%, respectively. Thus, the pH first increases and then decreases along with the rise of gypsum content, and the highest pH corresponds to DG24-SSB-CPB (Figure 13b). As a result, it can be speculated that the changing law of hydration reaction and viscosity, which increases first and then decreases, should be similar to that of the pH value discussed in Section 3.1. However, the viscosity keeps increasing with gypsum content in Figure 12, which suggests that both (i) and (ii) cause an increase in viscosity when DG dosage is below 24%. Although there is a negative effect because of (ii) when the DG dosage exceeds 24%, the viscosity increase caused by (i) is greater than the negative effect, which demonstrates why viscosity still increases. In conclusion, similarly to yield stress, the viscosity of SSB-CPB increases with the increase of DG dosage.

3.4. Effect of Gypsum Dosage on Strength Property of SSB-CPB

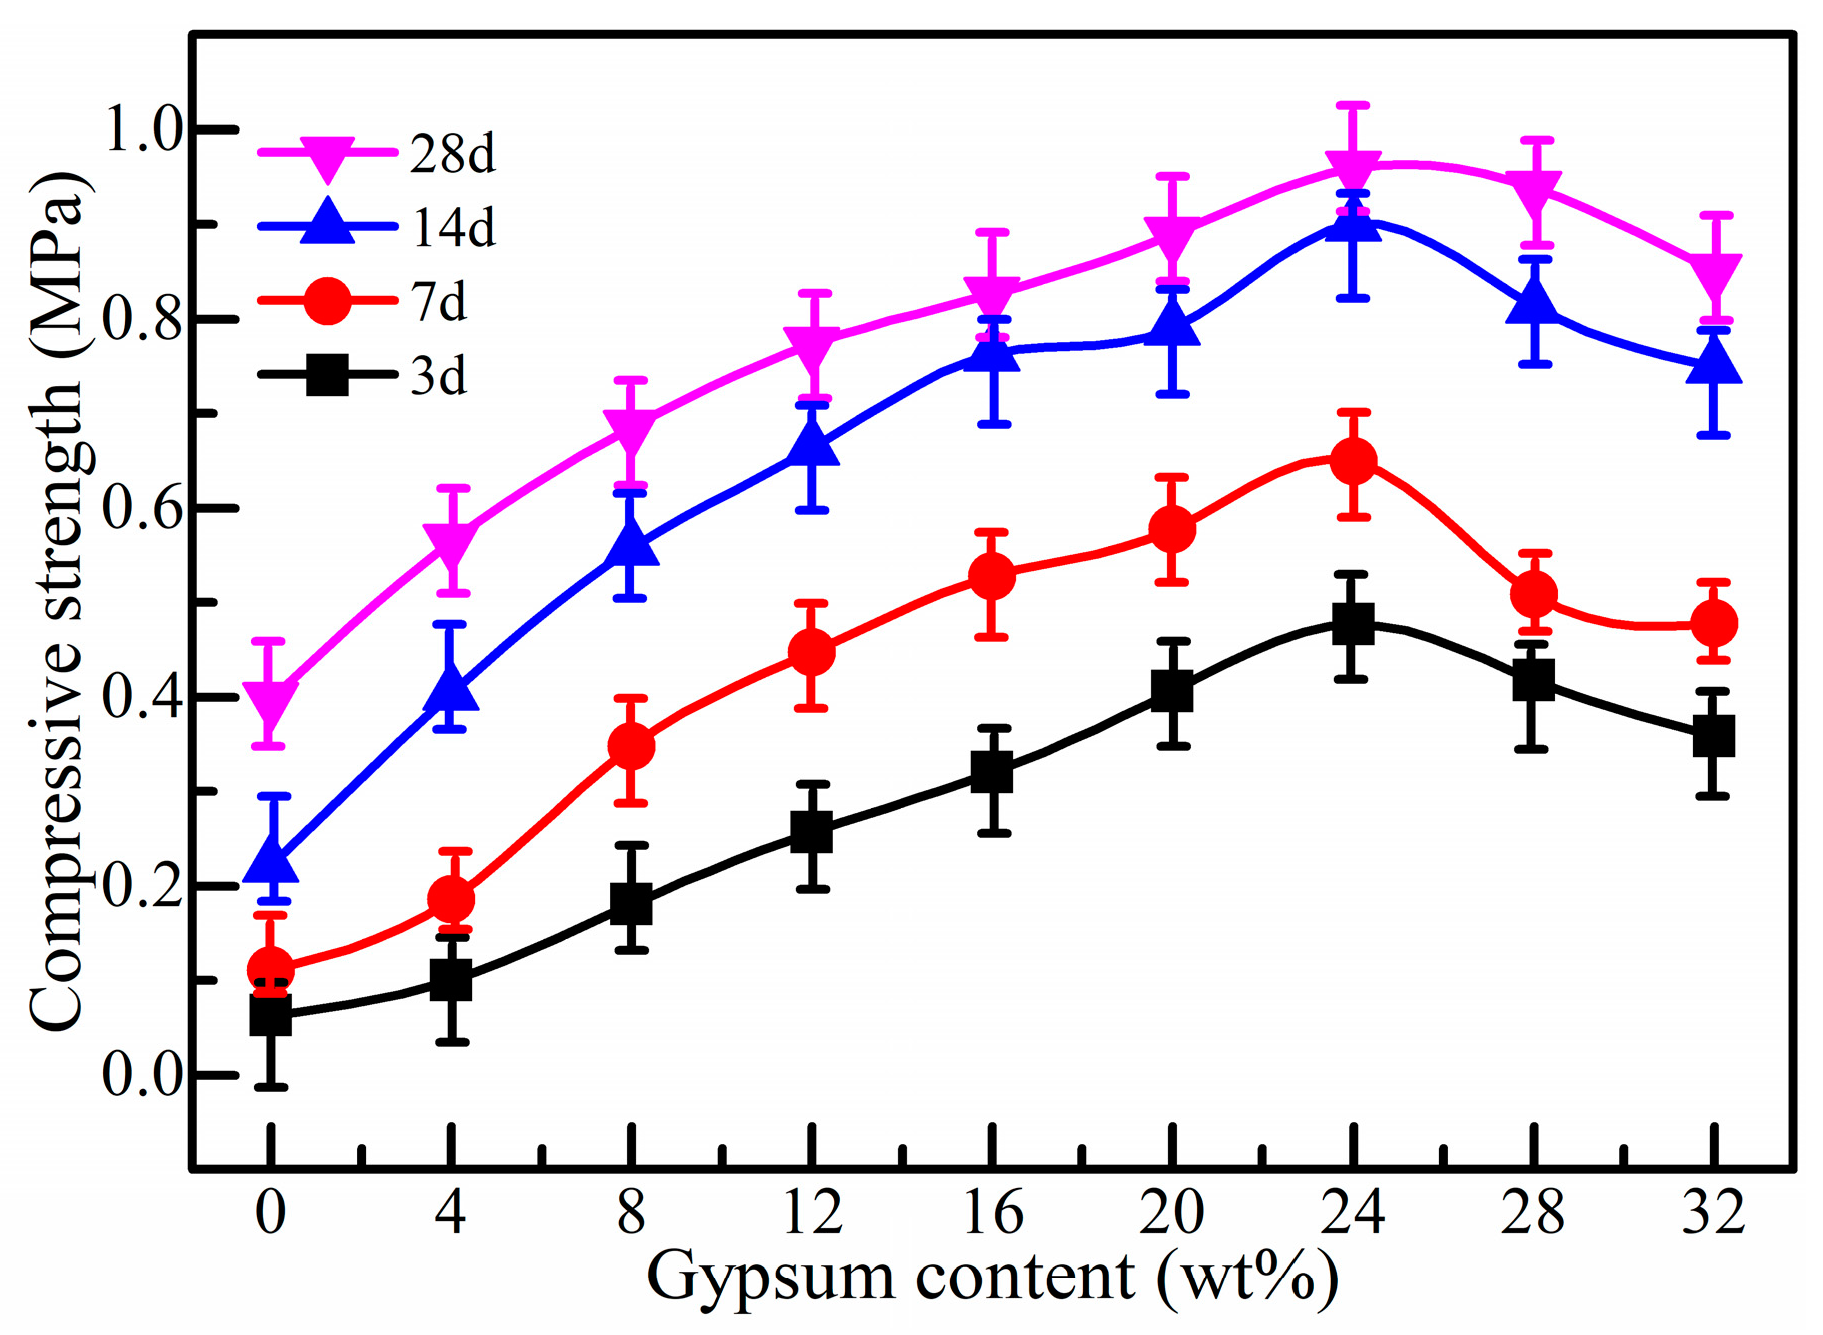
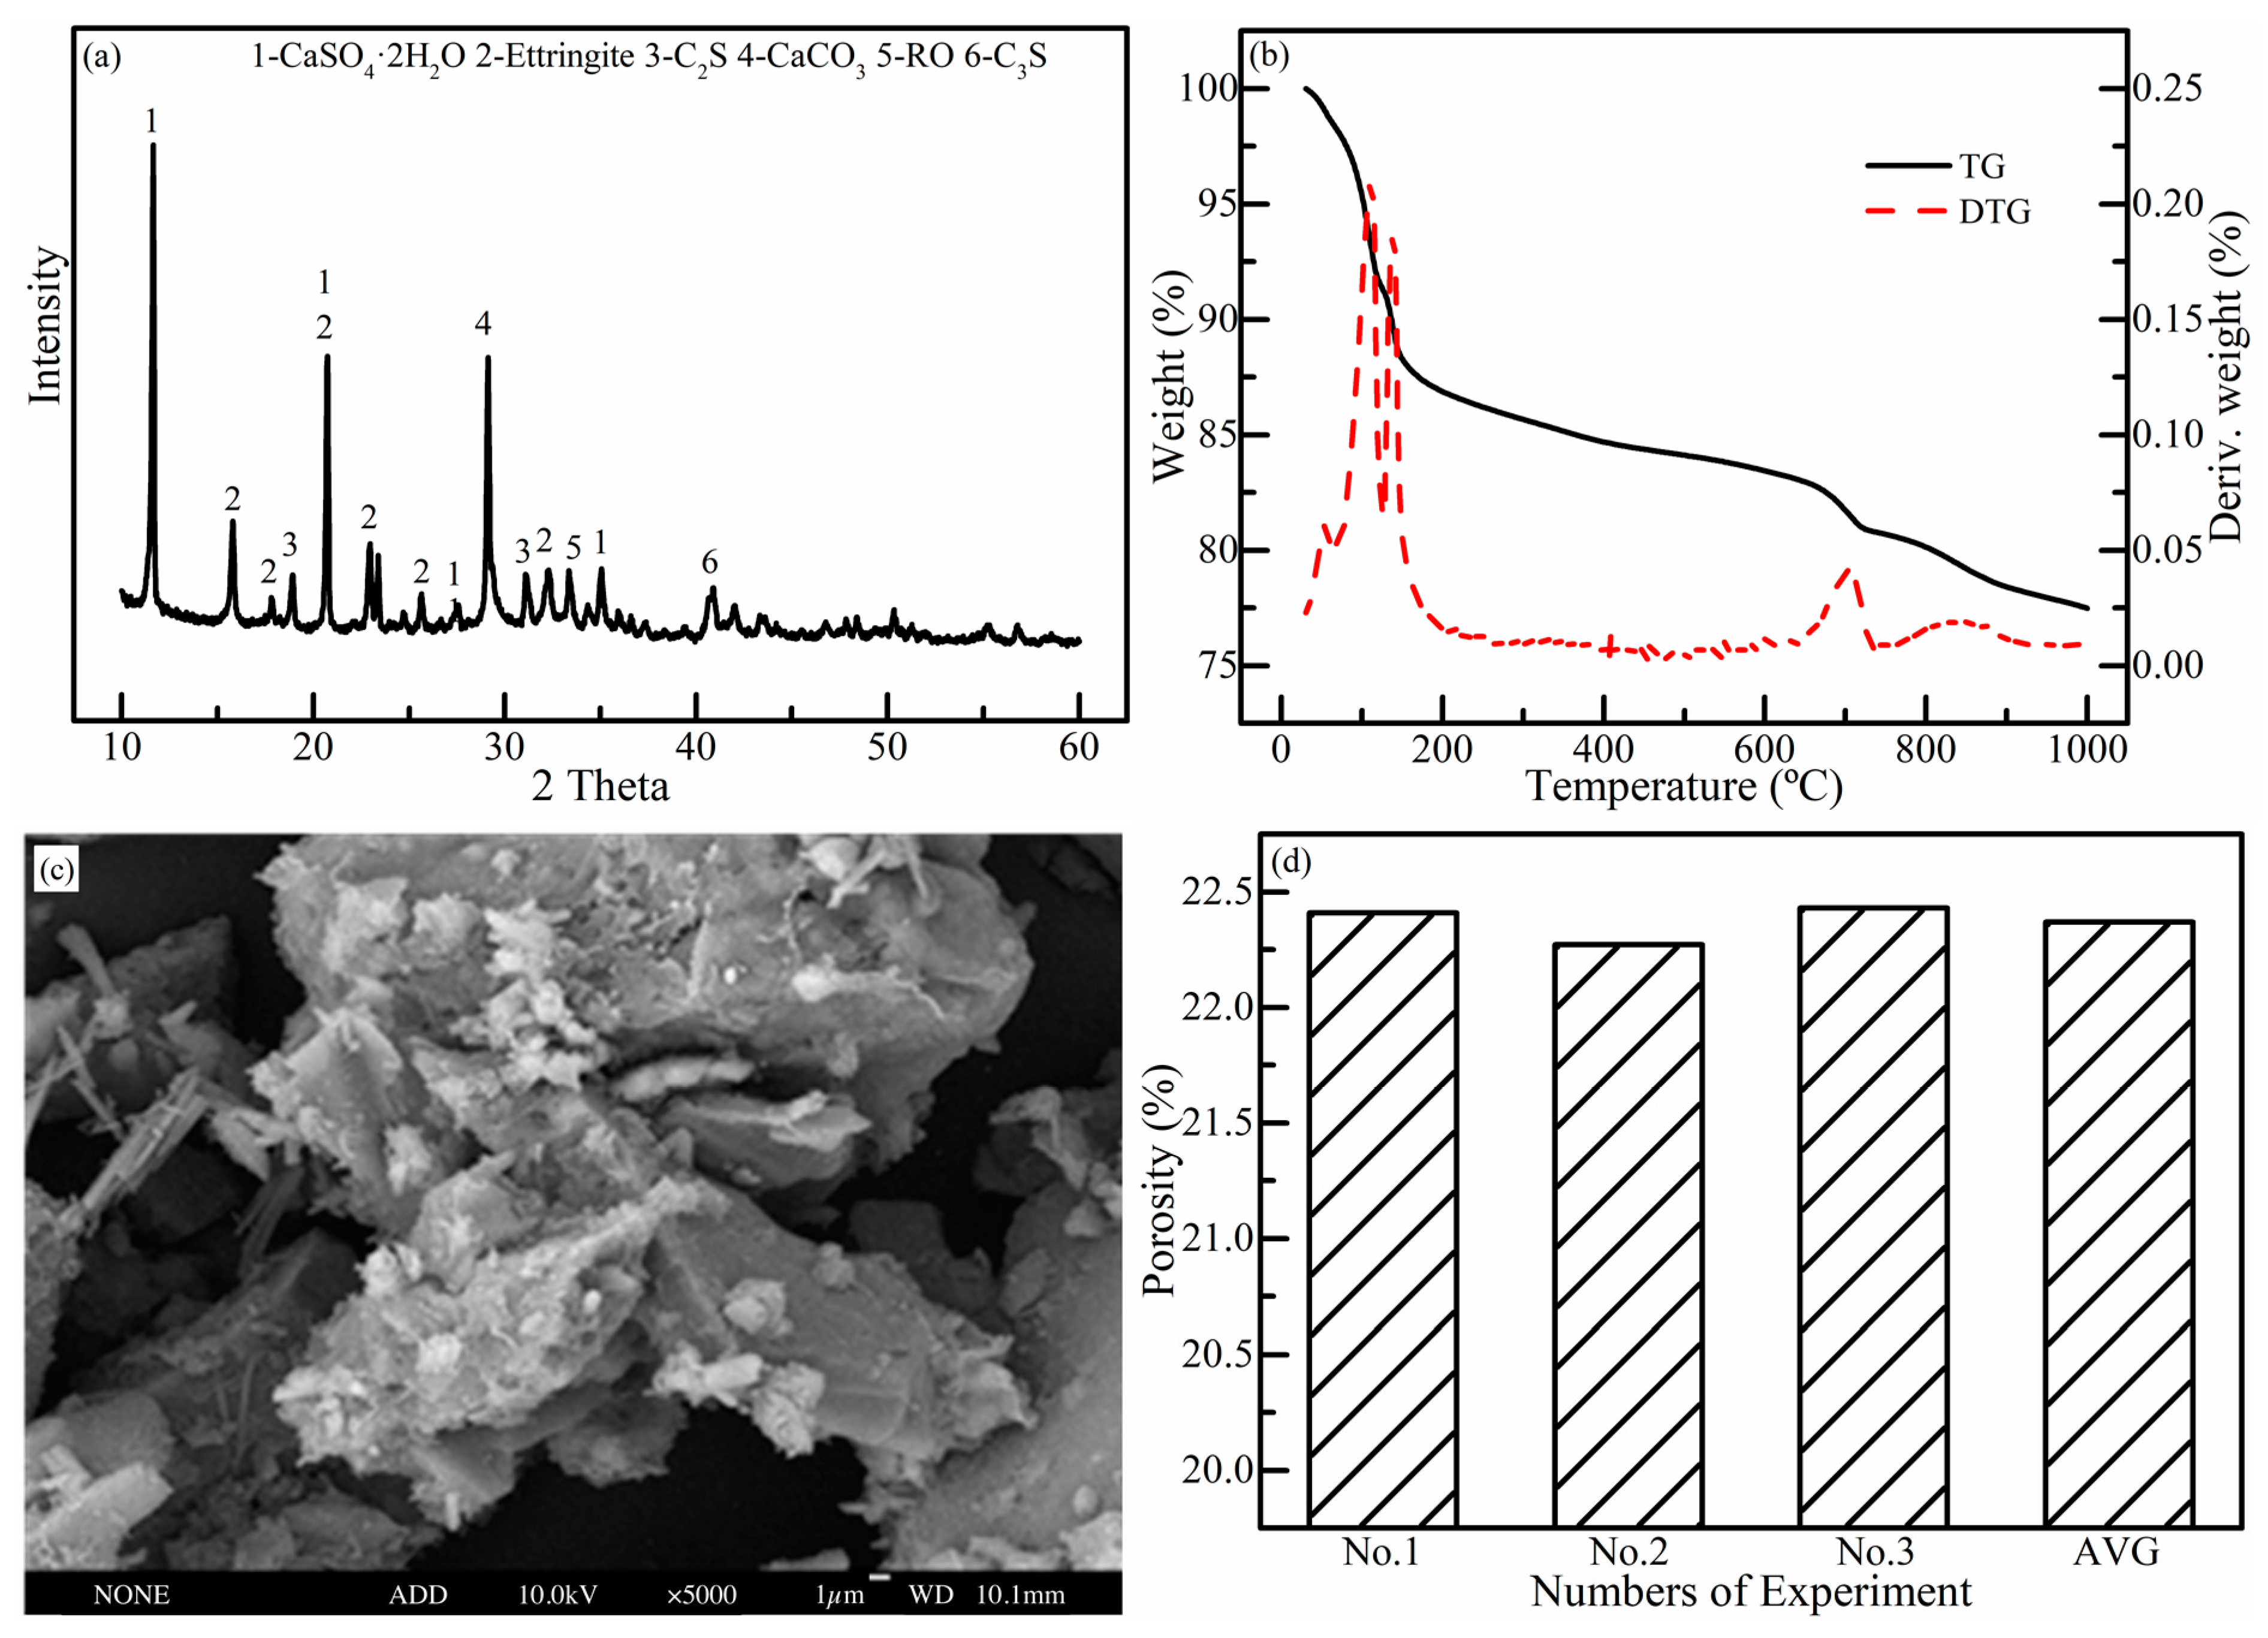
The effect of gypsum dosage on the strength development of hardened SSB-CPB samples with varying curing time is illustrated in Figure 14. As shown, the strength of SSB-CPB is 0.40, 0.96, and 0.85 MPa when gypsum content is 0%, 24%, and 32%, respectively, at 28 days of curing. The strength of SSB-CPB first increases and then decreases with gypsum content, regardless of curing time, and DG24-SSB-CPB of any curing time has the highest strength. Similar observations have been obtained in studies on the effect of gypsum on the strength performance of red mud-slag CPB [58]. The strength influence mechanism for hardened SSB-CPB with curing time was explained in Section 3.2, and the influence law of DG dosage on strength for SSB-CPB between different curing times is basically the same. Therefore, hardened SSB-CP(B) samples at 28 days of curing with 24% and 32% gypsum content were selected for comparative analysis by microstructural tests to deeply explore the internal mechanism causing changes in the strength of SSB-CPB with different gypsum contents. The results of microstructural tests for DG32-SSB-CP(B) are presented in Figure 15.
Figure 15a shows that the main mineral phase of DG32-SSB-CP is the same as that of DG24-SSB-CP (Figure 8a), but there is a slight difference in the intensity of the peaks between the two samples. The total mass loss of DG32-SSB-CP is 22.51% (Figure 15b), while that of DG24-SSB-CP is 23.40% (Figure 9a), and the former is 0.89% lower than the latter. Therefore, the DG24-SSB-CP has more hydration products, validating that the strength of SSB-CPB decreases when gypsum content increases from 24% to 32% (Figure 14). At the same time, compared with DG24-SSB-CP, the drop of hydration products for DG32-SSB-CP is also supported by the change of pH discussed in Section 3.3. In addition, the XRD and TG/DTG results are validated by the SEM and MIP test results of SSB-CPB. For example, comparing Figure 8a and Figure 15a, when the DG dosage is increased from 24% to 32%, the gypsum dihydrate diffraction peak is higher, while the calcium alumina diffraction peak becomes lower, produces less hydration products, and reduces the strength of the CPB, which is same as the SEM test results. There are more voids and fewer hydration products in the SEM micrograph of DG32-SSB-CPB than DG24-SSB-CPB (see Figure 10d and Figure 15c), and the porosity decreases from 22.37% to 19.84% (see Figure 11 and Figure 15d), which proves the authenticity of the strength, XRD, and TG/DTG tests. Similarly, it is not difficult to conclude that fewer voids and more hydration products lead to higher strength SSB-CPB when DG dosage is increased from 0% to 24%, thus explaining the mechanism of strength changes in SSB-CPB with different gypsum content.

4. Summary and Conclusions

The research results of the effects of gypsum type and dosage on the rheological and strength properties of SSB-CPB were presented in this work. The yield stress and viscosity of fresh SSB-CPB and the UCS of hardened SSB-CPB with different curing times were tested. Additional tests, such as the zeta potential, pH, and microstructural analysis (XRD, TG/DTG, SEM, and MIP), were conducted to provide insight into the mechanisms of the rheological and strength properties of SSB-CPB. The following conclusions were obtained.
The order of yield stress and viscosity of fresh SSB-CPB using different gypsums were FG, PG, and DG, from small to large. The change of yield stress could be attributed to the negative zeta potential of SSB-CPB, which was −47.7, −56.4, and −52.3 mV for DG, FG, and PG, respectively, which altered the attraction and weak flocs between particles. The average particle size was 47.5, 40.9, and 110.6 µm using DG, FG, and PG gypsum, respectively, and the pH of the corresponding SSB-CPB was 11.30, 10.95, and 11.12, which affected the hydration reaction environment. The increase of friction between particles, including internal solid particles and hydration products, resulted in an SSB-CPB viscosity that was lowest using FG, followed by PG, and the highest with DG.
PG24-SSB-CPB had the lowest strength for all curing times, DG24-SSB-CPB had the highest strength under 3 and 7 days of curing, while FG24-SSB-CPB had the highest strength under 14 and 28 days of curing. This was largely attributed to the following factors: (i) Although the main mineral phases of SSB-CP were qualitatively similar by XRD, regardless of gypsum type or curing time, there were quantitative differences in the hydration products using TG/DTG. The total mass loss of SSB-CP at 3 days of curing using DG, FG, or PG gypsum was 12.92%, 11.58%, and 10.46%, respectively, increasing to 23.40%, 24.68%, and 21.61% under 28 days of curing. (ii) The porosity of SSB-CPB at 3 days of curing using DG, FG, or PG gypsum was 37.90%, 39.26%, and 42.04%, respectively, decreasing to 19.84%, 18.70%, and 24.44% at 28 days of curing, which was the same as our intuitive analysis results using SEM micrographs. In short, compared with PG, the use of DG in SSB is better, and compared with FG, the total storage of DG is much higher. As a result, the recommended gypsum type in SSB is DG for backfill.
With the increase of gypsum dosage from 0% to 32%, the yield stress and viscosity of fresh SSB-CPB grew from 17.61 to 19.02 Pa and 0.740 to 0.774 Pa·s, respectively. The influence mechanism of yield stress was the decrease in zeta potential and viscosity, whose combined effect was the variation of the internal solid particles and the pH of SSB-CPB.
Regardless of curing times, the strength of SSB-CPB always increased first and then decreased with the increase of gypsum content. The SSB-CPB had the highest strength when the DG dosage was 24% due to fewer voids and more hydration products under an increase of DG dosage from 0% to 24%. The opposite law appeared as the DG dosage was further increased from 24% to 32%.

Author Contributions

F.W.: Conceptualization, methodology, validation, writing (original draft), writing (review and editing), visualization. B.X.: Validation, supervision, project administration, funding acquisition, writing (review and editing). F.Y.: Investigation, data curation, software, formal analysis, visualization. All authors have read and agreed to the published version of the manuscript.

Funding

This research and the APA were funded by the China Postdoctoral Science Foundation (CN), Grant number 2021M690362, and the S&T Program of Hebei (CN), Grant number 20374103D.

Data Availability Statement

Data is contained within the article.

Acknowledgments

The authors are grateful for the support from the China Postdoctoral Science Foundation (CN) and the China Scholarship Council under Grant CSC number 202106460019. Moreover, we thank Fujian Sanming Iron and Steel (Group) Co., Ltd., for providing the materials used in this research.

Conflicts of Interest

The authors declare no conflict of interest. The funders had no role in the design of the study; in the collection, analyses, or interpretation of data; in the writing of the manuscript, or in the decision to publish the results.

References

  1. Roshani, A.; Fall, M. Flow ability of cemented pastefill material that contains nano-silica particles. Powder Technol. 2020, 373, 289–300. [Google Scholar] [CrossRef]
  2. Qiu, J.; Guo, Z.; Yang, L.; Jiang, H.; Zhao, Y. Effects of packing density and water film thickness on the fluidity behaviour of cemented paste backfill. Powder Technol. 2020, 359, 27–35. [Google Scholar] [CrossRef]
  3. Wang, Y.; Fall, M.; Wu, A. Initial temperature-dependence of strength development and self-desiccation in cemented paste backfill that contains sodium silicate. Cem. Concr. Compos. 2016, 67, 101–110. [Google Scholar] [CrossRef]
  4. Cui, L.; Fall, M. An evolutive elasto-plastic model for cemented paste backfill. Comput. Geotech. 2016, 71, 19–29. [Google Scholar] [CrossRef]
  5. Ghirian, A.; Fall, M. Coupled thermo-hydro-mechanical–chemical behaviour of cemented paste backfill in column experiments. Part I: Physical, hydraulic and thermal processes and characteristics. Eng. Geol. 2013, 164, 195–207. [Google Scholar] [CrossRef]
  6. Cui, L.; Fall, M. Mechanical and thermal properties of cemented tailings materials at early ages: Influence of initial temperature, curing stress and drainage conditions. Constr. Build. Mater. 2016, 125, 553–563. [Google Scholar] [CrossRef]
  7. Yang, X.; Xiaobing, Y.; Gao, Q.; He, J. Determining the pressure drop of cemented Gobi sand and tailings paste backfill in a pipe flow. Constr. Build. Mater. 2020, 255, 119371. [Google Scholar] [CrossRef]
  8. Tikou, B.; Mostafa, B. Design and Application of Underground Mine Paste Backfill Technology. Geotech. Geol. Eng. 2008, 26, 147–174. [Google Scholar] [CrossRef]
  9. Yilmaz, E.; Benzaazoua, M.; Belem, T.; Bussière, B. Effect of curing under pressure on compressive strength development of cemented paste backfill. Miner. Eng. 2009, 22, 772–785. [Google Scholar] [CrossRef]
  10. Yang, X.; Xiao, B.; Gao, Q. Validating the Use of Slag Binder with 91 Percent Blast Furnace Slag for Mine Backfilling. Adv. Mater. Sci. Eng. 2020, 2020, 2525831. [Google Scholar] [CrossRef]
  11. Fall, M.; Célestin, J.; Pokharel, M.; Touré, M. A contribution to understanding the effects of curing temperature on the mechanical properties of mine cemented tailings backfill. Eng. Geol. 2010, 114, 397–413. [Google Scholar] [CrossRef]
  12. Behera, S.; Ghosh, C.; Mishra, D.; Singh, P.; Mishra, K.; Buragohain, J.; Mandal, P.K. Strength development and microstructural investigation of lead-zinc mill tailings based paste backfill with fly ash as alternative binder. Cem. Concr. Compos. 2020, 109, 103553. [Google Scholar] [CrossRef]
  13. Wu, A.; Wang, Y.; Wang, H.; Yin, S.; Miao, X. Coupled effects of cement type and water quality on the properties of cemented paste backfill. Int. J. Miner. Process. 2015, 143, 65–71. [Google Scholar] [CrossRef]
  14. Shafigh, P.; Nomeli, M.A.; Alengaram, U.J.; Bin Mahmud, H.; Jumaat, M.Z. Engineering properties of lightweight aggregate concrete containing limestone powder and high volume fly ash. J. Clean. Prod. 2016, 135, 148–157. [Google Scholar] [CrossRef]
  15. Xu, W.; Li, Q.; Haruna, S. The Effect of Calcium Formate, Sodium Sulfate, and Cement Clinker on Engineering Properties of Fly Ash-Based Cemented Tailings Backfill. Adv. Mater. Sci. Eng. 2019, 2019, 5370360. [Google Scholar] [CrossRef] [Green Version]
  16. Zhao, Y.; Taheri, A.; Karakus, M.; Chen, Z.; Deng, A. Effects of water content, water type and temperature on the rheological behaviour of slag-cement and fly ash-cement paste backfill. Int. J. Min. Sci. Technol. 2020, 30, 271–278. [Google Scholar] [CrossRef]
  17. Yilmaz, E.; Belem, T.; Bussière, B.; Mbonimpa, M.; Benzaazoua, M. Curing time effect on consolidation behaviour of cemented paste backfill containing different cement types and contents. Constr. Build. Mater. 2015, 75, 99–111. [Google Scholar] [CrossRef]
  18. Sun, X.; Zhao, Y.; Tian, Y.; Wu, P.; Guo, Z.; Qiu, J.; Xing, J.; Xiaowei, G. Modification of high-volume fly ash cement with metakaolin for its utilization in cemented paste backfill: The effects of metakaolin content and particle size. Powder Technol. 2021, 393, 539–549. [Google Scholar] [CrossRef]
  19. Cihangir, F.; Ercikdi, B.; Kesimal, A.; Turan, A.; Deveci, H. Utilisation of alkali-activated blast furnace slag in paste backfill of high-sulphide mill tailings: Effect of binder type and dosage. Miner. Eng. 2012, 30, 33–43. [Google Scholar] [CrossRef]
  20. Jiang, H.; Qi, Z.; Yilmaz, E.; Han, J.; Qiu, J.; Dong, C. Effectiveness of alkali-activated slag as alternative binder on workability and early age compressive strength of cemented paste backfills. Constr. Build. Mater. 2019, 218, 689–700. [Google Scholar] [CrossRef]
  21. Xue, G.; Yilmaz, E.; Song, W.; Cao, S. Compressive Strength Characteristics of Cemented Tailings Backfill with Alkali-Activated Slag. Appl. Sci. 2018, 8, 1537. [Google Scholar] [CrossRef] [Green Version]
  22. Li, L.; Gao, Q.; Chen, D.; Wu, F. Effect of gypsum-clinker mass ratios on properties of slag filling cementitious material and its application. J. Cent. South Univ. (Sci. Technol.) 2020, 51, 489–498. [Google Scholar] [CrossRef]
  23. Han, F.; Zhang, Z.; Wang, D.; Yan, P. Hydration heat evolution and kinetics of blended cement containing steel slag at different temperatures. Thermochim. Acta 2015, 605, 43–51. [Google Scholar] [CrossRef]
  24. Wang, Q.; Yan, P.; Yang, J.; Zhang, B. Influence of steel slag on mechanical properties and durability of concrete. Constr. Build. Mater. 2013, 47, 1414–1420. [Google Scholar] [CrossRef]
  25. Kourounis, S.; Tsivilis, S.; Tsakiridis, P.; Papadimitriou, G.; Tsibouki, Z. Properties and hydration of blended cements with steelmaking slag. Cem. Concr. Res. 2007, 37, 815–822. [Google Scholar] [CrossRef]
  26. Brand, A.S.; Roesler, J.R. Steel furnace slag aggregate expansion and hardened concrete properties. Cem. Concr. Compos. 2015, 60, 1–9. [Google Scholar] [CrossRef]
  27. Shi, C. Steel slag—its production, processing, characteristics, and cementitious properties. J. Mater. Civ. Eng. 2004, 16, 230–236. [Google Scholar] [CrossRef]
  28. Wang, T.; Wu, K.; Wu, M. Development of green binder systems based on flue gas desulfurization gypsum and fly ash incorporating slag or steel slag powders. Constr. Build. Mater. 2020, 265, 120275. [Google Scholar] [CrossRef]
  29. R., S.L.R.; Domínguez, O.; A., J.H.D.; García, C.; Tapia, F. Synergistic effects of rubber-tire-powder and fluorogypsum in cement-based composite. Case Stud. Constr. Mater. 2020, 14, e00471. [Google Scholar] [CrossRef]
  30. Kuryatnyk, T.; da Luz, C.A.; Ambroise, J.; Pera, J. Valorization of phosphogypsum as hydraulic binder. J. Hazard. Mater. 2008, 160, 681–687. [Google Scholar] [CrossRef]
  31. Li, W.; Fall, M. Strength and self-desiccation of slag-cemented paste backfill at early ages: Link to initial sulphate concentration. Cem. Concr. Compos. 2018, 89, 160–168. [Google Scholar] [CrossRef]
  32. Xiao, B.; Fall, M.; Roshani, A. Towards Understanding the Rheological Properties of Slag-Cemented Paste Backfill. Int. J. Min. Reclam. Environ. 2020, 35, 268–290. [Google Scholar] [CrossRef]
  33. All-China Environment Federation Professional Committee for the Treatment of Solid and Endangered Wastes. Development Report on Comprehensive Utilization of Large Industrial Solid Waste in China in 2019; Industrial Solid Waste Network: Beijing, China, 2020. [Google Scholar]
  34. Ke, X.; Hou, H.; Zhou, M.; Wang, Y.; Zhou, X. Effect of particle gradation on properties of fresh and hardened cemented paste backfill. Constr. Build. Mater. 2015, 96, 378–382. [Google Scholar] [CrossRef]
  35. Wu, D.; Cai, S.-J.; Huang, G. Coupled effect of cement hydration and temperature on rheological properties of fresh cemented tailings backfill slurry. Trans. Nonferrous Met. Soc. China 2014, 24, 2954–2963. [Google Scholar] [CrossRef]
  36. Wang, Y.; Wu, A.; Zhang, L.; Jin, F.; Liu, X. Investigating the Effect of Solid Components on Yield Stress for Cemented Paste Back-fill via Uniform Design. Adv. Mater. Sci. Eng. 2018, 2018, 3839174. [Google Scholar] [CrossRef] [Green Version]
  37. Xu, W.; Chen, W.; Tian, M.; Guo, L. Effect of temperature on time-dependent rheological and compressive strength of fresh cemented paste backfill containing flocculants. Constr. Build. Mater. 2021, 267, 121038. [Google Scholar] [CrossRef]
  38. Xiao, B.; Wen, Z.; Wu, F.; Li, L.; Yang, Z.; Gao, Q. A simple L-shape pipe flow test for practical rheological properties of backfill slurry: A case study. Powder Technol. 2019, 356, 1008–1015. [Google Scholar] [CrossRef]
  39. Bharathan, B.; McGuinness, M.; Kuhar, S.; Kermani, M.; Hassani, F.P.; Sasmito, A.P. Pressure loss and friction factor in non-Newtonian mine paste backfill: Modelling, loop test and mine field data. Powder Technol. 2019, 344, 443–453. [Google Scholar] [CrossRef]
  40. Wang, Q.; Yan, P.; Feng, J. A discussion on improving hydration activity of steel slag by altering its mineral compositions. J. Hazard. Mater. 2011, 186, 1070–1075. [Google Scholar] [CrossRef]
  41. Xu, C.; Ni, W.; Li, K.; Zhang, S.; Li, Y.; Xu, D. Hydration mechanism and orthogonal optimisation of mix proportion for steel slag–slag-based clinker-free prefabricated concrete. Constr. Build. Mater. 2019, 228, 117036. [Google Scholar] [CrossRef]
  42. Wang, Q.; Yan, P. Hydration properties of basic oxygen furnace steel slag. Constr. Build. Mater. 2010, 24, 1134–1140. [Google Scholar] [CrossRef]
  43. Wu, F.; Yang, F.; Xiao, B.; Yang, Z.; Gao, Q. Influence of Steel Slag Dosage on Early Age Strength and Rheological Properties of Paste. Mater. Rev. 2021, 35, 3021–3025. [Google Scholar] [CrossRef]
  44. Xiao, B.L.; Miao, S.J.; Gao, Q.; Chen, B.Y.; Li, S.H. Hydration Mechanism of Sustainable Clinker-Free Steel Slag Binder and Its Application in Mine Backfill. JOM 2021, 73, 1053–1061. [Google Scholar] [CrossRef]
  45. Cihangir, F.; Ercikdi, B.; Kesimal, A.; Ocak, S.; Akyol, Y. Effect of sodium-silicate activated slag at different silicate modulus on the strength and microstructural properties of full and coarse sulphidic tailings paste backfill. Constr. Build. Mater. 2018, 185, 555–566. [Google Scholar] [CrossRef]
  46. Zhang, Y.; Wu, W.; Liu, Q.; Sheng, L. Studying with small sample for leaching behavior of heavy metals based on the fuzzy theo-ry. World J. Eng. 2015, 12, 271–282. [Google Scholar] [CrossRef]
  47. Zhang, S.; Zhao, Y.; Guo, Z.; Ding, H. Stabilization/solidification of hexavalent chromium containing tailings using low-carbon binders for cemented paste backfill. J. Environ. Chem. Eng. 2021, 9, 104738. [Google Scholar] [CrossRef]
  48. Pokharel, M.; Fall, M. Combined influence of sulphate and temperature on the saturated hydraulic conductivity of hardened cemented paste backfill. Cem. Concr. Compos. 2013, 38, 21–28. [Google Scholar] [CrossRef]
  49. Shang, J.; Zhang, K.; Zhao, S.; Wu, G.; Li, X. Development on Evaluation Methodology of Cementitious Activity of Steel Slag. Mater. Rev. 2012, 26, 128–130,140. [Google Scholar] [CrossRef]
  50. Haruna, S.; Fall, M. Strength development of cemented tailings materials containing polycarboxylate ether-based superplasticizer: Experimental results on the effect of time and temperature. Can. J. Civ. Eng. 2021, 48, 429–442. [Google Scholar] [CrossRef]
  51. Liu, X.; Wu, A.; Wang, H.; Wang, Y. Influence mechanism and calculation model of CPB rheological parameters. J. Univ. Sci. Technol. Beijing 2017, 39, 190–195. [Google Scholar] [CrossRef]
  52. Xiapeng, P.; Fall, M.; Haruna, S. Sulphate induced changes of rheological properties of cemented paste backfill. Miner. Eng. 2019, 141, 105849. [Google Scholar] [CrossRef]
  53. Aldhafeeri, Z.; Fall, M. Sulphate induced changes in the reactivity of cemented tailings backfill. Int. J. Miner. Process. 2017, 166, 13–23. [Google Scholar] [CrossRef]
  54. Wang, Y.; Cao, Y.; Cui, L.; Si, Z.; Wang, H. Effect of external sulfate attack on the mechanical behavior of cemented paste backfill. Constr. Build. Mater. 2020, 263, 120968. [Google Scholar] [CrossRef]
  55. Chin, C.-J.; Yiacoumi, S.; Tsouris, C. Probing DLVO Forces Using Interparticle Magnetic Forces: Transition from Secondary-Minimum to Primary-Minimum Aggregation. Langmuir 2001, 17, 6065–6071. [Google Scholar] [CrossRef]
  56. Kuznar, Z.A.; Elimelech, M. Direct microscopic observation of particle deposition in porous media: Role of the secondary energy minimum. Colloids Surf. A Physicochem. Eng. Asp. 2007, 294, 156–162. [Google Scholar] [CrossRef]
  57. Hot, J.; Bessaies-Bey, H.; Brumaud, C.; Duc, M.; Castella, C.; Roussel, N. Adsorbing polymers and viscosity of cement pastes. Cem. Concr. Res. 2014, 63, 12–19. [Google Scholar] [CrossRef]
  58. Gao, S.; Ni, W.; Zhu, L.; Wang, Z.; Wang, J. Effect of gypsum on strength performance of cemented backfilling materials of red mud-slag system. J. Cent. South Univ. (Sci. Technol.) 2013, 44, 2259–2266. [Google Scholar]
  59. Xiao, B.; Wen, Z.; Miao, S.; Gao, Q. Utilization of steel slag for cemented tailings backfill: Hydration, strength, pore structure, and cost analysis. Case Stud. Constr. Mater. 2021, 15, e00621. [Google Scholar] [CrossRef]
  60. Li, Z.; Zhang, J.; Li, S.; Gao, Y.; Liu, C.; Qi, Y. Effect of different gypsums on the workability and mechanical properties of red mud-slag based grouting materials. J. Clean. Prod. 2020, 245, 118759. [Google Scholar] [CrossRef]
  61. Sun, G.; Tang, Q.; Zhang, L.; Wang, C. Early activation effect and mechanism of high-volume fly ash. J. Harbin Eng. Univ. 2019, 40, 540–547. [Google Scholar] [CrossRef]
  62. Xiao, B.; Miao, S.; Gao, Q.; Wu, F. Effect of metallurgical slag cementitious material on solidification characteristics of ultra-fine tailings backfill. Chin. J. Nonferrous Met. 2022, 32, 1153–1163. [Google Scholar] [CrossRef]
  63. Wang, X.; Ni, W.; Li, J.; Zhang, S.; Hitch, M.; Pascual, R. Carbonation of steel slag and gypsum for building materials and associated reaction mechanisms. Cem. Concr. Res. 2019, 125, 105893. [Google Scholar] [CrossRef]
  64. Chang, J.; Xiong, C.; Zhang, Y.; Wang, D. Foaming characteristics and microstructure of aerated steel slag block prepared by accelerated carbonation. Constr. Build. Mater. 2019, 209, 222–233. [Google Scholar] [CrossRef]
  65. Cui, X.; Ni, W.; Ren, C. Hydration Mechanism of All Solid Waste Cementitious Materials Based on Steel Slag and Blast Furnace Slag. Chin. J. Mater. Res. 2017, 31, 687–694. [Google Scholar] [CrossRef]
  66. Dambrauskas, T.; Baltakys, K.; Škamat, J.; Kudžma, A. Hydration peculiarities of high basicity calcium silicate hydrate samples. J. Therm. Anal. Calorim. 2017, 131, 491–499. [Google Scholar] [CrossRef]
  67. Petlovanyi, M.; Mamaikin, O. Assessment of an expediency of binder material mechanical activation in cemented rockfill. ARPN J. Eng. Appl. Sci. 2019, 14, 3492–3503. [Google Scholar]
  68. Petlovanyi, M.V.; Zubko, S.A.; Popovych, V.V.; Sai, K.S. Physicochemical mechanism of structure formation and strength-ening in the backfill massif when filling underground cavities. Vopr. Khimii I Khimicheskoi Tekhnologii 2019, 6, 142–150. [Google Scholar]
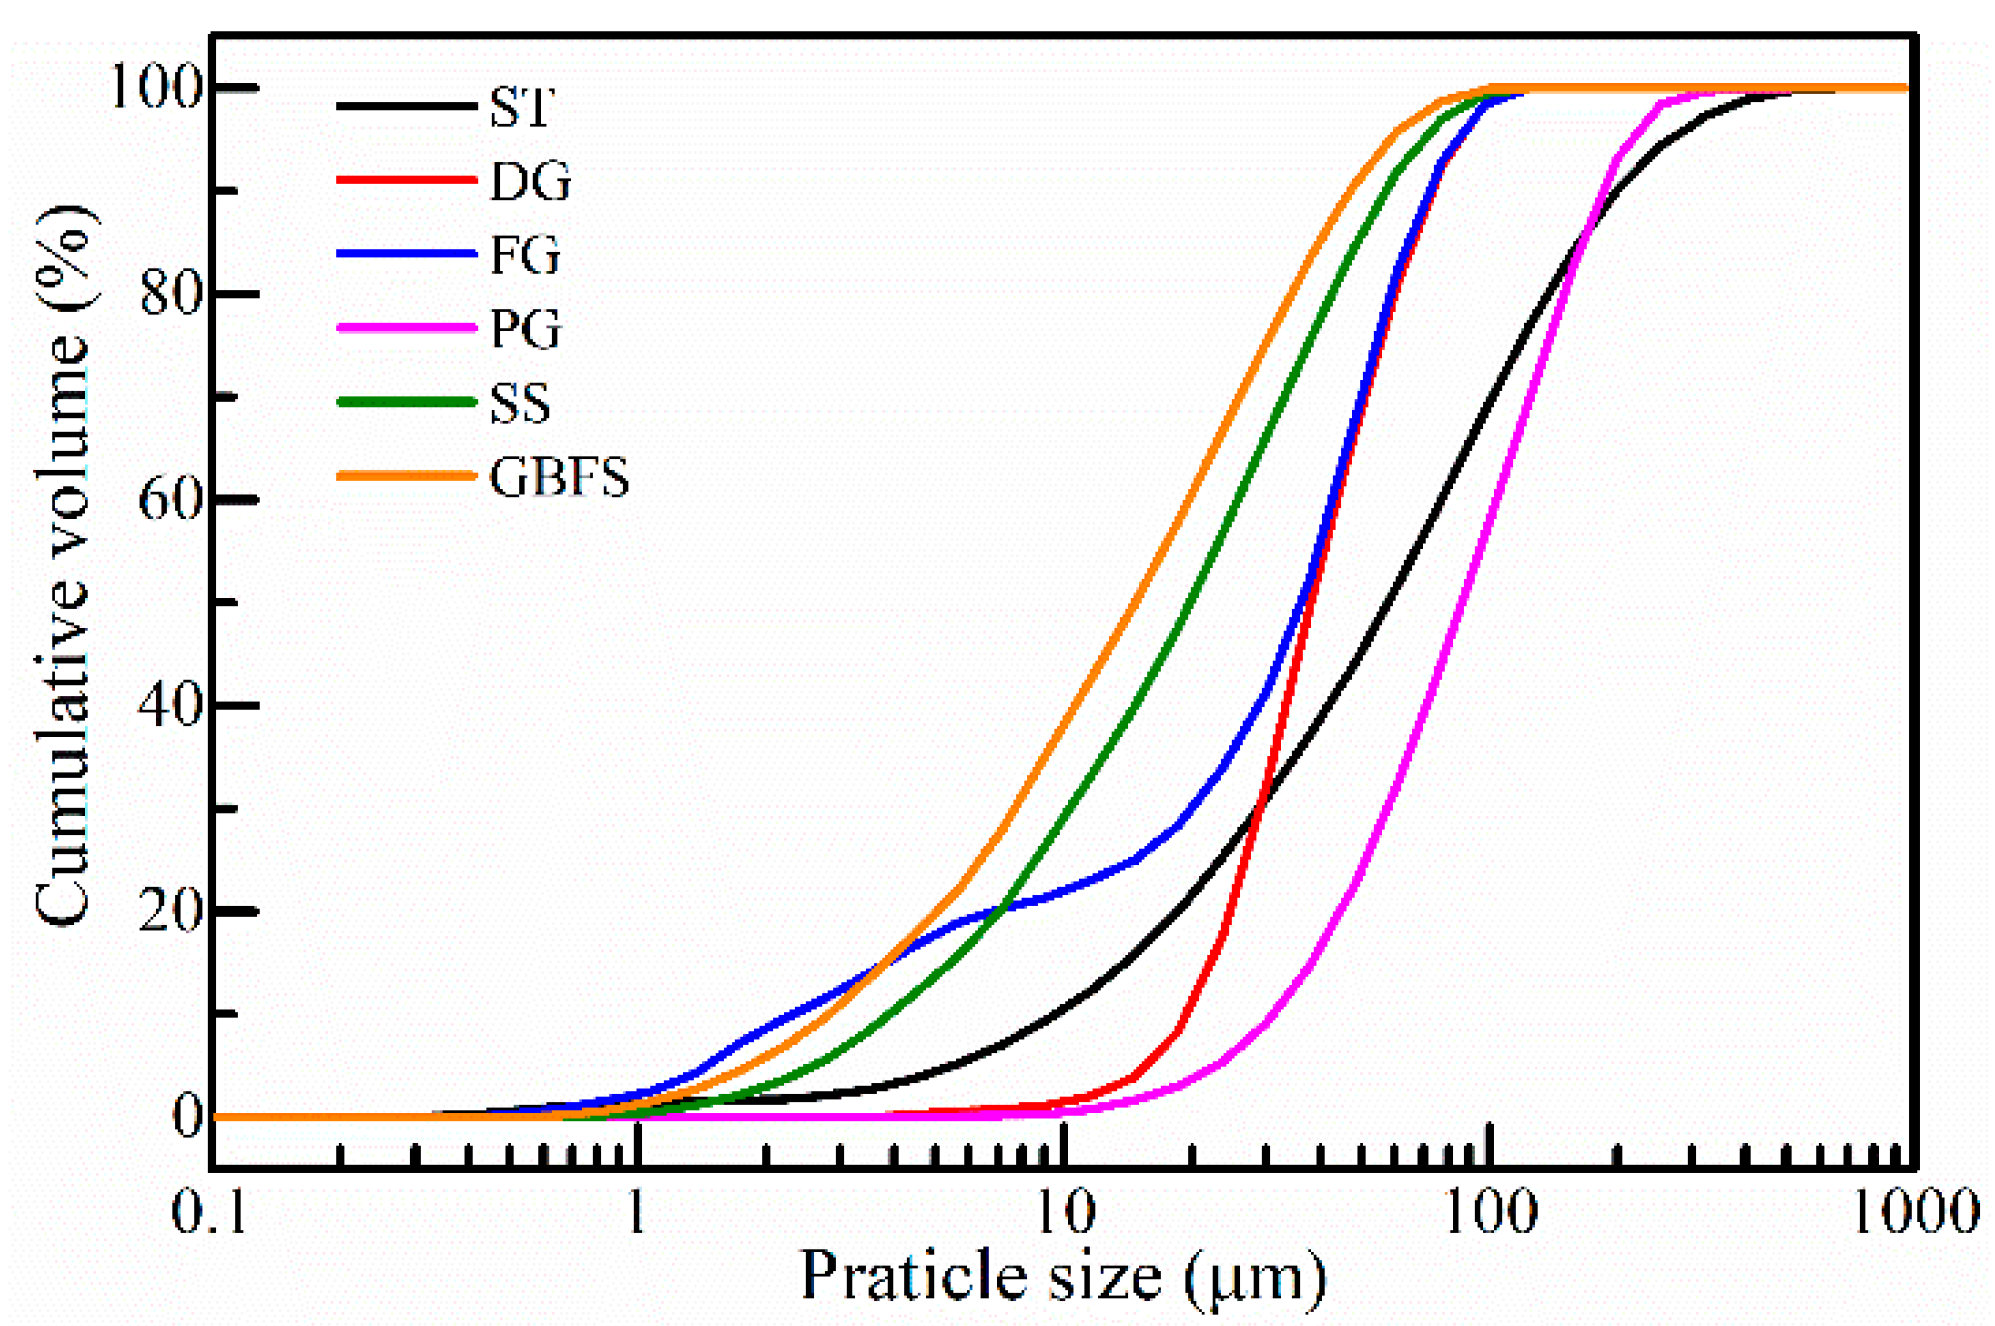
Figure 1. PSD of raw materials used in the experiment.
Minerals 13 00421 g001
Figure 2. XRD patterns of different gypsums.
Minerals 13 00421 g002
Figure 3. SEM diagram of different gypsum types: (a) desulfurization gypsum, (b) fluorogypsum (c) Phosphogypsum.
Minerals 13 00421 g003
Figure 4. Diagrams of (a) rheology tests and (b) uniaxial compressive strength tests.
Minerals 13 00421 g004
Figure 5. Yield stress and viscosity for fresh SSB-CPB with different gypsums.
Minerals 13 00421 g005
Figure 6. (a) Zeta potential and (b) pH value for fresh SSB-CPB with different gypsum types.
Minerals 13 00421 g006
Figure 7. Strength of hardened SSB-CPB with different gypsums.
Minerals 13 00421 g007
Figure 8. XRD pattern for hardened SSB-CP with different gypsums: (a) DG24-SSB-CP-3d, (b) FG24-SSB-CP-3d, and (c) PG24-SSB-CP-3d.
Minerals 13 00421 g008
Figure 9. TG/DTG diagram for hardened SSB-CP with different gypsums: (a) DG24-SSB-CP, (b) FG24-SSB-CP, and (c) PG24-SSB-CP.
Minerals 13 00421 g009
Figure 10. SEM micrographs of hardened SSB-CP with different gypsums: (a) DG24-SSB-CPB-3d, (b) FG24-SSB-CPB-3d, (c) PG24-SSB-CPB-3d, (d) DG24-SSB-CPB-28d, (e) FG24-SSB-28d, and (f) PG24-SSB-CPB-28d.
Minerals 13 00421 g010
Figure 11. MIP test results for hardened SSB-CP with different gypsums.
Minerals 13 00421 g011
Figure 12. Yield stress and viscosity for fresh SSB-CPB with different DG dosages.
Minerals 13 00421 g012
Figure 13. (a) Zeta potential and (b) pH value for fresh SSB-CPB with different DG dosages.
Minerals 13 00421 g013
Figure 14. Strength development of hardened SSB-CPB with different DG dosages and curing days.
Minerals 13 00421 g014
Figure 15. (a) XRD pattern and (b) TG/DTG diagram of DG32-SSB-CP; (c) SEM micrograph and (d) MIP test results of DG32-SSB-CPB. All results are under 28 days of curing.
Minerals 13 00421 g015
Table 1. Chemical composition of raw materials used in the experiment.
SampleSilica TailingsDesulfurization GypsumFluorogypsum PhosphogypsumSteel SlagSlag
CaO0.0147.1447.1245.4546.2243.51
SiO299.801.831.392.2918.9930.68
Al2O30.050.440.320.164.4514.03
MgO<0.010.000.001.194.597.35
SO30.0050.2049.6848.020.321.32
Fe2O30.000.220.510.3316.640.72
TiO20.020.020.030.050.870.68
MnO0.000.010.020.034.760.57
K2O0.020.040.060.040.120.54
Na2O<0.010.000.000.040.000.33
SrO0.000.050.010.100.040.08
P2O50.000.000.001.412.250.06
F0.000.000.800.830.000.00
Table 2. Summary of the mixing proportions of the prepared samples.
Sample NameSSBCuring Time (Days)
Gypsum TypeGypsum Dosage (%)SS (%)Slag (%)
Effect of gypsum type
DG24-SSB-CPBDG2435413, 7, 14, 28
FG24-SSB-CPBFG2435413, 7, 14, 28
PG24-SSB-CPBPG2435413, 7, 14, 28
Effect of gypsum dosage
DG0-SSB-CPBDG035653, 7, 14, 28
DG4-SSB-CPBDG435613, 7, 14, 28
DG8-SSB-CPBDG835573, 7, 14, 28
DG12-SSB-CPBDG1235533, 7, 14, 28
DG16-SSB-CPBDG1635493, 7, 14, 28
DG20-SSB-CPBDG2035453, 7, 14, 28
DG24-SSB-CPBDG2435413, 7, 14, 28
DG28-SSB-CPBDG2835373, 7, 14, 28
DG32-SSB-CPBDG3235333, 7, 14, 28
Disclaimer/Publisher’s Note: The statements, opinions and data contained in all publications are solely those of the individual author(s) and contributor(s) and not of MDPI and/or the editor(s). MDPI and/or the editor(s) disclaim responsibility for any injury to people or property resulting from any ideas, methods, instructions or products referred to in the content.