Abstract
The optimization of reservoir sweet spots is the key to the efficient exploration and development of low-permeability and tight sandstone gas reservoirs. However, offshore deep, low-permeability and tight sandstone has the characteristics of large burial depth, large diagenesis heterogeneity and prominent importance of diagenetic facies, which make it difficult to predict reservoir sweet spots. This work comprehensively used logging data, core observation, conventional core analysis, thin section, powder particle size analysis, clay X-ray diffraction analysis, cathode luminescence analysis, scanning electron microscopy and energy spectrum analysis and carried out the study of diagenesis, diagenetic facies and reservoir sweet spots of low-permeability and tight sandstone of H3 and H4 (the third and fourth members of Huagang Formation) members in the Jiaxing area of the Xihu Sag. The results show that the H3 and H4 sandstones were divided into five diagenetic facies types, and chlorite-coated facies and dissolution facies were favorable diagenetic facies belts. The H3 member mainly develops chlorite-coated facies, dissolution facies and quartz-cemented facies, whereas the H4 member primarily develops quartz-cemented facies and chlorite-coated facies. The percentages of type I sweet spot, type II1 sweet spot and type II2 sweet spot in the H3 reservoir are approximately 21%, 23% and 26%, respectively, whereas the percentages of type I sweet spot, type II1 sweet spot and type II2 sweet spot in the H4 reservoir are about 16%, 15% and 16%, respectively. The distribution rules of reservoir sweet spots were investigated. Type I sweet spot was mainly developed in the areas of chlorite-coated facies and dissolution facies of medium sandstone and coarse sandstone in the channel bar and braided channel sedimentary microfacies. Type II sweet spot was primarily distributed in the areas of quartz-cemented facies, chlorite-coated facies and minor dissolution facies of medium sandstone, fine sandstone and sandy conglomerate in the braided channel, subaqueous distributary channel and channel bar sedimentary microfacies. Type III sweet spot was chiefly developed in the areas of tightly compacted facies, calcite-cemented facies and quartz-cemented facies of fine sandstone, siltstone and a small amount of sandy conglomerate in the subaqueous distributary channel sedimentary microfacies.
1. Introduction
The reservoir properties of sandstone are largely controlled by sediment composition and diagenesis alteration [1,2,3]. The difference of the sedimentary process leads to the difference of the original sediment composition. Diagenesis may affect reservoir properties through postdepositional processes [3,4,5]. Diagenesis in deep, tight reservoirs mainly encompasses compaction, cementation, replacement and dissolution [6,7,8,9]. These diagenetic alterations result in sediment consolidation diagenesis and pore volume change. Diagenesis has various effects on reservoir properties, and diagenetic facies are important research content of deep, low-permeability and tight sandstone. Unconventional petroleum geology research is mainly focused on continuous or semi-continuous sweet spot areas [10].
Diagenetic facies refers to the interval or unit formed by the interaction between sediments and diagenetic processes in some tectonic environments [11]. Most previous diagenetic facies studies were conducted by microscopic thin section examination, cathode luminescence, scanning electron microscopy and X-ray diffraction analysis [12,13,14]. Due to the high cost of the core, the prediction of diagenetic facies and reservoir quality is limited. There are two methods for quantitative characterization of diagenetic facies: diagenetic facies characterization by logging curves and diagenetic facies characterization by seismic data. Ozkan et al. [15] linked petrographic characteristics with logging curves to generate a model for predicting diagenetic facies using logging curves [15]. Linking diagenetic facies with logging curves provided a favorable tool for predicting the distribution of high-quality reservoirs in tight sandstones [16]. Zeng et al. [17] established the relationship between major diagenetic facies and seismic parameters by using logging curves, and by using seismic data, they predicted diagenetic facies through the relationship between calcite content, reservoir porosity and wave impedance [17]. Future gas field development and prospect evaluation depend on accurate characterization of reservoir parameters [18,19]. Diagenetic facies is a comprehensive description of the type and degree of diagenesis and diagenetic minerals, which determines the formation and distribution of the sweet spot in tight sandstones [11,16,20].
Sweet spot evaluation is an important aspect of current unconventional oil and gas exploration and development, which is of great significance to scale beneficial development of unconventional oil and gas [21]. Sweet spot is a potential area with the greatest exploration potential in the deep interval [22]. With the continuous deepening of the research on sweet spot, this concept is gradually improved. In 1999, the United States Geological Survey defined sweet spot as a tight sandstone gas block capable of producing 30 years of gas continuously [23]. Law [24] believed that sweet spot in tight sandstone gas reservoirs was formed by the combined action of sedimentation and structure [24]. Yang et al. [25] believed that a reservoir sweet spot in the process of tight sandstone gas exploration and development can be considered as the local area with high porosity and high permeability under the background of poor overall sandstone reservoir properties, and a tight sandstone gas development area that can provide high daily gas production and sustainable economic production [25]. At present, the evaluation and prediction of the sweet spot area/section is the key and difficult point of unconventional oil and gas exploration and development [21]. Oil and/or gas accumulation intervals in rock formations are referred to as a sweet spot interval, and oil and gas accumulation areas in geography are referred to as sweet spot areas [10]. However, relatively high-quality tight sandstones in different petroliferous basins are controlled by different diagenetic processes [5,26]. Some factors, such as large burial depth, large diagenesis heterogeneity, the significant importance of diagenetic facies and multiple intervals/units composed of different reservoir properties, limit the evaluation of the reservoir quality and reservoir sweet spots of low-permeability and tight sandstones. Therefore, sweet spot evaluation and optimization is of great significance to the exploration and development of deep, low-permeability and tight sandstone gas reservoirs [12,27].
The exploration and development of offshore deep, low-permeability and tight sandstone gas reservoirs is difficult, and the prediction of reservoir sweet spots is difficult at this stage. The low-permeability and tight sandstone reservoir of the Huagang Formation in the Xihu Sag of the East China Sea Basin is characterized by large burial depth (more than 3500 m) and strong diagenesis heterogeneity, which increases the cost, difficulty and risk of exploration and development. To solve the above-mentioned problems, low-permeability and tight sandstone was divided into five relatively uniform diagenetic facies. Then, the logging responses of the five diagenetic facies were summarized, and a model was established to predict the vertical distribution of the diagenetic facies. Finally, the vertical distribution of reservoir sweet spots was depicted by the porosity index of sweet spots. The controlling factors of reservoir sweet spots in low-permeability and tight sandstone were discussed, and then the distribution rules of the reservoir sweet spots were revealed.
2. Geological Setting
The East China Sea Basin, also known as the East China Sea Shelf Basin, is located in the southeastern continental margin of the Eurasian plate (Figure 1a). It is mainly a back-arc rift petroliferous basin with Mesozoic–Cenozoic deposits. The East China Sea Basin covers an area of 24.13 × 10⁴ km2. The degree of oil and gas exploration in the East China Sea Basin is relatively low, and it is still in the early stage of exploration and development. At present, the target of exploration and development is focused on the Xihu Sag. The Xihu Sag is a second-order structural unit in the East China Sea Basin, located in the middle to the northeast of the basin (Figure 1b) [28]. The width of the Xihu Sag is about 100 km in the east–west direction, the length is approximately 400 km in the north–south direction, and the area of the Xihu Sag is about 5.9 × 10⁴ km2. The Xihu Sag has characteristics of east–west zoning and north–south blocking on the plane, which can be divided into the western slope belt, western sag belt, central uplift belt, eastern sag belt and eastern slope belt (Figure 1c) [29]. The central uplift belt is composed of the Jiaxing tectonic zone, Ningbo tectonic zone, Huangyan tectonic zone and Tiantai tectonic zone from north to south. The study area is the N gas field of the Jiaxing tectonic zone in the central uplift belt of the Xihu Sag. The study area covers an area of 229 m2, including 4 wells with a spacing of 2.3–5.9 km (Figure 1d).
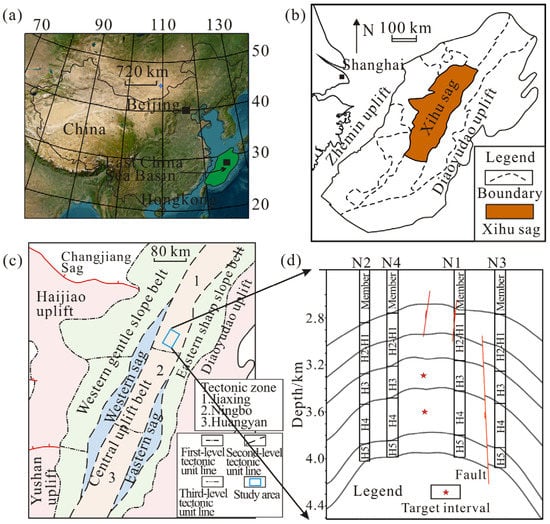
Figure 1.
(a) Geographical location of the East China Sea Basin. (b) Structural units of the East China Sea Basin (modified from Wang et al. [28]; reproduced with permission from Elsevier). (c) Division of structural units in the Xihu Sag (cited from Lou et al. [29]). (d) Sampling wells in the Jiaxing tectonic zone of the north-central part of central uplift belt in the Xihu Sag. The stars in subfigure d indicate the target intervals.
The Xihu Sag is mainly composed of Cenozoic detrital deposits with a thickness of approximately 9000–15000 m. The Xihu Sag experienced Jilong movement, Yandang movement, Oujiang movement, Yuquan movement, Huagang movement, Longjing movement and Okinawa movement in the Cenozoic era (Figure 2). From the bottom to the top, the strata in the Xihu Sag successively develop the Bajiaoting (E21b) Formation, Baoshi (E22b) Formation, Pinghu (E23p) Formation, Huagang (E3h) Formation, Longjing (N11l) Formation, Yuquan (N12y) Formation, Liulang (N13l) Formation, Santan (N2s) Formation and Donghai (Qd) Group (Figure 2). The Oligocene Huagang Formation is primarily composed of lakeside sand bodies and lake–delta sand bodies in the river–lake system, and the thickness of most areas of the Xihu Sag is between 1000 m and 2000 m. From the top to the bottom, the Huagang Formation consists of 12 members, namely, H1 (E3h1), H2 (E3h2), H3 (E3h3), H4 (E3h4), H5 (E3h5), H6 (E3h6), H7 (E3h7), H8 (E3h8), H9 (E3h9), H10 (E3h10), H11 (E3h11) and H12 (E3h12). The H1, H2, H3, H4 and H5 members are the upper part of Huagang Formation, and H6, H7, H8, H9, H10, H11 and H12 are the lower part of Huagang Formation. The target intervals studied are H3 and H4 (Figure 2).
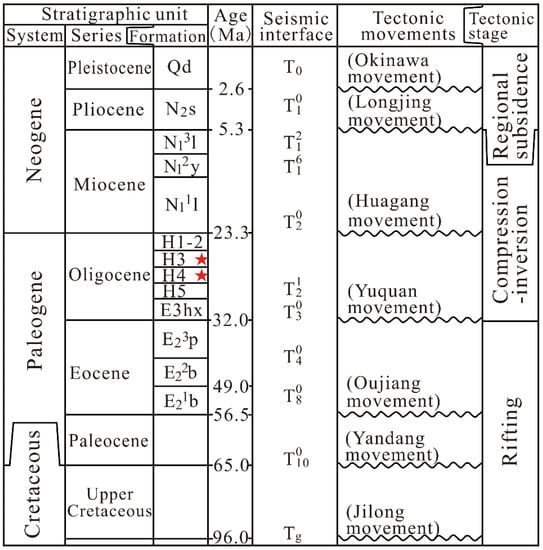
Figure 2.
Stratigraphic column of the Xihu Sag (modified from Lou et al. [29]; Ye et al. [30]; reproduced with permission from Elsevier). The H3 and H4 members marked by red stars are the studied target intervals.
The Huagang Formation in the study area was deposited in the braided river delta sedimentary environment. The H1 and H2 members were deposited in the braided river delta plain, whereas the H3, H4 and H5 members were deposited in the braided river delta front. The braided channel, channel bar and subaqueous distributary channel are common sedimentary microfacies in H3, H4 and H5. As the target intervals with rich gas reservoirs, H3 and H4 are mainly low-permeability and tight sandstone.
3. Materials and Methods
3.1. Petrographic Data
In this study, 1444 conventional core analysis data and 154 clay X-ray diffraction data of the H3 and H4 sandstone samples from the N1, N2, N3 and N4 wells were collected. This work observed 10 core sections of four wells. The length of these core sections is 188.5 m, mainly from 2 core sections of the N1 well, 3 core sections of the N2 well, 3 core sections of the N3 well and 2 core sections of the N4 well.
A total of 293 core samples were selected for the production of the thin section to study diagenesis characteristics. At a given temperature and pressure, the liquid impregnant was injected into the rock pores and solidified. The core was cut and ground into slices with a thickness of 30 μm in the required direction, which allowed visible light to pass through the slices. Under the Zeiss Axio Scope Al multifunctional polarizing microscope, the mineral composition and pore type of each thin section was observed using an eye lens 10× (magnification) and an objective lens 2.5× (magnification), 5× (magnification), 10× (magnification) and 20× (magnification). At least 500 point statistics were performed on each thin section to ensure that the error generated by the point statistics was less than 5.5% for each thin section.
A total of 341 core samples were selected for powder particle size analysis. The amount of core sample required was greater than 50 g. The sample was then broken into appropriate small pieces. The grain size of dry powder samples was analyzed using a Mastersizer 2000 laser particle size analyzer with a voltage of 240 V and a current of 60 VA, and the grain size composition of the powder samples was measured. The measurement range of the grain sizes is 0.02–2000 μm.
A total of eight sandstone samples were made into cathodeluminescence thin sections for the analysis of authigenic minerals. At the working conditions of room temperature 25–28 °C and humidity < 50%, the main detection equipment, a CL8200MK5 cathodoluminescence instrument and AXIO SCOPE A1 polarizing microscope, were used to obtain the target authigenic minerals and the luminescence color of each cathodoluminescence thin section. The images taken chiefly include single polarized light, crossed polarized light and cathode luminescence.
A total of eight core samples were selected to observe the obvious pore space. The representative, flat and fresh section was taken as the observation surface. The core sample was then stuck to the sample post and dried in an oven at 50 °C. The obvious pore space of each core sample was observed using a scanning electron microscope at an acceleration voltage of 20 keV. In addition, a total of 29 core samples were made into multifunctional thin sections to observe the authigenic minerals and pore spaces. Authigenic minerals and pore spaces from 80 magnification to 2000 magnification were observed by a Thermoscientific Quattro scanning electron microscopy (SEM) under low vacuum conditions with a working voltage of 20.0 kV and a working current of 1.0 μs. The authigenic minerals primarily include calcite, quartz and clay. In addition, an Oxford Instruments energy spectrometer was used to measure the point and surface scanning energy spectrum data of selected minerals at a high voltage of 20.0 kV and a spot size of 3.5.
3.2. Quantitative Calculation of Diagenesis Degree
The compaction intensity of a sandstone reservoir can be expressed by the compactional porosity loss rate, and the calculation equation is Equation (1).
where Pcompaction is the compactional porosity loss rate; Vprimary is the primary porosity; Vcompaction is the pore volume loss caused by compaction; Vdissolution is the pore volume enhancement caused by dissolution; Vcementation is the volume of cement; Vpresent is the current pore volume. The estimation of the primary porosity is based on the relationship Φo = 20.91 + 22.90/So between the sorting coefficient and the porosity of the unconsolidated sand under the surface condition. So is the Trask sorting coefficient, which is calculated indirectly through the powder particle size analysis data. So = (Q1/Q3)1/2, where Q1 and Q3 are the grain size at 25% and 75%, respectively, on the particle size probability accumulation curve.
The cementation intensity of the sandstone reservoir can be expressed by the cementation porosity loss rate, and the calculation equation is Equation (2).
where Pcementation is the cementation porosity loss rate. The cement volume can be quantitatively calculated on the thin section.
The dissolution intensity of the sandstone reservoir can be expressed by the dissolution porosity enhancement rate, and the calculation equation is Equation (3).
where Pdissolution is the dissolution porosity enhancement rate; Ppresent is the current core-based measured porosity; Vresiduepore is the residual primary pore on the thin section; Vsecondarypore is the secondary pore on the thin section. The residual primary pore, secondary pore and total plane porosity can be quantitatively calculated on the thin section.
3.3. Petrophysical Analysis
The logging curves used in this study include the compensated neutron, s-wave acoustic time difference, p-wave acoustic time difference, gamma ray, density, resistivity and log-derived porosity data. The vertical resolution of these log curves was 0.1 m, and it was used to evaluate the diagenetic facies distribution. In addition, log-derived porosity data were also used to study the vertical distribution of reservoir sweet spots. The evaluation indices for reservoir sweet spots can include porosity, permeability, production capacity, pore structure, irreducible water saturation, sedimentary microfacies and diagenetic facies.
The influence of different diageneses on logging curves was investigated. Compaction had a great influence on porosity logging curves. With the increase of the compaction intensity, the acoustic time difference and compensated neutron decreased, the density increased, and the resistivity decreased. Meanwhile, the sandstone with a high compaction intensity contained a high content of plastic clastic grains or argillaceous materials, which also caused high gamma rays.
The porosity increased by the dissolution led to the decrease of the density and the increase of the acoustic time difference and compensated neutron. The response of the acoustic time difference to the secondary pore is not as obvious as that of the compensated neutron. Calcite cementation is characterized by high resistivity, and early basal calcite-cemented sandstone generally contains very low argillaceous material and undergoes tight cementation, which results in low gamma rays, low acoustic time difference and high density. The strata with silica cementation generally have low argillaceous content and, thus, low gamma rays.
4. Results
4.1. Reservoir Characteristics
4.1.1. Petrographic Characteristics
The H3 and H4 sandstones were identified as feldspar lithic quartzose, a small amount of feldspathic litharenite and litharenite (Figure 3). The H3 and H4 rocks are mostly medium, coarse and fine sandstones, with grain sizes ranging from 0.4 mm to 1.2 mm. Grain sorting is medium to good, and grain roundness ranges from subangular to subcircular. Quartz, feldspar and rock fragments comprise the main clastic minerals in the low-permeability and tight sandstones of the H3 and H4 members (Table 1). The content of detrital quartz ranges from 53% to 75%, with an average value of 64.44% in framework grains. The content of detrital feldspar (k-feldspar and plagioclase) varies from 8% to 21%, with an average value of 16.4%. The total rock fragments content ranges from 14% to 37%, and the average value is 19.15%. The composition of rock fragments is primarily composed of 8.71% metamorphic rock fragment, 7.89% volcanic rock fragment and minor sedimentary rock fragment. The cement chiefly contains authigenic quartz, calcite and clay.
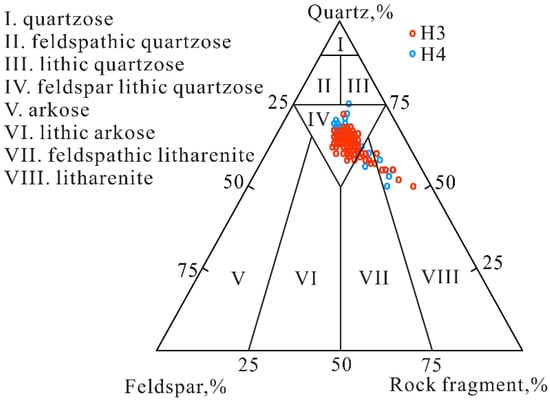
Figure 3.
Ternary diagram of framework grain composition of the H3 and H4 members in the Xihu Sag (base map cited from Folk et al. [31]; reproduced with permission from Elsevier).

Table 1.
Mineral composition and diagenetic characteristics of five diagenetic facies in H3 and H4 sandstones of the Xihu Sag.
4.1.2. Sedimentary Characteristics
Previous research investigated the relationship between provenance and sedimentary microfacies and the distribution of sedimentary microfacies in the study area of the Xihu Sag [32]. The interpretation of the plane distribution of sedimentary microfacies by multiple seismic attributes improved the prediction accuracy of sedimentary microfacies [33,34]. Multiple seismic attributes (mean amplitude, mean square root amplitude, maximum amplitude, maximum absolute amplitude and seismic time thickness) were calibrated based on single-well sedimentary microfacies analysis, and the sedimentary microfacies distributions of the H3 and H4 members were interpreted. The main sedimentary microfacies in the H3 member are braided channels and channel bars (Figure 4a), and the main sedimentary microfacies in the H4 member are subaqueous distributary channels and channel bars (Figure 4b).
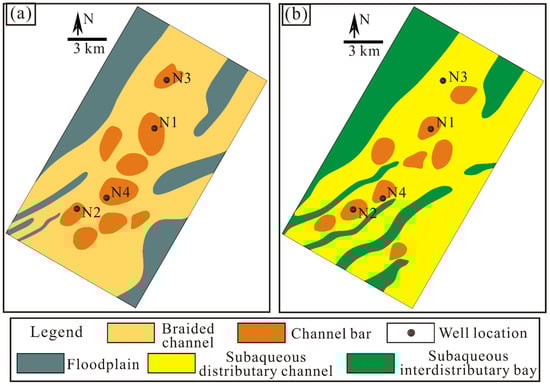
Figure 4.
Plane distribution of sedimentary microfacies (Modified from Wang et al. [32]; reproduced with permission from Elsevier). (a) Distribution of braided channels and channel bars in the H3 member. (b) Distribution of channel bars and subaqueous distributary channels in the H4 member.
Based on the core observations and powder particle size analysis, six kinds of lithologies with different grain sizes were identified. These grain size lithologies included coarse sandstone, medium sandstone, fine sandstone, sandy conglomerate, siltstone and mudstone (Figure 5). Coarse sandstone, medium sandstone and fine sandstone constitute the main parts of the H3 and H4 reservoirs, which are dominated by massive bedding, cross bedding and parallel bedding (Figure 5a–f). Siltstone is dominated by wavy bedding and massive bedding, with a high content of grey-black argillaceous matrix (Figure 5g,h). Silty mudstone has massive bedding and wavy bedding (Figure 5i,j). Sandy conglomerate is mainly located at the bottom of braided channels with massive bedding (Figure 5k,l).
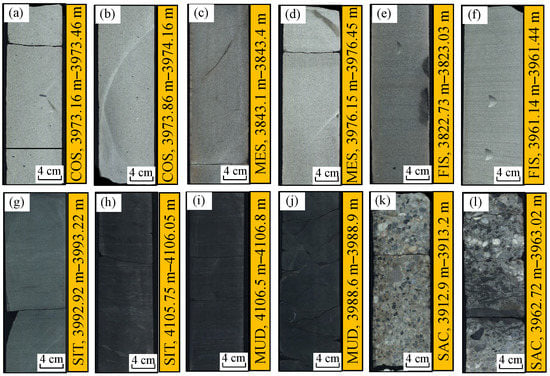
Figure 5.
Core photographs of sandstone grain size in the H3 and H4 members. (a,b) Coarse sandstone (COS). (c,d) Medium sandstone (MES). (e,f) Fine sandstone (FIS). (g,h) Siltstone (SIT). (i,j) Mudstone (MUD). (k,l) Sandy conglomerate (SAC).
4.2. Diagenesis and Diagenetic Facies
4.2.1. Diagenesis
- (1)
- Compaction
Compaction is the main reason for destroying reservoir properties of the H3 and H4 sandstones. The evidence for the compaction of the H3 and H4 sandstones is the contact type between mineral grains, the pressure dissolution of quartz grains, the fracture of quartz and feldspar, and the deformation of mica and argillaceous rock fragments (Figure 6a–f). The burial depth of the H3 sandstone is about 3375–3771 m, and the contact type between grains is mainly point–line contact and line contact (Figure 6g). The burial depth of the H4 sandstone is approximately 3628–4140 m, and the contact type between grains is mainly line contact, with a small amount of concave–convex contact and sutured contact (Figure 6h,i).
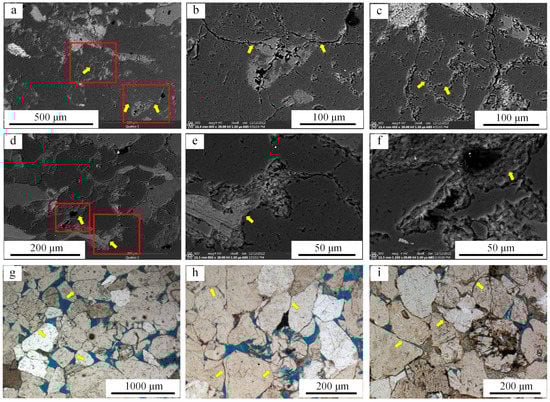
Figure 6.
Compaction characteristics of the H3 and H4 sandstones in the Xihu Sag. (a) N2 well, 4109.5 m, concave–convex contact, sutured contact and rigid grain fracture. (b) Partial magnification of image a, concave–convex contact and sutured contact. (c) Partial magnification of image a, rigid grain fracture. (d) N1 well, 3450 m, deformation of mica and argillaceous rock fragments. (e) Partial magnification of image d and deformation of mica. (f) Partial magnification of image d, deformation of argillaceous rock fragments. (g) N2 well, 3620.8 m, point-line contact and line contact. (h) N2 well, 3969.8 m, line contact, minor concave–convex contact and sutured contact. (i) N2 well, 3961.8 m, line contact, minor concave–convex contact and sutured contact. Yellow arrow indicate target compaction phenomenon.
- (2)
- Cementation
- Silica cementation
Quartz cements in H3 and H4 are relatively common in the study area, which usually include quartz overgrowth around quartz grains and authigenic quartz crystals in the pores. Quartz cements in the H3 and H4 sandstones may be related to the silica source or the development of chlorite coat. The silica formed by the dissolution of feldspar and rock fragments often becomes authigenic quartz crystals in association with other authigenic minerals (Figure 7a,b). The silica provided by the pressure dissolution of quartz grains usually becomes quartz overgrowth (Figure 7c,d) and may also become authigenic quartz crystals. The silica provided by the illitization of smectite often becomes authigenic quartz crystals in association with other authigenic minerals (Figure 7e,f). Quartz cements in the H3 sandstone are usually quartz overgrowth and authigenic quartz crystals. The development of the chlorite coat inhibited quartz cementation to some extent, and only when the chlorite coat was poorly developed did quartz overgrowth occur (Figure 7g). Quartz cements in the H4 sandstone show quartz overgrowth and authigenic quartz crystals (Figure 7h,i). The compaction of quartz grains and the illitization of smectite provided more silica, and the development of the chlorite coat was slightly reduced, so more quartz cement was formed.
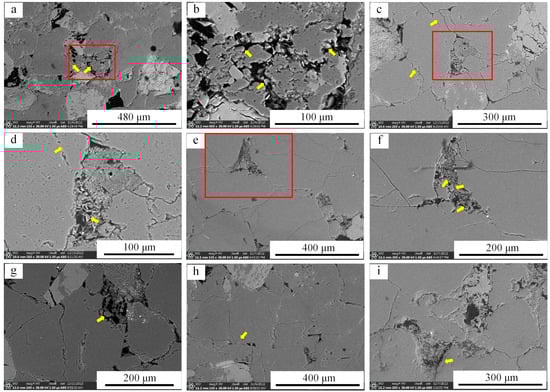
Figure 7.
Characteristics of silica cementation of the H3 and H4 sandstones. (a) N3 well, 4123.6 m, quartz overgrowth and authigenic quartz crystals. (b) Partial magnification of image a, authigenic quartz crystals in pores. (c) N4 well, 3910.4 m, quartz overgrowth. (d) Partial magnification of image c, quartz overgrowth and authigenic quartz crystals. (e) N2 well, 4104.2 m, authigenic quartz crystals, honeycomb-like illite and flaky illite. (f) Partial magnification of image e. (g) N1 well, 3446.3 m, authigenic quartz crystals. (h) N3 well, 4123.6 m, quartz overgrowth. (i) N2 well, 4104.2 m, quartz overgrowth. Yellow arrow indicate target silica cementation phenomenon.
- Calcite cementation
Calcite cement of the H3 and H4 sandstones is usually calcite and ferrocalcite (Figure 8). Observation of thin sections and cathodoluminescence thin sections shows that the H3 and H4 sandstones developed two stages of calcite cement (Figure 8). The first-stage calcite showed basal-type intercrystal cementation (Figure 8a–c), which was later than the chlorite coat and earlier than the quartz overgrowth, and the cathodoluminescence was croci-orange (Figure 8d). The second-stage ferrocalcite showed scattered granular or local porphyritic cementation (Figure 8e), which was later than the quartz overgrowth, and the cathodoluminescence appeared dark red (Figure 8f). The calcite cementation in the H3 and H4 sandstones has few differences, and the overall development degree is not high. The area with strong calcite cementation is near the sand–mud interface, so the impact on the reservoir is weak.
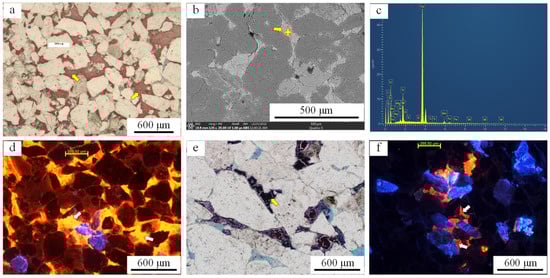
Figure 8.
Characteristics of calcite cementation of the H3 and H4 sandstones. (a) N1 well, 3845.8 m, thin section image of calcite cement. (b) N2 well, 4109.5 m, scanning electron microscope image of calcite cement. Four pointed star in subfigure b indicate sampling point of energy spectrum data. (c) Point energy spectrum data of image b. (d) N1 well, 3840.5 m, cathodoluminescence image of calcite cement. (e) N2 well, 3984.2 m, thin section image of ferrocalcite cement. (f) N3 well, 4120.8 m, cathodoluminescence image of ferrocalcite cement. Yellow arrow indicate target calcite cementation phenomenon.
- Authigenic clay cementation
Authigenic clay cementation in the H3 and H4 sandstones in the study area includes chlorite, illite–smectite mixed layer and illite cementation. Chlorite cementation appears as grain coat or pore filling (Figure 9a–d). Grain coat develops early and can effectively weaken silica cementation, and only isolated columnar quartz crystals appear in the area where chlorite coat is not developed or grain fracture occurs (Figure 9d). Illite cementation appears as honeycomb, flaky, filamentous or hairlike in the pore throat (Figure 9e–h). Filamentous illite on the chlorite coat can also be seen (Figure 9h). The illite–smectite mixed layer is mainly honeycomb (Figure 9i).
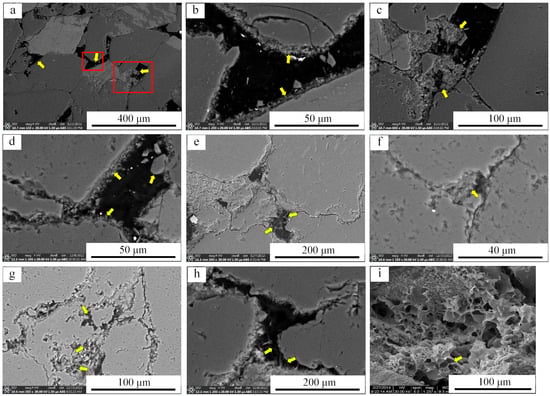
Figure 9.
Characteristics of authigenic clay mineral cementation in the H3 and H4 sandstones. (a) N4 well, 3917.4 m, chlorite coat and pore-filling chlorite. (b) Partial magnification of image a, chlorite coat. (c) Partial magnification of image a, pore-filling chlorite. (d) N2 well, 3984.3 m, chlorite coat and authigenic quartz crystals. (e) N2 well, 4104.2 m, honeycomb-like illite and flaky illite. (f) N4 well, 3910.4 m, flaky illite. (g) N4 well, 3910.4 m, filamentous illite in secondary pores. (h) N2 well, 3986.2 m, filamentous illite. (i) N1 well, 3826.3 m, illite–smectite mixed layer. Yellow arrow indicate target authigenic clay minerals.
- (3)
- Dissolution
Dissolution is an important reason to increase the reservoir properties of the H3 and H4 sandstones. Dissolution in the H3 and H4 sandstones is often developed on the cleavage plane and double-crystal fractures of feldspar minerals or the surfaces of feldspar, rock fragments and carbonate cement, and the intragranular dissolved pores, intergranular dissolved pores and moldic pores were developed (Figure 10a–e). The dissolution of clastic grains, such as feldspar and rock fragments, can be identified by thin sections and scanning electron microscopy.
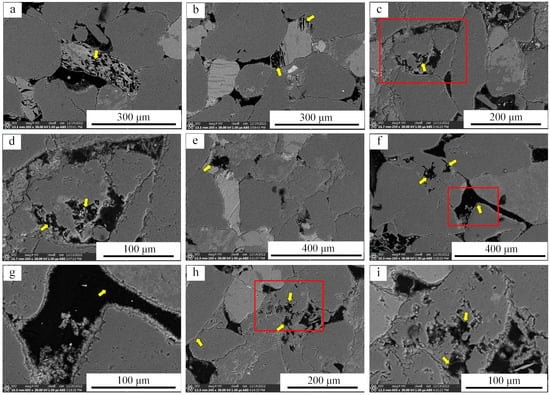
Figure 10.
Dissolution characteristics of the H3 and H4 sandstones. (a,b) N1 well, 3831.5 m, dissolution of feldspar grain and secondary pore. (c) N1 well, 3824.6 m, dissolution of rock fragments and secondary pores. (d) Partial magnification of image c. (e) N1 well, 3831.5 m, dissolution of calcite cement. (f) N2 well, 3622.5 m, dissolution of clastic grains and secondary pores. (g) Partial magnification of image f. (h) N1 well, 3831.5 m, dissolution of clastic grains and secondary pores. (i) Partial magnification of image h. Yellow arrow indicate target dissolution phenomenon.
In the H3 sandstone, due to the strong compaction resistance of the coarse and medium sandstones, the dissolution of mineral grains on the basis of pre-existing primary pores further formed secondary pores, and primary pores, intergranular dissolved pores and intragranular dissolved pores were developed (Figure 10f,g). In the H4 sandstone, due to the strong compaction of the medium sandstone and fine sandstone, the contact type between grains was line and concave–convex contact, and the fluid did not flow easily. The dissolution of the feldspar and rock fragments mostly formed intergranular dissolved pores, intragranular dissolved pores and moldic pores (Figure 10h,i).
4.2.2. Diagenetic Facies
The diagenetic characteristics of the H3 and H4 sandstones were analyzed. Because early chlorite coat inhibited compaction and quartz cementation, high-porosity sandstone with a large number of primary intergranular pores developed in H3 and H4 members. Dissolution in sandstone with pre-existing primary intergranular pores further increased the sandstone porosity. The degree of compaction is high in the sandstone with low porosity. In addition, calcite cementation and silica cementation can also result in the low porosity of some sandstones. Based on diagenesis and diagenetic minerals, the H3 and H4 sandstones were divided into five diagenetic facies. The specific diagenetic facies types and characteristics are as follows.
Tightly compacted facies. The lithologies are siltstone and fine sandstone, with a grain size of 0.1–0.45 mm, quartz content of 63%–68%, and matrix content of 0%–26% (Figure 11a). The average values of primary porosity and secondary porosity are 2.08% and 4.35%, respectively. The average values of the compactional porosity loss rate, dissolution porosity enhancement rate and cementation porosity loss rate are 78.04%, 12.58% and 16.14%, respectively (Table 1). Due to strong compaction, primary pores almost disappeared, and it was difficult for acidic fluid to enter in the later stage for dissolution. Therefore, both the primary intergranular pores and the secondary pores were poorly developed.
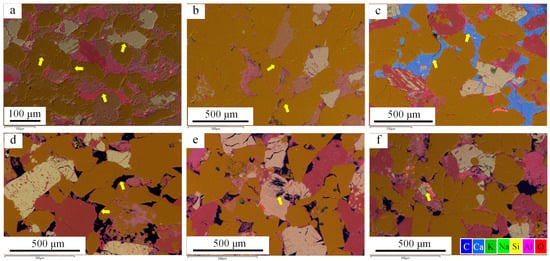
Figure 11.
Diagenetic facies types of the H3 and H4 reservoirs in the Xihu Sag. (a) N1 well, 3450 m, energy spectrum surface scanning image of tightly compacted facies. (b) N4 well, 3910.4 m, energy spectrum surface scanning image of quartz-cemented facies. (c) N2 well, 4109.5 m, energy spectrum surface scanning image of calcite-cemented facies. (d) N1 well, 3981.3 m, energy spectrum surface scanning image of chlorite-coated facies. (e) N1 well, 3831.5 m, energy spectrum surface scanning image of dissolution facies. (f) N1 well, 3820.5 m, energy spectrum surface scanning image of dissolution facies. Yellow arrow indicate target diagenesis phenomenon.
Quartz-cemented facies. The lithologies are fine and medium sandstones, with a grain size of 0.13–0.95 mm (Figure 11b). The content of quartz is 56%–70%, and the content of matrix is 1%–28%. The average values of primary porosity and secondary porosity are 3.23% and 5.28%, respectively. The average values of the compactional porosity loss rate, dissolution porosity enhancement rate and cementation porosity loss rate are 76%, 14.01% and 15.17%, respectively (Table 1). The compaction and quartz cementation were stronger in the early and middle diagenesis stages, and the primary pore was less preserved.
Calcite-cemented facies. The lithologies are fine sandstone, medium sandstone and sandy conglomerate, with a grain size of 0.13–0.6 mm (Figure 11c). The content of quartz is 62%–67%, and the content of matrix is 0%–5%. The average values of primary porosity and secondary porosity are 1.22% and 4.12%, respectively. The average values of the compactional porosity loss rate, dissolution porosity enhancement rate and cementation porosity loss rate are 31.45%, 12.41% and 64.86%, respectively (Table 1). Due to strong calcite cementation, primary intergranular pores almost disappeared, and it was difficult for acidic fluids to enter the calcite-cemented sandstone for dissolution in the later stage, so the primary intergranular pores and secondary pores were poorly developed.
Chlorite-coated facies. The lithologies are medium sandstone, fine sandstone and coarse sandstone, and the grain size is 0.09–1.2 mm (Figure 11d). The content of quartz is 55%–69%, and the content of matrix is 1%–7%. The average values of primary porosity and secondary porosity are 4.19% and 5.53%, respectively. The average values of the compactional porosity loss rate, dissolution porosity enhancement rate and cementation porosity loss rate are 74.91%, 16.29% and 12.02%, respectively (Table 1). In the early and middle diagenetic stages, because the early chlorite coat weakened the mechanical compaction, the primary intergranular pore content was more preserved. In the late stage of the middle diagenesis, the chlorite coat could inhibit pressure dissolution and quartz cementation and preserve more primary intergranular pores.
Dissolution facies. The lithologies are medium sandstone and coarse sandstone, with a grain size ranging from 0.15 mm to 1.2 mm (Figure 11e,f). The content of quartz is 55%–68%, and the content of matrix is 1%–5%. A large number of primary intergranular pore and secondary pores were developed. The average values of primary porosity and secondary porosity are 4.7% and 6.29%, respectively. The average values of the compactional porosity loss rate, dissolution porosity enhancement rate and cementation porosity loss rate are 73.91%, 17.25% and 8.89%, respectively (Table 1). In the early diagenesis and middle diagenesis stages, mechanical compaction had little effect, and primary intergranular pores were relatively developed. In the late stage of the middle diagenesis, the chlorite coat could effectively resist the contact between grains, inhibit pressure dissolution, reduce the source of silica cement and, thus, inhibit quartz overgrowth. Meanwhile, the well-preserved primary intergranular pores in the early diagenetic stage were conducive to the entry of acidic fluids in the later stage, thus causing dissolution and forming a large number of secondary pores.
4.3. Logging Evaluation of Diagenetic Facies
4.3.1. Logging Response and Quantitative Discrimination of Diagenetic Facies
In order to reflect the logging response characteristics of the five diagenetic facies, seven curves of compensated neutron, s-wave acoustic time difference, p-wave acoustic time difference, gamma rays, density, resistivity and log-derived porosity were selected for diagenetic facies logging identification. The five diagenetic facies have different logging response characteristics (Table 2).
Table 2.
Logging response characteristics of diagenetic facies in the H3 and H4 members in the Xihu Sag. Abbreviations: CNL = compensated neutron; DTC = s-wave acoustic time difference; DTS = p-wave acoustic time difference; GR = gamma ray; DEN = density; RT = resistivity; PHIE = log-derived porosity.
The logging response characteristics of the five diagenetic facies are shown below (Figure 12). The acoustic time difference logging curve of the tightly compacted sandstone shows a medium-low value and is in the range of 58.59 μs/ft to 70.16 μs/ft. The density logging curve shows high values, ranging from 2.55 g/cm3 to 2.68 g/cm3 (Figure 12a). The resistivity logging curve shows medium-high values. The gamma ray and acoustic time difference logging curves of the quartz-cemented facies show medium-low values. The resistivity values are high, ranging from 13.71 Ω·m to 141.02 Ω·m (Figure 12b). The density logging curve shows medium-high values.
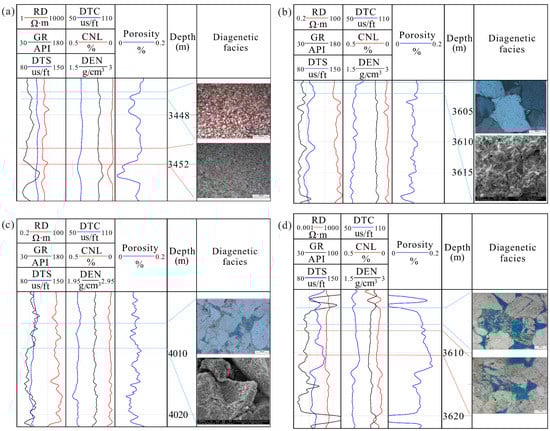
Figure 12.
Logging response characteristics of diagenetic facies. (a) Tightly compacted facies and calcite-cemented facies. (b) Quartz-cemented facies. (c) Chlorite-coated facies. (d) Dissolution facies.
The gamma ray and acoustic time difference logging curves of the calcite-cemented sandstone show low values, and the density logging curve shows high values. The gamma ray values range from 38.98 API to 85.27 API. In addition, the resistivity logging curve shows a clear calcium spike due to calcium cement (Figure 12a). The gamma ray and density logging curves of the chlorite-coated sandstone are medium-low values, and the acoustic time difference logging curves are medium-high values. The resistivity logging curve is a medium-low value, ranging from 11.12 Ω·m to 94.19 Ω·m (Figure 12c). The logging response characteristics of the dissolution facies are characterized by a medium-low resistivity value, low density value and medium-high acoustic time difference value. The resistivity value and density value are distributed from 7.63–54.79 Ω·m and 2.37–2.55 g/cm3, respectively. As the authigenic clay formed by the dissolution of the mineral composition in the sandstone was taken out in time, the dissolution facies sandstone shows medium-low gamma ray values, which are distributed between 38.2 API and 84.7 API (Figure 12d).
Combined with the accuracy of the logging data and the logging response of the diagenetic facies types, the author used the Fisher discriminant method on SPSS to discriminate five types of diagenetic facies and established the corresponding linear multivariate discriminant functions.
The discriminant functions of the five diagenetic facies of the H3 sandstone are Equation (4) to Equation (8).
Y1 = −6049.4 CNL + 12.98 DTC + 26.3 DTS + 1.6 GR + 38,134.6 DEN − 3.6 RD + 68,310.7 PHIE − 52,022.3
Y2 = −6194.5 CNL + 12.5 DTC + 26.4 DTS + 1.68 GR + 38,502.8 DEN − 3.5 RD + 69,332.6 PHIE − 52,990.5
Y3 = −6254.7 CNL + 14.1 DTC + 25.2 DTS + 1.7 GR + 38,432.8 DEN − 3.4 RD + 69,542.8 PHIE − 52,797.6
Y4 = −6286.3 CNL + 14.37 DTC + 25 DTS + 1.7 GR + 38,463.1 DEN − 3.4 RD + 69,687.6 PHIE − 52,885.5
Y5 = −6255.7 CNL + 14.7 DTC + 24.9 DTS + 1.67 GR + 38,472.7 DEN − 3.4 RD + 69,735 PHIE − 52,929.9
The discriminant functions of the five diagenetic facies of the H4 sandstone are Equation (9) to Equation (13).
where Y1, Y2, Y3, Y4 and Y5 represent the Fisher discriminant function values of the five diagenetic facies, respectively. CNL, DTC, DTS, GR, DEN, RD and PHIE represent the compensated neutron, s-wave acoustic time difference, p-wave acoustic time difference, gamma ray, density, resistivity and log-derived porosity, respectively. Y1–Y5 represent the discriminant function values of the five diagenetic facies in the study area, respectively. The logging parameters corresponding to the non-sample points were put into the above-mentioned discriminant functions, and the maximum discriminant function value calculated was the diagenetic facies type of the sample point.
Y1 = 1805 CNL + 26.5 DTC + 6.1 DTS − 4.8 GR + 8848.8 DEN + 0.08 RD + 10,483.5 PHIE − 12,696.2
Y2 = 1749.4 CNL + 26.5 DTC + 5.9 DTS − 4.9 GR + 8837.2 DEN + 0.06 RD + 10,495.5 PHIE − 12,639.7
Y3 = 1760.6 CNL + 26.6 DTC + 5.6 DTS − 4.8 GR + 8835 DEN + 0.07 RD + 10,681.5 PHIE − 12,627.5
Y4 = 1790.3 CNL + 26.9 DTC + 5.5 DTS − 4.9 GR + 8847.4 DEN + 0.07 RD + 10,734.3 PHIE – 12,663.7
Y5 = 1734.9 CNL + 27.3 DTC + 5.4 DTS − 4.8 GR + 8838.7 DEN + 0.02 RD + 10,777 PHIE − 12,667
By using Equations (9) and (10) for intersection analysis, the centroid separation of the data distribution of the five diagenetic facies was significant (Figure 13). The coincidence rate of the diagenetic facies obtained by the discriminant analysis is as high as 80%, and the distribution area boundaries of the five diagenetic facies types are obvious, which indicates that the diagenetic facies discrimination effect is good, and the discriminant model established is relatively reliable.
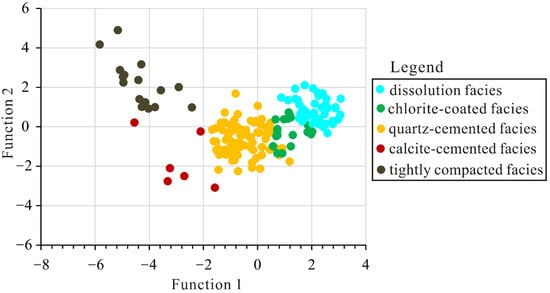
Figure 13.
Fisher discriminant analysis results of the H4 reservoir diagenetic facies.
4.3.2. Vertical Distribution of Diagenetic Facies
Based on the classification of the diagenetic facies types and the analysis of the diagenetic facies logging response, the discriminant models were used to identify the diagenetic facies of the H3 and H4 members in the study area. According to the diagenetic facies division results of the core section and the diagenetic facies prediction results of the non-core section, the distribution of the reservoir diagenetic facies of the H3 and H4 members was obtained (Figure 14). The H3 reservoir of the N gas field is mainly composed of chlorite-coated facies, dissolution facies and quartz-cemented facies, and a small amount of calcite-cemented facies and tightly compacted facies. The H4 reservoir primarily consists of quartz-cemented facies and chlorite-coated facies, followed by dissolution facies, accompanied by minor tightly compacted facies and calcite-cemented facies.
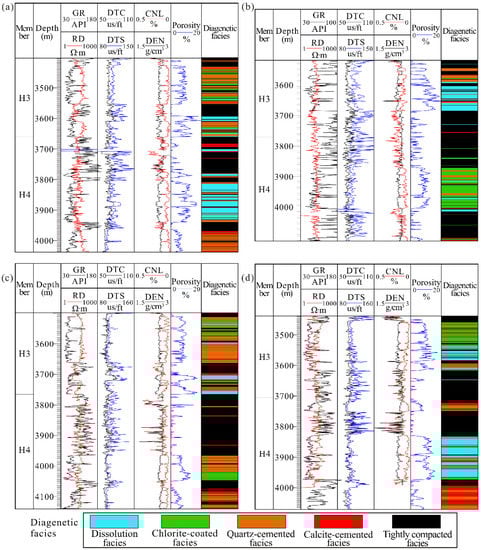
Figure 14.
Vertical distribution of diagenetic facies in the single wellsites. (a) N1 well. (b) N2 well. (c) N3 well. (d) N4 well.
In summary, the H3 and H4 reservoirs mainly develop quartz-cemented facies and chlorite-coated facies, followed by dissolution facies, and minor tightly compacted facies and calcite-cemented facies are developed. Tightly compacted facies, calcite-cemented facies and quartz-cemented facies are obviously destructive diagenetic facies (Table 1). Relatively speaking, the reservoir properties of the quartz-cemented facies sandstone samples are better than those of the tightly compacted facies and the calcite-cemented facies sandstone samples. The chlorite-coated facies and dissolution facies are obviously constructive diagenetic facies.
4.4. Vertical Distribution of Reservoir Sweet Spot
Based on the oil and gas industry standard “regulation of offshore petroleum reserves estimation”, conventional core analysis data were used to establish reservoir sweet spot classification criteria for the H3 and H4 members in the Jiaxing area in the Xihu Sag [35]. In the established reservoir sweet spot criteria, sandstone with a porosity higher than 11% and permeability higher than 10 × 10−3 μm2 is considered as a type I reservoir sweet spot. Sandstone with a porosity of 9%–11% and permeability of 3 × 10⁻³ μm2 to 10 × 10−3 μm2 is considered as a type II1 reservoir sweet spot. Sandstone with a porosity of 7%–9% and permeability of 1 × 10⁻³ μm2 to 3 × 10⁻³ μm2 is considered as a type II2 reservoir sweet spot. Sandstone with a porosity of 6%–7% and permeability of 0.3 × 10⁻³ μm2 to 1 × 10⁻³ μm2 is considered as a type III reservoir sweet spot.
The porosity index of the reservoir sweet spot was used to truncate and calibrate the log-derived porosity, so that the log-derived porosity data were converted into reservoir sweet spot data (Figure 15). The statistical results showed that the H3 reservoir primarily develops type I sweet spot, type II1 sweet spot and type II2 sweet spot, whose percentages are about 21%, 23% and 26%, respectively. The sweet spot type of the H4 reservoir is similar to that of the H3 reservoir. The sweet spot type of the H4 reservoir mainly develops type I, type II1 and type II2, whose percentages are approximately 16%, 15% and 16%, respectively.
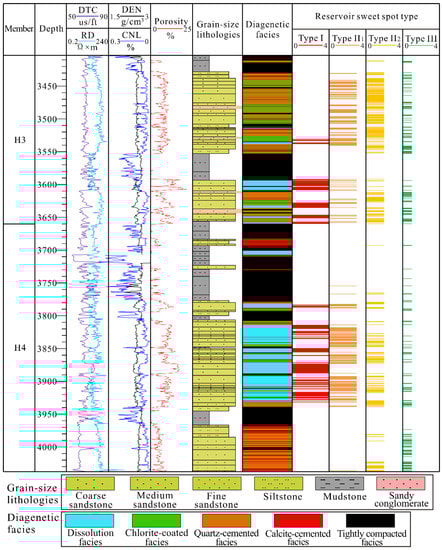
Figure 15.
Comprehensive column of different grain size lithologies, diagenetic facies and reservoir sweet spot of low-permeability and tight sandstones in N1 well in the Jiaxing area, East China Sea Basin.
5. Discussion
5.1. Control of Sedimentation on Reservoir Sweet Spot
5.1.1. Influence of Sedimentary Microfacies
The statistical analysis of the porosity and permeability of different sedimentary microfacies in H3 member (Figure 16) shows that the porosity distribution peak range of the channel bar sedimentary microfacies is 7%–15%, and the permeability presents a bimodal distribution, with peak ranges of 0.1 × 10⁻³–3 × 10⁻³μm2 and 10 × 10−3–1000 × 10−3 μm2, respectively; the porosity distribution peak range of the braided channel sedimentary microfacies is 7%–11%, and the permeability distribution peak range is 0.1 × 10⁻³–3 × 10⁻³ μm2. The porosity distribution peak range of the subaqueous distributary channel sedimentary microfacies in the H4 member is 5%–11%, and the permeability distribution peak range is 0.01 × 10⁻³–1 × 10⁻³ μm2; the peak range of the porosity distribution and the permeability distribution of the channel bar sedimentary microfacies in the H4 member are 7%–13% and 0.1 × 10⁻³–10 × 10−3 μm2, respectively.
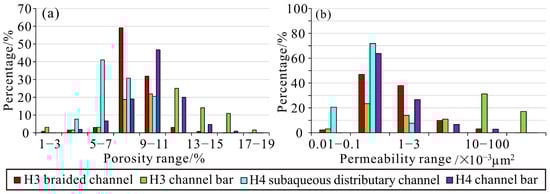
Figure 16.
Histogram of porosity and permeability of different sedimentary microfacies. (a) Porosity histogram of different sedimentary microfacies. (b) Permeability histogram of different sedimentary microfacies.
The relationship between the sedimentary microfacies and reservoir sweet spots in the H3 and H4 members was statistically analyzed. In the H3 sandstone, the type I reservoir sweet spot mainly exists in the channel bar and the braided channel sedimentary microfacies, and the channel bar accounts for more than 85% in the type I reservoir sweet spot. The type II1 reservoir sweet spot is slightly more frequent in the braided channel sedimentary microfacies than in the channel bar sedimentary microfacies. The braided channel and the channel bar sedimentary microfacies account for about 75% and 25% in the type II1 reservoir sweet spot, respectively. The type II2 reservoir sweet spot appears more frequently in the braided channel sedimentary microfacies than in the channel bar sedimentary microfacies, and the braided channel and the channel bar account for approximately 85% and 15% in the type II2 reservoir sweet spot, respectively. The type III reservoir sweet spot occurs in the channel bar and the braided channel sedimentary microfacies, and the channel bar and the braided channel account for about 50% in the type III reservoir sweet spot, respectively (Figure 17a).
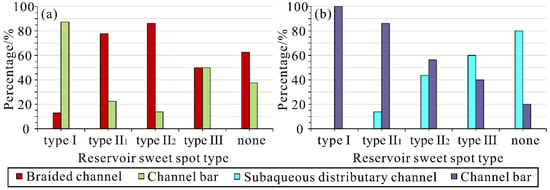
Figure 17.
(a) Histogram of reservoir sweet spot of different sedimentary microfacies in H3 member. (b) Histogram of reservoir sweet spot of different sedimentary microfacies in H4 member.
In the H4 sandstone, the type I reservoir sweet spot chiefly exists in the channel bar and rarely occurs in the subaqueous distributary channel. The type II1 reservoir sweet spot is more frequent in the channel bar sedimentary microfacies than in the subaqueous distributary channel sedimentary microfacies. The proportions of the channel bar and the subaqueous distributary channel in the type II1 reservoir sweet spot are approximately 85% and 15%, respectively. The type II2 reservoir sweet spot is slightly more frequent in the channel bar sedimentary microfacies than in the subaqueous distributary channel sedimentary microfacies. The proportions of the channel bar and the subaqueous distributary channel in the type II2 reservoir sweet spot are about 55% and 45%, respectively. The type III reservoir sweet spot occurs in the subaqueous distributary channel and the channel bar sedimentary microfacies, accounting for about 60% and 40%, respectively (Figure 17b).
5.1.2. Influence of Sandstone Grain Size
The results of the core observation and powder particle size analysis show that the H3 sandstone reservoirs are mainly composed of medium and coarse sandstones, whereas the H4 sandstone reservoirs primarily consist of medium and fine sandstones [32].
The relationship between grain size and reservoir sweet spots in the low-permeability and tight sandstone in the Jiaxing area was investigated. The statistical analysis results of the H3 member showed that the grain sizes of the type I reservoir sweet spot are primarily coarse sandstone and medium sandstone; the grain sizes of the type II1 reservoir sweet spot are chiefly medium sandstone, coarse sandstone and fine sandstone; the grain sizes of the type II2 reservoir sweet spot are mainly medium sandstone, coarse sandstone and sandy conglomerate; and the grain sizes of the type III reservoir sweet spot are mainly coarse sandstone, medium sandstone and fine sandstone (Figure 18a). The relationship between grain size and reservoir sweet spots in the H4 member showed that the grain sizes of the type I reservoir sweet spot are chiefly medium sandstone and coarse sandstone; the grain sizes of the type II1 reservoir sweet spot are primarily medium sandstone, fine sandstone and coarse sandstone; the grain sizes of the type II2 reservoir sweet spot are mainly medium sandstone and fine sandstone; and the grain sizes of the type III reservoir sweet spot are mainly fine sandstone and medium sandstone (Figure 18b). In summary, the reservoir sweet spots of type I and type II1 in the H3 and H4 members are mainly developed in coarse sandstone and medium sandstone, as well as minor fine sandstone and siltstone. Reservoir sweet spot of type II2 is primarily developed in coarse sandstone, medium sandstone and a small amount of fine sandstone and sandy conglomerate. Reservoir sweet spot of type III is mainly developed in fine sandstone, medium sandstone and a small amount of coarse sandstone and siltstone (Figure 18).
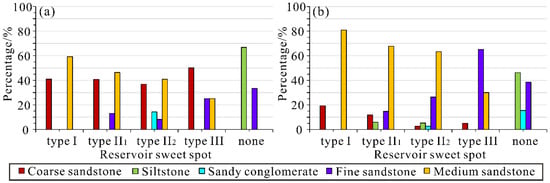
Figure 18.
Relationship between sandstone grain size and reservoir sweet spot. (a) H3 sandstone. (b) H4 sandstone.
5.2. Control of Diagenesis on Reservoir Sweet Spot
5.2.1. Influence of Diagenesis
- (1)
- Influence of compaction
The study results on the influence of compaction on the five diagenetic facies in the H3 member show that the average values of the compactional porosity loss rate of the dissolution facies, chlorite-coated facies, quartz-cemented facies and calcite-cemented facies are 72.73%, 74.8%, 76.03% and 9.15%, respectively (Table 3). The study results on the influence of compaction on the five diagenetic facies in the H4 member show that the average compactional porosity loss rate values of dissolution facies, chlorite-coated facies, quartz-cemented facies, calcite-cemented facies and tightly compacted facies are 76.8%, 74.99%, 75.99%, 46.32% and 78.04%, respectively (Table 3). Relatively speaking, the compactional porosity loss rate of same diagenetic facies in H4 is higher than that in H3.
Table 3.
Statistics of compaction intensity of five diagenetic facies in the H3 and H4 members.
- (2)
- Influence of cementation
The study results on the influence of cementation on the four diagenetic facies in the H3 member show that the average value of the cementation porosity loss rates of the dissolution facies, chlorite-coated facies, quartz-cemented facies and calcite-cemented facies are 8.84%, 9.96%, 11.09% and 90.5%, respectively (Table 4). The study results on the influence of cementation on the five diagenetic facies in the H4 member show that the average cementation porosity loss rate values of the dissolution facies, chlorite-coated facies, quartz-cemented facies, calcite-cemented facies and tightly compacted facies are 10.47%, 13.55%, 16.47%, 47.76% and 16.14%, respectively (Table 4).
Table 4.
Statistics of cementation intensity of five diagenetic facies in the H3 and H4 members.
- (3)
- Influence of dissolution
The study results on the influence of dissolution on the four diagenetic facies in the H3 member show that the average values of the dissolution porosity enhancement rate of the dissolution facies, chlorite-coated facies, quartz-cemented facies and calcite-cemented facies are 17.36%, 15.09%, 13.23% and 9.0%, respectively (Table 5). The study results on the influence of dissolution on the five diagenetic facies in the H4 member show that the average dissolution porosity enhancement rate of the dissolution facies, chlorite-coated facies, quartz-cemented facies, calcite-cemented facies and tightly compacted facies are 16.96%, 17.17%, 14.25%, 14.69% and 12.58%, respectively (Table 5).
Table 5.
Statistics of dissolution intensity of five diagenetic facies in the H3 and H4 members.
5.2.2. Influence of Diagenetic Facies
This section selected the diagenetic facies for reservoir sweet spot evaluation (Figure 19). Type I reservoir sweet spot in H3 is mainly dissolution facies and chlorite-coated facies, which account for 56% and 41%, respectively, in the type I reservoir sweet spot; there is a small part of quartz-cemented facies, accounting for approximately 3%. Type II1 reservoir sweet spot primarily consists of chlorite-coated facies, quartz-cemented facies and dissolution facies, accounting for 48%, 29% and 22%, respectively. Type II2 reservoir sweet spot in the H3 member is similar to type II1 reservoir sweet spot, which primarily occurs in chlorite-coated facies, quartz-cemented facies and dissolution facies, but the occurrence frequency is slightly higher in chlorite-coated facies. Type III reservoir sweet spot is chiefly formed of quartz-cemented facies and calcite-cemented facies, accounting for about 75% and 25%, respectively (Figure 19a).
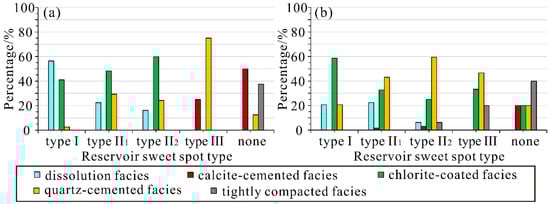
Figure 19.
Histogram of reservoir sweet spot of different diagenetic facies. (a) H3 sandstone. (b) H4 sandstone.
Type I reservoir sweet spot in H4 is mainly composed of chlorite-coated facies, dissolution facies and quartz-cemented facies, which account for 58%, 20% and 20%, respectively, in type I reservoir sweet spot. Type II1 reservoir sweet spot primarily consists of quartz-cemented facies, chlorite-coated facies and dissolution facies, accounting for 43%, 32% and 22%, respectively. Type II2 reservoir sweet spot is similar to type II1 reservoir sweet spot, and it mainly occurs in quartz-cemented facies, chlorite-coated facies and dissolution facies, but the occurrence frequency is slightly higher in chlorite-coated facies. Type III reservoir sweet spot is primarily composed of quartz-cemented facies, chlorite-coated facies and tightly compacted facies, accounting for approximately 46%, 33% and 20%, respectively (Figure 19b).
5.3. Distribution Rule of Reservoir Sweet Spot
When the definition of reservoir sweet spot was used to consider low-permeability and tight sandstone, geologists gave the geological significance of a low-permeability and tight sandstone reservoir sweet spot. Thus, geologists can study the evolution and spatial distribution of a reservoir sweet spot in low-permeability and tight sandstones.
Based on the study of the petrological characteristics, sedimentary characteristics, diagenesis and diagenetic facies of low-permeability and tight sandstones in the H3 and H4 members, the vertical distribution of diagenetic facies was evaluated according to diagenetic facies logging response characteristics. Then, the log-derived porosity was truncated by the porosity index of the reservoir sweet spot, and the spatial distribution of the reservoir sweet spot was analyzed. Based on this, the sedimentary microfacies, grain-size lithologies and diagenetic facies of the type I sweet spot, type II1 sweet spot, type II2 sweet spot, type III sweet spot and non-sweet spot were investigated, and the early diagenesis of different types of reservoir sweet spots and its influence on reservoir quality, as well as middle diagenesis and its influence on reservoir quality, were analyzed in detail.
Type I reservoir sweet spot was mainly developed in the areas of dissolution facies and chlorite-coated facies in the sedimentary microfacies of the channel bar and the braided channel. The controlling factors of this kind of reservoir sweet spot are clean medium-coarse sandstones, chlorite coat and the dissolution of feldspar and rock fragment. Coarse sandstone and medium sandstone had a good sedimentary material foundation, chlorite coat slowed down compaction and inhibited quartz cementation, and the dissolution of feldspar and rock fragments produced secondary pores. The formation of the type I reservoir sweet spot was mainly attributed to: (1) chlorite coat inhibited quartz cementation and thus protected the pore space; (2) dissolution created secondary pores and thus increased the pore space.
Type II1 reservoir sweet spot was primarily distributed in the areas of chlorite-coated facies, dissolution facies and quartz-cemented facies in the sedimentary microfacies of the channel bar, braided channel and subaqueous distributary channel. The controlling factors of this type of reservoir sweet spot are clean medium-fine sandstones, part of chlorite coat and local quartz cementation. Medium sandstone and fine sandstone had a good sedimentary material foundation, and some chlorite coat slowed down compaction and inhibited quartz cementation. The formation of the type II1 reservoir sweet spot was primarily attributed to the following reasons: (1) some chlorite coat inhibited quartz cementation, thus protecting the pore space; (2) local quartz cementation occupied the pore space through quartz overgrowth and authigenic quartz crystals.
Type II2 reservoir sweet spot was mainly developed in the areas of quartz-cemented facies, chlorite-coated facies and tightly compacted facies in the sedimentary microfacies of the subaqueous distributary channel, braided channel and channel bar. The controlling factors of this type of reservoir sweet spot are medium-fine sandstones, quartz cementation and part of chlorite coat. Medium sandstone and fine sandstone had a good sedimentary material foundation, and some chlorite coat slowed down compaction and inhibited quartz cementation to some extent. The formation of the type II2 reservoir sweet spot was primarily attributed to the following reasons: (1) some chlorite coat inhibited quartz cementation, thus protecting pore space; (2) quartz cementation occupied the pore space through quartz overgrowth and authigenic quartz crystals.
Type III reservoir sweet spot was primarily distributed in the areas of tightly compacted facies, calcite-cemented facies and quartz-cemented facies in the sedimentary microfacies of the subaqueous distributary channel, channel bar and braided channel. The controlling factors of this type of reservoir sweet spot are fine sandstone, clay-rich sandstone, mudstone-rich matrix sandstone, compaction, quartz cementation and carbonate cementation. Fine sandstone, clay-rich sandstone and mudstone-rich matrix sandstone had a poor sedimentary material foundation, and these sandstones experienced quartz cementation, compaction and carbonate cementation. The formation of the type III reservoir sweet spot was primarily attributed to the following reasons: (1) quartz cement was developed in the sandstone with a poor chlorite coat; (2) local carbonate cementation occupied the pore space; (3) compaction resulted in the partial destruction of the pore space.
In this study, three parameters—namely, sedimentary microfacies that can reflect the sedimentary material foundation, diagenetic facies that can reflect the present diagenetic products and final reservoir properties, and reservoir sweet spots that can reflect the classification of the reservoir—were selected to investigate the distribution rules of reservoir sweet spots in the H3 and H4 members. The H3 reservoir sweet spot of the N gas field was primarily controlled by sedimentation. The burial depth of H3 sandstone ranges from 3375 m to 3771 m, and the H3 sandstone is mainly medium-strong compaction. The H3 reservoir primarily consists of 19.9% type I sweet spot, 29.59% type II1 sweet spot, 44.39% type II2 sweet spot, 2.04% type III sweet spot and 4.08% non-sweet spot (Figure 20a,b). Type I reservoir sweet spot in the H3 member was mainly developed in the areas of dissolution facies and chlorite-coated facies of the channel bar and the braided channel sedimentary microfacies. Type II1 and II2 reservoir sweet spots were primarily distributed in the areas of chlorite-coated facies and quartz-cemented facies of the braided channel and the channel bar sedimentary microfacies. Type III reservoir sweet spot was chiefly developed in the areas of quartz-cemented facies and calcite-cemented facies of the braided channel and the channel bar sedimentary microfacies. Non-sweet spot was mainly distributed in the areas of tightly compacted facies and calcite-cemented facies of the braided channel and the channel bar sedimentary microfacies.
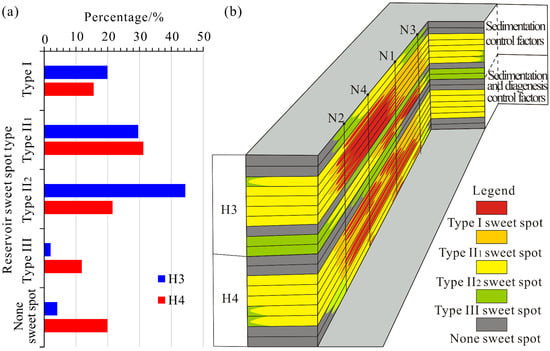
Figure 20.
Spatial distribution of reservoir sweet spot of the H3 and H4 members. (a) Distribution histogram of the H3 and H4 reservoir sweet spot. (b) Pattern diagram of the spatial distribution of H3 and H4 reservoir sweet spot.
The H4 reservoir sweet spot was mainly controlled by sedimentation and diagenesis. The burial depth of the H4 sandstone ranges from 3628 m to 4140 m, and the H4 sandstone is dominated by medium-strong compaction and strong compaction. The H4 reservoir mainly consists of 15.59% type I sweet spot, 31.18% type II1 sweet spot, 21.51% type II2 sweet spot, 11.83% type III sweet spot and 19.89% non-sweet spot (Figure 20a,b). Type I reservoir sweet spot in the H4 member was mainly developed in the areas of dissolution facies, chlorite-coated facies and quartz-cemented facies of the channel bar sedimentary microfacies. Type II1 and II2 reservoir sweet spots were primarily distributed in the areas of chlorite-coated facies and quartz-cemented facies of the channel bar and the subaqueous distributary channel sedimentary microfacies. Type III reservoir sweet spot was primarily developed in the areas of quartz-cemented facies and tightly compacted facies of the subaqueous distributary channel and the channel bar sedimentary microfacies. Non-sweet spot was primarily distributed in the areas of tightly compacted facies, calcite-cemented facies and quartz-cemented facies of the subaqueous distributary channel and the channel bar sedimentary microfacies.
6. Conclusions
The low-permeability and tight sandstone in the H3 and H4 members of the N gas field in the Xihu Sag, East China Sea Basin, provided a good example for studying diagenetic facies, reservoir sweet spots, their controlling factors and distribution rules of low-permeability and tight sandstone. The following three main conclusions were obtained.
- (1)
- The H3 and H4 sandstones in the Xihu Sag mainly developed compaction, calcite cementation, silica cementation, clay mineral conversion and dissolution. The H3 and H4 sandstones were divided into five diagenetic facies, including dissolution facies, chlorite-coated facies, quartz-cemented facies, calcite-cemented facies and tightly compacted facies. Of these, chlorite-coated facies and dissolution facies are favorable diagenetic facies belts.
- (2)
- The H3 reservoir is mainly composed of chlorite-coated facies, dissolution facies and quartz-cemented facies, whereas the H4 reservoir primarily consists of quartz-cemented facies and chlorite-coated facies. The percentages of type I, type II1 and type II2 sweet spots in the H3 reservoir are approximately 21%, 23% and 26%, respectively, whereas the percentages of type I, type II1 and type II2 sweet spots in the H4 reservoir are about 16%, 15% and 16%, respectively.
- (3)
- The distribution rules of reservoir sweet spots of low-permeability and tight sandstone in H3 and H4 were summarized. Type I reservoir sweet spot occurred in the sedimentary microfacies of the channel bar and the braided channel, and its grain-size lithologies were mainly medium sandstone and coarse sandstone, and the diagenetic facies were chlorite-coated facies and dissolution facies. Type II reservoir sweet spot was primarily developed in the sedimentary microfacies of the braided channel, subaqueous distributary channel and channel bar, and its lithologies were medium sandstone, fine sandstone and sandy conglomerate, and the diagenetic facies were quartz-cemented facies, chlorite-coated facies and dissolution facies. Type III reservoir sweet spot was located in the sedimentary microfacies of the subaqueous distributary channel, and its lithologies were fine sandstone, siltstone and medium sandstone, and the diagenetic facies were tightly compacted facies, calcite-cemented facies and quartz-cemented facies.
Author Contributions
Conceptualization, W.W., C.L. and J.L.; methodology, W.W., C.L. and X.Z.; software, W.W. and C.L.; validation, W.W., C.L. and X.Z.; formal analysis, W.W.; resources, W.W., C.L., X.Z., C.D. and L.R.; data curation, W.W.; writing—original draft preparation, W.W.; writing—review and editing, W.W. and C.L.; visualization, W.W.; supervision, W.W., C.L. and X.Z.; project administration, W.W., C.L., X.Z., C.D. and L.R.; funding acquisition, W.W. and C.L. All authors have read and agreed to the published version of the manuscript.
Funding
This research was financially co-funded by the National Natural Science Foundation of China (Grant numbers. 42202144, U19B2006, and 41772139), the Natural Science Foundation of Shandong Province (ZR2022QD048), and the China Postdoctoral Science Foundation (2022M723494).
Data Availability Statement
The data that support the findings of this study are available from the corresponding author upon reasonable request.
Conflicts of Interest
The authors declare no conflict of interest.
References
- Salem, A.M.; Ketzer, J.; Morad, S.; Rizk, R.R.; Al-Aasm, I. Diagenesis and Reservoir-Quality Evolution of Incised-Valley Sandstones: Evidence from the Abu Madi Gas Reservoirs (Upper Miocene), the Nile Delta Basin, Egypt. J. Sediment. Res. 2005, 75, 572–584. [Google Scholar] [CrossRef]
- McKinley, J.M.; Atkinson, P.; Lloyd, C.; Ruffell, A.H.; Worden, R.H. How Porosity and Permeability Vary Spatially with Grain Size, Sorting, Cement Volume, and Mineral Dissolution In Fluvial Triassic Sandstones: The Value of Geostatistics and Local Regression. J. Sediment. Res. 2011, 81, 844–858. [Google Scholar] [CrossRef]
- Dar, Q.U.Z.; Pu, R.; Baiyegunhi, C.; Shabeer, G.; Ali, R.I.; Ashraf, U.; Sajid, Z.; Mehmood, M. The impact of diagenesis on the reservoir quality of the early Cretaceous Lower Goru sandstones in the Lower Indus Basin, Pakistan. J. Pet. Explor. Prod. Technol. 2021, 12, 1437–1452. [Google Scholar] [CrossRef]
- Taylor, T.R.; Giles, M.R.; Hathon, L.A.; Diggs, T.N.; Braunsdorf, N.R.; Birbiglia, G.V.; Kittridge, M.G.; Macaulay, C.I.; Espejo, I.S. Sandstone diagenesis and reservoir quality prediction: Models, myths, and reality. AAPG Bull. 2010, 94, 1093–1132. [Google Scholar] [CrossRef]
- Wang, E.Z.; Liu, G.Y.; Pang, X.Q.; Wu, Z.Y.; Li, C.R.; Bai, H.; Zhang, Z.H. Sedimentology, diagenetic evolution, and sweet spot prediction of tight sandstone reservoirs: A case study of the third member of the Upper Paleogene Shahejie Formation, Nanpu, Bohai Bay Basin, China. J. Pet. Sci. Eng. 2020, 186, 106718. [Google Scholar] [CrossRef]
- Bjorlykke, K.; Jahren, J. Open or closed geochemical systems during diagenesis in sedimentary basins: Constraints on mass transfer during diagenesis and the prediction of porosity in sandstone and carbonate reservoirs. AAPG Bull. 2012, 96, 2193–2214. [Google Scholar] [CrossRef]
- Kassab, M.A.; Hassanain, I.M.; Salem, A.M. Petrography, diagenesis and reservoir characteristics of the Pre-Cenomanian sandstone, Sheikh Attia area, East Central Sinai, Egypt. J. Afr. Earth Sci. 2014, 96, 122–138. [Google Scholar] [CrossRef]
- Makeen, Y.M.; Abdullah, W.H.; Ayinla, H.A.; Hakimi, M.H.; Sia, S.-G. Sedimentology, diagenesis and reservoir quality of the upper Abu Gabra Formation sandstones in the Fula Sub-basin, Muglad Basin, Sudan. Mar. Pet. Geol. 2016, 77, 1227–1242. [Google Scholar] [CrossRef]
- Yuan, G.H.; Cao, Y.C.; Gluyas, J.; Cao, X.; Zhang, W.B. Petrography, fluid-inclusion, isotope, and trace- element constraints on the origin of quartz cementation and feldspar dissolution and the associated fluid evolution in arkosic sandstones. AAPG Bull. 2018, 102, 761–792. [Google Scholar] [CrossRef]
- Qiu, Z.; Zou, C. Controlling factors on the formation and distribution of “sweet-spot areas” of marine gas shales in South China and a preliminary discussion on unconventional petroleum sedimentology. J. Asian Earth Sci. 2019, 194, 103989. [Google Scholar] [CrossRef]
- Cui, Y.F.; Wang, G.W.; Jones, S.J.; Zhou, Z.L.; Ran, Y.; Lai, J.; Li, R.J.; Deng, L. Prediction of diagenetic facies using well logs—A case study from the upper Triassic Yanchang Formation, Ordos Basin, China. Mar. Pet. Geol. 2017, 81, 50–65. [Google Scholar] [CrossRef]
- Mansurbeg, H.; Morad, S.; Salem, A.; Marfil, R.; El-Ghali, M.; Nystuen, J.; Caja, M.; Amorosi, A.; Garcia, D.; La Iglesia, A. Diagenesis and reservoir quality evolution of palaeocene deep-water, marine sandstones, the Shetland-Faroes Basin, British continental shelf. Mar. Pet. Geol. 2008, 25, 514–543. [Google Scholar] [CrossRef]
- Nguyen, B.T.T.; Jones, S.; Goulty, N.R.; Middleton, A.J.; Grant, N.; Ferguson, A.; Bowen, L. The role of fluid pressure and diagenetic cements for porosity preservation in Triassic fluvial reservoirs of the Central Graben, North Sea. AAPG Bull. 2013, 97, 1273–1302. [Google Scholar] [CrossRef]
- Wu, D.; Liu, S.; Chen, H.; Lin, L.; Yu, Y.; Xu, C.; Pan, B. Investigation and prediction of diagenetic facies using well logs in tight gas reservoirs: Evidences from the Xu-2 member in the Xinchang structural belt of the western Sichuan Basin, western China. J. Pet. Sci. Eng. 2020, 192, 107326. [Google Scholar] [CrossRef]
- Ozkan, A.; Cumella, S.P.; Milliken, K.L.; Laubach, S.E. Prediction of lithofacies and reservoir quality using well logs, Late Cretaceous Williams Fork Formation, Mamm Creek field, Piceance Basin, Colorado. AAPG Bull. 2011, 95, 1699–1723. [Google Scholar] [CrossRef]
- Lai, J.; Wang, G.; Wang, S.; Cao, J.; Li, M.; Pang, X.; Zhou, Z.; Fan, X.; Dai, Q.; Yang, L.; et al. Review of diagenetic facies in tight sandstones: Diagenesis, diagenetic minerals, and prediction via well logs. Earth-Sci. Rev. 2018, 185, 234–258. [Google Scholar] [CrossRef]
- Zeng, H.; Zhu, X.; Zhu, R.; Zhang, Q. Seismic prediction of sandstone diagenetic facies: Applied to Cretaceous Qingshankou Formation in Qijia Depression, Songliao Basin, East China. Pet. Explor. Dev. 2013, 40, 287–2954. [Google Scholar] [CrossRef]
- Anees, A.; Zhang, H.; Ashraf, U.; Wang, R.; Thanh, H.V.; Radwan, A.E.; Ullah, J.; Abbasi, G.R.; Iqbal, I.; Ali, N.; et al. Sand-ratio distribution in an unconventional tight sandstone reservoir of Hangjinqi area, Ordos Basin: Acoustic impedance inversion-based reservoir quality prediction. Front. Earth Sci. 2022, 10. [Google Scholar] [CrossRef]
- Ashraf, U.; Anees, A.; Shi, W.Z.; Wang, R.; Ali, M.; Jiang, R.; Thanh, H.V.; Iqbal, I.; Zhang, X.N.; Zhang, H.C. Estimation of porosity and facies distribution through seismic inversion in an unconventional tight sandstone reservoir of Hangjinqi area, Ordos basin. Front. Earth Sci. 2022, 10, 1014052. [Google Scholar] [CrossRef]
- Zou, C.N.; Tao, S.Z.; Zhou, H.; Zhang, X.-X.; He, D.-B.; Zhou, C.-M.; Wang, L.; Wang, X.S.; Li, F.-H.; Zhu, R.-K.; et al. Genesis, classification, and evaluation method of diagenetic facies. Pet. Explor. Dev. 2008, 35, 526–540. [Google Scholar] [CrossRef]
- Sun, L.D.; Zhao, W.Z.; Liu, H.; Zhu, R.K.; Bai, B.; Kang, Y.; Zhang, J.Y.; Wu, S.T. Concept and application of “sweet spot” in shale oil. Acta Pet. Sin. 2023, 44, 1–13. [Google Scholar]
- Zhang, S.; Liu, H.; Liu, Y.; Wang, Y.; Wang, M.; Bao, Y.; Hu, Q.; Li, Z.; Zhang, S.; Yao, S.; et al. Main controls and geological sweet spot types in Paleogene shale oil rich areas of the Jiyang Depression, Bohai Bay basin, China. Mar. Pet. Geol. 2019, 111, 576–587. [Google Scholar] [CrossRef]
- Popov, M.A.; Nuccio, V.F.; Dyman, T.S.; Gognat, T.A.; Johnson, R.C.; Schmoker, J.W.; Wilson, M.S.; Bartberger, C. Basin-Centered Gas Systems of the U.S. USGS; U.S. Geological Survey: Reston, VA, USA, 2000; pp. 5–299.
- Law, B.E. Basin-centered gas systems. AAPG Bull. 2002, 86, 1891–1919. [Google Scholar]
- Yang, S.Y.; Zhang, J.C.; Huang, W.D.; Zhang, Y.; Tang, X. “Sweet spot” types of reservoirs and genesis of tight sandstone gas in Kekeya area, Turpan-Hami Basin. Acta Pet. Sin. 2013, 34, 272–282. [Google Scholar]
- Lai, J.; Wang, G.; Ran, Y.; Zhou, Z.; Cui, Y. Impact of diagenesis on the reservoir quality of tight oil sandstones: The case of Upper Triassic Yanchang Formation Chang 7 oil layers in Ordos Basin, China. J. Pet. Sci. Eng. 2016, 145, 54–65. [Google Scholar] [CrossRef]
- Morad, S.; Al-Ramadan, K.; Ketzer, J.M.; De Ros, L.F. The impact of diagenesis on the heterogeneity of sandstone reservoirs: A review of the role of depositional facies and sequence stratigraphy. AAPG Bull. 2010, 94, 1267–1309. [Google Scholar] [CrossRef]
- Wang, W.G.; Lin, C.Y.; Zhang, X.G.; Dong, C.M.; Ren, L.H.; Lin, J.L. Effect of burial history on diagenetic and reservoir-forming process of the Oligocene sandstones in Xihu sag, East China Sea Basin. Mar. Pet. Geol. 2019, 112, 104034. [Google Scholar] [CrossRef]
- Lou, M.; Cai, H.; He, X.; Liu, Y.; Huang, X.; Zhang, X.; Liu, H. Application of seismic sedimentology in characterization of fluvial-deltaic reservoirs in Xihu sag, East China Sea shelf basin. Pet. Explor. Dev. 2023, 50, 138–151. [Google Scholar] [CrossRef]
- Ye, J.; Qing, H.; Bend, S.L.; Gu, H. Petroleum systems in the offshore Xihu Basin on the continental shelf of the East China Sea. AAPG Bull. 2007, 91, 1167–1188. [Google Scholar] [CrossRef]
- Folk, R.L.; Andrews, P.B.; Lewis, D.W. Detrital sedimentary rock classification and nomenclature for use in New Zealand. New Zealand J. Geol. Geophys. 1970, 13, 937–968. [Google Scholar] [CrossRef]
- Wang, W.; Lin, C.; Zhang, X.; Dong, C.; Ren, L.; Lin, J. Provenance, clastic composition and their impact on diagenesis: A case study of the Oligocene sandstone in the Xihu sag, East China Sea Basin. Mar. Pet. Geol. 2020, 126, 104890. [Google Scholar] [CrossRef]
- Abbas, A.; Zhu, H.; Zeng, Z.; Zhou, X. Sedimentary facies analysis using sequence stratigraphy and seismic sedimentology in the Paleogene Pinghu Formation, Xihu Depression, East China Sea Shelf Basin. Mar. Pet. Geol. 2018, 93, 287–297. [Google Scholar] [CrossRef]
- Kashihara, K.; Tsuji, T. Improvement in facies discrimination using multipleseismic attributes for permeability modelling of the Athabasca Oil Sands, Canada. Explor. Geophys. 2010, 41, 80–87. [Google Scholar] [CrossRef]
- Zou, C.N.; Li, X.J.; Zhu, R.K.; Wan, J.Y.; Li, J.Z.; Hu, Y.; Shi, L.; Hui, K.Y. SY/T 6832-2011 Geological Evaluating Methods for Tight Sandstone Gas; Petroleum Industry Press: Beijing, China, 2011; pp. 1–5. [Google Scholar]


Disclaimer/Publisher’s Note: The statements, opinions and data contained in all publications are solely those of the individual author(s) and contributor(s) and not of MDPI and/or the editor(s). MDPI and/or the editor(s) disclaim responsibility for any injury to people or property resulting from any ideas, methods, instructions or products referred to in the content. |
© 2023 by the authors. Licensee MDPI, Basel, Switzerland. This article is an open access article distributed under the terms and conditions of the Creative Commons Attribution (CC BY) license (https://creativecommons.org/licenses/by/4.0/).