Article

Modelling Flocculation in a Thickener Feedwell Using a Coupled Computational Fluid Dynamics–Population Balance Model

1
College of Mining Engineering, Taiyuan University of Technology, Taiyuan 030024, China
2
Engineering Research Center of Ecological Mining in Shanxi Province, Taiyuan University of Technology, Taiyuan 030024, China
*
Author to whom correspondence should be addressed.
Minerals 2023, 13(3), 309; https://doi.org/10.3390/min13030309
Submission received: 19 January 2023 / Revised: 16 February 2023 / Accepted: 20 February 2023 / Published: 22 February 2023
(This article belongs to the Special Issue Advances in Mineral Processing and Process Engineering)

Abstract

:
The flocculation that takes place in the central feedwell of the thickener plays a crucial role in the coal-slurry thickening process, which is not only complex but also largely influenced by the flow characteristics. A coupled computational fluid dynamics–population balance model (CFD–PBM) was used to model the complex flocculation-thickening behaviour in an industrial-scale gravity thickener. The initialisation parameters of the inlet flow were obtained through self-designed image-recognition experiments, and then the effects of different types of conical deflectors on the floc distribution were simulated and analysed using them. The results showed that, under the condition that the angle of the conical deflector’s sides in the vertical plane was known, a reasonable increase in the height of the bottom surface could reduce the annular spanwise vortices at the underflow of the feedwell, thereby avoiding the erosion of the inlet flow and the annular spanwise vortex on the floc deposition layer. However, excessive height on the part of the conical deflector could affect the flocculation effect of solid particles. For the same central feedwell size of the thickener as in the simulation, the best flocculation effect was achieved at an angle of α = 24° in the vertical plane of the conical deflector. Turbulence regulation of the conical deflector promotes the aggregation of fine particles in the fluid of the feedwell, providing a new method for the intensification of the flocculation-concentration process.

1. Introduction

Wet coal preparation is an important technique for the clean and efficient utilisation of coal. The coal wastewater generated by washing, which runs to billions of cubic metres per year, is usually purified and reused via concentration and pressure filtration [1]. The thickening process is mainly realised via a coal-slurry thickener [2]. To reduce floc breakage due to the excessive feed flow velocity of the thickener and enable better flocculation of fine particles and small-scale flocs, adding a deflector at the feed inlet of the central feedwell can effectively regulate the turbulent flow in part of the fluid zone. Particle collision flocculation occurs primarily in turbulent environments [3], with the motion of fine particles being strongly influenced by the turbulent minimum vortex scale. The vortex formed by the inflow guided by the deflector is the main source of power for further flocculation, being essentially a combination of the turbulent shear and reaction residence time, which is usually evaluated in practice by the size of the flocs [4,5]. Feed particles require only a short time to flocculate and grow after contact with flocculants—for example, in a reasonably mixed feedwell, the residence time of the particles typically does not exceed 10 s [6]. However, to dissipate the initial energy of the feed flow, the infeed flow must remain in the feedwell for a sufficient amount of time. Practically, the addition of a conical deflector to the vertical feedwell can effectively extend the residence time of the material in the central feedwell. The conical deflector, which is an important design element of “closed” feedwells, is widely used in thickening processes, most notably in the “Supaflo” feedwell [7,8,9,10]. Moreover, high turbulent shear rates usually improve flocculation efficiency by increasing the mixing and particle collision rates. However, flocculation breakage also increases considerably at high shear rates [11,12]. As a result, the floc size follows a similar trend—that is, the average floc size first increases with the turbulent shear rate before decreasing to some extent. Finally, the coalescence and fragmentation rates are in dynamic equilibrium, resulting in a relatively stable floc size distribution. Additionally, with the help of a conical deflector, the vertical downward feed-flow rate of the central feedwell can be reduced, effectively avoiding floc fragmentation and damage to the sediment layer caused by collisions between the high-speed moving feed jet and the sediment layer.
In this study, the effective distribution of thickener materials in the central feedwell was enhanced by changing the position and angle of the conical deflector to adjust the distribution of the macroscopic vortex and microvortex. This could, in turn, enhance the thickener concentration efficiency and improve the coal sludge water treatment capacity and treatment efficiency of coal processing plants. Consequently, our examination of the flow-field characteristics and distribution behaviour of the fine particles and flocs in the thickener central feedwell for the purpose of thickener structure optimisation and production efficiency improvement is of practical importance.
For the internal flow field of a central feedwell, the effective collision efficiency depends not only on the mixing and adsorption properties of the flocculant solution but can also be influenced by the turbulent effects of fluid transport and the interaction between the breakage and flocculation of flocs in motion [13,14,15,16,17,18,19]. Turbulent flow can be regarded as a flow formed by the superposition and combination of vortices of different scales, with the scale size of these vortices and their rotation direction being randomly distributed. Moreover, the size of large-scale vortices approximates the size of the flow field, with its main determining condition being the boundary condition of the flow field. Large-scale vortices are the main cause of low-frequency pulsations. The continuous rupture of large-scale vortices leads to a decrease in the vortex scale until the smallest scale vortices are generated, with the size of small-scale vortices being approximately 1/1000 of the magnitude of the flow-field scale. Its main determining condition is the viscous force of the fluid, and small-scale vortices are the main cause of high-frequency pulsations [20,21,22]. Whether or not the fluid flow generates vortices has a strong bearing on the motion state of the particles. Studies have shown that the closer the microvortex scale is to the particle scale, the more favourable it is for mutual collisions between particles [23]. To make reasonable use of vortices, it is necessary to have a clear understanding of their essential mechanism and to promote collisional flocculation between fine-particle–fine-particles, floc–flocs, and fine-particle–flocs. Moreover, the presence of a large number of disordered turbulent vortex structures in the jet flow field gives the particles a good flocculation effect [24].
The kinetics of the flow field and the flocculation and fragmentation of the flocs are typically quantified using numerical models [25]. In such models, the particle coalescence and floc fragmentation in the internal and external flow fields of the feedwell can be effectively simulated via the coupled computational fluid dynamics–population balance model (CFD–PBM) method [26,27,28]. Frungieri and Vanni obtained detailed predictions of the aggregation and breakage in shear suspensions by coupling between Stokes dynamics and a general equilibrium model solved stochastically [29]. More recently, Frungieri et al. combined CFD with a discrete element method characterisation to establish a macroscopic PBM describing the fluid-induced particle breakage processes in industrial equipment [30]. In recent years, coupled CFD–PBMs have been applied in various fields, such as bubble aggregation and breakage in gas–liquid two-phase flow [31,32,33], droplet size distribution changes and droplet mixing, breakage, and coalescence in liquid–liquid two-phase flow [34,35,36,37], solid particle fragmentation and flocculation in solid–liquid two-phase flow [38,39], and phase changes in solid–liquid–gas three-phase flow [40]. Consequently, the CFD–PBM method plays an important role in the study of the flocculation and fragmentation of solid particles in mining wastewater and mineral slurries [14,26,41]. In this study, changing the volume of the central feedwell in the same proportion had an enormous impact on the internal flow field, making it difficult to conduct laboratory experiments. Based on the development of process-intensification-based solid–liquid separation equipment, numerical simulations were used to study the internal mixed fluid and floc movement regulation, analyse the floc distribution regulation, and provide a theoretical basis and data support for the optimisation of the thickener’s structural parameters.

2. Materials and Methods

2.1. Mathematical Model

2.1.1. Multiphase Flow Model

The Euler–Euler approach was used in the numerical simulations to describe the liquid–solid interaction through transient solutions. In the Eulerian–Eulerian model framework, the solid phase is assumed to be continuous, with the interaction between the liquid and solid phases being solved by introducing the phase volume fraction as a continuous function of time and space [42,43,44,45]. The simulations used a multi-fluid granular model to describe the flow behaviour of fluid–solid mixtures. Considering the inelasticity of the particle phase, the solid phase pressure was derived by analogising the random particle motion resulting from interparticle collisions to the thermal motion of molecules in a gas. As in the case of gases, the intensity of the particle velocity fluctuations determines the pressure, viscosity, and pressure of the solid phase. The kinetic energy associated with particle velocity fluctuations is proportional to the mean square of the random motion [46,47,48]. The liquid and solid phases share a common pressure field, and the two sets of mass and momentum conservation equations for the liquid and solid phases can be solved as follows [48,49,50]:
t ( φ l ρ l ) + · ( φ l ρ l U l ) = 0
t ( φ s ρ s ) + · ( φ s ρ s U s ) = 0
t ( φ l ρ l ) + · ( φ l ρ l U l ) = φ l P + · τ l ¯ ¯ + φ l ρ l g + K s l U s l
t ( φ s ρ s ) + · ( φ s ρ s U s ) = φ s P P s + · τ s ¯ ¯ + φ s ρ s g + K l s U l s
where φ, ρ, U, P, Ps, g, K, and  τ ¯ ¯ denote the volume fraction, density, velocity vector, pressure shared by all the phases, solid pressure, gravitational acceleration, moment exchange coefficient, and stress–strain tensor, respectively (the subscripts l and s denote the liquid and solid phases, respectively), and Kls = Ksl.
The liquid–solid phase exchange coefficients can be expressed using the Wen–Yu model as follows [51]:
K s l = 3 4 C D φ s φ l ρ l | U s U l | d s φ l 2.65
where  ρ l denotes the fluid phase density,  d s denotes the particle size of solid particles,  C D = 24 φ l Re s [ 1 + 0.15 ( φ l Re s ) 0.687 ] Re s denotes the particle Reynolds number [52],  Re s = ρ l d s | U s U l | μ l , and  μ l denotes the hydrodynamic viscosity.

2.1.2. Turbulence Model

Solving the Reynolds-averaged Navier–Stokes (RANS) equations greatly reduces the computational overhead. Consequently, the RANS method is now used to solve engineering problems. Due to the inhomogeneity of the solid–liquid flow field in the concentrator, a phase-interaction turbulence model can be used. Moreover, two-equation turbulence models—especially the kε model—are widely used in industrial CFD simulations of concentrators owing to their stability, computational efficiency, and reasonable accuracy [12,28,44,53,54]. As a modified version of the standard kε turbulence model, the renormalisation group (RNG) kε turbulence model improves the accuracy for fast strain and eddy flows—which usually occur in the thickener feedwell—by introducing an additional term in the ε equation. Consequently, the RNG kε turbulence model was chosen for the simulations to describe the complex turbulent fluctuations. The transport equations for the turbulent kinetic energy and turbulent energy dissipation can be expressed as follows:
t ( ρ k ) + x i ( ρ k u i ) = x j ( α k ( μ + μ t σ k ) k x j ) + G k + G b ρ ε Y M
t ( ρ ε ) + x i ( ρ ε u i ) = x j ( α ε ( μ + μ t σ ε ) ε x j ) + C 1 ε ε k ( G k + C 3 ε G b ) C 2 ε ρ ε 2 k
where k, ε, μ, and μt denote the turbulent kinetic energy, turbulent kinetic energy dissipation rate, dynamic liquid viscosity, and turbulent viscosity, respectively,  μ t = 0.0845 ρ K 2 ε C 2 ε = 1.68 + 0.0845 ρ η 3 ( 1 η / 4.377 ) 1 + 0.0012 η 3 η = K ε S ¯ S ¯ = 2 S i j ¯ S i j ¯ S i j ¯ = 1 2 ( u i ¯ x j + u j ¯ x i ) α k = α ε = 1.39 C 1 ε = 1.42 σ k = 1.0 σ ε = 1.2 , and  G k G b , and  C 3 ε G b denote the production terms of the viscous force, buoyancy force on the kinetic energy, and buoyancy force on the dissipation rate, respectively.

2.1.3. Aggregation Kernel in the PBM

In turbulent flow, large-scale vortices continuously gain energy from the main fluid, with the energy then being gradually transferred to small vortices through the interaction between different-scale vortices and same-scale vortices. Finally, because the continuous action of the fluid viscous forces leads to energy dissipation, the small-scale vortices gradually disappear and the mechanical energy in the turbulent fluid is converted into the internal energy of the fluid. Based on the Kolmogorov turbulent microvortex theory, the minimum vortex scale (λ) can be mathematically characterised as follows [55]:
λ = ( υ 3 / ε ) 1 / 4
where ν denotes the kinematic viscosity of the fluid (m2·s−1) and ε denotes the effective energy dissipated per unit mass of water (m2·s−3).
In turbulent flow fields, aggregation can occur through two mechanisms—the first being the viscous subrange mechanism, which applies when the particles are smaller than the Kolmogorov microscale [56], with the collision rate being expressed as follows:
a ( V i , V j ) = ς T 8 π 15 γ ˙ ( L i + L j ) 3 8
where  ς T denotes the pre-factor for the capture efficiency parameter considering turbulent collisions,  γ ˙ denotes the shear rate, and  γ ˙ = ( ε / υ ) 0 . 5 . Li and Lj denote the particle characteristic sizes.
The second aggregation mechanism—that is, the inertial subrange mechanism—is applicable when the particles are larger than the Kolmogorov microscale. For the inertial subrange, the particles are larger than the smallest vortices, meaning they are dragged by the velocity fluctuations in the flow field [57], with the aggregation rate being expressed as follows:
a ( V i , V j ) = ς T 2 3 / 2 π ( L i + L j ) 2 4 ( U i 2 + U j 2 )
where  U i 2 denotes the squared mean velocity of the particle,  ς T = 0.732 ( 5 N T ) 0.242 ; N T 5 N T denotes the ratio between the viscous and van der Waals forces,  N T = 6 π μ ( L i + L j ) 3 λ ˙ 8 H H denotes the Hamaker constant,  λ ˙ denotes the deformation rate, and  λ ˙ = ( 4 ε 15 π ν ) 0.5 .

2.1.4. Breakage Kernel in the PBM

Flocculation is a dynamic balance between aggregation and breakage in a coal-slurry thickener. Process variables—for example, the turbulent dissipation rate, flocculant dosage, and coal-slurry viscosity—have an important effect on floc fragmentation (which is considered in the flocculation model). As coal-slurry flocs are aggregated solid particles, the breakage frequency can be chosen using the Ghadiri model, while the fragmentation probability density distribution function uses the multiple fragmentation generalised function, with the fragmentation frequency being defined as follows [58,59]:
g ( V ) = K b U i 2 L 5 / 3
where L denotes the particle diameter before crushing, Kb is the breakage constant,  K b ρ E 2 / 3 Γ 5 / 3 ρ denotes the particle density, E denotes the particle elastic modulus, and  Γ denotes the particle surface energy.
The fragment size distribution used in the PBM is shown in Table 1.

2.2. Structure and Meshing

The central feedwell in this numerical simulation is the central feedwell of a central-agitator-type coal-slurry thickener, which is fed vertically downward. The lower part of the inlet is equipped with a buffer deflector to reduce the feeding velocity, while the conical buffer deflector is connected to the central agitator shaft and rotates at the same angular velocity during operation. The barrel is equipped with 16 radial diversion ports, with the material outlets being placed in the sediment layer of the thickener, the structure of which is shown in Figure 1. Figure 1a,b show the structure and dimensions of the thickener and feedwell, respectively. In the model, most of the transport from the storage tank to the feedwell could be neglected—that is, a 1760 mm long feed pipe was simulated together with the internal and external flow fields to the central feedwell of the thickener. In all cases in this study, the air domain above the liquid–gas interface could be neglected. Additionally, only a small part of the flow field outside the feedwell was simulated, ignoring most of the flow field inside the concentrator.
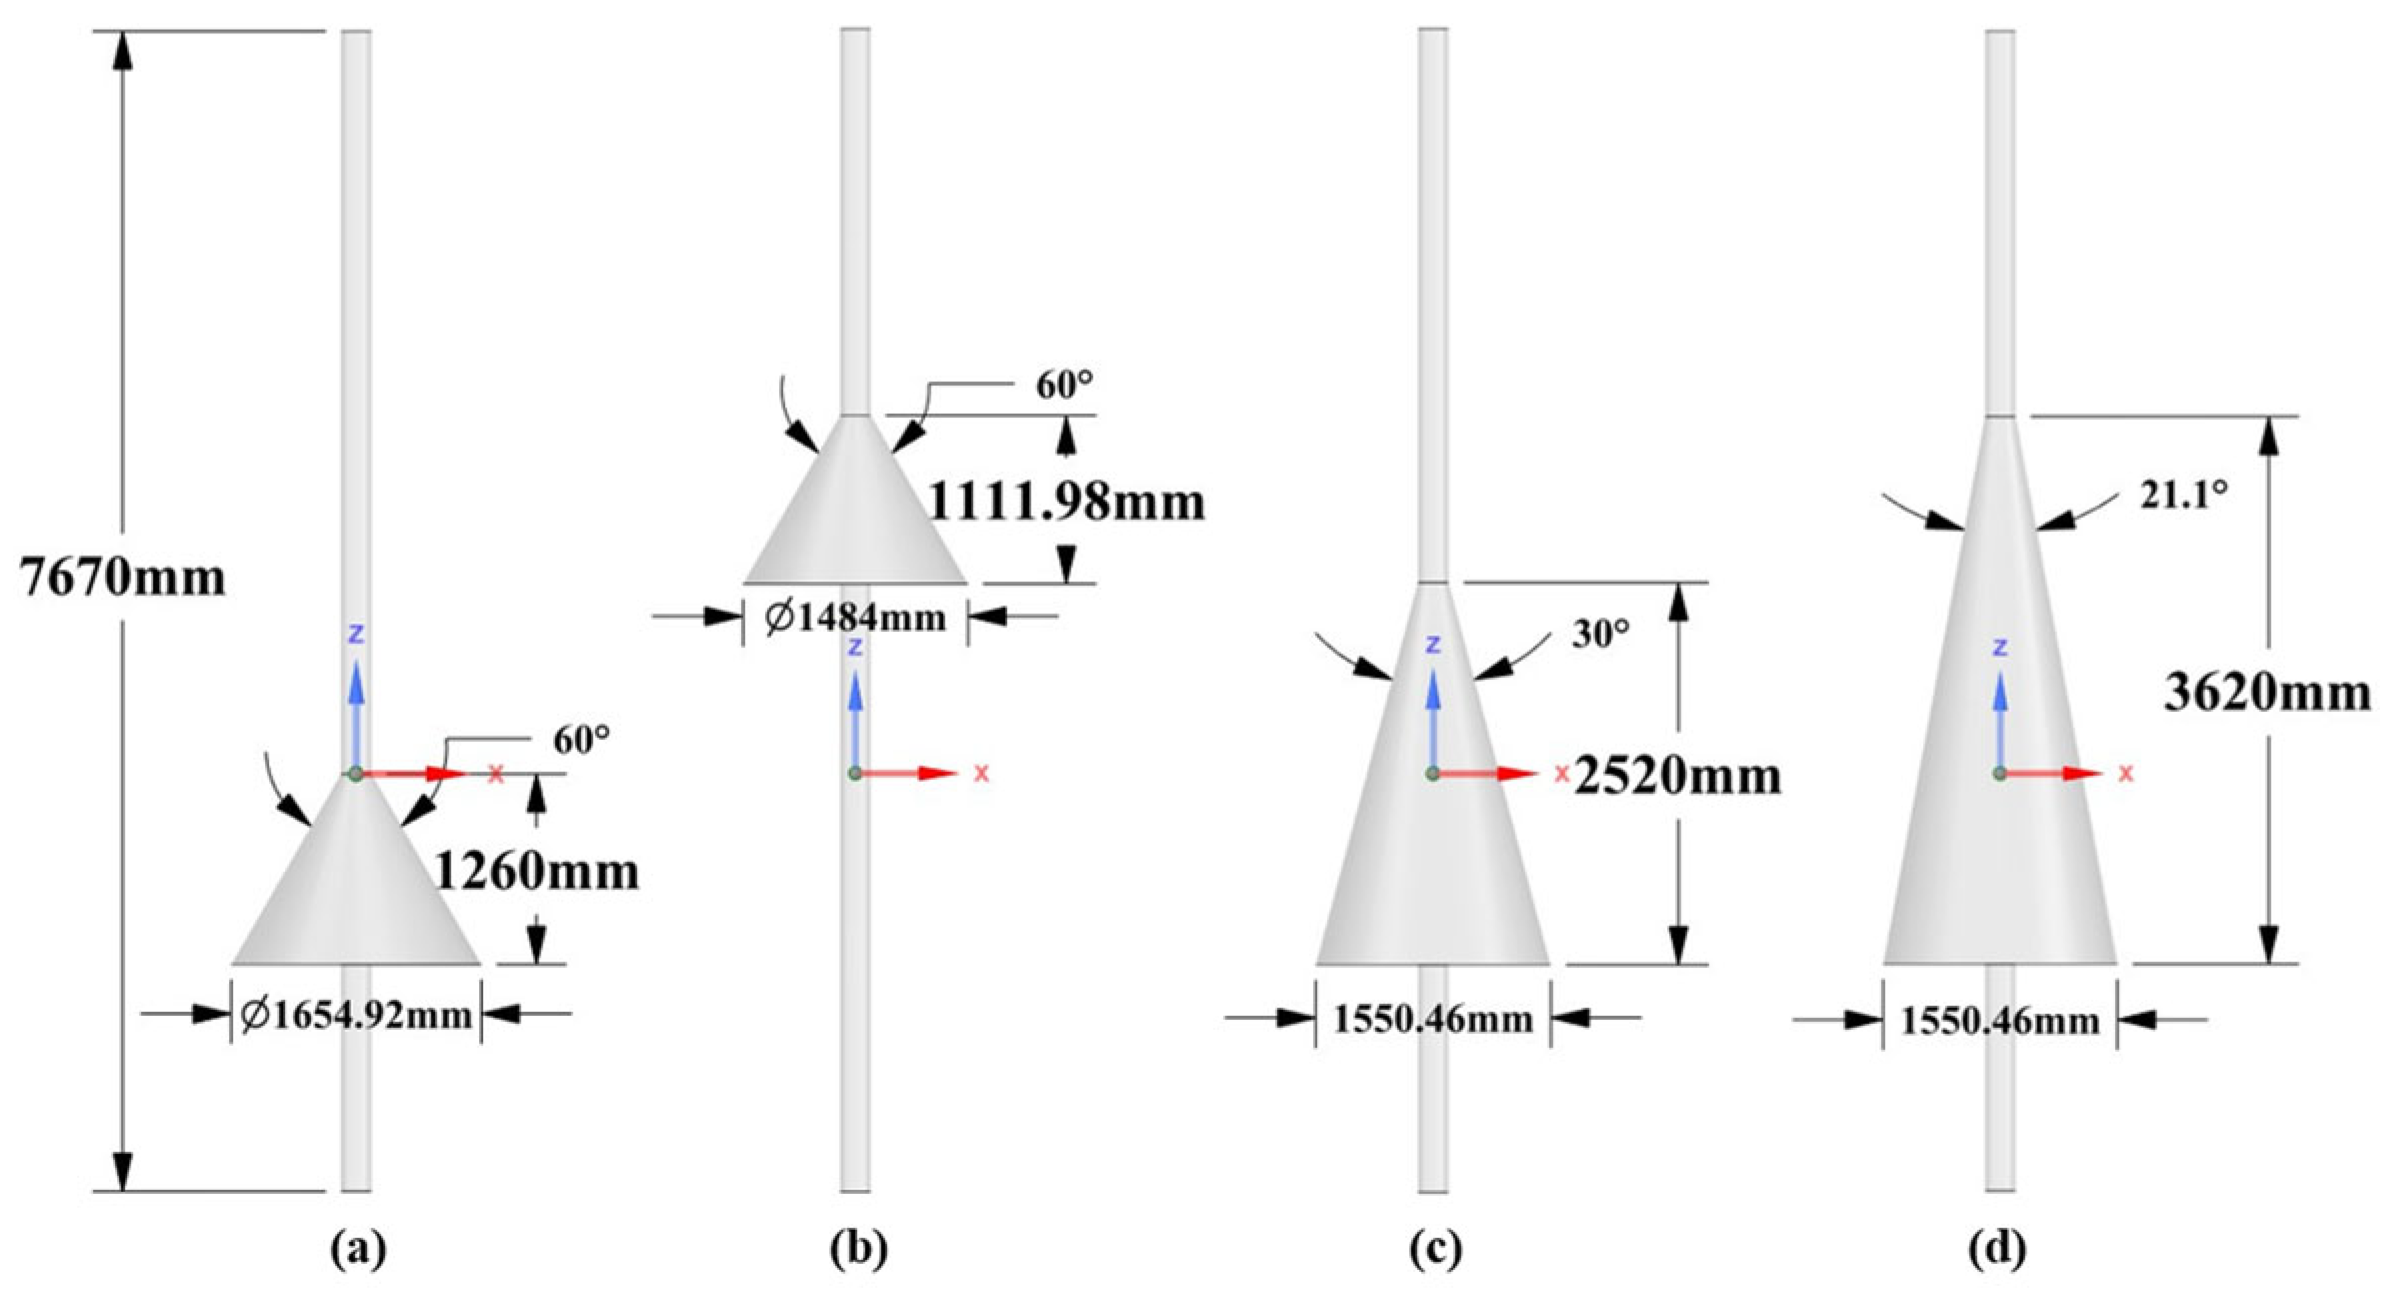
The structure of the conical buffer deflector is shown in Figure 2, including the central rotating stirring shaft and conical deflector. The stirring shaft is a solid cylinder of length L = 7670 mm and diameter d = 200 mm. The angle is αa = αb = 60° for the sides of the conical deflector in the vertical plane of models (a) and (b); however, the bottom height of the conical deflector in (b) is 1766 mm higher than that in (a). The bottom heights of models (c) and (d) are equal to those of (a), whereas the angles (α) for the sides of the conical deflector in the vertical plane of (c) and (d) are αc = 30° and αd = 21.1°, respectively.
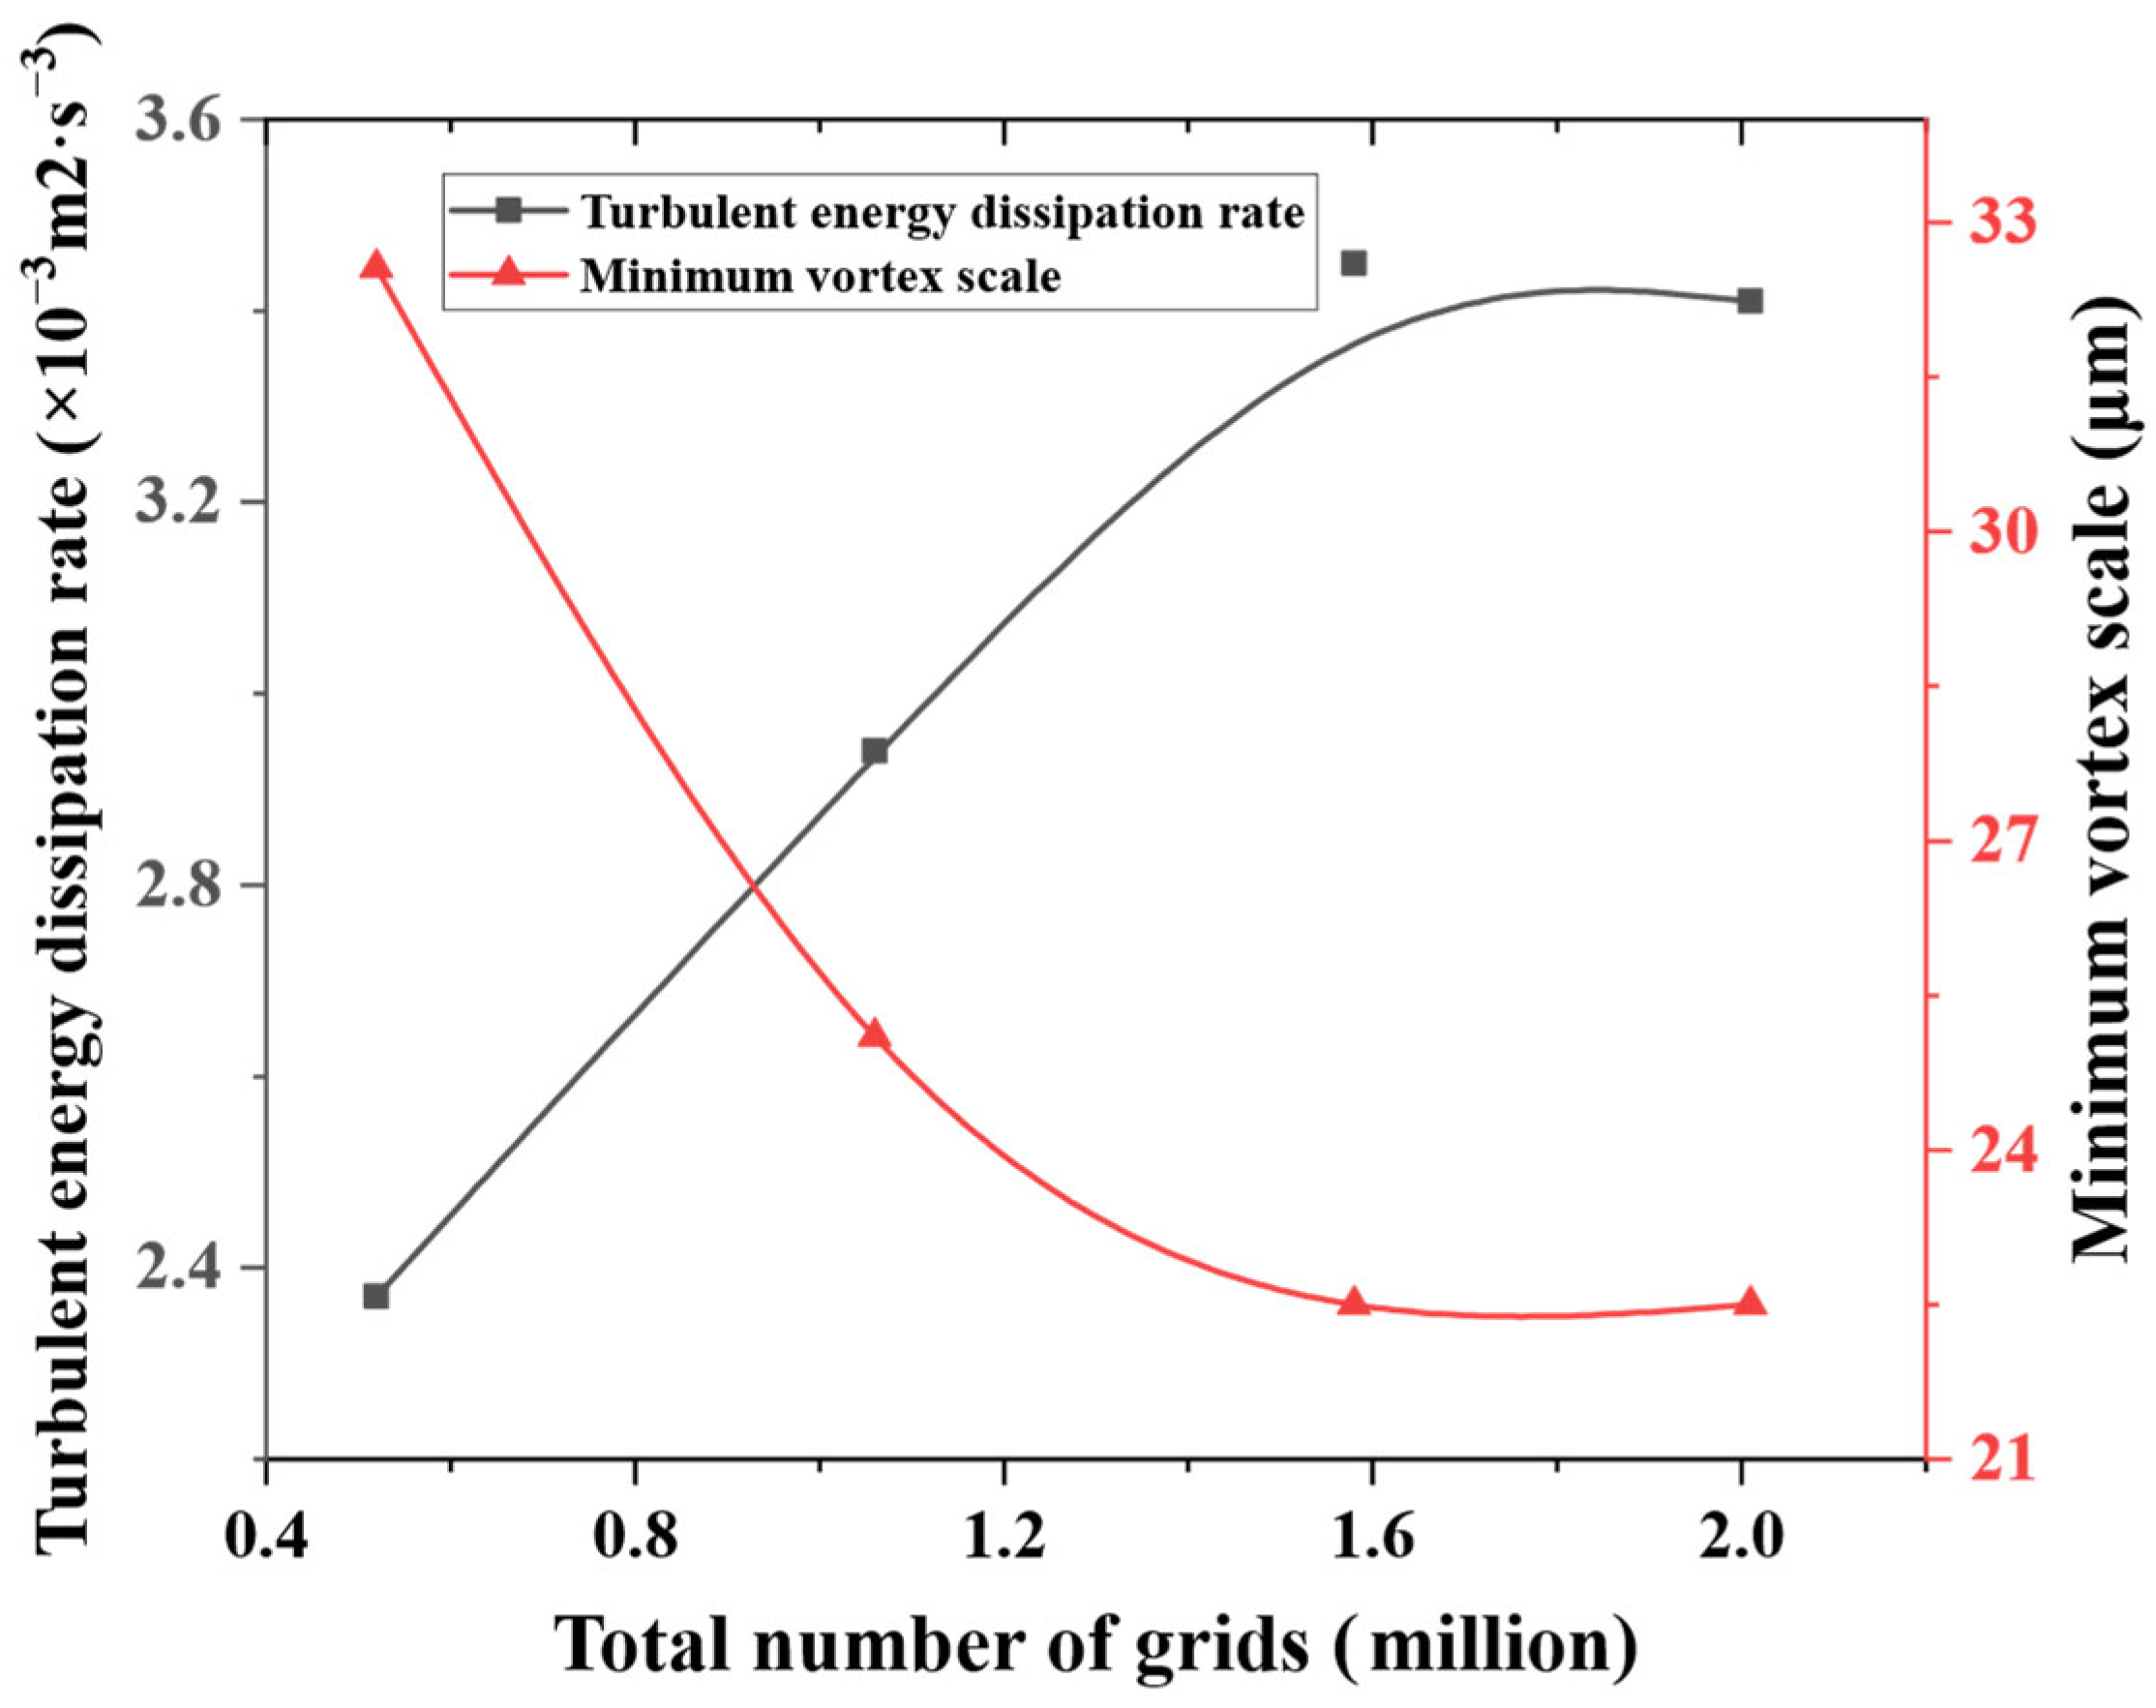
The meshing in this simulation was conducted using ICEM CFD software (ANSYS) using hexahedral structured meshing [60], as shown in Figure 3. Grid independence verification was performed before the numerical simulation, as shown in Figure 4. When the number of grids reached 1.58 million, the two main indicators affecting flocculation—that is, the volume-averaged turbulent kinetic energy dissipation rate and the turbulent minimum vortex scale—stabilised. The strategy of limiting the total number of grids to approximately 1.58 million was chosen to optimise the calculation accuracy and cost trade-offs.
For the central feedwell used in this simulation, the suspension jet with floc particles entering from the inlet forms a backflow under the influence of the conical deflector during feeding. The returning fluid collides with the original fluid in the barrel, leading to the colliding fluid diffusing to the periphery and a pressure difference being formed between the faster and slower diffusing areas. The fluid moves rapidly from the high-pressure area towards the low-pressure area, forming a vortex. These vortices can promote the mixing and flocculation of particles and accelerate the diffusion and movement of fine particles during mixing, effectively increasing the probability of collision between particles. For the feedwell itself, the internal flow-field pressure is less than the external flow-field pressure, which causes the internal–external flow field to form recirculation and spanwise vortices in the radial manifold region.

2.3. Initial Parameters

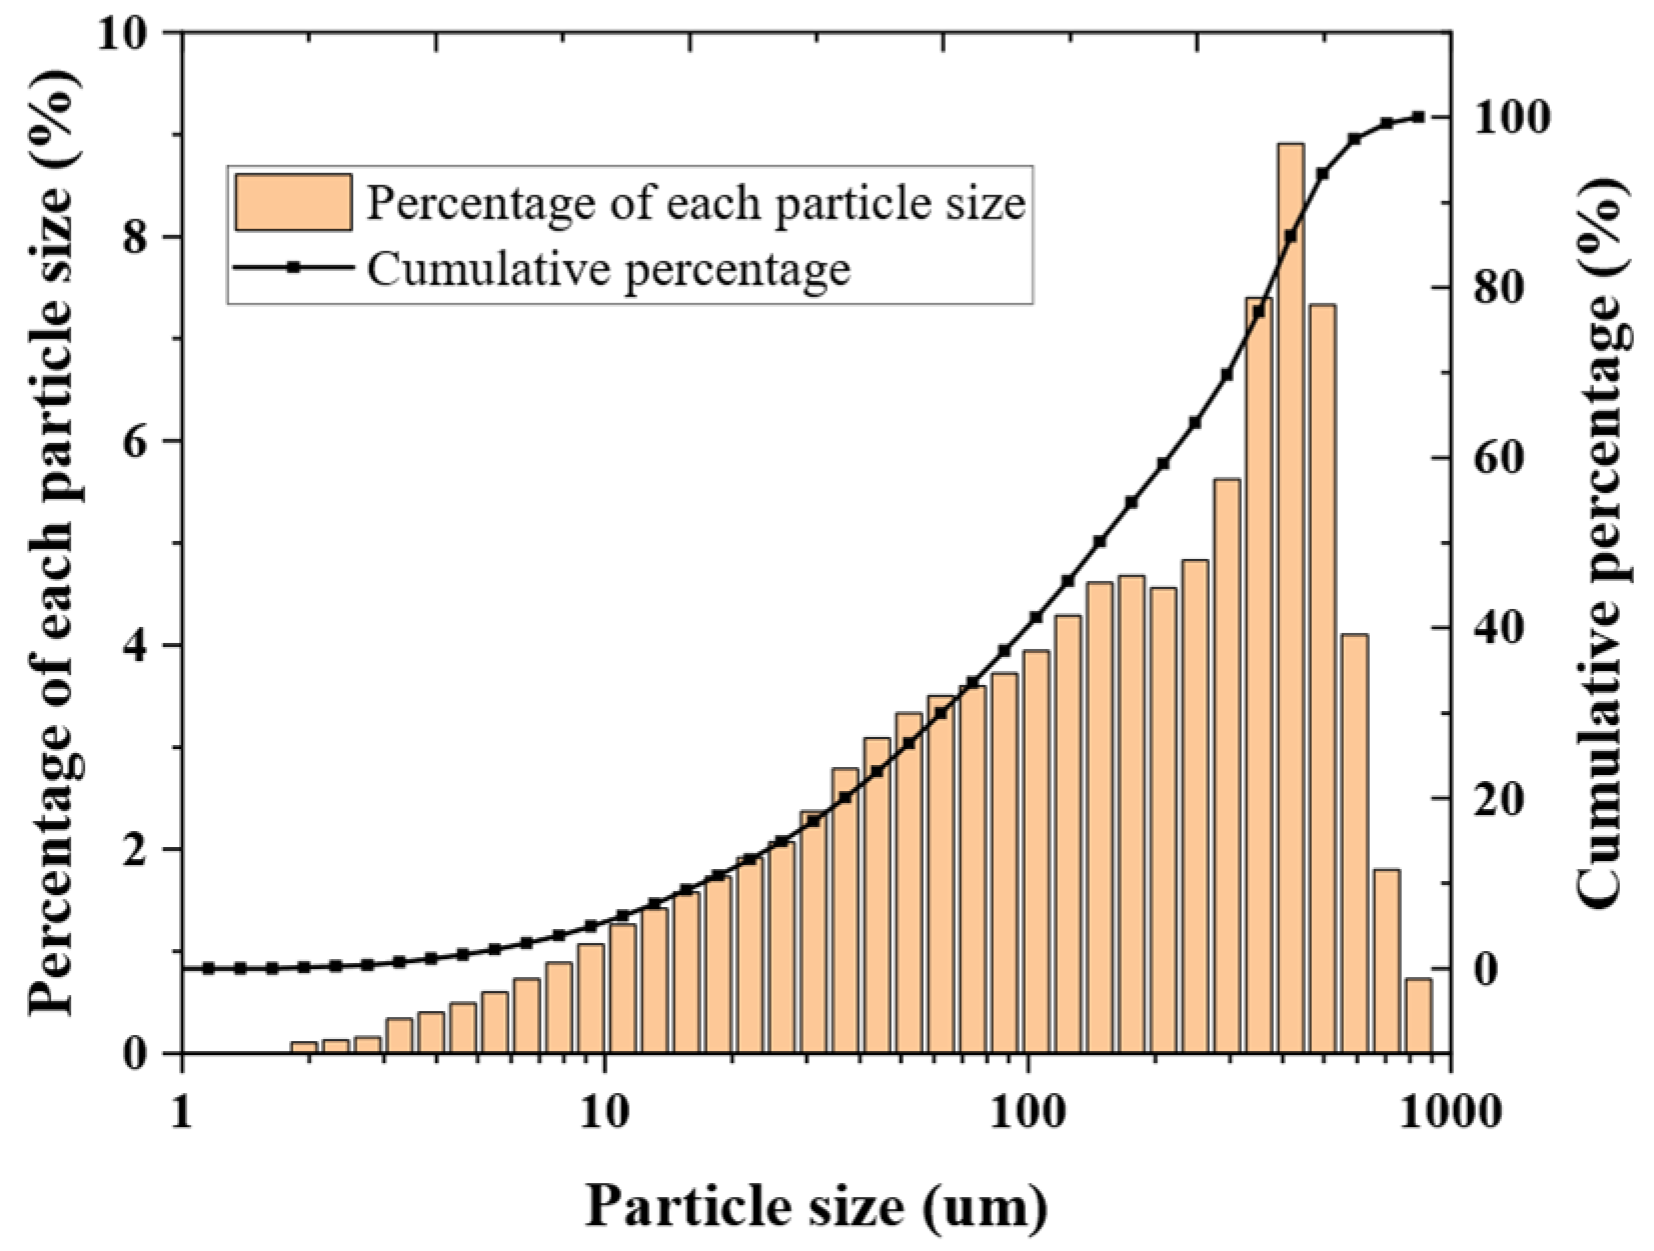
The raw material used in this simulation was coal-slurry water from a coal power processing plant. In the simulation, the density of the tailings coal was considered to be homogeneous at 1440 kg/m3. The initial viscosity of the solid-phase—as measured with an NDJ-9S rotational viscometer at an ambient temperature of 16 °C—was 0.0032 kg/(m·s). The volume fraction of solid particles in the coal-slurry water was measured after it free settled in 100 mL measuring cylinders, and the results are shown in Figure 5. The volume fraction obtained from each cylinder after settling averaged 24.12%. The particle size composition of the unflocculated coal samples was analysed using a laser particle sizer (MICROTRAC-S3500). As shown in Figure 6, the average particle size of the samples was 0.221 mm, with samples <0.145 mm and <0.5 mm representing 50% and 90% of the total samples, respectively.
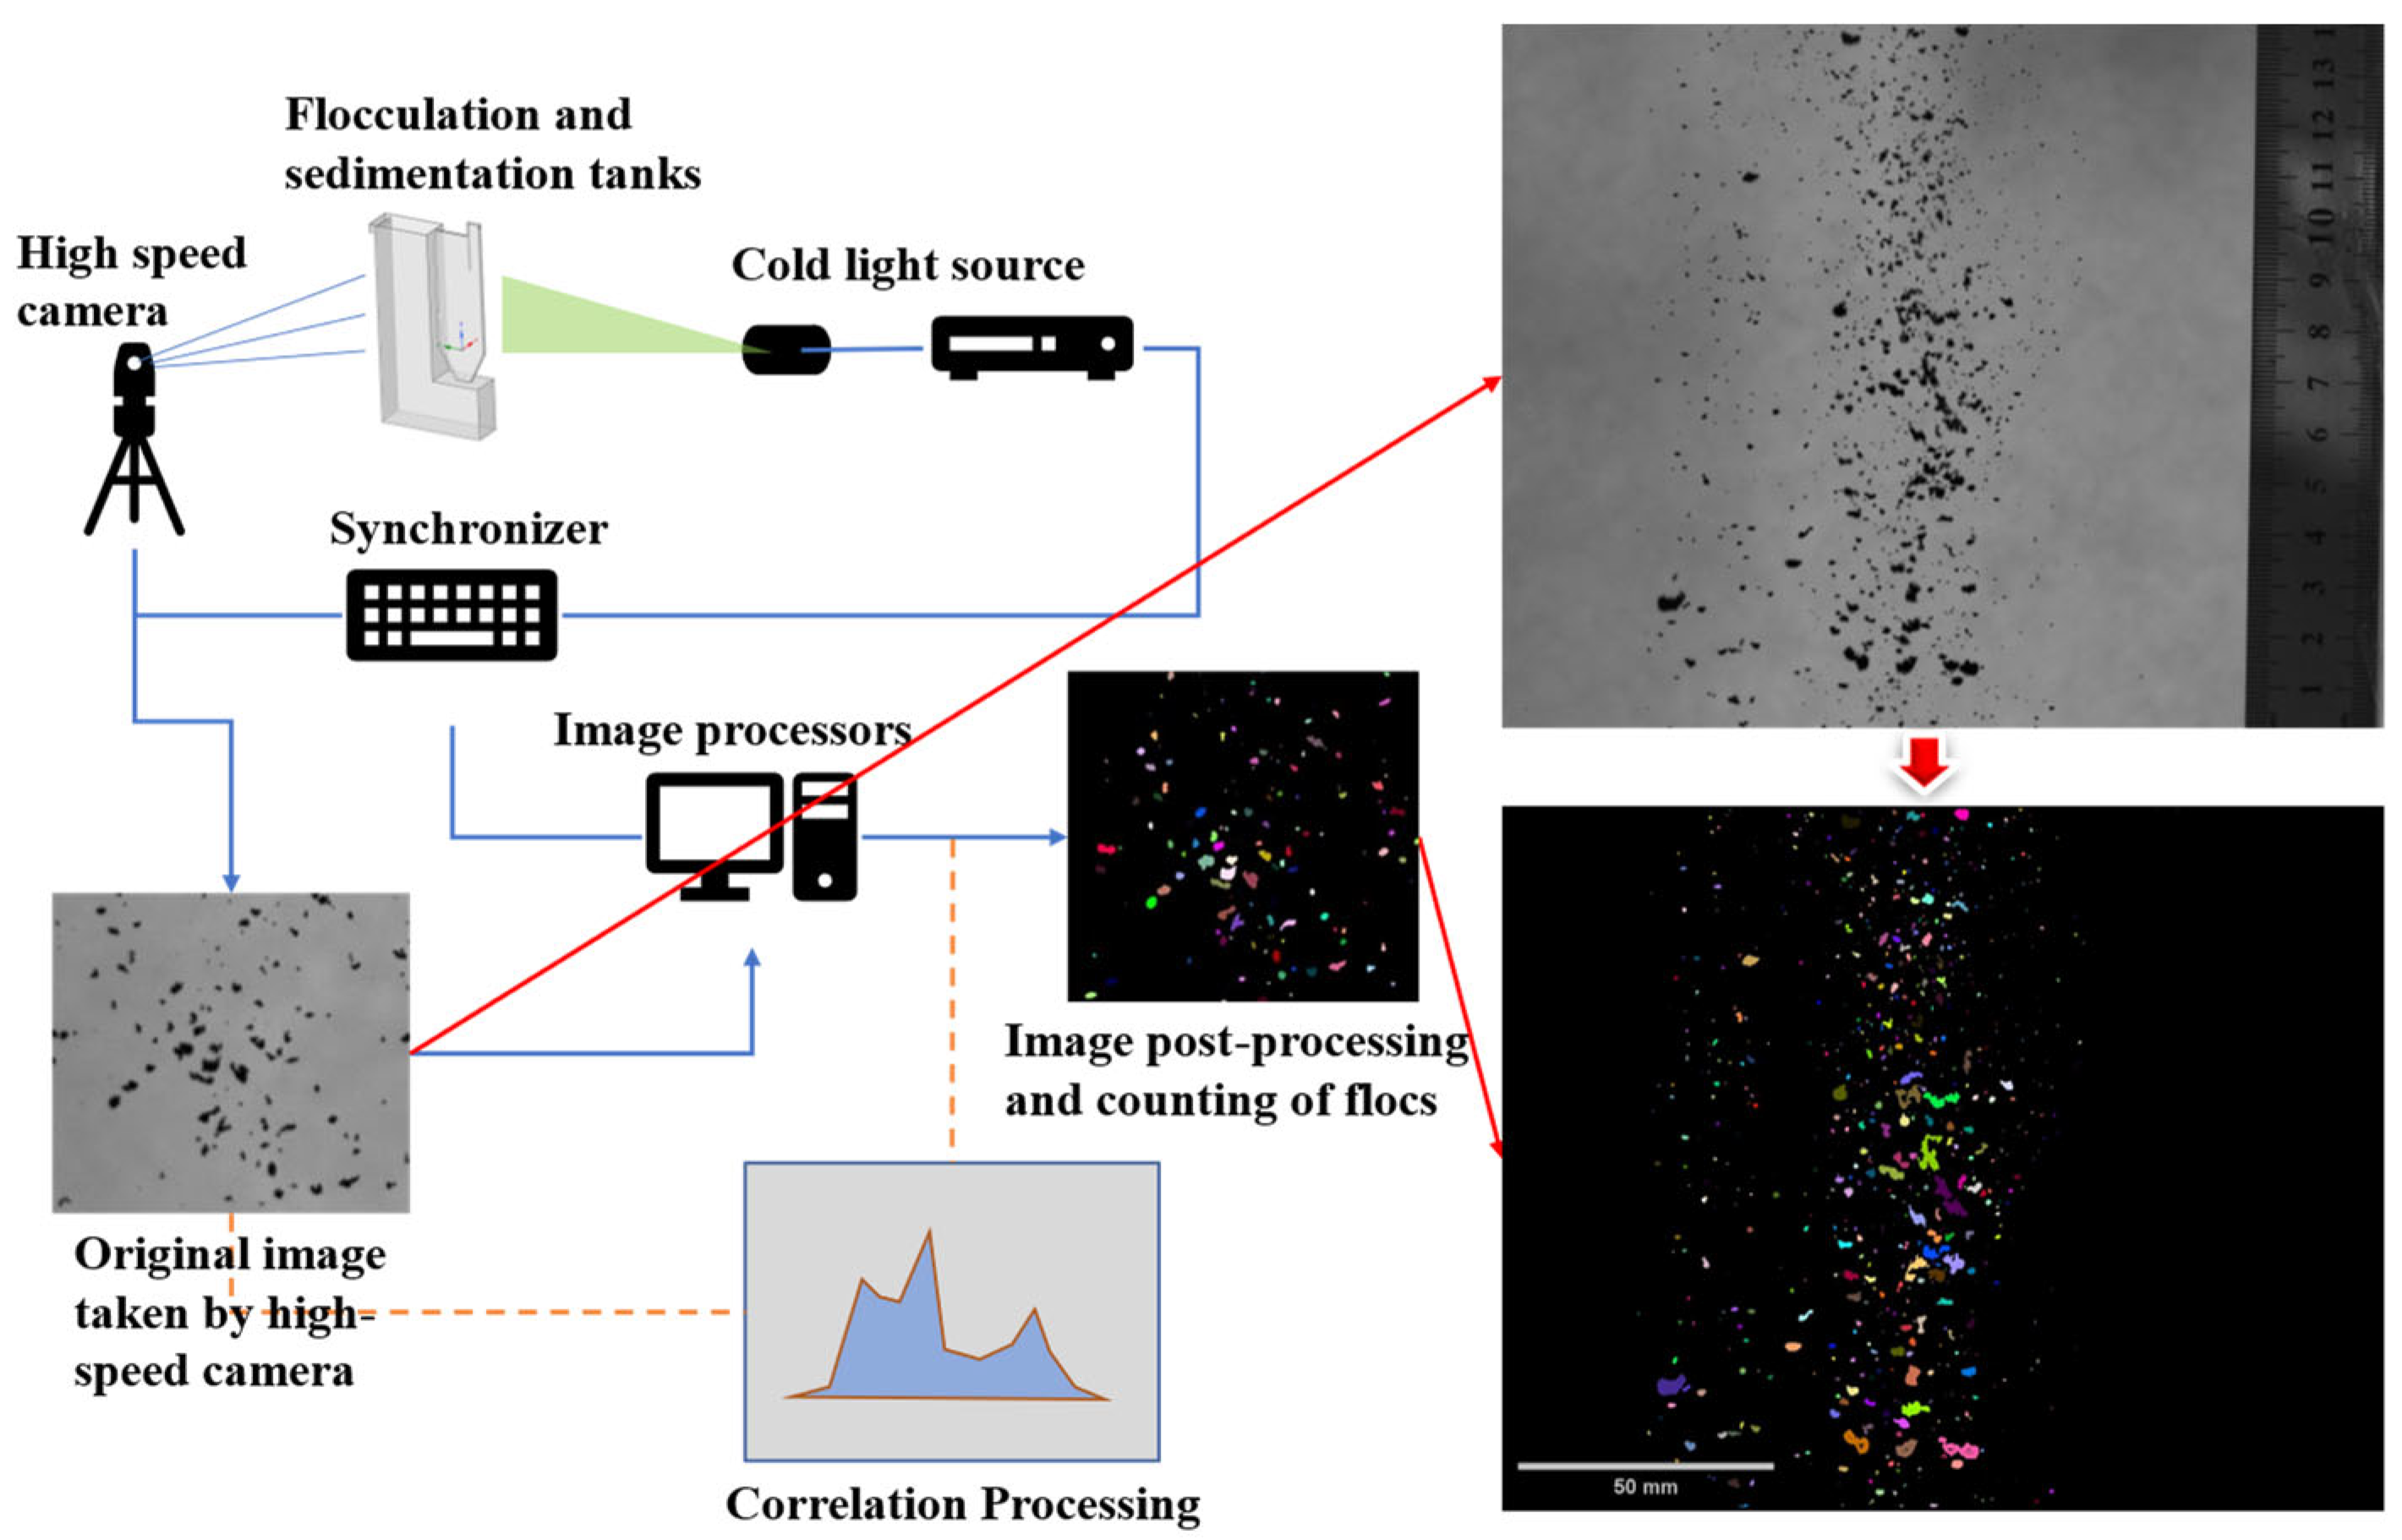
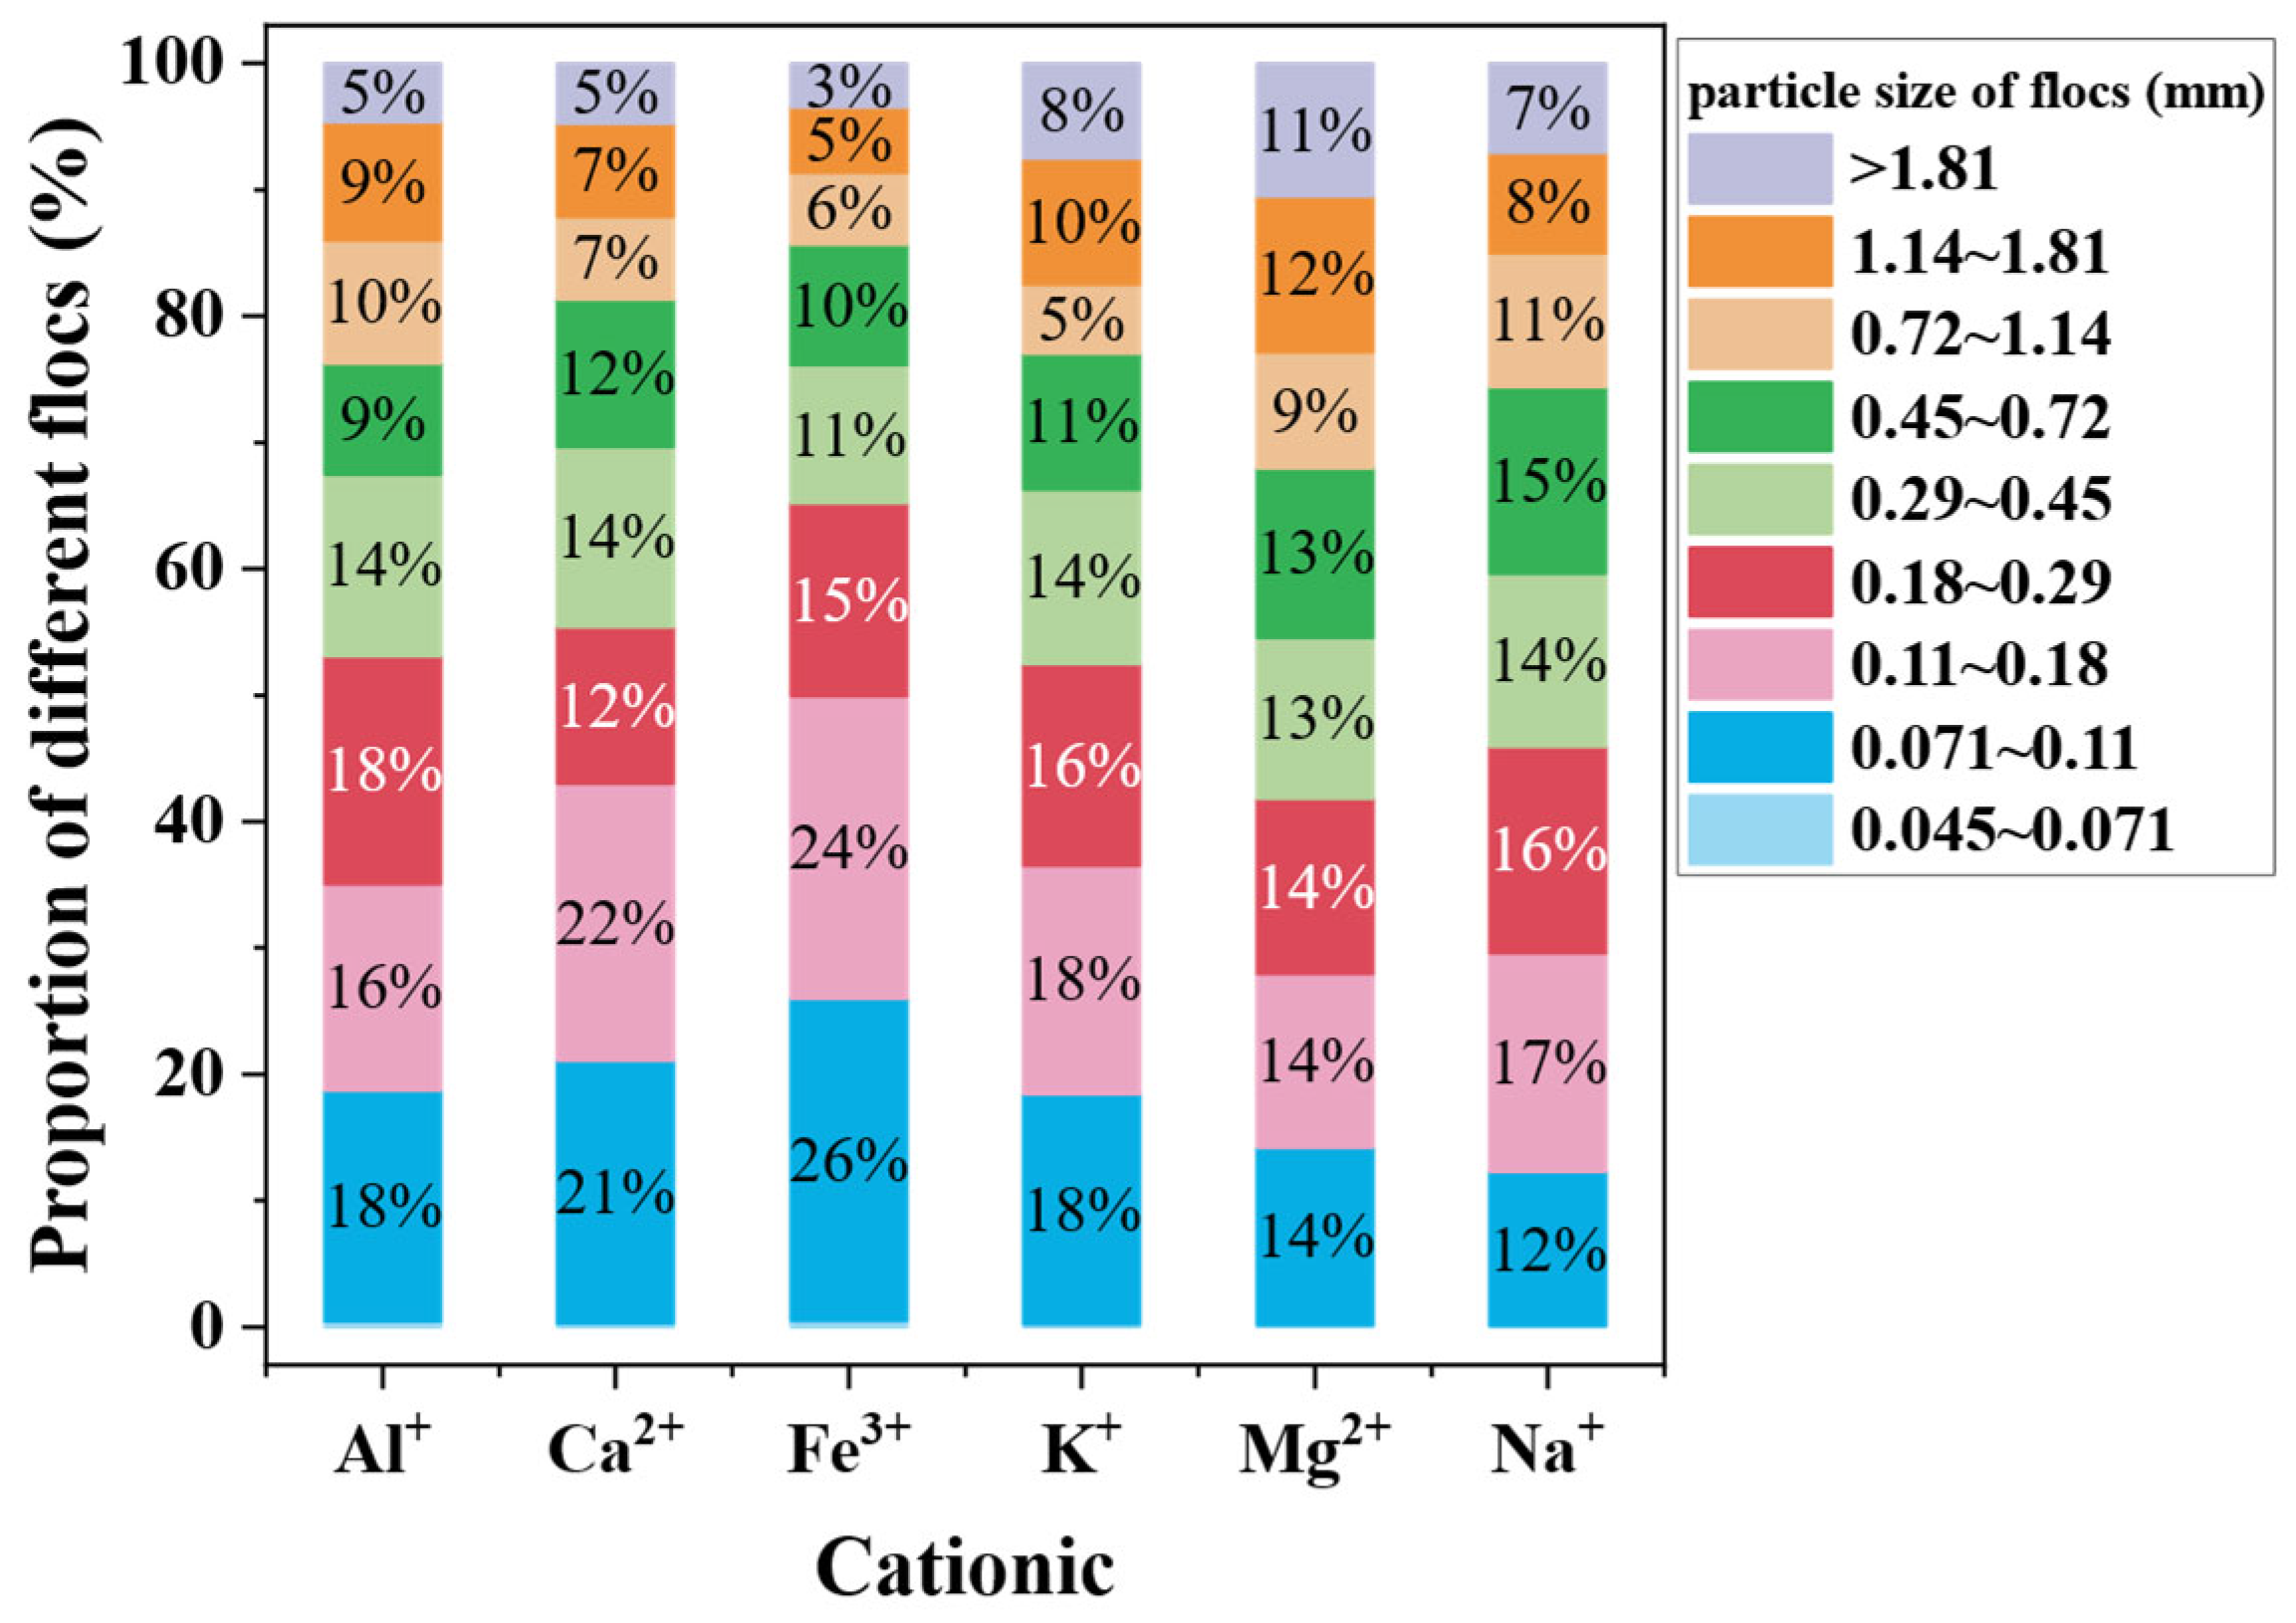
In this study, cationic polyacrylamide (CPAM)—with a molecular weight of 12 million—and a cationic coagulant were used. The dosage of CPAM (concentration of 1 g/L) was 20 g/t dry coal slurry, and the ionic coagulants were Al3+, Ca2+, Fe3+, K+, Mg2+, and Na+ (concentration of 50 g/L at a dosage of 250 g/t dry coal slurry). First, a coagulant and flocculant were used in combination to settle the coal-slurry water. The settling pipe with coal-sludge water and coagulation chemicals was manually reversed 10 times, with each reversal having a duration of approximately 1 s. Second, the settled coal-sludge water was injected into a constructed settling tank—with the settling tank being constructed to a thickness of 8 mm to ensure accurate counts and prevent flocs from obscuring one another—as shown in Figure 7. Images of the flocs were taken using a high-speed camera (FASTCAM Multi) during the free fall of the flocs in the settling tank. Finally, Photron FASTCAM Viewer software was used to analyse the process in a frame-by-frame manner and select images of the floc distribution when the settling process stabilised. The images were greyed out, coloured, and numbered using ImageJ software to determine the volume fraction of flocs of each chord length. The floc settling process was photographed three times for each agent combination, and the experimental results concerning the volume fraction distribution of each floc size were averaged, the results of which are shown in Figure 8. The experimental results of the combined use of Mg2+ and CPAM were selected as the floc parameters for the coupled CFD–PBM simulation, as shown in Table 2, in which the volume fraction of each floc size is relatively uniform and there are relatively more large-sized flocs. In this study, CPAM was dosed in advance of the feedwell, with the dosing point being very close to the feedwell, resulting in a large amount of residual CPAM in the feedwell.

2.4. Boundary Conditions

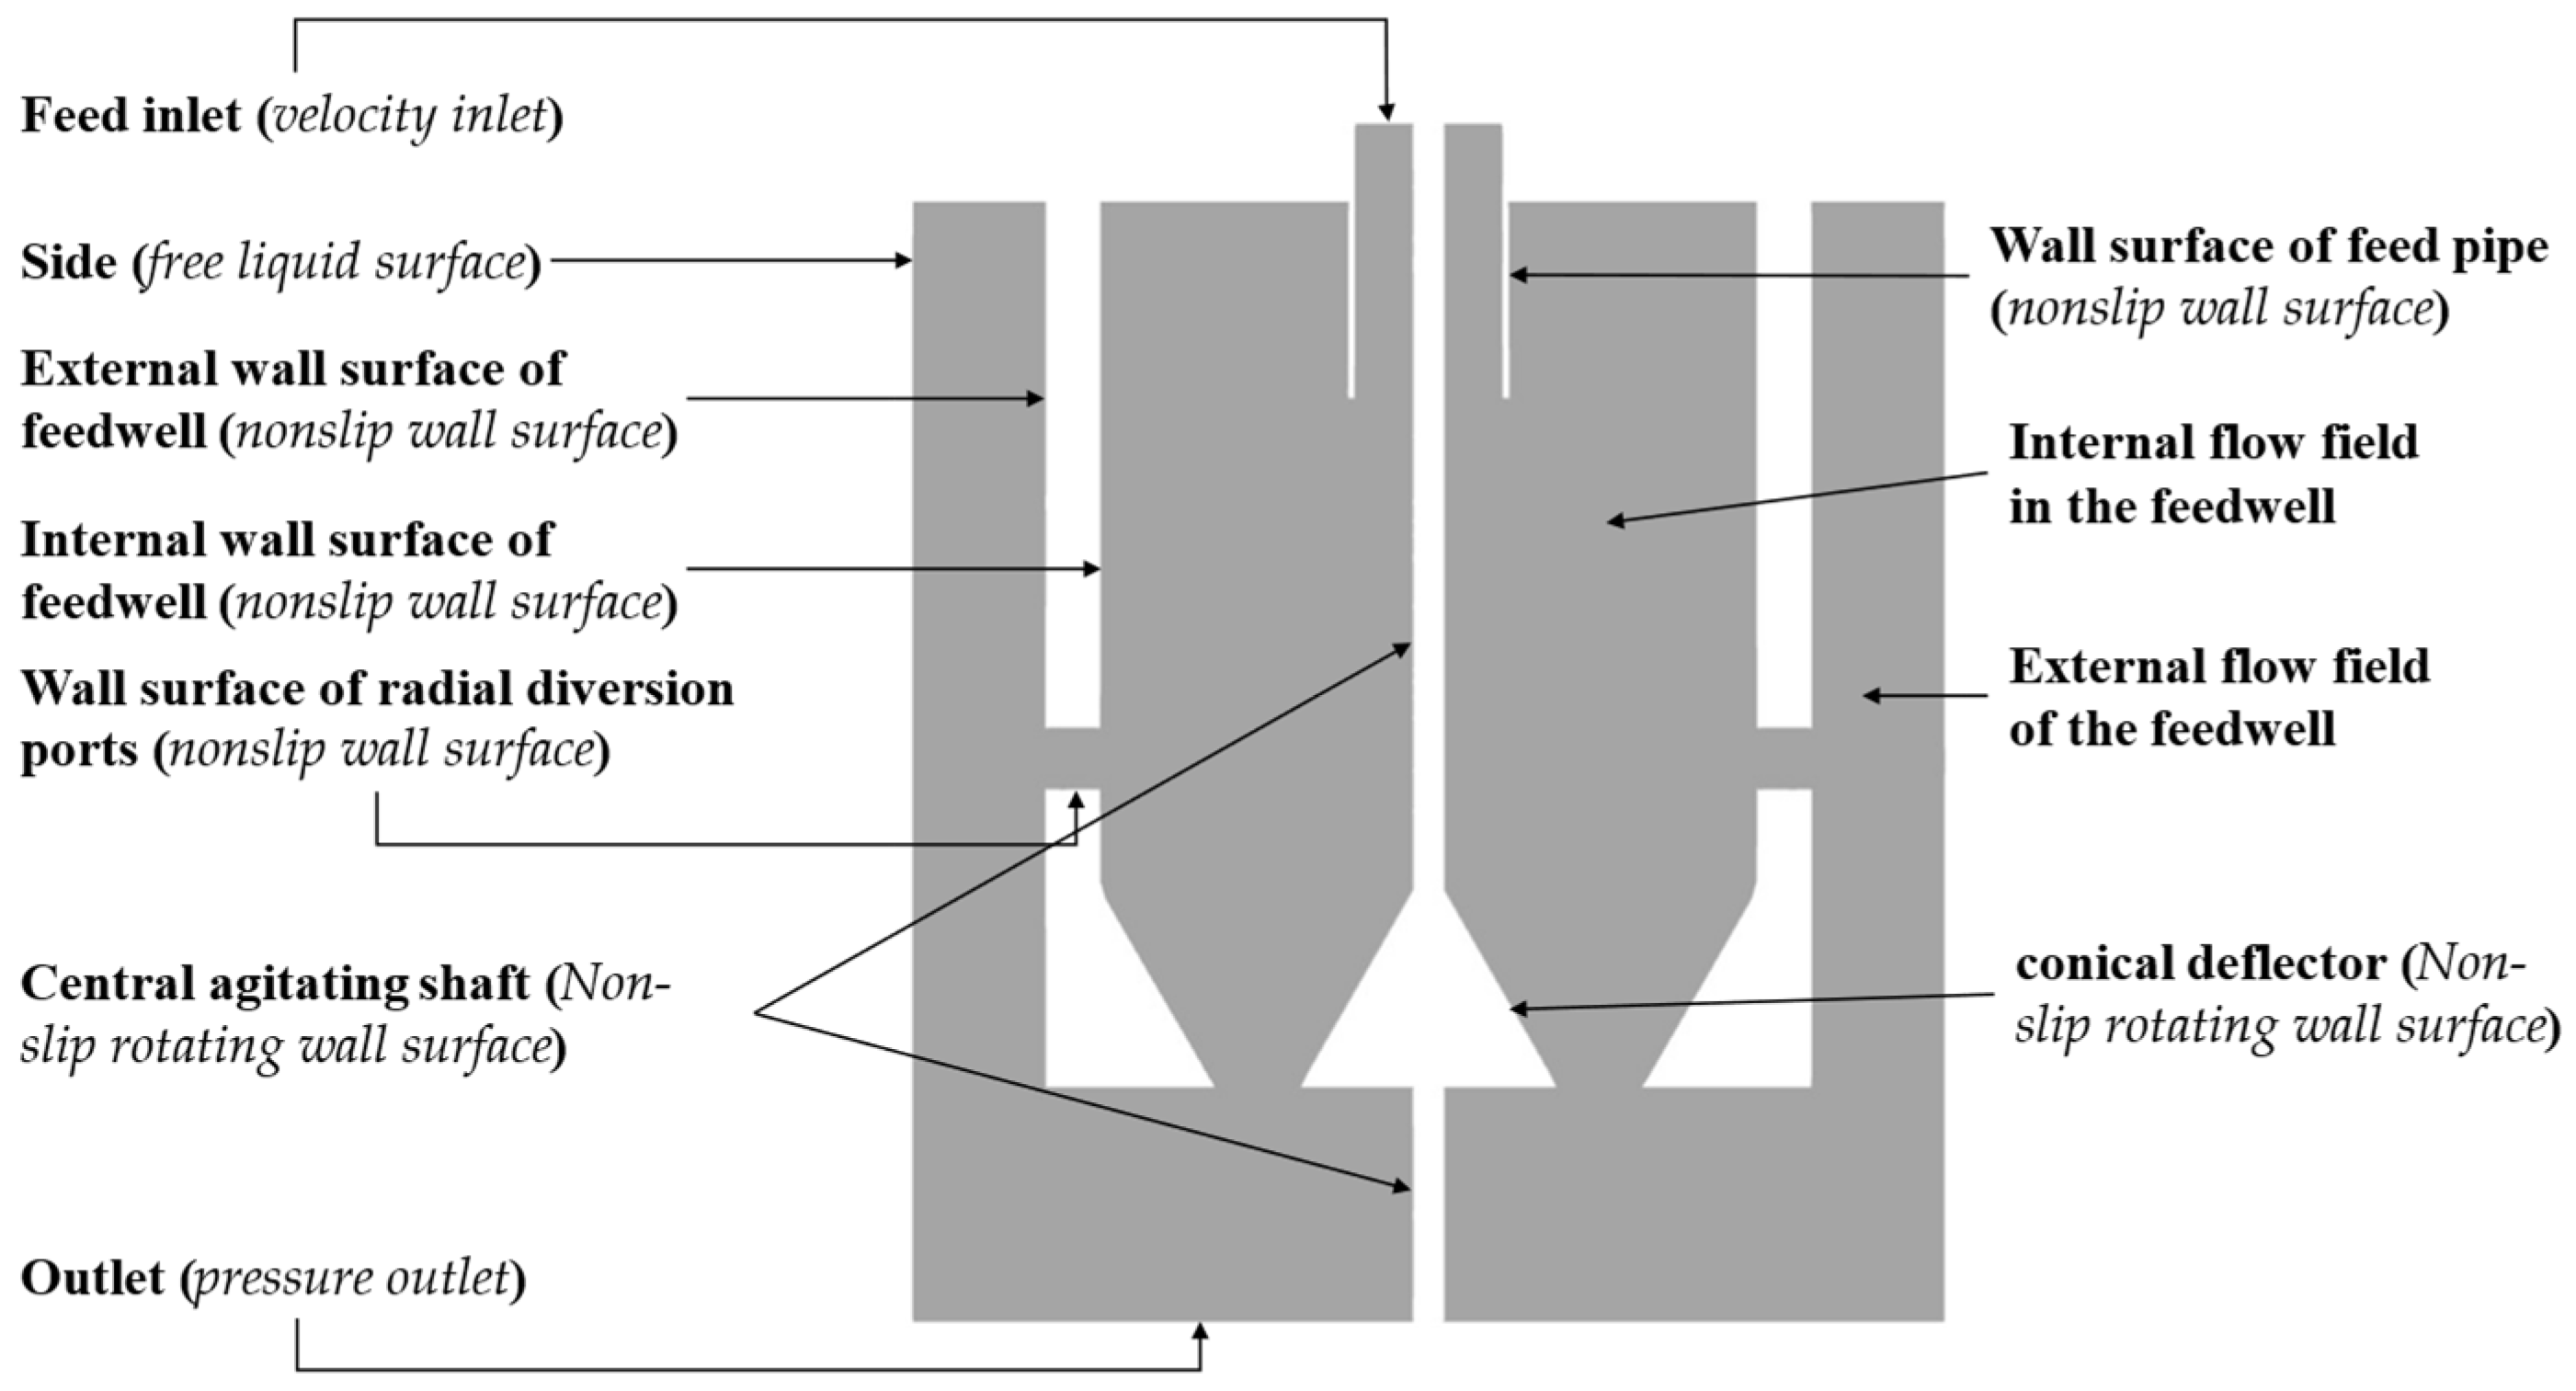
The coupled CFD–PBM was performed using FLUENT software (ANSYS), with the water phase and floc being considered to be the main and secondary phases, respectively. The simulation used an implicit algorithm to discretise the control equations, with the SIMPLE algorithm being used to perform the pressure–velocity coupling calculation. In the discrete equation format, the gradient was in the least-squares cell-based format, and the momentum term, turbulent kinetic energy term, turbulent dissipation rate term, and flocs-bin were in the second-order windward format. The volume fraction was in the first-order windward format. The specific boundary conditions are shown in Figure 9 and Table 3.
The accuracy of the convergence residuals was set to 10−4, and the computation was performed using a non-stationary solution. The time step was set to be 10−2 s. After the calculation reached statistical stability for approximately 300 s, the last 10 s were time-averaged for subsequent analysis. During actual production, a stirring shaft rotational velocity that is too fast can stir up the flocs in the sediment layer, while a rotational velocity that is too slow can lead to the blockage of the aggregate pit at the bottom of the thickener. Consequently, the rotational velocity of the stirring shaft is generally between 1 and 3 rpm, with 1.6 rpm being chosen as the simulation parameter for this numerical simulation. Unless otherwise specified, the physical parameter values of the mixed phase were used for postprocessing.

3. Results

3.1. Turbulence Characteristics

3.1.1. Flow-Field Distribution and Velocity Characteristics

The internal flow-field distribution and velocity characteristics of the feedwell were analysed in the X-Z plane, as shown in Figure 10. As can be seen from the figure, after the feed flow enters the feedwell from the inlet pipe, the flow velocity is relatively stable and no obvious divergence occurs. As it moves towards the deflector plate, the feed flow is blocked by the deflector plate and disperses in all directions, generating a vortex flow inside the feedwell and an obvious velocity gradient. Different particle sizes are affected by the inertia of the aqueous phase, resulting in velocity differences between the particles, leading to mutual friction between the particles and synergistic fluid shear to increase the contact frequency between them. In the mixing zone, there are two large vortices on both sides of the inflow plate, forming an obvious circulation flow, which is conducive to particle dispersion. In the radial manifold flow area, the fluid velocity is larger on the near-inner-wall side, which is mainly due to the inertia of the radial movement of the horizontal flow. The fluid moves towards the open-hole flow area and then continues to move towards the centre axis of the feedwell. After encountering the vertical downward jet, it is divided into two streams. The upper fluid returns to the mixing area to form a circulating flow, while the lower fluid moves towards the discharge area. The flow field of the entire discharge area is evenly distributed, which is conducive to material discharge. As the fluid approaches the bottom flow port, the horizontal flow and circulation flow velocity in the mixing zone increase, which is more conducive to mass transfer between the particles.

3.1.2. Evolution Characteristics of Macro-Vortices in the Central Feedwell

The pressure gradient is the main reason for the vortex generation in the fluid domain. The inlet flow forms a high-pressure region in the lower part of the barrel near the bottom flow port and a low-pressure region in the direction of the radial manifold port, with the fluid always flowing from the high-pressure region to the low-pressure region. After mutual contact between the high-speed inflow jet and conical deflector, part of the fluid flows back along the axial direction. The pressure in the return flow area increases along the flow direction—that is, there is a reverse pressure gradient—forming a vortex whose axis of rotation is perpendicular to the axial direction. This vortex is called the spanwise vortex. The rest of the fluid enters the sediment layer along the flow direction, and a circular spanwise vortex is formed below the bottom flow port owing to the redirecting effect of the deflector. The annular spanwise vortices cause erosion of the floc deposition layer, thereby destroying the already settled flocs. Similarly, the backpressure gradient around the radial splitter contributes to the formation of spanwise vortices in the radial splitter region. Additionally, because of the viscous resistance of the inlet pipe wall, central stirring shaft, conical deflector plate, and slow rotation of the stirring shaft and deflector plate, the fluid forms streamwise vortices along the flow direction. The spanwise and streamwise vortices strengthen fine particle aggregation and mixing in the fluid.
The Q-criterion can be used to identify the turbulent vortex structure generated in the feedwell. In general, a vortex is generated in the fluid region when Q > 0—that is, the vortex in the rotating part is larger than that in the deformed part [61]. The Q-criterion characteristic equation can be expressed as follows:
Q = 1 2 ( Ω 2 S 2 )
where Ω and S denote the antisymmetric (rotational rate tensor) and symmetric (strain rate tensor) components of the velocity gradient tensor, respectively. Thus, Ω and S correspond to the rotation and deformation of the flow field, respectively.
Figure 11 shows the macroscopic vortex 3D equipotential surfaces generated by different model deflectors in the feedwell when Q = 0.1. It is evident that, for the same angle α (αa = αb = 60°) between the sides of the tapered deflector in the vertical plane, the higher the height of the bottom surface of the tapered deflector (model (b) deflector height being higher than that of model (a)), the greater the vortex scale of the macroscopic vortex generated in the barrel, with the higher deflector forming more obvious streamwise vortices.
In the case of the conical deflector bottom at the same height (the deflector bottoms for models (a), (c), and (d) are at the same height), the vortex scale of the macroscopic vortex increases with a decrease in the angle α between the sides of the deflector (αa = 60°, αc = 30°, αd = 21.1°). The fluid velocity directions in the streamwise vortex and in the spanwise vortex formed at the radial manifold are orthogonal, leading to more pronounced collisions between the small-scale vortices owing to turbulent dissipation and greatly increasing the contact collisions and aggregation between the particles.
For the velocity distribution on the vortex equipotential surface, the velocity is higher in the area near the stirring axis and deflector plate, and it decreases along the radial direction. In the macroscopic vortex, the closer to the centre of the vortex, the greater the fluid velocity—thus, a velocity gradient zone forms. The velocity gradient between different flow layers in the vortex and the fluid shear between different areas of the barrel effectively strengthen the different flow layers between the fluid mixing contact and particle collision.

3.1.3. Minimum Vortex Scale

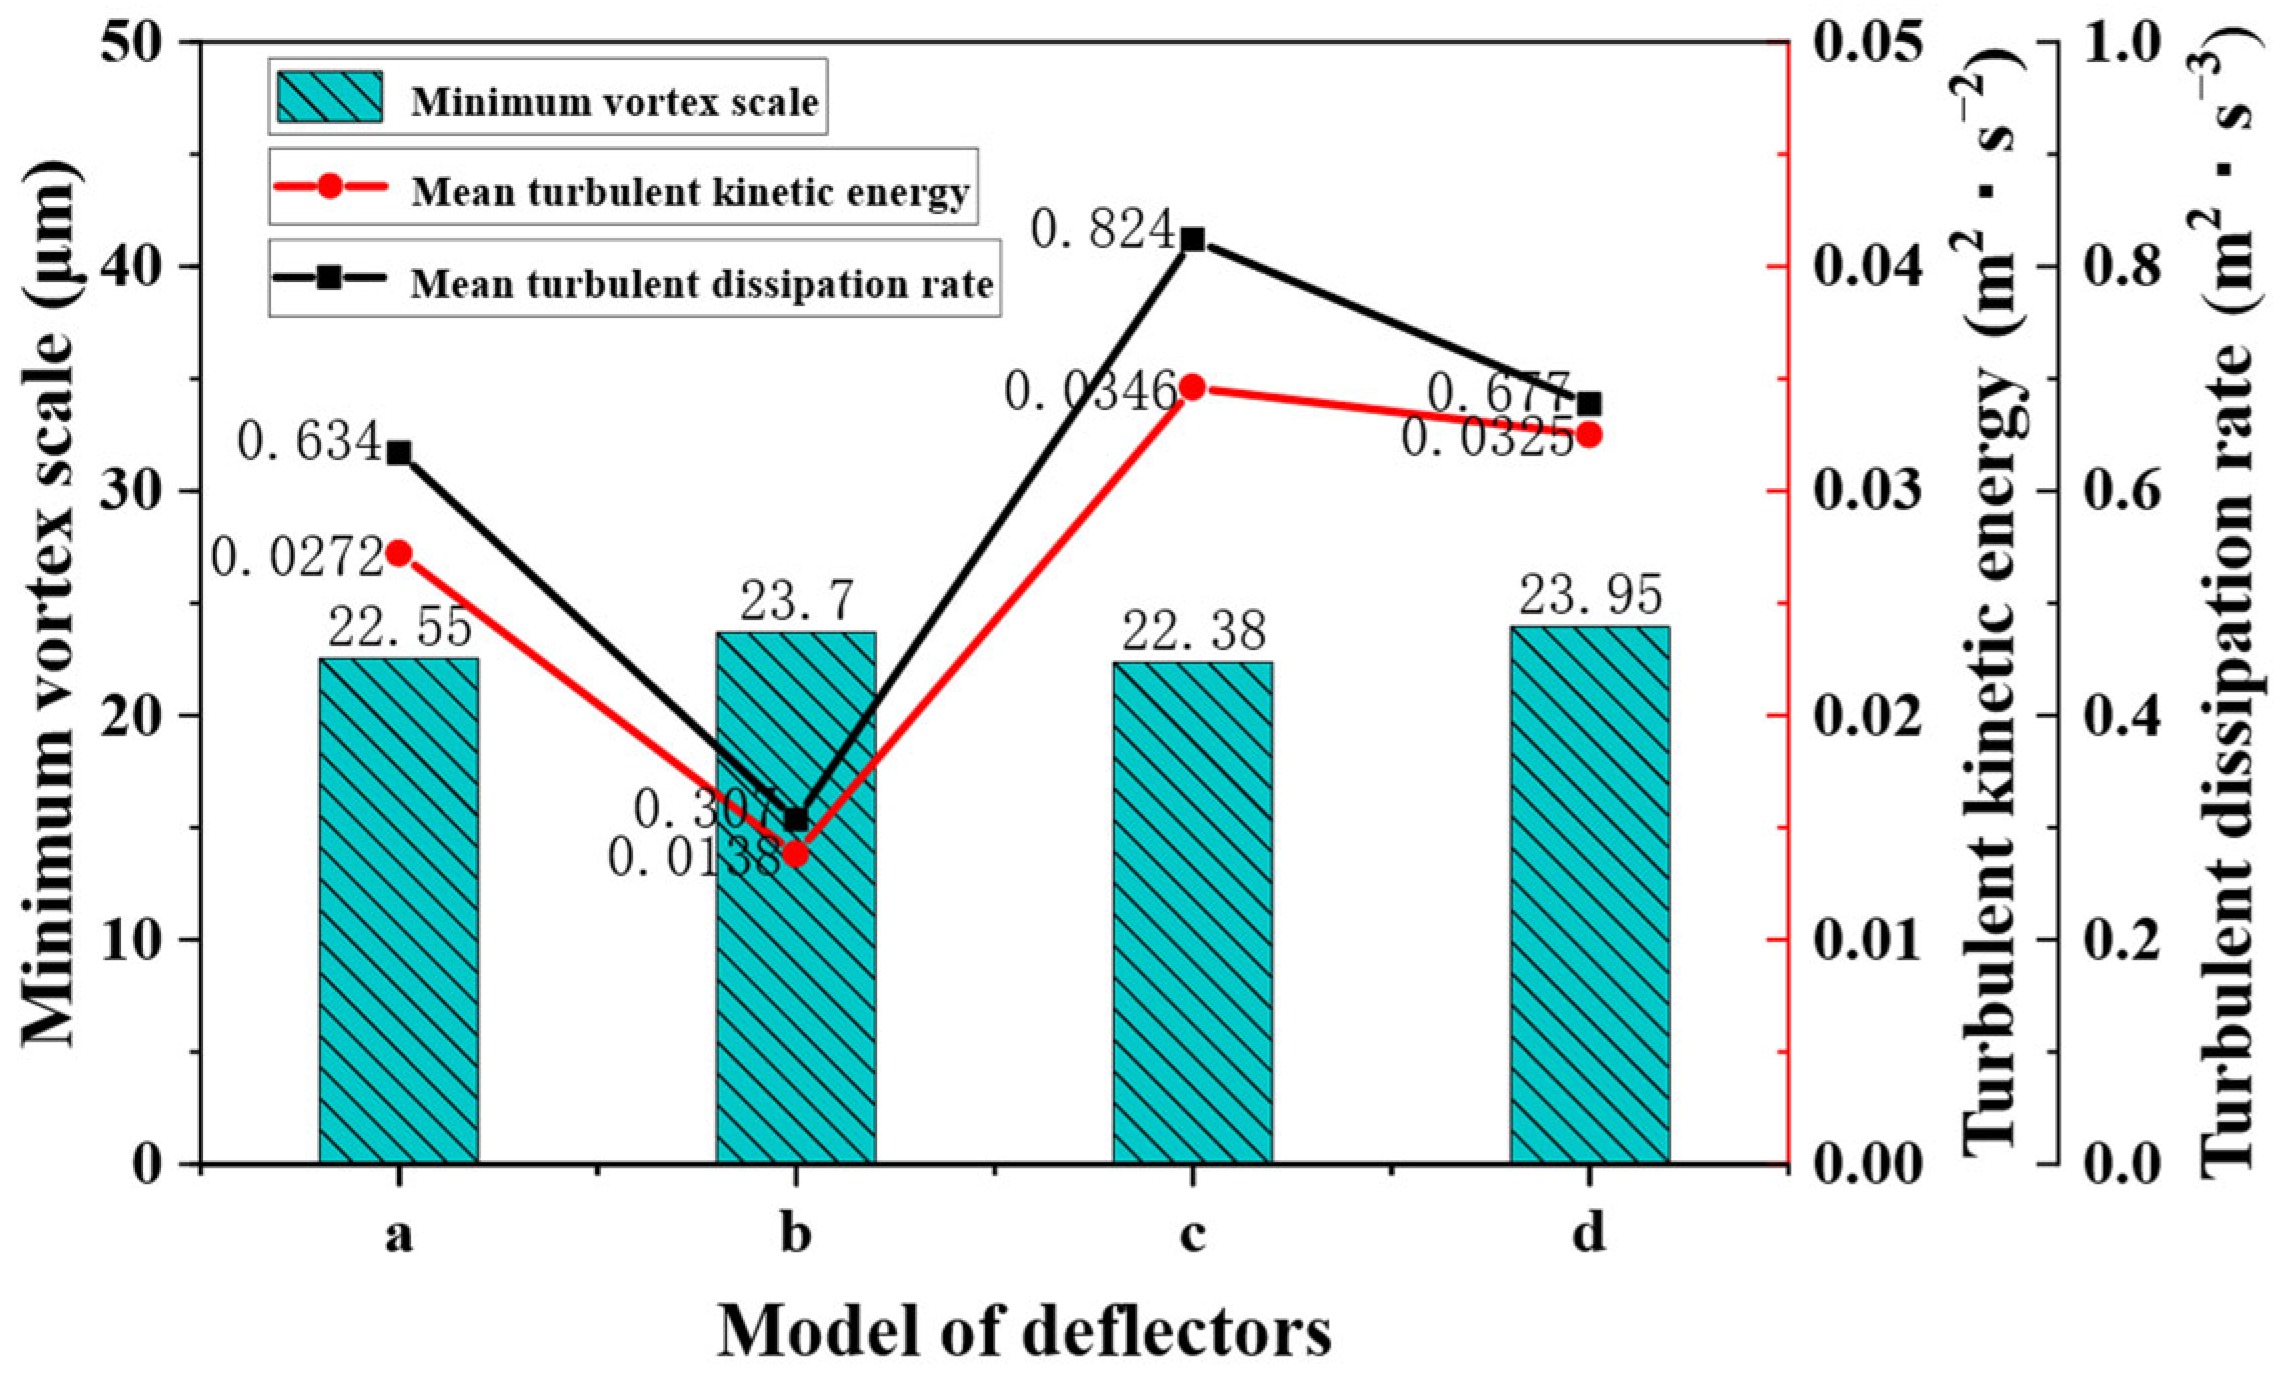
Based on the viscous and inertial subrange mechanisms mentioned in Section 2.1.3, an analysis of the distribution of the minimum vortex scale in turbulent flow is important to study the floc aggregation and breakage. The magnitude of the minimum vortex scale in each region within the feedwell and its distribution in each region can be calculated using Tecplot software and Equation (8) [56]. The results are shown in Figure 12. The central stirring shaft and conical deflector in the feedwell can induce small-scale vortices of less than 100 μm, reaching the effective particle collision vortex scale. The smallest vortex scale in the area near the bottom flow of the feedwell is smaller than that near the inlet area. With the same angle α of the conical deflector (αa = αb = 60°), the higher the height of the bottom surface of the conical deflector, the smaller the distribution range of the minimum vortex scale induced by the central stirring axis and the conical deflector. Combined with the results shown in Figure 13, with the higher height of the bottom surface of the conical deflector, the minimum vortex scale of the external flow field of the conical deflector increases from 23.55 to 23.7 μm. Moreover, the turbulent kinetic energy and turbulent kinetic energy dissipation rate both tend to decrease.
For the same height of the bottom surface of the conical deflector (models (a), (c), and (d), where the bottom surface is at the same height), the distribution range of the minimum vortex scale in the external flow field increases continuously with a decrease in α (αa = 60°, αc = 30°, αd = 21.1°) between the sides of the deflector, as shown in Figure 12. Combined with the results shown in Figure 13, when α decreases from 60° to 30°, the turbulent kinetic energy and turbulent kinetic energy dissipation rate increase, the high-turbulence-action area range increases, and the minimum vortex scale decreases from 22.55 to 22.38 μm. A decrease in the minimum vortex scale has a beneficial effect on the effective transfer of intra-flow energy to fine particles. When α decreases from 30° to 21.1°, the turbulent kinetic energy and turbulent kinetic energy dissipation rate decrease, the high-turbulence-action area range decreases, and the minimum vortex scale increases from 22.38 to 23.95 μm.

3.2. Effect of Deflector on Flocculation Performance

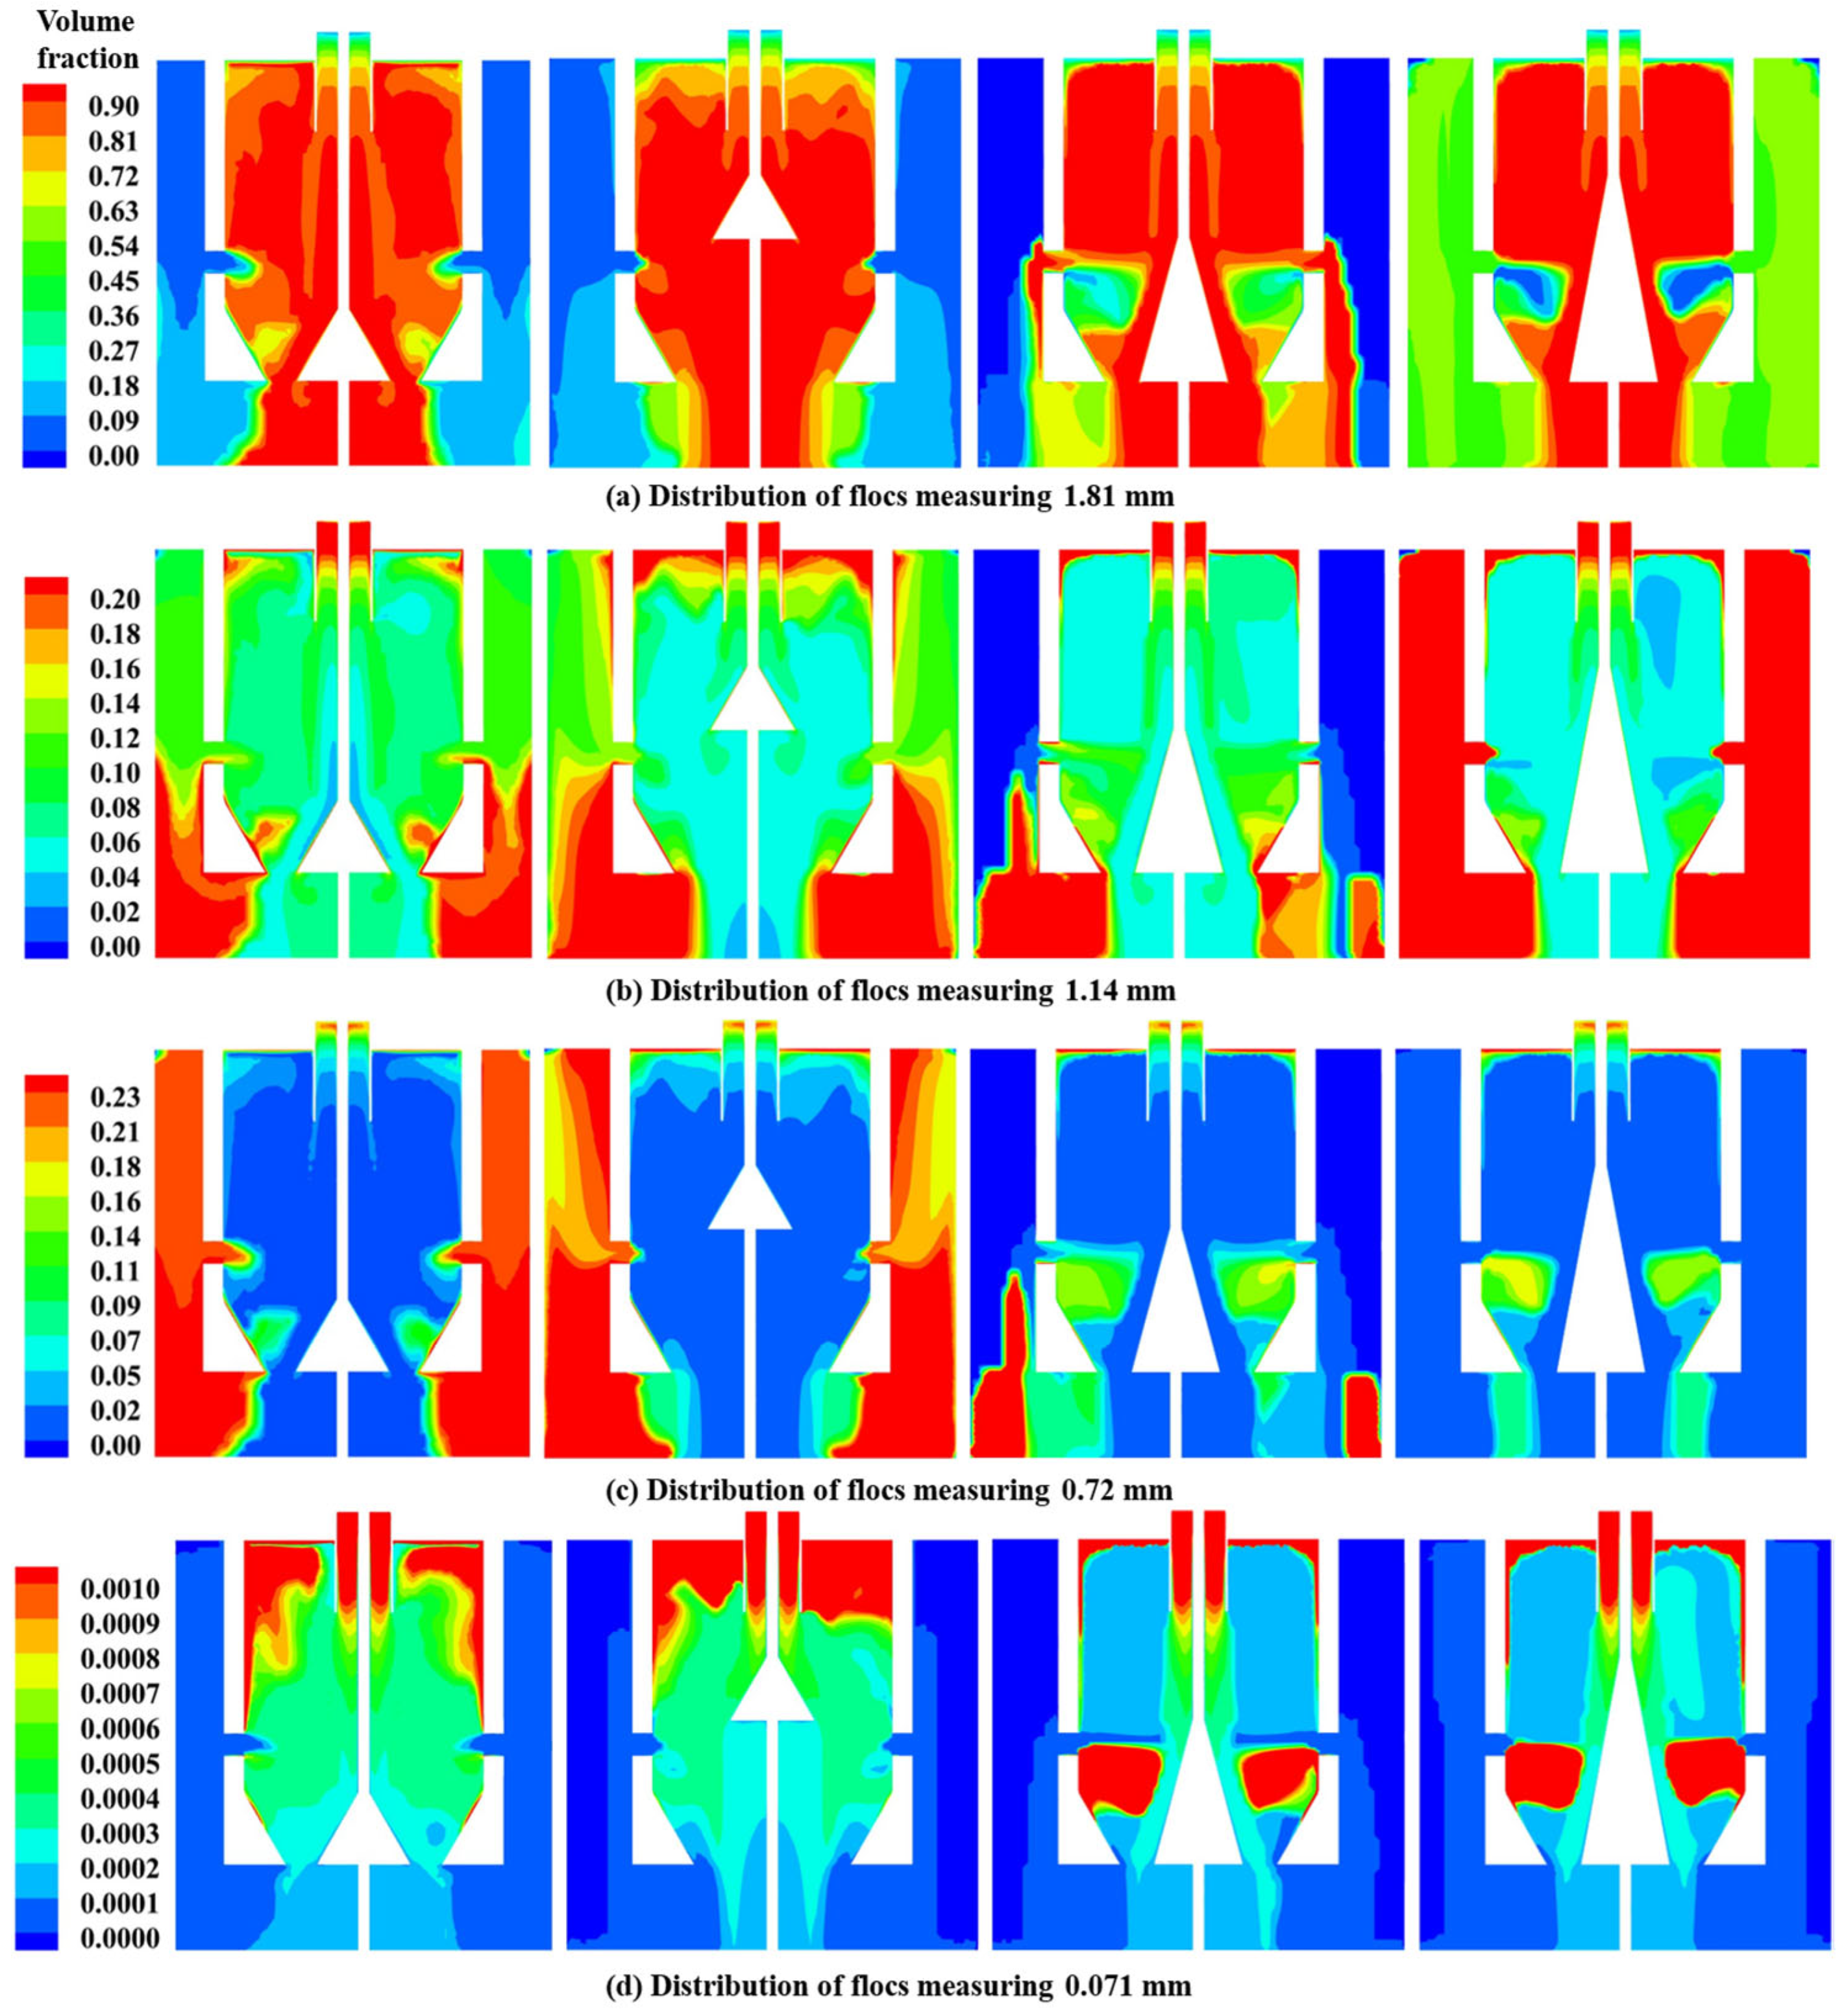
The floc distribution according to size and the corresponding volume fraction in and around the feedwell under the action of different types of conical buffer deflectors was used as the main criterion for flocculation performance. Figure 14 shows the floc distribution according to scale in the internal–external flow field of the feedwell. From Figure 14a, it is evident that floc particles with an equivalent particle size of 1.81 mm are distributed primarily in the internal flow field of the feedwell. Only for the conical deflector plate with αd = 21.1° do the 1.81 mm floc particles diffuse to the external flow field. This shows that large flocs diffuse to the external flow field of the central feedwell only when the angle between the sides of the tapered deflector is sufficiently small. As shown in Figure 14b, flocculent particles with an equivalent particle size of 1.14 mm are distributed in the internal–external flow field of the feedwell, with the main distribution area being the external flow field. As shown in Figure 14c, floc particles with an equivalent particle size of 0.72 mm are distributed primarily in the external flow field of the feedwell flow field. When the angles between the sides of the conical deflector plate are αc = 30° and αd = 21.1°, 0.72 mm floc particles are less distributed in the entire flow field of the feedwell and more in the radial manifold area. This shows that when the angle between the sides of the conical deflector increases, flocs with a particle size of approximately 1 mm tend to spread from the internal flow field of the central feedwell to the external flow field. As shown in Figure 14d, fine particles with an equivalent particle size of 0.071 mm are distributed primarily in the upper part of the internal flow field of the feedwell flow field. When the angle between the sides of the conical deflector plate decreases, the distribution area of particles with a particle size of approximately 0.071 mm decreases considerably, indicating that the flocculation performance of fine particles increases as the angle between the sides of the conical deflector plate decreases.
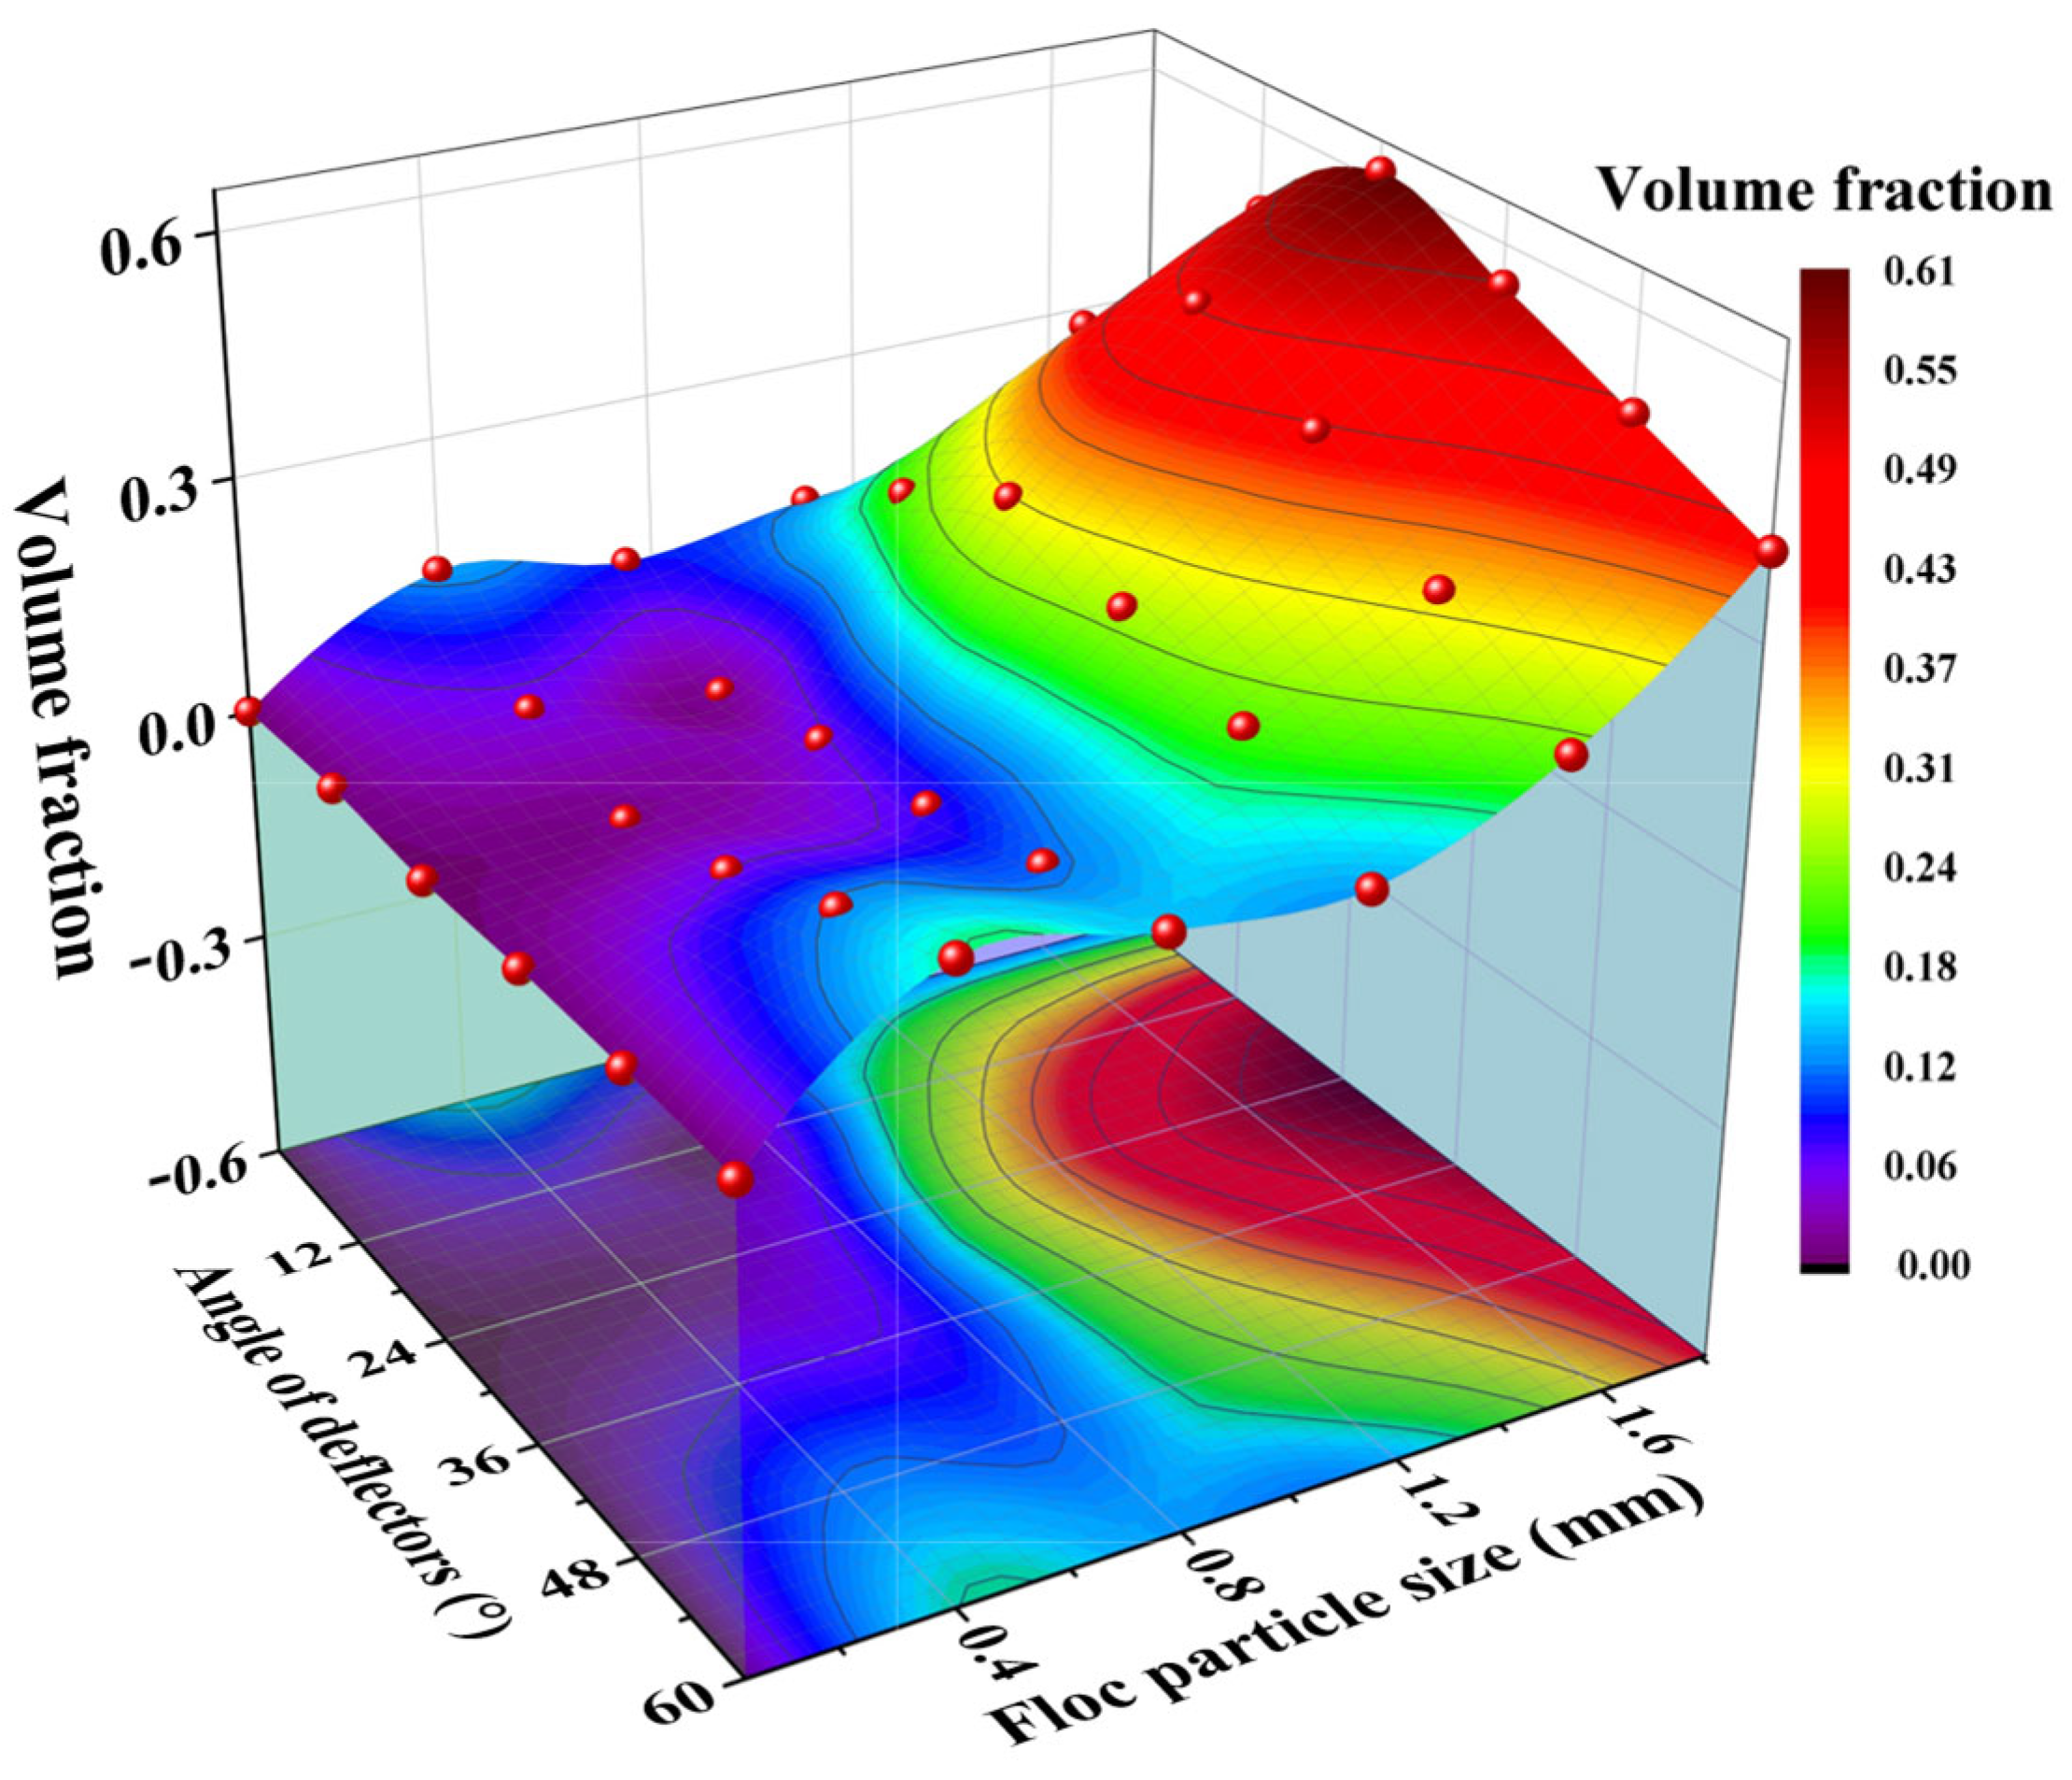
The floc size distribution was extracted from the PBM simulation results using Tecplot software. The results show that, although the solid concentration of the feed is constant, the volume fraction of flocs at each scale varies greatly under the regulation of different types of conical deflectors. The volume fraction of each chord length floc in the entire flow-field region of the feedwell was analysed with variations in the angle of the side of the conical deflector in the vertical plane via an adjacent-averaging algorithm in Origin software [62]. The results are shown in Figure 15. It is evident that as the angle α of the central buffer deflector increases, the volume fraction of floc particles larger than 0.8 mm initially increases before decreasing, while the volume fraction of floc particles smaller than 0.8 mm decreases before increasing. When the angle of the deflector plate is α > 24° or α < 24°, the volume fraction of each particle size tends to be flat as α increases or decreases. Moreover, the volume fraction of small particles in the entire flow field decreases and the volume fraction of large flocs increases as the angle of the deflector plate α approaches 24°.
In summary, the best flocculation effect in the overall flow-field area of the central feedwell was achieved when the angle α between the sides of the central buffer deflector in the vertical plane was close to 24°. Consequently, the volume fraction of each chord length floc in the external flow field of the central buffer deflector was statistically analysed, as shown in Figure 16. Compared with the initial volume fraction in the inlet flow, the volume fraction of floc particles larger than 1.25 mm increases more significantly, while the volume fraction of floc particles smaller than 0.75 mm decreases more significantly under the action of the deflector. This suggests that the central buffer deflector has a major effect on flocculation intensification.
As the angle α of the sides of the deflector plate in the vertical plane (αa = 60°, αc = 30°, αd = 21.1°) decreases, the volume fraction of floc particles with an equivalent particle size greater than 1.5 mm in the external flow field of the conical deflector plate increases, while the volume fraction of floc particles with a particle size between 1.25 and 1.5 mm does not change much—that is, the volume fraction of floc particles with sizes less than 1.25 mm tends to decrease. These results indicate that reducing the angle α of the side of the deflector plate in the vertical plane and increasing the surface area of the sides of the guide plate facilitate the flocculation process.

4. Discussion

In this study, a coupled conventional CFD–PBM approach based on the Eulerian–Eulerian framework was used to simulate the flocculation-thickening behaviour of the central feedwell of an industrial-scale gravity thickener [14,26,40,41]. This study focused on the effect of the conical deflector on the flow characteristics and flocculation performance over a specific range of variations in the angle of the conical deflector. The liquid turbulence and solid motion vortex viscosity terms were solved using the RNG kε turbulence model and dispersive phase zero equation model [63], respectively. The initial parameters of the inlet flow were obtained using self-designed image-recognition experiments. The turbulent kinetic energy and turbulent dissipation rate in and around the feedwell were investigated, with both being found to be inversely related to the height of the conical deflector plate. It was evident that the turbulent kinetic energy and turbulent dissipation rate increased and subsequently decreased as the angle of the conical deflector increased in the vertical plane. Moreover, the formation of large vortices in the feed barrel could lead to a low local turbulent dissipation rate.
To verify the simulation results, it was evident that—under the condition that the angle of the side of the conical deflector in the vertical plane was known—the height of the conical deflector’s bottom surface could be appropriately increased to effectively prevent the bottom flow from appearing as a circular spanwise vortex, thereby avoiding the erosion of the inlet flow and spanwise spreading vortex on the floc deposition layer. However, the height of the conical deflector was too high, which affected the flocculation of the solid particles. For the thickener used in this study, the simulation results showed that too large or too small an angle on the sides of the conical deflector in the vertical plane could lead to poor mixing and flocculation performance degradation. For the specific concentrator feedwell used in this study, the angle of the side of the conical inflow plate in the vertical plane within a specific range of 20–30° could improve the flocculation performance. The results showed that 24° worked best.
It could be expected that different feeding methods—that is, tangential and vertical feeding—might also affect the flow-field characteristics and flocculation performance of the feedwell [14,17,18,26]. Consequently, it will be necessary to study the feeding methods and feed-flow rates of the feedwell in subsequent experiments.

Author Contributions

Conceptualisation, Y.F. and X.D.; methodology, X.M.; software, H.T.; validation, Y.F., X.D. and M.C.; formal analysis, H.T.; investigation, H.T.; resources, X.D.; data curation, H.T. and N.L.; writing—original draft preparation, H.T.; writing—review and editing, H.T.; visualisation, H.T.; supervision, Y.F.; project administration, Y.F. and X.D.; funding acquisition, Y.F. All authors have read and agreed to the published version of the manuscript.

Funding

This research was funded by the International (Regional) Cooperation and Exchange Projects of the National Natural Science Foundation of China (Grant No. 51820105006) and the National Natural Science Foundation of China (General Program) (Grant No. 52074189).

Institutional Review Board Statement

Not applicable.

Informed Consent Statement

Not applicable.

Data Availability Statement

The data that support the findings of this study are available from the corresponding author upon reasonable request. The data are not publicly available due to privacy.

Conflicts of Interest

The authors declare no conflict of interest.

References

  1. Min, F.; Chen, J.; Peng, C.; Chen, C. Promotion of Coal Slime Water Sedimentation and Filtration via Hydrophobic Coagulation. International J. Coal Prep. Util. 2021, 41, 815–829. [Google Scholar] [CrossRef]
  2. Bedell, D.; Slottee, S.; Shoenbrunn, F.; Fawell, P. Chapter 7—Thickening. In Paste and Thickened Tailings—A Guide, 3rd ed.; Jewell, R.J., Fourie, A.B., Eds.; Australian Centre for Geomechanics: Nedlands, Australia, 2015; pp. 113–134. [Google Scholar]
  3. Saini, N.; Kleinstreuer, C. A New Collision Model for Ellipsoidal Particles in Shear Flow. J. Comput. Phys. 2019, 376, 1028–1050. [Google Scholar] [CrossRef]
  4. Šulc, R.; Ditl, P. Scale-up Rules for Flocculation. Int. J. Miner. Process. 2017, 167, 79–85. [Google Scholar] [CrossRef]
  5. Šulc, R.; Ditl, P. The Effect of Process Conditions on the Flocculation Process Occurring in an Agitated Vessel. Pol. J. Chem. Technol. 2012, 14, 88–96. [Google Scholar] [CrossRef] [Green Version]
  6. Nguyen, T.V.; Farrow, J.B.; Smith, J.; Fawell, P.D. Design and Development of a Novel Thickener Feedwell Using Computational Fluid Dynamics. J. South. Afr. Inst. Min. Metall. 2012, 112, 939–948. [Google Scholar]
  7. Chadwick, J.R. Zaldivar. Min. Mag. 1994, 171, 271–277. [Google Scholar]
  8. Taylor, D. Thickener. US5015392(A), 1989-11-15. Available online: https://worldwide.espacenet.com/publicationDetails/originalDocument?CC=US&NR=5015392&KC=&FT=E (accessed on 20 November 2022).
  9. Gong, T.; Courtenay, S. Case Study: Advantages of High Rate Thickening at TISCO Jianshan Iron Mine. In Proceedings of the XXIV International Mineral Processing Congress, Beijing, China, 24–28 September 2008; pp. 4171–4175. [Google Scholar]
  10. Arabadzhi, Y.N.; Olennikov, A.S.; Kurchukov, A.M.; Likhachova, T.A. Thickening equipment modernazation with supaflo process (Outotec) at Talnakh Concentrator. Tsvetnye Metally 2018, 2018, 38–43. [Google Scholar] [CrossRef]
  11. Watanabe, Y. Flocculation and Me. Water Res. 2017, 114, 88–103. [Google Scholar] [CrossRef]
  12. Heath, A.R.; Bahri, P.A.; Fawell, P.D.; Farrow, J.B. Polymer Flocculation of Calcite: Population Balance Model. AIChE J. 2006, 52, 1641–1653. [Google Scholar] [CrossRef]
  13. Ge, L.H.; Evans, G.M.; Moreno-Atanasio, R. CFD-DEM Investigation of the Interaction Between a Particle Swarm and a Stationary Bubble: Particle-Bubble Collision Efficiency. Powder Technol. 2020, 366, 641–652. [Google Scholar] [CrossRef]
  14. Fawell, P.D.; Nguyen, T.V.; Solnordal, C.B.; Stephens, D.W. Enhancing Gravity Thickener Feedwell Design and Operation for Optimal Flocculation through the Application of Computational Fluid Dynamics. Miner. Process. Extr. Metall. Rev. 2021, 42, 496–510. [Google Scholar] [CrossRef]
  15. Johnston, R.R.M.; Nguyen, T.W.; Schwarz, M.P.; Simic, K. Fluid Flow and Natural Dilution in Open-type Thickener Feedwells. In Proceedings of the 4th International Alumina Quality Workshop, Darwin, Australia, 2–7 June 1996; pp. 468–475. [Google Scholar]
  16. Tanguay, M.; Fawell, P.; Adkins, S. Modelling the Impact of Two Different Flocculants on the Performance of a Thickener Feedwell. Appl. Math. Model. 2014, 38, 4262–4276. [Google Scholar] [CrossRef]
  17. Nguyen, T.; Heath, A.; Witt, P. Population Balance-CFD Modelling of Fluid Flow, Solids Distribution and Flocculation in Thickener Feedwells. In Proceedings of the Fifth International Conference on CFD in the Process Industries Melbourne, Melbourne, Australia, 13–15 December 2006; p. 1. [Google Scholar]
  18. Owen, A.T.; Nguyen, T.V.; Fawell, P.D. The Effect of Flocculant Solution Transport and Addition Conditions on Feedwell Performance in Gravity Thickeners. Int. J. Miner. Process. 2009, 93, 115–127. [Google Scholar] [CrossRef]
  19. Rau, M.J.; Ackleson, S.G.; Smith, G.B. Effects of Turbulent Aggregation on Clay Floc Breakup and Implications for the Oceanic Environment. PLoS ONE 2018, 13, e0207809. [Google Scholar] [CrossRef] [Green Version]
  20. Kostoglou, M.; Karapantsios, T.D.; Oikonomidou, O. A Critical Review on Turbulent Collision Frequency/Efficiency Models in Flotation: Unravelling the Path from General Coagulation to Flotation. Adv. Colloid Interface Sci. 2020, 279, 102158. [Google Scholar] [CrossRef]
  21. Nguyen, A.V.; An-Vo, D.-A.; Tran-Cong, T.; Evans, G.M. A Review of Stochastic Description of the Turbulence Effect on Bubble-Particle Interactions in Flotation. Int. J. Miner. Process. 2016, 156, 75–86. [Google Scholar] [CrossRef]
  22. Yunus, A.C.; John, M.C. Fluid Mechanics Fundamentals and Applications; McGraw-Hill: New York, NY, USA, 2013; pp. 134–391. [Google Scholar]
  23. Vlieghe, M.; Frances, C.; Coufort-Saudejaud, C.; Liné, A. Morphological Properties of Flocs Under Turbulent Break-up and Restructuring Processes. AIChE J. 2017, 63, 3706–3716. [Google Scholar] [CrossRef] [Green Version]
  24. Sun, H.; Wu, Y.; Xu, C. Pressure Fluctuation in the Submerged Circulative Impinging Stream Reactor. Chin. J. Chem. Eng. 2006, 14, 428–434. [Google Scholar] [CrossRef]
  25. Yacoubi, A.E.; Xu, S.; Wang, Z.J. A New Method for Computing Particle Collisions in Navier–Stokes Flows. J. Comput. Phys. 2019, 399, 108919. [Google Scholar] [CrossRef]
  26. Wang, X.; Cui, B.; Wei, D.; Song, Z.; He, Y.; Bayly, A.E. CFD-PBM Modelling of Tailings Flocculation in a Lab-scale Gravity Thickener. Powder Technol. 2022, 396, 139–151. [Google Scholar] [CrossRef]
  27. Fawell, P.; Farrow, J.; Heath, A.; Nguyen, T.; Owen, A.; Paterson, D.; Rudman, M.; Scales, P.; Simic, K.; Stephens, D.; et al. 20 years of AMIRA P266 ‘Improving Thickener Technology’—How Has It Changed the Understanding of Thickener Performance? In Proceedings of the Twelfth International Seminar on Paste and Thickened Tailings, Australian Centre for Geomechanics, Viña del Mar, Chile, 21–24 April 2009; pp. 59–68. [Google Scholar]
  28. Jeldres, R.I.; Fawell, P.D.; Florio, B.J. Population Balance Modelling to Describe the Particle Aggregation Process: A Review. Powder Technol. 2018, 326, 190–207. [Google Scholar] [CrossRef]
  29. Frungieri, G.; Vanni, M. Aggregation and breakup of colloidal particle aggregates in shear flow: A combined Monte Carlo-Stokesian dynamics approach. Powder Technol. 2021, 388, 357–370. [Google Scholar] [CrossRef]
  30. Frungieri, G.; Boccardo, G.; Buffo, A.; Karimi-Varzaneh, H.A.; Vanni, M. CFD-DEM characterization and population balance modelling of a dispersive mixing process. Chem. Eng. Sci. 2022, 260, 117859. [Google Scholar] [CrossRef]
  31. An, M.; Guan, X.; Yang, N. Modeling the Effects of Solid Particles in CFD-PBM Simulation of Slurry Bubble Columns. Chem. Eng. Sci. 2020, 223, 115743. [Google Scholar] [CrossRef]
  32. Yan, P.; Jin, H.; He, G.; Guo, X.; Ma, L.; Yang, S.; Zhang, R. Numerical Simulation of Bubble Characteristics in Bubble Columns with Different Liquid Viscosities and Surface Tensions Using a CFD-PBM Coupled Model. Chem. Eng. Res. Des. 2020, 154, 47–59. [Google Scholar] [CrossRef]
  33. Guo, K.; Wang, T.; Liu, Y.; Wang, J. CFD-PBM Simulations of a Bubble Column with Different Liquid Properties. Chem. Eng. J. 2017, 329, 116–127. [Google Scholar] [CrossRef]
  34. Rave, K.; Hermes, M.; Wirz, D.; Hundshagen, M.; Friebel, A.; von Harbou, E.; Bart, H.-J.; Skoda, R. Experiments and Fully Transient Coupled CFD-PBM 3D Flow Simulations of Disperse Liquid–Liquid Flow in a Baffled Stirred Tank. Chem. Eng. Sci. 2022, 253, 117518. [Google Scholar] [CrossRef]
  35. Valdés, J.P.; Asuaje, M.; Ratkovich, N. Study of an ESP’s Performance Handling Liquid–Liquid Flow and Unstable O-W Emulsions Part II: Coupled CFD-PBM Modelling. J. Pet. Sci. Eng. 2021, 198, 108227. [Google Scholar] [CrossRef]
  36. Thaker, A.H.; Buwa, V.V. Separation of Liquid–Liquid Dispersion in a Batch Settler: CFD-PBM Simulations Incorporating Interfacial Coalescence. AIChE J. 2020, 66, e16983. [Google Scholar] [CrossRef]
  37. Zhou, H.; Yu, X.; Wang, B.; Jing, S.; Lan, W.; Li, S. CFD–PBM Simulation of Liquid–Liquid Dispersions in a Pump-Mixer. Ind. Eng. Chem. Res. 2021, 60, 1926–1938. [Google Scholar] [CrossRef]
  38. Cai, L.; Liu, Z.; Mi, S.; Luo, C.; Ma, K.; Xu, A.; Yang, S. Investigation on Flow Characteristics of Ice Slurry in Horizontal 90° Elbow Pipe by a CFD-PBM Coupled Model. Adv. Powder Technol. 2019, 30, 2299–2310. [Google Scholar] [CrossRef]
  39. Xu, D.; Liu, Z.; Cai, L.; Tang, Y.; Yu, Y.; Xu, A. A CFD-PBM Approach for Modeling Ice Slurry Flow in Horizontal Pipes. Chem. Eng. Sci. 2018, 176, 546–559. [Google Scholar] [CrossRef]
  40. Li, L.; Zhao, Y.; Lian, W.; Han, C.; Liu, Y.; Li, P.; Zhang, Q.; Huang, W. Insight into the Effect of Particle Density and Size on the Hydrodynamics of a Particular Slurry Bubble Column Reactor by CFD-PBM Approach. Powder Technol. 2022, 400, 117264. [Google Scholar] [CrossRef]
  41. Wang, X.; Cui, B.; Wei, D.; Song, Z.; He, Y.; Bayly, A.E. Effect of Feed Solid Concentration on Tailings Slurry Flocculation in a Thickener by a Coupled CFD-PBM Modelling Approach. J. Environ. Chem. Eng. 2021, 9, 106385. [Google Scholar] [CrossRef]
  42. Lee, J.L.; Lim, E.W.C. Comparisons of Eulerian-Eulerian and CFD-DEM Simulations of Mixing Behaviors in Bubbling Fluidized Beds. Powder Technol. 2017, 318, 193–205. [Google Scholar] [CrossRef]
  43. Xiao, H.; Cinnella, P. Quantification of Model Uncertainty in RANS Simulations: A Review. Prog. Aerosp. Sci. 2019, 108, 1–31. [Google Scholar] [CrossRef] [Green Version]
  44. Ashraf Ali, B.; Pushpavanam, S. Analysis of Unsteady Gas–Liquid Flows in a Rectangular Tank: Comparison of Euler–Eulerian and Euler–Lagrangian Simulations. Int. J. Multiph. Flow 2011, 37, 268–277. [Google Scholar] [CrossRef]
  45. Prat, O.P.; Ducoste, J.J. Simulation of Flocculation in Stirred Vessels Lagrangian Versus Eulerian. Chem. Eng. Res. Des. 2007, 85, 207–219. [Google Scholar] [CrossRef]
  46. Ding, J.; Gidaspow, D. A bubbling fluidization model using kinetic theory of granular flow. AIChE J. 1990, 36, 523–538. [Google Scholar] [CrossRef]
  47. Lebowitz, J.L. Exact Solution of Generalized Percus-Yevick Equation for a Mixture of Hard Spheres. Phys. Rev. 1964, 133, A895–A899. [Google Scholar] [CrossRef]
  48. Lun, C.K.K.; Savage, S.B.; Jeffrey, D.J.; Chepurniy, N. Kinetic theories for granular flow: Inelastic particles in Couette flow and slightly inelastic particles in a general flowfield. J. Fluid Mech. 1984, 140, 223–256. [Google Scholar] [CrossRef]
  49. Gidaspow, D.B.; Bezburua, R.; Ding, J. Hydrodynamics of Circulating Fluidized Beds: Kinetic Theory Approach. In Proceedings of the 7th Engineering Foundation Conference on Fluidization, Chicago, IL, USA, 1 January 1991; pp. 75–82. [Google Scholar]
  50. Ogawa, S.; Umemura, A.; Oshima, N. On the Equations of Fully Fluidized Granular Materials. Z. Für Angew. Math. Und Phys. ZAMP 1980, 31, 483–493. [Google Scholar] [CrossRef]
  51. Wen, C.; Yu, Y. Mechanics of Fluidization. Chem. Eng. Prog. Symp. Ser. 1966, 62, 100–111. [Google Scholar]
  52. Richardson, J.F.; Zaki, W.N. Sedimentation and Fluidisation: Part I. Chem. Eng. Res. Des. 1997, 75, S82–S100. [Google Scholar] [CrossRef]
  53. Heath, A.; Koh, P.T.L. Combined Population Balance and CFD Modeling of Particle Aggregation by Polymeric Flocculants. In Third International Conference on CFD in the Minerals and Process Industries; CSIRO: Melbourne, Australia, 2003. [Google Scholar]
  54. White, R.B.; Sutalo, I.D.; Nguyen, T. Fluid Flow in Thickener Feedwell Models. Miner. Eng. 2003, 16, 145–150. [Google Scholar] [CrossRef]
  55. Pope, S.B. Turbulent Flows. In Turbulent Flows; Cambridge University Press: Cambridge, UK, 2000; pp. 185–188. [Google Scholar]
  56. Saffman, P.G.; Turner, J.S. On the Collision of Drops in Turbulent Clouds. J. Fluid Mech. 1956, 1, 16–30. [Google Scholar] [CrossRef] [Green Version]
  57. Abrahamson, J. Collision Rates of Small particles in a Vigorously Turbulent Fluid. Chem. Eng. Sci. 1975, 30, 1371–1379. [Google Scholar] [CrossRef]
  58. Ghadiri, M.; Zhang, Z. Impact Attrition of Particulate Solids. Part 1: A Theoretical Model of Chipping. Chem. Eng. Sci. 2002, 57, 3659–3669. [Google Scholar] [CrossRef]
  59. Moreno-Atanasio, R.; Ghadiri, M. Mechanistic Analysis and Computer Simulation of Impact Breakage of Agglomerates: Effect of Surface Energy. Chem. Eng. Sci. 2006, 61, 2476–2481. [Google Scholar] [CrossRef] [Green Version]
  60. Hou, D.; Zhao, Q.; Cui, B.; Wei, D.; Song, Z.; Feng, Y. The effects of solid shear stress and wall roughness on the simulation of cylindrical hydrocyclone classification. Powder Technol. 2021, 393, 184–204. [Google Scholar] [CrossRef]
  61. Hunt, J.; Wray, A.; Moin, P. Eddies, Streams, and Convergence Zones in Turbulent Flows. Stud. Turbul. Using Numer. Simul. Databases 1988, 1, 193–208. [Google Scholar]
  62. Hayashi, Y. Asymptotic behavior of the node degrees in the ensemble average of adjacency matrix. Netw. Sci. 2016, 4, 385–399. [Google Scholar] [CrossRef] [Green Version]
  63. Gao, H.; Stenstrom, M.K. Evaluation of three turbulence models in predicting the steady state hydrodynamics of a secondary sedimentation tank. Water Res. 2018, 143, 445–456. [Google Scholar] [CrossRef]
Figure 1. Structure of the central feedwell of the thickener, (a) Dimensional and structural drawings of the thickener in the vertical plane; (b) Size and structure of the feedwell in the thickener (a).
Minerals 13 00309 g001
Figure 2. Structure of the conical deflector: (a) αa = 60°; (b) αb = 60°, with the bottom height of the conical deflector of (b) being 1766 mm higher than that of (a); (c) αc = 30°; and (d) αd = 21.1°.
Minerals 13 00309 g002
Figure 3. Grid configuration.
Minerals 13 00309 g003
Figure 4. Grid independence verification.
Minerals 13 00309 g004
Figure 5. Volume fraction of the sediment layer after free settling of the coal-slurry water.
Minerals 13 00309 g005
Figure 6. Laser particle size distribution of coal sample for test.
Minerals 13 00309 g006
Figure 7. Calibration of the volume fraction parameter of each equivalent particle size floc among the total flocs (Where the red arrows indicate zooming in on the picture and displaying the panorama; the blue arrows indicate signalling; and the dashed lines indicate the operation process.).
Minerals 13 00309 g007
Figure 8. Volume fraction of flocs of each equivalent particle size among the total flocs.
Minerals 13 00309 g008
Figure 9. Schematic of the simulation boundary conditions.
Minerals 13 00309 g009
Figure 10. Internal flow-field distribution and velocity characteristics of the feedwell: (a) αa = 60°; (b) αb = 60°, with the bottom height of the conical deflector of (b) being 1766 mm higher than that of (a); (c) αc = 30°; and (d) αd = 21.1°.
Minerals 13 00309 g010
Figure 11. Evolutionary characteristics of macroscopic vortices in the feedwell with different types of deflectors: The red areas in (1) indicates the main distribution range of the solid phase. (a) αa = 60°; (b) αb = 60°, with the bottom height of the conical deflector of (b) being 1766 mm higher than that of (a); (c) αc = 30°; and (d) αd = 21.1°.
Minerals 13 00309 g011
Figure 12. Distribution of the minimum vortex scale in the flow field of the feedwell: (a) αa = 60°; (b) αb = 60°, with the bottom height of the conical deflector of (b) being 1766 mm higher than that of (a); (c) αc = 30°; and (d) αd = 21.1°.
Minerals 13 00309 g012
Figure 13. Variation in the turbulence evaluation index of the external flow field for different types of conical deflectors.
Minerals 13 00309 g013
Figure 14. Floc distribution at each scale in the flow field of the feedwell: (ad) show the distribution of four different sizes of flocs in the flow field inside and outside the feedwell, respectively.
Minerals 13 00309 g014
Figure 15. Variation in the volume fraction of flocs at each scale in the flow field of the feedwell according to the angle α of the deflector plate.
Minerals 13 00309 g015
Figure 16. Variation in volume fraction of flocs at each scale in the external flow field for different types of conical deflectors.
Minerals 13 00309 g016
Table 1. Fragment size distribution.
ParameterValue
Bins9
Ratio exponent2
Min. Diameter (mm)0.045
Max. Diameter (mm)1.814
Table 2. CFD–PBM coupling simulation floc parameters.
DesignationBin 0Bin 1Bin 2Bin 3Bin 4Bin 5Bin 6Bin 7Bin 8
Equivalent diameter (mm)1.8101.1400.7200.4500.2900.1900.1100.0710.045
Volume fraction0.1050.1240.0920.1340.1270.1390.1370.1400.001
Table 3. Boundary conditions for the numerical simulation.
ParameterValue
Inlet velocity (m·s−1)1.44
Solid density (kg·m−3)1440
Angular speed of stirring shaft (rpm)1.6
Inlet hydraulic diameter (mm)575
Underflow port hydraulic diameter (mm)3700
Free liquid surface hydrodynamic diameter on the side (mm)3585
Disclaimer/Publisher’s Note: The statements, opinions and data contained in all publications are solely those of the individual author(s) and contributor(s) and not of MDPI and/or the editor(s). MDPI and/or the editor(s) disclaim responsibility for any injury to people or property resulting from any ideas, methods, instructions or products referred to in the content.