Abstract
Coal-fired thermal power plants that meet the huge energy demand of China largely contribute to carbon emissions, environmental pollution, and human health issues. To investigate the impact of coal-fired power plants on the environment in the most developed region of eastern China, samples of feed coal, limestone, slag, fly ash, and flue gas desulfurization (FGD) gypsum were collected from two coal-fired power plants in Hefei City, Anhui Province, China. The concentrations of trace elements in these samples were determined using inductively coupled plasma mass spectrometry (ICP-MS). The results show that the feed coal was slightly rich in V, Cr, Se, In, Sb, Pb, and Ga compared to common Chinese coal. Most trace elements were concentrated in fly ash, especially in the fine particles. Only Sc, Cr, Rb, and Ba were enriched in slag. The smaller the particle size of the fly ash, the higher the fraction of volatile trace elements. The elemental concentrations of old fly ash, which was precipitated in the well of the flue gas pipeline, did not show noticeable differences from fresh fly ash. In addition, the short-time storage of fly ash did not influence the trace elements. To understand the possibility of recovering rare earth elements from coal combustion by-products, the outlook coefficients (Coutl) of coal combustion by-products for the Wanneng (WN) and Tianyuan (TY) power plants were calculated, and they were found to be promising for rare earth elements plus yttrium (REY) recovery. However, as per the evaluation diagram of cut-off grade and Coutl values, all feed coal and its by-products from these two coal-fired power plants are projected to be ‘unpromising’. Therefore, the coal combustion by-products from the WN and TY coal-fired power plants were not candidates for REY recovery.
1. Introduction
Coal-fired thermal power generation accounted for more than 60% of China’s power supply in 2020 [1]. The carbon emitted from coal consumption, especially coal-fired power generation, is the main contributor to the total carbon emissions of China [2]. Although carbon neutrality is expected to be fully achieved by 2060, coal would still be required for power peak regulation [1]. Moreover, as China is rich in coal resources, coal will still play an important role in China’s energy structure in the future. Thus, the comprehensive, efficient, and clean utilization of coal is an available and necessary way to achieve carbon peak and carbon neutrality [3].
During coal combustion and its by-products’ disposal, the migration, partitioning, and release of toxic trace elements are harmful to human health and the environment [4,5,6]. Therefore, coal-fired power plants are considered the most important anthropogenic contributors of toxic elements to the environment [7,8,9]. Fly ash is discharged into ash ponds, posing a long-term threat to groundwater, surface water, and even local ecosystems [10]. The distribution, enrichment, and modes of occurrence of toxic trace elements in coal by-products are critical for clean coal utilization [11,12,13] and are the scientific basis for choosing pollution control methods and/or technologies [14,15]. Trace elements provide useful information for controlling toxic element pollution during coal combustion and utilization [16,17,18].
Approximately 85% of the world’s rare earth elements are produced by China [19]. Critical elements, such as Ge, Ga, U, V, Se, and rare earth elements plus yttrium (REY), in coal and/or its by-products are promising alternatives to traditional ore deposits [20]. While coal combustion by-products, such as fly ash and flue gas desulfurization (FGD) gypsum, usually end up in landfills, recovering critical elements from them represents a meaningful paradigm shift for coal. Coal by-products have suitable utilization prospects and many economic and environmental benefits for coal usage [20].
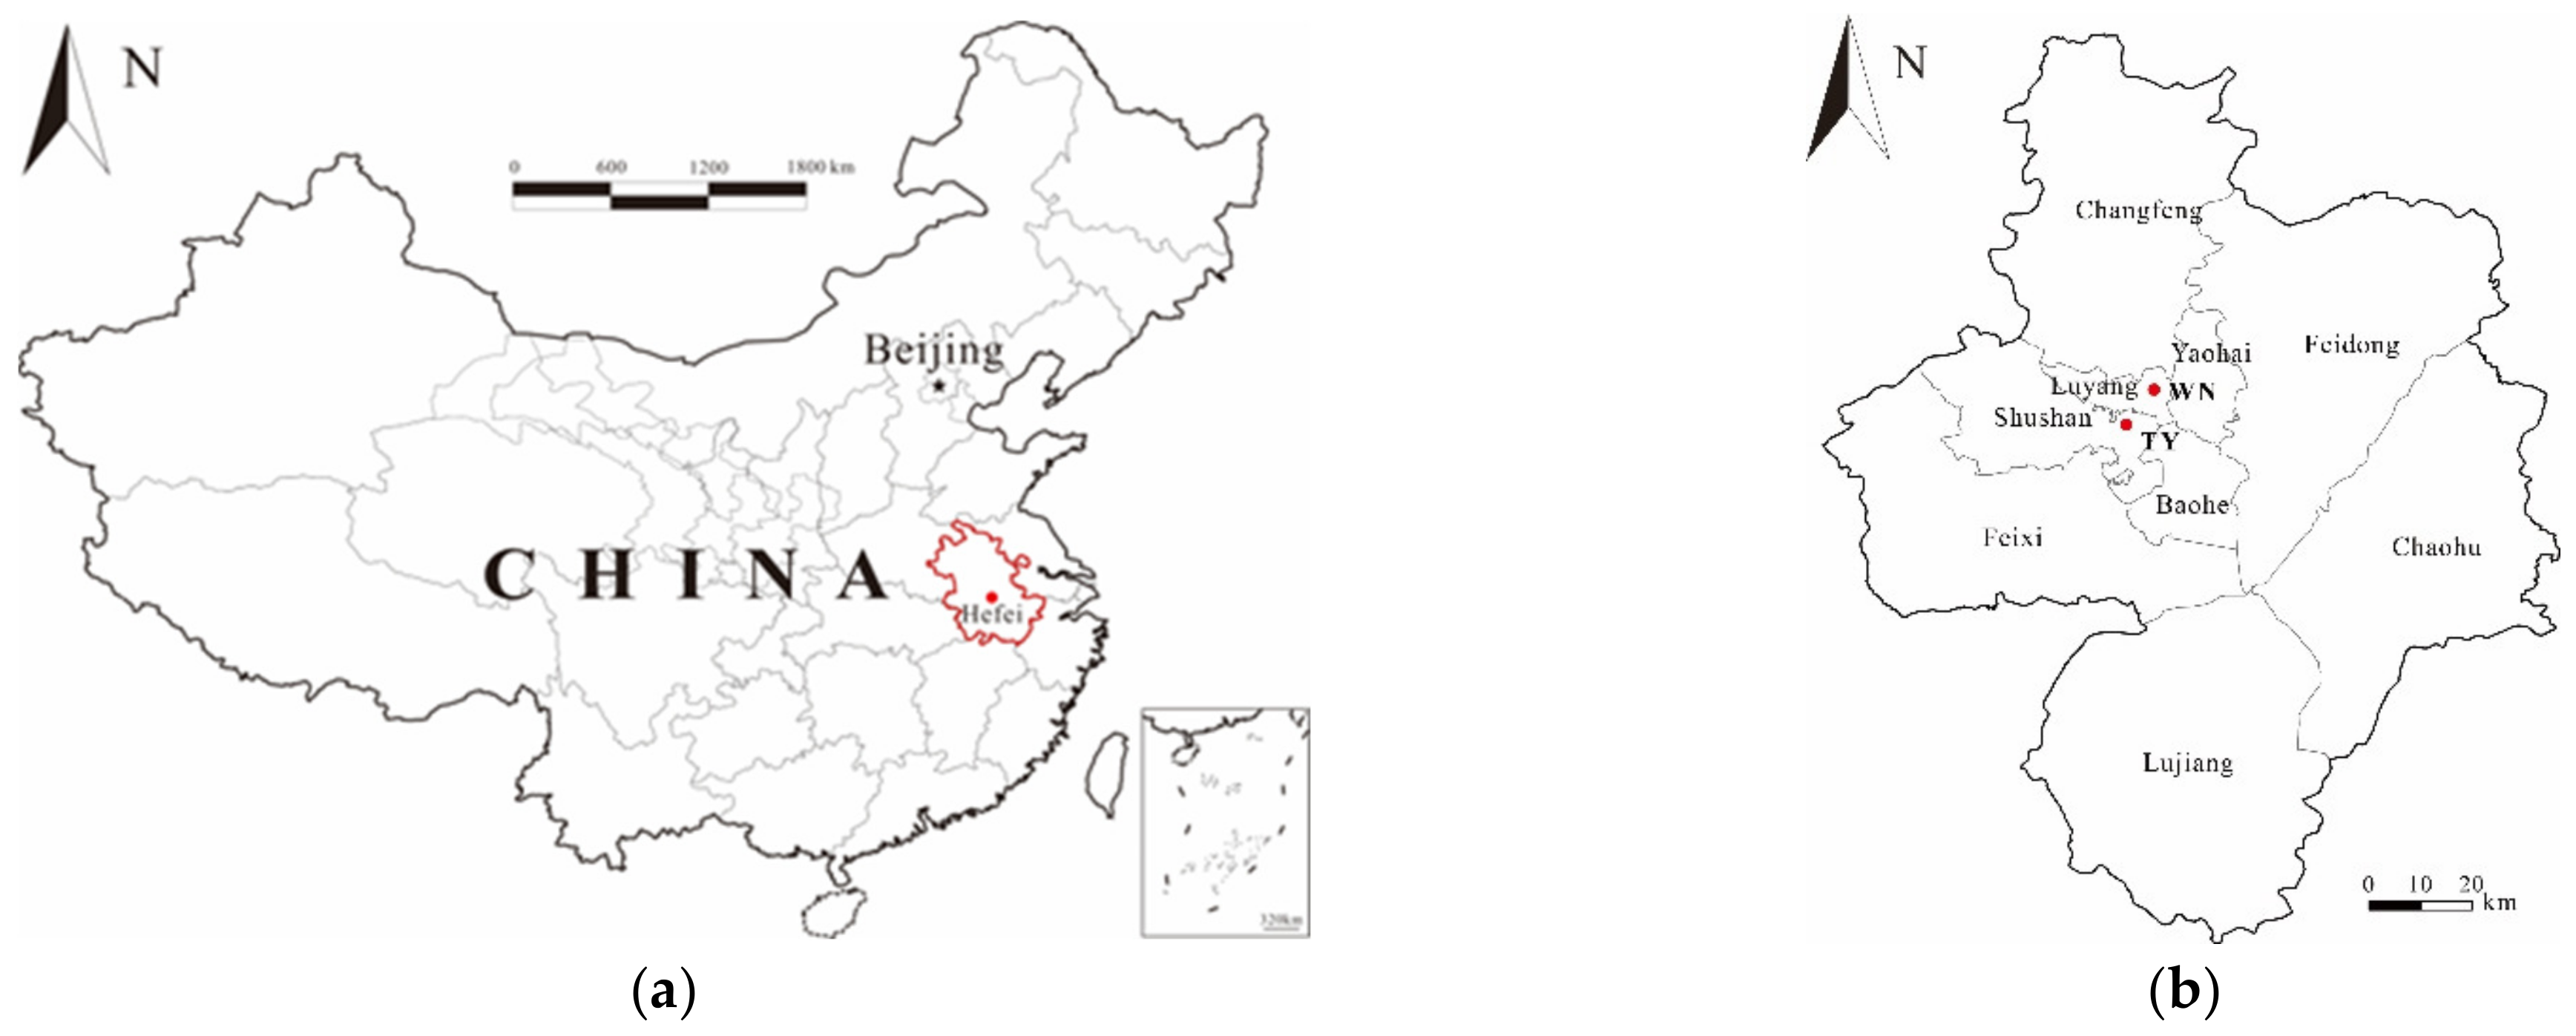
Anhui Province is one of the major coal-based energy suppliers in eastern China [21]. Hefei City, the provincial capital of Anhui, is located at the center of Anhui Province and lies between the Yangtze and Huaihe rivers (Figure 1a); it is an important city in the most developed Yangtze River Delta. Additionally, Hefei is located in a region with a subtropical monsoon humid climate, and the environment in this area, with intensive human activities, is sensitive and vulnerable. Emissions from coal-fired power plants pose a threat to the environment and human health. The objectives of this study were (1) to investigate the partitioning and distribution of trace elements in feed coal and its combustion by-products from two coal-fired power plants in Hefei City, Anhui Province, eastern China; (2) to understand the stability of trace elements in coal ash during storage; and (3) to evaluate the recovery potential of REY from coal combustion by-products.
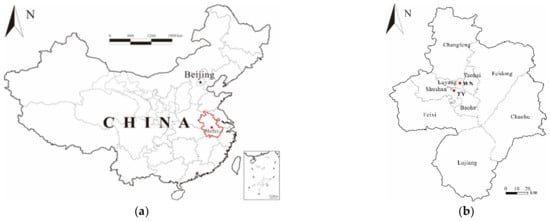
Figure 1.
Locations of Hefei in Anhui Province (red outline) of eastern China (a) and two coal-fired power plants (Wanneng—WN, and Tianyuan—TY) in Hefei City (b).
2. Materials and Methods
2.1. Sampling Sites
Two coal-fired power plants (Wanneng and Tianyuan plants, abbreviated as WN and TY, respectively) in Hefei were chosen as the study objects. The WN and TY power plants are situated at the central and southwestern parts of Hefei, respectively (Figure 1b). According to operators’ records, the powdered raw feed coals in the two plants were transported from the Huainan coalfield in northern Anhui Province. The ash yields of feed coals from the WN and TY power plants were 12.46% and 12.23%, respectively. The average contents of the volatile matter of feed coal were 36.38% and 31.52%, respectively, for these two plants, indicating a high volatile bituminous coal rank [22]. The total sulfur contents of these two feed coals were 0.61% and 0.57%, respectively (Table S1 in Supplementary Materials). The coal quality of raw feed coals was consistent with the Huainan coals reported by Sun et al. [23].
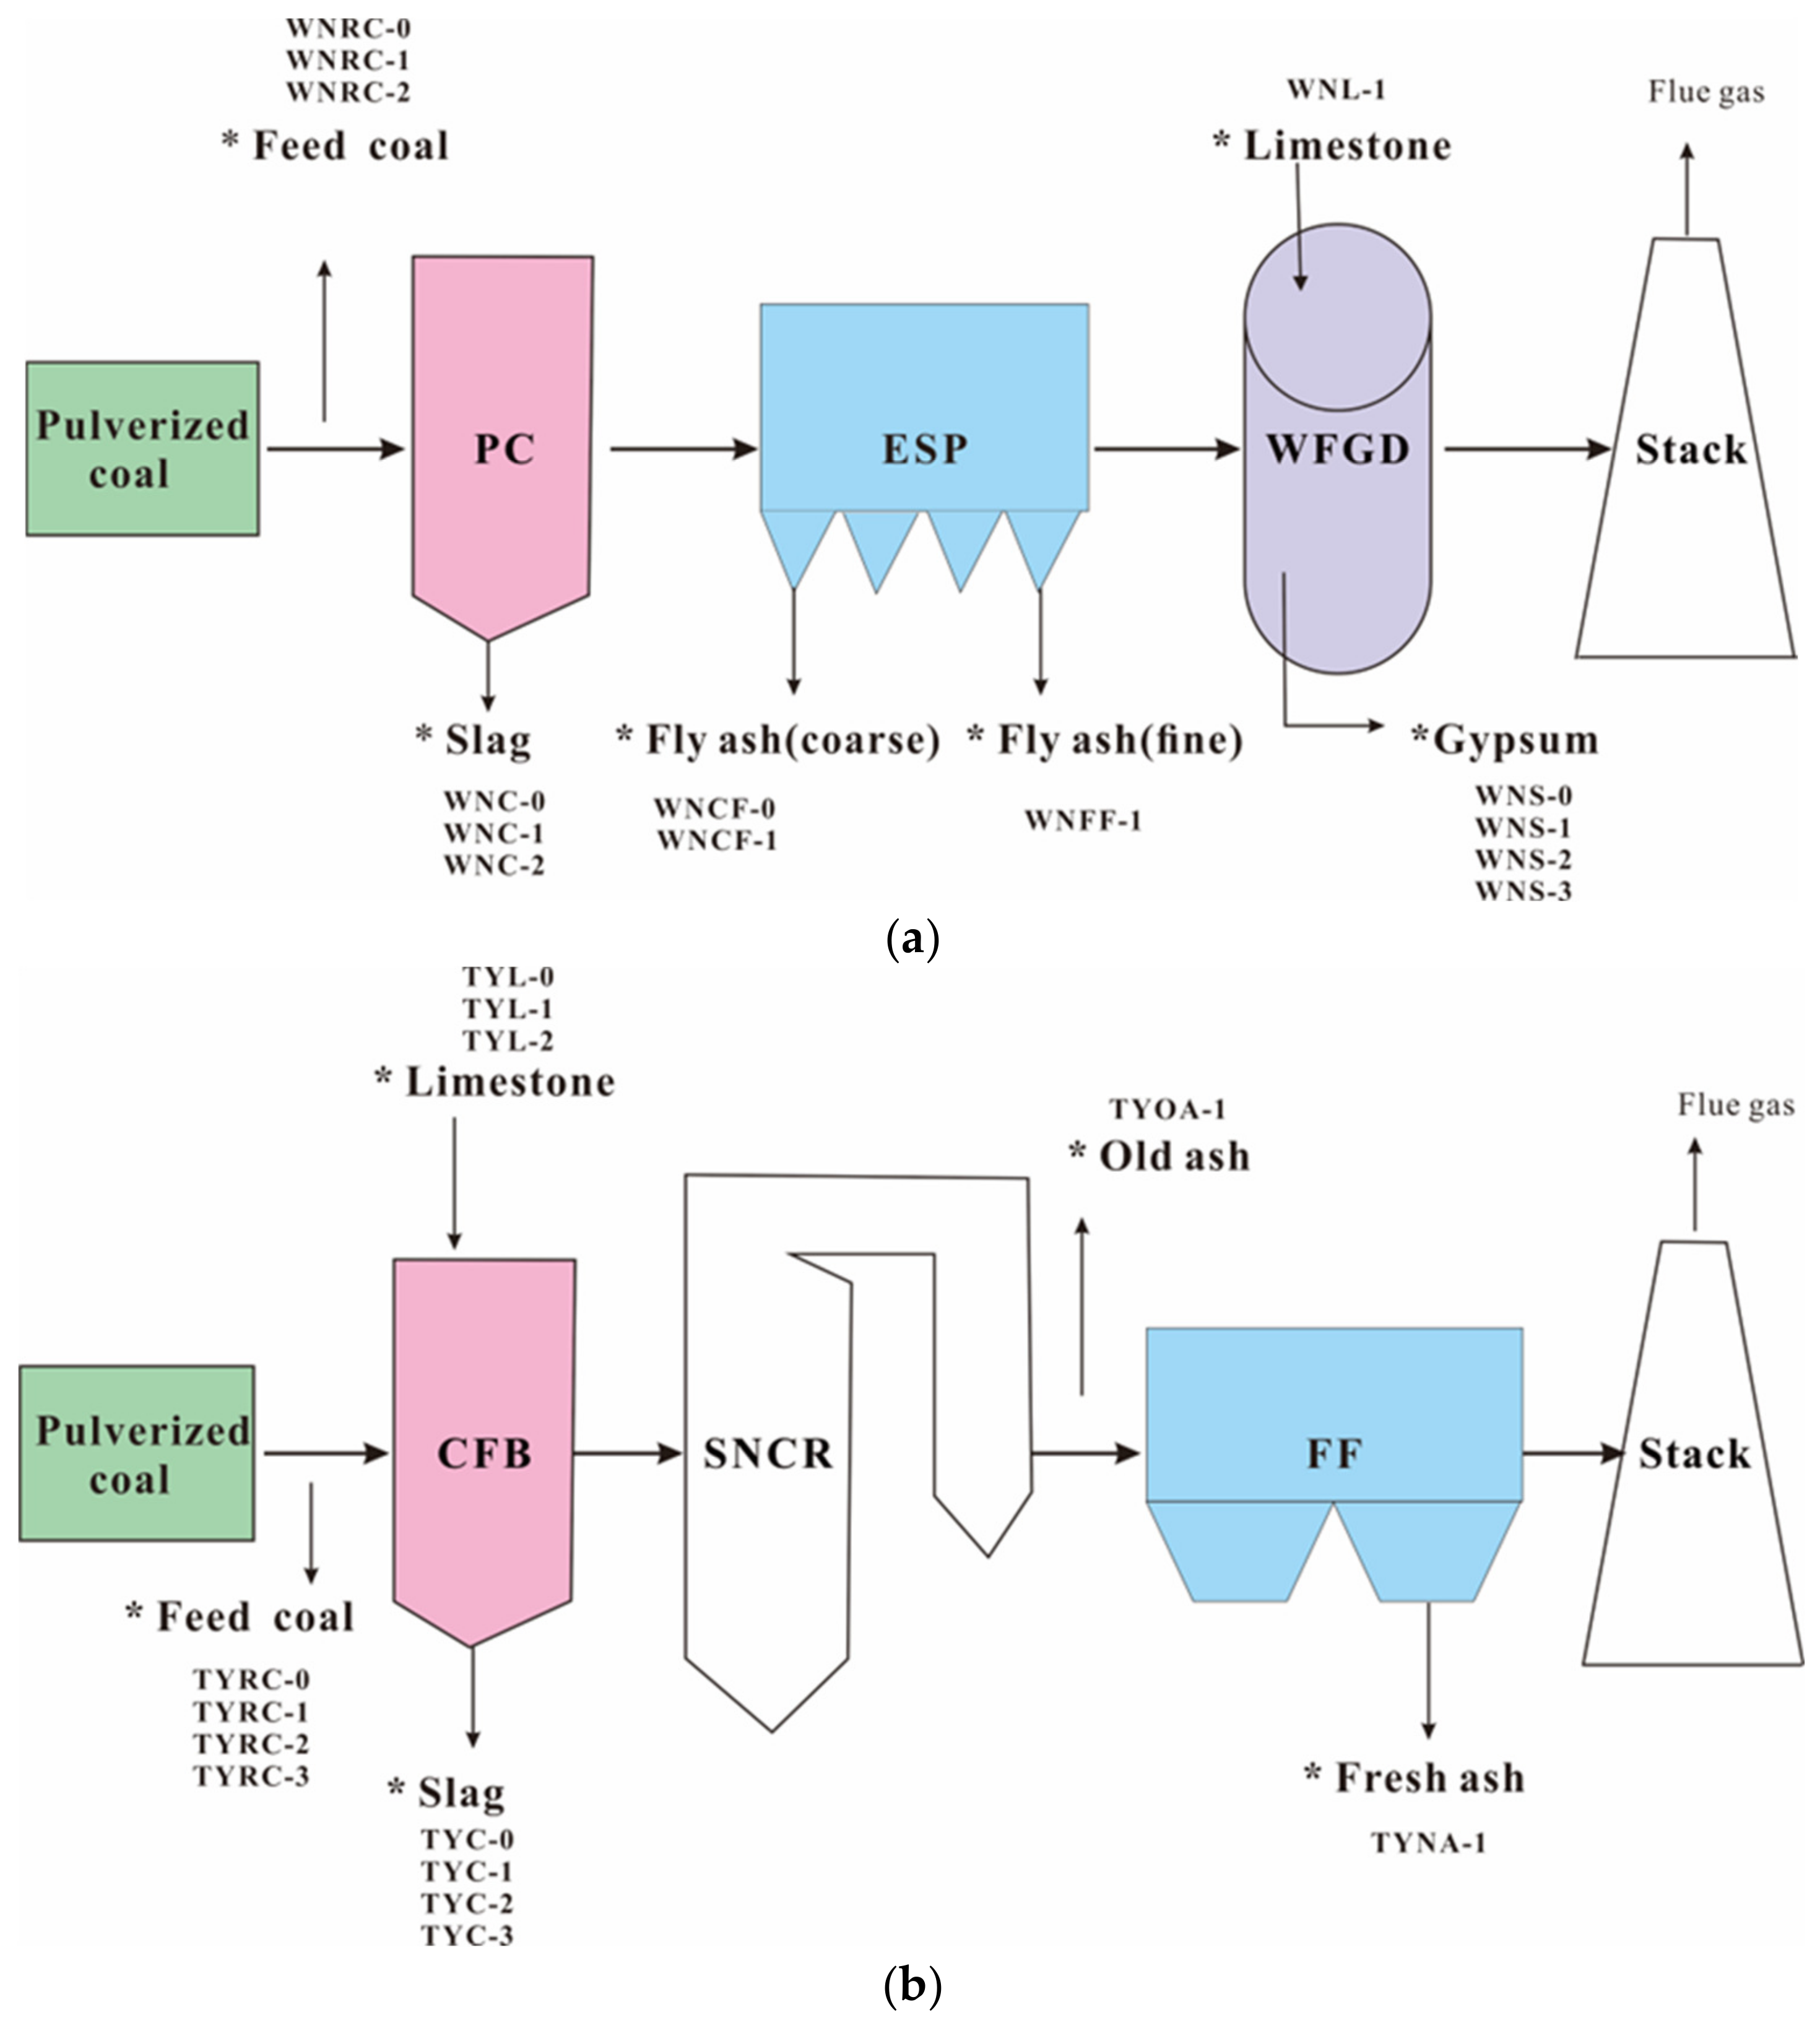
The configuration and air pollution control devices of the WN and TY coal-fired power plants are illustrated in Figure 2. Both boilers and air pollution control sets were differentiated in these two plants. For the WN plant, the powdered raw coal was burnt in a pulverized coal combustion boiler (PC), and then its flue gas was processed by an electrostatic precipitator (ESP, for particles) and wet flue gas desulfurization (WFGD, for sulfur oxides) (Figure 2a). However, a circulating fluidized bed boiler (CFB) was employed in the TY plant. Further, the air pollutants, such as sulfur oxides, nitrogen oxides, and particles, were trapped by a limestone injection in CFB, a selective non-catalytic reduction reactor (SNCR), and a fabric filter (FF), respectively (Figure 2b).
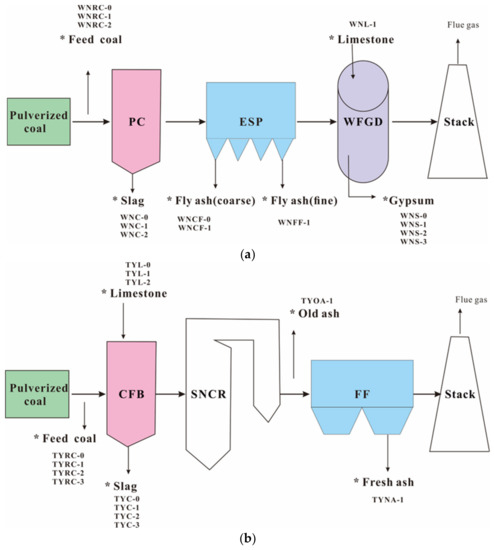
Figure 2.
Operation flow charts of the WN (a) and TY (b) power plants and their sampling points. *: samples; PC: pulverized coal combustion boiler; ESP: electrostatic precipitator; WFGD: wet flue gas desulfurization; CFB: circulating fluidized bed boiler; SNCR: selective non-catalytic reduction reactor; and FF: fabric filters.
2.2. Sampling
Feed coal, slag, and ash from the WN and TY coal-fired power plants were collected following the ASTM standard [24] on 15–19 May 2017. Three raw feed coal samples were sampled from the conveyer before the PC boiler of the WN plant. Slag, coarse and fine fly ash samples were collected from the bottom of the PC boiler, and the first and last cascades of ESP, respectively (Figure 2a). Coarse and fine ashes were used to reveal the influence of particle size on the partitioning of trace elements during coal combustion, especially volatile elements. The raw limestone and its products—FGD gypsums—were sampled at the entrance and exit of the WFGD reactor to investigate the possible impacts of desulfurization on the fate of trace element (Figure 2a).
Another four raw feed coal samples were obtained from the conveyer before the CFB boiler of the TY plant. Slag and fresh ash samples were collected from the bottom of the CFB boiler and the FF bin, respectively (Figure 2b). Compared to the WN plant, a calcium spraying process—limestone addition—was adopted to desulfurize (Figure 2b). Therefore, only raw limestone samples were collected. Due to an FF trapper employed in the TY plant, only one type of ash was sampled. In addition, to understand the stability of trace elements during ash precipitation and short-time storage, two ash samples—that is, old ash and stored ash samples—were scraped from the inside wall of the pipeline linking the SNCR and FF and taken from the ash silo of the TY power plant, respectively (Figure 2b).
A total of 500 g of samples was collected from each sampling site. All the samples were immediately stored in polyethylene plastic bags to prevent contamination. Detailed information on the samples is provided in Figure 2 and Table 1.

Table 1.
Information on the sampling in the WN and TY power plants in Hefei, Anhui Province, eastern China.
2.3. Experiments
The obtained samples were air-dried, manually crushed using an agate mortar, and passed through a 200-mesh sieve. The powdered samples were stored in amber glass bottles (250 g) for subsequent chemical analysis.
The concentrations of most trace elements were measured by inductively coupled plasma mass spectrometry (ICP-MS), according to the method proposed by Dai et al. [25]. For the ICP-MS analysis, the powdered samples were digested using a microwave digestion system. An acidic mixture of 2 mL of 65% HNO3, 5 mL of 40% HF, and 1 mL of 30% H2O2 was applied to the samples. To avoid polyatomic interference, arsenic and Se were determined using ICP-MS using collision/reaction cell technology proposed by Li et al. [26]. The analysis was performed at the State Key Laboratory of Coal Resources and Safe Mining, China University of Mining and Technology, Beijing, China.
3. Results
3.1. Elements in Feed Coal and Its Combustion by-Products—WN Power Plant
3.1.1. Trace Elements
During coal combustion, the trace elements in coal are partitioned into by-products and/or released with flue gas. The concentrations of trace elements in the feed coal, limestone, and by-products (slag, coarse ash, fine ash, and FGD gypsum) from the WN power plant are presented in Table 2 (Table S2 in Supplementary Materials). The ratio of a trace element’s concentration in coal to its average of Chinese coal (Concentration Coefficient, CC) was used to reflect the enrichment of a trace element in the raw coal of a power plant. The enrichment of trace elements in coal can be divided into six categories: unusually enriched (100 < CC), significantly enriched (10 < CC < 100), enriched (5 < CC < 10), slightly enriched (2 < CC < 5), normal (0.5 < CC < 2), and depleted (CC < 0.5) [27].

Table 2.
Trace element concentrations in feed coal and its by-products from the WN power plant (units: mg/kg on an air-dried basis).
Compared to that in common Chinese coal [29], V (77.2 mg/kg, CC = 2.20), Cr (38.4 mg/kg, CC = 2.49), Se (7.41 mg/kg, CC = 3.00), In (0.15 mg/kg, CC = 3.13), Sb (2.11 mg/kg, CC = 2.51), and Pb (34.3 mg/kg, CC = 2.27) in the feed coals were only slightly enriched (Table 2). Compared to common Chinese coal, Huainan coal was slightly enriched only in Cr, Se, and W [28]. The feed coal of the WN power plant was transported from the Huainan coalfield. A similar pattern of enrichment of elements in the feed coal and Huainan coal further confirms that the feed coals were derived from the Huainan coalfield.
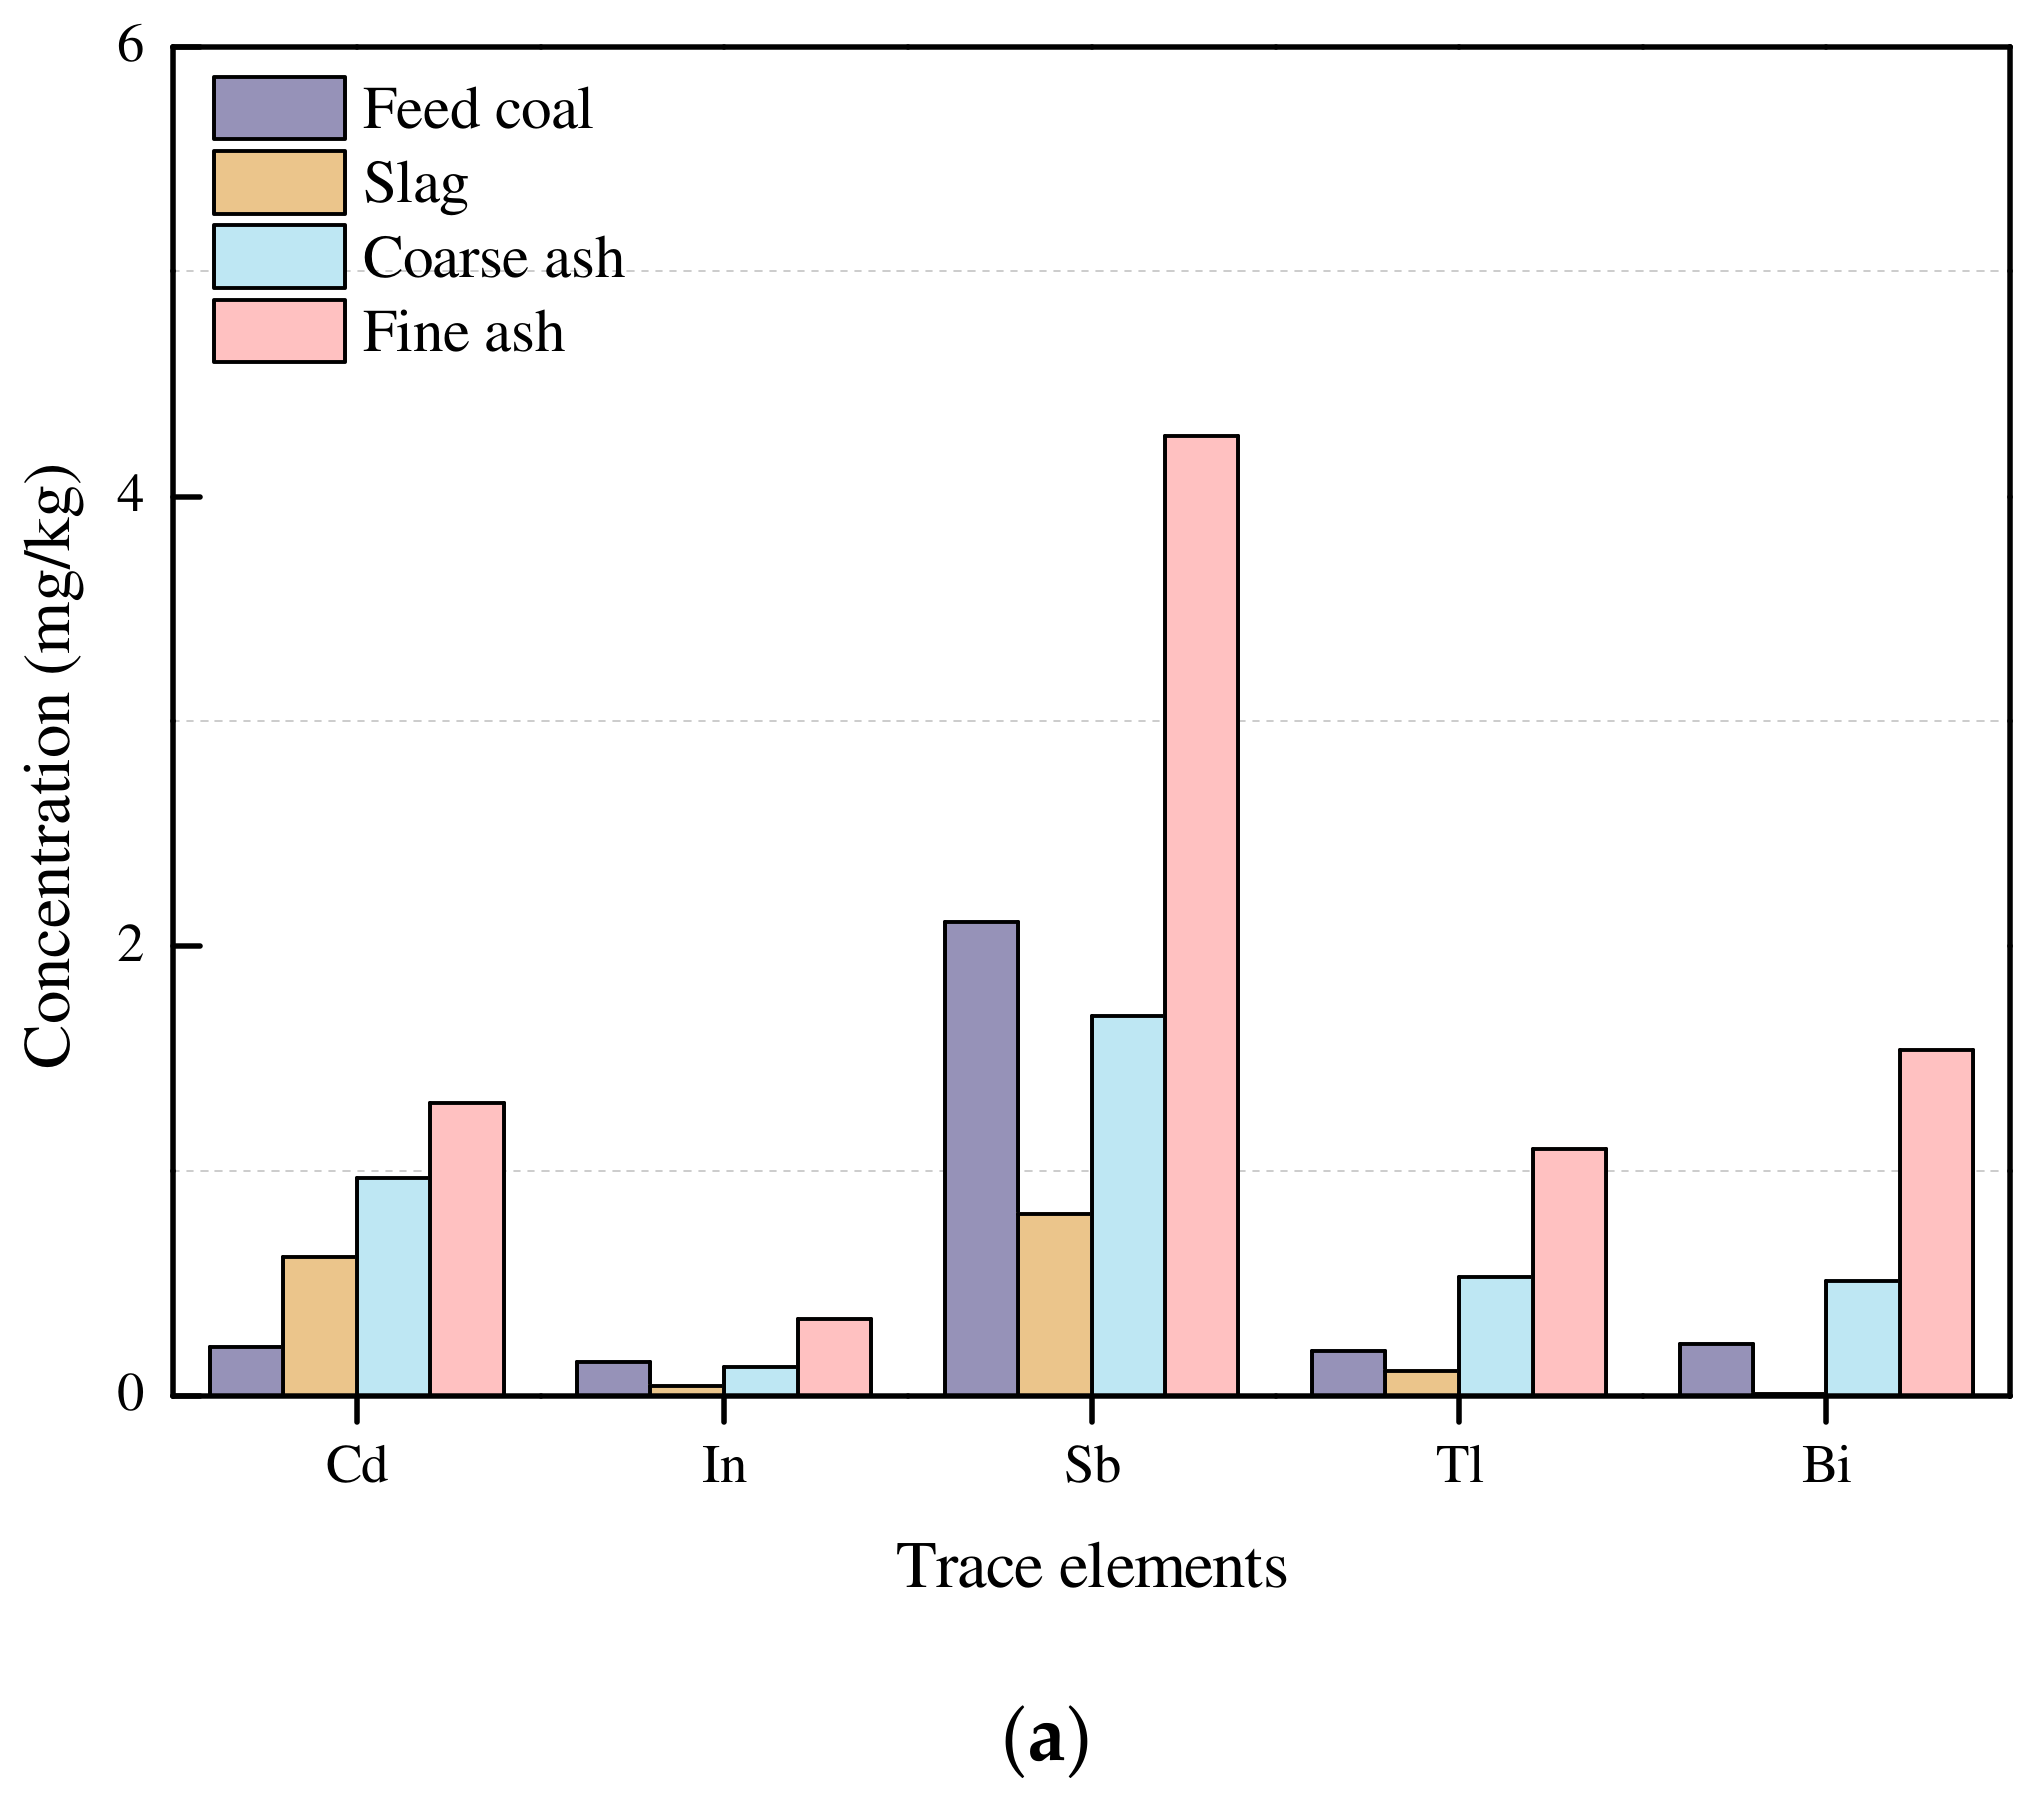
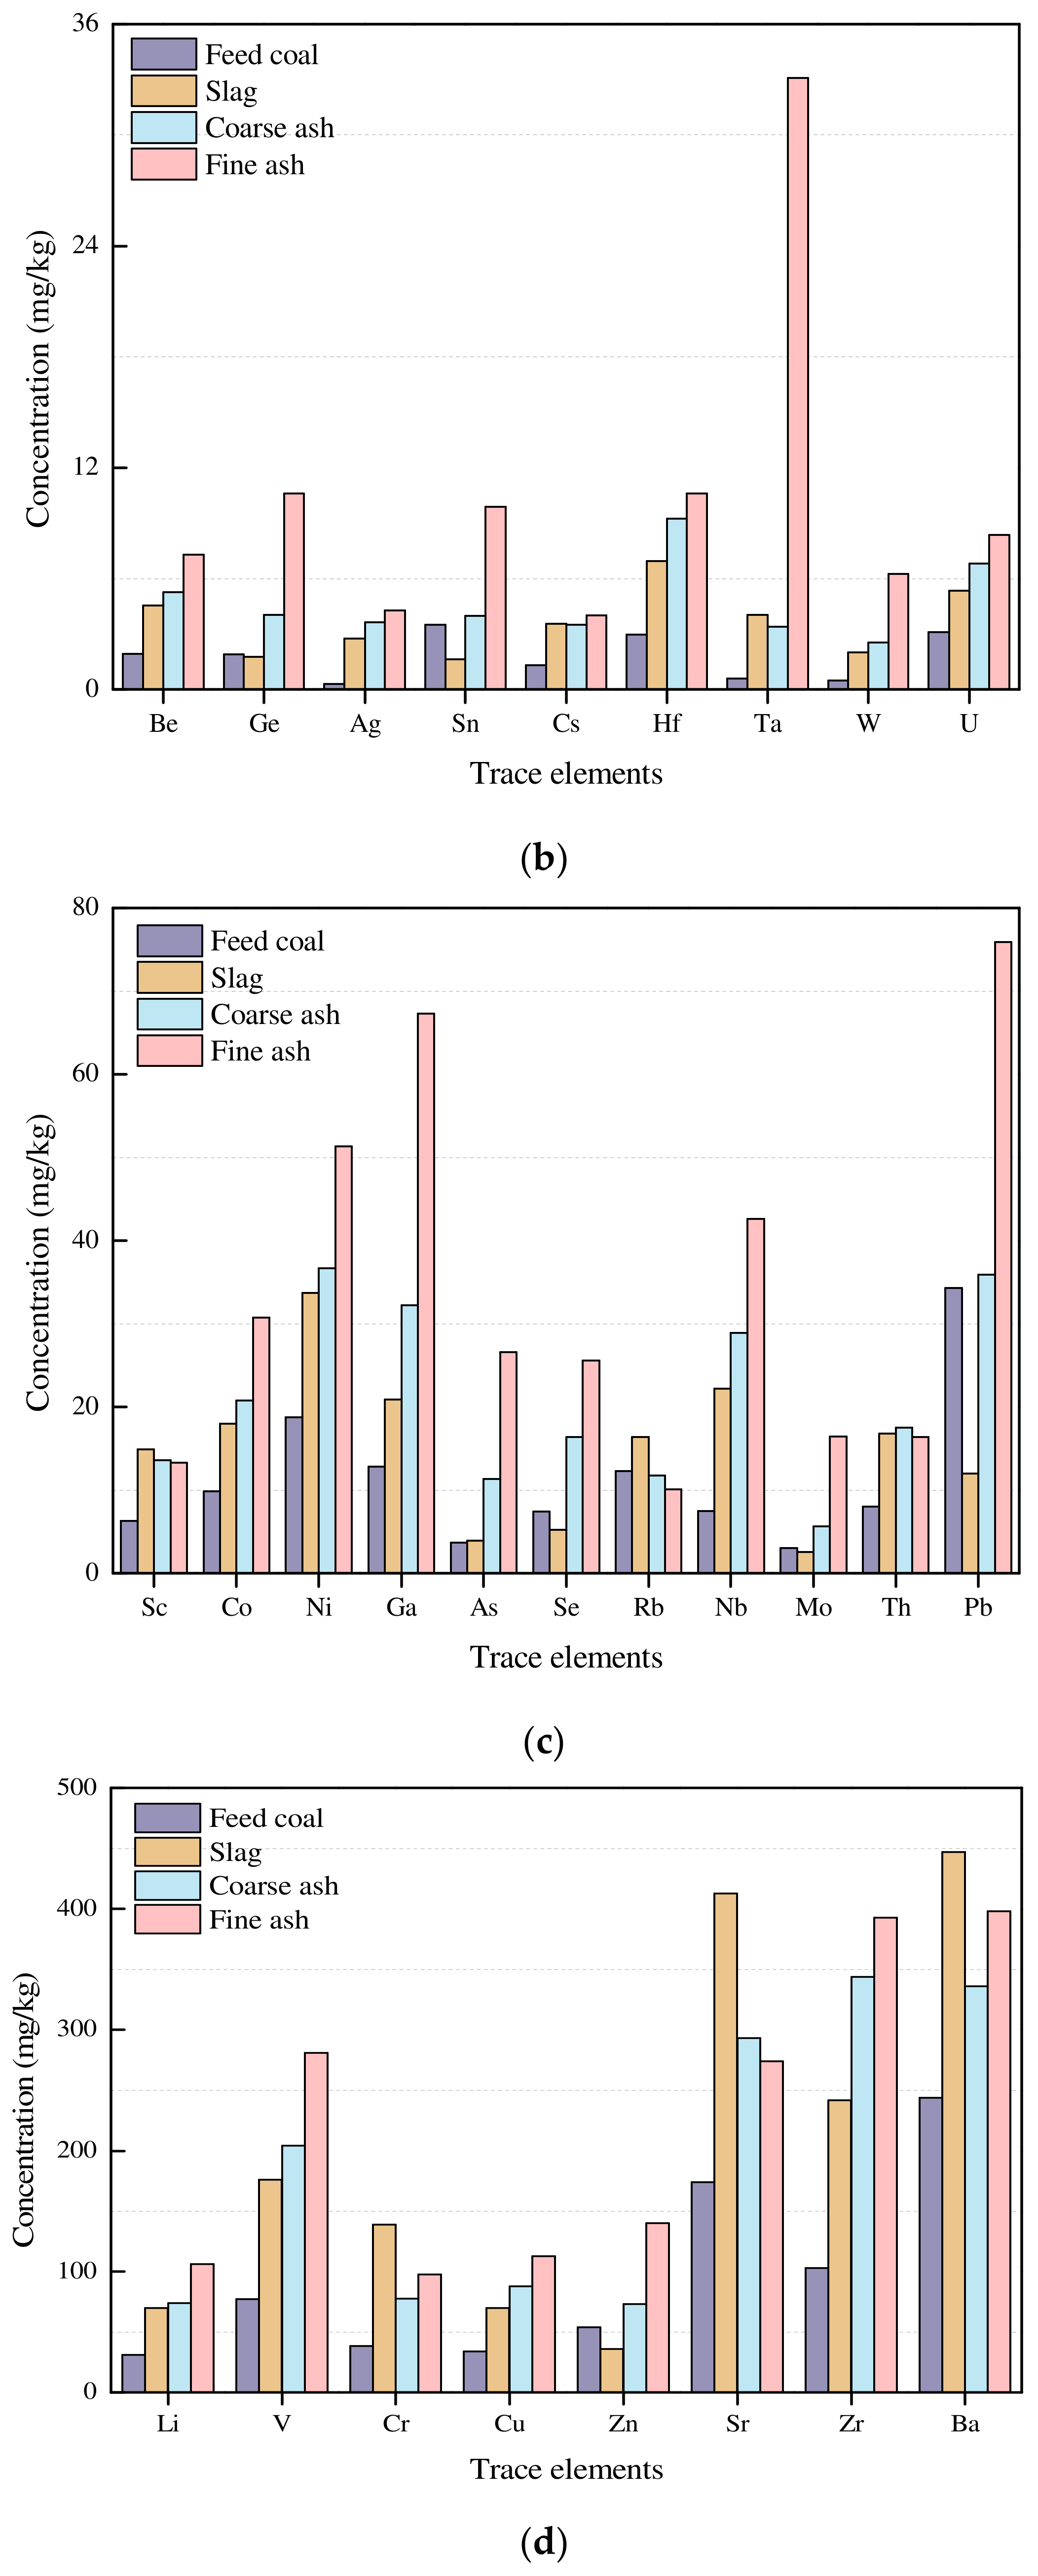
The Concentration Coefficient (CC) of elements in coal by-products compared to that in coal was also applied to reflect the enrichment of elements in slag and fly ash. The enrichment behavior of trace elements in the by-products could be divided into four categories: normal (0.5 < CC < 2), slightly enriched (2 < CC < 5), enriched (5 < CC < 10), and significantly enriched (10 < CC). Compared to that in feed coal, Bi was depleted in slag (Figure 3a), which could be due to its partition into fine fly ash or its release into the atmosphere with flue gas. However, slag was enriched in Ta (Figure 3b).
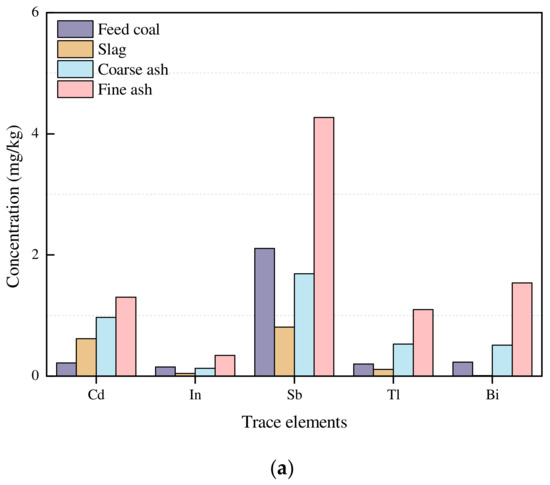
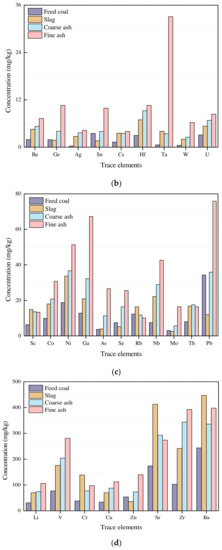
Figure 3.
Comparison of trace elements with concentrations of lower than 5 mg/kg (a), 35 mg/kg (b), 80 mg/kg (c), and 500 mg/kg (d) in feed coal, slag, coarse ash, and fine ash from the WN power plant.
Compared to that in the feed coal, Ga, Ge, As, Nb, Mo, Cd, Tl, and Bi were enriched (Figure 3a–c), and Ta and W were significantly enriched in fine fly ash (Figure 3b). Tantalum and W were enriched in coarse fly ash (Figure 3b). Fly ash is a fine by-product of coal-fired power plants that provides a larger surface area for the condensation of trace elements than slag [13]. The organic-bound elements are easily volatilized and further coagulated on the fly ash surface, resulting in a higher concentration in fly ash than in slag [30].
Based on their partitioning during coal combustion, the trace elements in coal were divided into three groups [31]: Class I, elements that are difficult to volatilize and enrich in the residue; Class II, elements that volatilize during combustion and then condense when the flue gas temperature drops; and Class III, elements that volatilize and release with flue gas. Gallium, Ge, As, Nb, Mo, Cd, Tl, and Bi were classified into Class II by Meij [31], accounting for their enrichment in fine fly ash and the depletion of Bi in the slag of this power plant. Silver and Ta belong to Class I as per Meij [31]; thus, they remained in the residue (slag) and coarse ash particles.
Compared to that in the slag, Zn, Ge, As, Se, Mo, In, Sn, Sb, Tl, and Pb were slightly enriched (Figure 3), and Bi was significantly enriched (Figure 3a) in coarse fly ash. Antimony, Ge, Sn, Pb, Mo, As, In, and Ta were enriched (Figure 3a–c), whereas Tl and Bi were significantly enriched (Figure 3a) in fine fly ash compared to that in slag. When flue gas passes the burning area, the volatilized elements are condensed and further concentrated on the surface of the fly ash particles, resulting in the enrichment of finer fly ash particles. Due to their low volatility, Sc, Cr, Rb, Sr, and Ba are abundant in the slag (Figure 3a,b).
The concentrations of most trace elements in fine fly ash were higher than those in coarse fly ash (Table 2). Specifically, compared to that in coarse fly ash, Ga, Ge, As, Mo, In, Sn, Sb, W, Tl, Pb, and Bi were slightly enriched, and Ta was enriched in fine fly ash (Figure 3a–c). With a decrease in the particle size, the enrichment of Sr, Sc, Rb, and Th decreased, while the enrichment of other elements—for example, Zr, Cs, Ba, and Hf—was not noticeable (Figure 3b–d). Owing to the specific surface area, the surface activity and adsorption capacity of fine fly ash were higher than those of coarse fly ash. The geochemical properties of the elements dominate their distribution, migration, and fate during combustion [32].
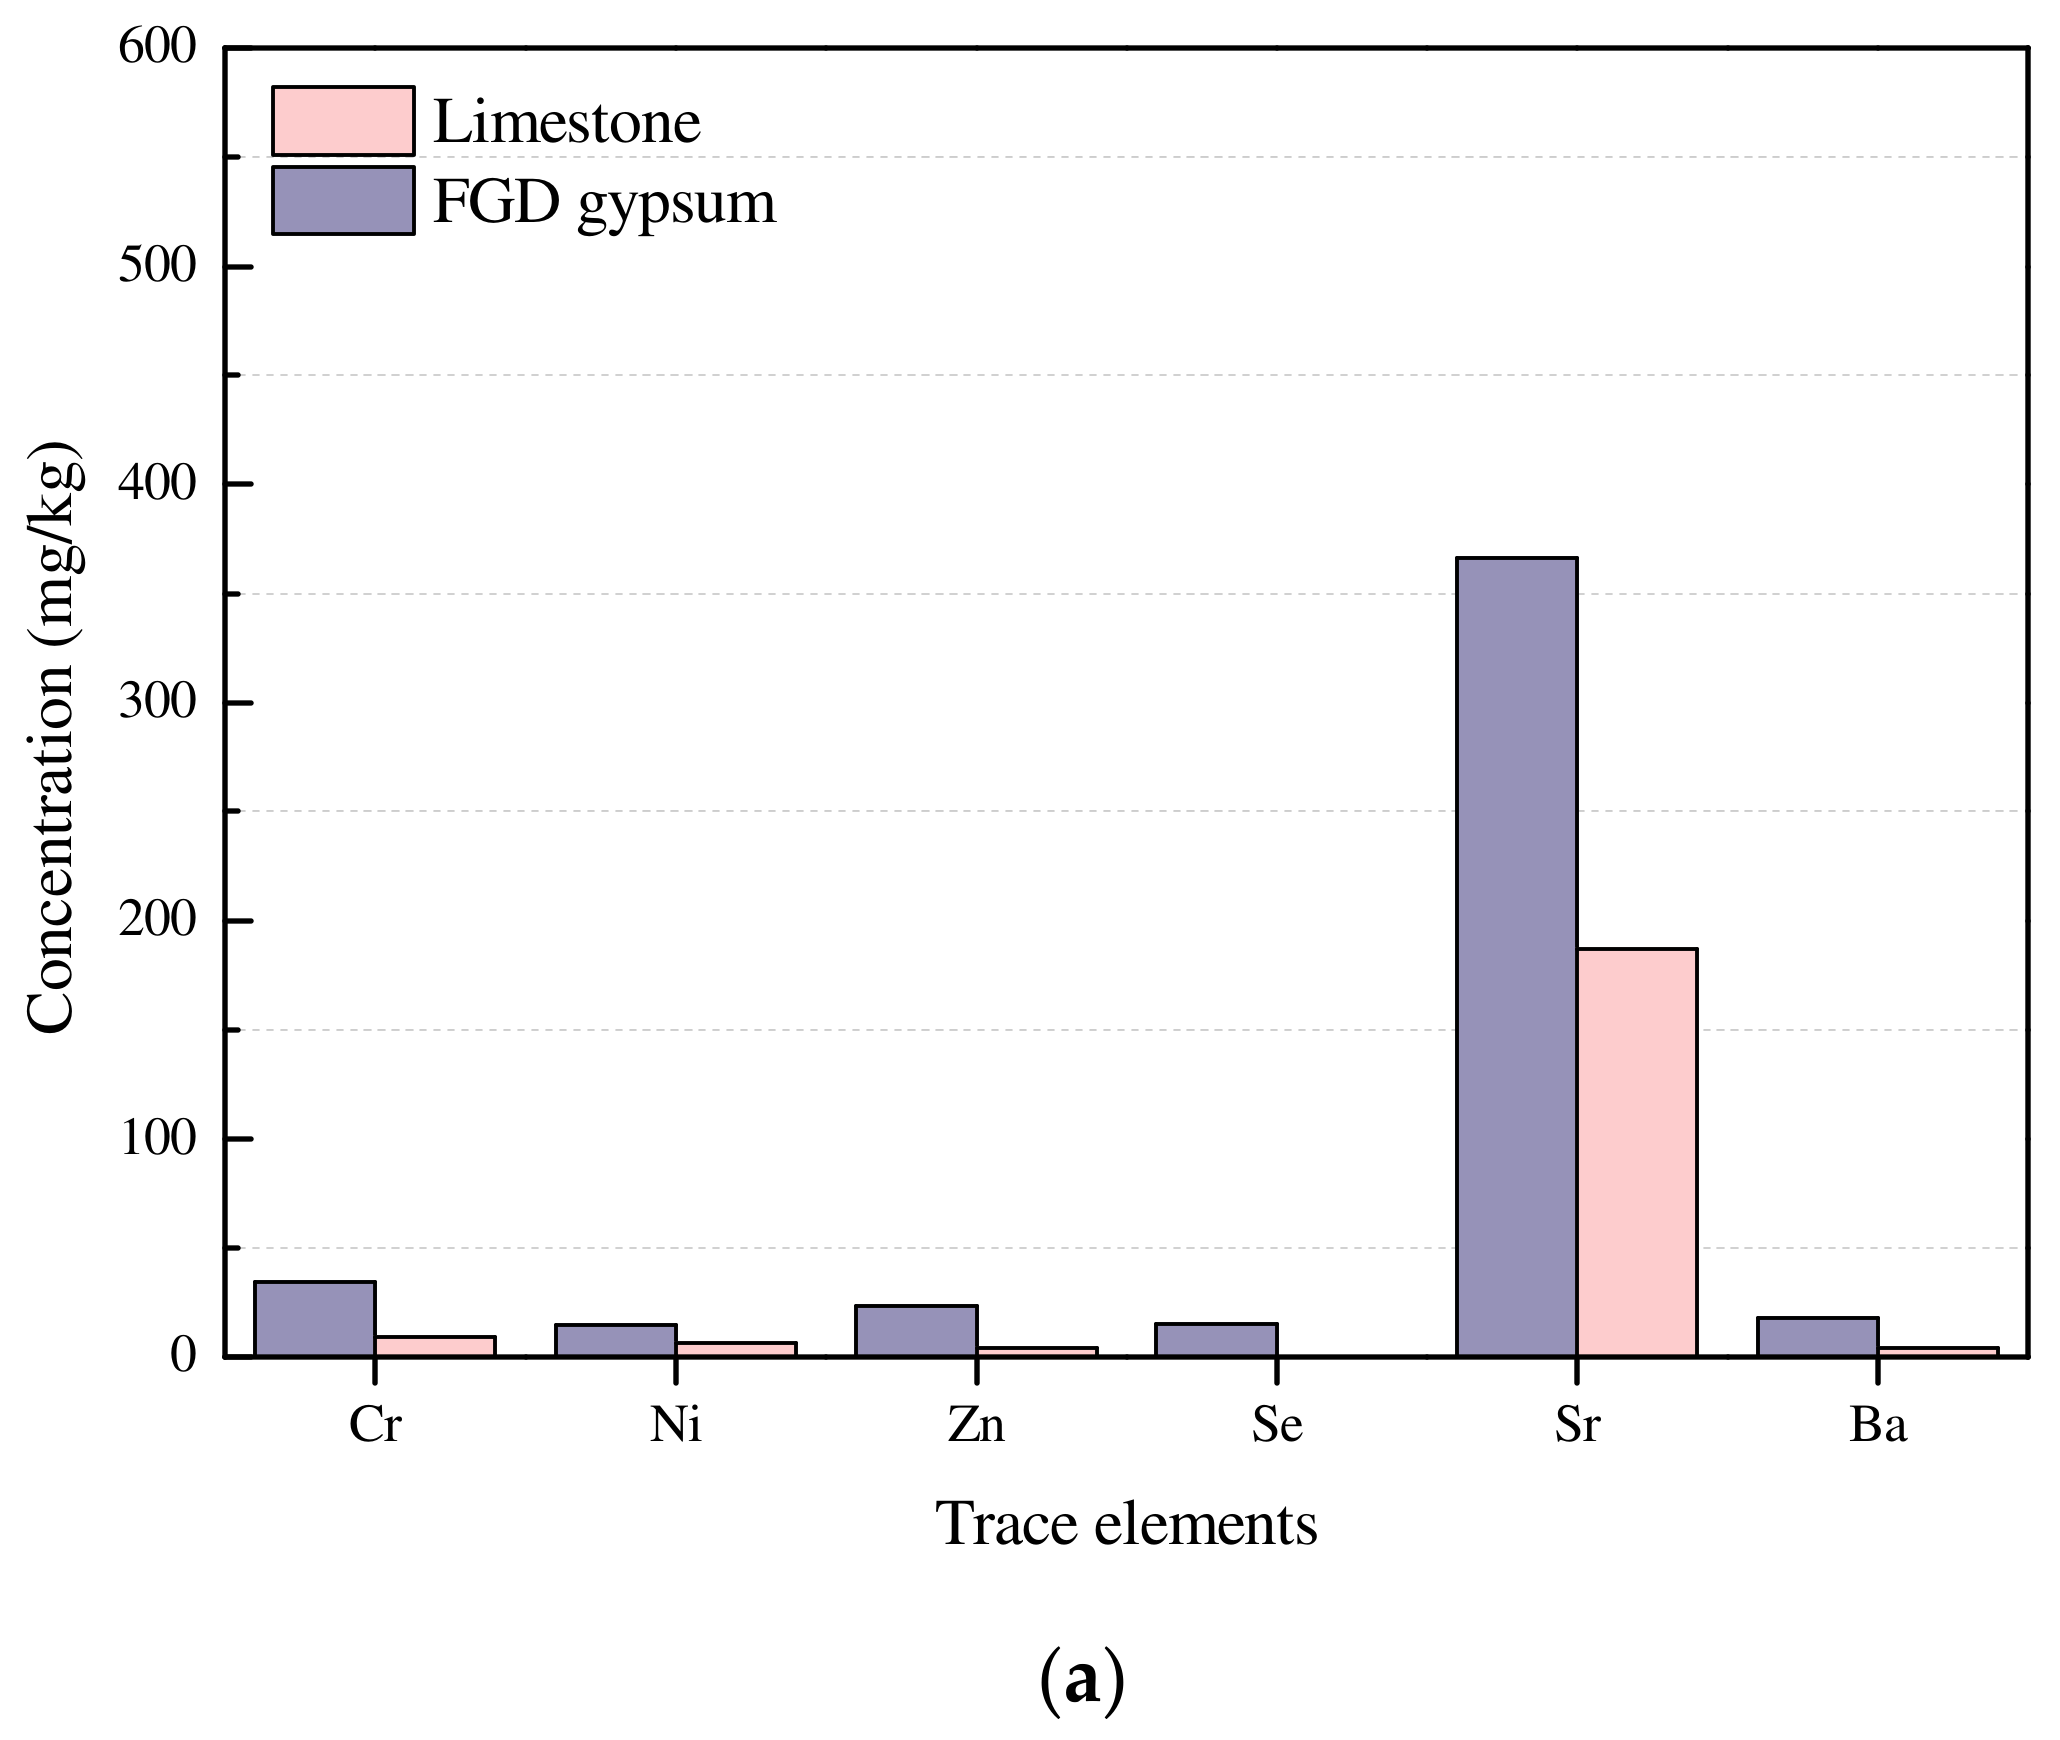
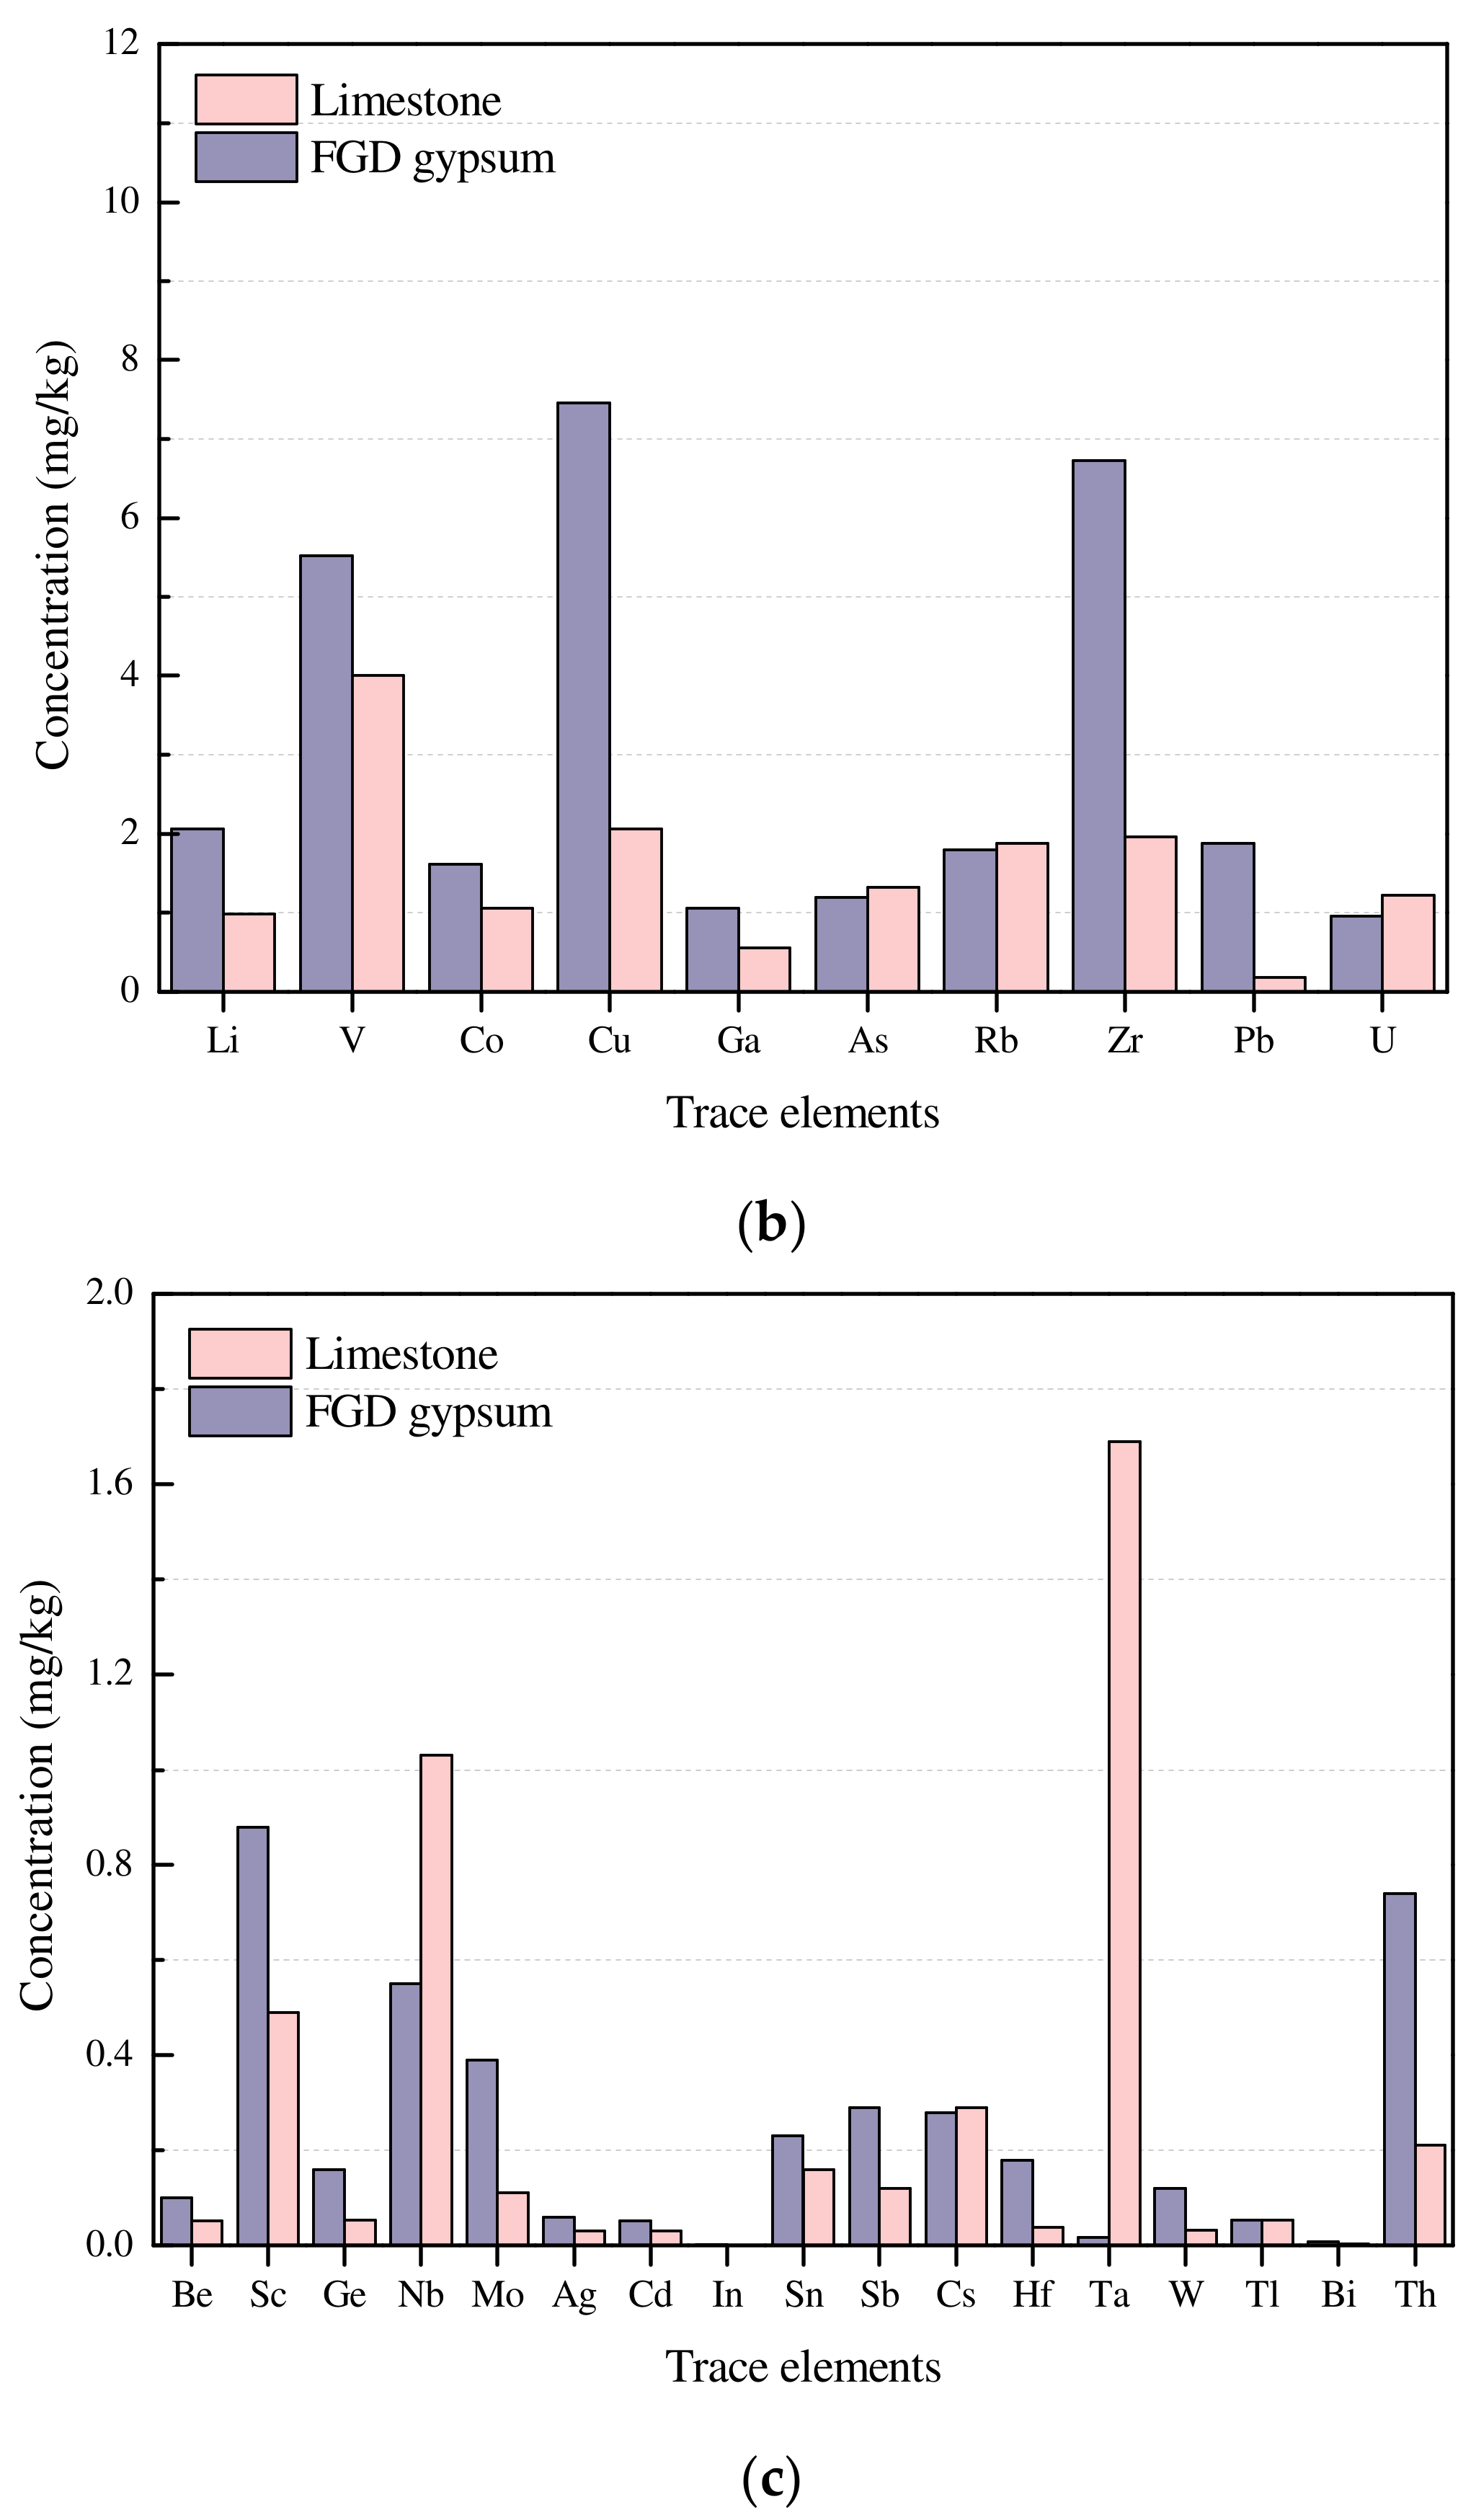
Compared to the concentrations in other coal combustion by-products, the concentrations of trace elements in the FGD gypsum were relatively low (Table 2). However, the concentrations of certain heavy metals, such as Pb and Zn (Figure 4a,b), increased significantly during the FGD. It is worth noting that the concentration of Se in the FGD gypsum increased more than 800 times (Figure 4a and Table 2). This may be because Se is volatilized during combustion, primarily in the form of vapor, and then reacts with CaO to form calcium selenate or calcium selenite, which is eventually captured by the FGD device. During FGD, Se primarily exists as selenite (SeO32−) and selenate (SeO42−), which can also form an array of aqueous chemical complexes [33].
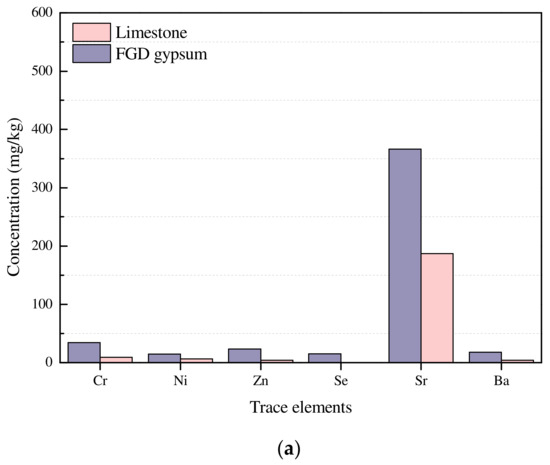
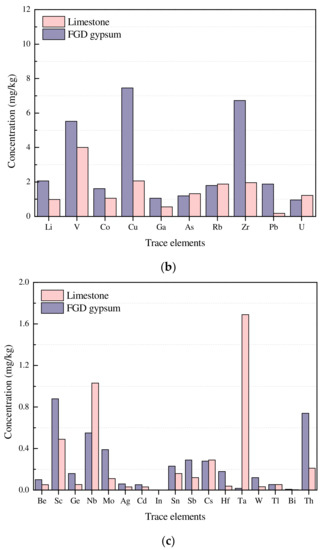
Figure 4.
Comparison of trace elements with concentrations of lower than 400 mg/kg (a), 10 mg/kg (b), and 2 mg/kg (c) in limestone and FGD gypsum from the WN power plant.
3.1.2. REY
The concentrations of rare earth elements and yttrium (REY) in coal and its combustion by-products of the WN power plant, Huainan coal [28], Chinese coal [29], and the upper continental crust (UCC) [34] are presented in Table 3 (Table S3 in Supplementary Materials). The REY concentration in the feed coal was 124 mg/kg, which is slightly lower than that of common Chinese coal (136 mg/kg) [29] and Huainan coal (162 mg/kg) [28]. The REY concentration in slag, coarse fly ash, and fine fly ash from the WN power plant was 289 mg/kg, 292 mg/kg, and 289 mg/kg, respectively.

Table 3.
Concentrations of REY in feed coal and its by-products from the WN power plant (units: mg/kg on an air-dried basis).
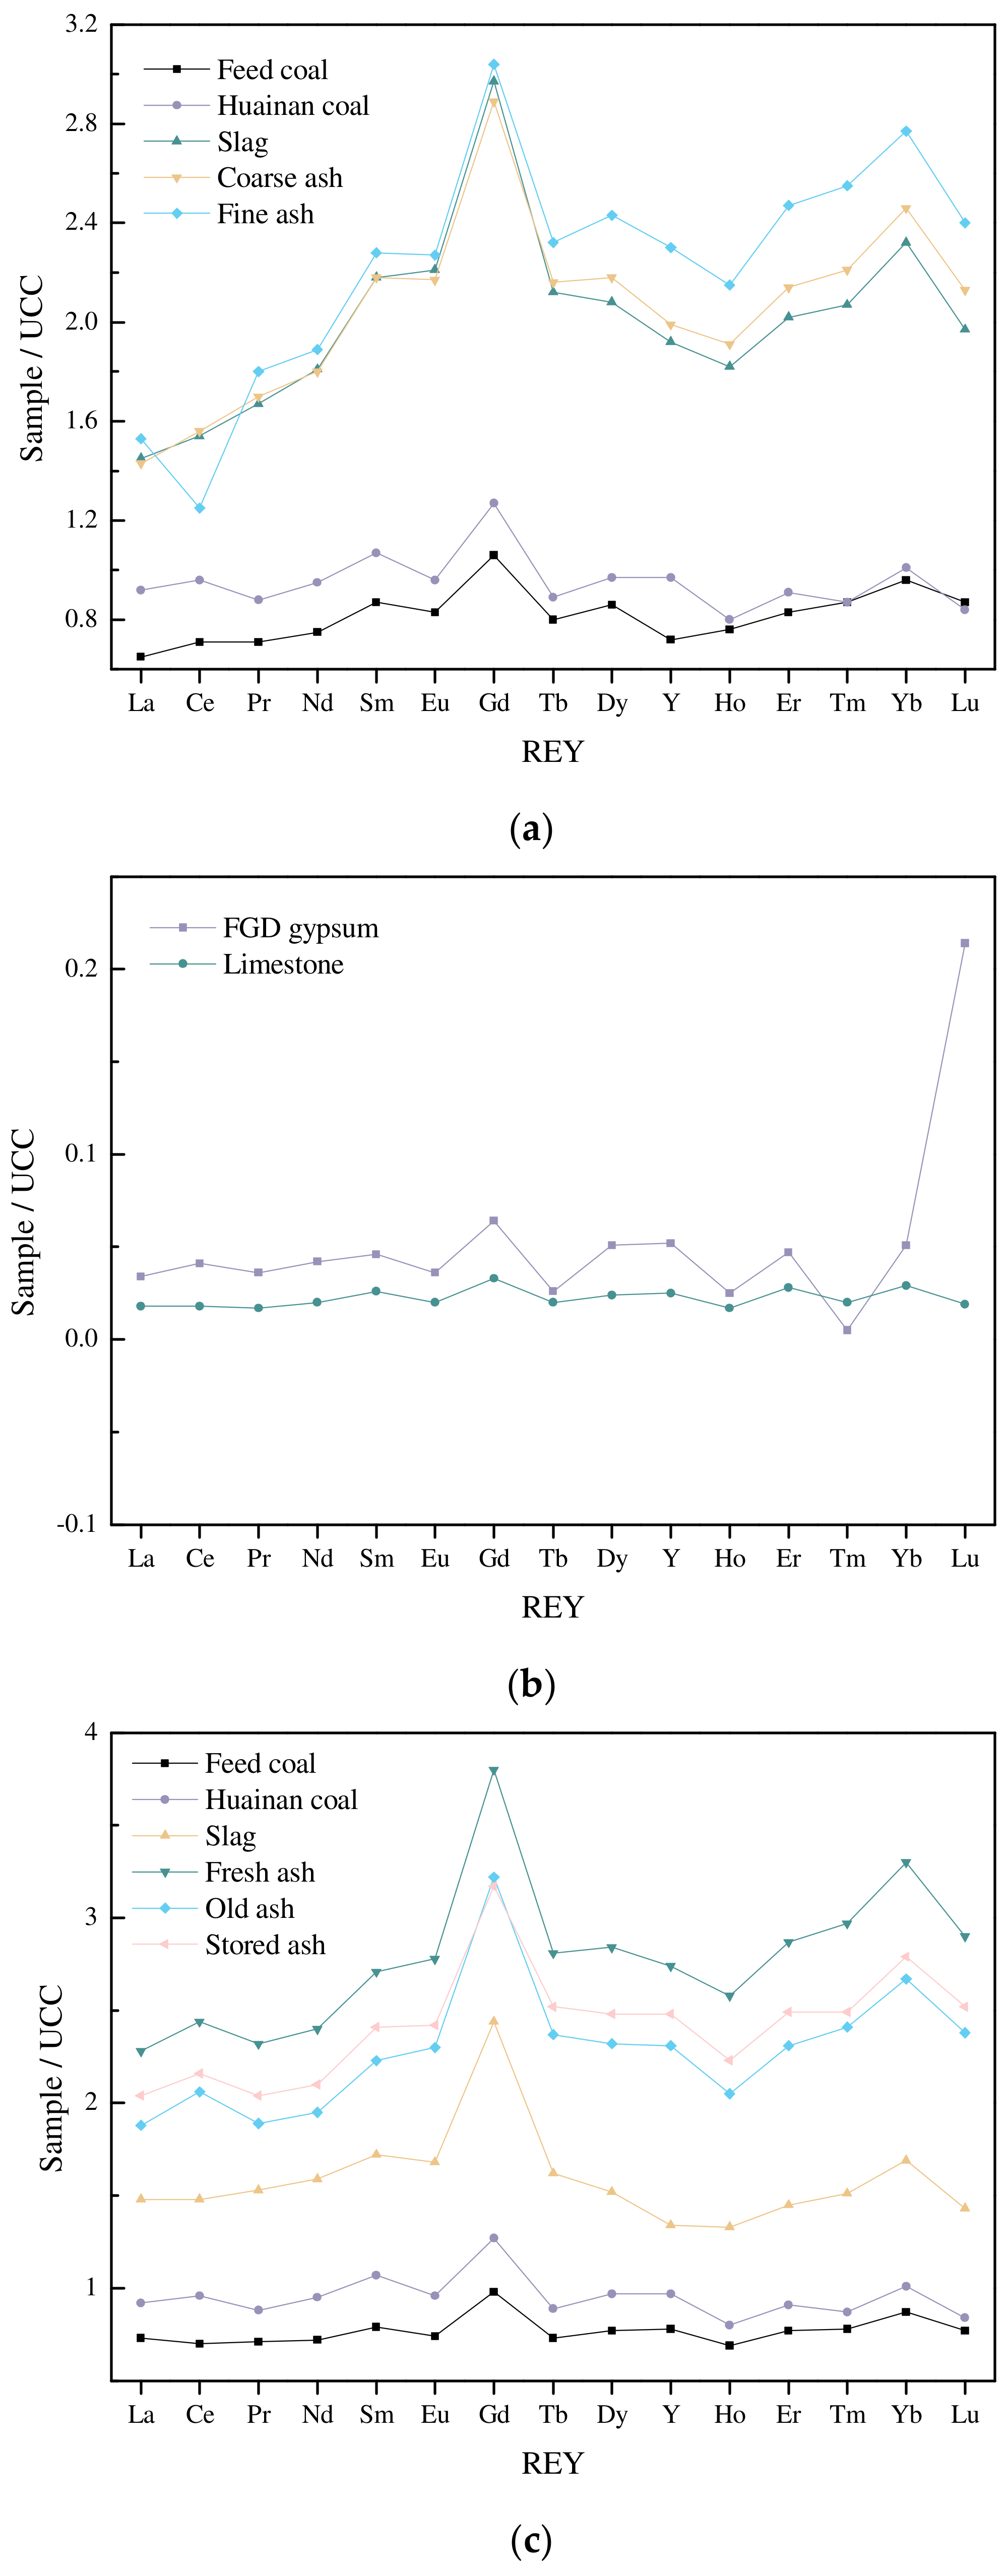
The UCC-normalized REY distribution pattern provides clear fractionation information of REY and geochemical information on its origin [27]. As REYs are non-volatile, they are immobile during coal combustion [20] and are not expected to partition among the by-products. Raw feed coal and its by-products share a similar UCC-normalized REY distribution pattern, characterized by a significantly positive Gd anomaly, a slightly positive Ce anomaly, and a slightly negative Eu anomaly (Figure 5a). Moreover, the UCC-normalized REY pattern of the WN feed coal resembles that of Huainan coal (Figure 5a) [28], further verifying that the raw feed coal is related to Huainan coal. The lines of by-products overhang those of the feed coal, suggesting that REYs are concentrated in the by-products due to the loss of organic matter in coal during combustion.
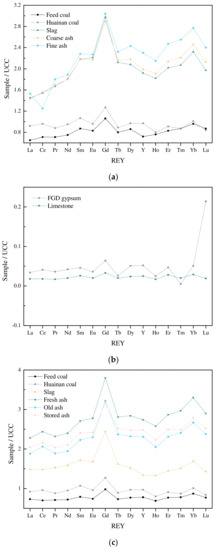
Figure 5.
UCC-normalized REY distribution patterns of the feed coal and various ashes (a) and limestone and FGD gypsum (b) from the WN power plant, and the feed coal and various ashes from the TY plant (c). Data of REY in the Huainan coals and the Upper Continental Crust were cited from Zhang et al. [28] and Rudnick and Gao [34], respectively.
The UCC-normalized REY distribution pattern lines of limestone and FGD gypsum were similar and adjacent, except for Lu (Figure 5b). Additionally, the concentrations of REY in the limestone and FGD gypsum were approximately 3.38 and 7.15 mg/kg (Table 3), suggesting that REYs were not volatized during coal combustion (a low concentration in the flue gas), and the FGD process did not affect the partitioning of REY. The reason(s) for the difference in Lu concentration between limestone and FGD gypsum requires further investigation.
A tri-division REY-enrichment scheme for coal was proposed—that is, L-type (LaN/LuN > 1), M-type (LaN/SmN < 1 and GdN/LuN > 1), and H-type (LaN/LuN < 1) [35]. The UCC-normalized REY distribution patterns of the raw feed coal, its by-products, and Huainan coal exhibited HREY enrichment (Figure 5a), which might be related to the stronger organic affinity of HREY than that of LREY and MREY [28,36,37,38]. It is worth noting that the fractionation of HREY compared to that of MREY and LREY is more noticeable in the by-products than in the feed coal (Figure 5a), which might have resulted from the breakdown of coal organic matter during combustion.
3.2. Elements in Feed Coal and Its By-Products—TY Power Plant
3.2.1. Trace Elements
The concentrations of trace elements in the feed coal, its by-products (slag, fresh ash, old ash, and stored ash), and limestone of the TY power plant are listed in Table 4 (Table S4 in Supplementary Materials). Compared to that in common Chinese coal [29], only V (35.1 mg/kg, CC = 2.19), Cr (15.4 mg/kg, CC = 2.42), Ga (2.78 mg/kg, CC = 2.02), and Se (8.84 mg/kg, CC = 3.58) were slightly enriched in the raw feed coal. Similar to the feed coal of the WN power plant, the feed coal of the TY power plant and Huainan coal showed a similar element enrichment pattern, indicating that the raw coal was imported from the Huainan coalfield.

Table 4.
Trace element concentrations in feed coal and its by-products from the TY power plant (units: mg/kg on air-dried basis).
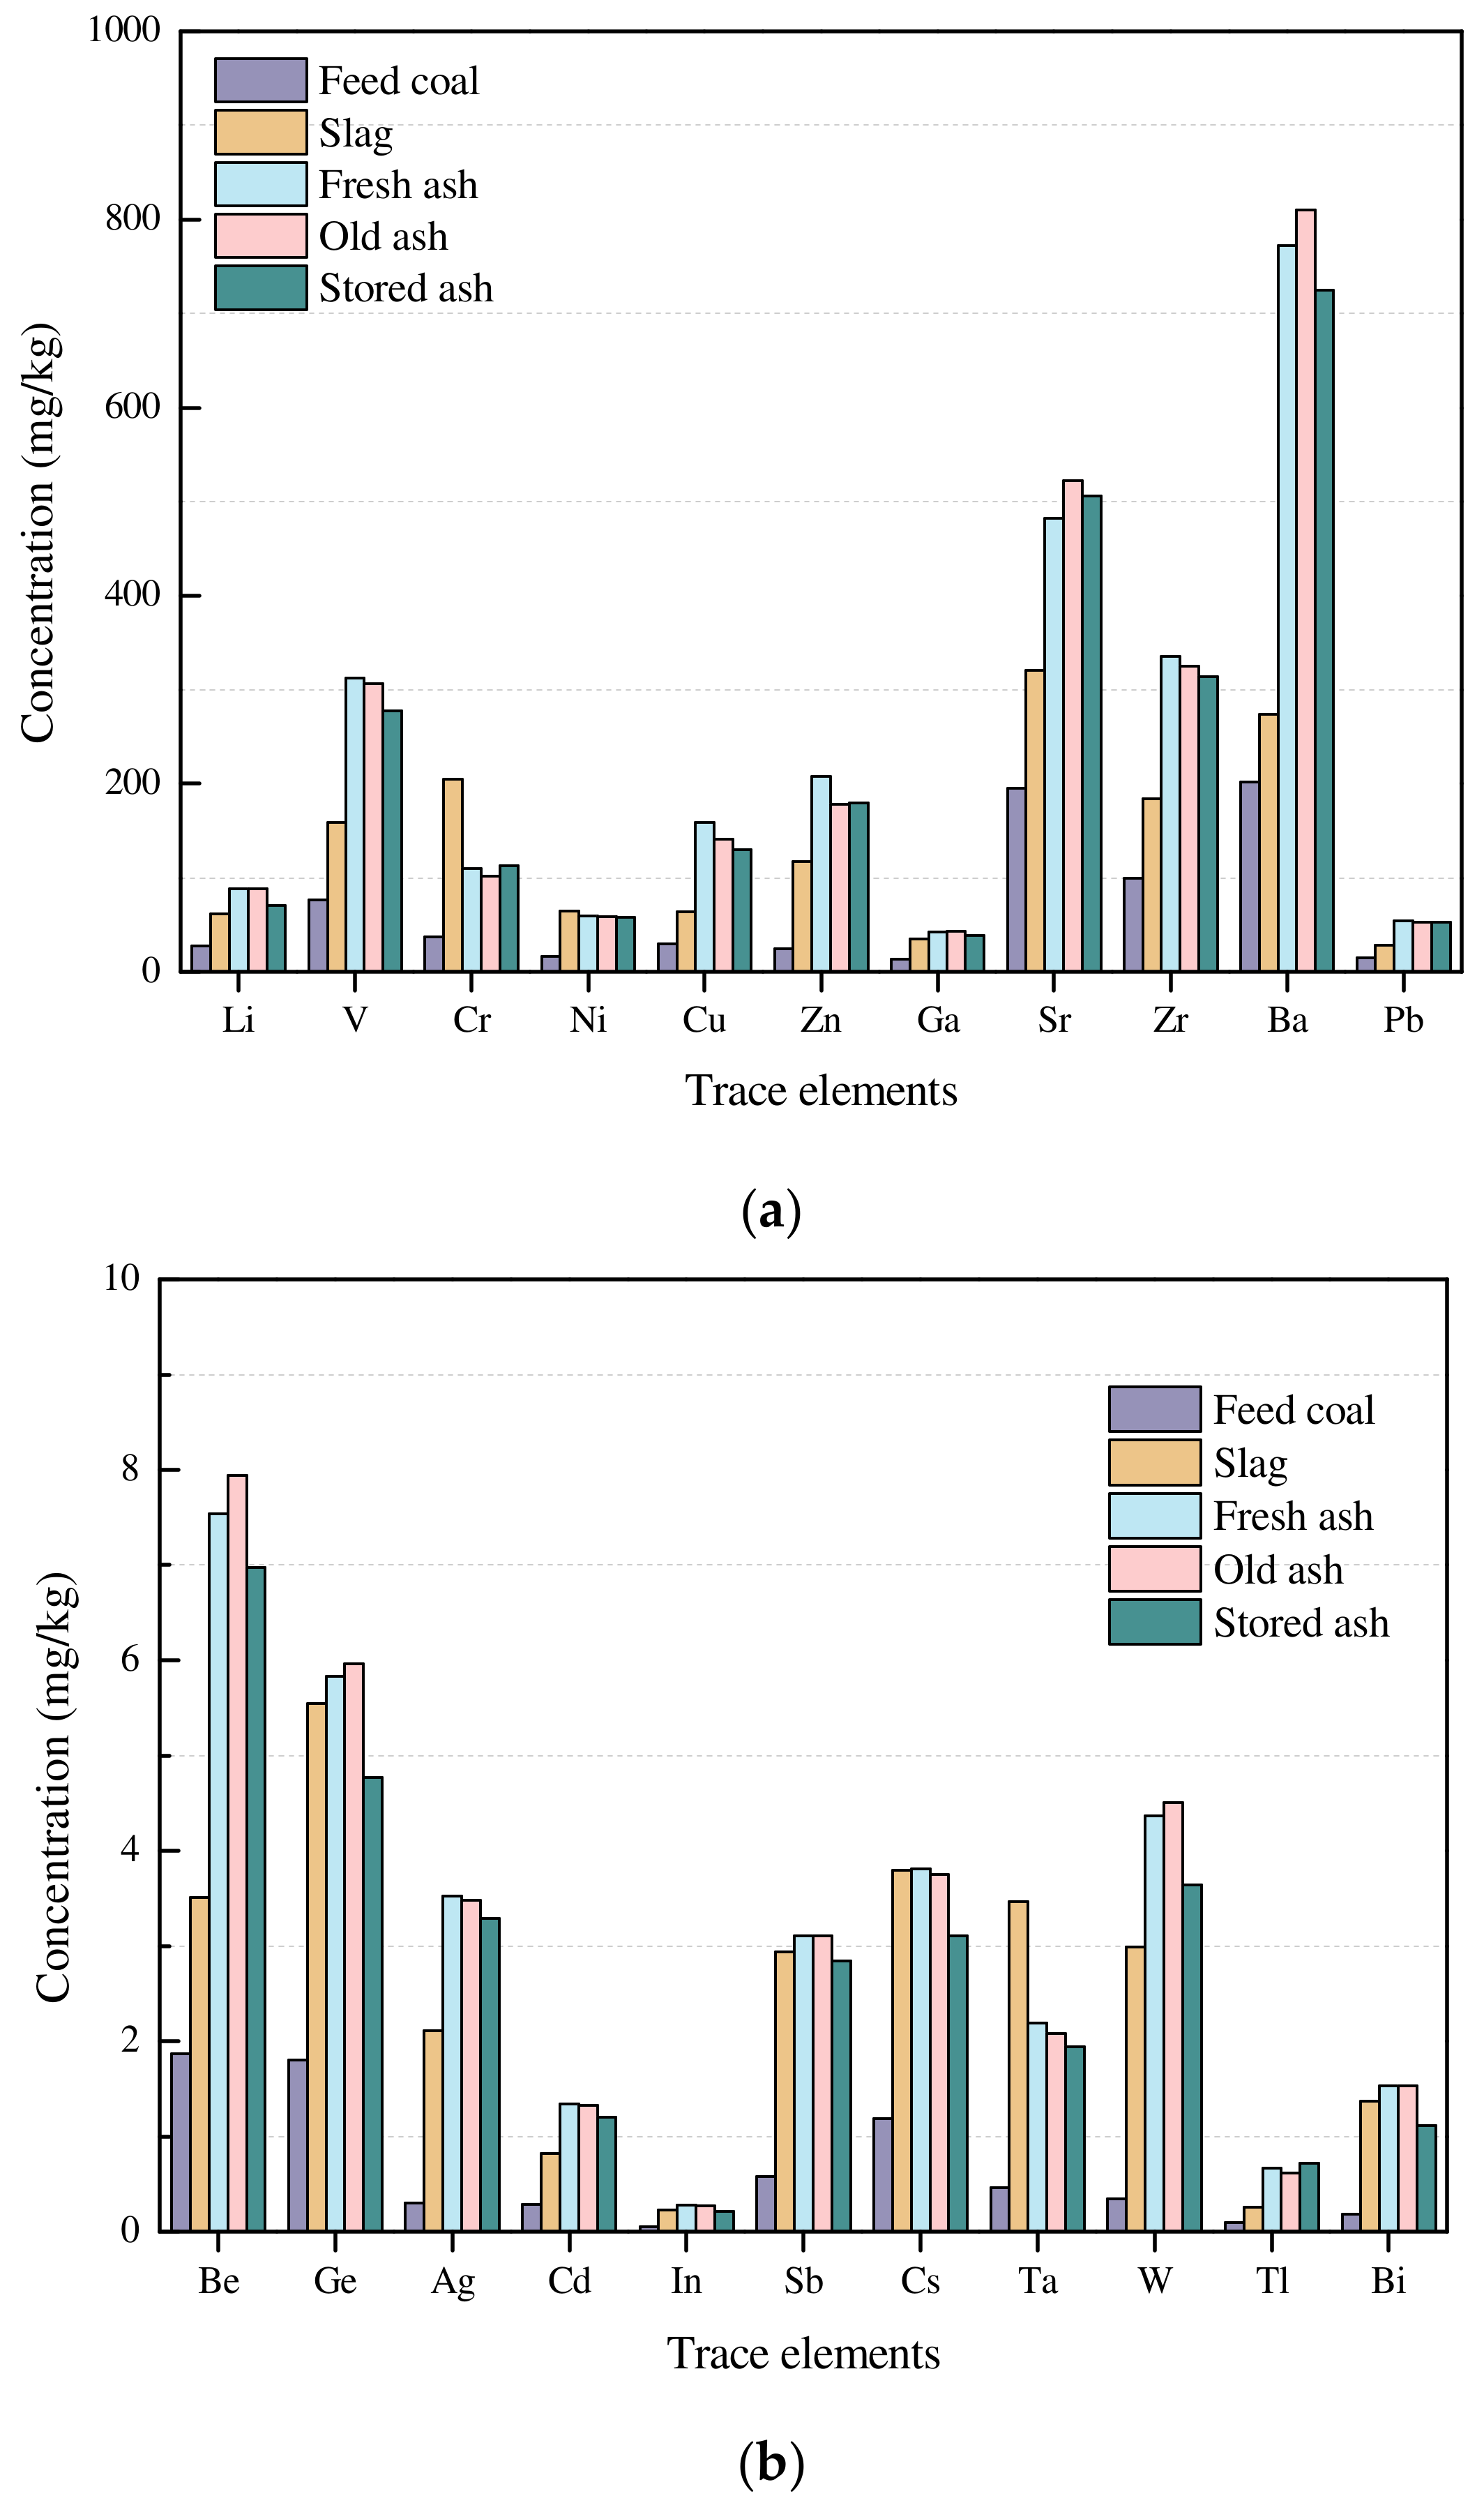
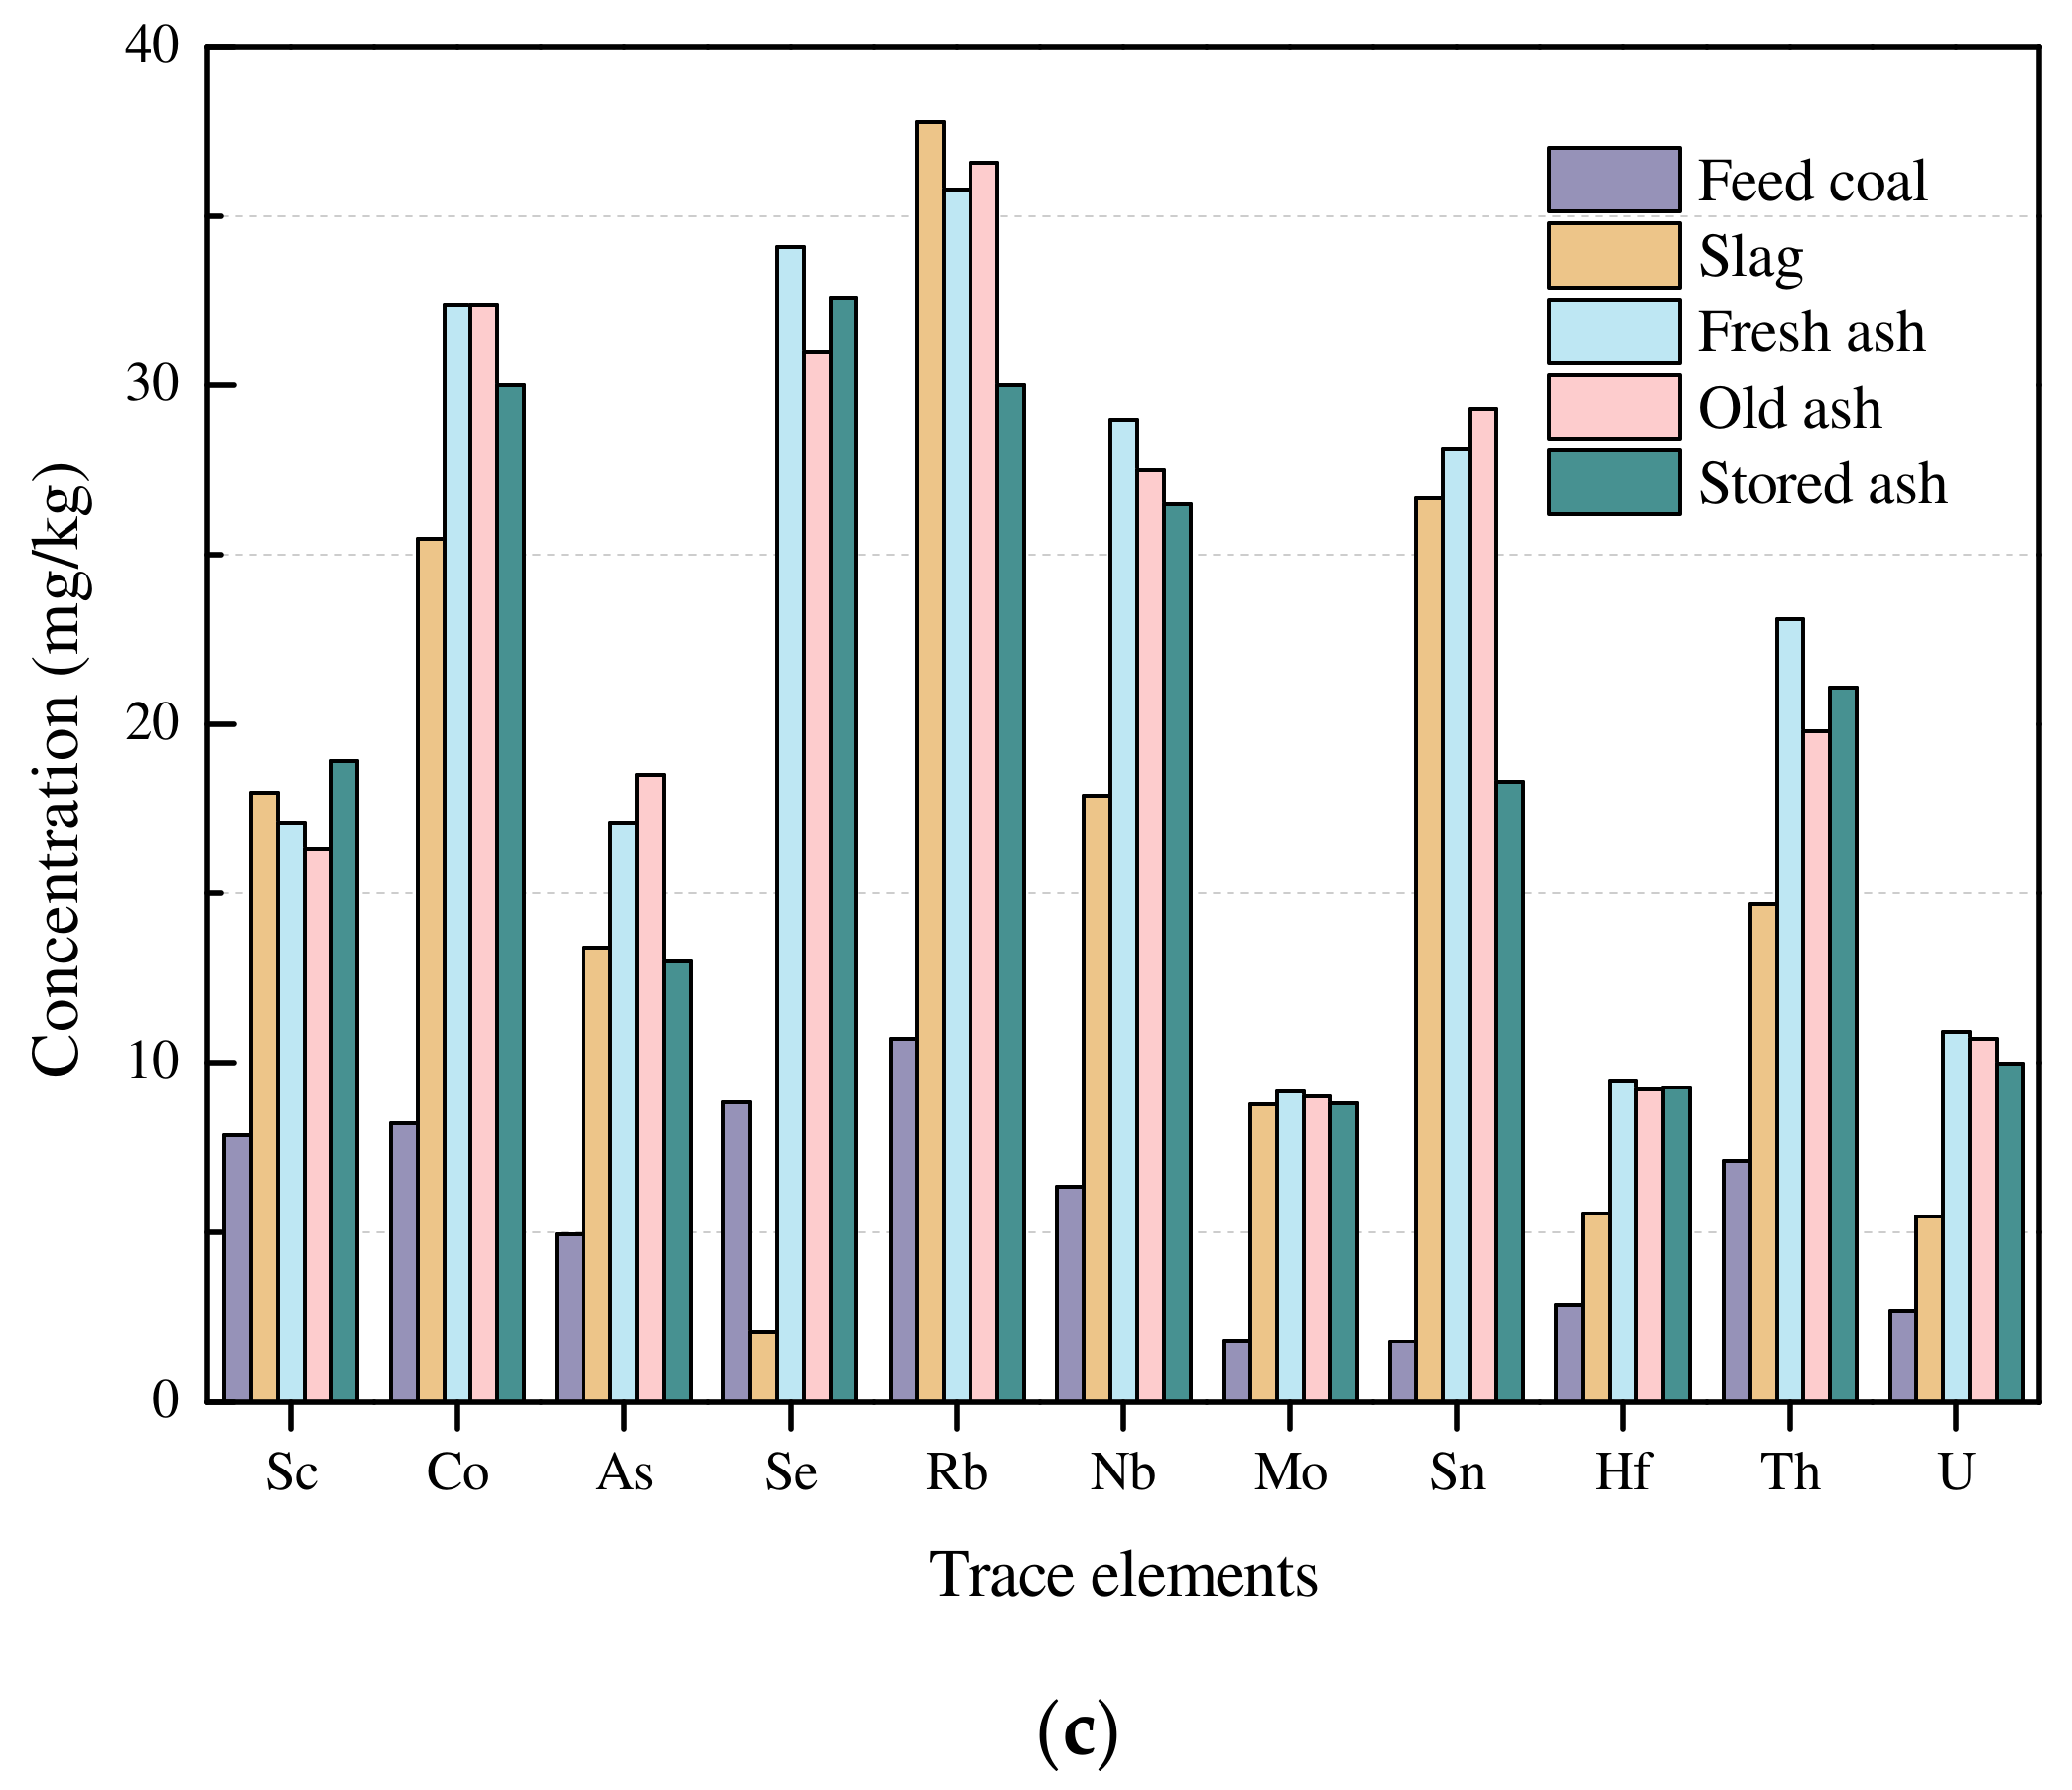
Compared to that in feed coal, Cr, Sb, Ta, W, and Bi were enriched (Figure 6a,b), and Sn was significantly enriched in slag (Figure 6c). The enriched trace elements in slag could be attributed to its inorganic affinity and the breakdown and loss of organic matter during combustion, resulting in the enrichment of these elements in the burning residues. However, owing to its high volatility, Se was depleted in slag (Figure 6c), indicating that volatile Se might escape from flue gas.
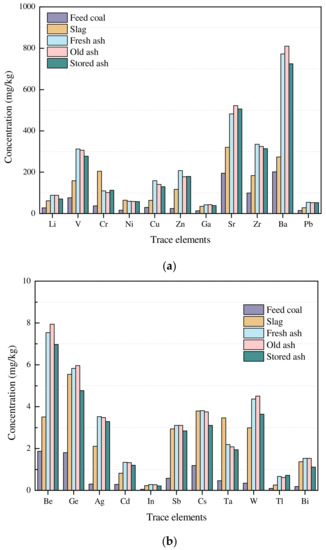
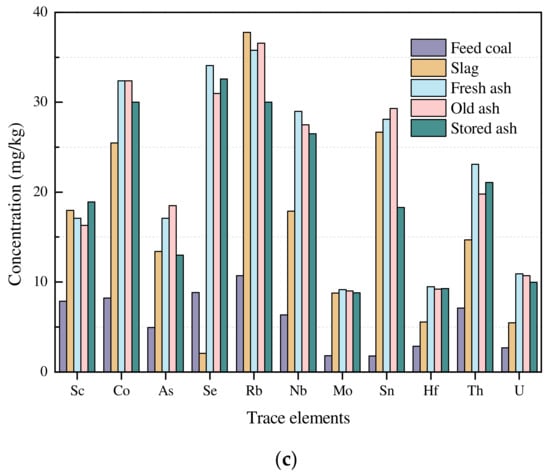
Figure 6.
Comparison of trace elements with concentrations lower than 1000 mg/kg (a), 10 mg/kg (b), and 40 mg/kg (c) in feed coal, slag, fresh ash, old ash, and stored ash from the TY power plant.
Compared to that in feed coal, Cu, Zn, Mo, Tl, Bi, and Sb were enriched, and Sn and W were significantly enriched in fresh fly ash (Figure 6b,c). In addition, Zn, Sb, Tl, and Bi were enriched, and Sn and W were significantly enriched in old fly ash (Figure 6b,c). Zinc, Tl, and Bi were enriched, while Sn and W were significantly enriched in stored fly ash (Figure 6b,c). However, the enriched element association was not different between the different types of fly ash.
Compared to that in slag, Be, Cu, Tl, and Ba were enriched in fresh and old fly ash, and Cu, Tl, and Ba were also enriched in the stored fly ash (Figure 6a,b). It is worth noting that the concentration of Se in all fly ash samples was approximately 15 times higher than that of slag (Table 4), whereas other elements, exemplified by Mo and Sb (Figure 6b,c), were evenly distributed between the slag and the fly ash.
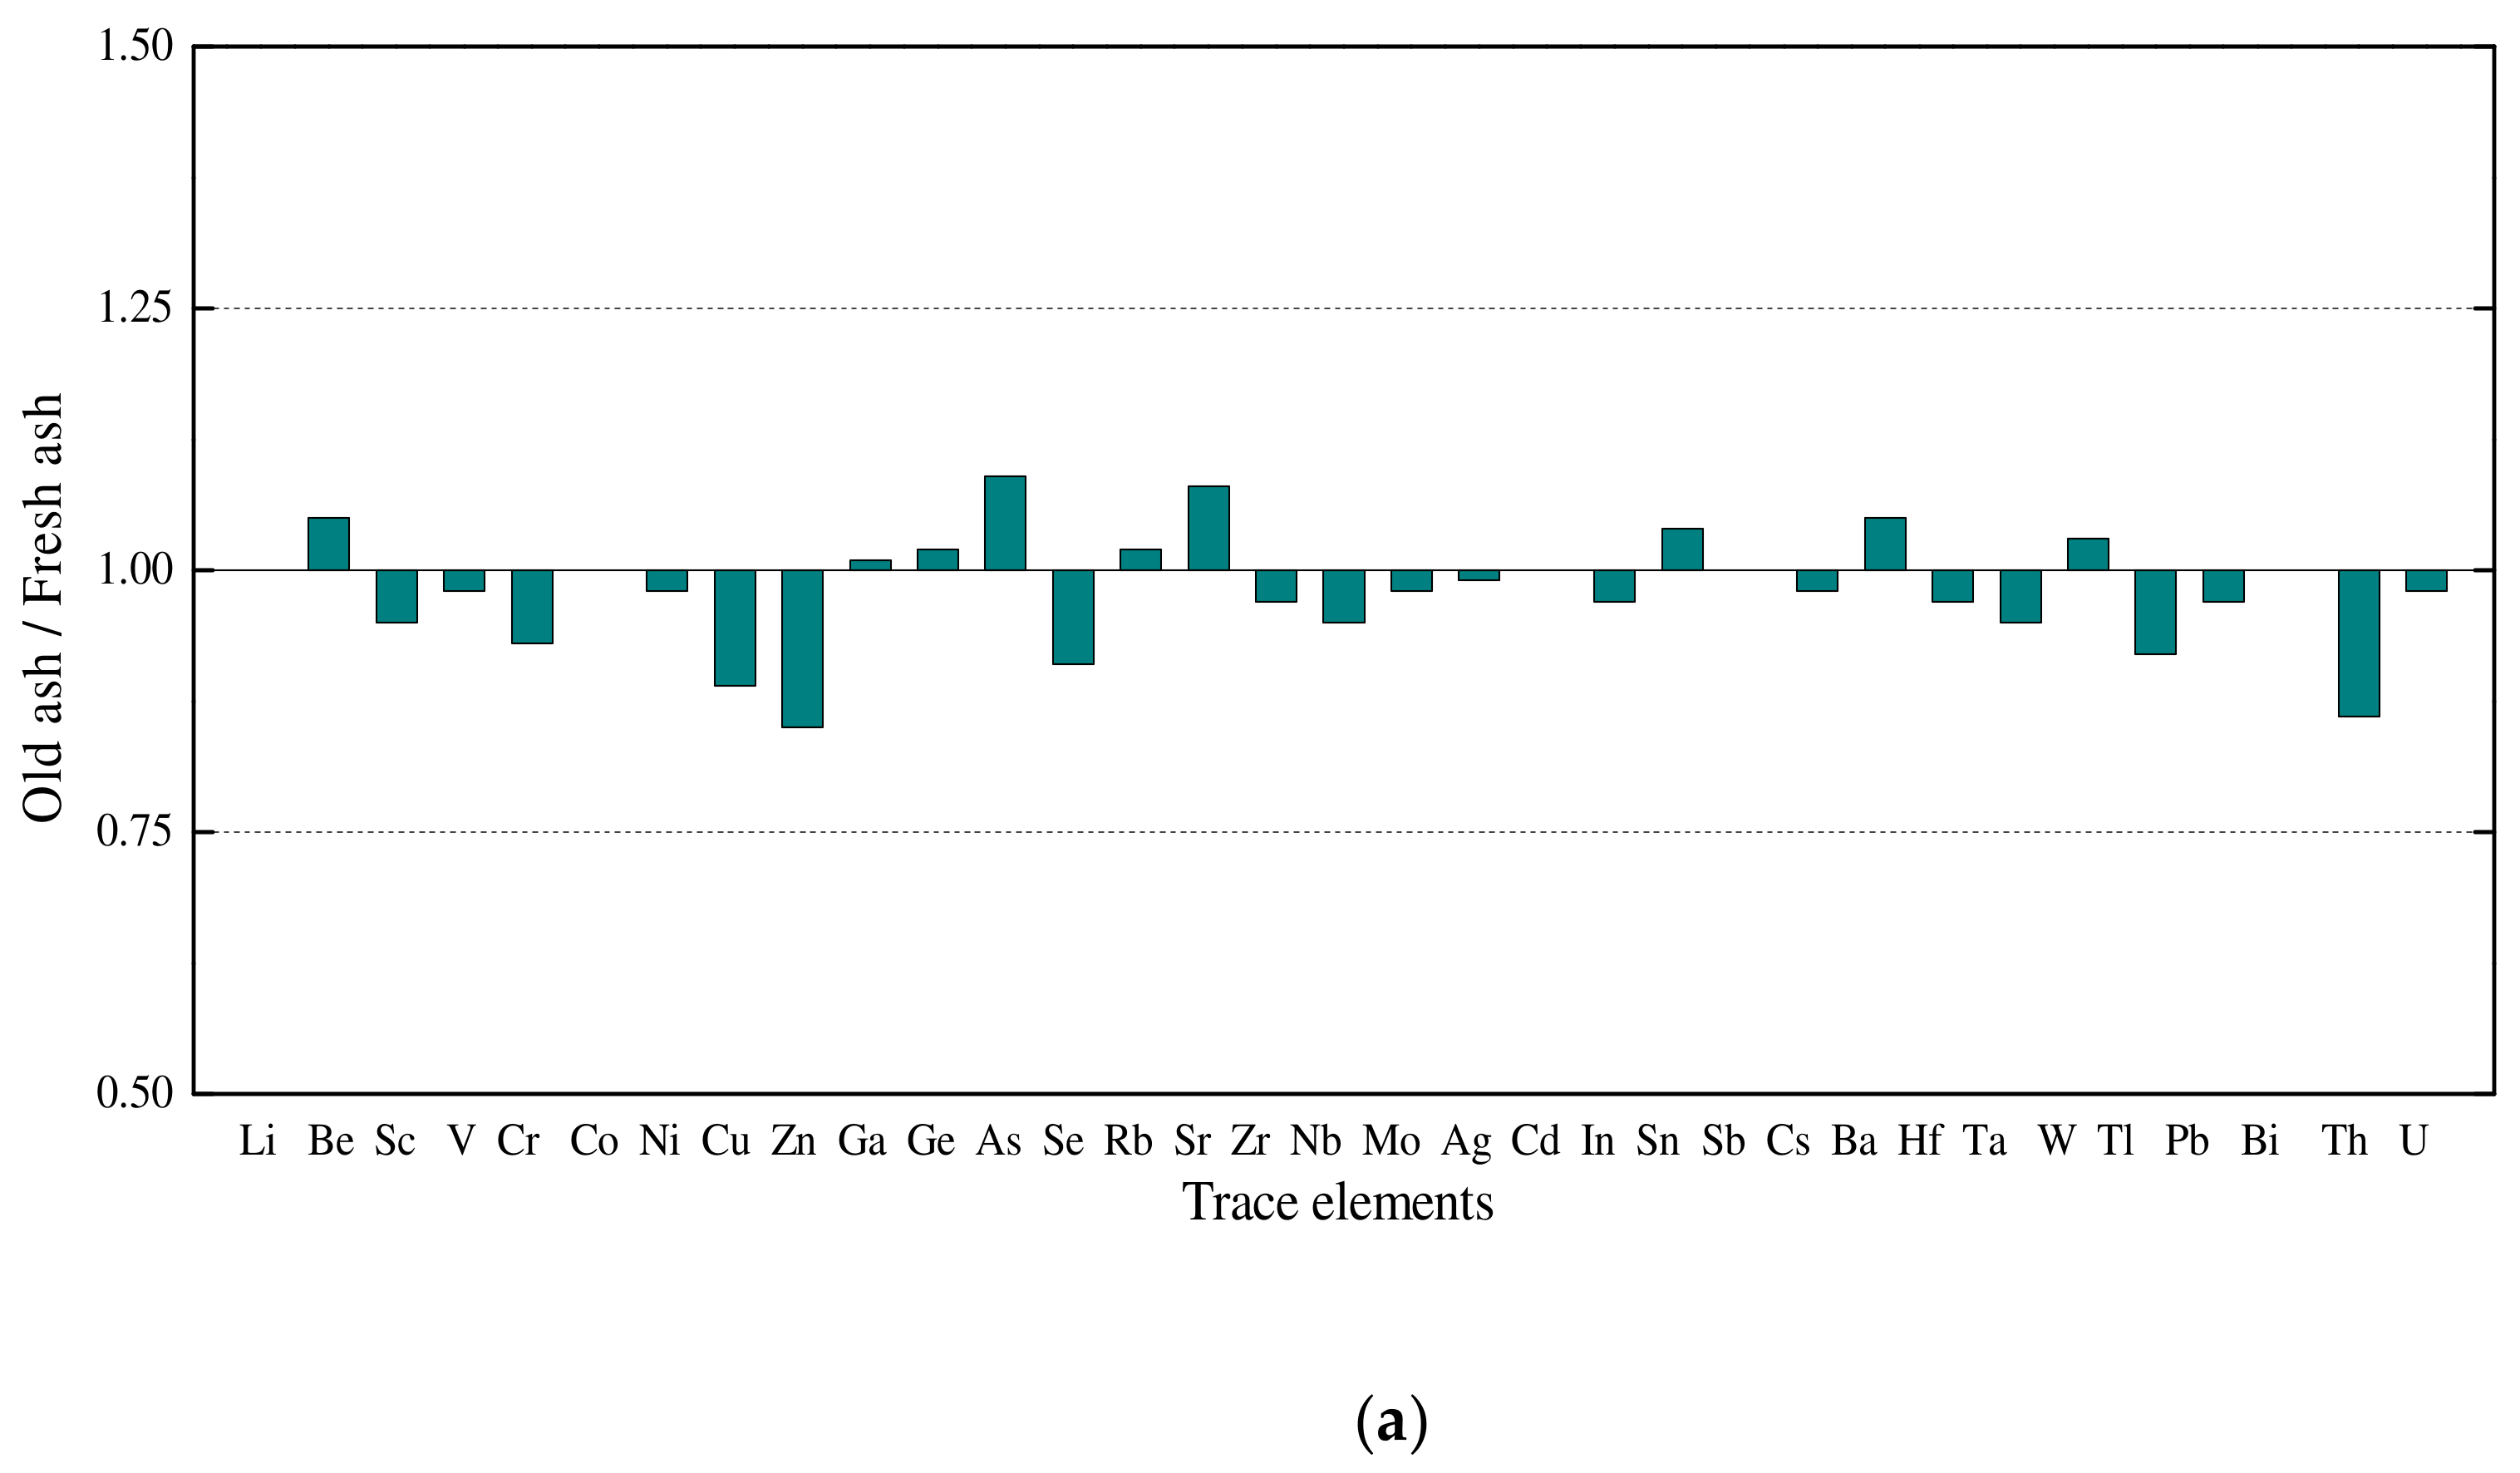
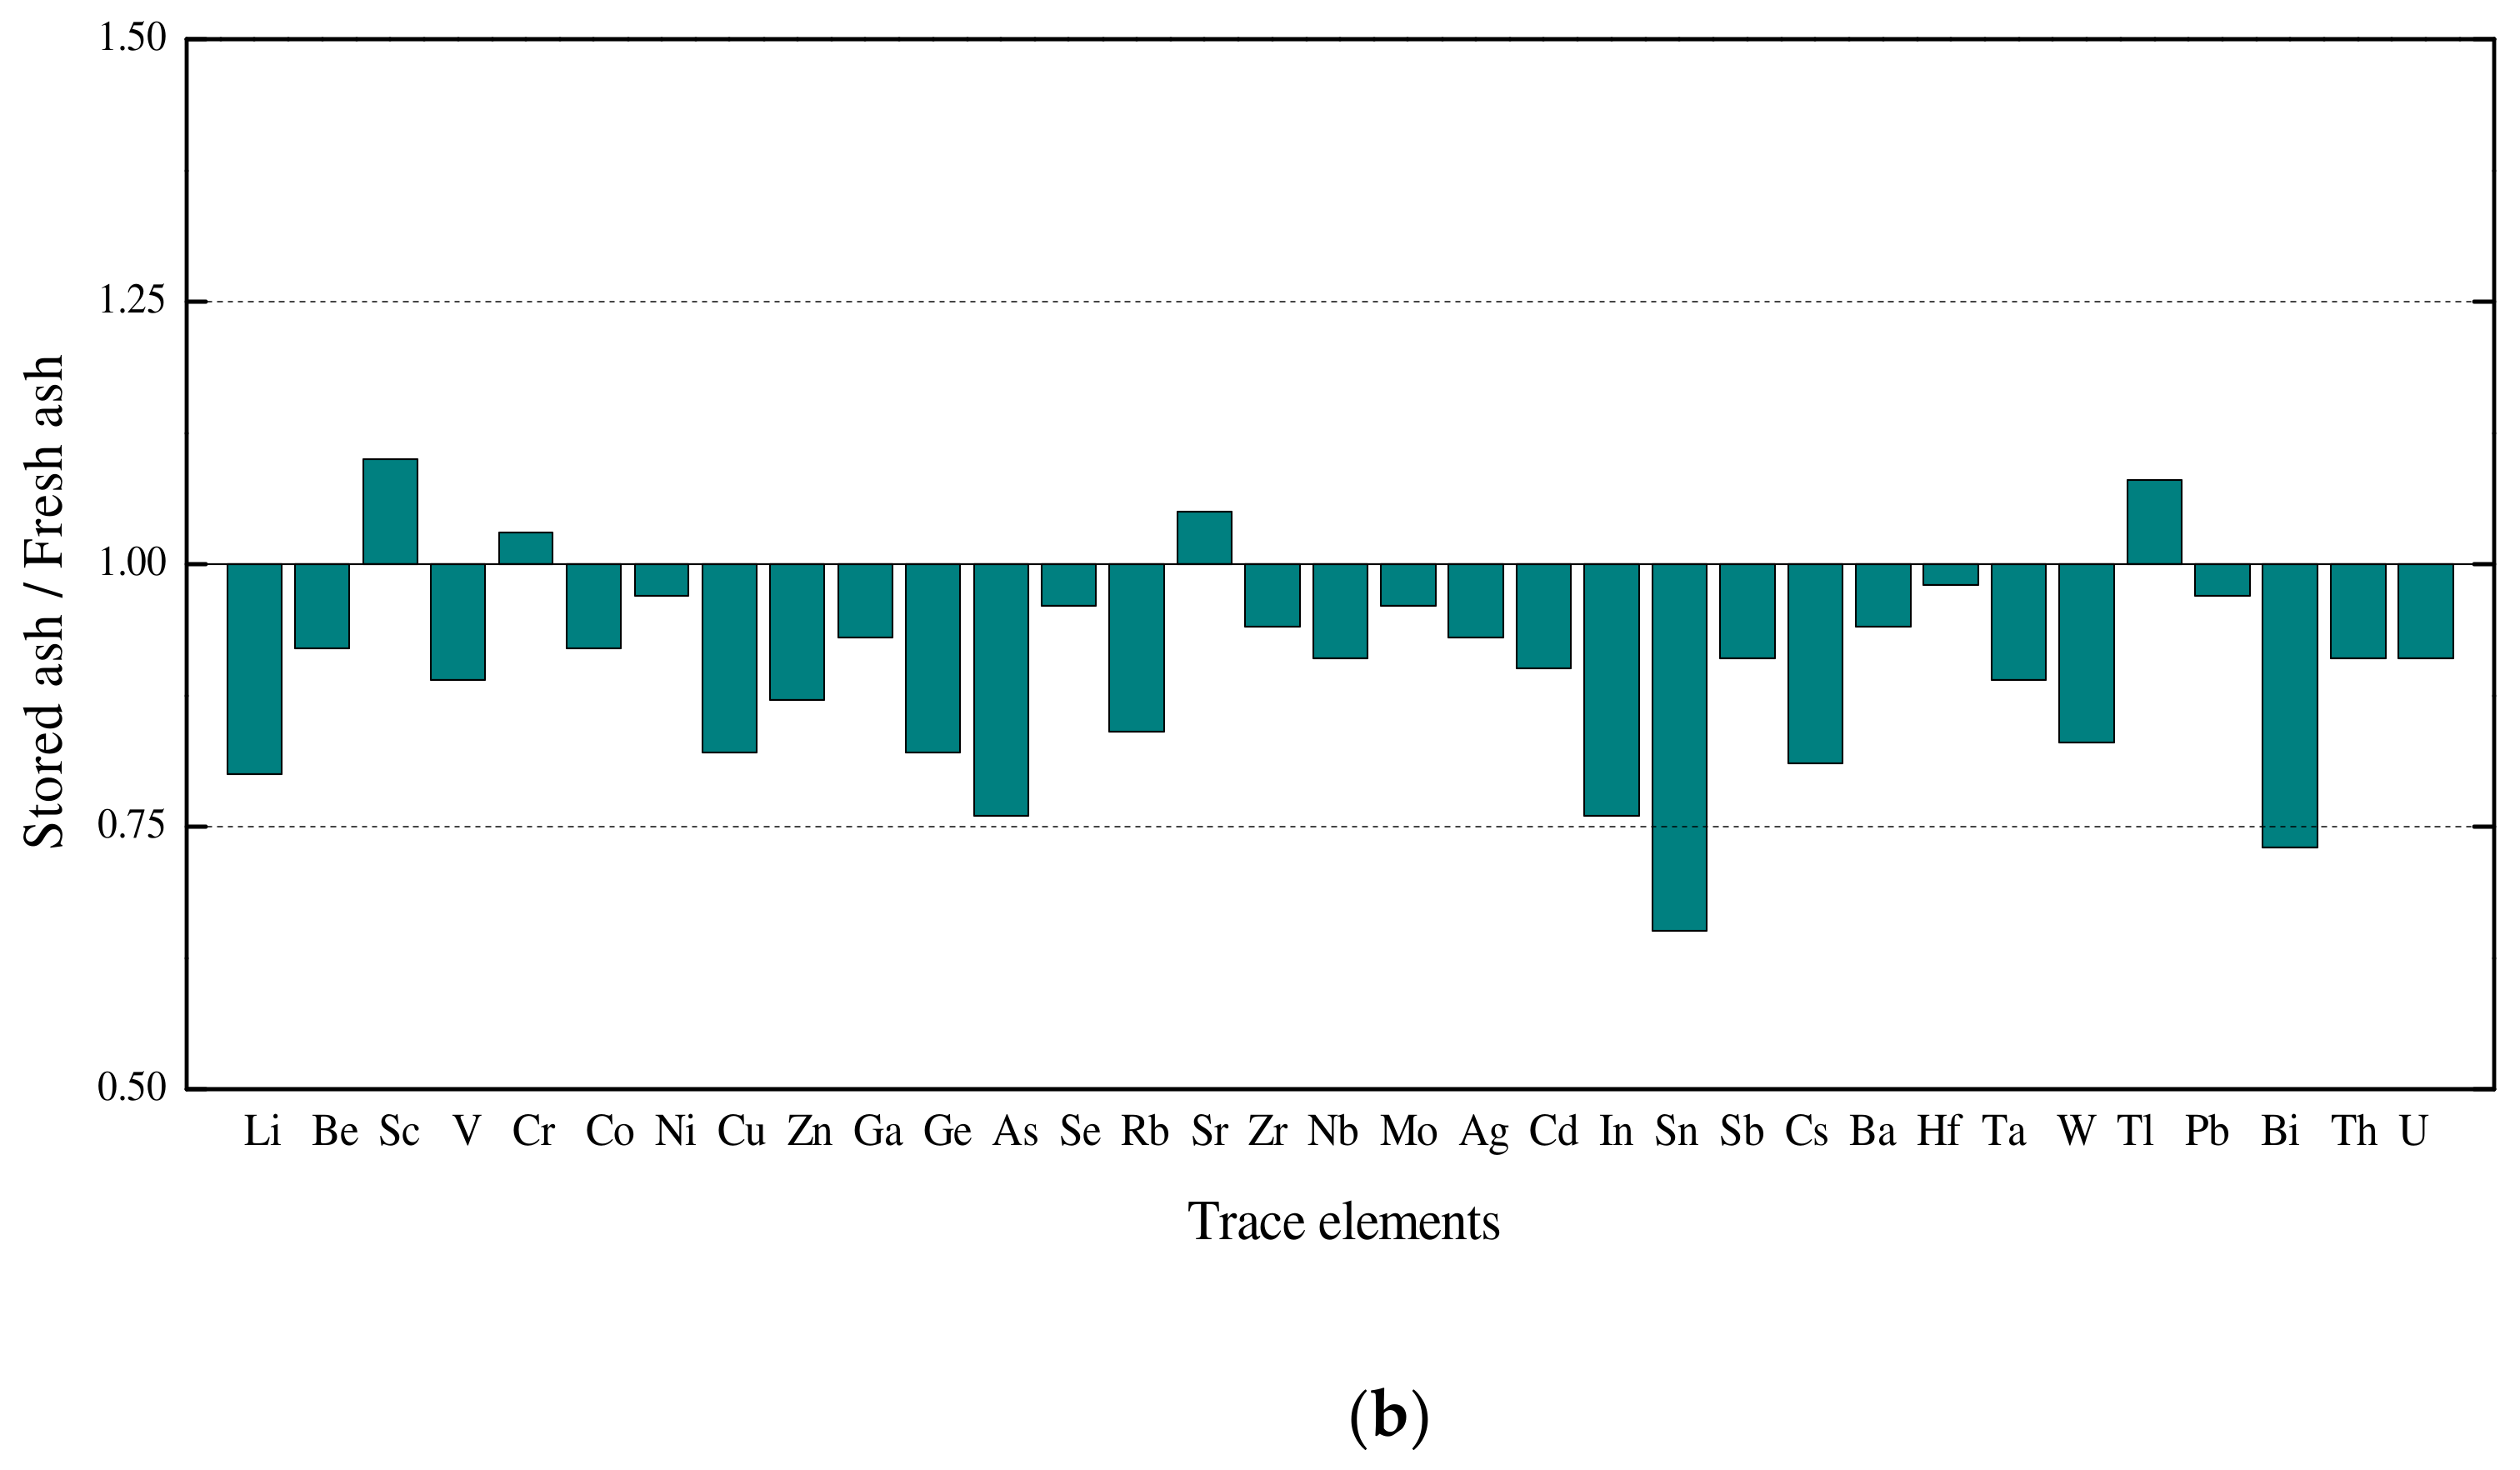
Compared to that in fresh ash, the concentrations of all trace elements in old ash did not significantly change (Figure 7a), suggesting that the trace elements might not be redeposited or reactivated during the precipitation of fine ash particles in the well of the flue gas pipeline. Moreover, the concentrations of trace elements in stored fly ash did not present any significant variations during short-time fly ash storage, especially Cr, Ni, Se, Mo, Hf, and Pb (Figure 7b), implying that fly ash is stable.
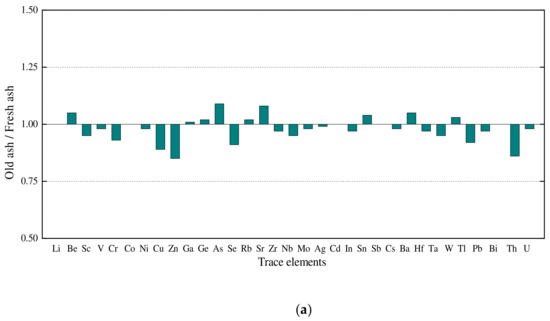
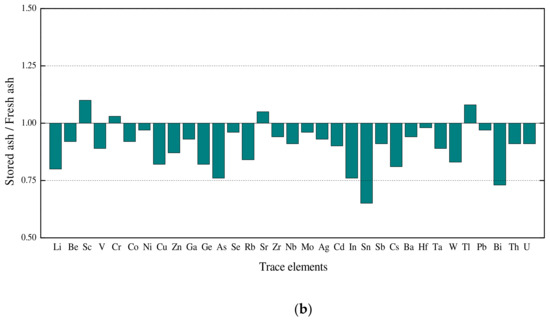
Figure 7.
Comparison of trace element concentrations in old and fresh ash (a), and in stored and fresh ash (b) from the TY power plant.
3.2.2. REY
The concentrations of REY in the feed coal and its by-products of the TY power plant, Huainan coal [28], Chinese coal [29], and the UCC [34] are given in Table 5 (Table S5 in Supplementary Materials). The REY concentration of the feed coal in the TY power plant was 124 mg/kg, which is slightly lower than that of common Chinese coal [29]. The raw feed coal and its by-products shared a completely similar UCC-normalized REY distribution pattern, which was characterized by a significantly positive Gd anomaly, a slightly positive Ce anomaly, and slightly negative Eu and Ho anomalies (Figure 5c). Moreover, the UCC-normalized REY distribution patterns of the feed coal and its by-products of the TY power plant were similar to those of Huainan coal [28] (Figure 5c), confirming that the raw feed coal was transported from the Huainan coalfield. The slight HREY enrichment of the raw feed coal, its by-products, and Huainan coal (Figure 5c) might be related to the stronger organic affinity of HREY than that of LREY and MREY in the coal and the effect of the origin of the raw coal on its by-products.

Table 5.
Concentrations of REY in feed coal and its by-products from the TY power plant (units: mg/kg on an air-dried basis).
4. Discussion
4.1. Partitioning of Trace Elements in Coal Combustion By-Products
4.1.1. Effect of Ash Particle Size
The concentrations of trace elements in the coarse and fine fly ash of the WN power plant were significantly different (Table 2 and Figure 3). Specifically, the concentrations of Ga, Ge, As, Mo, In, Sn, Sb, W, Tl, Pb, Bi, and Ta increased with a decrease in the particle size (Figure 3a–c), while the concentrations of Sr, Sc, Rb, and Th decreased (Figure 3c,d). Other elements, such as Zr, Cs, Ba, and Hf, did not exhibit a noticeable relationship with particle size (Figure 3b–d).
The increased concentrations of most elements in finer fly ash were mainly ascribed to the decreased particle size. As the surface area of finer particles increases, their adsorption capacity improves. Therefore, trace elements, particularly volatile elements, are more easily enriched in finer ash particles. Coal ash particle size has a significant influence on the partitioning, migration, and release of trace elements during coal combustion [13]. In general, the smaller the particle size, the larger the specific surface area, and the stronger the adsorption capacity of elements; thus, elements tend to concentrate in fine particles [30,39,40,41,42]. Shah et al. [43] found that the concentration of Cr increased with decreasing particle size in an Australian combustion product. Yi et al. [44] reported that the relative enrichment factors of As, Cd, Cu, V, and Zn decreased with increasing particle size. Helble [45] stated that As, Sb, Pb, Cd, Co, and Se were nearly always enriched in the finest particulates, independent of the coal type burned or the scale of the combustion facility analyzed.
4.1.2. Effect of Flue Gas Desulfurization
The concentrations of most trace elements in the FGD gypsum were lower than those of other coal combustion by-products (Table 2). However, during the FGD process, the concentrations of some hazardous trace elements, such as Cr, Zn, Pb, and Se (Figure 3c,d), increased significantly in the FGD gypsum compared to that in raw limestone. The concentration of Se in the FGD gypsum increased by more than 800 times that in the feed limestone (Table 2).
The addition of limestone caused some elements in the flue gas to react with calcium oxide, which was eventually captured by the generated gypsum. In addition, certain heavy metals enriched in the finer fly ash particles that escaped from the particulate control devices could be removed by the FGD process [31,46]. The use of additives appears to be a major factor affecting the partitioning of trace elements in FGD systems [47].
During FGD, the anomalously enriched Se in the FGD gypsum was due to the formation of calcium selenate and/or selenite. Tang et al. [48] reported that Se was removed from gaseous emissions by chemical absorption into the limestone slurry as selenate. Xu et al. [49] suggested that calcium-based sorbents are an effective choice for capturing sulfur oxides and trace elements, including Se. Moreover, Zhang et al. [50] indicated that SO2 was removed by sulfur-fixing additives, and some hazardous trace elements, such as As, Se, Be, Cr, Co, Ni, Pb, and Zn, were retained.
4.2. Effects of Ash Precipitation and Storage on Trace Elements in Fly Ash
Compared to the concentrations in fresh ash, the concentrations of all trace elements in old ash were in the normal range (0.5 < CC < 2) (Figure 7a), suggesting that all these trace elements might not be redeposited or reactivated during the precipitation of fine fly ash particles in the well of the flue gas pipeline.
Additionally, compared to those in fresh fly ash, the concentrations of trace elements in stored ash were not significantly changed (0.5 < CC < 2) and did not present any noticeable fluctuations during short-time fly ash storage, especially Cr, Ni, Se, Mo, Hf, and Pb (Figure 7b). However, during long-time storage, the nature of fly ash is affected by certain ambient factors (e.g., moisture, rain water, fallout), and even the mixing of fly ash of different origins results in the migration/release of trace elements and a corresponding variation in trace element concentrations in the stored fly ash. During landfill or the long-term storage of fly ash, heavy metals in fly ash are released or migrated under the action of water, especially acid rainwater [51]. An increase in natural pH and a decrease in the buffering capacity of the ash due to contact (even a relatively brief contact) with water during handling and storage would result in a loss of components from the surface of the ash particles [52]. Stored and reprocessed rejects or materials from longer-standing stockpiles may produce acid leachates containing high concentrations of several elements [53]. Jankowski et al. [54] reported that chemical reactions during ash–water interactions are responsible for the variations in trace element concentrations. Given the short storage time of fly ash in the TY power plant, the small change in elemental concentrations in the stored fly ash compared to that in fresh fly ash could be attributed to its heterogeneity and/or the mixture of fly ash with different chemical compositions.
4.3. Evaluation of Potential REY Resources in Coal Combustion By-Products
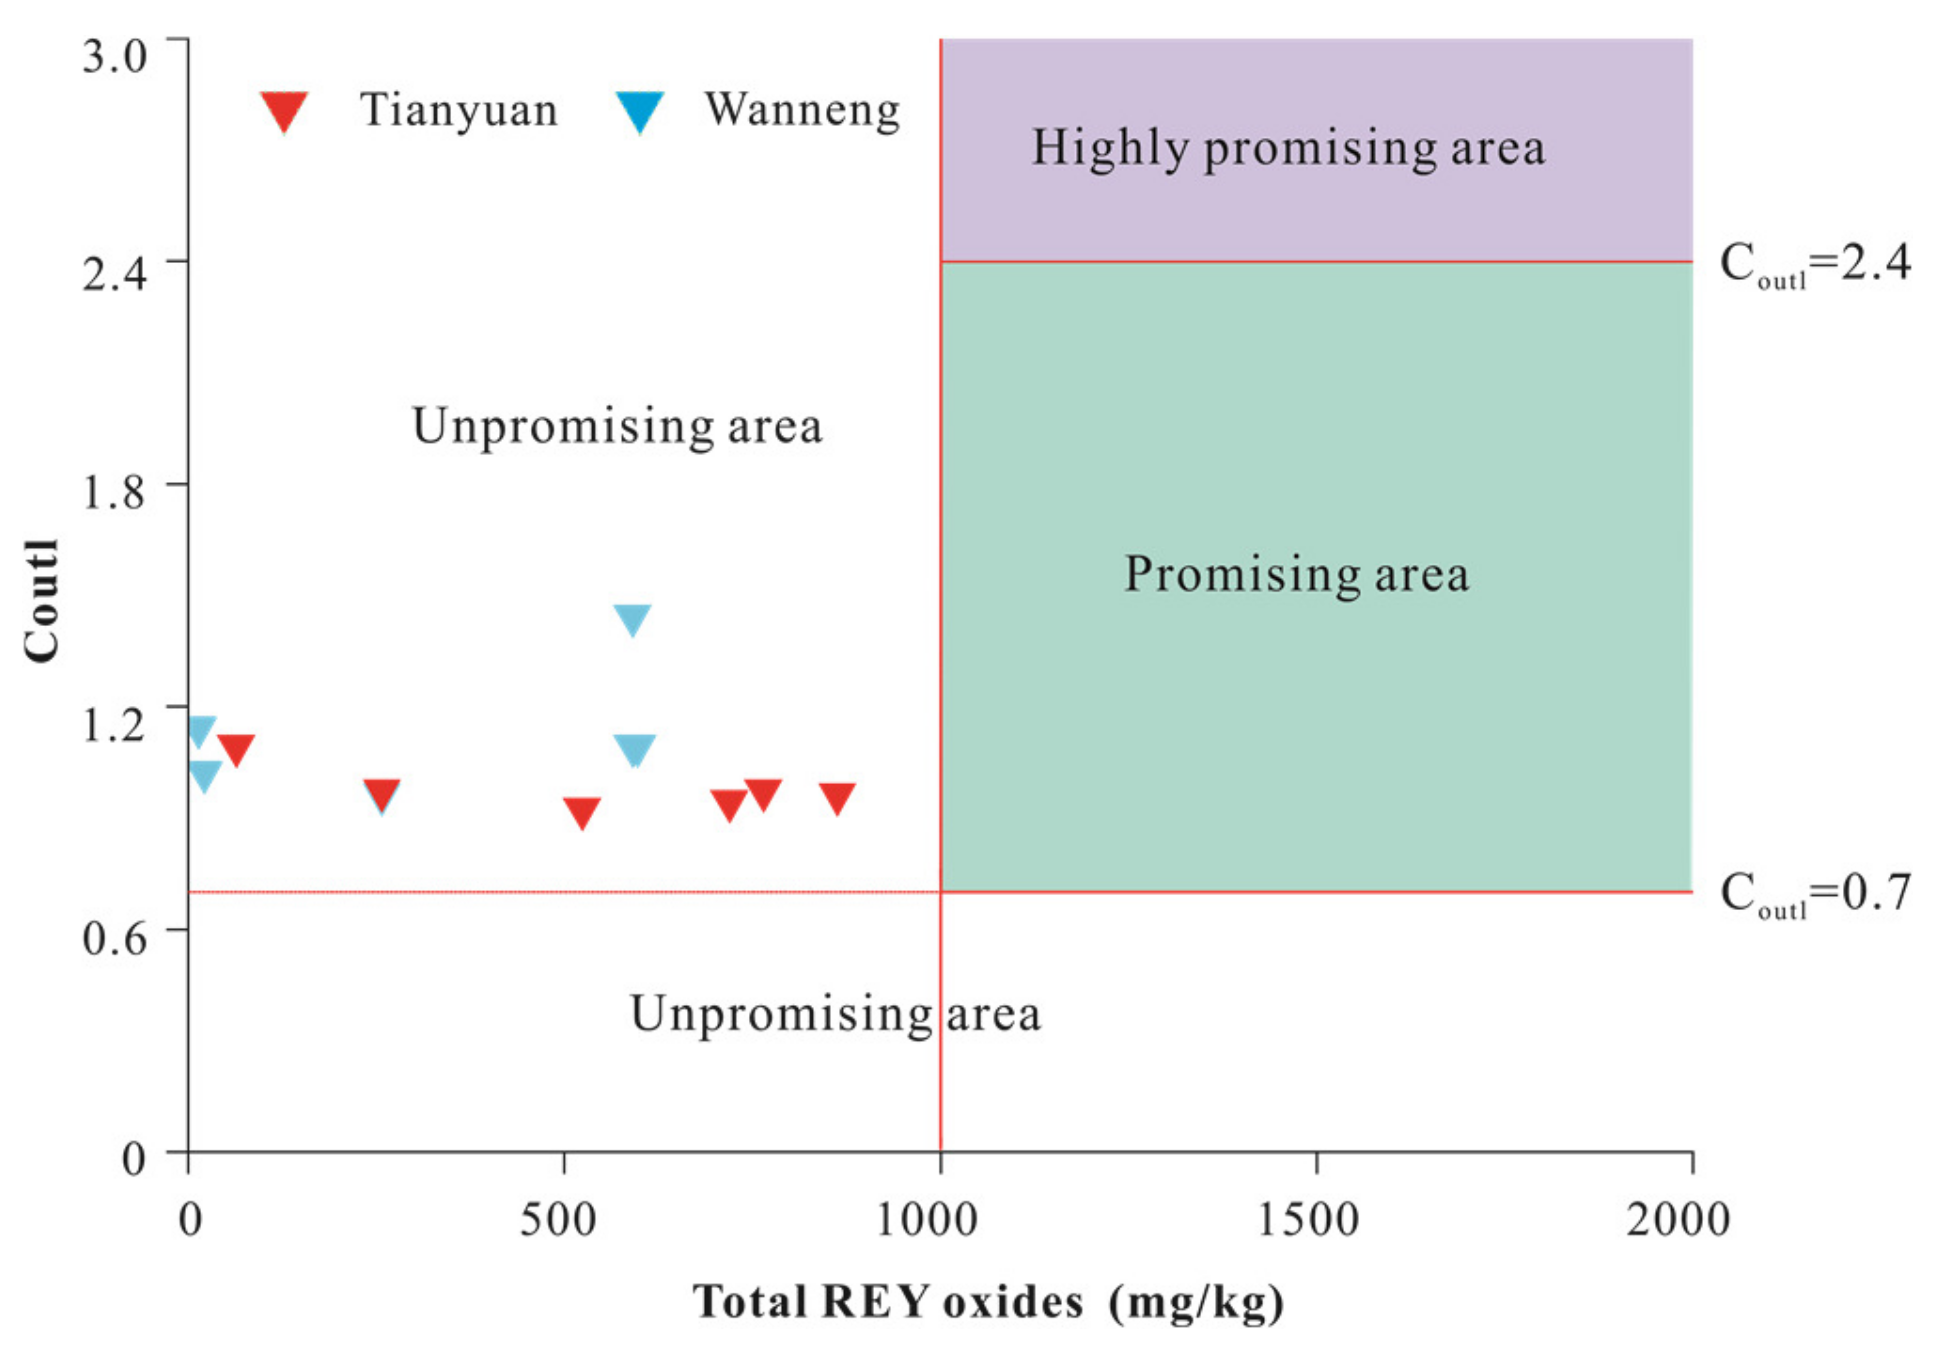
The cut-off grade of REY oxides (REO, sum of La2O3 to Lu2O3 plus Y2O3) in coal ash was proposed to be 1000 mg/kg [35]. The concentration of REO in world hard coal ash is 485 mg/kg [55]. Thus, if the REO concentration in coal ash is twice the world background concentration, REO could be an economically viable by-product of coal combustion residues [27,35]. The REO concentrations in the feed coal, slag, and fly ash of the WN and TY power plants were 250, 250, 584, 517, 584, and 856 mg/kg, respectively.
Based on its market supply and demand, REY was divided into critical (Nd, Eu, Tb, Dy, Y, and Er), uncritical (La, Pr, Sm, and Gd), and excessive (Ce, Ho, Tm, Yb, and Lu) groups by Seredin and Dai [35]. They proposed several criteria to assess REY in coal ash as an economic raw material [35]. The outlook coefficient (Coutl) is the ratio of the relative amount of critical REY in the total REY to the relative amount of excessive REY [35]. Coal materials with Coutl values >2.4, 0.7–1.9, and <0.7 were considered highly promising, promising, and unpromising for REY recovery, respectively.
The Coutl values of the coal combustion by-products of the WN and TY power plants ranged from 0.88 to 1.36, and from 0.84 to 1.01, respectively, indicating that coal combustion by-products are promising for the recovery of REY. Furthermore, the Coutl of fine fly ash was the highest among all by-products. However, based on the evaluation diagram of cut-off grade and Coutl values [56], all raw feed coal and its by-products from these two coal-fired power plants are projected to be ‘unpromising’ (Figure 8). Thus, the coal combustion by-products from the WN and TY coal-fired power plants were not candidates for REY recovery.
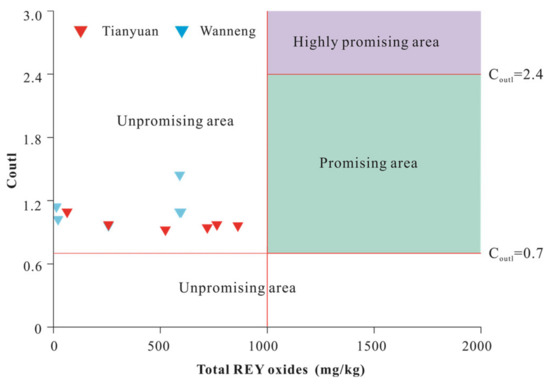
Figure 8.
Evaluation diagram of cut-off grade vs. Coutl values of coal and its by-products from the WN and TY power plants. The evaluation method was adopted from Dai et al. [56].
5. Conclusions
The partitioning and migration of trace elements in raw feed coal and its combustion by-products from two typical coal-fired power plants in Hefei, Anhui Province, eastern China, were investigated.
The raw feed coal from the WN and TY power plants were only slightly rich in V, Cr, Se, In, Sb, Pb, and Ga compared to common Chinese coal. Most trace elements were concentrated in fly ash, such as Cu, Zn, Mo, Tl, Bi, Sb, Sn, and W. Gallium, Ge, As, Mo, In, Sn, Sb, W, Tl, Pb, and Bi, which are volatile during coal combustion, are prone to enrichment in fine fly ash particles. Gaseous Se in flue gas is captured by calcium oxide in the limestone slurry as selenite and/or selenate during the FGD process. The precipitation of fly ash in the well of the flue gas pipeline and short-time storage of fly ash did not exert any significant impact on trace elements in the fly ash.
Although the Coutl values of coal combustion by-products from the WN and TY coal-fired power plants exhibited a promising range of REY recovery, the cut-off grade vs. Coutl evaluation diagram eliminated potential REY recovery from the by-products.
Supplementary Materials
The following supporting information can be downloaded at: https://www.mdpi.com/article/10.3390/min13020152/s1, Table S1: Coal quality parameters of raw feed coals from the Wanneng and Tianyuan coal-fired power plants; Table S2: Concentrations of trace elements in samples from the Wanneng coal-fired power plant; Table S3: Concentrations of REY in samples from the Wanneng coal-fired power plant; Table S4: Concentrations of trace elements in samples from the Tianyuan coal-fired power plant; Table S5: Concentrations of REY in samples from the Tianyuan coal-fired power plant.
Author Contributions
P.J. carried out experiments and wrote the manuscript. J.C. initiated the project, performed the data analysis and interpretation, and revised the manuscript. Y.L. performed the data analysis and interpretation. X.L. and X.Q. analyzed the data and drew some figures. J.W. collected the literature and data. P.C., W.L. and R.W. reviewed the manuscript. All authors have read and agreed to the published version of the manuscript.
Funding
This work was supported by the Natural Science Foundation for Distinguished Young Scholars of Anhui Province (1908085J14), the National Key Research and Development Program of China (2016YFC0201605), and the National Natural Science Foundation of China (41972173).
Data Availability Statement
All data are presented in tables or as the Supplementary Materials of this paper.
Acknowledgments
Special thanks are given to the anonymous reviewers for their comments and suggestions.
Conflicts of Interest
The authors declare that they have no known competing financial interests or personal relationships that could have appeared to influence the work reported in this paper.
References
- Xie, H.P.; Ren, S.H.; Xie, Y.C. Development opportunities of the coal industry towards the goal of carbon neutrality. J. China Coal Soc. 2021, 46, 2197–2211. (In Chinese) [Google Scholar]
- Xie, H.P.; Wu, L.X.; Zheng, D.Z. Prediction on the energy consumption and coal demand of China in 2025. J. China Coal Soc. 2019, 44, 1949–1960. (In Chinese) [Google Scholar]
- Chen, J.; Li, Y.; Jiang, P.; Li, X.; Qi, X.; Liu, W.; Chen, P. Comprehensive utilization of resources and potential environmental risk of the coal-hosted critical element deposits: A case from the Lincang Ge refinery. J. China Coal Soc. 2022, 47, 1885–1894. [Google Scholar]
- Font, O.; Córdoba, P.; Leiva, C.; Romeo, L.M.; Bolea, I.; Guedea, I.; Alvarez, E. Fate and abatement of mercury and other trace elements in a coal fluidised bed oxy combustion pilot plant. Fuel 2012, 95, 272–281. [Google Scholar] [CrossRef]
- Roy, B.; Bhattacharya, S. Oxy-fuel fluidized bed combustion using Victorian brown coal: An experimental investigation. Fuel Process. Technol. 2014, 117, 23–29. [Google Scholar] [CrossRef]
- Oboirien, B.O.; Thulari, V.; North, B.C. Enrichment of trace elements in bottom ash from coal oxy-combustion: Effect of coal types. Appl. Energy 2016, 177, 81–86. [Google Scholar] [CrossRef]
- Fuge, R. Fluorine in the environment, a review of its sources and geochemistry. Appl. Geochem. 2019, 100, 393–406. [Google Scholar] [CrossRef]
- Hu, Y.; Cheng, H. Control of mercury emissions from stationary coal combustion sources in China: Current status and recommendations. Environ. Pollut. 2016, 218, 1209–1221. [Google Scholar] [CrossRef]
- Zhang, Y.; Ye, X.; Yang, T.; Li, J.; Chen, L.; Zhang, W.; Wang, X. Evaluation of costs associated with atmospheric mercury emission reductions from coal combustion in China in 2010 and projections for 2020. Sci. Total Environ. 2018, 610–611, 796–801. [Google Scholar] [CrossRef]
- Zhang, L.; Cao, N. Impact of fly ash field on groundwater environment in thermal power plants. Sci. Technol. Life 2011, 7, 209. (In Chinese) [Google Scholar]
- Swanson, S.M.; Engle, M.A.; Ruppert, L.F.; Affolter, R.H.; Jones, K.B. Partitioning of selected trace elements in coal combustion products from two coal-burning power plants in the United States. Int. J. Coal Geol. 2013, 113, 116–126. [Google Scholar] [CrossRef]
- Sun, Y.; Zhao, C.; Qin, S.; Xiao, L.; Li, Z.; Lin, M. Occurrence of some valuable elements in the unique ‘high-aluminum coals’ from the Jungar coalfield, China. Ore Geol. Rev. 2016, 72, 659–668. [Google Scholar] [CrossRef]
- Wang, J.; Yang, Z.; Qin, S.; Panchal, B.; Sun, Y.; Niu, H. Distribution characteristics and migration patterns of hazardous trace elements in coal combustion products of power plants. Fuel 2019, 258, 116062. [Google Scholar] [CrossRef]
- Bhangare, R.C.; Ajmal, P.Y.; Sahu, S.K.; Pandit, G.G.; Puranik, V.D. Distribution of trace elements in coal and combustion residues from five thermal power plants in India. Int. J. Coal Geol. 2011, 86, 349–356. [Google Scholar] [CrossRef]
- Tang, Q.; Liu, G.; Zhou, C.; Sun, R. Distribution of trace elements in feed coal and combustion residues from two coal-fired power plants at Huainan, Anhui, China. Fuel 2013, 107, 315–322. [Google Scholar] [CrossRef]
- Dai, S.; Ren, D.; Tang, Y.; Yue, M.; Hao, L. Concentration and distribution of elements in Late Permian coals from western Guizhou Province, China. Int. J. Coal Geol. 2005, 61, 119–137. [Google Scholar] [CrossRef]
- Finkelman, R.B.; Orem, W.; Castranova, V.; Tatu, C.A.; Belkin, H.E.; Zheng, B.; Lerch, H.E. Health impacts of coal and coal use: Possible solutions. Int. J. Coal Geol. 2002, 50, 425–443. [Google Scholar] [CrossRef]
- Liu, G.; Vassilev, S.V.; Gao, L.; Zheng, L.; Peng, Z. Mineral and chemical composition and some trace element contents in coals and coal ashes from Huaibei coal field, China. Energy Convers. Manag. 2005, 46, 2001–2009. [Google Scholar] [CrossRef]
- USGS. Mineral Commodity Summaries, Rare Earths. 2017. Available online: https://minerals.usgs.gov/minerals/pubs/commodity/rare_earths/mcs-2017-raree.pdf (accessed on 4 October 2021).
- Dai, S.; Finkelman, R.B. Coal as a promising source of critical elements: Progress and future prospects. Int. J. Coal Geol. 2018, 186, 155–164. [Google Scholar] [CrossRef]
- Chen, J.; Zhang, B.; Zhang, S.; Zeng, J.; Chen, P.; Liu, W.; Wang, X. A complete atmospheric emission inventory of F, As, Se, Cd, Sb, Hg, Pb, and U from coal-fired power plants in Anhui Province, eastern China. Environ. Geochem. Health 2021, 43, 1817–1837. [Google Scholar] [CrossRef]
- D388-12; Standard Classification of Coals by Rank. ASTM International: West Conshohocken, PA, USA, 2012.
- Sun, R.; Liu, G.; Zheng, L.; Chou, C.L. Characteristics of coal quality and their relationship with coal-forming environment: A case study from the Zhuji exploration area, Huainan coalfield, Anhui, China. Energy 2010, 35, 423–435. [Google Scholar] [CrossRef]
- D2234M-16; Standard Test Method for Collection of a Gross Sample of Coal. ASTM International: West Conshohocken, PA, USA, 2016.
- Dai, S.; Wang, X.; Zhou, Y.; Hower, J.C.; Li, D.; Chen, W.; Zhu, X.; Zou, J. Chemical and mineralogical compositions of silicic, mafic, and alkali tonsteins in the late Permian coals from the Songzao Coalfield, Chongqing, Southwest China. Chem. Geol. 2011, 282, 29–44. [Google Scholar] [CrossRef]
- Li, X.; Dai, S.; Zhang, W.; Li, T.; Zheng, X.; Chen, W. Determination of As and Se in coal and coal combustion products using closed vessel microwave digestion and collision/reaction cell technology (CCT) of inductively coupled plasma mass spectrometry (ICP-MS). Int. J. Coal Geol. 2014, 124, 1–4. [Google Scholar] [CrossRef]
- Dai, S.; Graham, I.T.; Ward, C.R. A review of anomalous rare earth elements and yttrium in coal. Int. J. Coal Geol. 2016, 159, 82–95. [Google Scholar] [CrossRef]
- Zhang, B.; Chen, J.; Sha, J.; Zhang, S.; Zeng, J.; Chen, P.; Yao, D.; Liu, W.; Wang, X.; Zhang, P.; et al. Geochemistry of coal thermally-altered by igneous intrusion: A case study from the Pansan Coal Mine of Huainan Coalfield, Anhui, Eastern China. J. Geochem. Explor. 2020, 213, 106532. [Google Scholar] [CrossRef]
- Dai, S.; Ren, D.; Chou, C.-L.; Finkelman, R.B.; Seredin, V.V.; Zhou, Y. Geochemistry of trace elements in Chinese coals: A review of abundances, genetic types, impacts on human health, and industrial utilization. Int. J. Coal Geol. 2012, 94, 3–21. [Google Scholar] [CrossRef]
- Dai, S.; Zhao, L.; Peng, S.; Chou, C.L.; Wang, X.; Zhang, Y.; Li, D.; Sun, Y. Abundances and distribution of minerals and elements in high-alumina coal fly ash from the Jungar Power Plant, Inner Mongolia, China. Int. J. Coal Geol. 2010, 81, 320–332. [Google Scholar] [CrossRef]
- Meij, R. Trace element behavior in coal-fired power plants. Fuel Process. Technol. 1994, 39, 199–217. [Google Scholar] [CrossRef]
- Ouyang, Z. Enrichment of heavy metals in fine particles during coal combustion. Fuel Energy Abstr. 1997, 38, 379. [Google Scholar]
- Córdoba, P. Partitioning and speciation of selenium in wet limestone flue gas desulphurisation systems: A review. Fuel 2017, 202, 184–195. [Google Scholar] [CrossRef]
- Rudnick, R.L.; Gao, S. Composition of the Continental Crust. In Treatise on Geochemistry; Holland, H.D., Turekian, K.K., Eds.; Elsevier: Oxford, UK, 2014; pp. 1–51. [Google Scholar]
- Seredin, V.V.; Dai, S. Coal deposits as potential alternative sources for lanthanides and yttrium. Int. J. Coal Geol. 2012, 94, 67–93. [Google Scholar] [CrossRef]
- Chen, J.; Liu, G.; Li, H.; Wu, B. Mineralogical and geochemical responses of coal to igneous intrusion in the Pansan Coal Mine of the Huainan coalfield, Anhui, China. Int. J. Coal Geol. 2014, 124, 11–35. [Google Scholar] [CrossRef]
- Dai, S.; Zhang, W.; Ward, C.R.; Seredin, V.V.; Hower, J.C.; Li, X.; Song, W.; Wang, X.; Kang, H.; Zheng, L. Mineralogical and geochemical anomalies of late Permian coals from the Fusui Coalfield, Guangxi Province, southern China: Influences of terrigenous materials and hydrothermal fluids. Int. J. Coal Geol. 2013, 105, 60–84. [Google Scholar] [CrossRef]
- Dai, S.; Wang, P.; Ward, C.R.; Tang, Y.; Song, X.; Jiang, J.; Hower, J.C.; Li, T.; Serdin, V.V.; Wangner, N.J.; et al. Elemental and mineralogical anomalies in the coal-hosted Ge ore deposit of Lincang, Yunnan, southwestern China: Key role of N2–CO2-mixed hydrothermal solutions. Int. J. Coal Geol. 2015, 152, 19–46. [Google Scholar] [CrossRef]
- Hood, M.M.; Taggart, R.K.; Smith, R.C.; Hsu-Kim, H.; Hower, J.C. Rare earth element distribution in fly ash derived from the Fire Clay coal, Kentucky. Coal Combust. Gasif. Prod. 2017, 9, 22–33. [Google Scholar] [CrossRef]
- Furimsky, E. Characterization of trace element emissions from coal combustion by equilibrium calculations. Fuel Process. Technol. 2000, 63, 29–44. [Google Scholar] [CrossRef]
- Seames, W.S.; Wendt, J. Regimes of association of arsenic and selenium during pulverized coal combustion. Proc. Combust. Inst. 2007, 31, 2839–2846. [Google Scholar] [CrossRef]
- Wen, M.Z.; Xu, W.D. Mobility and release of hazardous trace elements in coal-fired power plant. J. China Coal Soc. 2010, 35, 1518–1523. (In Chinese) [Google Scholar]
- Shah, P.; Strezov, V.; Nelson, P.F. Speciation of chromium in Australian coals and combustion products. Fuel 2012, 102, 1–8. [Google Scholar] [CrossRef]
- Yi, H.; Hao, J.; Lei, D.; Tang, X.; Ning, P.; Li, X. Fine particle and trace element emissions from an anthracite coal-fired power plant equipped with a bag-house in China. Fuel 2008, 87, 2050–2057. [Google Scholar] [CrossRef]
- Helble, J.J. A model for the air emissions of trace metallic elements from coal combustors equipped with electrostatic precipitators. Fuel Process. Technol. 2000, 63, 125–147. [Google Scholar] [CrossRef]
- Al-Abed, S.R.; Jegadeesan, G.; Scheckel, K.G.; Tolaymat, T. Speciation, characterization, and mobility of As, Se, and Hg in flue gas desulphurization residues. Environ. Sci. Technol. 2008, 42, 1693–1698. [Google Scholar] [CrossRef]
- Font, O.; Izquierdo, M.; Ochoa-Gonzalez, R.; Leiva, C.; Alvarez, E. Fate of trace pollutants in PCC-FGD power plants. In Proceedings of the World of Coal Ash—WOCA Conference, Lexington, KY, USA, 4–7 May 2009. [Google Scholar]
- Tang, Q.; Liu, G.; Yan, Z.; Sun, R. Distribution and fate of environmentally sensitive elements (arsenic, mercury, stibium and selenium) in coal-fired power plants at Huainan, Anhui, China. Fuel 2012, 95, 334–339. [Google Scholar] [CrossRef]
- Xu, M.; Yan, R.; Zheng, C.; Qiao, Y.; Han, J.; Sheng, C. Status of trace element emission in a coal combustion process: A review. Fuel Process. Technol. 2004, 85, 215–237. [Google Scholar] [CrossRef]
- Zhang, J.Y.; Ren, D.Y.; Zhong, Q.; Xu, F.M.; Zhang, Y.G.; Yin, J.S. Retention of selenium volatility using lime in coal combustion. Environ. Sci. Technol. 2003, 22, 100–103. (In Chinese) [Google Scholar]
- Li, J.; Liu, T.L. The effect on leaching behavior of heavy metals contained in fly ash by using CaO. J. Northeast. China Inst. Electr. Power Eng. Nat. Sci. Ed. 2005, 2, 85–87. [Google Scholar]
- Ward, C.R.; French, D.; Jankowski, J.; Dubikova, M.; Li, Z.; Riley, K.W. Element mobility from fresh and long-stored acidic fly ashes associated with an Australian power station. Int. J. Coal Geol. 2009, 80, 224–236. [Google Scholar] [CrossRef]
- Oliveira, M.L.S.; Ward, C.R.; French, D.; Hower, J.C.; Querol, X.; Silva, L.F.O. Mineralogy and leaching characteristics of beneficiated coal products from Santa Catarina, Brazil. Int. J. Coal Geol. 2012, 94, 314–325. [Google Scholar] [CrossRef]
- Jankowski, J.; Dubikova, M.; Ward, C.R.; French, D. An application of hydrogeochemical modelling in understanding chemical reactions in fly ash-water interaction during batch leaching tests of acidic fly ashes. In Proceedings of the 22nd International Pittsburgh Coal Conference, Pittsburgh, PA, USA, 12–15 September 2005. [Google Scholar]
- Ketris, M.P.; Yudovich, Y. Estimations of Clarkes for Carbonaceous biolithe: World averages for trace element contents in black shales and coals. Int. J. Coal Geol. 2009, 78, 135–148. [Google Scholar] [CrossRef]
- Dai, S.; Xie, P.; Jia, S.; Ward, C.R.; Hower, J.C.; Yan, X.; French, D. Enrichment of U-Re-V-Cr-Se and rare earth elements in the Late Permian coals of the Moxinpo Coalfield, Chongqing, China: Genetic implications from geochemical and mineralogical data. Ore Geol. Rev. 2017, 80, 1–17. [Google Scholar] [CrossRef]
Disclaimer/Publisher’s Note: The statements, opinions and data contained in all publications are solely those of the individual author(s) and contributor(s) and not of MDPI and/or the editor(s). MDPI and/or the editor(s) disclaim responsibility for any injury to people or property resulting from any ideas, methods, instructions or products referred to in the content. |
© 2023 by the authors. Licensee MDPI, Basel, Switzerland. This article is an open access article distributed under the terms and conditions of the Creative Commons Attribution (CC BY) license (https://creativecommons.org/licenses/by/4.0/).

