
Digital Cake Analysis: A Novel Coal Filter Cake Examination Technique Using Microcomputed Tomography


Abstract
:1. Introduction
2. Experimental
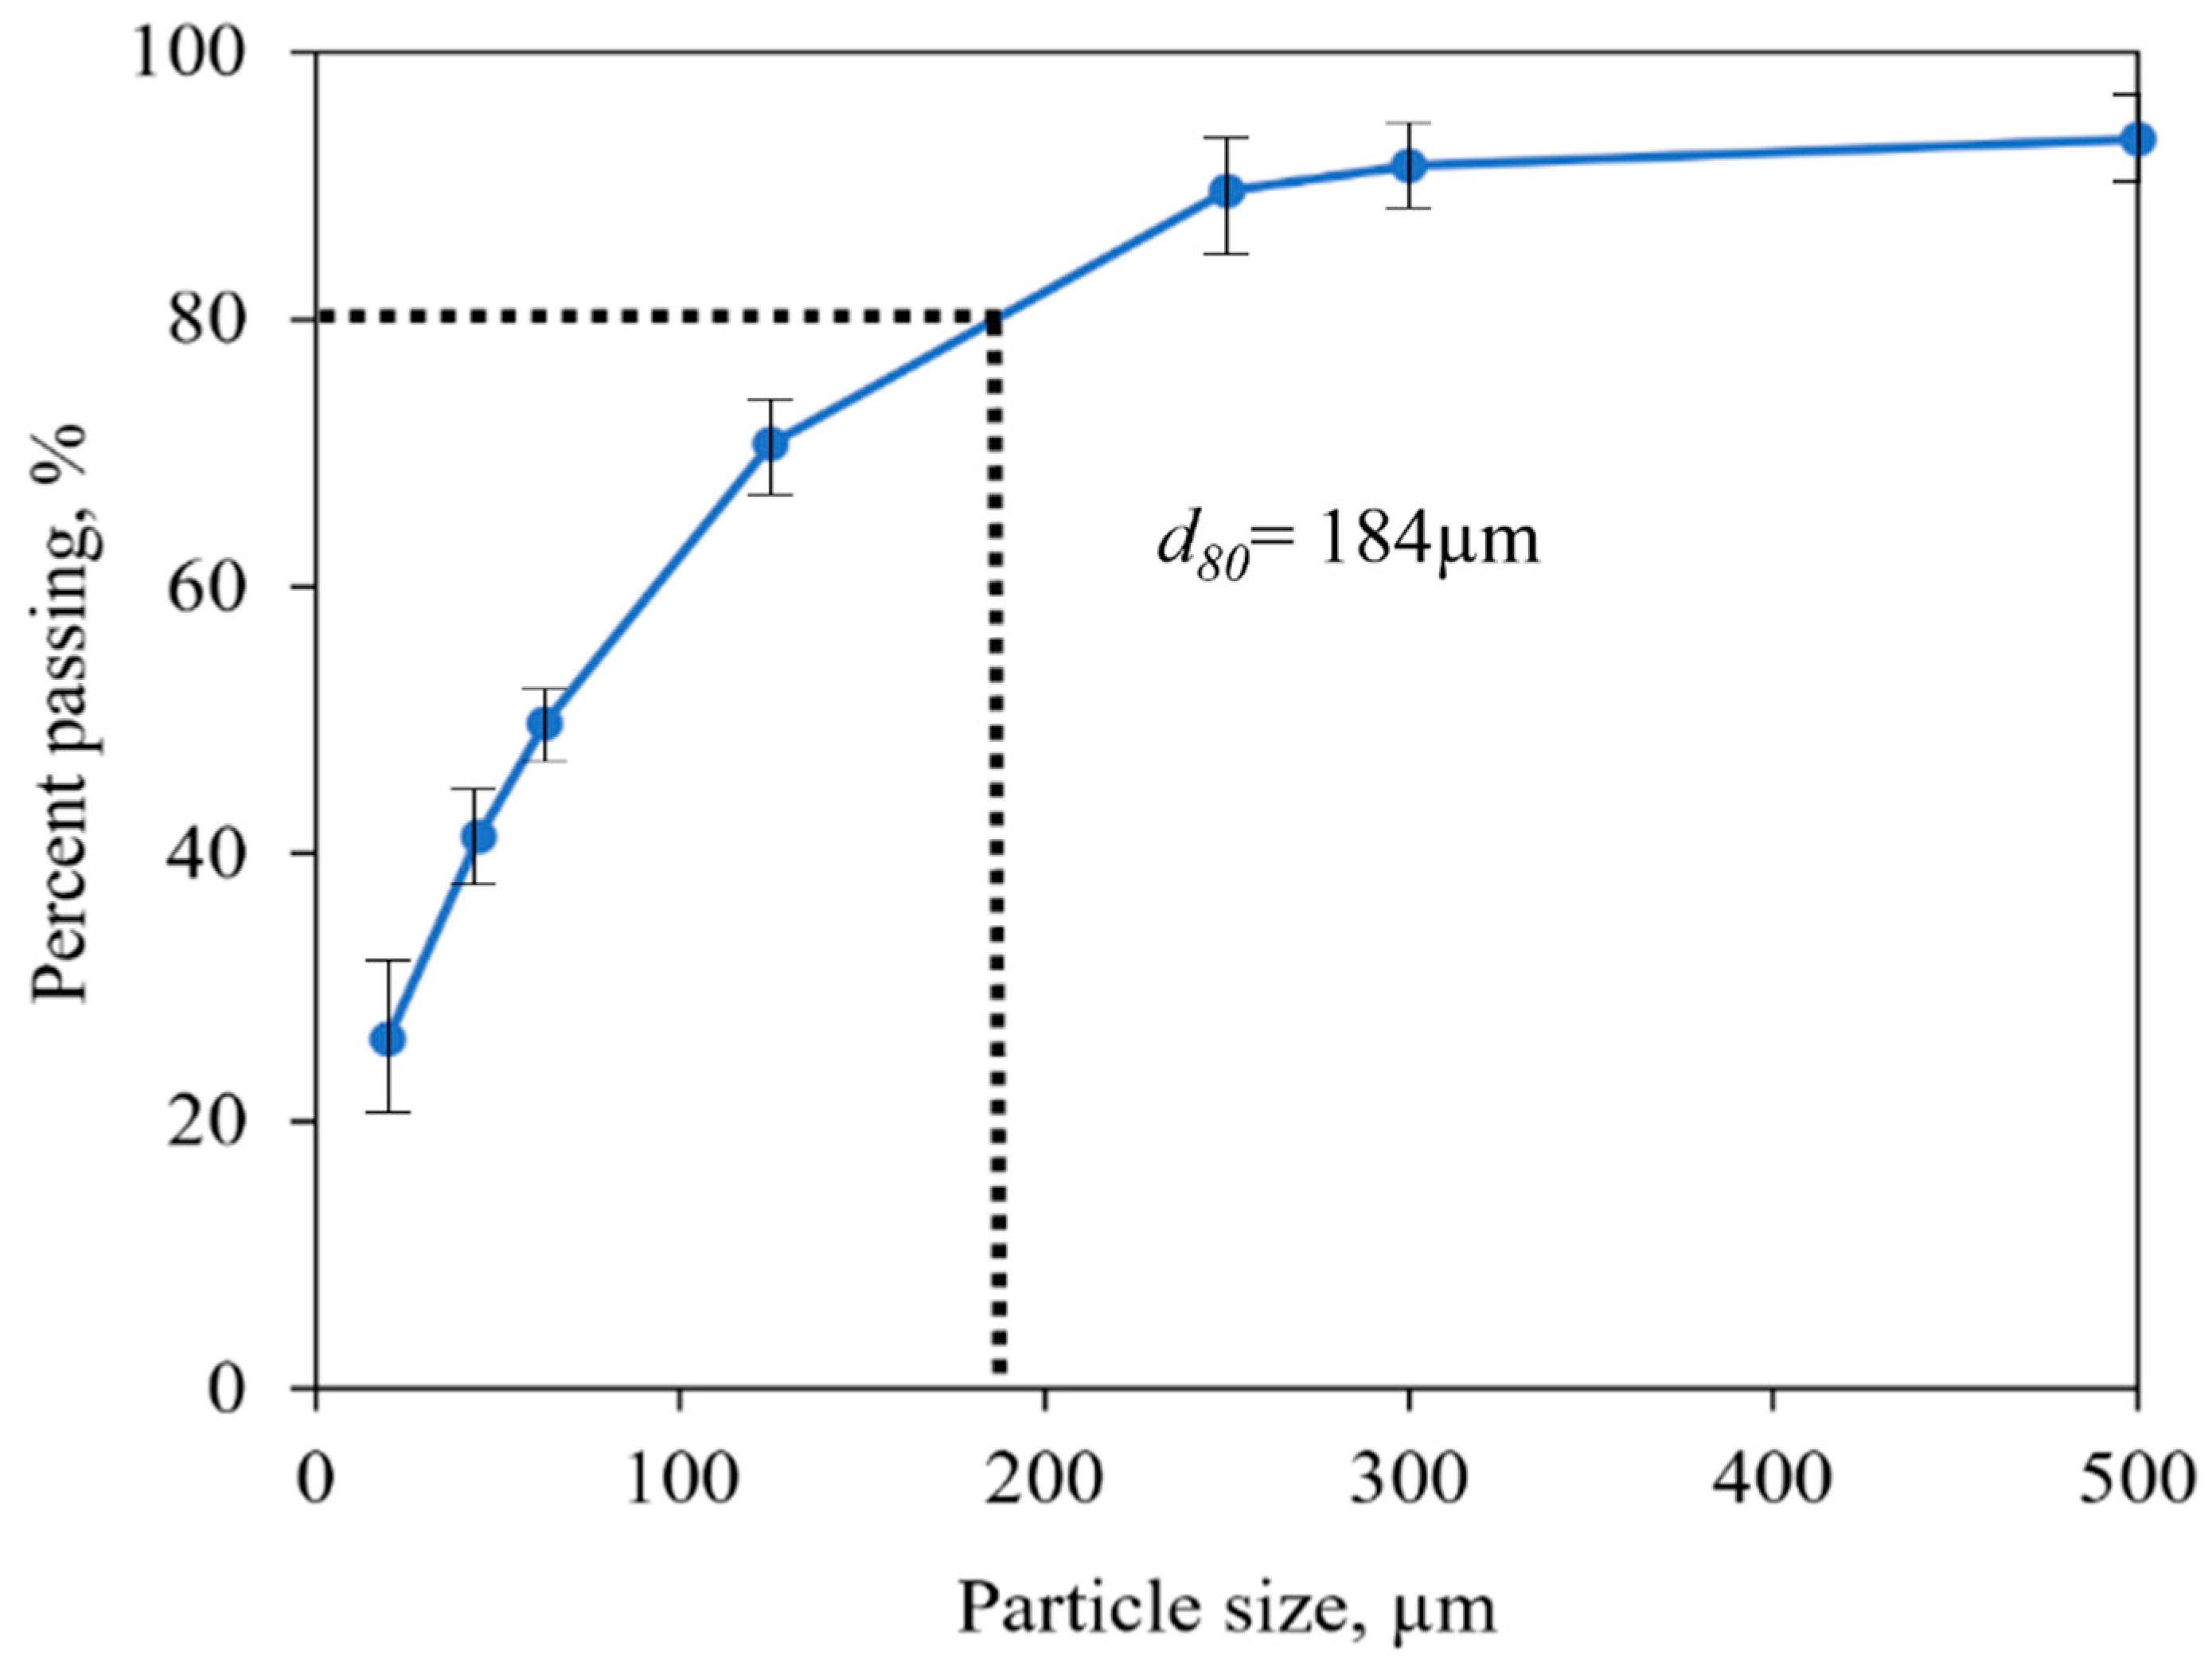
2.1. Materials
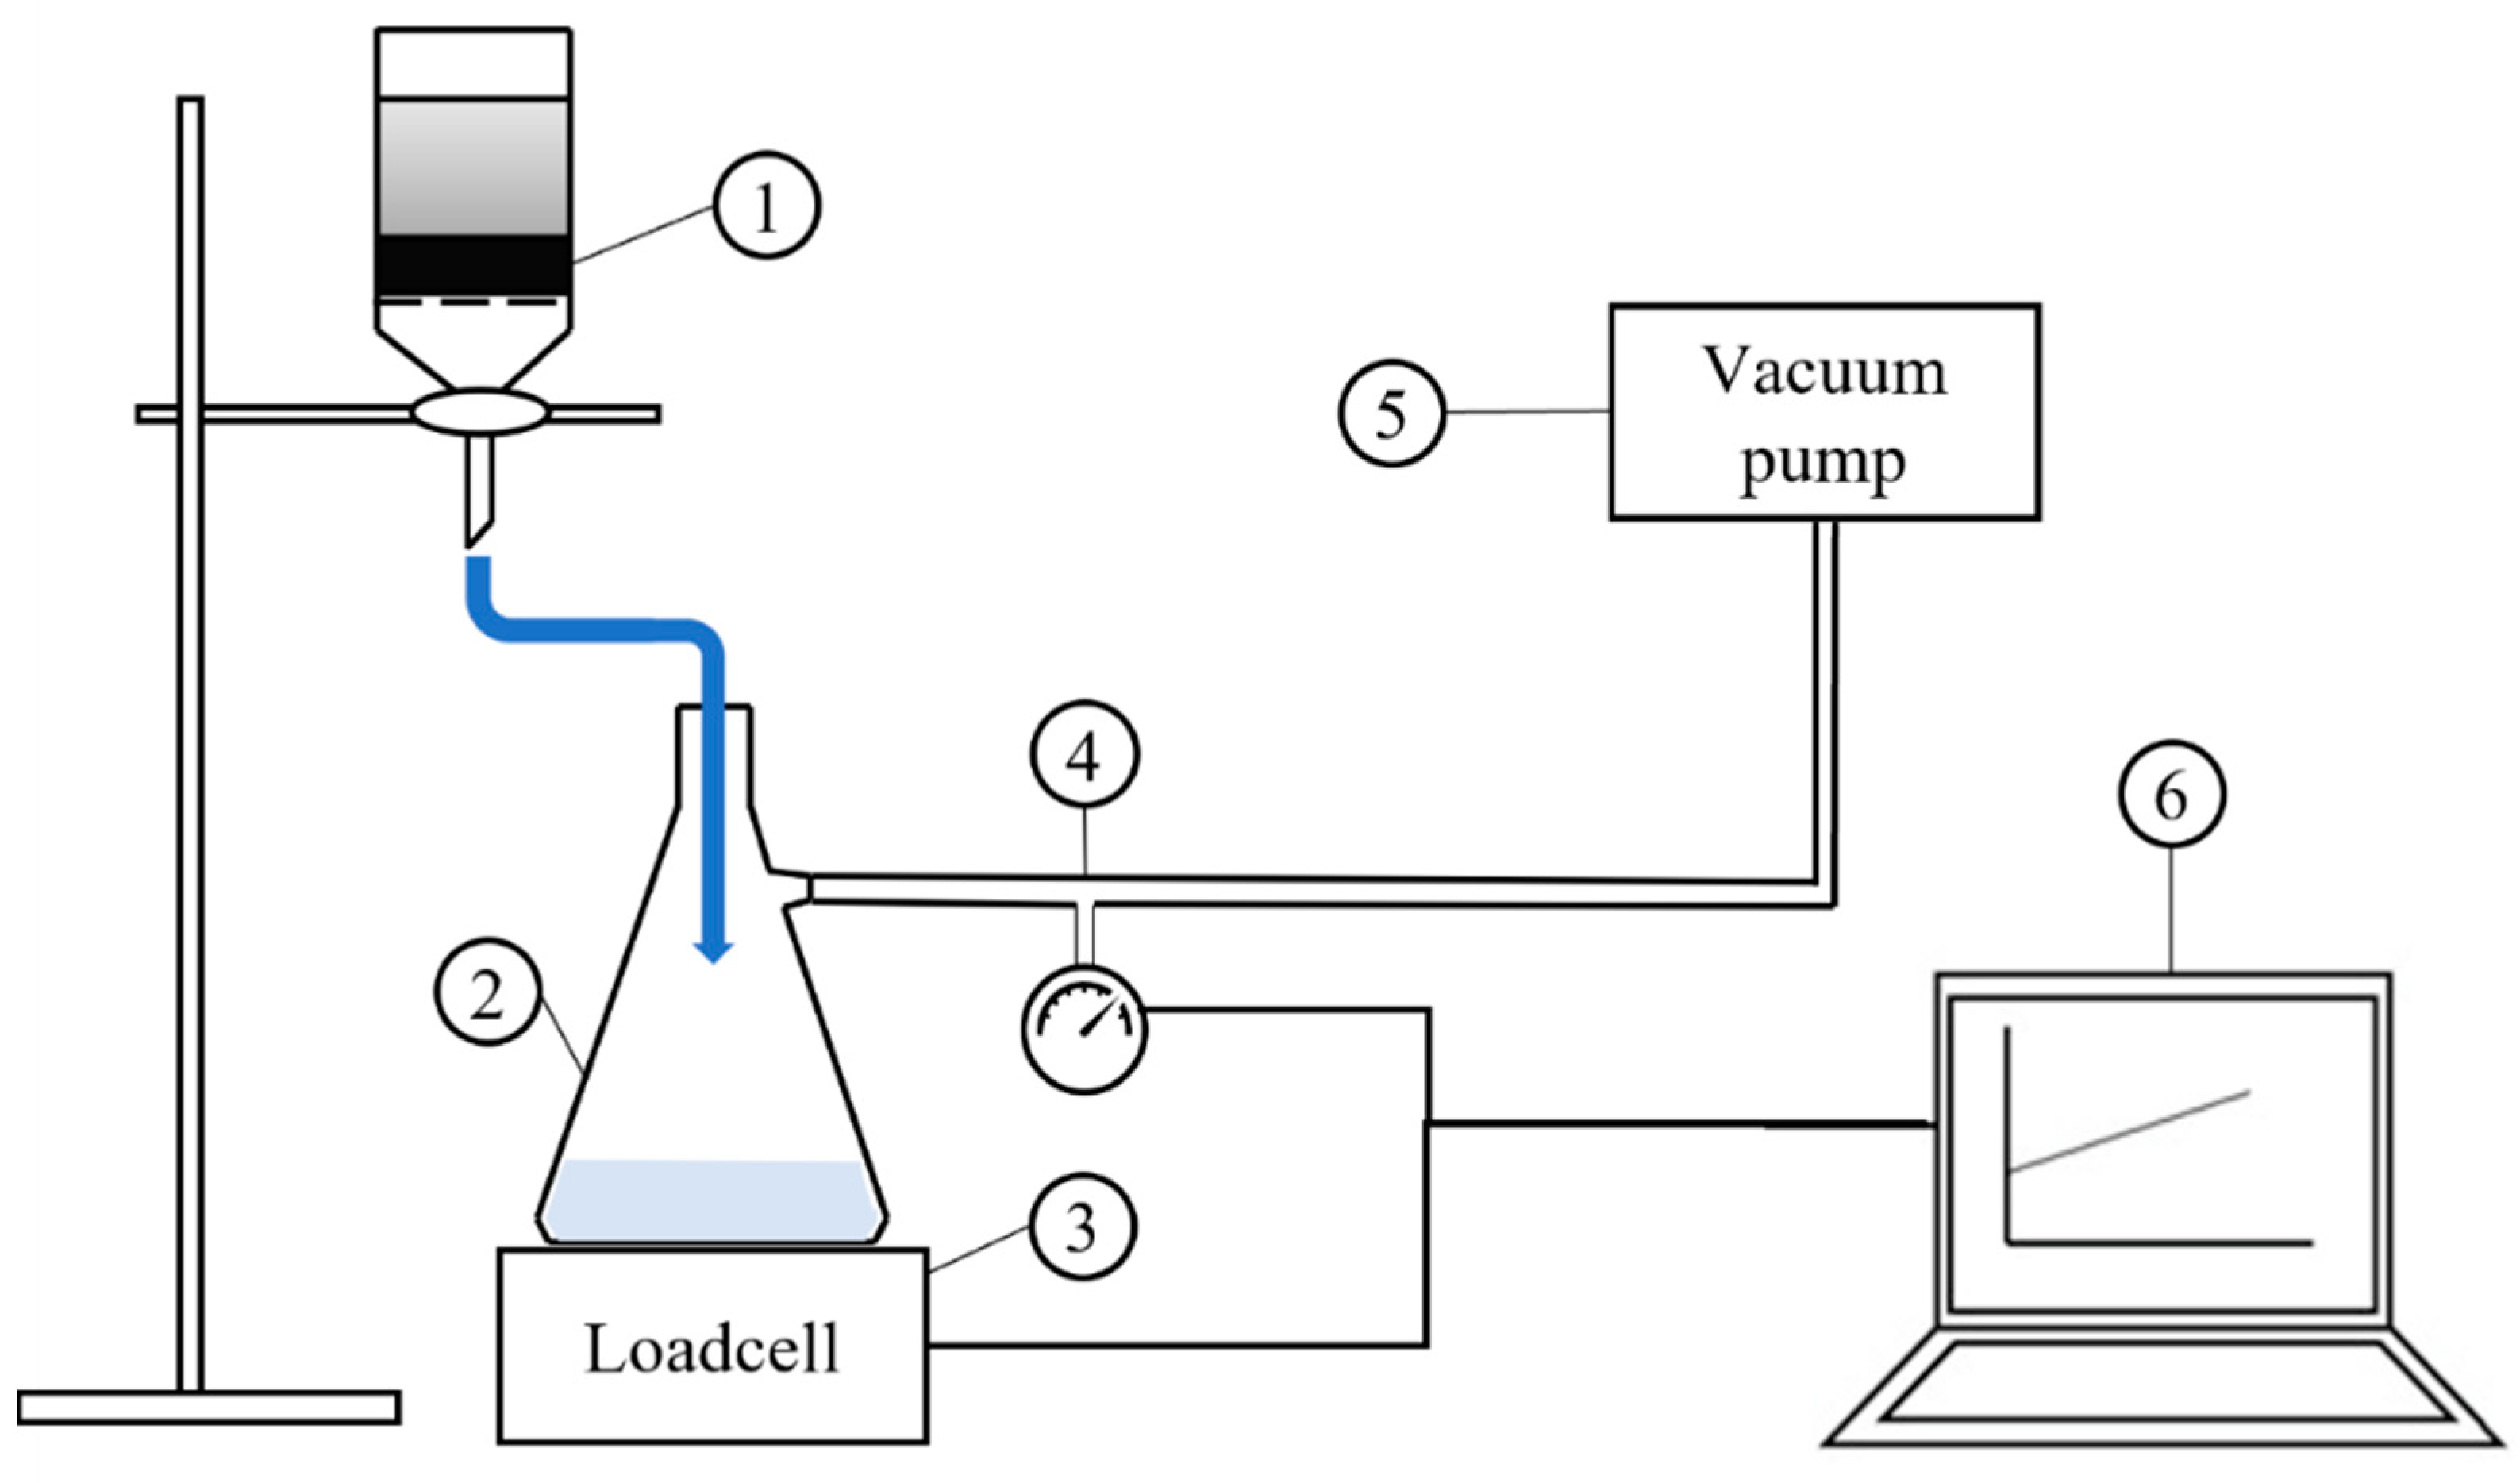
2.2. Slurry Preparation and Filtration
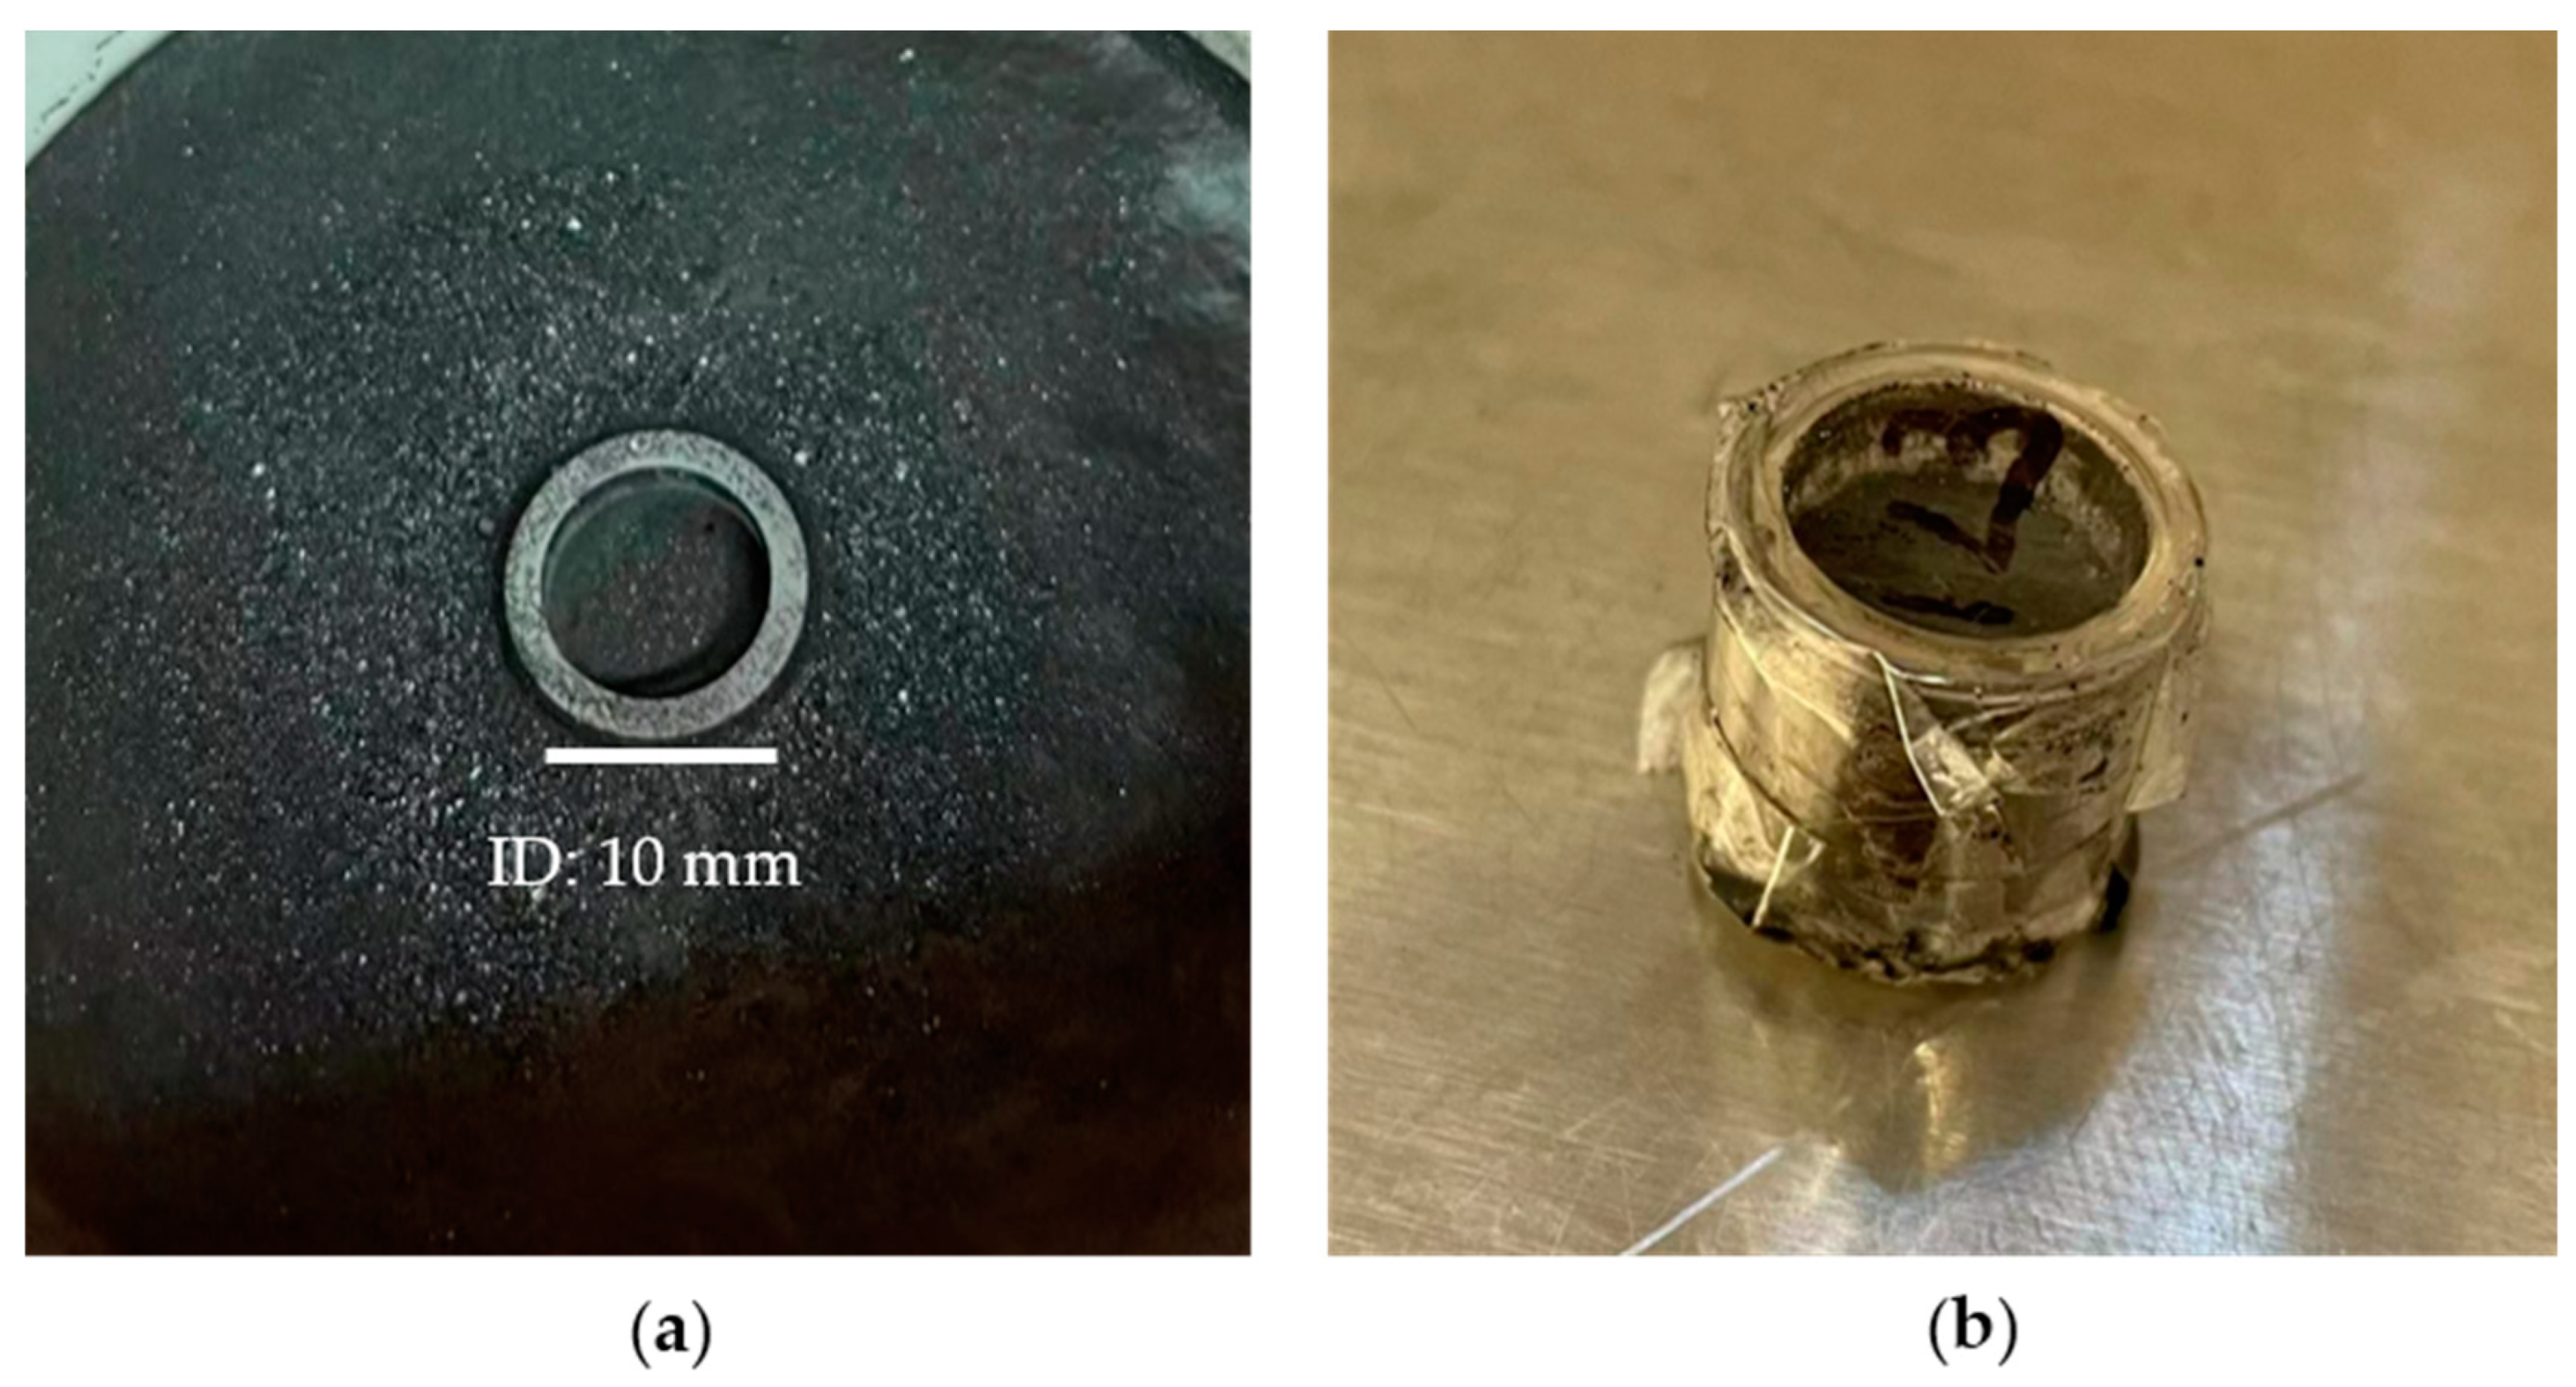
2.3. Filter Cake Sampling
2.4. Experimental Porosity Measurement Method
2.5. Digital Cake Analysis Methods
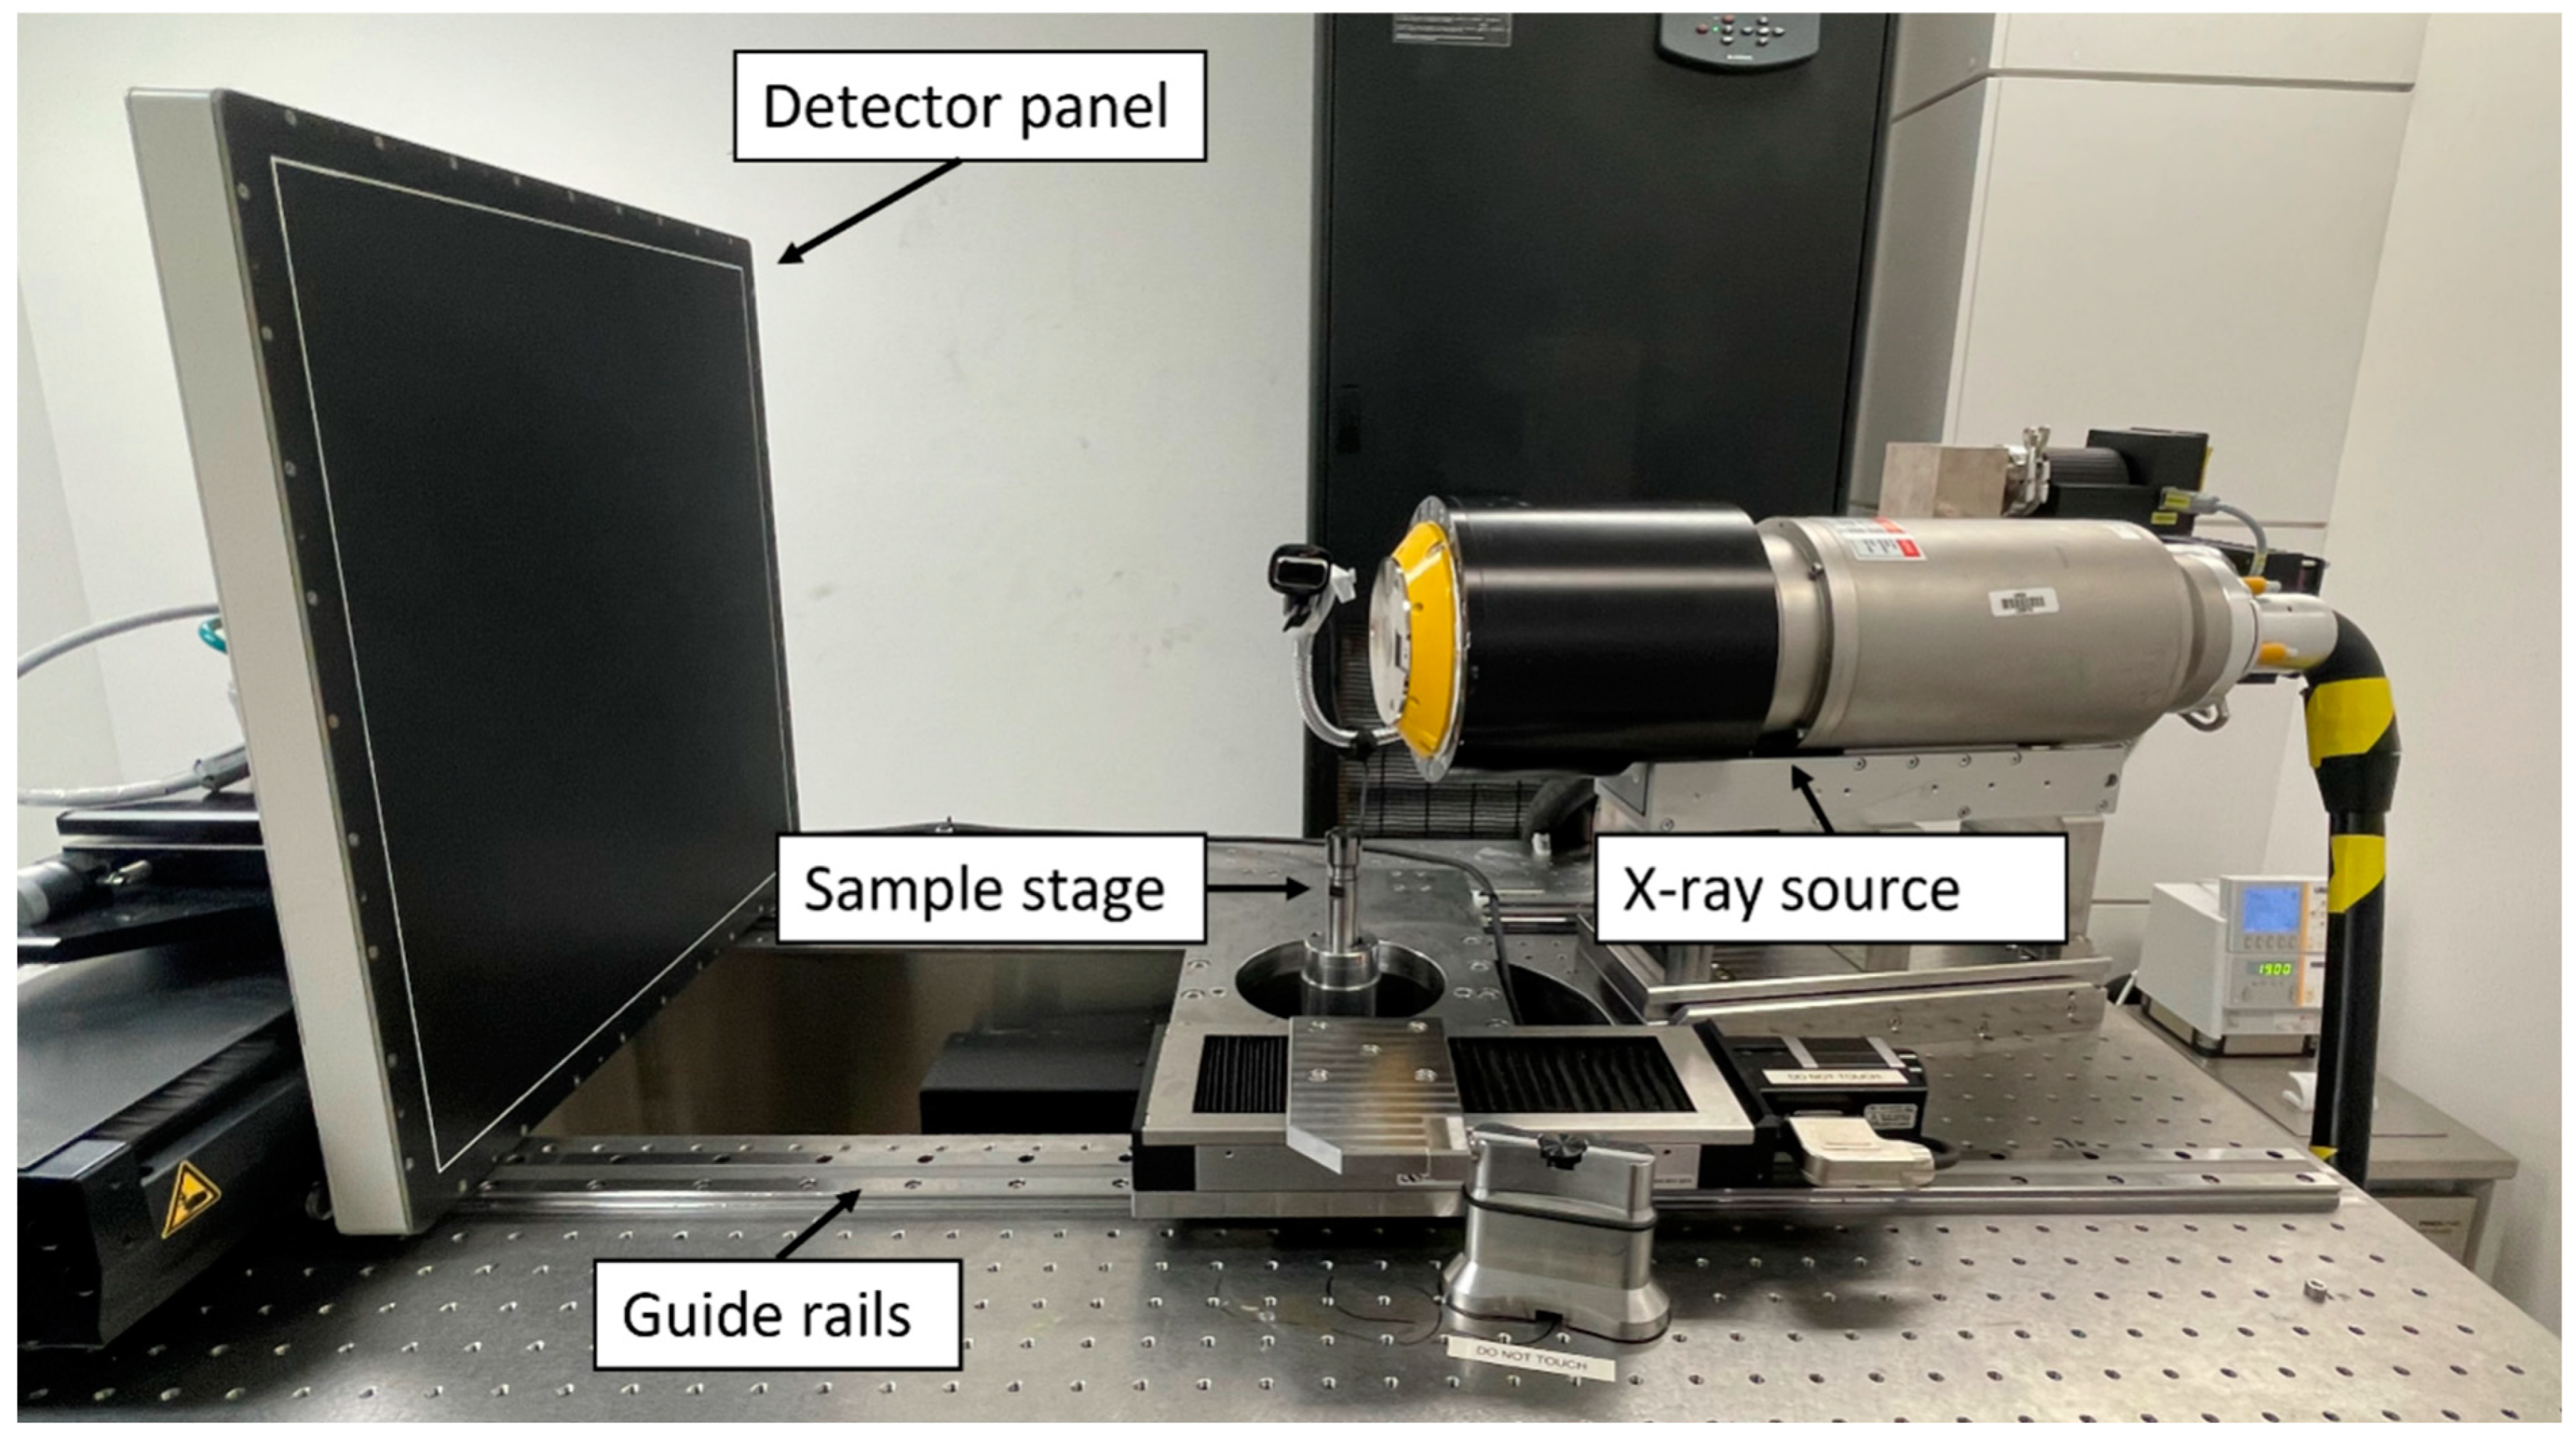
2.5.1. µCT Imaging
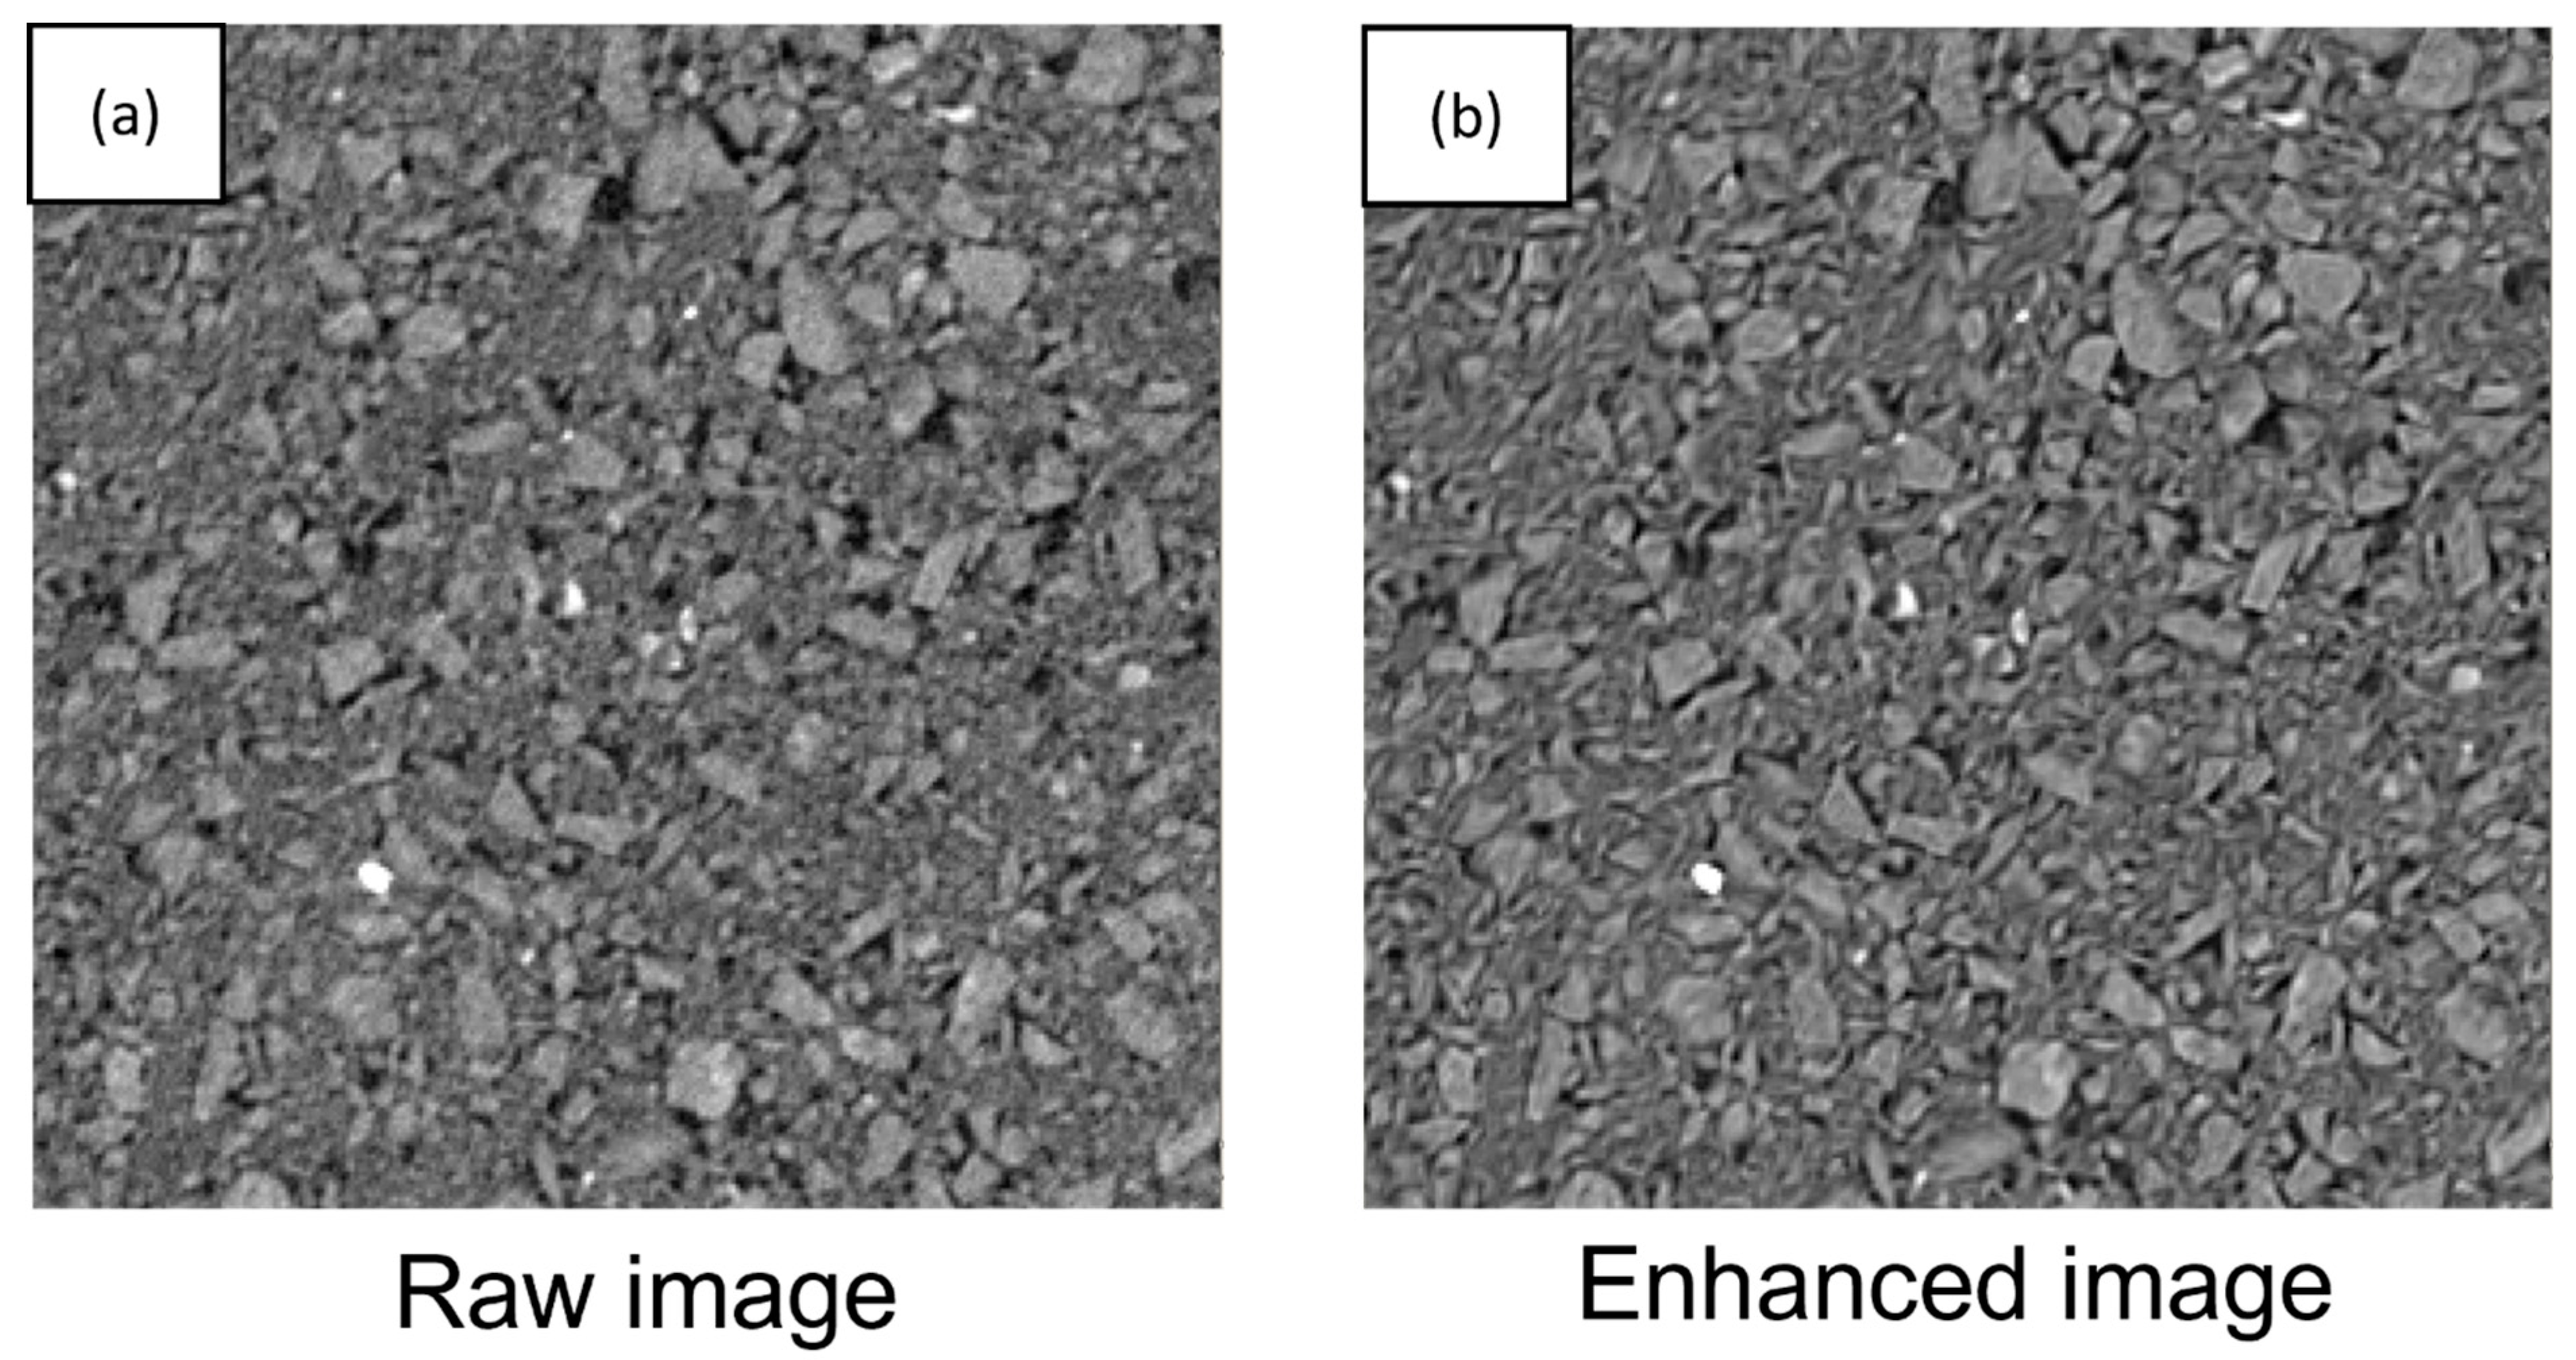
2.5.2. Image Quality Enhancement
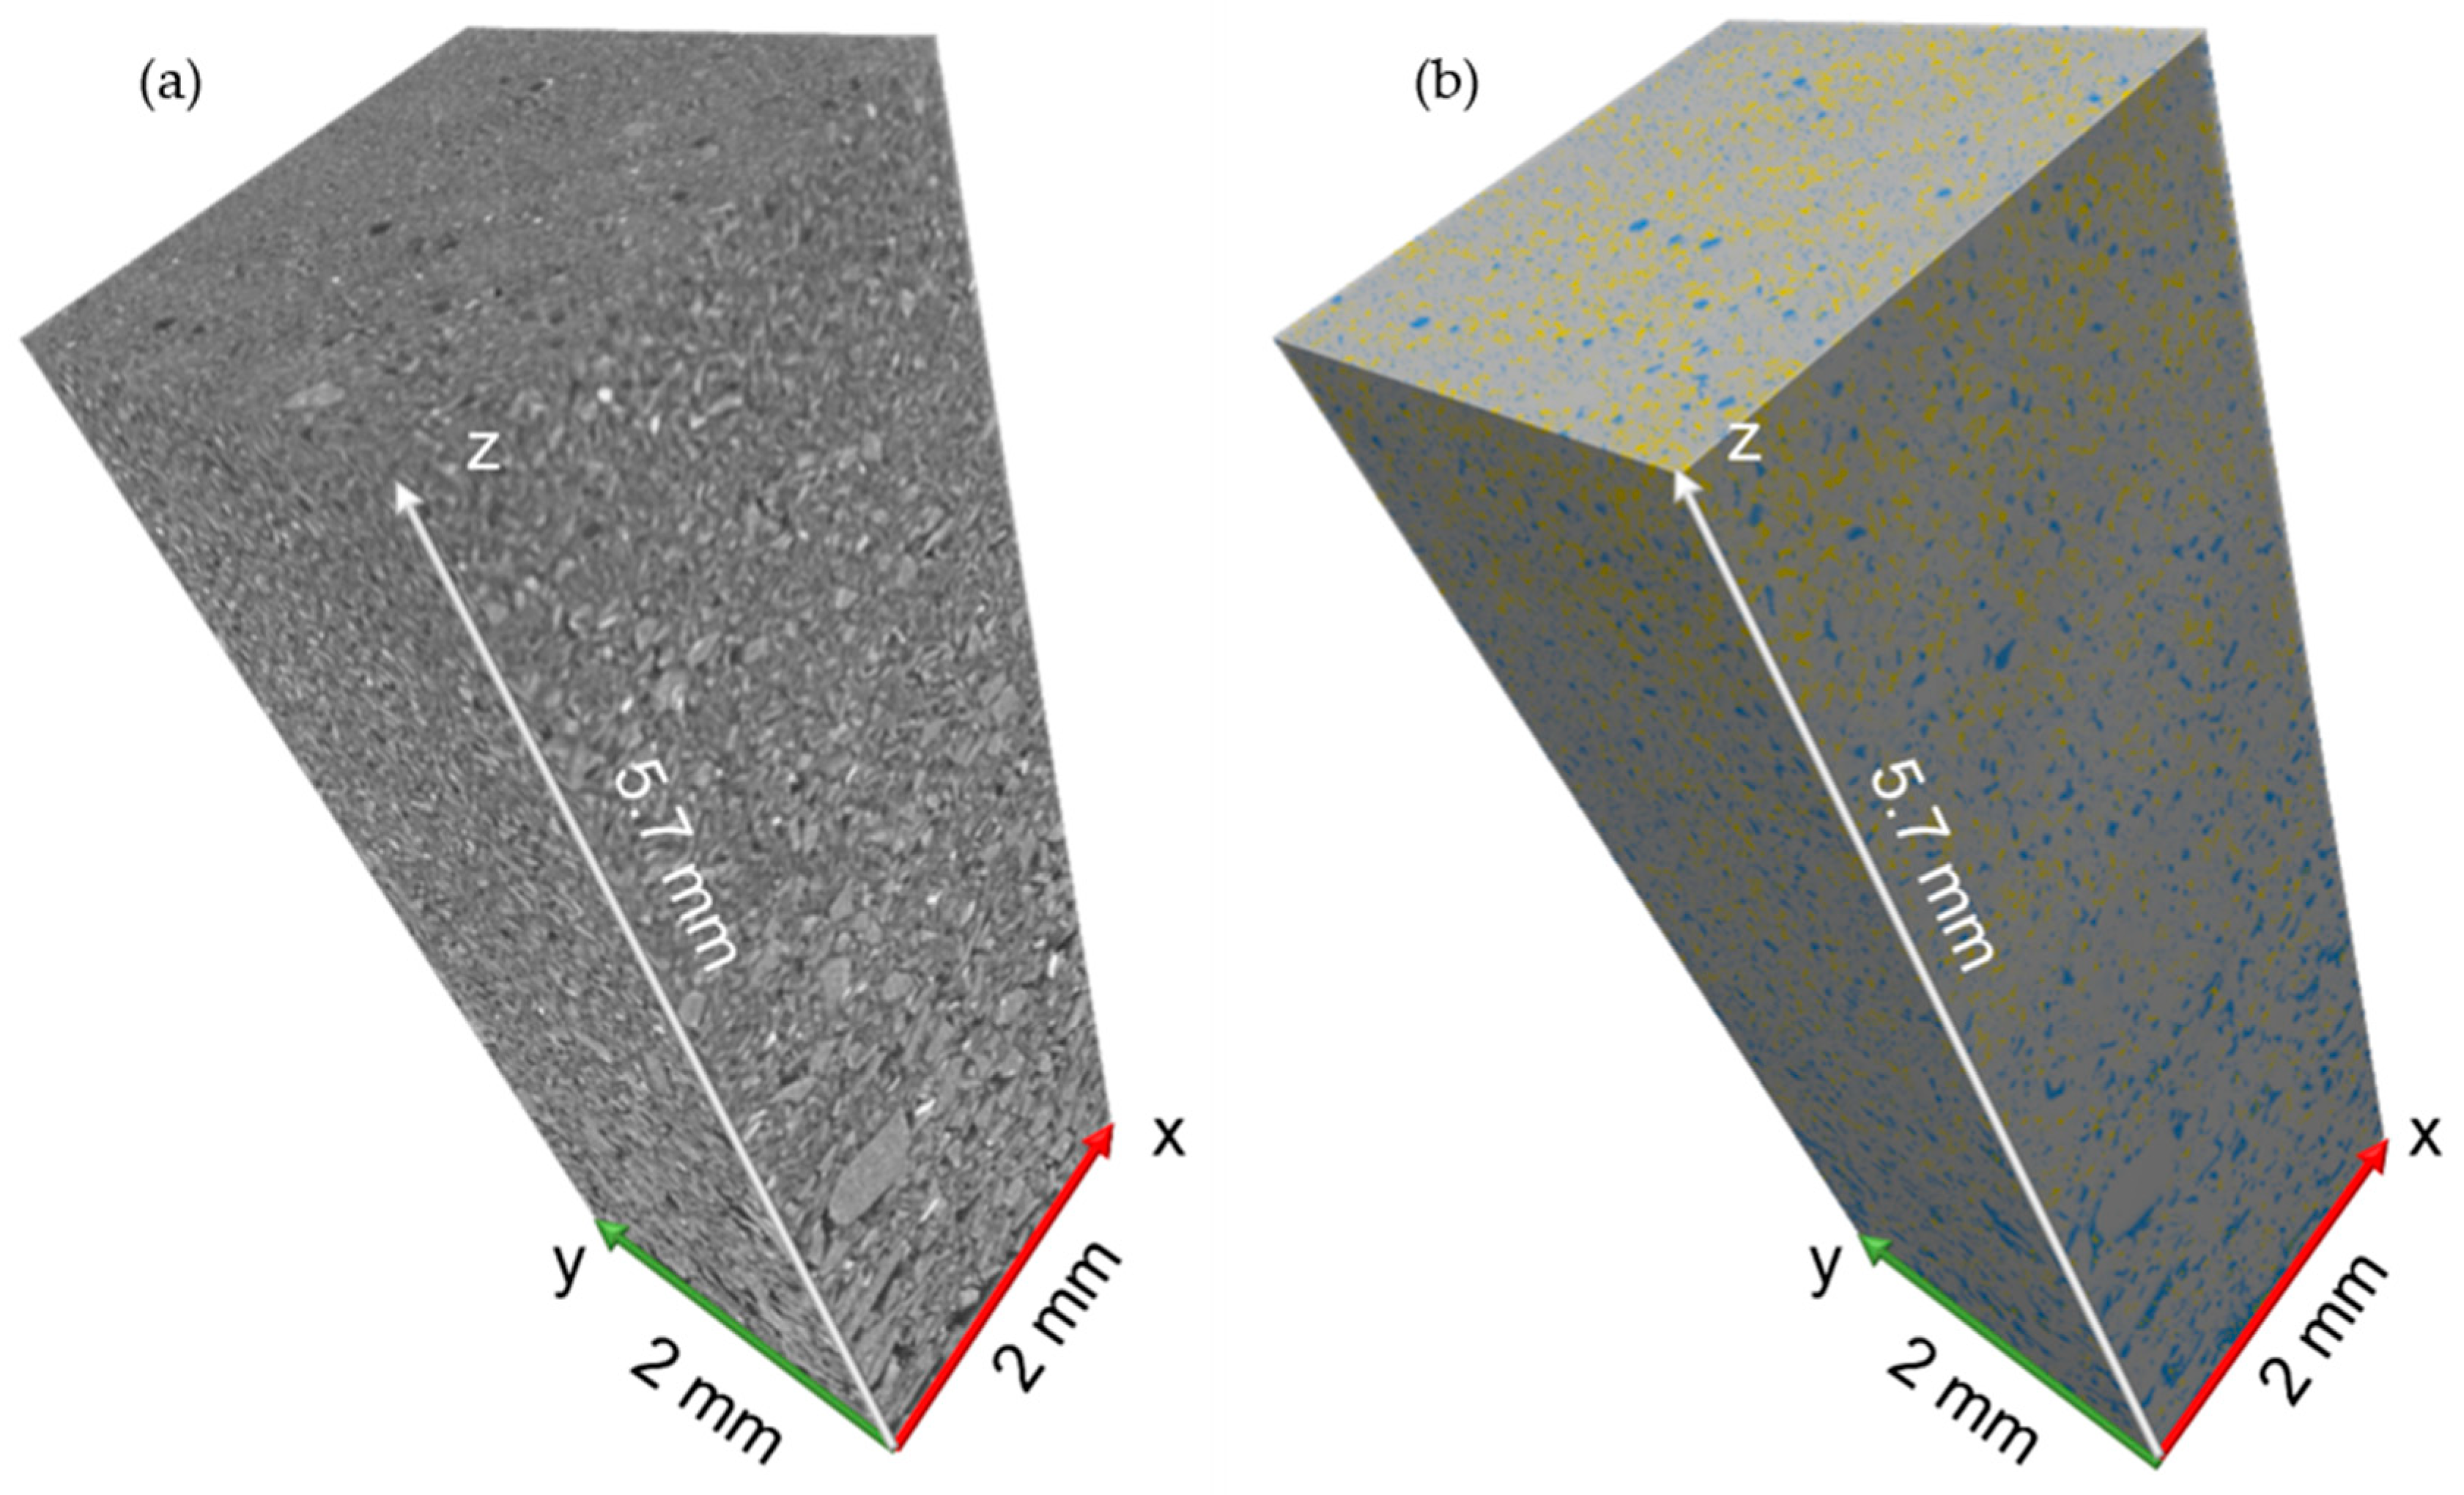
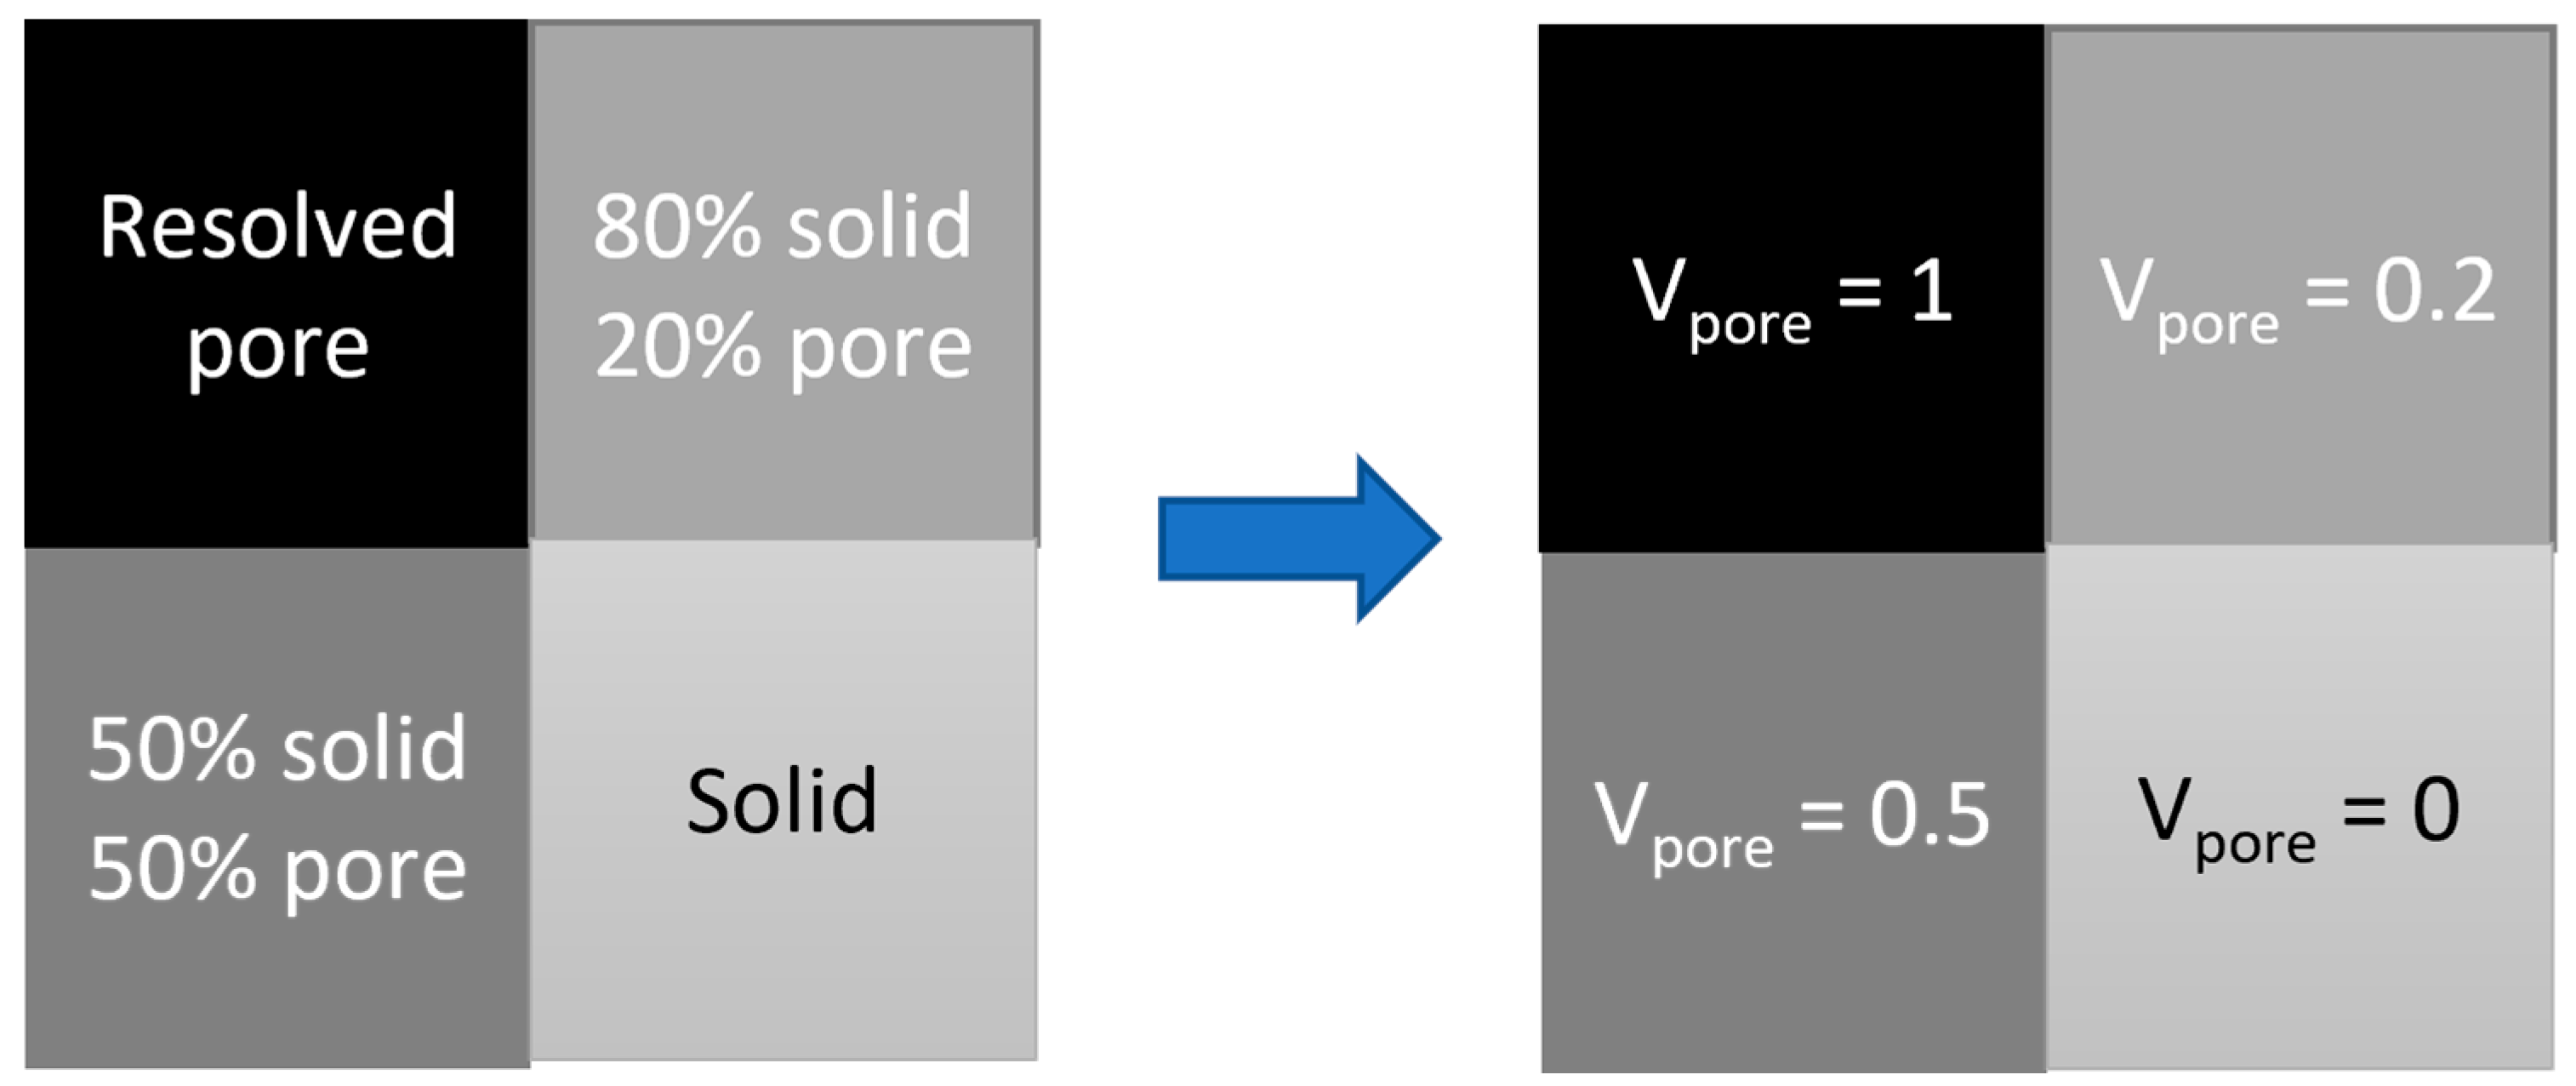
2.5.3. Image Segmentation
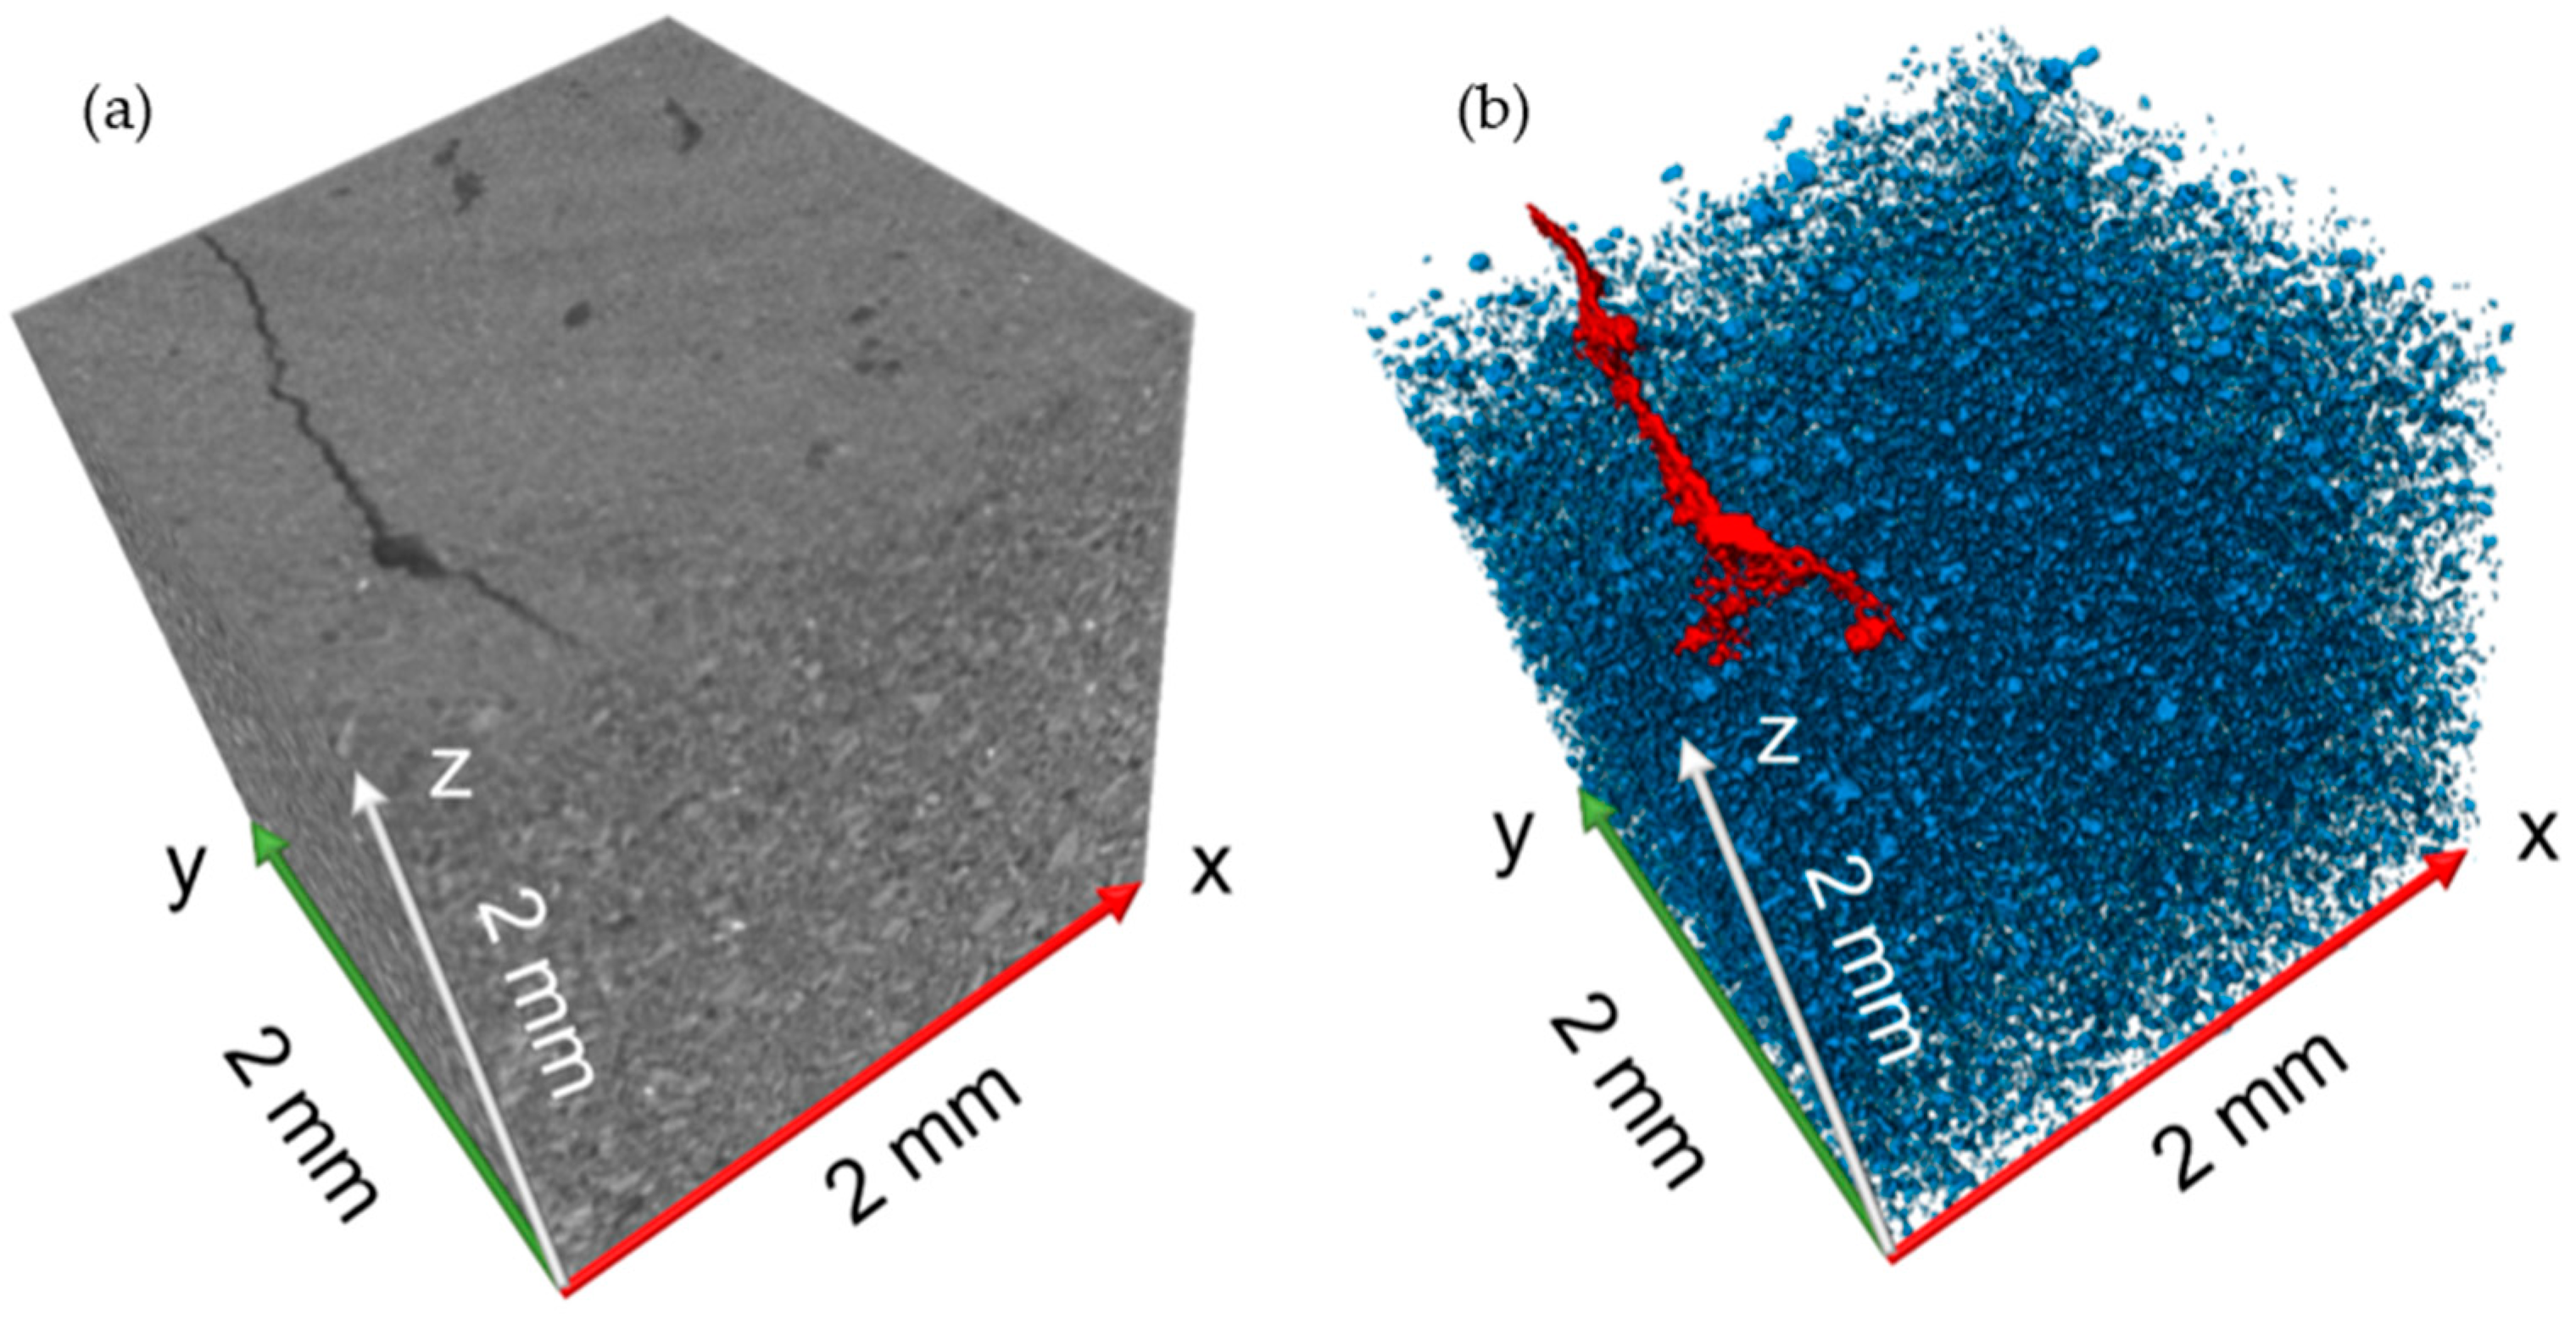
2.5.4. Crack Isolation
2.5.5. Imaged-Based Cake Analyses
3. Results and Discussions
3.1. Filter Cake Porosity
3.2. Crack Isolation
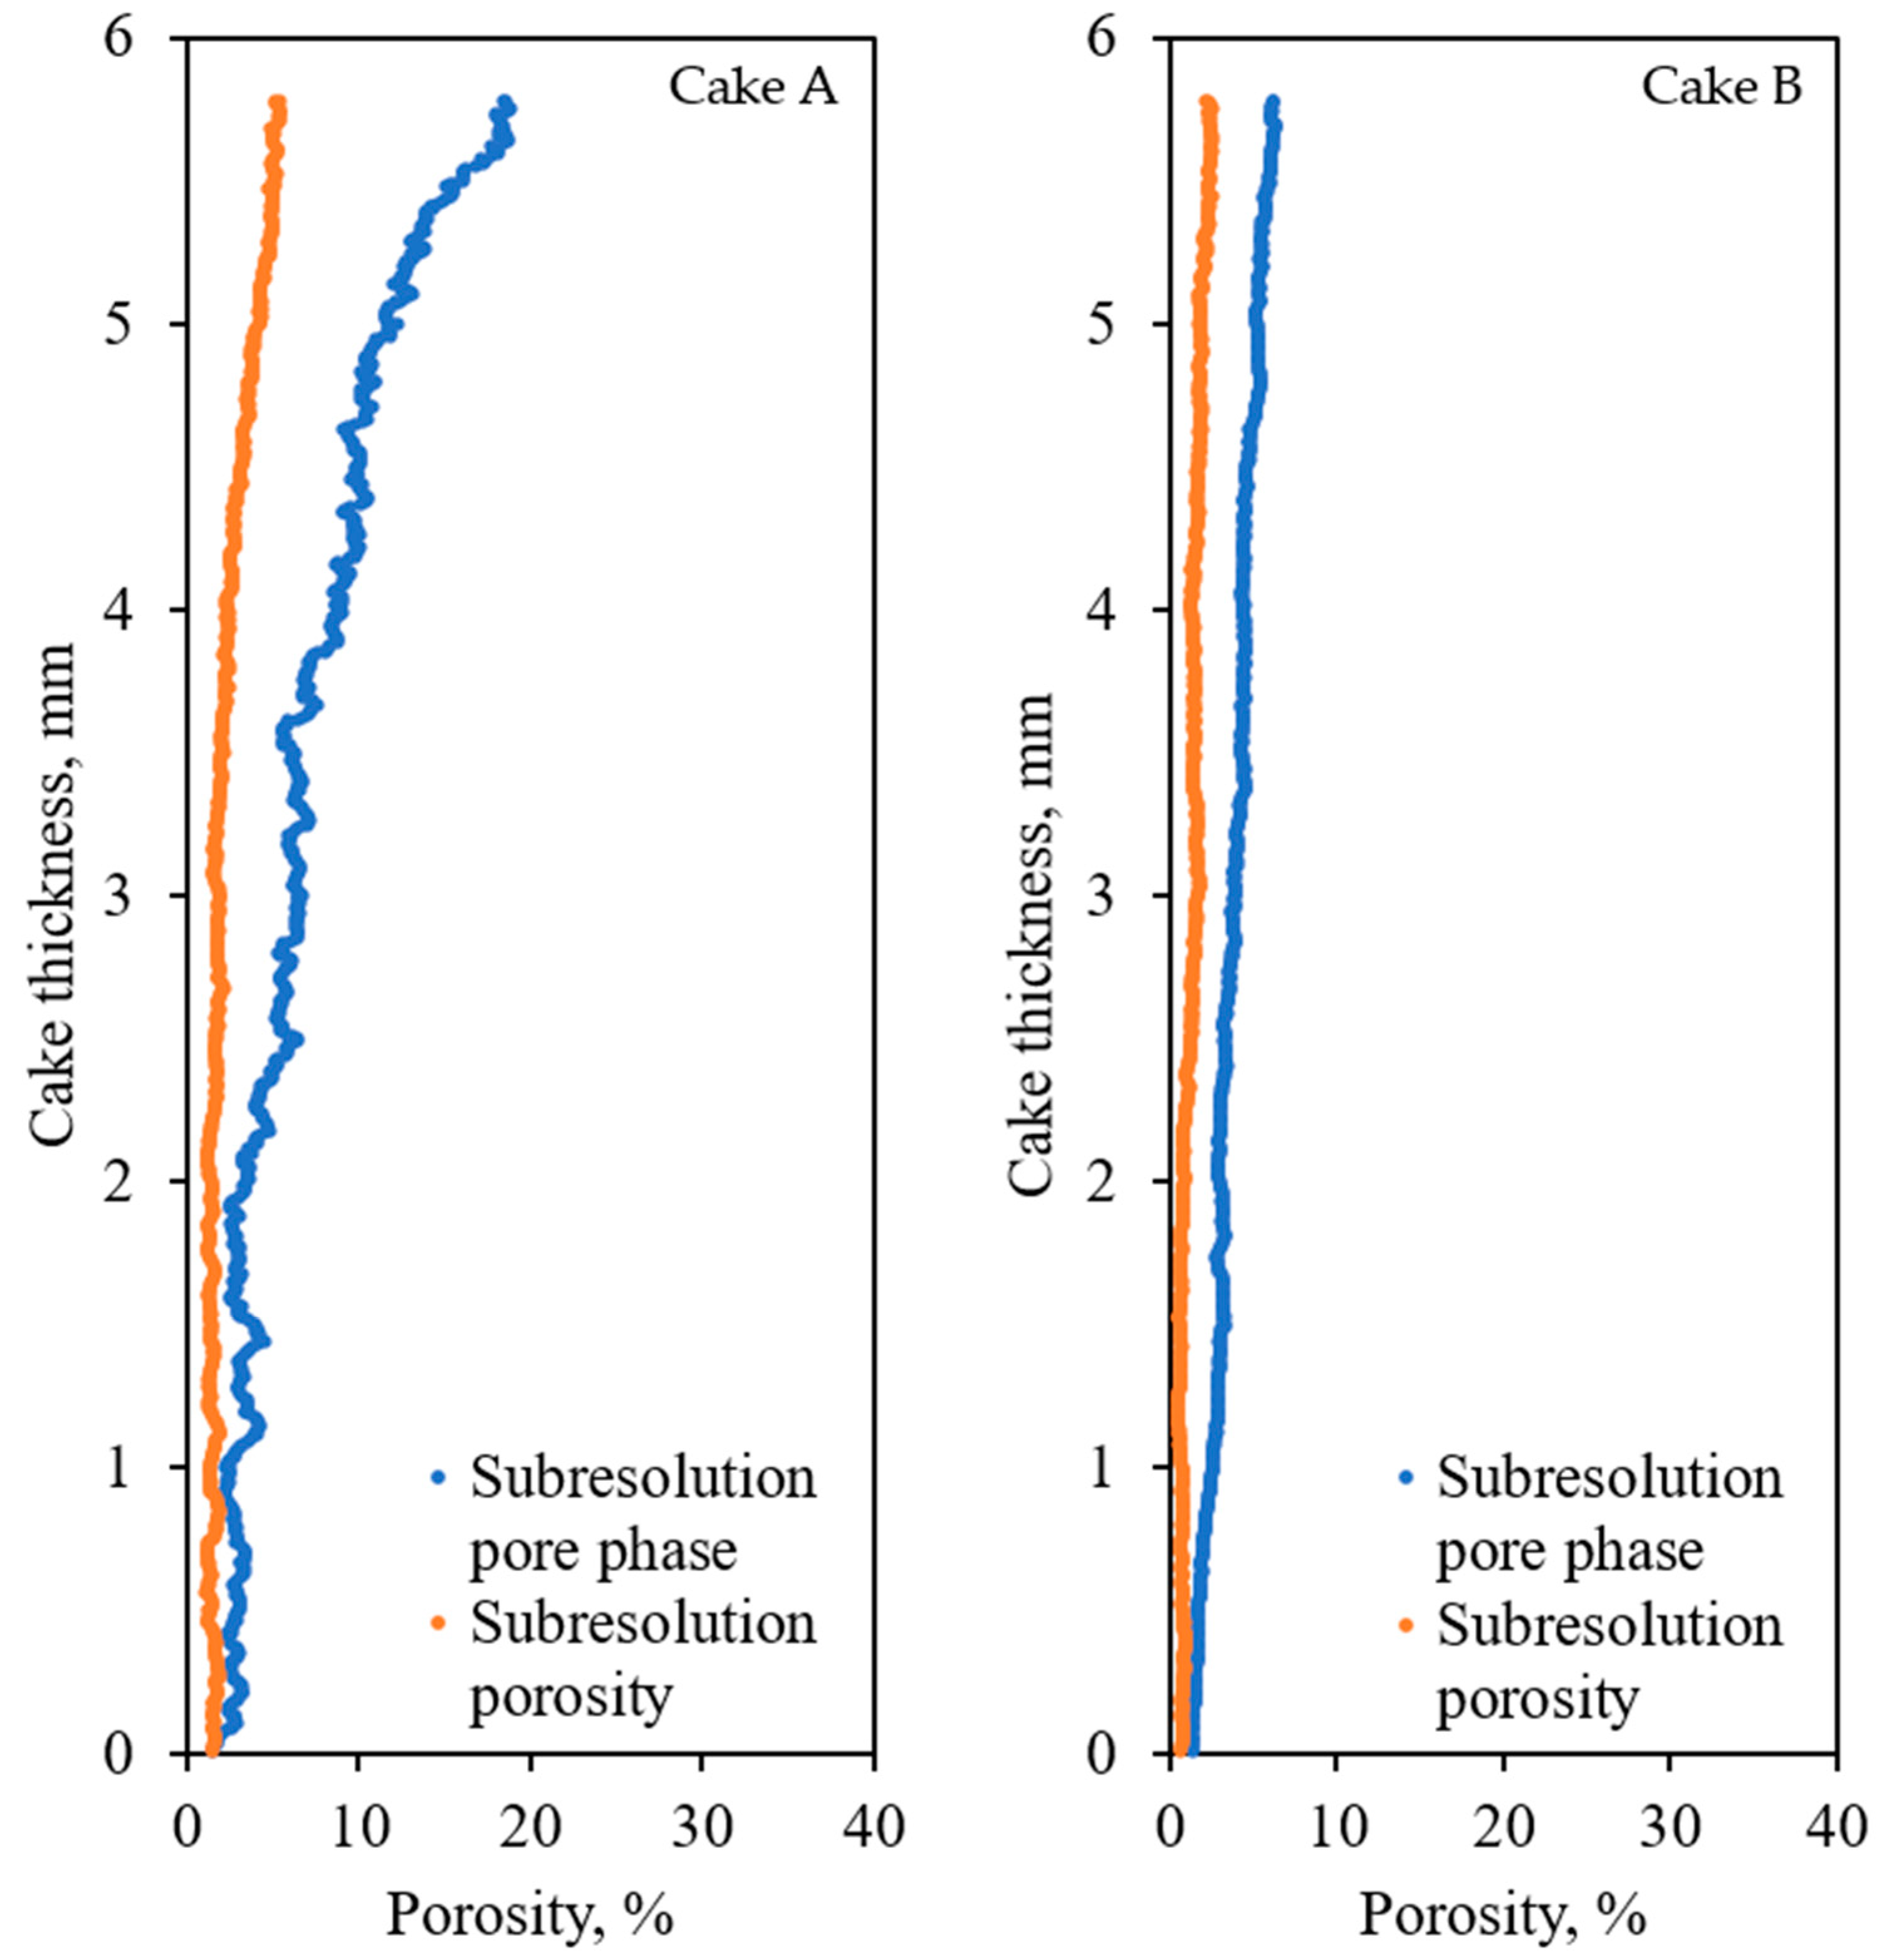
3.3. Porosity Profile
4. Conclusions
Author Contributions
Funding
Data Availability Statement
Acknowledgments
Conflicts of Interest
References
- Lin, C.; Miller, J. Pore structure and network analysis of filter cake. Chem. Eng. J. 2000, 80, 221–231. [Google Scholar] [CrossRef]
- Tien, C.; Ramarao, B.V. Can filter cake porosity be estimated based on the Kozeny–Carman equation? Powder Technol. 2013, 237, 233–240. [Google Scholar] [CrossRef]
- Li, Y.; Chen, Y.; Xia, W.; Xie, G. Filtration of kaolinite and coal mixture suspension: Settling behavior and filter cake structure analysis. Powder Technol. 2021, 381, 122–128. [Google Scholar] [CrossRef]
- Condie, D.J.; Hinkel, M.; Veal, C.J. Modelling the vacuum filtration of fine coal. Filtr. Sep. 1996, 33, 825–834. [Google Scholar] [CrossRef]
- Feng, Z.; Fan, Y.; Dong, X.; Ma, X.; Chen, R. Permeability estimation in filter cake based on X-ray microtomography and Lattice Boltzmann method. Sep. Purif. Technol. 2021, 275, 119114. [Google Scholar] [CrossRef]
- Kozeny, J. Uber kapillare leitung der wasser in boden. R. Acad. Sci. Vienna Proc. Cl. I 1927, 136, 271–306. [Google Scholar]
- Carman, P. Fundamental principles of industrial filtration (A critical review of present knowledge). Trans. Inst. Chem. Eng. 1938, 16, 168–188. [Google Scholar]
- Carman, P.C. Fluid flow through granular beds. Trans. Inst. Chem. Eng. 1937, 15, 150–166. [Google Scholar] [CrossRef]
- Tien, C. Introduction to Cake Filtration: Analyses, Experiments and Applications; Elsevier: Amsterdam, The Netherlands, 2006. [Google Scholar]
- Esser, S.; Löwer, E.; Peuker, U. Network model of porous media–Review of old ideas with new methods. Sep. Purif. Technol. 2021, 257, 117854. [Google Scholar] [CrossRef]
- Foley, G. A review of factors affecting filter cake properties in dead-end microfiltration of microbial suspensions. J. Membr. Sci. 2006, 274, 38–46. [Google Scholar] [CrossRef]
- Pirard, R.; Alié, C.; Pirard, J.-P. Porosimetry: Collapse and Intrusion. In Handbook of Sol-Gel Science and Technology; 2. Characterization and properties of sol-gel materials and products; Springer Science & Business Media: New York, NY, USA, 2005; Volume 2, p. 211. [Google Scholar]
- Lawrence, G. Measurement of pore sizes in fine-textured soils: A review of existing techniques. J. Soil Sci. 1977, 28, 527–540. [Google Scholar] [CrossRef]
- Meeten, G. A dissection method for analysing filter cakes. Chem. Eng. Sci. 1993, 48, 2391–2398. [Google Scholar] [CrossRef]
- Wildenschild, D.; Sheppard, A.P. X-ray imaging and analysis techniques for quantifying pore-scale structure and processes in subsurface porous medium systems. Adv. Water Resour. 2013, 51, 217–246. [Google Scholar] [CrossRef]
- Sheppard, A.P.; Sok, R.M.; Averdunk, H. Techniques for image enhancement and segmentation of tomographic images of porous materials. Phys. A Stat. Mech. Its Appl. 2004, 339, 145–151. [Google Scholar] [CrossRef]
- Yang, B.; Wu, A.; Miao, X.; Liu, J. 3D characterization and analysis of pore structure of packed ore particle beds based on computed tomography images. Trans. Nonferrous Met. Soc. China 2014, 24, 833–838. [Google Scholar] [CrossRef]
- Mathews, J.P.; Campbell, Q.P.; Xu, H.; Halleck, P. A review of the application of X-ray computed tomography to the study of coal. Fuel 2017, 209, 10–24. [Google Scholar] [CrossRef]
- Ramandi, H.L.; Mostaghimi, P.; Armstrong, R.T.; Saadatfar, M.; Pinczewski, W.V. Porosity and permeability characterization of coal: A micro-computed tomography study. Int. J. Coal Geol. 2016, 154, 57–68. [Google Scholar] [CrossRef]
- Fan, Y.; Ma, X.; Dong, X.; Feng, Z.; Dong, Y. Characterisation of floc size, effective density and sedimentation under various flocculation mechanisms. Water Sci. Technol. 2020, 82, 1261–1271. [Google Scholar] [CrossRef]
- Li, Y.; Xia, W.; Wen, B.; Xie, G. Filtration and dewatering of the mixture of quartz and kaolinite in different proportions. J. Colloid Interface Sci. 2019, 555, 731–739. [Google Scholar] [CrossRef]
- Feng, Z.; Dong, X.; Fan, Y.; Li, H.; Dong, Y.; Ma, X.; Chen, R. Use of X-ray microtomography to quantitatively characterize the pore structure of three-dimensional filter cakes. Miner. Eng. 2020, 152, 106275. [Google Scholar] [CrossRef]
- Ramandi, H.L.; Mostaghimi, P.; Armstrong, R.T. Digital rock analysis for accurate prediction of fractured media permeability. J. Hydrol. 2017, 554, 817–826. [Google Scholar] [CrossRef]
- Andrews, J.C.; Almeida, E.; van der Meulen, M.C.; Alwood, J.S.; Lee, C.; Liu, Y.; Chen, J.; Meirer, F.; Feser, M.; Gelb, J. Nanoscale X-ray microscopic imaging of mammalian mineralized tissue. Microsc. Microanal. 2010, 16, 327–336. [Google Scholar] [CrossRef] [PubMed]
- Peyrin, F. Investigation of bone with synchrotron radiation imaging: From micro to nano. Osteoporos. Int. 2009, 20, 1057–1063. [Google Scholar] [CrossRef] [PubMed]
- Zhao, Y.; Sun, Y.; Yuan, L.; Xu, Q. Impact of nanopore structure on coal strength: A study based on synchrotron radiation nano-CT. Results Phys. 2020, 17, 103029. [Google Scholar] [CrossRef]
- Zhao, Y.; Peng, L.; Liu, S.; Cao, B.; Sun, Y.; Hou, B. Pore structure characterization of shales using synchrotron SAXS and NMR cryoporometry. Mar. Pet. Geol. 2019, 102, 116–125. [Google Scholar] [CrossRef]
- Zhao, Y.; Sun, Y.; Liu, S.; Chen, Z.; Yuan, L. Pore structure characterization of coal by synchrotron radiation nano-CT. Fuel 2018, 215, 102–110. [Google Scholar] [CrossRef]
- Zhao, Y.; Liu, S.; Elsworth, D.; Jiang, Y.; Zhu, J. Pore Structure Characterization of Coal by Synchrotron Small-Angle X-ray Scattering and Transmission Electron Microscopy. Energy Fuels 2014, 28, 3704–3711. [Google Scholar] [CrossRef]
- Sørensen, B.L.; Sørensen, P.B. Structure compression in cake filtration. J. Environ. Eng. 1997, 123, 345–353. [Google Scholar] [CrossRef]
- Stamatakis, K.; Tien, C. Cake formation and growth in cake filtration. Chem. Eng. Sci. 1991, 46, 1917–1933. [Google Scholar] [CrossRef]
- Kakwani, R.M.; Gala, H.B.; Chiang, S.H.; Klinzing, G.E.; Tierney, J.W. Dewatering of fine coal—Micrographic analysis of filter cake structure. Powder Technol. 1985, 41, 239–250. [Google Scholar] [CrossRef]
- Shirato, M.; Aragaki, T.; Ichimura, K.; Norio, O. Porosity variation in filter cake under constant-pressure filtration. J. Chem. Eng. Jpn. 1971, 4, 172–177. [Google Scholar] [CrossRef]
- Bournival, G.; Yoshida, M.; Cox, N.; Lambert, N.; Ata, S. Analysis of a coal preparation plant. Part 1. Changes in water and coal quality, coal seam, and plant performance. Fuel Process. Technol. 2019, 190, 67–80. [Google Scholar] [CrossRef]
- Manono, M.S.; Corin, K.; Wiese, J. Water quality effects on a sulfidic PGM ore: Implications for froth stability and gangue management. Physicochem. Probl. Miner. Process. 2018, 54, 1253–1265. [Google Scholar]
- Varslot, T.; Kingston, A.; Myers, G.; Sheppard, A. Considerations for high-magnification high-cone-angle helical micro-CT. In Developments in X-ray Tomography VIII; SPIE: Bellingham, WA, USA, 2012; pp. 259–268. [Google Scholar]
- Latham, S.J.; Kingston, A.M.; Recur, B.; Myers, G.R.; Sheppard, A.P. Multi-resolution radiograph alignment for motion correction in x-ray micro-tomography. In Developments in X-ray Tomography X; SPIE: Bellingham, WA, USA, 2016; pp. 50–61. [Google Scholar]
- Wildenschild, D.; Vaz, C.M.P.; Rivers, M.L.; Rikard, D.; Christensen, B.S.B. Using X-ray computed tomography in hydrology: Systems, resolutions, and limitations. J. Hydrol. 2002, 267, 285–297. [Google Scholar] [CrossRef]
- Worden, R.H. A Review of Particle Size Analysis with X-ray CT. Materials 2023, 16, 1259. [Google Scholar]
- Ketcham, R.A. Computational methods for quantitative analysis of three-dimensional features in geological specimens. Geosphere 2005, 1, 32–41. [Google Scholar] [CrossRef]
- Karimpouli, S.; Tahmasebi, P.; Ramandi, H.L. A review of experimental and numerical modeling of digital coalbed methane: Imaging, segmentation, fracture modeling and permeability prediction. Int. J. Coal Geol. 2020, 228, 103552. [Google Scholar] [CrossRef]
- Weickert, J. Coherence-enhancing diffusion filtering. Int. J. Comput. Vis. 1999, 31, 111–127. [Google Scholar] [CrossRef]
- Frangakis, A.S.; Hegerl, R. Noise reduction in electron tomographic reconstructions using nonlinear anisotropic diffusion. J. Struct. Biol. 2001, 135, 239–250. [Google Scholar] [CrossRef]
- Pratt, W.K. Introduction To Digital Image Processing; CRC Press: Boca Raton, FL, USA, 2013. [Google Scholar]
- Ramandi, H.L.; Liu, M.; Tadbiri, S.; Mostaghimi, P. Impact of dissolution of syngenetic and epigenetic minerals on coal permeability. Chem. Geol. 2018, 486, 31–39. [Google Scholar] [CrossRef]
- Sakellariou, A.; Arns, C.H.; Sheppard, A.P.; Sok, R.M.; Averdunk, H.; Limaye, A.; Jones, A.C.; Senden, T.J.; Knackstedt, M.A. Developing a virtual materials laboratory. Mater. Today 2007, 10, 44–51. [Google Scholar] [CrossRef]
- Vincent, L.; Soille, P. Watersheds in digital spaces: An efficient algorithm based on immersion simulations. IEEE Trans. Pattern Anal. Mach. Intell. 1991, 13, 583–598. [Google Scholar] [CrossRef]
- Caselles, V.; Kimmel, R.; Sapiro, G. Geodesic active contours. Int. J. Comput. Vis. 1997, 22, 61–79. [Google Scholar] [CrossRef]
- Schlüter, S.; Sheppard, A.; Brown, K.; Wildenschild, D. Image processing of multiphase images obtained via X-ray microtomography: A review. Water Resour. Res. 2014, 50, 3615–3639. [Google Scholar] [CrossRef]
- Golab, A.; Ward, C.R.; Permana, A.; Lennox, P.; Botha, P. High-resolution three-dimensional imaging of coal using microfocus X-ray computed tomography, with special reference to modes of mineral occurrence. Int. J. Coal Geol. 2013, 113, 97–108. [Google Scholar] [CrossRef]
- Qajar, J.; Francois, N.; Arns, C.H. Microtomographic characterization of dissolution-induced local porosity changes including fines migration in carbonate rock. SPE J. 2013, 18, 545–562. [Google Scholar] [CrossRef]
- Ramandi, H.L.; Armstrong, R.T.; Mostaghimi, P.; Saadatfar, M.; Pinczewsk, W.V. X-ray micro-computed tomography imaging for coal characterization. In SPE Asia Pacific Unconventional Resources Conference and Exhibition; OnePetro: Richardson, TX, USA, 2015. [Google Scholar]
- Saadatfar, M.; Francois, N.; Arad, A.; Madadi, M.; Cruikshank, R.; Alizadeh, M.; Sheppard, A.; Kingston, A.; Limay, A.; Senden, T. 3D mapping of deformation in an unconsolidated sand: A micro mechanical study. In SEG Technical Program Expanded Abstracts 2012; Society of Exploration Geophysicists: Houston, TX, USA, 2012; pp. 1–6. [Google Scholar]
- Saadatfar, M.; Mukherjee, M.; Madadi, M.; Schröder-Turk, G.; Garcia-Moreno, F.; Schaller, F.; Hutzler, S.; Sheppard, A.; Banhart, J.; Ramamurty, U. Structure and deformation correlation of closed-cell aluminium foam subject to uniaxial compression. Acta Mater. 2012, 60, 3604–3615. [Google Scholar] [CrossRef]
- Sok, R.M.; Varslot, T.; Ghous, A.; Latham, S.; Sheppard, A.P.; Knackstedt, M.A. Pore scale characterization of carbonates at multiple scales: Integration of micro-CT, BSEM, and FIBSEM. Petrophysics 2010, 51, 379–387. [Google Scholar]
- Miletić, M.; Kumar, L.M.; Arns, J.-Y.; Agarwal, A.; Foster, S.J.; Arns, C.; Perić, D. Gradient-based fibre detection method on 3D micro-CT tomographic image for defining fibre orientation bias in ultra-high-performance concrete. Cem. Concr. Res. 2020, 129, 105962. [Google Scholar] [CrossRef]
- Alhammadi, A.M.; Gao, Y.; Akai, T.; Blunt, M.J.; Bijeljic, B. Pore-scale X-ray imaging with measurement of relative permeability, capillary pressure and oil recovery in a mixed-wet micro-porous carbonate reservoir rock. Fuel 2020, 268, 117018. [Google Scholar] [CrossRef]
- Hermanek, P.; Rathore, J.S.; Aloisi, V.; Carmignato, S. Principles of X-ray computed tomography. In Industrial X-ray Computed Tomography; Springer: Berlin/Heidelberg, Germany, 2018; pp. 25–67. [Google Scholar]
- Baveye, P.C.; Pot, V.; Garnier, P. Accounting for sub-resolution pores in models of water and solute transport in soils based on computed tomography images: Are we there yet? J. Hydrol. 2017, 555, 253–256. [Google Scholar] [CrossRef]
- Shah, S.; Gray, F.; Crawshaw, J.; Boek, E. Micro-computed tomography pore-scale study of flow in porous media: Effect of voxel resolution. Adv. Water Resour. 2016, 95, 276–287. [Google Scholar] [CrossRef]
- Herrmann, H.; Pastorelli, E.; Kallonen, A.; Suuronen, J.-P. Methods for fibre orientation analysis of X-ray tomography images of steel fibre reinforced concrete (SFRC). J. Mater. Sci. 2016, 51, 3772–3783. [Google Scholar] [CrossRef]
- Michael, G. X-ray computed tomography. Phys. Educ. 2001, 36, 442. [Google Scholar] [CrossRef]
- Serra, J. Introduction to mathematical morphology. Comput. Vis. Graph. Image Process. 1986, 35, 283–305. [Google Scholar] [CrossRef]
- Quackenbush, L.J. A review of techniques for extracting linear features from imagery. Photogramm. Eng. Remote Sens. 2004, 70, 1383–1392. [Google Scholar] [CrossRef]
- Wiedemann, T.; Stahl, W. Experimental investigation of the shrinkage and cracking behaviour of fine participate filter cakes. Chem. Eng. Process. 1996, 35, 35–42. [Google Scholar] [CrossRef]
- Anlauf, H.; Bott, R.; Stahl, W.; Krebber, A. The formation of shrinkage cracks in filter cakes during dewatering of fine sized ores. Alc~ Ereit~ Mgstechnik 1985, 4, 188–196. [Google Scholar]
- Wakeman, R. The role of internal stresses in filter cake cracking. Filtr. Sep. 1974, 11, 357–360. [Google Scholar]
- Pham, T.H. Experimental Investigation on Crack Formation in Filter Cakes with Wide Particle Size Distribution. Maschinenbau, Verfahrens- Und Energietechnik. Ph.D. Thesis, Technische Universität Bergakademie Freiberg, Freiberg, Germany, 2021. [Google Scholar]
- Barua, A.; Eagles, W.; Giorgio, G.; Ricard, F.; Stepanek, F. Experimental Study of Filter Cake Cracking during Deliquoring. Sci. Pharm. 2010, 78, 661. [Google Scholar] [CrossRef]
- Zhuo, Q.; Liu, W.; Xu, H.; Wang, D. Effect of particle size distribution on filter cake pore structure and coal slurry dewatering process. Int. J. Coal Prep. Util. 2020, 42, 1879–1894. [Google Scholar] [CrossRef]
- Hu, P.; Liang, L.; Xie, G.; Zhou, S.; Peng, Y. Effect of slurry conditioning on flocculant-aided filtration of coal tailings studied by low-field nuclear magnetic resonance and X-ray micro-tomography. Int. J. Min. Sci. Technol. 2020, 30, 859–864. [Google Scholar] [CrossRef]
- Hieke, M.; Ruland, J.; Anlauf, H.; Nirschl, H. Analysis of the porosity of filter cakes obtained by filtration of colloidal suspensions. Chem. Eng. Technol. Ind. Chem.-Plant Equip.-Process Eng.-Biotechnol. 2009, 32, 1095–1101. [Google Scholar] [CrossRef]


| Proximate analysis (wt.%) | Inherent moisture | 2.7 |
| Ash | 5.4 | |
| Volatile matter | 34.0 | |
| Fixed carbon | 57.9 | |
| Ultimate analysis (wt.%) | S | 0.7 |
| H | 5.1 | |
| N | 2.2 | |
| O | 6.3 |
| Sample | NaCl Concentration (mM) | Flocculant Dosage (g/t) |
|---|---|---|
| A | 2 | 0 |
| B | 200 | 90 |
| Imaging Parameters | Specifications |
|---|---|
| Radiographic field of vision | 18 mm × 43 mm |
| Number of display pixels | 3040 × 3040 |
| Detector pixel size | 139 μm |
| Acquisition time | 12 h |
| Energy of X-ray | 100 kV (72 mA) |
| Scanning operation | Double-helix system |
| X-ray beam form | Cone beam |
| Number of projections per revolution | 2520 |
| Total number of projections | 15,034 |
| Pitch | 18.9 mm |
| Sample | Resolved Porosity (2-Phase) | Subresolution Porosity | Total Image-Based Porosity (3-Phase) | Experimental Measurements | Relative Porosity Difference |
|---|---|---|---|---|---|
| % | |||||
| A | 16.02 | 3.13 | 19.15 | 18.54 | 3.29 |
| B | 22.16 | 1.35 | 23.51 | 24.21 | −2.89 |
Disclaimer/Publisher’s Note: The statements, opinions and data contained in all publications are solely those of the individual author(s) and contributor(s) and not of MDPI and/or the editor(s). MDPI and/or the editor(s) disclaim responsibility for any injury to people or property resulting from any ideas, methods, instructions or products referred to in the content. |
© 2023 by the authors. Licensee MDPI, Basel, Switzerland. This article is an open access article distributed under the terms and conditions of the Creative Commons Attribution (CC BY) license (https://creativecommons.org/licenses/by/4.0/).
Share and Cite
Zhang, F.; Bournival, G.; Ramandi, H.L.; Ata, S. Digital Cake Analysis: A Novel Coal Filter Cake Examination Technique Using Microcomputed Tomography. Minerals 2023, 13, 1509. https://doi.org/10.3390/min13121509
Zhang F, Bournival G, Ramandi HL, Ata S. Digital Cake Analysis: A Novel Coal Filter Cake Examination Technique Using Microcomputed Tomography. Minerals. 2023; 13(12):1509. https://doi.org/10.3390/min13121509
Chicago/Turabian StyleZhang, Feng, Ghislain Bournival, Hamed Lamei Ramandi, and Seher Ata. 2023. "Digital Cake Analysis: A Novel Coal Filter Cake Examination Technique Using Microcomputed Tomography" Minerals 13, no. 12: 1509. https://doi.org/10.3390/min13121509
APA StyleZhang, F., Bournival, G., Ramandi, H. L., & Ata, S. (2023). Digital Cake Analysis: A Novel Coal Filter Cake Examination Technique Using Microcomputed Tomography. Minerals, 13(12), 1509. https://doi.org/10.3390/min13121509