
Extensive Validation of a New Rock Breakage Test


Abstract
:
1. Introduction
2. Experimental
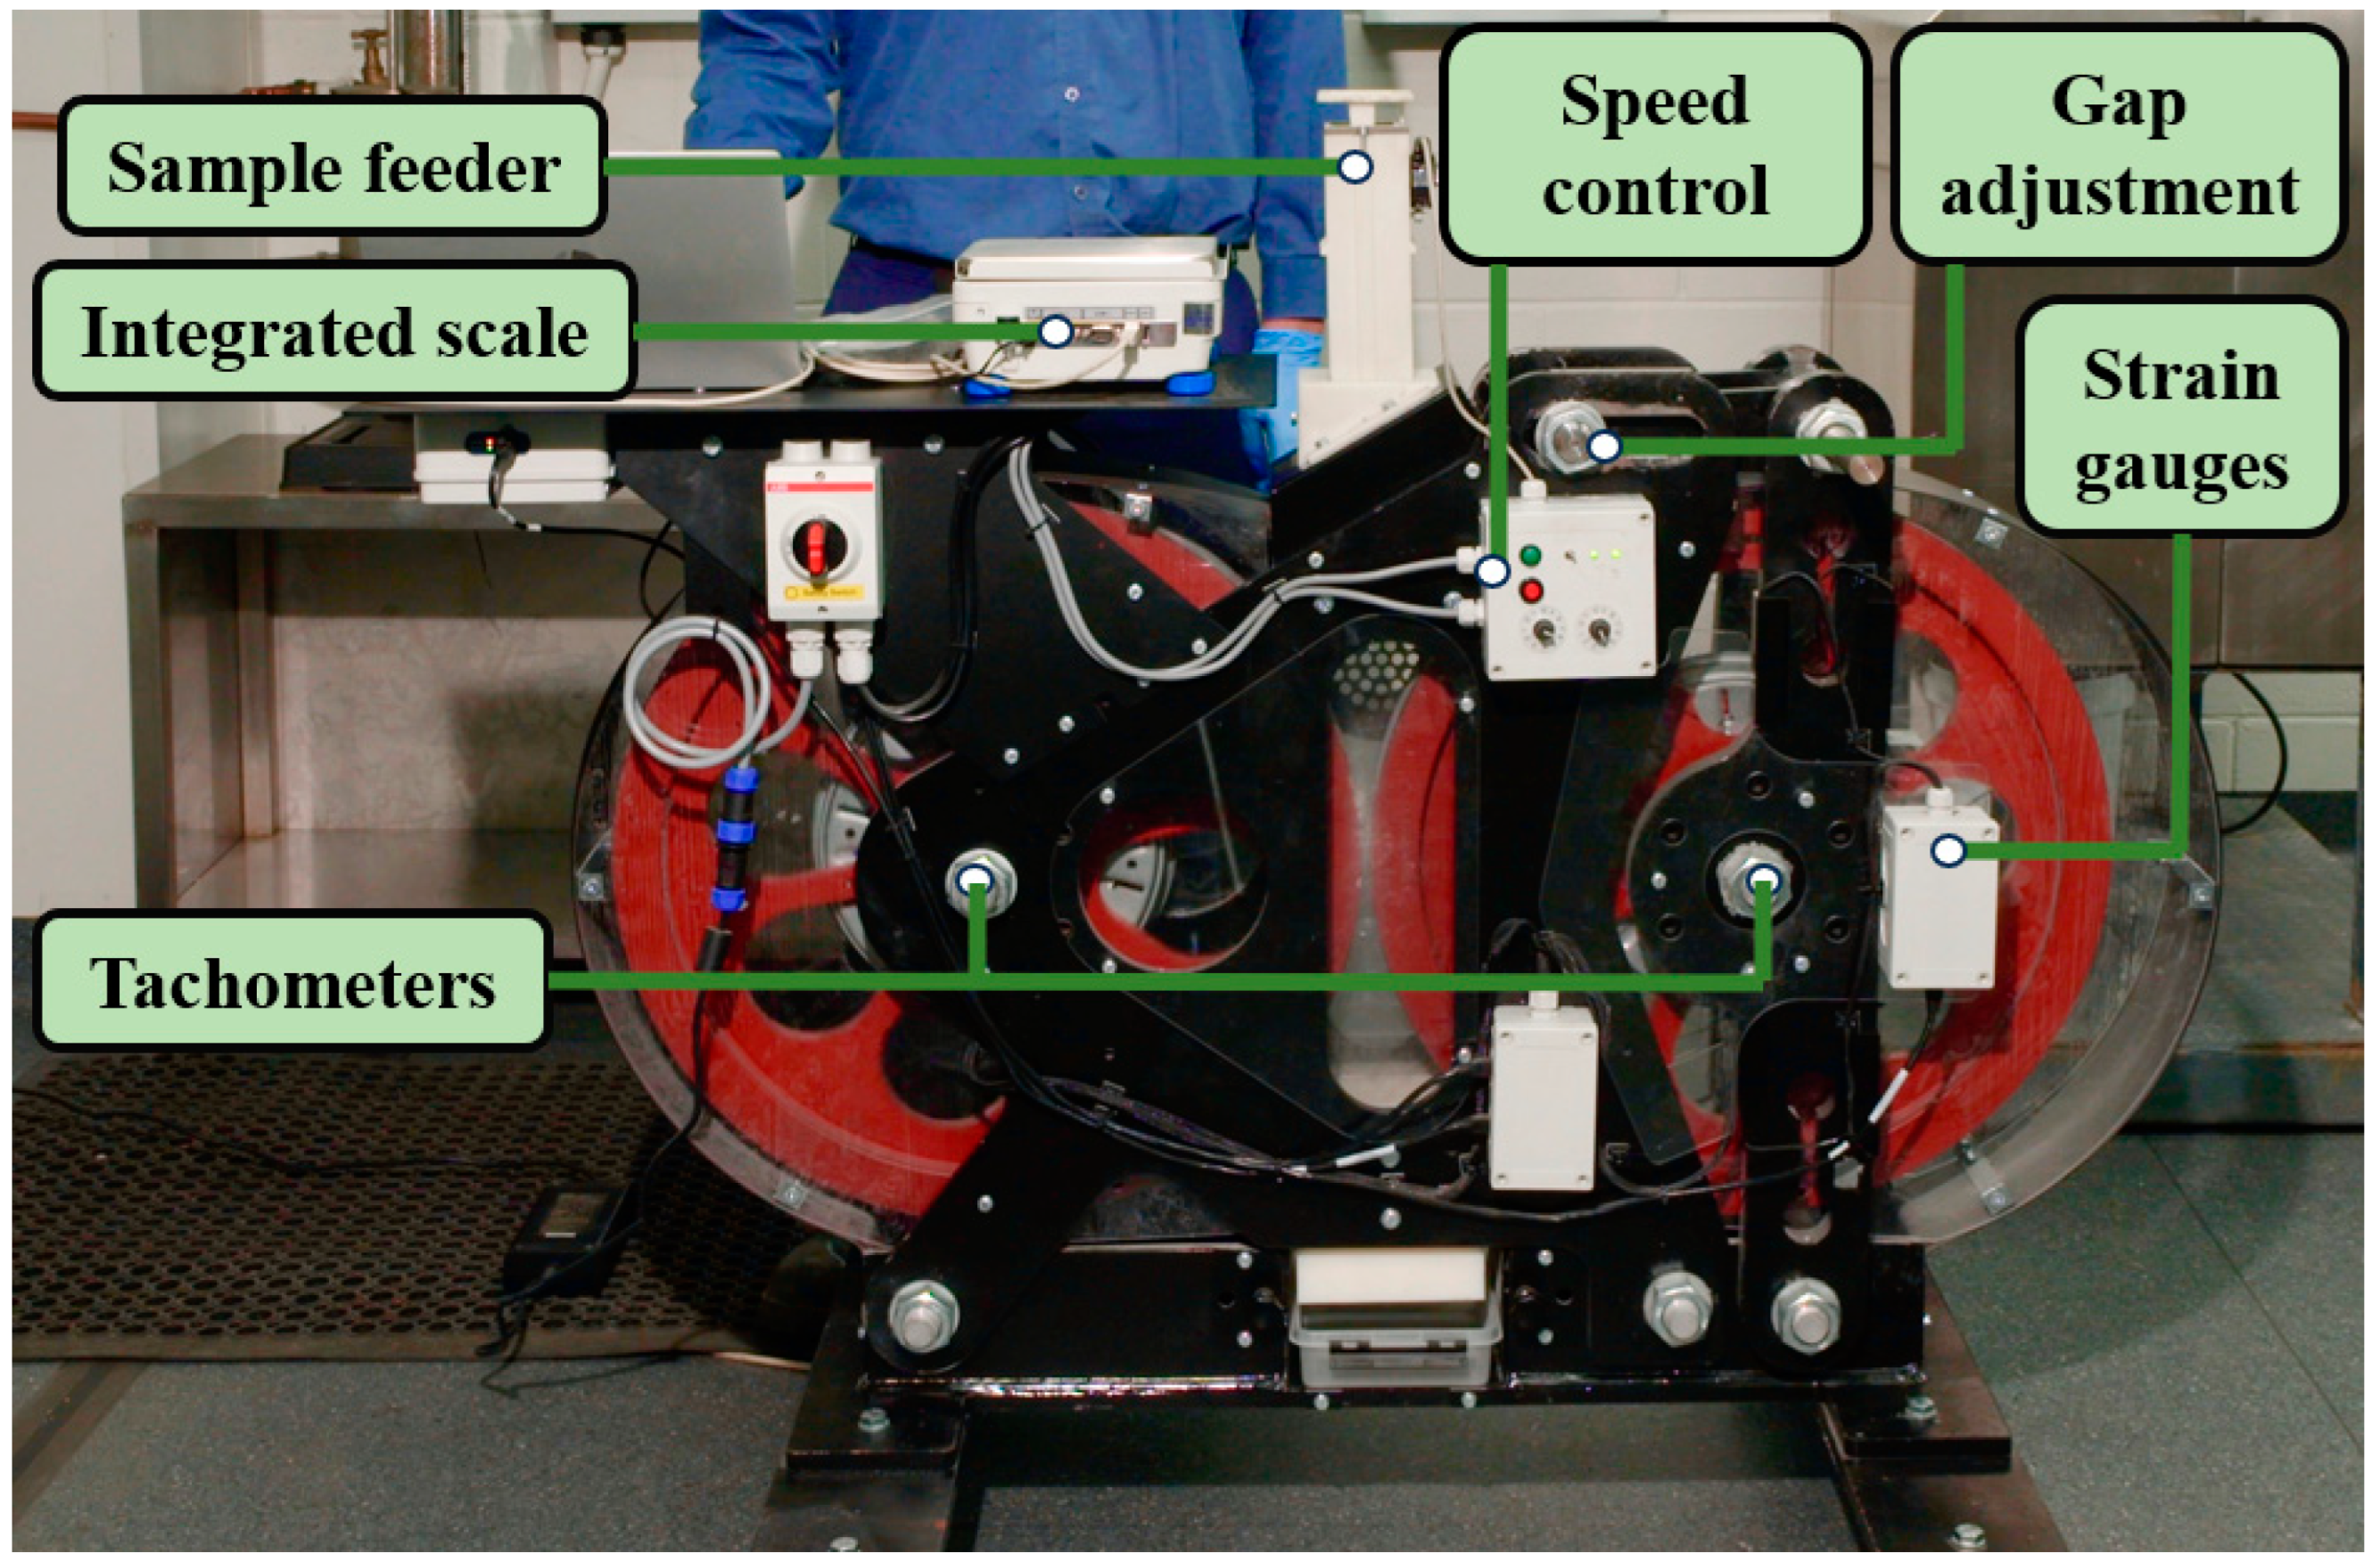
2.1. Geopyörä Procedure
2.2. Samples and Methodology
3. Results and Discussion
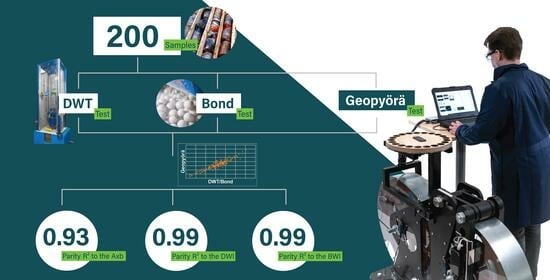
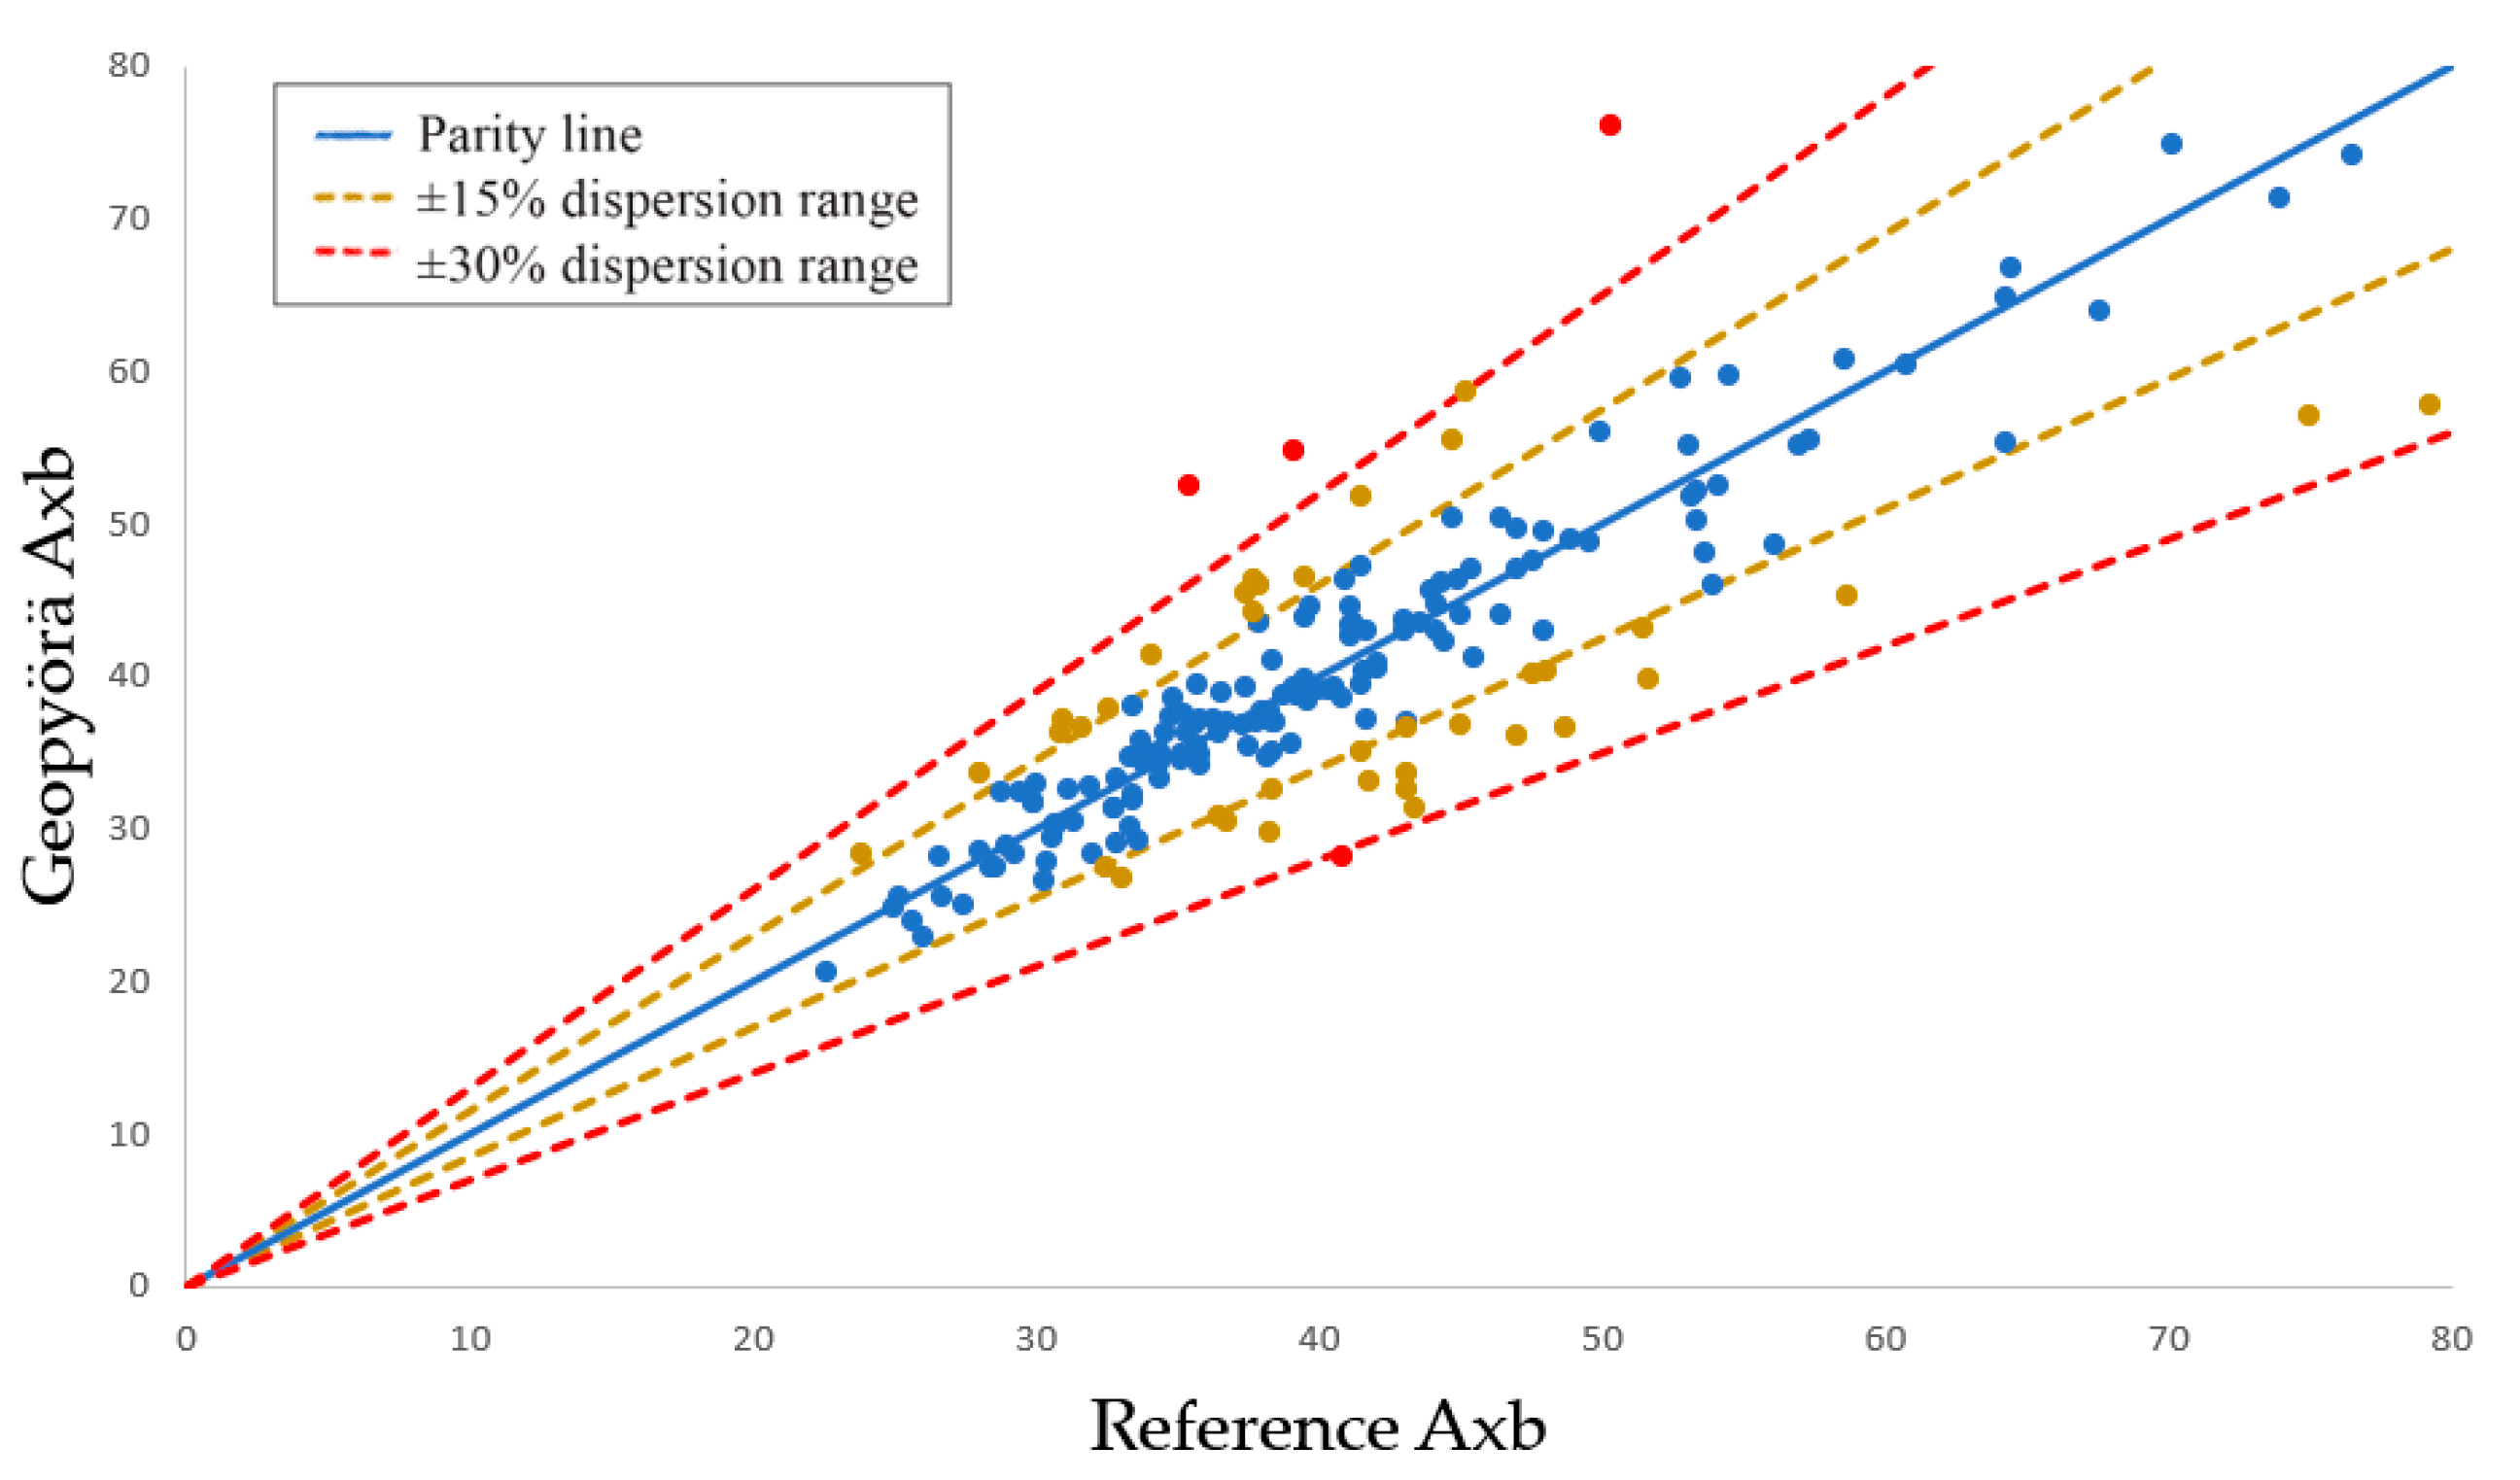
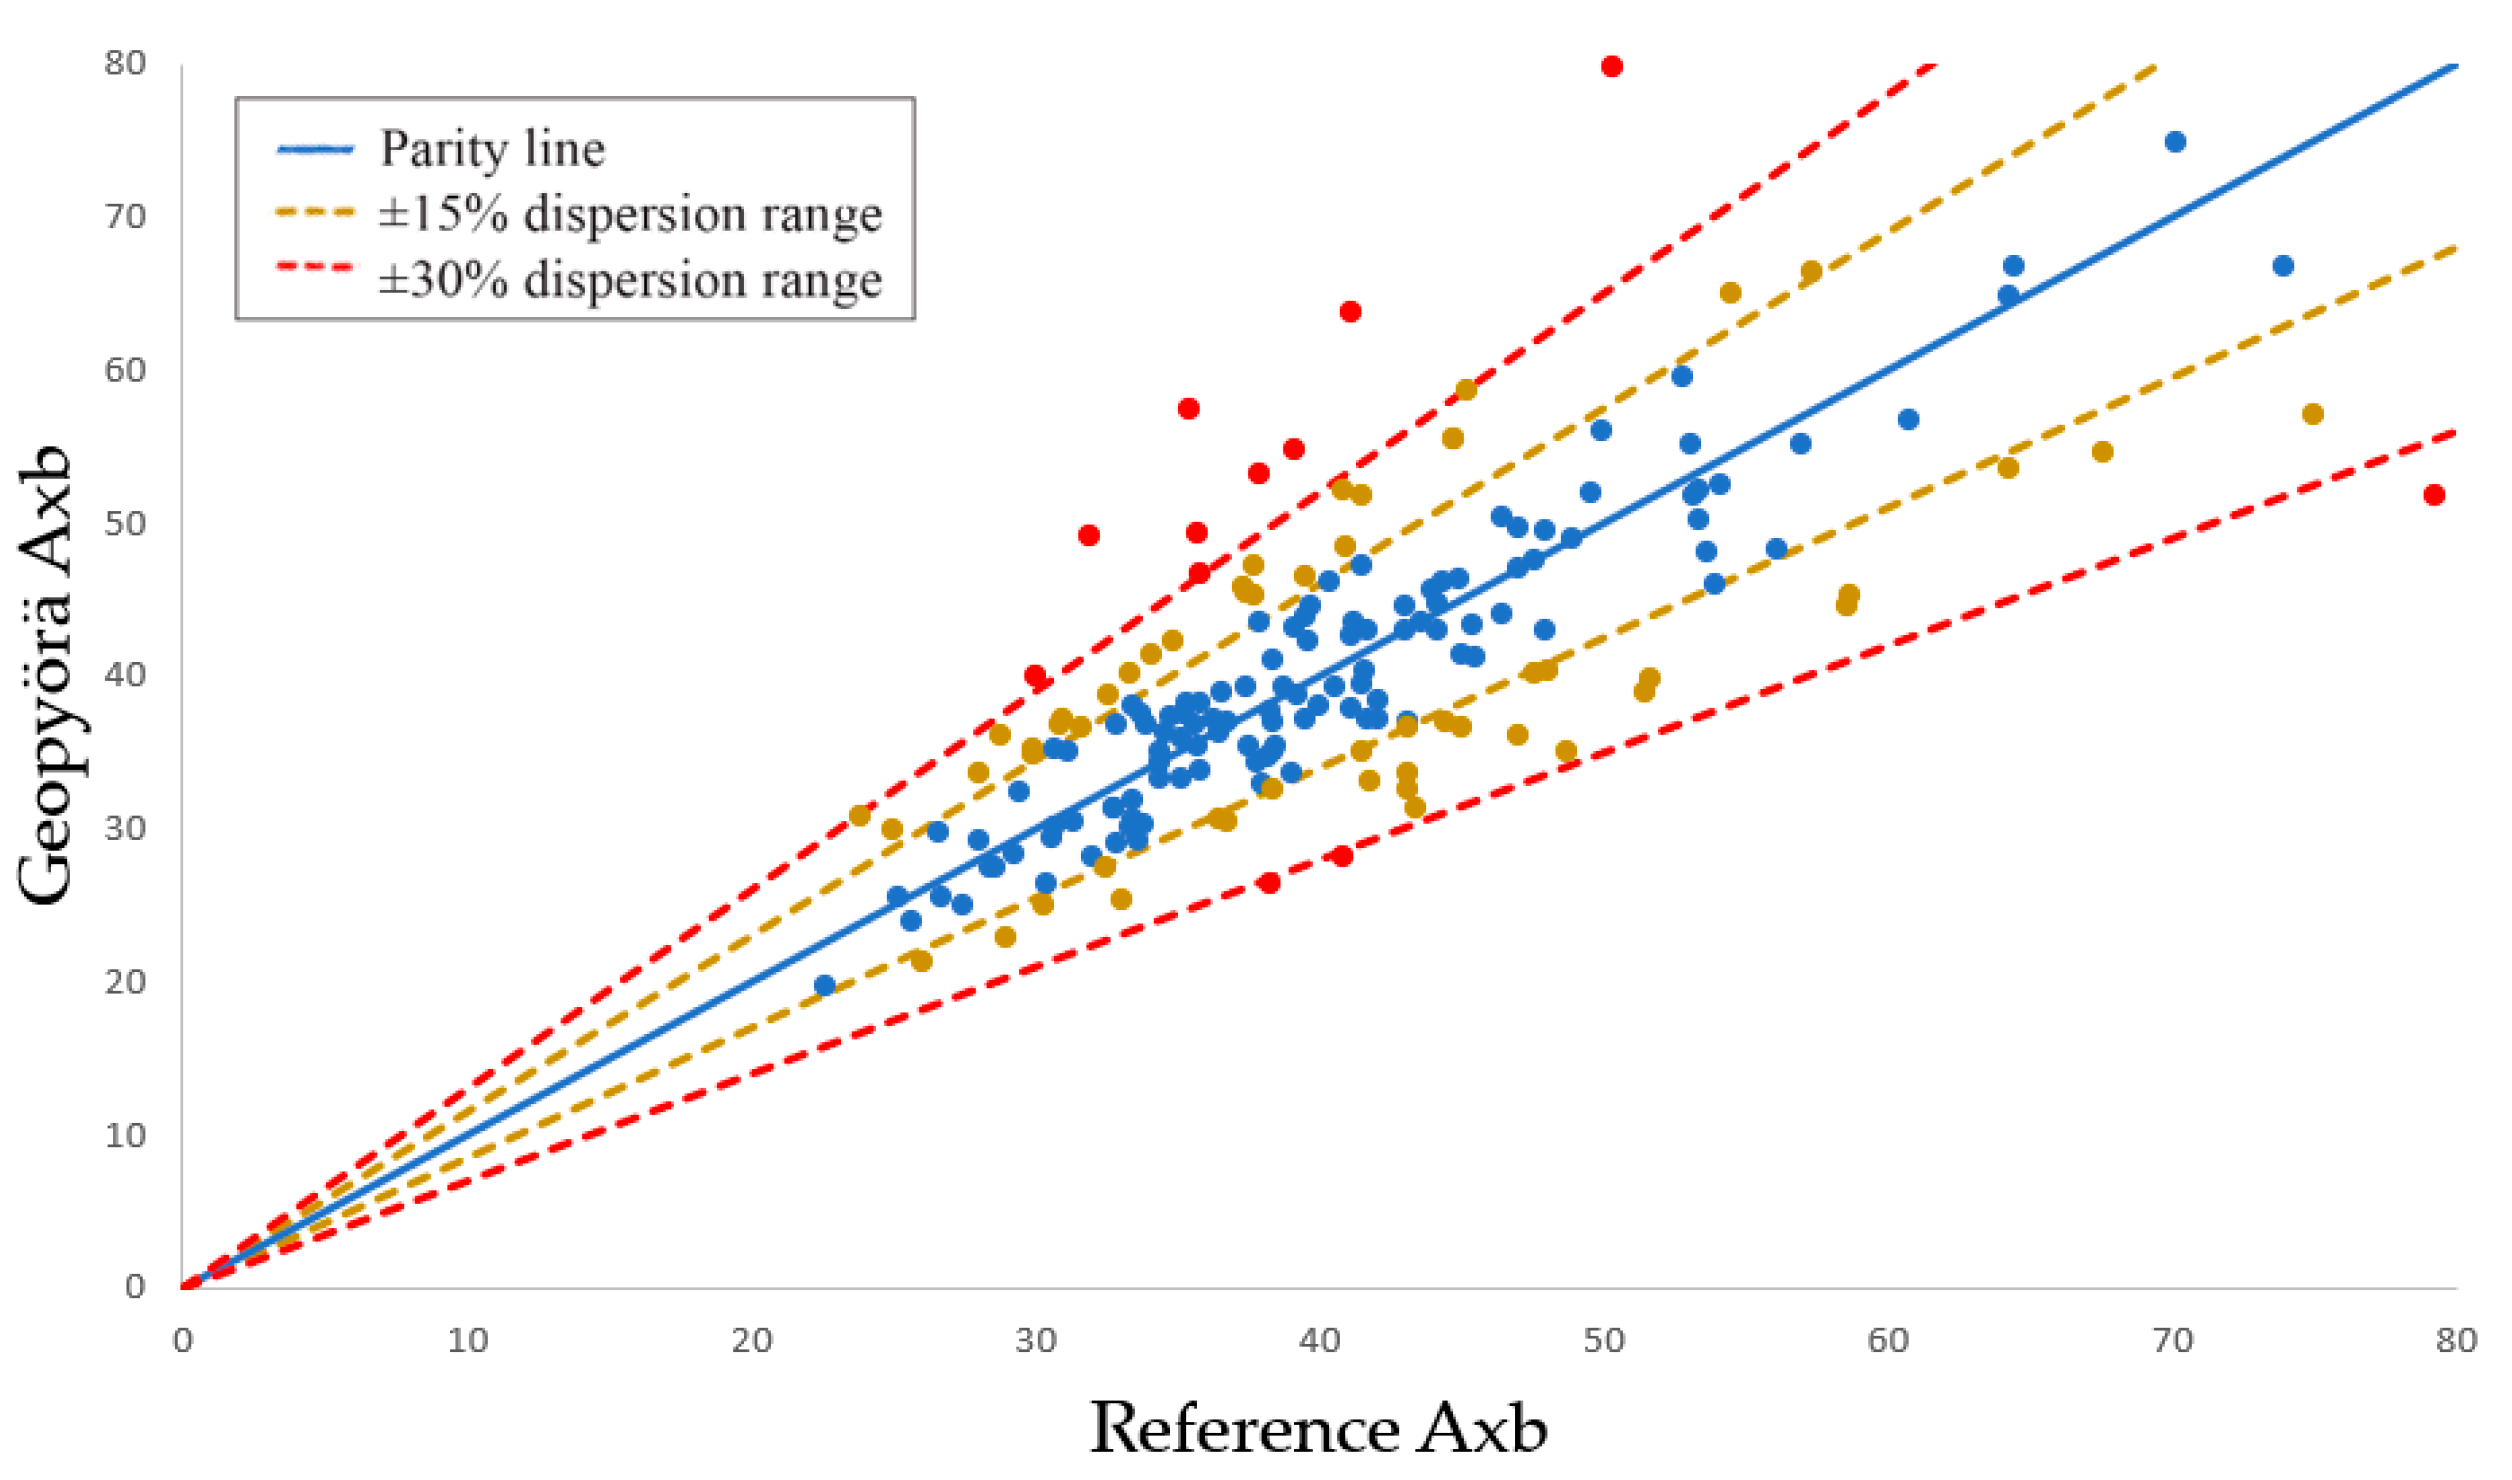
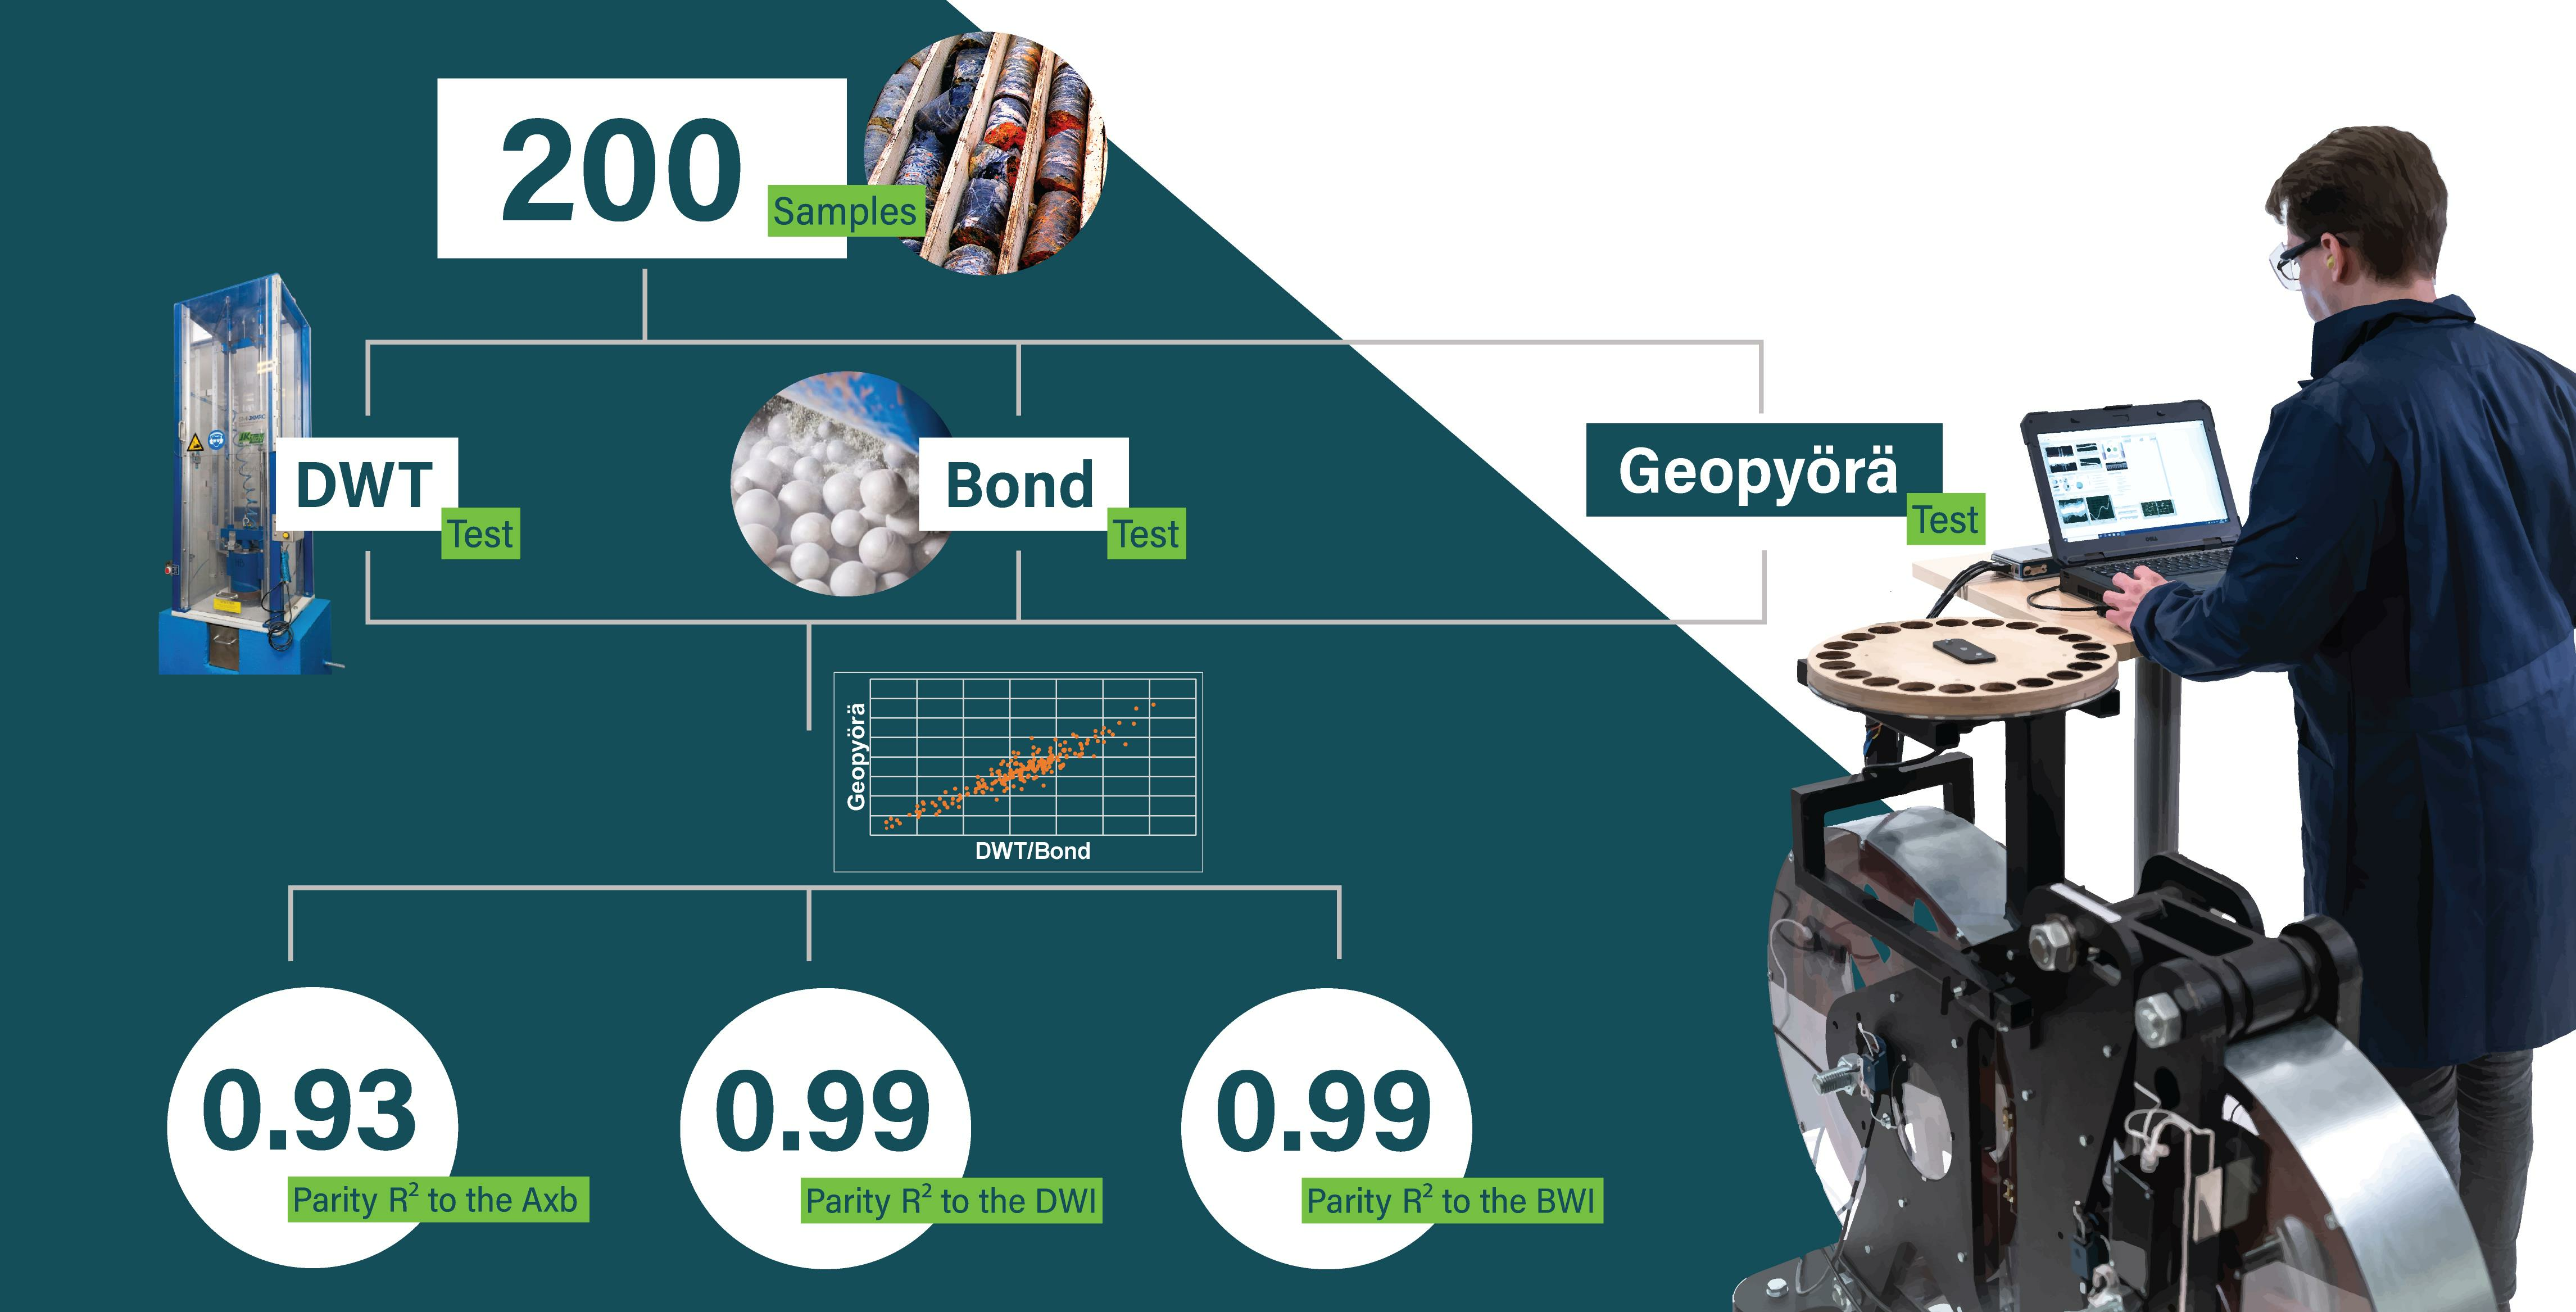
3.1. Axb Parameter
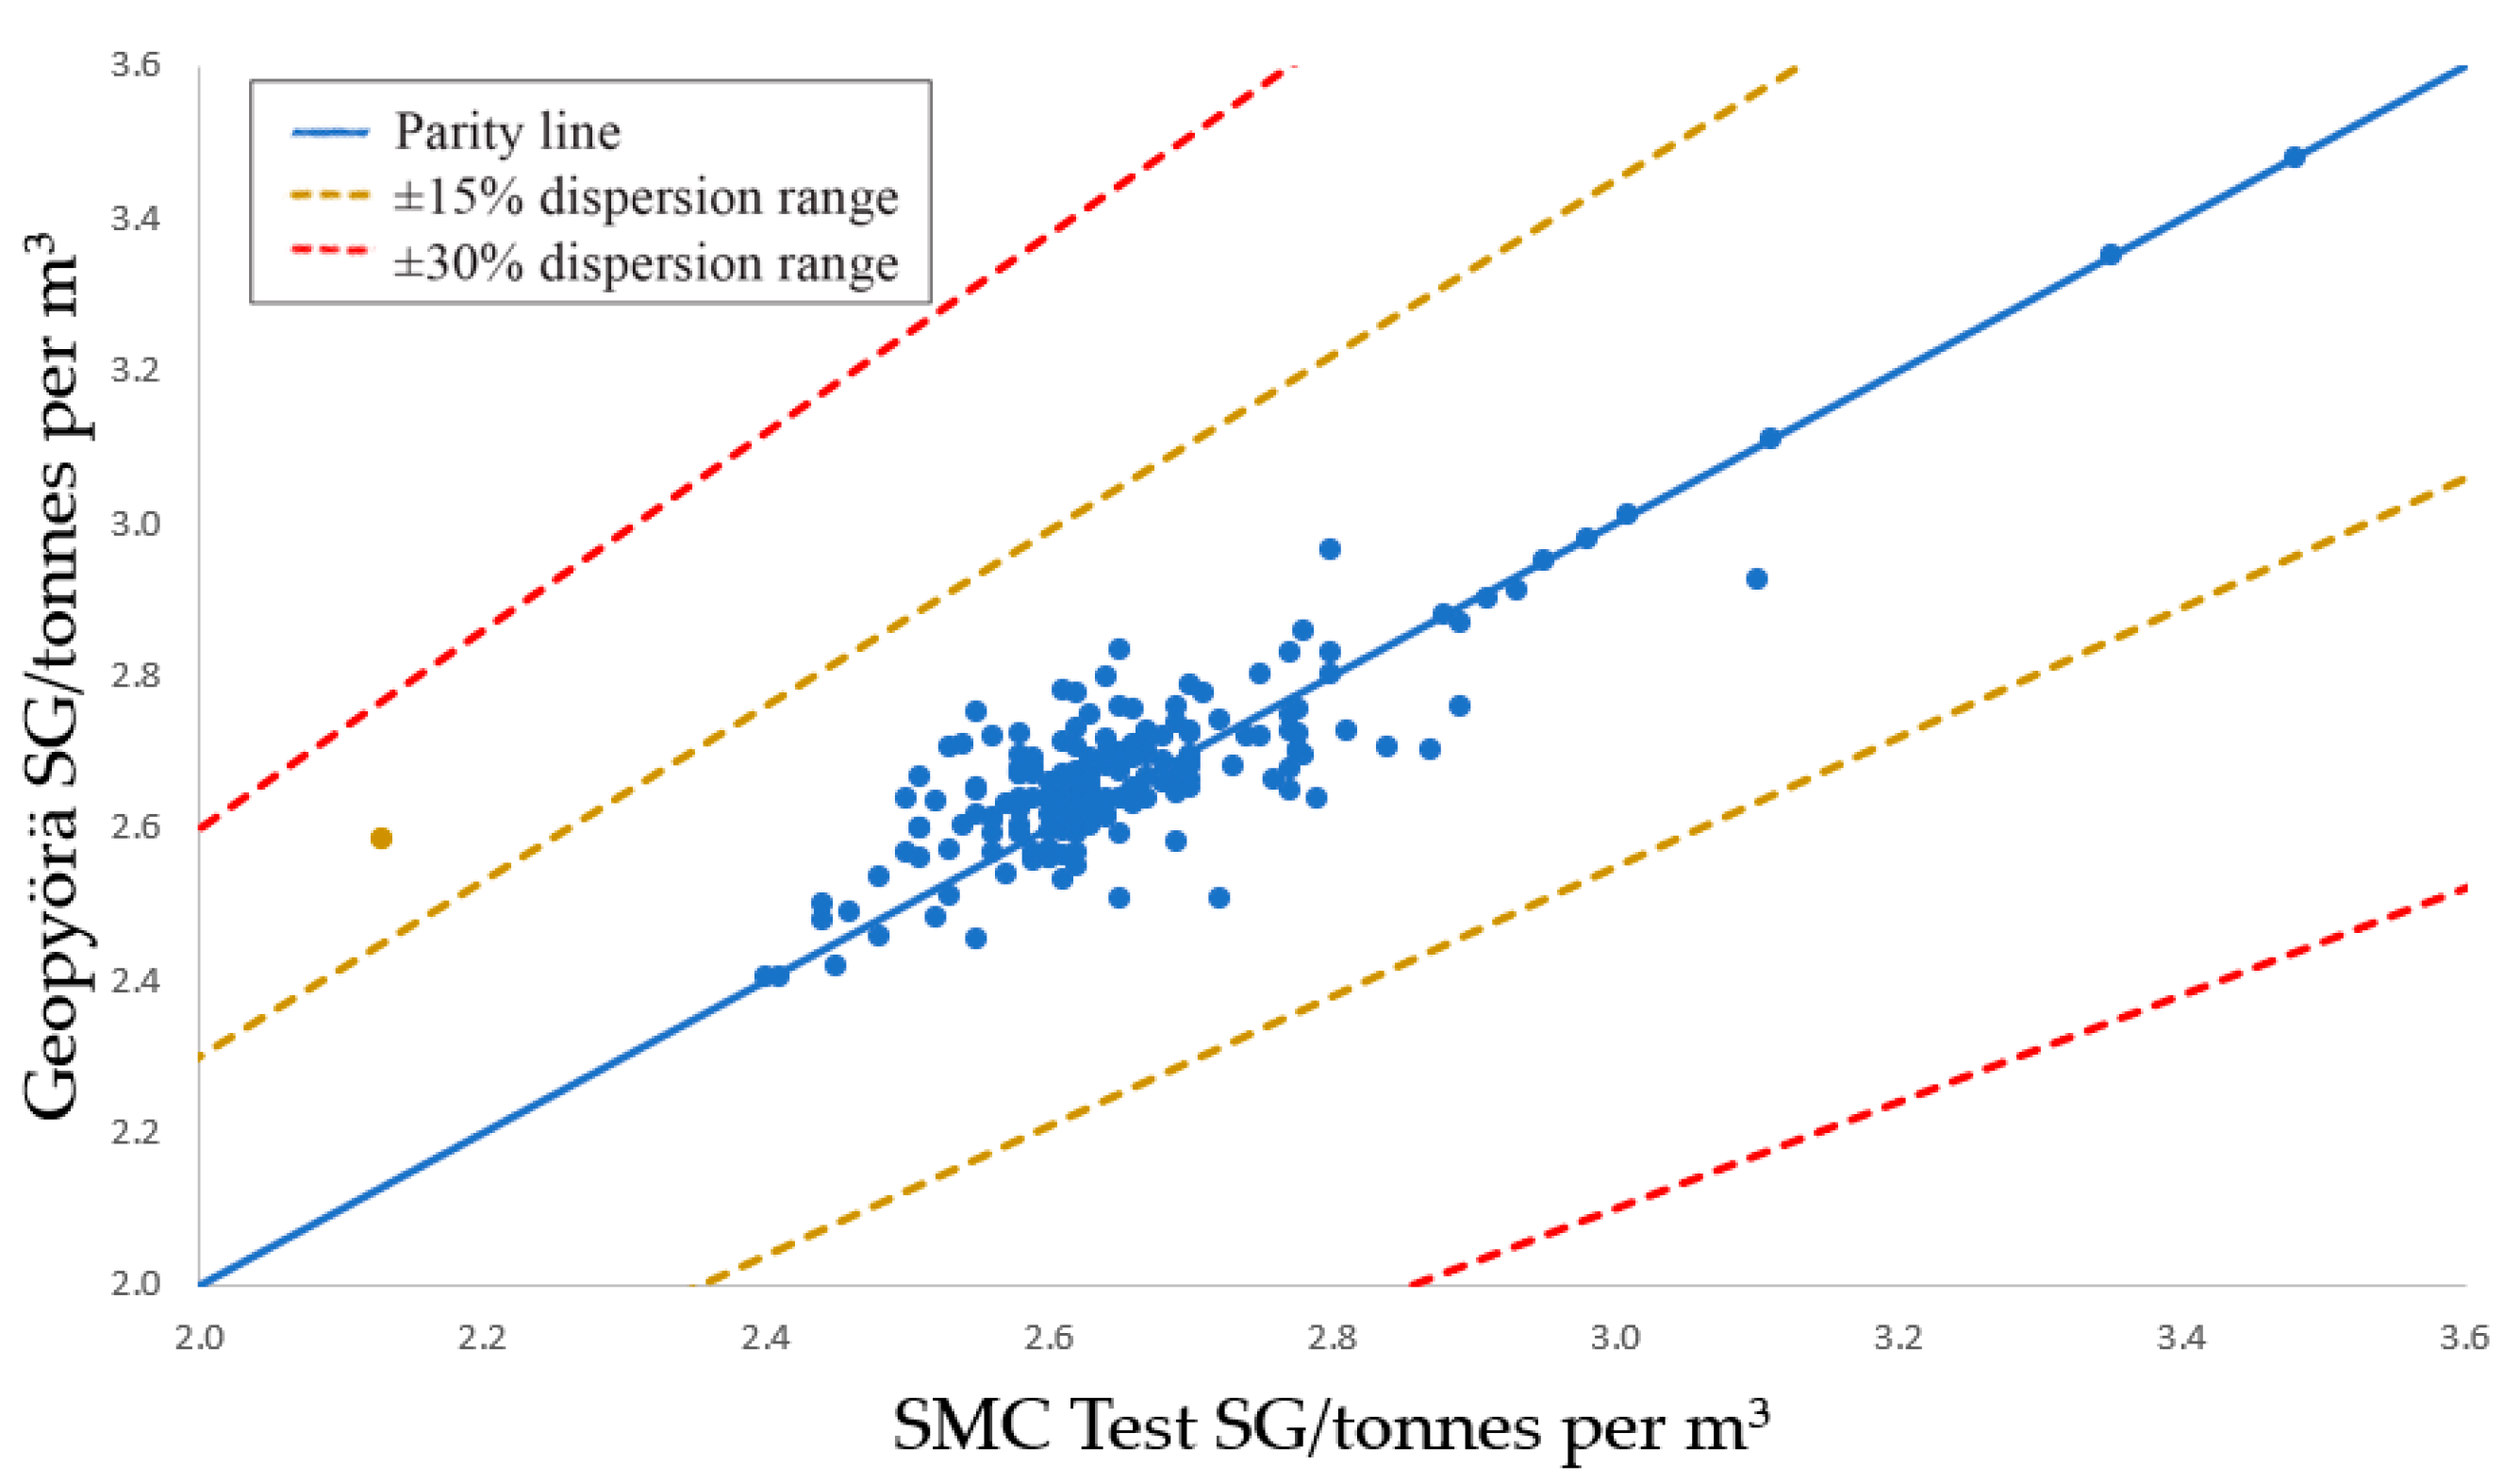
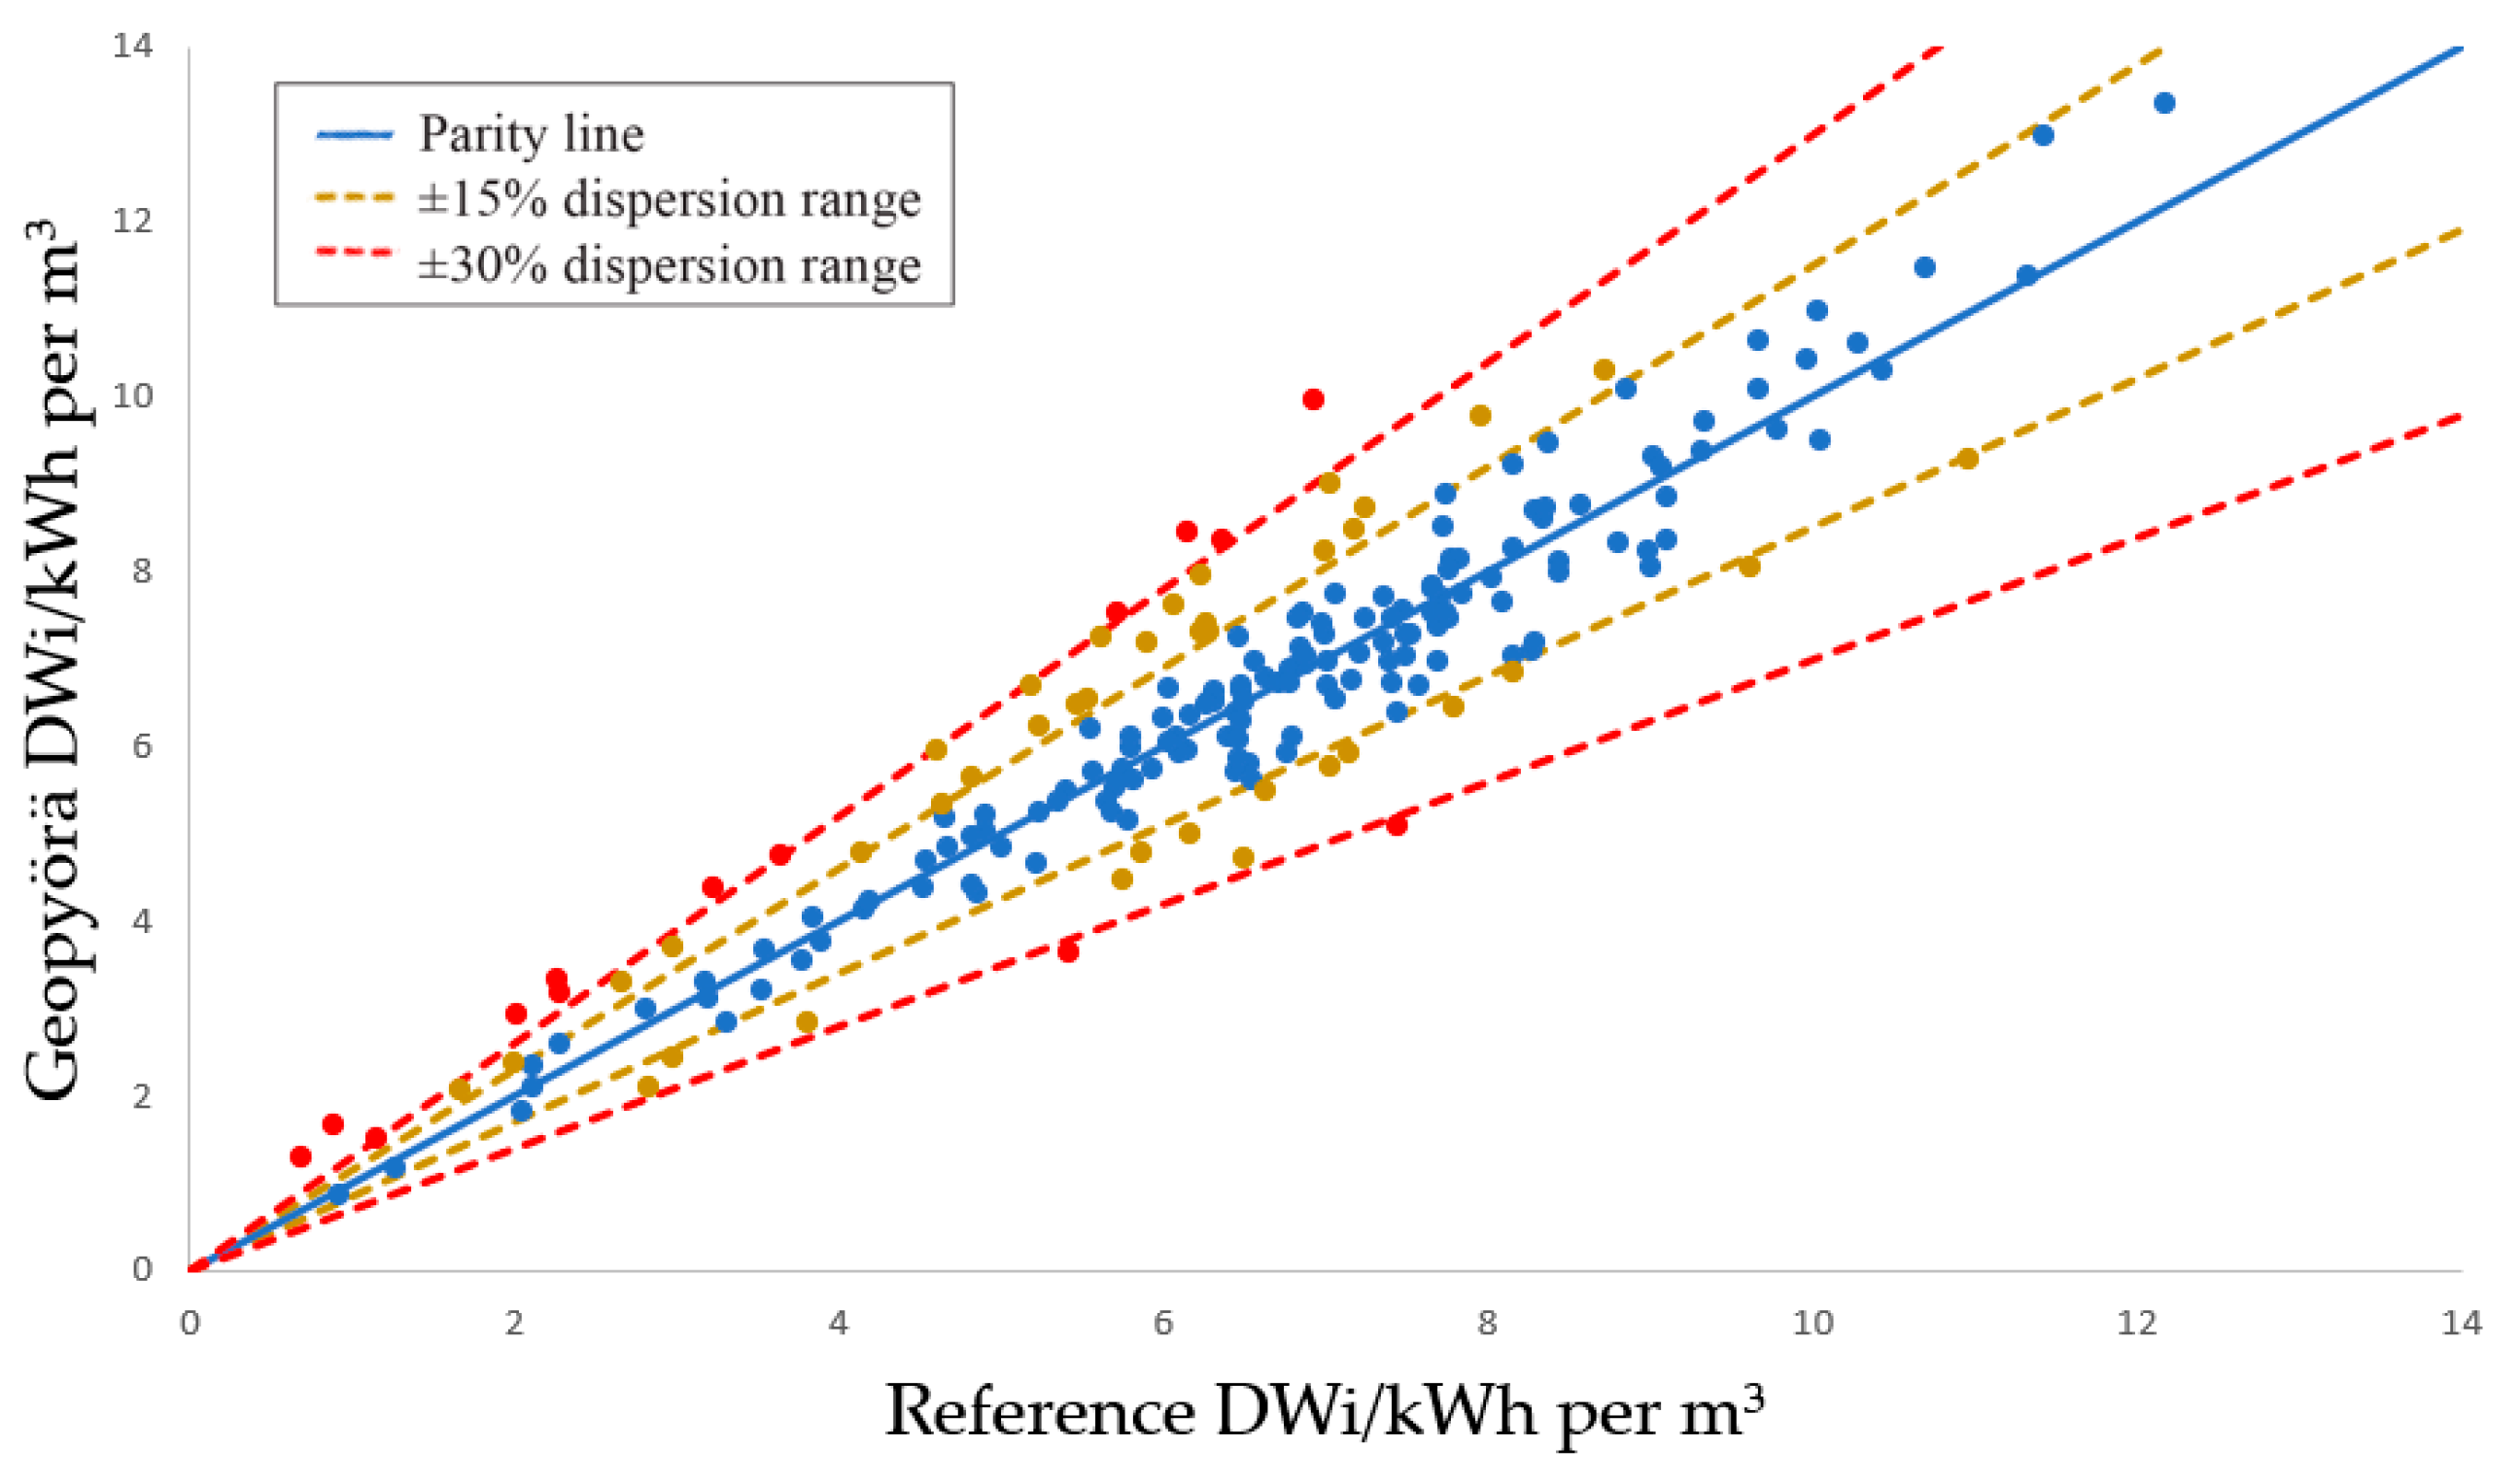
3.2. SMC Test DWi
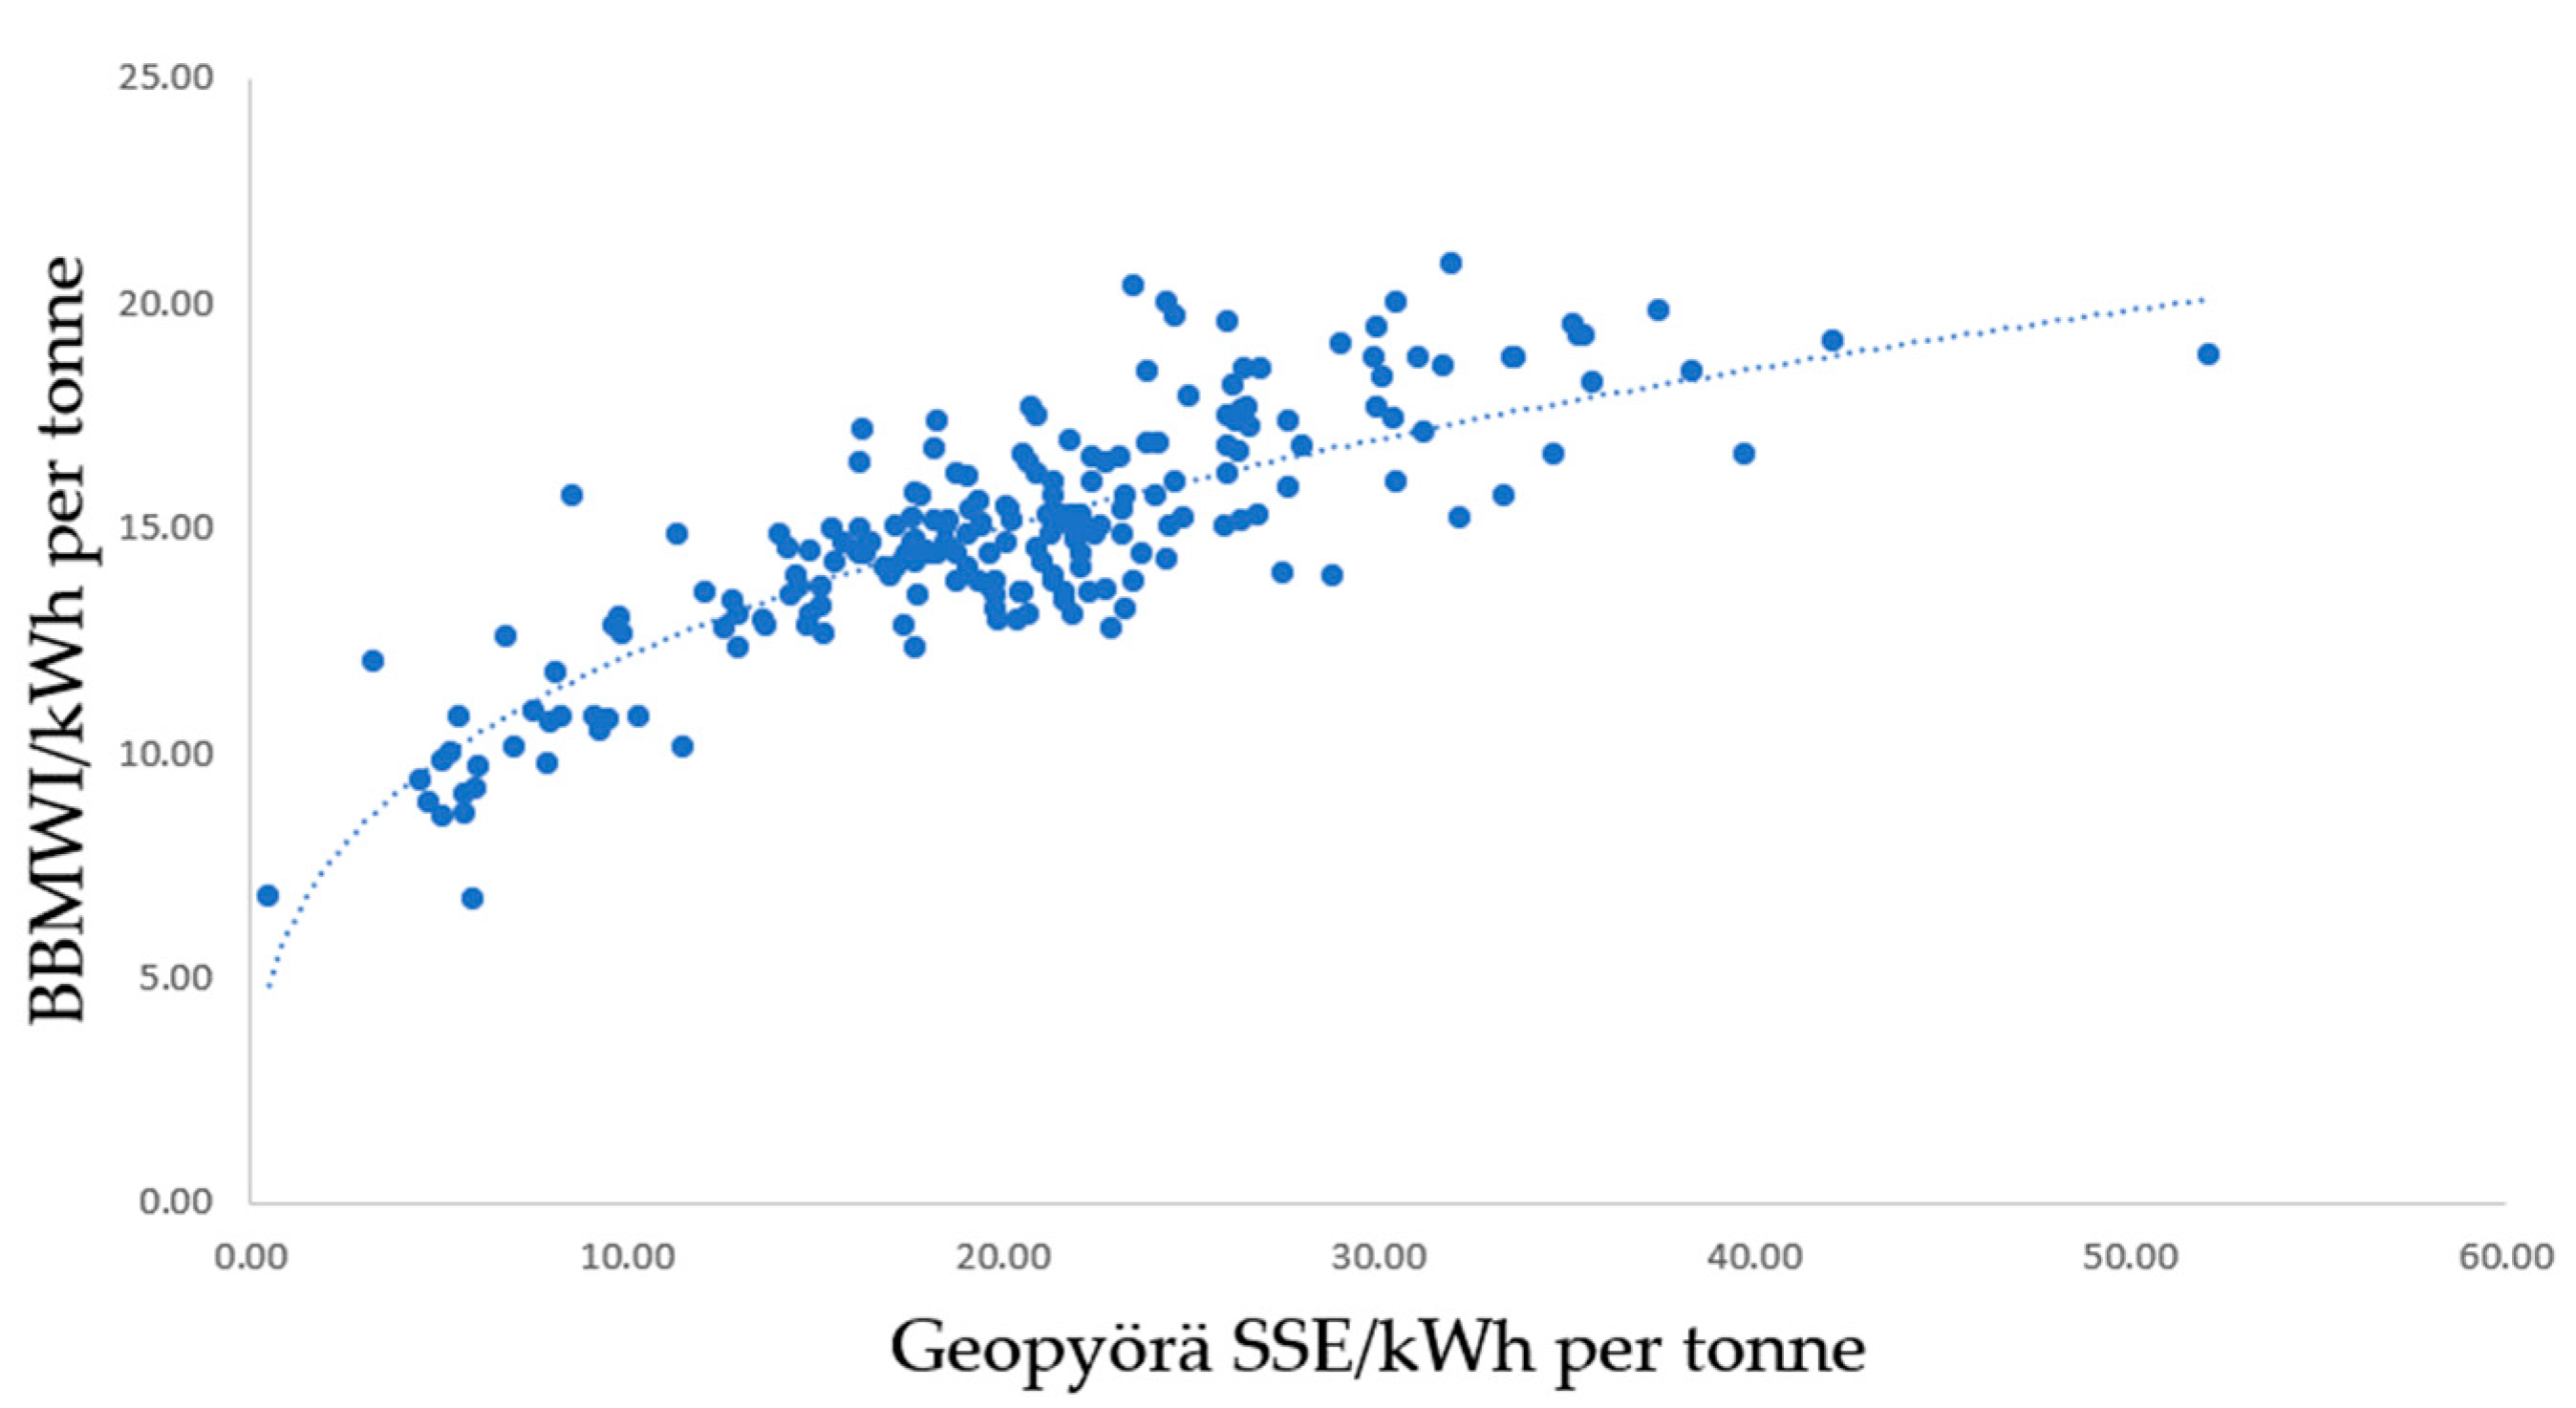
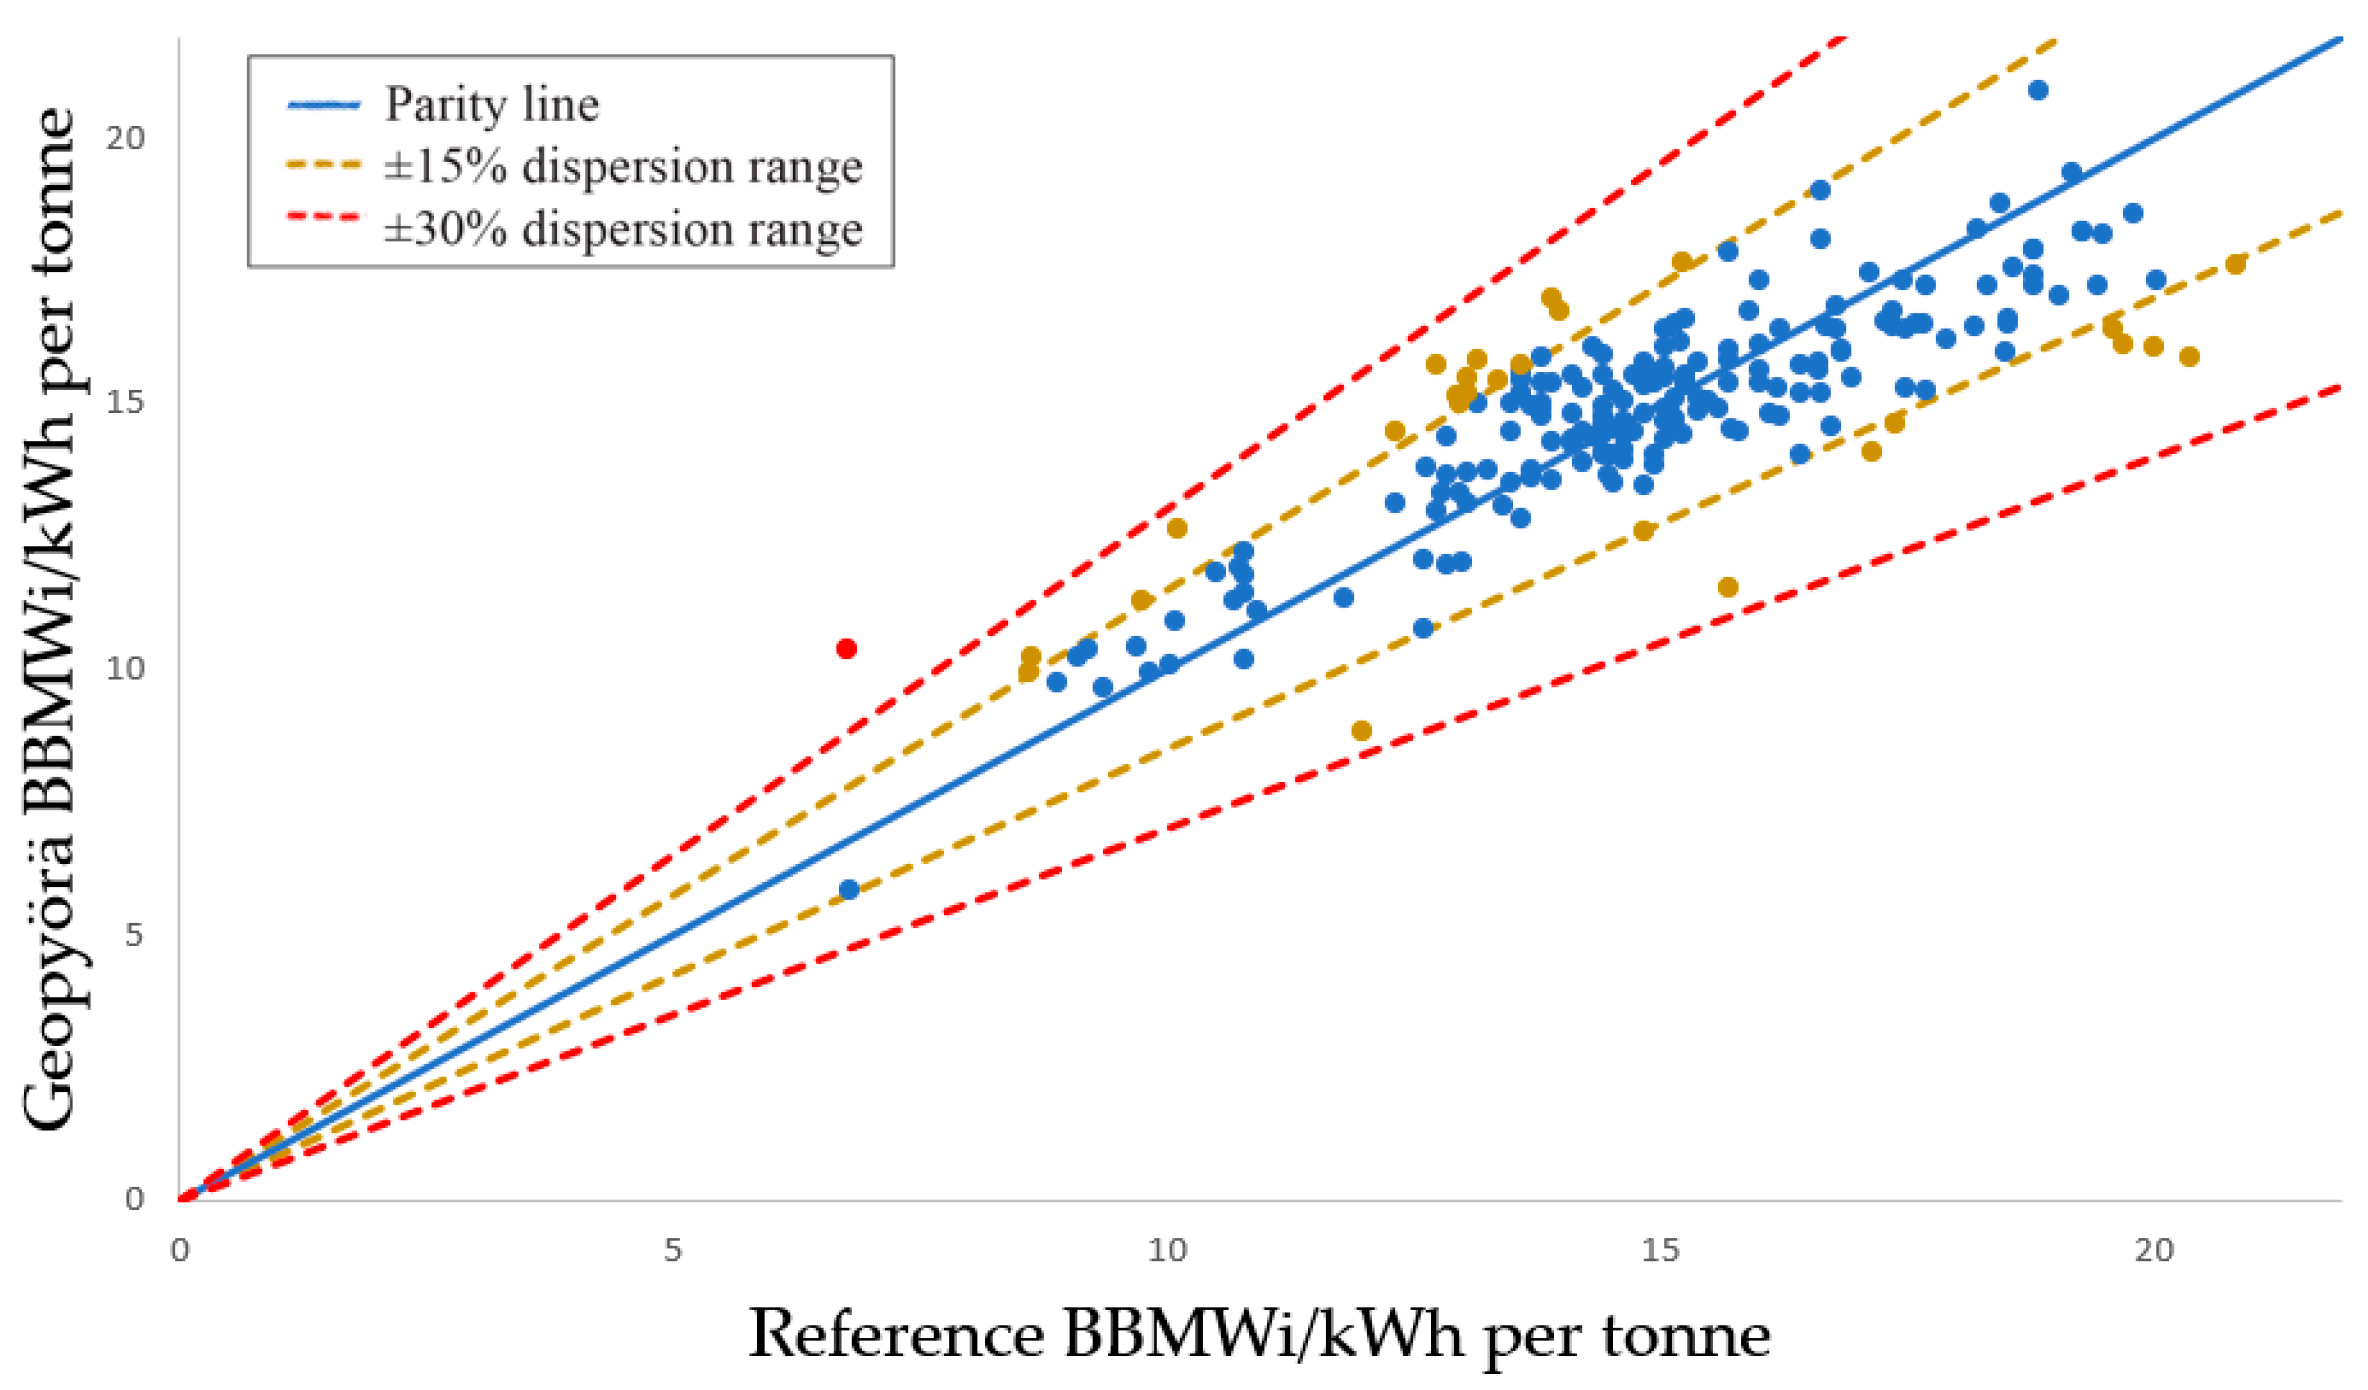
3.3. Bond Ball Mill Work Index
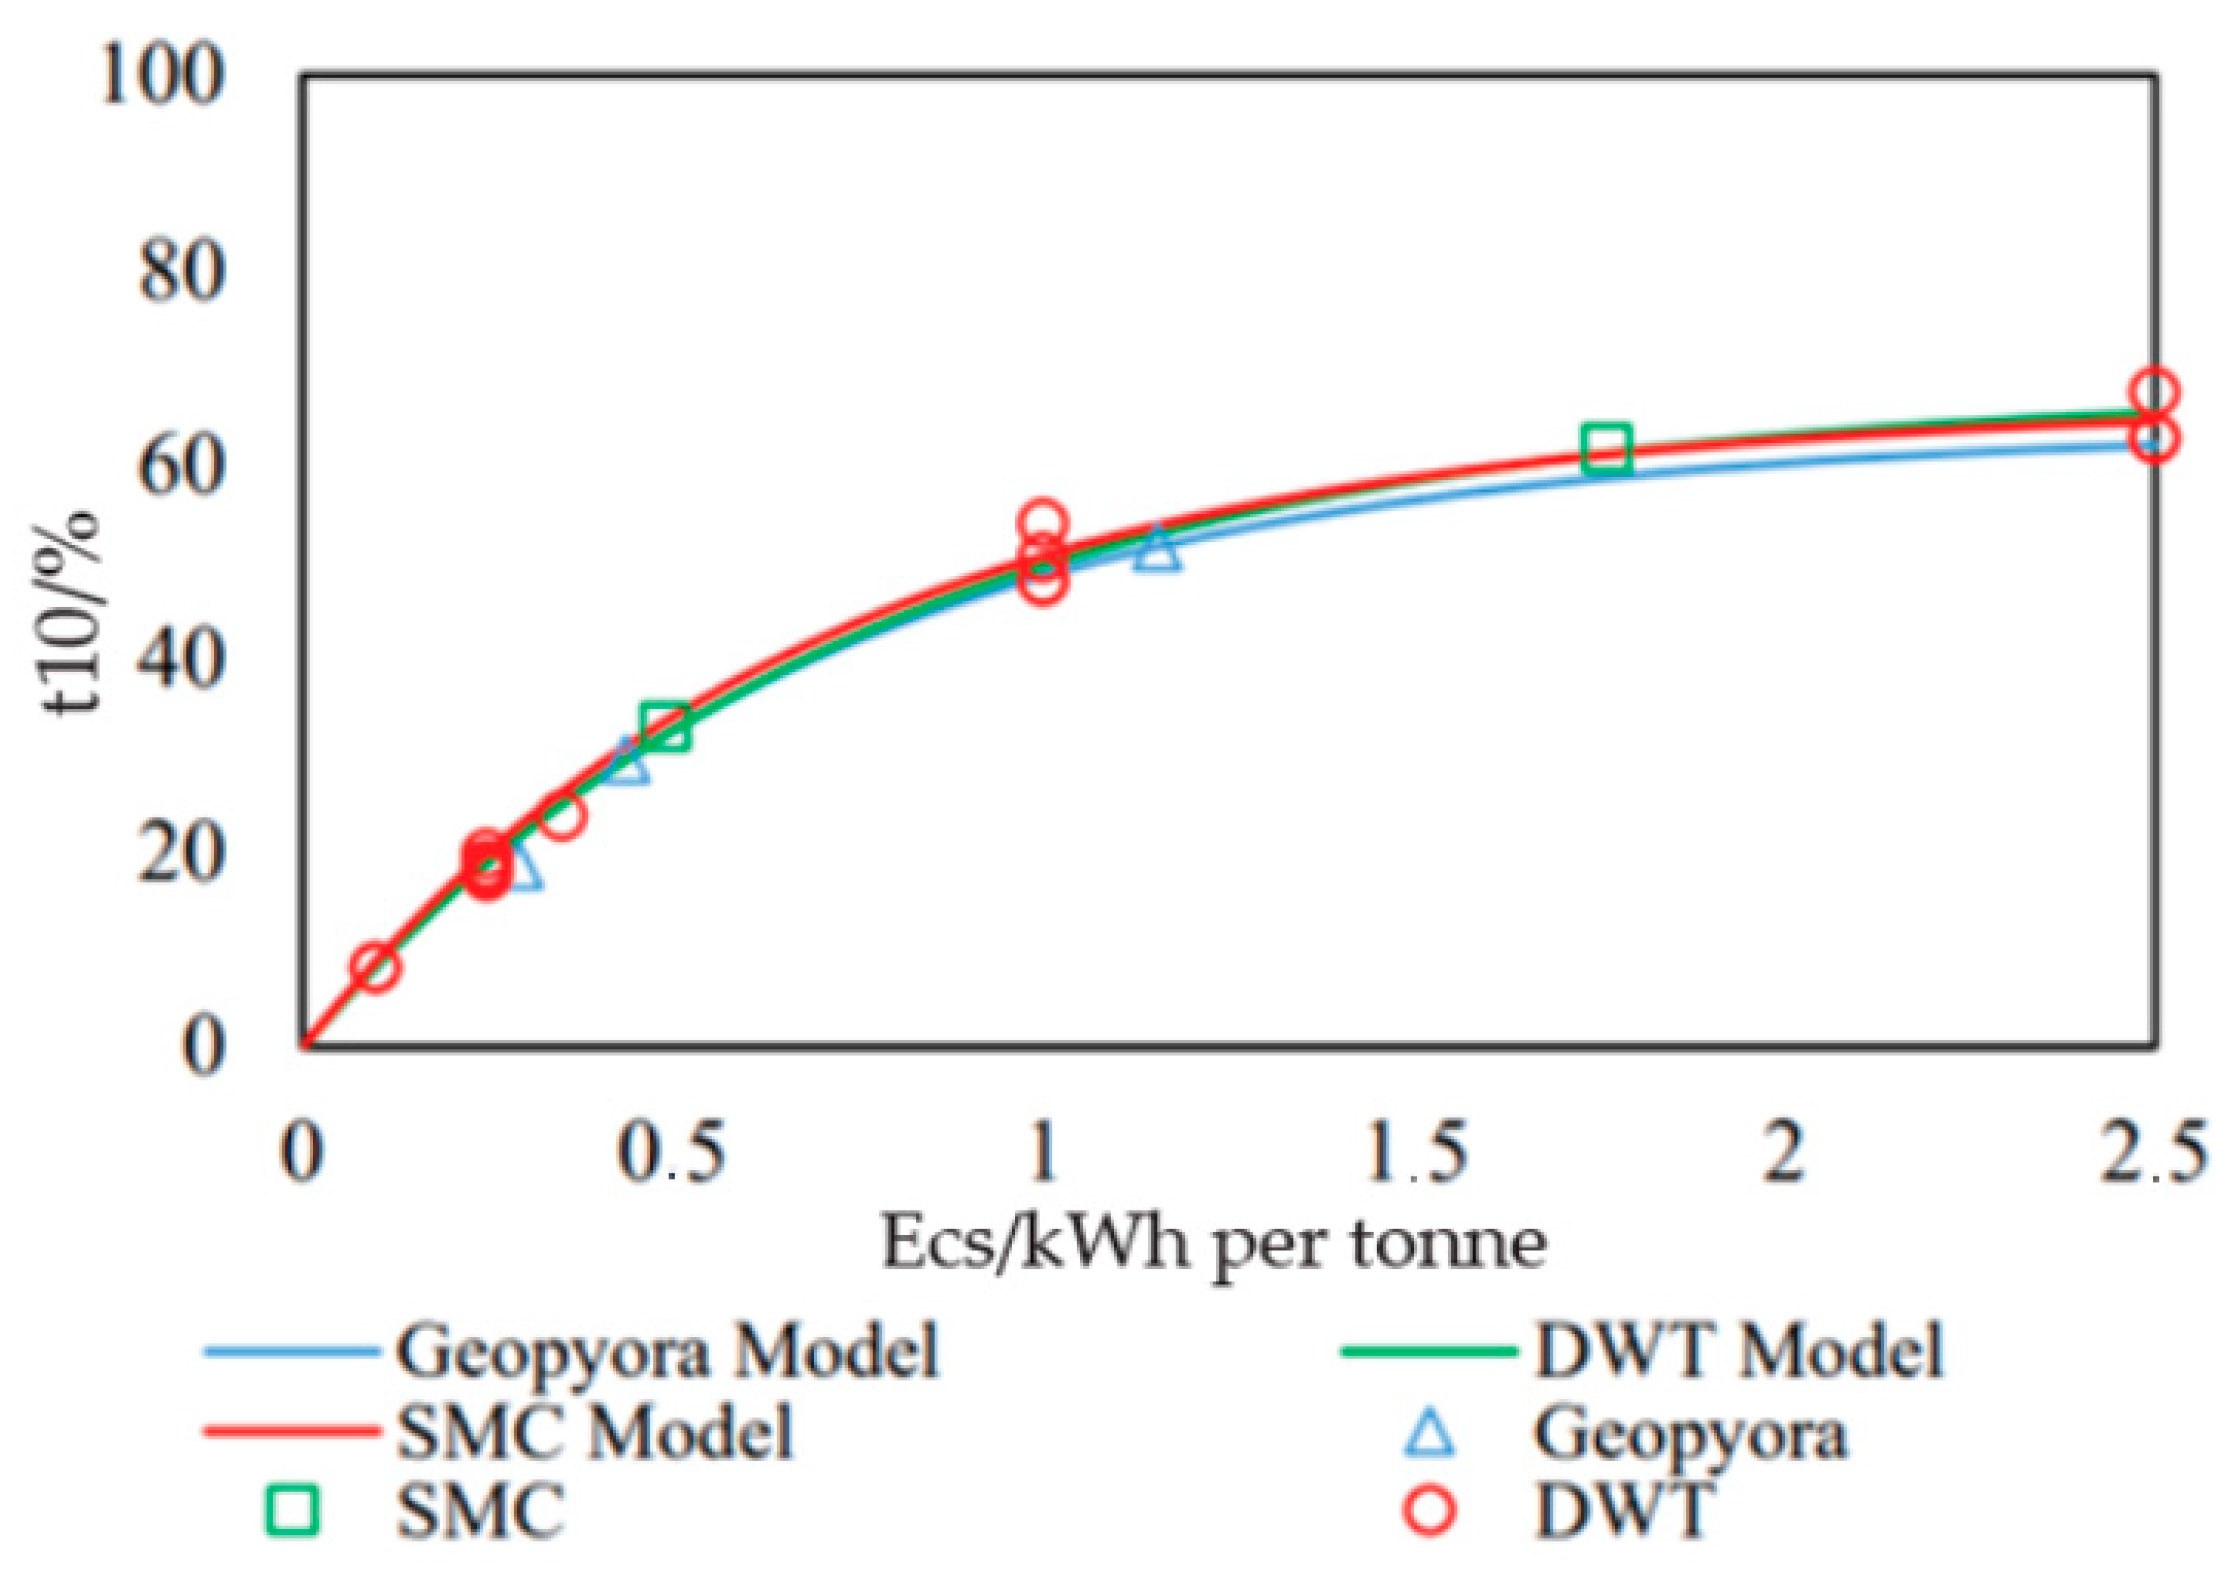
3.4. One Energy Analysis
4. Conclusions
Author Contributions
Funding
Data Availability Statement
Acknowledgments
Conflicts of Interest
References
- Bueno, M.; Foggiato, B.; Lane, G. Geometallurgy applied in comminution to minimize design risks. In Proceedings of the International Conference on Autogenous and Semiautogenous Grinding Technology, Vancouver, BC, Canada, 24–28 September 2015. [Google Scholar]
- Napier-Munn, T.J.; Morrell, S.; Morrison, R.D.; Kojovic, T. Mineral Comminution Circuits: Their Operation and Optimisation, 1st ed.; Julius Kruttschnitt Mineral Research Centre: Indooroopilly, Australia, 1996. [Google Scholar]
- Morell, S. Predicting the Specific Energy of Autogenous and Semi-autogenous Mills from Small Diameter Drill Core Samples. Miner. Eng. 2004, 17, 447–451. [Google Scholar] [CrossRef]
- Mwanga, A.; Rosenkranz, J.; Lamberg, P. Testing of ore comminution behaviour in the geometallurgical context—A review. Minerals 2015, 5, 276–297. [Google Scholar] [CrossRef]
- Torvela, J. Double Wheel Crusher Prototype. Master’s Thesis, University of Oulu, Oulu, Finland, 2020. [Google Scholar]
- Bond, F.C. Crushing and grinding calculations. Br. Chem. Eng. 1961, 6, 378–385. [Google Scholar]
- Chavez, T.M. Development of a Methodology and Validation of the Geopyörä Breakage Test. Master’s Thesis, University of Oulu, Oulu, Finland, 2020. [Google Scholar]
- Narayanan, S.S.; Whiten, W.J. Determination of comminution characteristics from single-particle breakage tests and its application to ball-mill scale-up. Trans. Inst. Min. Metall. Sect. C 1988, 97, C115–C124. [Google Scholar]
- Doll, A. Calculating DWi from a Drop Weight Test Result. Available online: https://www.sagmilling.com/articles/26/view/Calculating%20DWI%20from%20Axb.pdf (accessed on 6 July 2023).
- Josefin, Y.; Doll, A. Correction of Bond Ball Mill Work Index Test for Closing Mesh Sizes. In Proceedings of the Procemin-Geomet 2018 14th International Mineral Processing Conference & 5th International Seminar on Geometallurgy, Santiago, Chile, 28–30 November 2018; Gecamin: Santiago, Chile, 2018. [Google Scholar]
- Chavez, T.M. The Geopyörä breakage test for geometallurgy. In Proceedings of the IMPC 2020: XXX International Mineral Processing Congress, Cape Town, South Africa, 18–22 October 2020. [Google Scholar]
- Powell, M.S.; Morrison, R.D. The future of comminution modelling. Int. J. Miner. Process. 2007, 84, 228–239. [Google Scholar] [CrossRef]


| Test | Required Size Ranges | Energy Levels per Size Range | Total Required Mass (kg) |
|---|---|---|---|
| JKDWT | 5 | 3 | 50 |
| SMC | 1 | 5 | 20 |
| Geopyörä | 1 | 2 | 2 |
| Parity R-Squared | Mean Error | σ (t/m³) | σ/µ |
|---|---|---|---|
| 1.0 | 2% | 0.05 | 2% |
| Parity R-Squared | Mean Error | σ | σ/µ |
|---|---|---|---|
| 0.93 | 10% | 17.73 | 34% |
| Parity R-Squared | Mean Error | σ (kWh/m³) | σ/µ |
|---|---|---|---|
| 0.99 | 11% | 0.55 | 9% |
| Parity R-Squared | Mean Error | σ (kWh/m³) | σ/µ |
|---|---|---|---|
| 0.99 | 8% | 0.90 | 6% |
| Parity R-Squared | Mean Error | σ | σ/µ |
|---|---|---|---|
| 0.88 | 16% | 20.98 | 40% |
Disclaimer/Publisher’s Note: The statements, opinions and data contained in all publications are solely those of the individual author(s) and contributor(s) and not of MDPI and/or the editor(s). MDPI and/or the editor(s) disclaim responsibility for any injury to people or property resulting from any ideas, methods, instructions or products referred to in the content. |
© 2023 by the authors. Licensee MDPI, Basel, Switzerland. This article is an open access article distributed under the terms and conditions of the Creative Commons Attribution (CC BY) license (https://creativecommons.org/licenses/by/4.0/).
Share and Cite
Bueno, M.d.P.; Almeida, T.; Powell, M. Extensive Validation of a New Rock Breakage Test. Minerals 2023, 13, 1506. https://doi.org/10.3390/min13121506
Bueno MdP, Almeida T, Powell M. Extensive Validation of a New Rock Breakage Test. Minerals. 2023; 13(12):1506. https://doi.org/10.3390/min13121506
Chicago/Turabian StyleBueno, Marcos de Paiva, Thiago Almeida, and Malcolm Powell. 2023. "Extensive Validation of a New Rock Breakage Test" Minerals 13, no. 12: 1506. https://doi.org/10.3390/min13121506
APA StyleBueno, M. d. P., Almeida, T., & Powell, M. (2023). Extensive Validation of a New Rock Breakage Test. Minerals, 13(12), 1506. https://doi.org/10.3390/min13121506