
Magnetic and Geochemical Properties of Zagreb City Area Soils

 , ,
, ,  , and
, and
Abstract
:1. Introduction
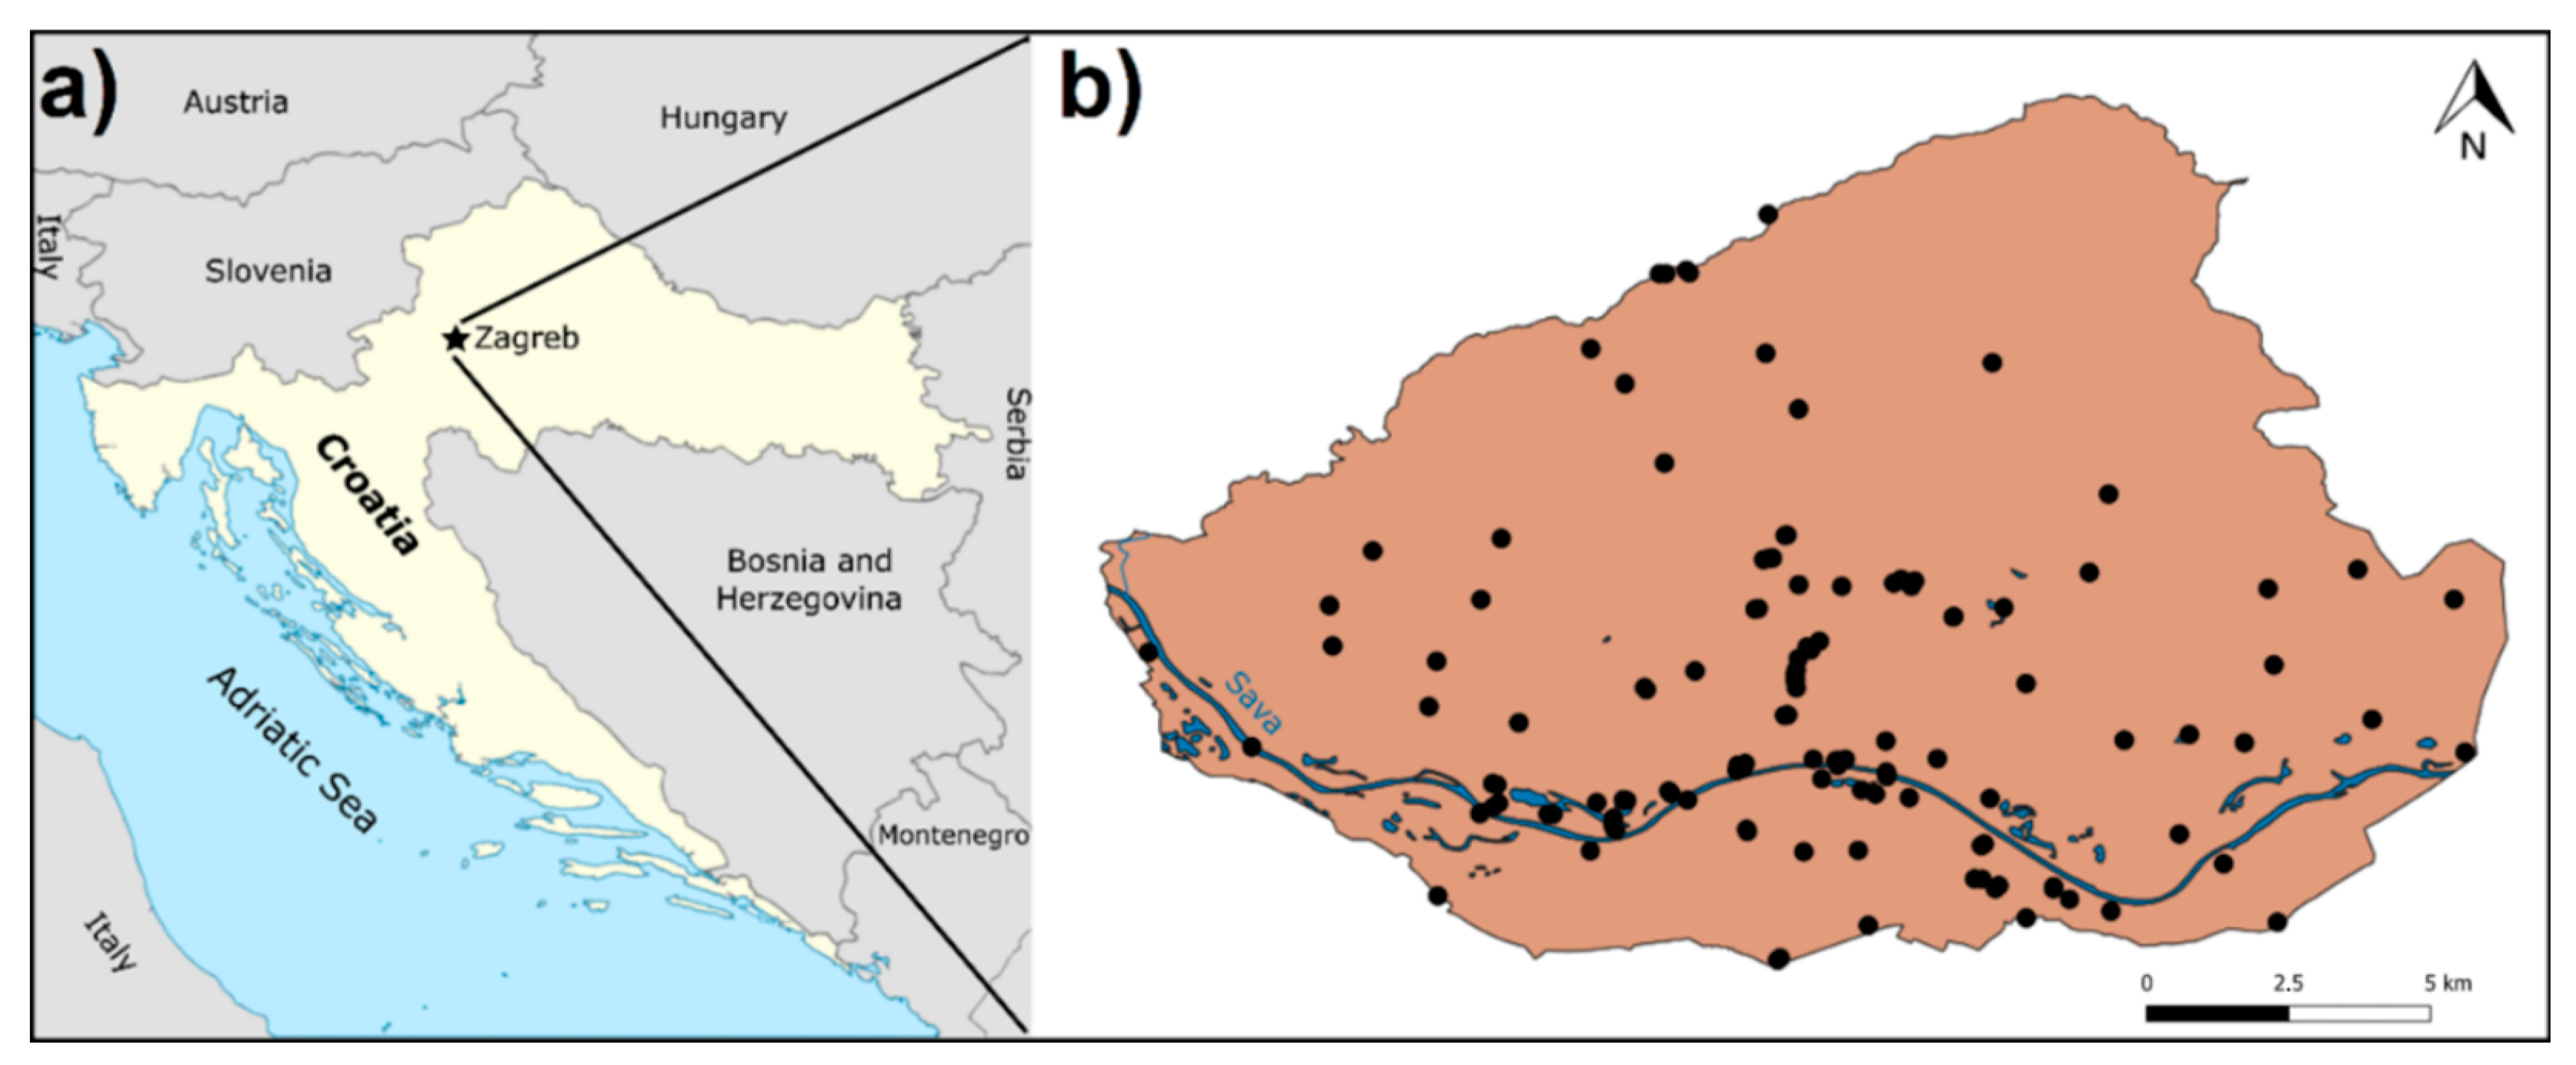
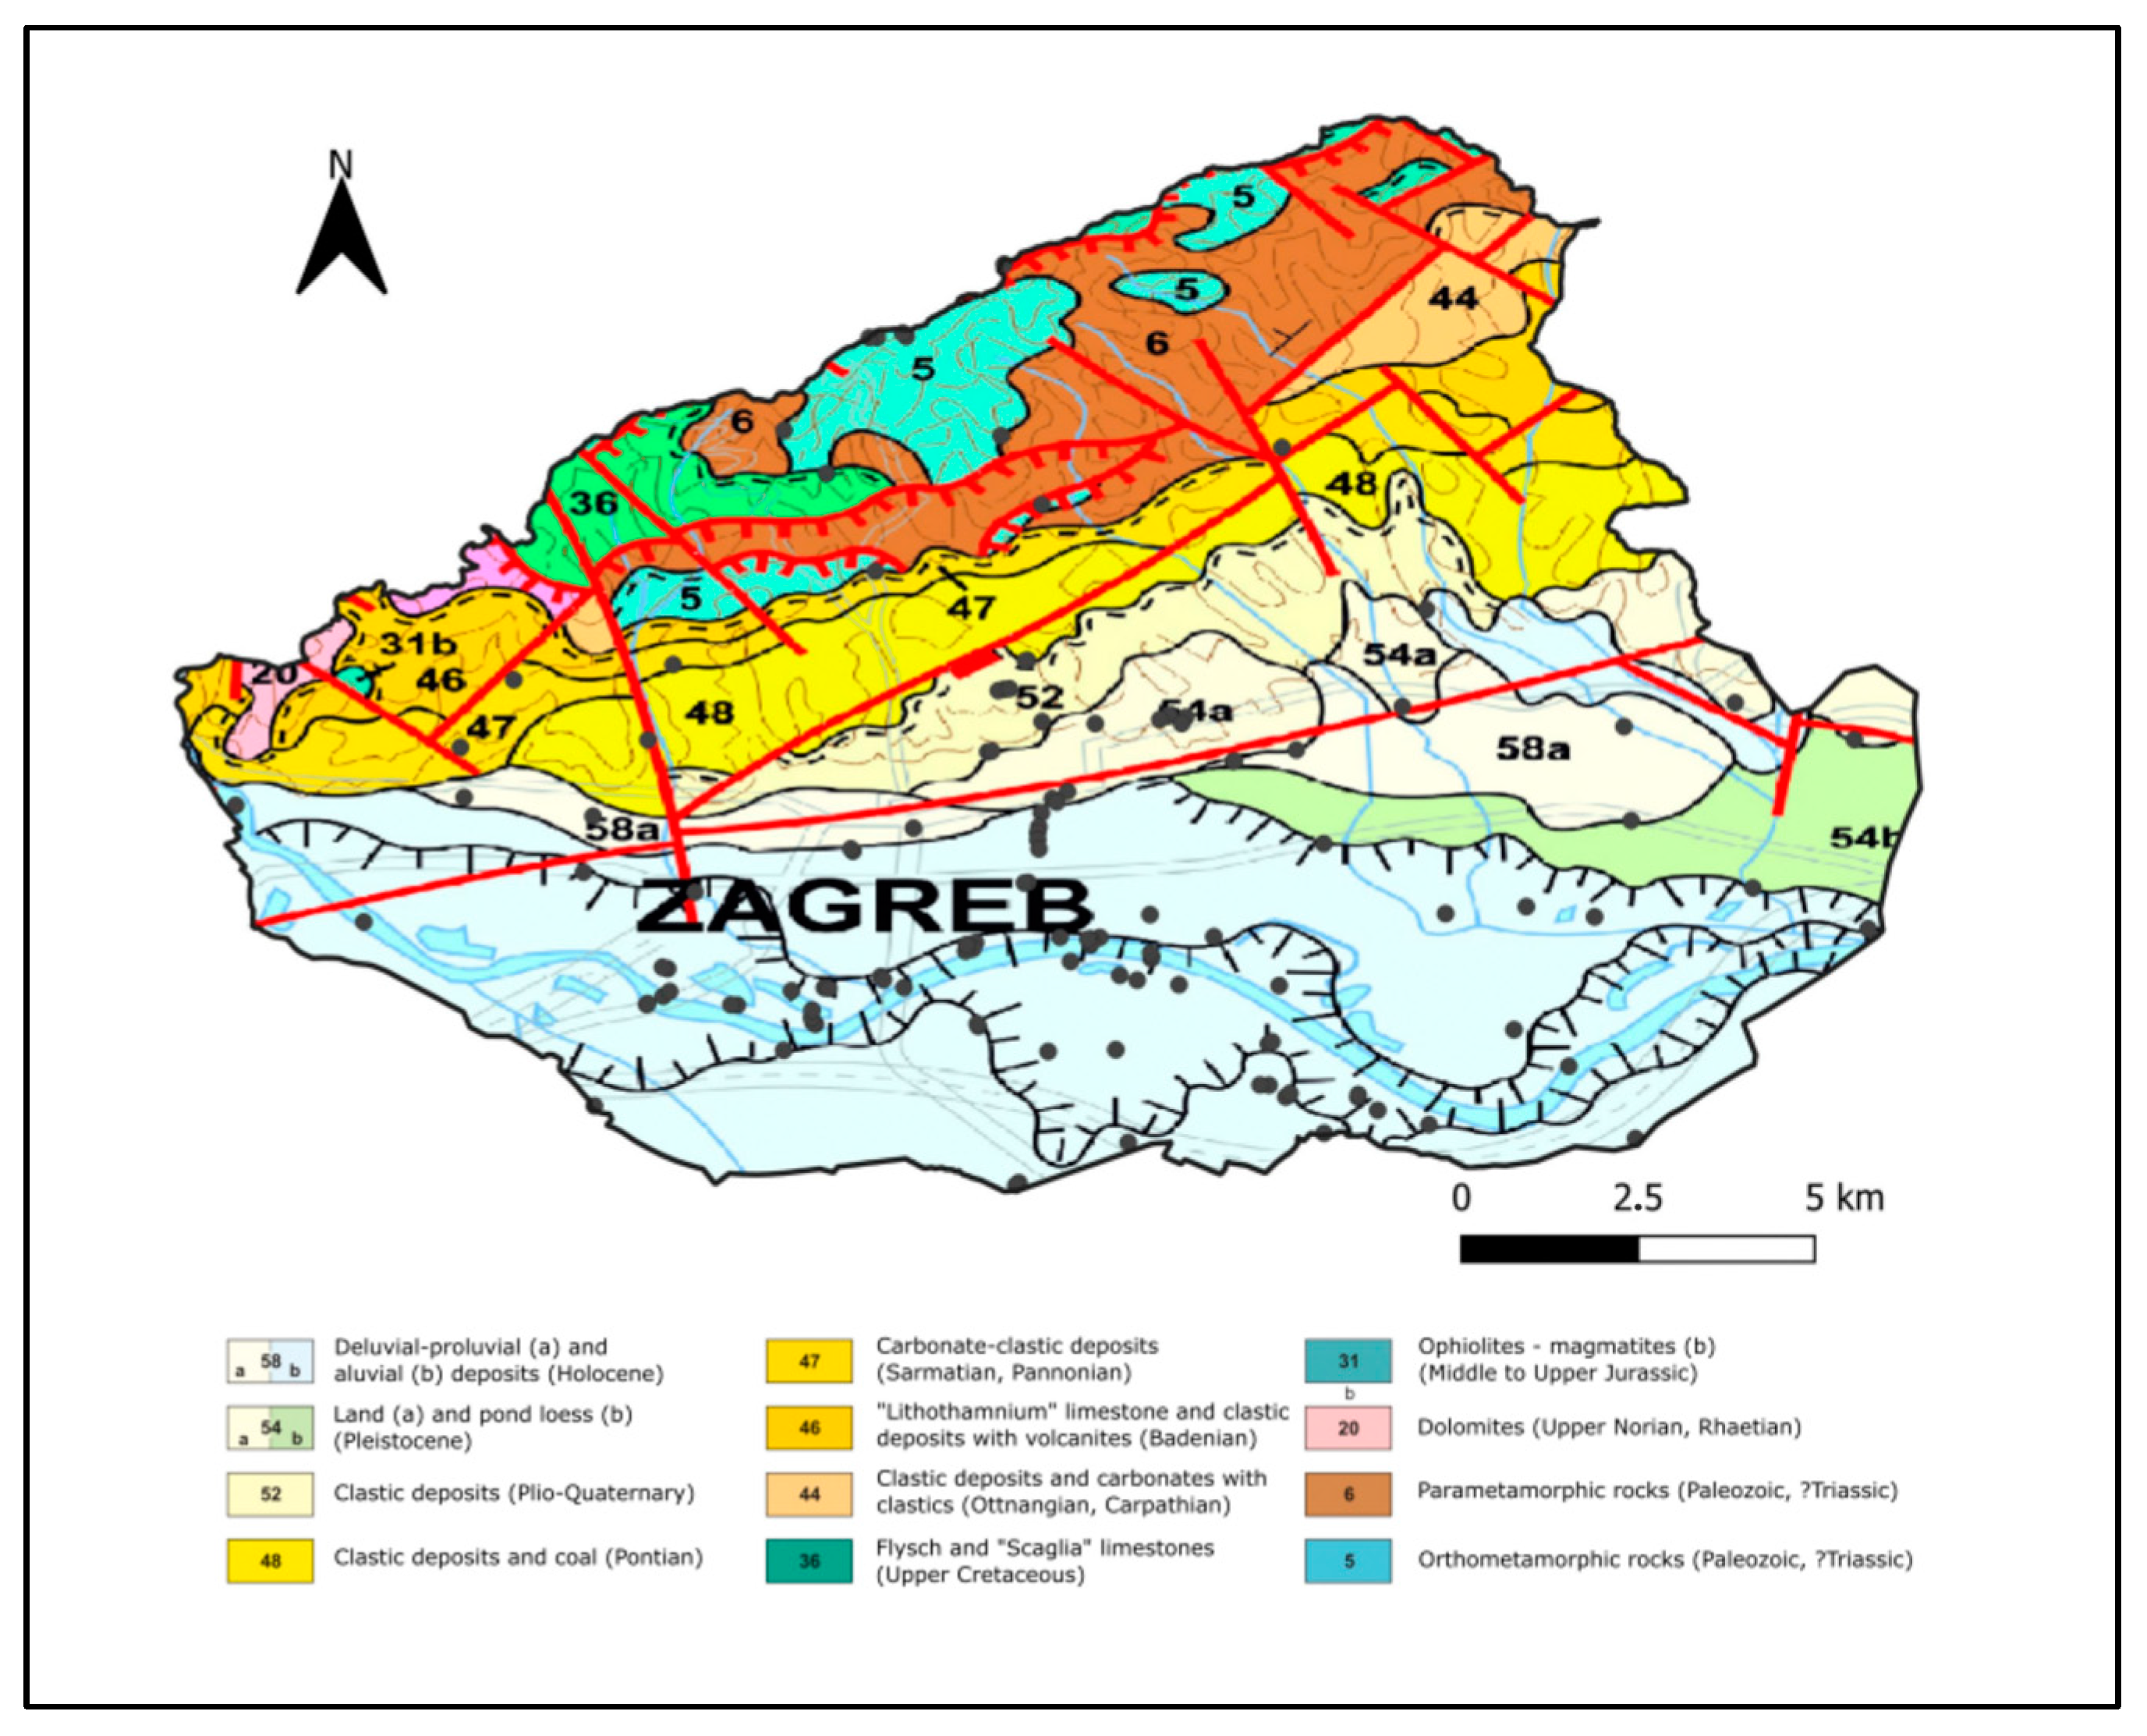
2. Study Area
3. Materials and Methods
3.1. In Situ Field Measurements
3.2. Sampling and Sample Preparation
- At each sampling location, first, the micro-location of the previous in situ measurement was found, and the sample was taken from this exact point.
- Grass or leaf cover was removed to reveal the bare surface of the soil. A square with sides of 25 cm was marked with a spade, and the soil was sampled to a depth of 2 cm.
- Soils were sampled using a spade, packed in PVC bags, and transported to the laboratory.
- Soil samples were dried at 40 °C in cardboard boxes under airflow. The dried soil was first sieved through a 12-mesh (approximately 2 mm) sieve and then ground in a mechanical mortar.
- Then, 40 g of each sample thus prepared was separated and stored in a plastic container for ICP-OES analysis, and the rest of the sample was stored.
- In each separated sample prepared for ICP-OES analysis, MS was measured under laboratory conditions before the ICP-OES analysis, also using the SM30 instrument.
3.3. Magnetic Susceptibility Measurements
3.4. Determination of Geochemical Composition Using ICP-OES
3.5. Statistical Analyses
- (a)
- The determination of basic statistical parameters—N (number of cases), mean, geometric mean, median, mode, frequency, minimum, maximum, standard deviation, skewness and kurtosis. These were determined to more clearly represent the experimentally determined values, without presenting the whole dataset.
- (b)
- Correlation analysis was performed by calculating Pearson’s correlation coefficient, which has been presented in the form of a correlation matrix and was used to determine the strength of the linear correlations between the mass fractions of analyzed elements and MS. The values obtained were statistically significant at p < 0.05. Pearson correlation assumes that the two variables are measured on interval scales, and determines the extent to which the values of the two variables are “proportional” to each other. The value of correlation (i.e., correlation coefficient) does not depend on the specific measurement units used. The presence of proportionality means the values are linearly related; that is, the correlation is strong if it can be “summarized” by a straight line (sloped upwards or downwards), which line is called the regression line or the least squares line because it is determined in such a way that the sum of the squared distances of all data points from the line is as low as possible.
- (c)
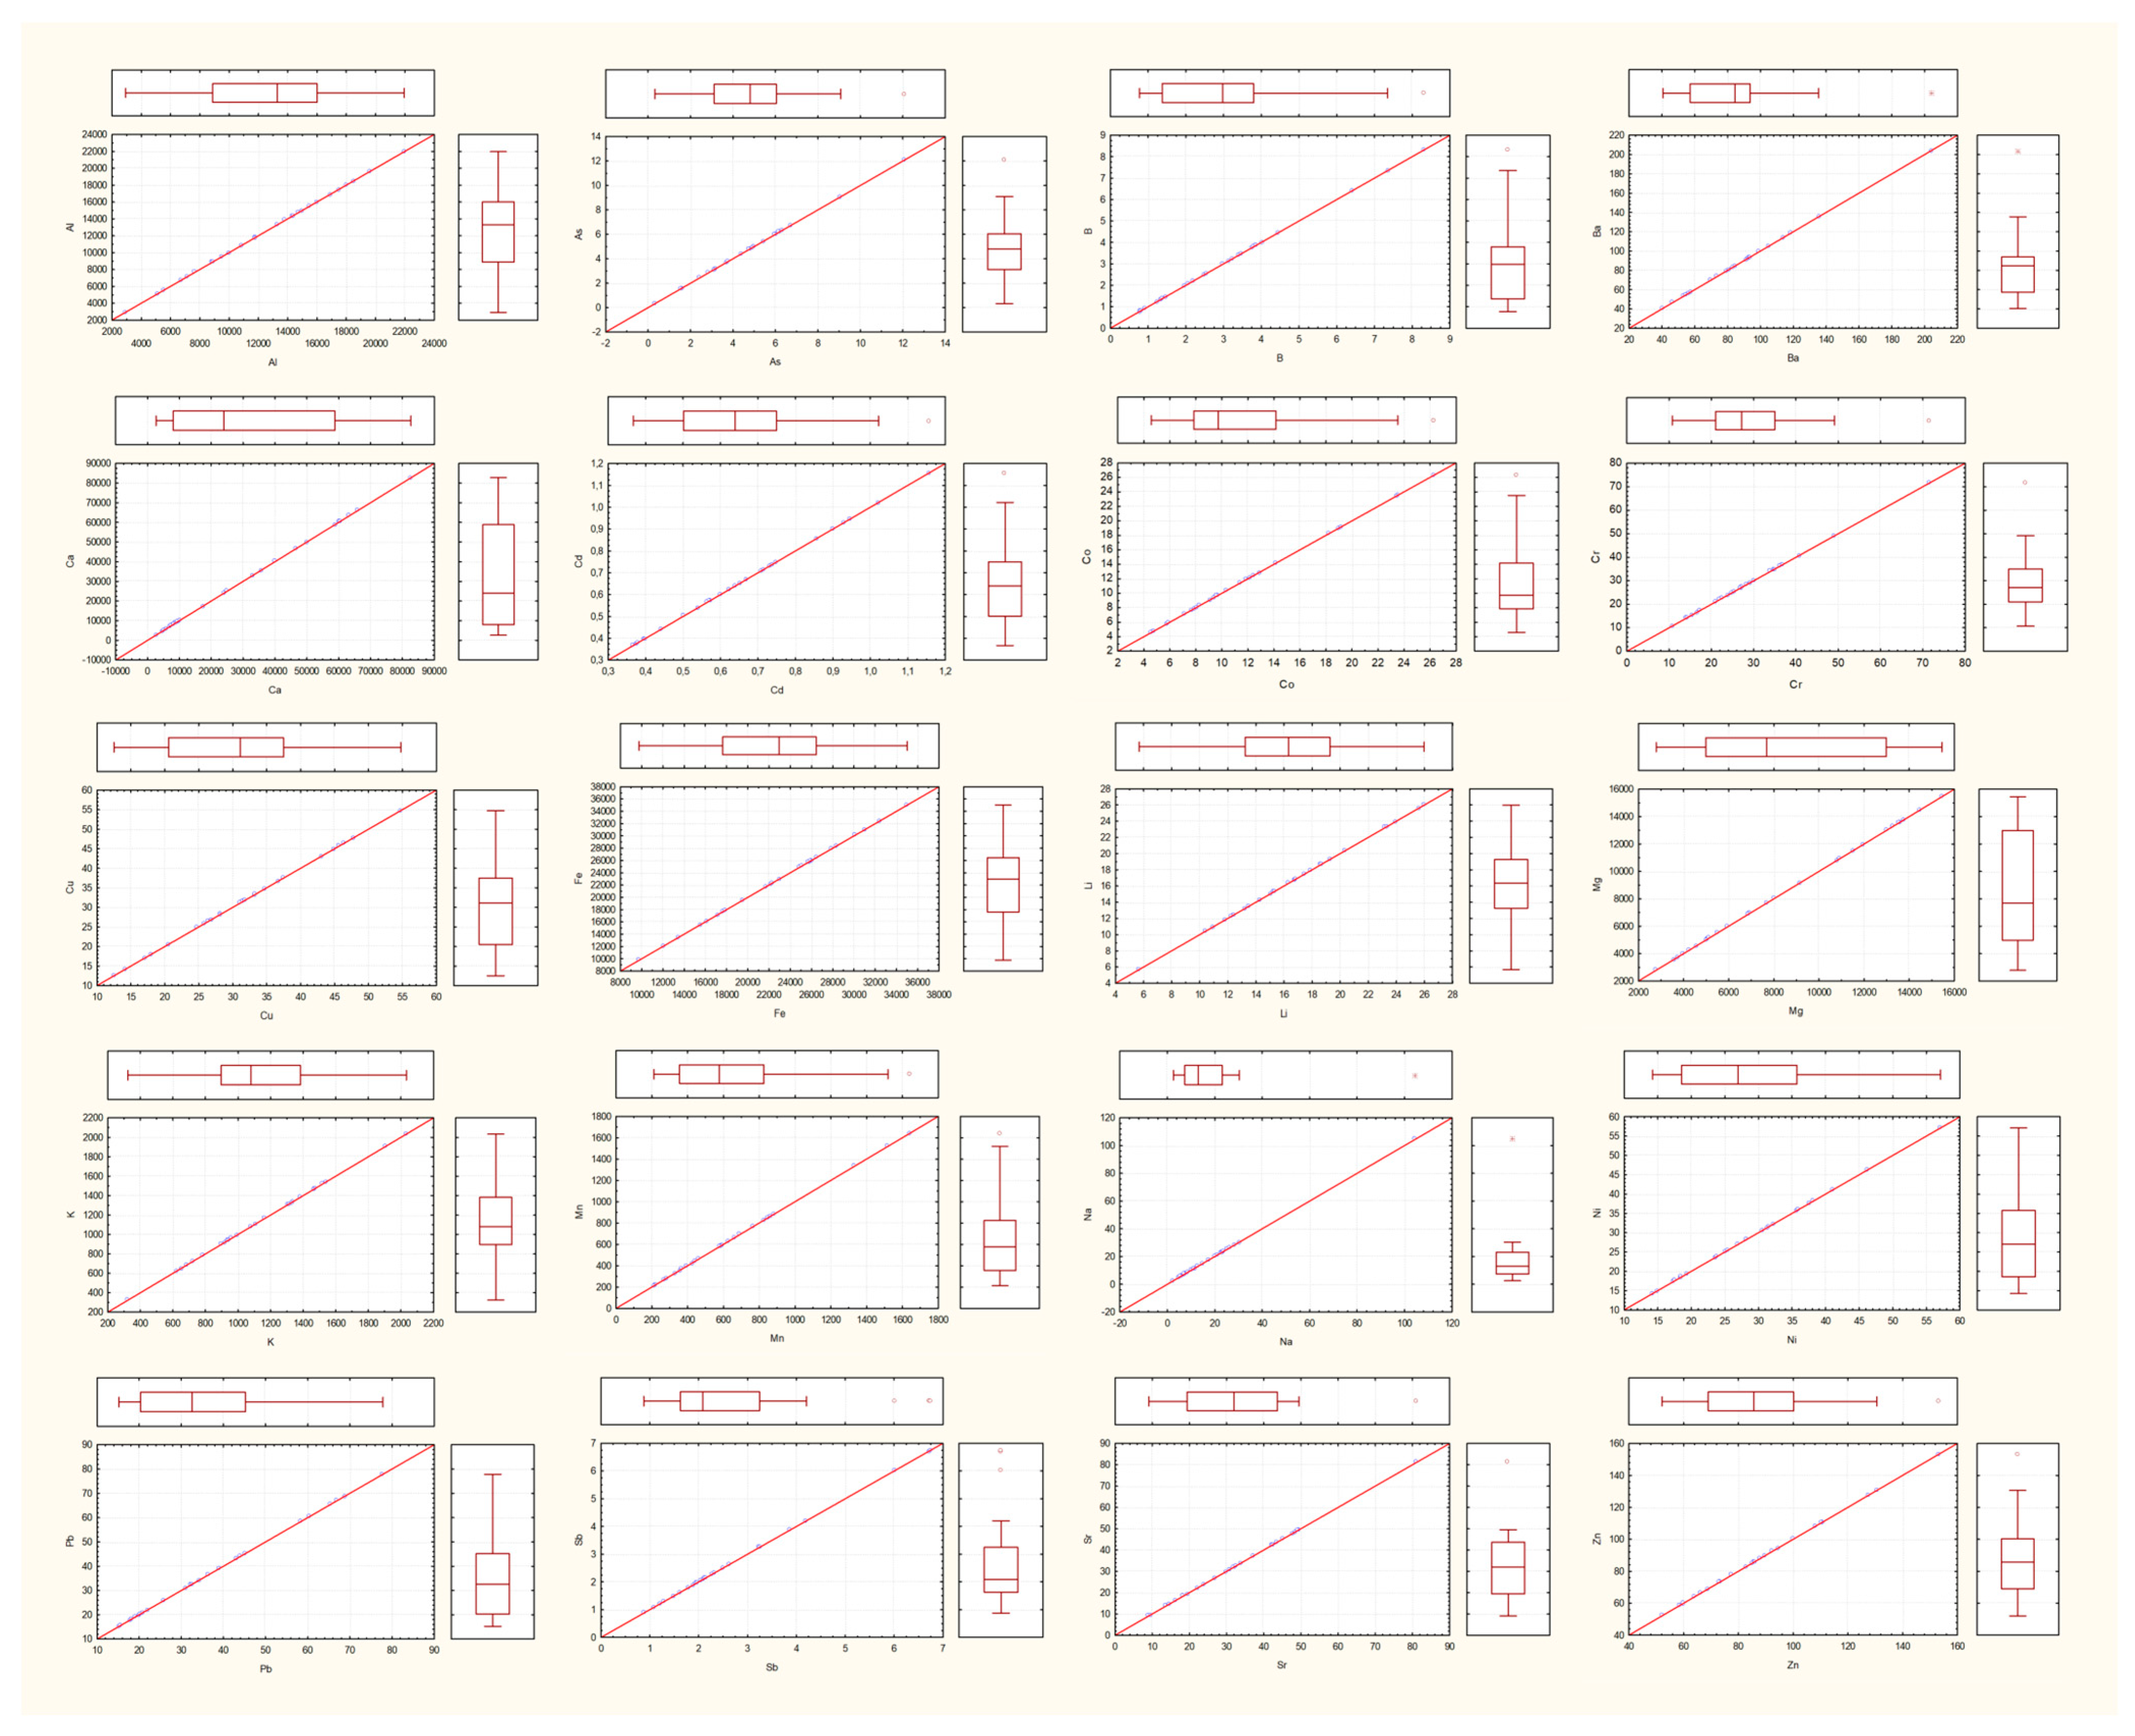
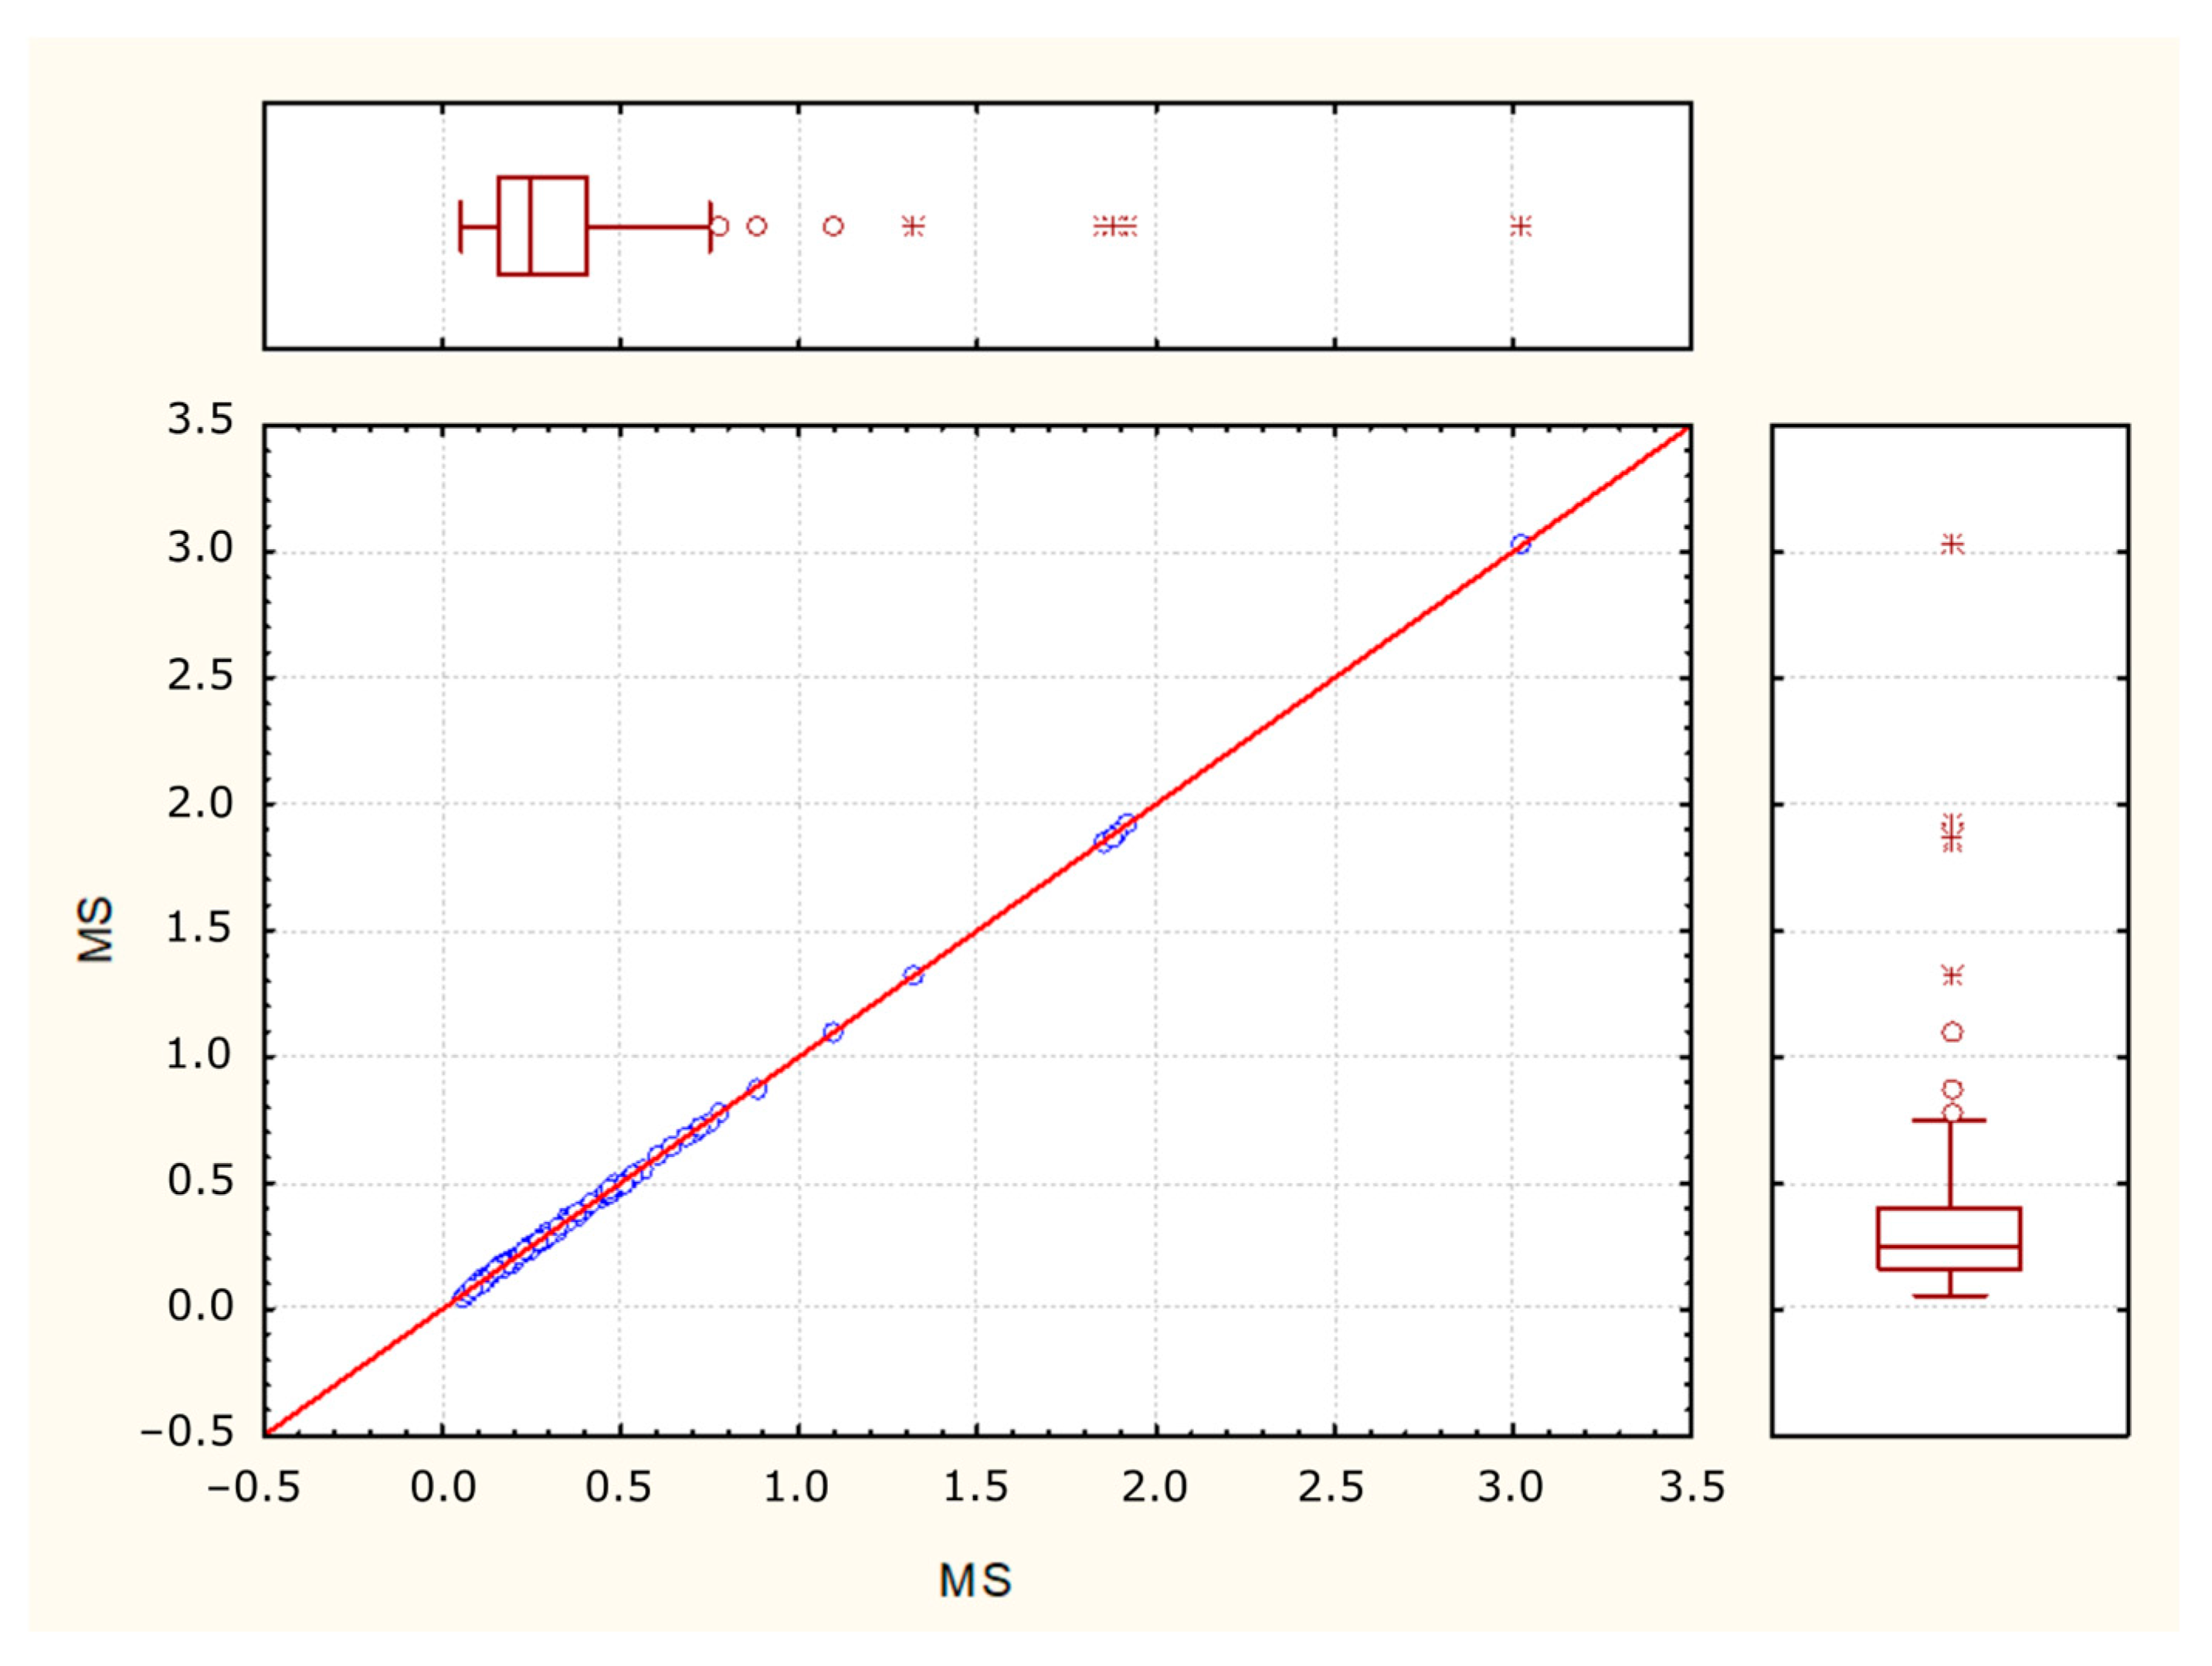
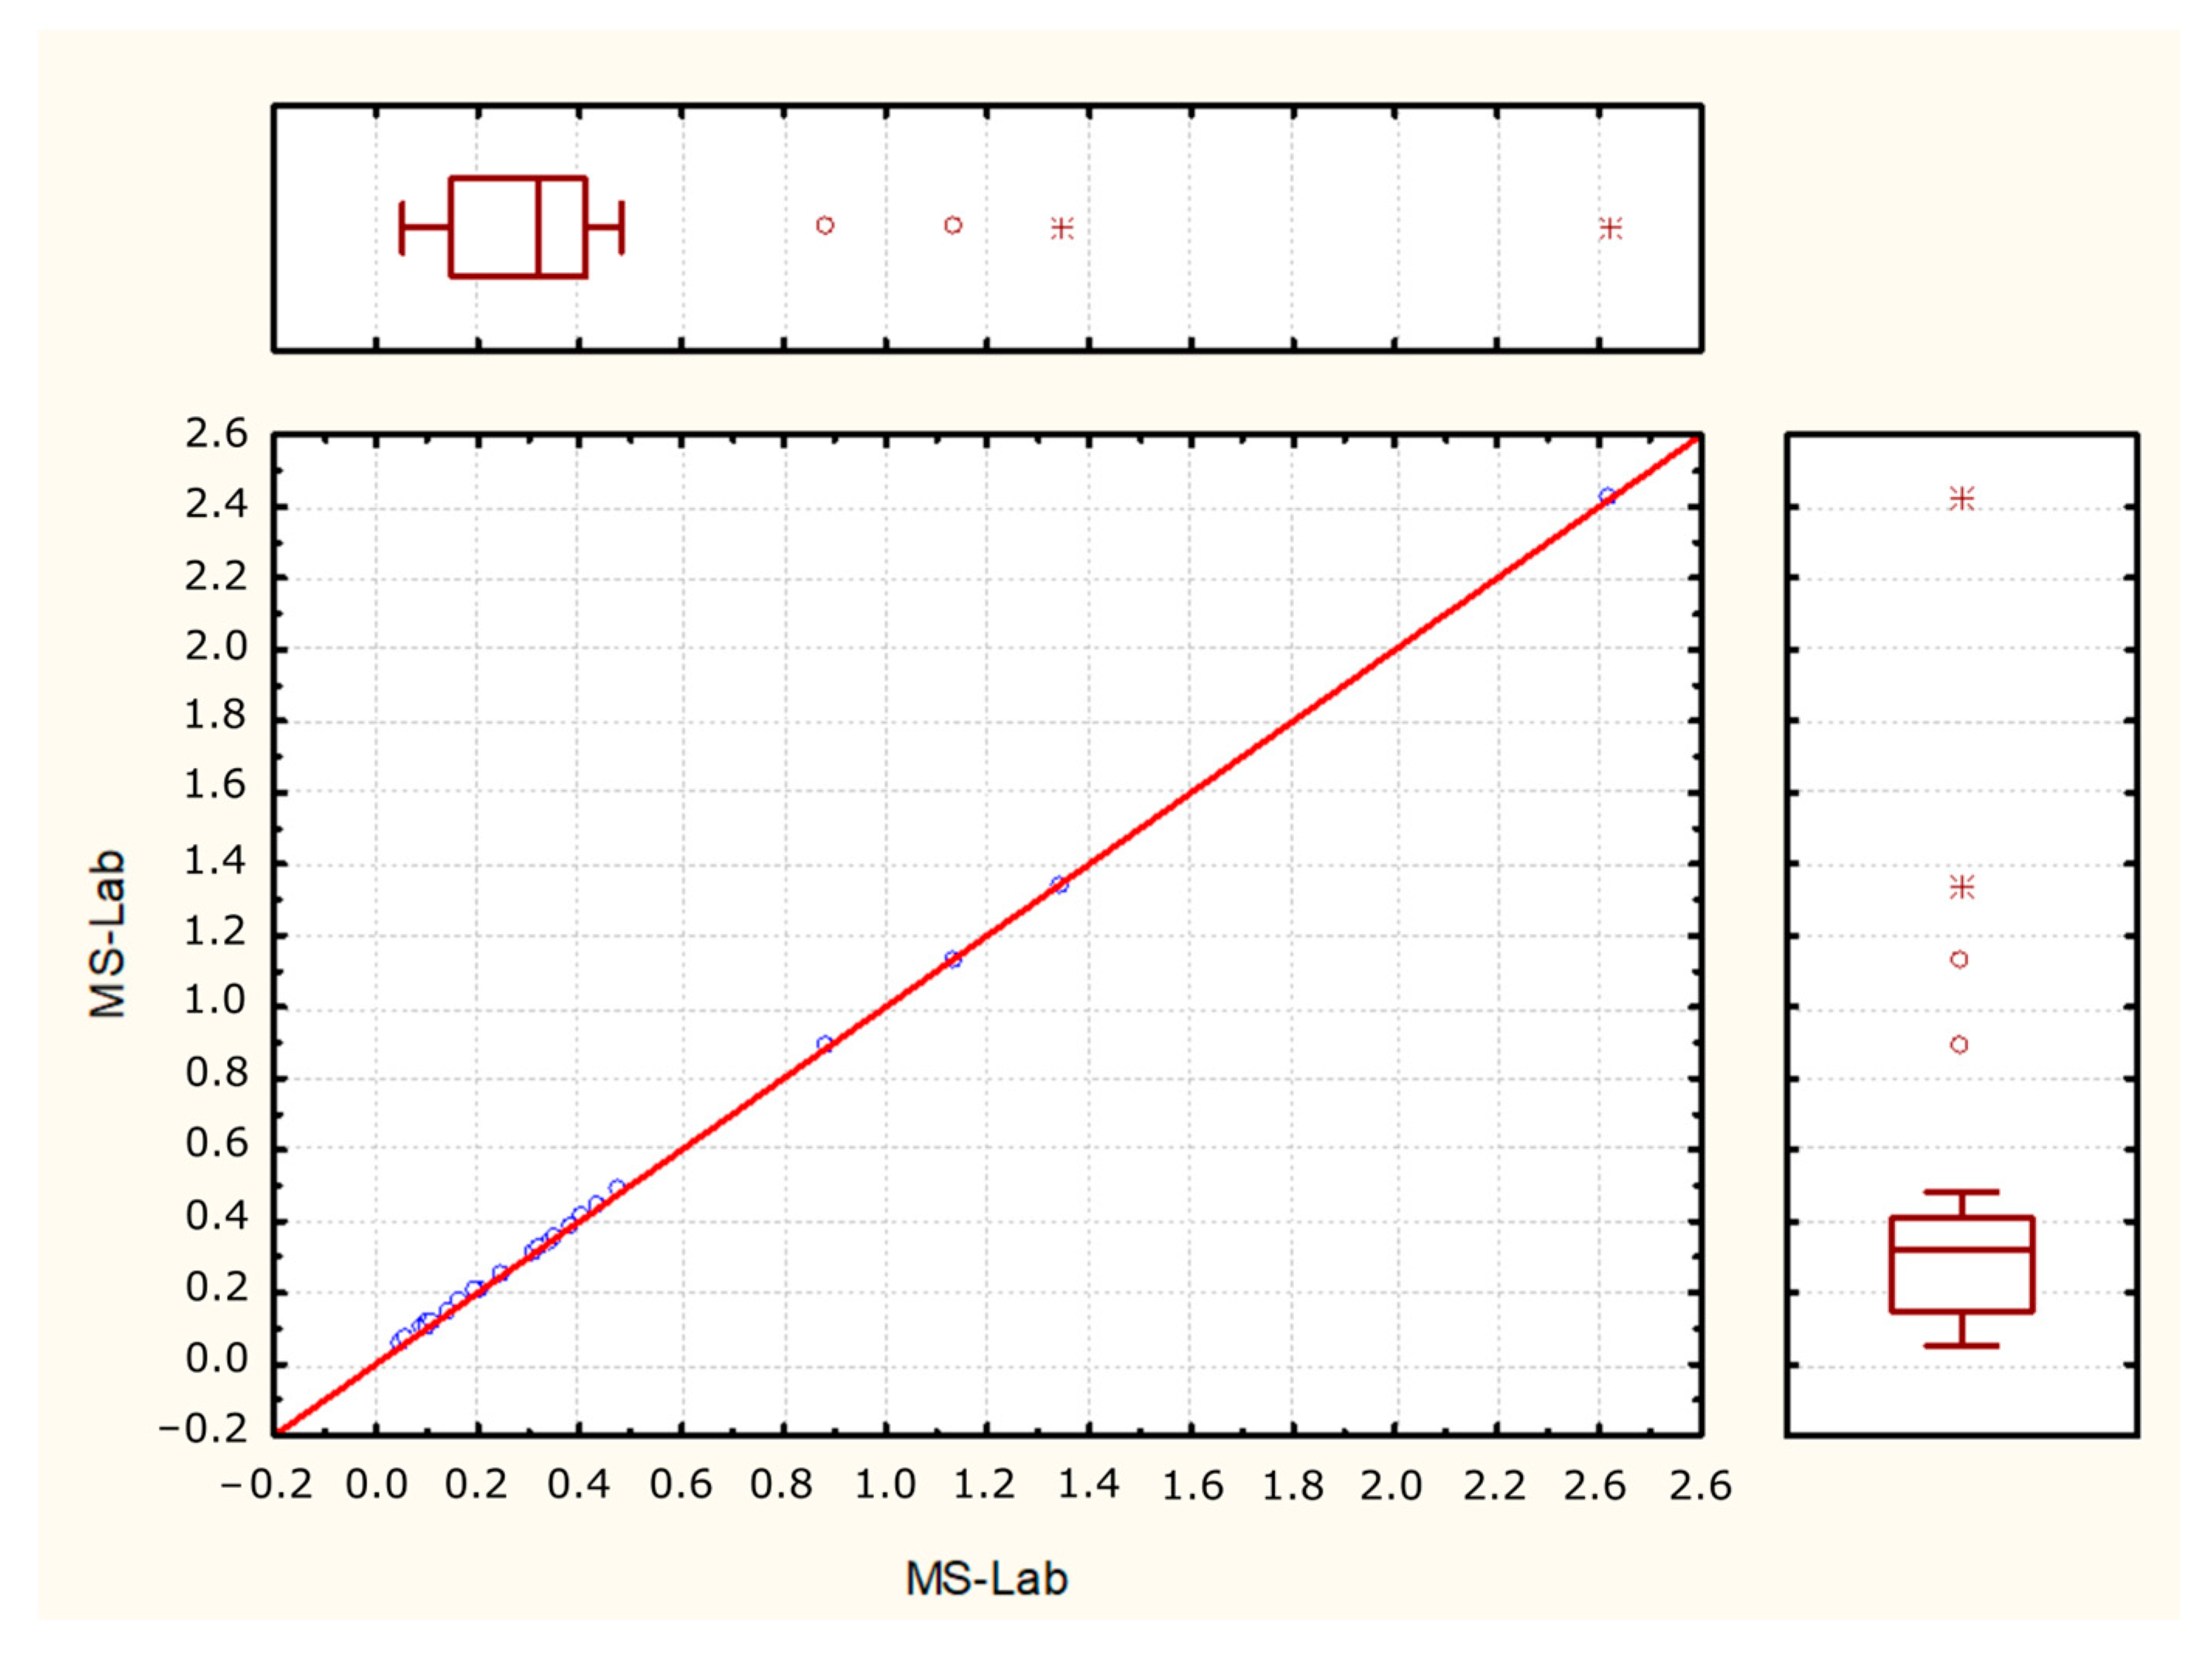
- The boxplot method was used to identify anomalies in the sediment samples. Normal or lognormal boxplots were constructed based on empirical plots of cumulative distribution. The box length represents the interquartile range, with outlier values defined as those situated between 1.5 and 3 box lengths from the upper or lower edge of the box. Extremes are defined as values situated more than 3 box lengths from the edge of the box [32,33].
- (d)
- The cluster analysis of Q-mode, in which clusters of samples are sought, was performed to identify groups of similar samples. Cluster analysis is used to derive multivariate statistics, and is a hierarchical method [34].
4. Results and Discussion
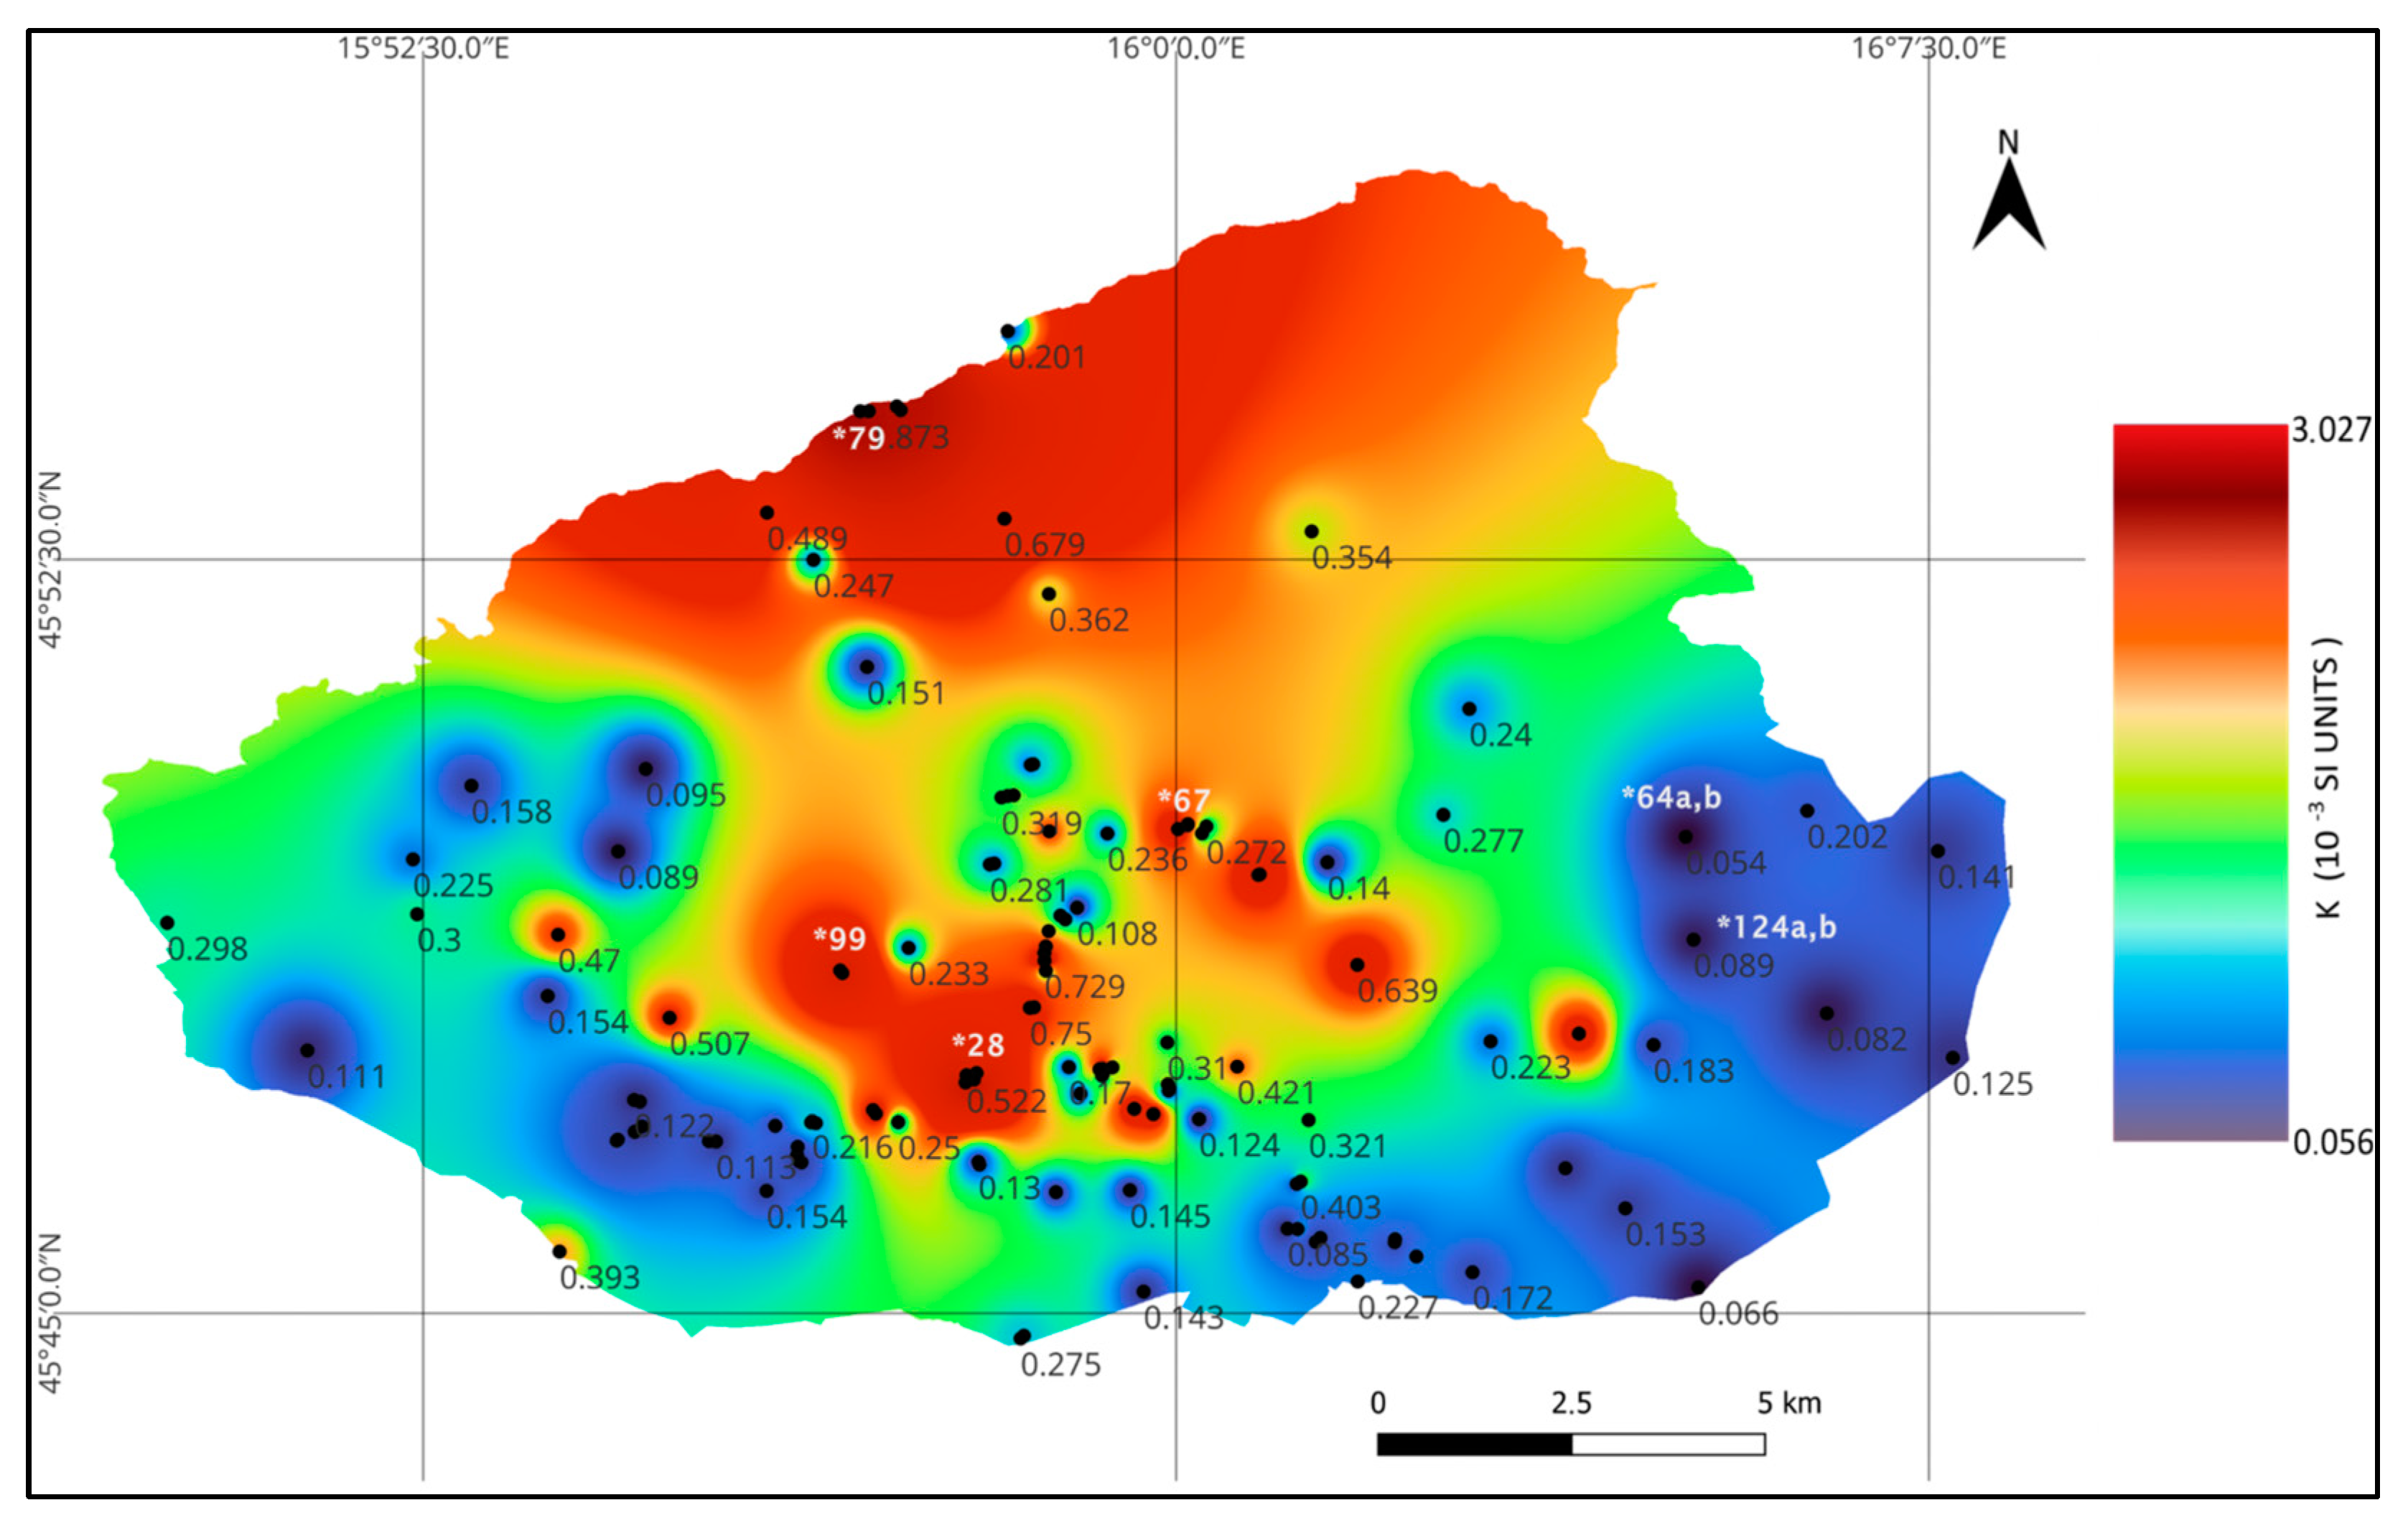
4.1. Distribution of MS within the City of Zagreb Based on In Situ Measurements
4.2. Distribution of MS within the City of Zagreb, Based on Laboratory Measurements of Selected Samples
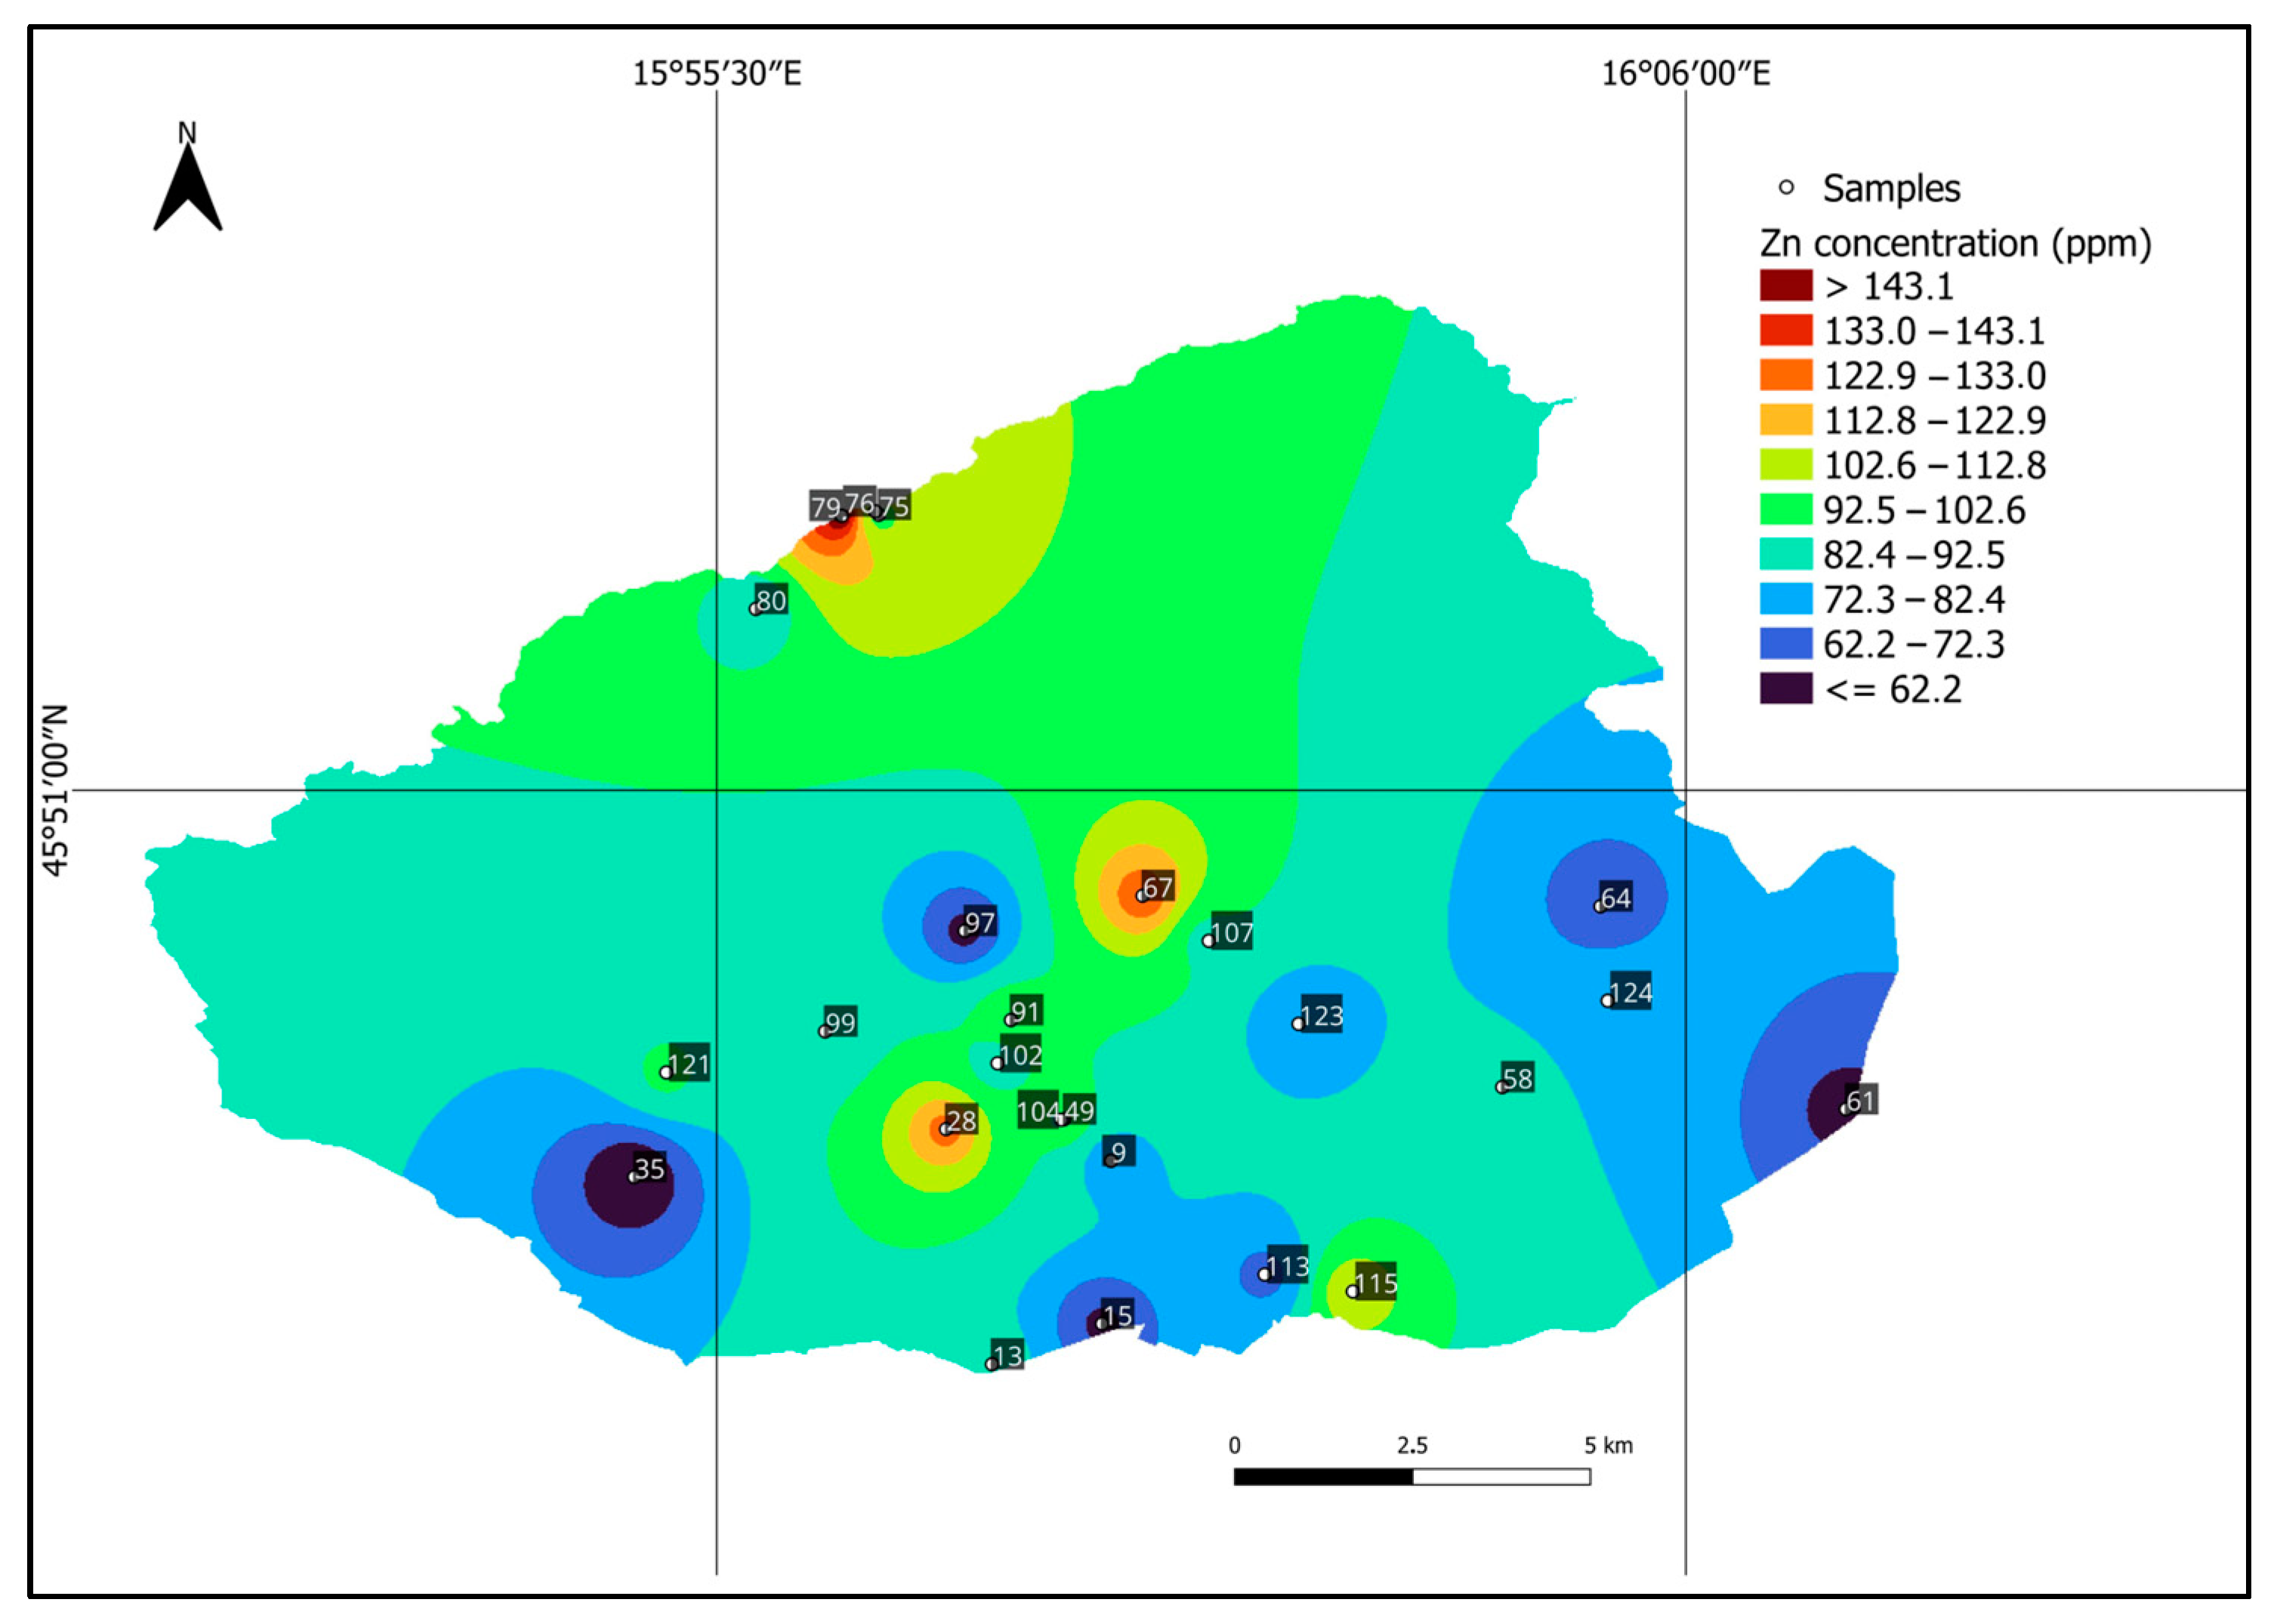
4.3. Element Distribution in Soils of Zagreb Area
4.4. Determination of Correlations between MS and Elements
4.5. Estimation of State of Anthropogenic Pollution of Zagreb, Determination of Average MS Value of Urban Soils and Recommendations for Future
5. Conclusions
- This study was performed to derive the first insights into the distribution of MS in the city of Zagreb and to establish correlations between magnetic parameters and concentrations of heavy metals.
- The median value of 0.245 × 10⁻³ SI units, obtained via in situ measurements, should be used in the future as the average value of MS in Zagreb.
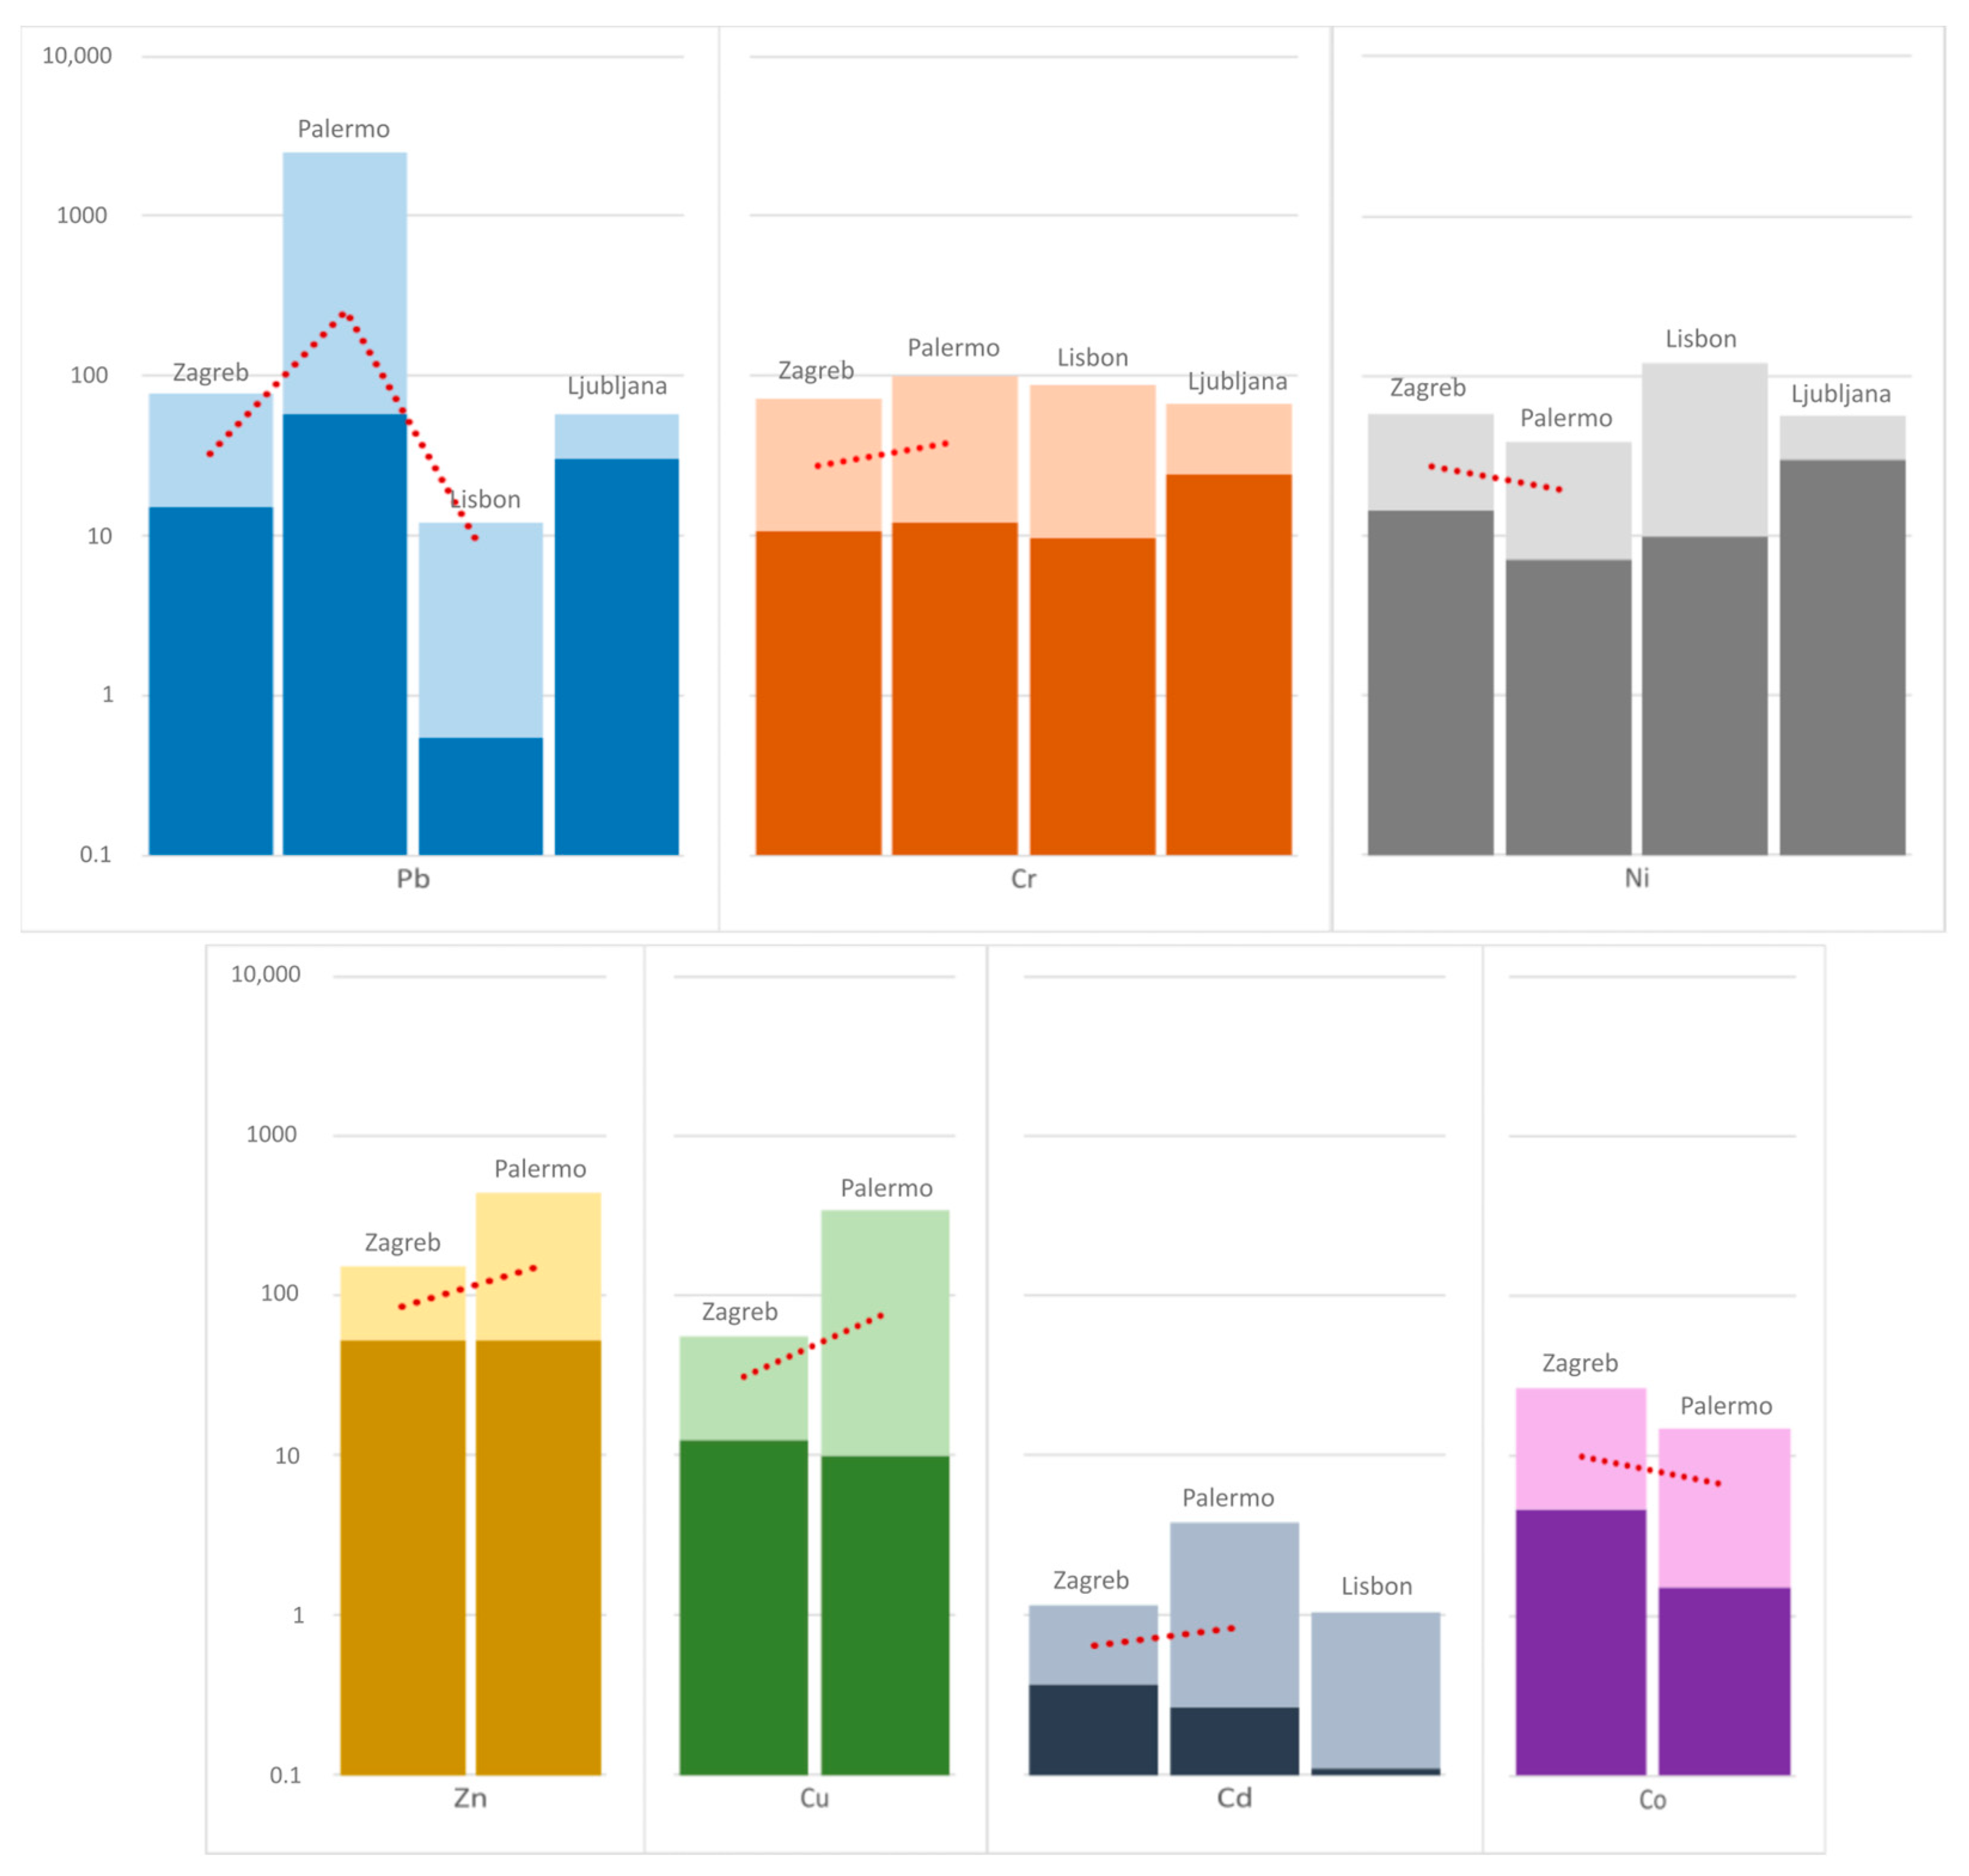
- The mean concentrations of most heavy metals measured in Zagreb (Pb (36.82 µg/g), Zn (87.77 µg/g), Cu (30.84 µg/g), Cd (0.66 µg/g), Cr (29.04), Co (11.89) and Ni (28.40)) are relatively low in comparison with the values set out in the Croatian legislation for agricultural soils, as well as when compared to the values reported for several other cities in Europe and to the world average.
- The boxplot analysis showed that 9 of the 20 elements studied (45% of them) show no anomalies, and most of them have a regular, normal distribution. The elements showing no anomalies include Al, Ca, Cu, Fe, K, Li, Mg, Ni, and Pb. The rest of the elements (As, B, Ba, Cd, Co, Cr, Mn, Na, Sb, Sr, and Zn) mostly showed only one anomaly, among which outliers were the most prevalent.
- The boxplot analysis confirmed that heavy metal anomalies are located at the same sampling points as MS anomalies.
- The correlation analysis between the measured magnetic parameters and the chemical elements analyzed showed a very good correlation, especially for in situ measurements, with values of Cd (0.52), Co (0.54), Fe (0.35), Mn (0.74), Na (0.45), Pb (0.48), Sb (0.63) and Zn (0.75).
- The in situ MS measurements suggest that there is no contamination in some areas where one would expect it (close to industrial areas, landfills, etc.). In the Zagreb city area, we mostly see a geogenic influence driving the changes in MS.
- In situ MS measurements were proven to be a very efficient tool for use in the initial screening of a large area when searching for possible heavy element contamination, thus enabling the cheap and fast assessment of the environmental conditions across the whole of Croatia.
- The proposed methodology, consisting of in situ MS measurements accompanied by sampling on about 20% of locations, on which samples chemical analyses are then performed, could be standardized to enable uniform soil and sediment quality investigations worldwide for heavy metals. In particular, it could be of great benefit to less developed countries, wherein the number of such investigations could be increased due to the much lower costs compared to classical geochemical investigations, with the main goal of increasing environmental quality.
Author Contributions
Funding
Data Availability Statement
Acknowledgments
Conflicts of Interest
Appendix A

| Sample Code | Sample Name | Geographical Coordinates | MS In Situ/Laboratory Measurements (10−3 SI Units) |
|---|---|---|---|
| 1 | Domovinski Most Žitnjak | 45.7740439918759,16.0646237216045 | 0.134 |
| 2 | Domovinski Most—Desna Obala | 45.7674046988826,16.0745809092195 | 0.153 |
| 3 | Sajmišna cesta—istočno od željezničkog mosta | 45.756796267067,16.0492017620444 | 0.172 |
| 4 | Jakuševec—uz ogradu | 45.7617897301369,16.0362761114126 | 0.132 |
| 5 | Jakuševec—uz ogradu preko nasipa | 45.7622696325107,16.0363446304065 | 0.262 |
| 6 | Jakuševec—zapadna strana | 45.7714542709519,16.0200244441544 | 0.135 |
| 7 | Jakuševec—zapadna strana preko nasipa | 45.7718331798484,16.0206753280813 | 0.403 |
| 8 | Most Mladosti južna strana | 45.7821987831065,16.0037965441551 | 0.124 |
| 9 | Bundek—istok * | 45.7830193018431,15.9962064322574 | 0.610/0.171 |
| 10 | Bundek—sredina | 45.7838999603551,15.9930464354659 | 0.649 |
| 11 | Bundek—zapad | 45.7864101071037,15.9841058651128 | 0.170 |
| 12 | Dugave—kod Mamutice | 45.7704076311764,15.9923265221306 | 0.145 |
| 13 | Mala Mlaka—uz vodocrpilište (1) * | 45.7462743121562,15.9747169833504 | 0.265/0.208 |
| 14 | Mala Mlaka—uz vodocrpilište (2) | 45.7458158117247,15.9741739778074 | 0.275 |
| 15 | Bauhaus Buzin * | 45.7535884190359,15.9945891742625 | 0.143/0.094 |
| 16 | Radmanovačka ulica | 45.7700832241245,15.9800396998299 | 0.159 |
| 17 | Park Mladenaca | 45.7746465500553,15.9673445410879 | 0.245 |
| 18 | Park Mladenaca—igralište | 45.7751032381159,15.9671763910422 | 0.130 |
| 19 | Jadranski most—jug | 45.7816941593734,15.95385283141 | 0.250 |
| 20 | Park kod bolnice Blato | 45.7702962415937,15.9319913022756 | 0.154 |
| 21 | Lučko—ispod mosta | 45.7602249116831,15.8976352840539 | 0.393 |
| 22 | Jankomirski most | 45.7935806269139,15.8557617081342 | 0.111 |
| 23 | Podsused most—lijeva obala | 45.8147444165568,15.832490854702 | 0.298 |
| 24 | Dom zdravlja Špansko | 45.8026157149214,15.8956596797069 | 0.154 |
| 25 | Studentski dom SR | 45.7836971448718,15.949668145084 | 0.487 |
| 26 | Studentski dom SR—preko nasipa | 45.7831088570426,15.9501293702797 | 0.557 |
| 27 | Prisavlje—između Kockice i nebodera | 45.7898336898784,15.9668565159461 | 0.363 |
| 28 | Prisavlje—uz Savu (1) * | 45.7887563568321,15.9664180126452 | 1.920/1.133 |
| 29 | Prisavlje—uz Savu (2) | 45.788273653519,15.9650386659405 | 1.320 |
| 30 | Prisavlje (3) | 45.78947905595,15.965193478511 | 0.522 |
| 31 | Klub Jedrenja (1) | 45.7850940879971,15.9109551956364 | 0.128 |
| 32 | Klub Jedrenja (2) | 45.7853682681368,15.9099933080156 | 0.122 |
| 33 | Bejzbol Klub Jarun Uz Savu (1) | 45.7786274233417,15.9071087533958 | 0.184 |
| 34 | Bejzbol Klub Jarun Uz Savu (2) | 45.7787906539309,15.9072969096575 | 0.165 |
| 35 | Bejzbol Klub Jarun Uz Savu (3) * | 45.7801066807969,15.9101155889901 | 0.135/0.099 |
| 36 | Beach Bar Jarun | 45.7809718414207,15.9113074612978 | 0.154 |
| 37 | Kanu Klub Končar | 45.7784918701123,15.9236021302682 | 0.113 |
| 38 | Kanu Klub Končar (2) livada | 45.7785522055982,15.9224291015104 | 0.191 |
| 39 | Sava uz Malo jezero (1) | 45.7750205542008,15.9377868606528 | 0.166 |
| 40 | Sava uz Malo jezero (2) | 45.7752701022045,15.9373544410025 | 0.124 |
| 41 | Sava uz Malo jezero (3) | 45.7762136901334,15.9370593778734 | 0.173 |
| 42 | Aquarius klub | 45.7775885288217,15.9371615960587 | 0.188 |
| 43 | Potok Črnomerec (1) | 45.7818410885191,15.9395530439582 | 0.216 |
| 44 | Potok Črnomerec (2) | 45.781652000251,15.9393982757416 | 0.345 |
| 45 | Šuma uz potok Črnomerec | 45.7815276611746,15.9401798570782 | 0.248 |
| 46 | Beach Champ Jarun | 45.7810855242149,15.9334304834393 | 0.185 |
| 47 | IRB | 45.8295539829427,15.9885922853691 | 0.236 |
| 48 | Trnjanski nasip (1) | 45.7907795593901,15.989418541487 | 0.269 |
| 49 | Trnjanski nasip (2) * | 45.7905337201412,15.9877194091573 | 1.099/0.410 |
| 50 | Trnjanski nasip—uz Savu | 45.7894111411263,15.9876947623034 | 0.177 |
| 51 | Trnjanski nasip (3) | 45.7897506796707,15.9878386872978 | 0.175 |
| 52 | Petlja na Slavonskoj aveniji | 45.7949043519747,15.9985295899873 | 0.310 |
| 53 | NK Croatia Savica -uz Savu (1) | 45.7869301745477,15.9987511612843 | 0.137 |
| 54 | NK Croatia Savica -uz Savu (2) | 45.7873074549235,15.9988529488188 | 0.215 |
| 55 | NK Croatia Savica -uz Savu (3) | 45.7879704748768,15.9986244868195 | 0.448 |
| 56 | Džamija Borovje | 45.7909066922319,16.010126155733 | 0.421 |
| 57 | Bauhaus Žitnjak—spremište Čistoće | 45.795090534933,16.0522047747407 | 0.223 |
| 58 | Janaf Terminal Žitnjak * | 45.7963635020115,16.0668635105983 | 0.542/0.437 |
| 59 | Pročišćivač otpadnih voda | 45.7944971923019,16.0792669788523 | 0.183 |
| 60 | Ivanjorečka cesta | 45.7997428089496,16.1080182735642 | 0.082 |
| 61 | Autocesta petlja Hrušćica * | 45.7923624810942,16.1289417187834 | 0.125/0.107 |
| 62 | Sesvete—ulica Blage Zadre | 45.8266542930915,16.1264660690146 | 0.141 |
| 63 | Sesvete—livada pored škole | 45.8333274377861,16.1047794554278 | 0.202 |
| 64A | Mikuševa ulica—Dubec, 0-2 cm * | 45.8290197790321,16.0846014842222 | 0.054/0.052 |
| 64B | Mikuševa ulica—Dubec, 2-4 cm * | 45.8290197790321,16.0846014842222 | 0.054/0.054 |
| 65 | Grad Mladih | 45.8502332704355,16.0486783087879 | 0.240 |
| 66 | Markuševec | 45.8796577000474,16.0224982866012 | 0.357 |
| 67 | Jaruga Rebar Kozjak (1) * | 45.8309304456805,16.0019013715374 | 0.505/0.349 |
| 68 | Jaruga Rebar Kozjak (2) | 45.8311316923503,16.0019578417402 | 0.381 |
| 69 | Barutana Ambulanta | 45.830298022013,16.0003100063588 | 0.704 |
| 70 | Radićevo šetalište | 45.8299267617057,15.9789251453309 | 0.452 |
| 71 | Mihaljevac (Šuma) | 45.8410611257105,15.9762674617809 | 0.314 |
| 72 | Mihaljevac (Livada) | 45.8409545836944,15.9758714311076 | 0.171 |
| 73 | Bliznec | 45.8692829898902,15.9788763017586 | 0.362 |
| 74 | Adolfovac | 45.8817654556618,15.971492964021 | 0.679 |
| 75 | Činovnička livada—donji dio—šuma * | 45.899776961168,15.9542611013382 | 1.848/1.343 |
| 76 | Činovnička livada—dno (2) * | 45.9003829526604,15.9536296894939 | 1.890/0.387 |
| 77 | Hunjka—Sjeverna padina | 45.91287765, 15.97204607 | 0.201 |
| 78 | Sljeme—vrh (šuma) | 45.8996025441563,15.9489672898962 | 1.873 |
| 79 | Sljeme Vrh—livada * | 45.8995911580052,15.9475478174519 | 3.027/2.423 |
| 80 | Crkva Sv. Jakov * | 45.8827660820915,15.9320763181073 | 0.489/0.341 |
| 81 | Medvedgrad | 45.8749433988795,15.9397800238047 | 0.247 |
| 82 | Šestine | 45.8571843417814,15.9486809780265 | 0.151 |
| 83 | Groblje Gornje Vrapče | 45.8266002015263,15.9073627455591 | 0.089 |
| 84 | Livada Gorenci | 45.84026938, 15.91193877 | 0.095 |
| 85 | Šalata Livada | 45.8172538901291,15.9835428187165 | 0.108 |
| 86 | Ribnjak | 45.8159532277393,15.9807901895536 | 0.260 |
| 87 | Ribnjak (2) | 45.815320650954,15.9815977932001 | 0.286 |
| 88 | Javni Wc—livada | 45.8133675983546,15.9788184221939 | 0.372 |
| 89 | Zrinjevac | 45.8108508502514,15.9783604621421 | 0.472 |
| 90 | Zrinjevac (2) | 45.8097653623494,15.9781230138765 | 0.469 |
| 91 | Strossmayerov Trg * | 45.8084638970296,15.9781433068071 | 0.729/0,409 |
| 92 | Tomislavac | 45.8068231503416,15.9783594968143 | 0.239 |
| 93 | Cmrok Livada (1) | 45.8357858085536,15.9720231989523 | 0.304 |
| 94 | Cmrok Šuma | 45.8355394958674,15.9709901723723 | 0.319 |
| 95 | Cmrok Livada (2) | 45.8358960003264,15.9730086646345 | 0.352 |
| 96 | Tuškanac—šuma | 45.8244339310412,15.9690668982057 | 0.281 |
| 97 | Tuškanac—livada * | 45.8245872401338,15.969796949185 | 0.220/0.202 |
| 98 | Trg Dr. Franje Tuđmana | 45.8105932741351,15.9555789537231 | 0.233 |
| 99 | Park Pravednika među narodima—jaruga * | 45.806420820498,15.9445828324816 | 0.878/0.883 |
| 100 | Park Pravednika—višlje od jaruge | 45.8068482552254,15.9442174534753 | 0.782 |
| 101 | Poglavarstvo grada Zagreba | 45.8007451874247,15.9764039623233 | 0.378 |
| 102 | Poglavarstvo grada Zagreba (2) * | 45.8006493678313,15.9757123995982 | 0.750/0.307 |
| 103 | Trnjanski nasip—most Slobode Sjeverna strana | 45.7908131003426,15.9821906196011 | 0.170 |
| 104 | Šire područje oko Ustave Kunišćak * | 45.7904523086803,15.9872517164222 | 0.232/0.149 |
| 105 | Maksimir (1) oko crkve Sv. Jurja | 45.8247877135216,16.02510956668 | 0.140 |
| 106 | Maksimir (2) Bukovačka—zapad | 45.8226922910388,16.0136379971368 | 0.476 |
| 107 | Potok u Maksimiru blizu Bukovačke * | 45.8227843572939,16.0138624328225 | 0.727/0.319 |
| 108 | Barutana—jaruga spoj | 45.8307385076353,16.0050223679232 | 0.272 |
| 109 | Barutana—Križanje Tučanove i Salopekove ulice | 45.8295679372952,16.0042876216259 | 0.281 |
| 110 | Jakuševec Zapad 1 | 45.7639685124364,16.0201527031963 | 0.275 |
| 111 | Jakuševec Zapad 2 | 45.7640265632125,16.0185065326186 | 0.085 |
| 112 | Jakuševec Sredina 1 | 45.7618346258767,16.0231848000554 | 0.152 |
| 113 | Jakuševec Sredina 2 * | 45.7624959067962,16.023948068522 | 0.180/0.112 |
| 114 | Jakuševec Istok 1 | 45.7552667080561,16.0301438022254 | 0.227 |
| 115 | Jakuševec Istok 2 * | 45.7594193882746,16.039880584166 | 0.223/0.321 |
| 116 | Petina—kraj aerodroma | 45.7543014786061,16.086694405318 | 0.066 |
| 117 | Zelena Magistrala | 45.8374880265475,15.8829942804282 | 0.158 |
| 118 | Zelena Magistrala 2 | 45.8252727590539,15.8732968793435 | 0.225 |
| 119 | Gajnice Park | 45.8161784451918,15.8739764208085 | 0.300 |
| 120 | Vrapče—blizu bolnice | 45.8127733323109,15.8973861147384 | 0.470 |
| 121 | Grubišnopoljski put—Rudeš * | 45.7989998655385,15.9158978041369 | 0.507/0.248 |
| 122 | Savica | 45.7820387895255,16.0219886767542 | 0.321 |
| 123 | Borongaj cesta-šuma * | 45.8077755773537,16.0300792820734 | 0.639/0.483 |
| 124a | Novi Jelkovec, 0-2 cm * | 45.8119603937189,16.0858977873957 | 0.089/0.066 |
| 124b | Novi Jelkovec, 15-25 cm * | 45.8119603937189,16.0858977873957 | 0.089/0.074 |
| 125 | Gornja Dubrava | 45.8326561893296,16.044362686839 | 0.277 |
Appendix B
| Locality | Distance |
|---|---|
| Bundek—istok | 0.028480 |
| Bundek—sredina | 0.010520 |
| Studentski dom SR | 0.151480 |
| Studentski dom SR—preko nasipa | 0.081480 |
| Prisavlje—uz Savu (2) | 0.681520 |
| Prisavlje (3) | 0.116480 |
| Trnjanski nasip (2) | 0.460520 |
| NK Croatia Savica -uz Savu (3) | 0.190480 |
| Janaf Terminal Žitnjak | 0.096480 |
| Jaruga Rebar Kozjak (1) | 0.133480 |
| Barutana Ambulanta | 0.065520 |
| Radićevo šetalište | 0.186480 |
| Adolfovac | 0.040520 |
| Crkva Sv. Jakov | 0.149480 |
| Zrinjevac | 0.166480 |
| Zrinjevac (2) | 0.169480 |
| Strossmayerov Trg | 0.090520 |
| Park Pravednika među narodima—jaruga | 0.239520 |
| Park Pravednika—višlje od jaruge | 0.143520 |
| Poglavarstvo grada Zagreba (2) | 0.111520 |
| Maksimir (2) Bukovačka—zapad | 0.162480 |
| Potok u Maksimiru blizu Bukovačke | 0.088520 |
| Vrapče—blizu bolnice | 0.168480 |
| Grubišnopoljski put—Rudeš | 0.131480 |
| Borongaj | 0.000520 |
| Locality | Distance |
|---|---|
| Prisavlje—uz Savu (1) | 0.191600 |
| Činovnička livada—donji dio | 0.263600 |
| Činovnička livada—dno (2) | 0.221600 |
| Sljeme—vrh (šuma) | 0.238600 |
| Sljeme vrh—livada | 0.915400 |
| Locality | Distance |
|---|---|
| Domovinski most Žitnjak | 0.078526 |
| Domovinski most—Desna obala | 0.059526 |
| Sajmišna cesta—istočno od željezničkog mosta | 0.040526 |
| Jakuševec—uz ogradu | 0.080526 |
| Jakuševec—uz ogradu preko nasipa | 0.049474 |
| Jakuševec—zapadna strana | 0.077526 |
| Jakuševec—zapadna strana preko nasipa | 0.190474 |
| Most Mladosti južna strana | 0.088526 |
| Bundek—zapad | 0.042526 |
| Dugave—kod Mamutice | 0.067526 |
| Mala Mlaka—uz vodocrpilište (1) | 0.052474 |
| Mala Mlaka—uz vodocrpilište (2) | 0.062474 |
| Bauhaus Buzin | 0.069526 |
| Park Mladenaca | 0.032474 |
| Park Mladenaca—igralište | 0.082526 |
| Radmanovačka ulica | 0.053526 |
| Jadranski most—jug | 0.037474 |
| Park kod bolnice Blato | 0.058526 |
| Lučko—ispod mosta | 0.180474 |
| Jankomirski most | 0.101526 |
| Podsused most—lijeva obala | 0.085474 |
| Dom zdravlja Špansko | 0.058526 |
| Prisavlje—između Kockice i nebodera | 0.150474 |
| Klub Jedrenja (1) | 0.084526 |
| Klub Jedrenja (2) | 0.090526 |
| Bejzbol Klub Jarun Uz Savu (1) | 0.028526 |
| Bejzbol Klub Jarun Uz Savu (2) | 0.047526 |
| Bejzbol Klub Jarun Uz Savu (3) | 0.077526 |
| Beach Bar Jarun | 0.058526 |
| Kanu Klub Končar (1) | 0.099526 |
| Kanu Klub Končar (2) livada | 0.021526 |
| Sava uz Malo jezero (1) | 0.046526 |
| Sava uz Malo jezero (2) | 0.088526 |
| Sava uz Malo jezero (3) | 0.039526 |
| Aquarius klub | 0.024526 |
| Potok Črnomerec (1) | 0.003474 |
| Potok Črnomerec (2) | 0.132474 |
| Šuma uz potok Črnomerec | 0.035474 |
| Beach Champ bar Jarun | 0.027526 |
| IRB | 0.023474 |
| Trnjanski nasip (1) | 0.056474 |
| Trnjanski nasip—uz Savu | 0.035526 |
| Trnjanski nasip (3) | 0.037526 |
| Petlja na Slavonskoj aveniji | 0.097474 |
| NK Croatia Savica -uz Savu (1) | 0.075526 |
| NK Croatia Savica -uz Savu (2) | 0.002474 |
| Džamija Borovje | 0.208474 |
| Bauhaus Žitnjak—spremište Čistoće | 0.010474 |
| Pročišćivač otpadnih voda | 0.029526 |
| Ivanjorečka cesta | 0.130526 |
| Autocesta petlja Hrušćica | 0.087526 |
| Sesvete—ulica Blage Zadre | 0.071526 |
| Sesvete—livada pored škole | 0.010526 |
| Mikuševa ulica—Dubec | 0.158526 |
| Grad Mladih | 0.027474 |
| Markuševec | 0.144474 |
| Jaruga Rebar Kozjak (2) | 0.168474 |
| Mihaljevac (Šuma) | 0.101474 |
| Mihaljevac (Livada) | 0.041526 |
| Bliznec | 0.149474 |
| Hunjka—Sjeverna padina | 0.011526 |
| Medvedgrad | 0.034474 |
| Šestine | 0.061526 |
| Groblje Gornje Vrapče | 0.123526 |
| Livada Gorenci | 0.117526 |
| Šalata Livada | 0.104526 |
| Ribnjak | 0.047474 |
| Ribnjak (2) | 0.073474 |
| Javni Wc—livada | 0.159474 |
| Tomislavac | 0.026474 |
| Cmrok Livada (1) | 0.091474 |
| Cmrok Šuma | 0.106474 |
| Cmrok Livada (2) | 0.139474 |
| Tuškanac—šuma | 0.068474 |
| Tuškanac—livada | 0.007474 |
| Trg Dr. Franje Tuđmana | 0.020474 |
| Poglavarstvo grada Zagreba | 0.165474 |
| Trnjanski nasip—most Slobode Sjev. | 0.042526 |
| Šire područje oko Ustave Kunišćak | 0.019474 |
| Maksimir (1) oko crkve Sv. Jurja | 0.072526 |
| Barutana—jaruga spoj | 0.059474 |
| Barutana—Križanje Tučanove i Salopekove | 0.068474 |
| Jakuševec Zapad 1 | 0.062474 |
| Jakuševec Zapad 2 | 0.127526 |
| Jakuševec Sredina 1 | 0.060526 |
| Jakuševec Sredina 2 | 0.032526 |
| Jakuševec Istok 1 | 0.014474 |
| Jakuševec Istok 2 | 0.010474 |
| Petina—kraj aerodroma | 0.146526 |
| Zelena Magistrala | 0.054526 |
| Zelena Magistrala 2 | 0.012474 |
| Gajnice Park | 0.087474 |
| Savica | 0.108474 |
| Gornja Dubrava | 0.064474 |
| Novi Jelkovec | 0.123526 |
Appendix C
References
- Thompson, R.; Oldfield, F. Environmental Magnetism; Allen & Unwin: London, UK, 1986. [Google Scholar]
- Oldfield, F.; Hunt, A.; Jones, M.D.H.; Chester, R.; Dearing, J.A.; Olsson, L.; Prospero, J.M. Magnetic differentiation of atmospheric dusts. Nature 1985, 317, 516–518. [Google Scholar] [CrossRef]
- Hay, K.L.; Dearing, J.A.; Baban, S.M.J.; Loveland, P. A preliminary attempt to identify atmospherically derived pollution particles in English topsoils from magnetic susceptibility measurements. Phys. Chem. Earth 1997, 22, 207–210. [Google Scholar] [CrossRef]
- Heller, F.; Strzyszcz, Z.; Magiera, T. Magnetic record of industrial pollution in forest soils of Upper Silesia, Poland. J. Geophys. Res. 1998, 103, 17767–17774. [Google Scholar] [CrossRef]
- Scholger, R. Heavy metal pollution monitoring by magnetic susceptibility measurements applied to sediments of the river Mur (Styria, Austria). Eur. J. Environ. Eng. Geophys. 1998, 3, 25–37. [Google Scholar]
- Plater, A.J.; Ridgeway, J.; Appleby, P.G.; Berry, A.; Wright, M.R. Historical contaminant fluxes in the Tees estuary, UK. Mar. Pollut. Bull. 1998, 37, 343–360. [Google Scholar] [CrossRef]
- Kapička, A.; Petrovský, E.; Ustjak, S.; Macháčková, K. Proxy mapping of fly ash pollution of soils around a coal-burning power plant. J. Geochem. Explor. 1999, 66, 291–297. [Google Scholar] [CrossRef]
- Strzyszcz, Z. Magnetic Susceptibility of Soils in the Areas Influenced by Industrial Emissions. In Soil Monitoring; Schulin, R., Ed.; Birkhäuser: Basel, Switzerland, 1993; pp. 255–269. [Google Scholar]
- Strzyszcz, Z.; Magiera, T.; Heller, F. The influence of industrial emissions on the magnetic susceptibility of soils in Upper Silesia. Stud. Geophys. Geod. 1996, 40, 276–286. [Google Scholar] [CrossRef]
- Hanesch, M.; Scholger, R. Monitoring of heavy metal loadings in soils by means of magnetic susceptibility measurements. Environ. Geol. 2002, 42, 857–870. [Google Scholar] [CrossRef]
- Petrovský, E.; Ellwood, B. Magnetic monitoring of air- land- and water-pollution. In Quaternary Climates, Environments and Magnetism; Maher, B., Thompson, R., Eds.; Cambridge University Press: Cambridge, UK, 1999; pp. 279–322. [Google Scholar]
- Wang, X.S.; Qin, Y. Correlation between magnetic susceptibility and heavy metals in urban topsoil: A case study from the city of Xuzhou, China. Environ. Geol. 2005, 49, 10–18. [Google Scholar] [CrossRef]
- Lu, S.G.; Bai, S.Q. Magnetic characterization and magnetic mineralogy of the Hangzhou urban soils and its environmental implications. Chin. J. Geophys. 2008, 51, 549–557. [Google Scholar] [CrossRef]
- Lu, S.G.; Wang, H.; Guo, J. Magnetic response of heavy metals pollution in urban soils: Magnetic proxy parameters as an indicator of heavy metals pollution. In Proceedings of the 19th World Congress of Soil Science, Soil Solutions for a Changing World, Brisbane, Australia, 1–6 August 2010. [Google Scholar]
- El Baghdadi, M.; Barakat, A.; Sajieddine, M.; Nadem, S. Heavy metal pollution and soil magnetic susceptibility in urban soil of Beni Mellal City (Morocco). Environ. Earth Sci. 2012, 66, 141–155. [Google Scholar] [CrossRef]
- Frančišković-Bilinski, S. Detection of coal combustion products in stream sediments by chemical analysis and magnetic susceptibility measurements. Min. Mag. 2008, 72, 43–48. [Google Scholar] [CrossRef]
- Frančišković-Bilinski, S.; Bilinski, H.; Scholger, R.; Tomašić, N.; Maldini, K. Magnetic spherules in sediments of the sinking karstic Dobra River (Croatia). J. Soils Sediments 2014, 14, 600–614. [Google Scholar] [CrossRef]
- Frančišković-Bilinski, S.; Bilinski, H.; Maldini, K.; Milović, S.; Zhang, Q.; Appel, E. Chemical and magnetic tracing of coal slag pollutants in karstic river sediments. Environ. Earth Sci. 2017, 76, 476. [Google Scholar] [CrossRef]
- Hasan, O.; Miko, S.; Ilijanić, N.; Ivkić Filipović, I.; Steinberger, A.; Marjanović, H.; Grahovac, B. Spatial variability of soil magnetic susceptibility across Croatia. In Proceedings of the 13. Kongres Hrvatskog Tloznanstvenog Društva, Vukovar, Croatia, 10–14 September 2018. [Google Scholar]
- Sollitto, D.; Romić, M.; Castrignanò, A.; Romić, D.; Bakić, H. Assessing heavy metal contamination in soils of the Zagreb region (Northwest Croatia) using multivariate geostatistics. Catena 2010, 80, 182–194. [Google Scholar] [CrossRef]
- Zhao, P.; Fallu, D.J.; Pears, B.R.; Allonsius, C.; Lembrechts, J.J.; Van de Vondel, S.; Meysman, F.J.R.; Cucchiaro, S.; Tarolli, P.; Shi, P.; et al. Quantifying soil properties relevant to soil organic carbon biogeochemical cycles by infrared spectroscopy: The importance of compositional data analysis. Soil Tillage Res. 2023, 231, 105718. [Google Scholar] [CrossRef]
- Golik, V.I.; Klyuev, R.V.; Martyushev, N.V.; Brigida, V.; Efremenkov, E.A.; Sorokova, S.N.; Qi, M. Tailings utilization and zinc extraction based on Mechanochemical Activation. Materials 2023, 16, 726. [Google Scholar] [CrossRef]
- Shi, Y.L.; He, J.; Yang, X.; Zhou, W.; Wang, J.; Li, X.; Liu, C. Sorption of U(VI) onto natural soils and different mineral compositions: The batch method and spectroscopy analysis. J. Environ. Radioact. 2019, 203, 163–171. [Google Scholar] [CrossRef]
- Wikipedia (2023a) Zagreb. Wikimedia Foundation. Last Modified 28 June 2023, 21:28. Available online: https://hr.wikipedia.org/wiki/Zagreb (accessed on 4 July 2023).
- Mišur, I.; Balen, D.; Klötzli, U.; Belak, M.; Massonne, H.-J.; Brlek, M.; Brčić, V. Petrochronological study of chloritoid schist from Medvednica Mountain (Zagorje Mid-Transdanubian zone, Croatia). Geol. Croat. 2023, 76, 13–36. [Google Scholar] [CrossRef]
- Šikić, K. Geološki vodič Medvednice; Institut za Geološka Istraživanja, INA-Industrija Nafte: Zagreb, Croatia, 1995. [Google Scholar]
- Hrvatski Geološki Institut. Geološka karta Republike Hrvatske M 1:300.000; Zavod za Geologiju: Zagreb, Croatia, 2009. [Google Scholar]
- Wikipedia (2023b) Zagreb Climate. Wikimedia Foundation. Last Modified 26 June 2023, 20:59. Available online: https://en.wikipedia.org/wiki/Zagreb#Climate (accessed on 4 July 2023).
- de Andrade Passos, E.; Alves, J.C.; dos Santos, I.S.; Jose do Patrocínio, H.A.; Garcia, C.A.B.; Costa, A.C.S. Assessment of trace metals contamination in estuarine sediments using a sequential extraction technique and principal component analysis. Microchem 2010, 96, 50–57. [Google Scholar] [CrossRef]
- Sakan, S.; Popović, A.; Anđelković, I.; Đorđević, D. Aquatic Sediments Pollution Estimate Using the Metal Fractionation, Secondary Phase Enrichment Factor Calculation, and Used Statistical Methods. Environ. Geochem. Health 2016, 38, 855–867. [Google Scholar] [CrossRef] [PubMed]
- StatSoft. Statistica, Data Analysis Software System, version 6; StatSoft GmbH: Hamburg, Germany, 2001.
- Reimann, C.; Filzmoser, P.; Garrett, R.G. Background and threshold: Critical comparison of methods of determination. Sci. Total Environ. 2005, 346, 1–16. [Google Scholar] [CrossRef] [PubMed]
- Tukey, J.W. Exploratory Data Analysis; Addison-Wesley: Reading, MA, USA, 1977. [Google Scholar]
- Kaufman, L.; Rousseeuw, P.J. Finding Groups in Data: An Introduction to Cluster Analysis; Wiley Series in Probability and Statistics: Hoboken, NJ, USA; John Wiley & Sons: Hoboken, NJ, USA, 1990. [Google Scholar]
- Rubinić, V.; Ilijanić, N.; Magdić, I.; Bensa, A.; Husnjak, S.; Krklec, K. Plasticity, Mineralogy, and WRB Classification of Some Typical Clay Soils along the Two Major Rivers in Croatia. Eurasian. Soil Sci. 2020, 53, 922–940. [Google Scholar] [CrossRef]
- WHO. World Health Organization & International Programme on Chemical Safety Boron; World Health Organization: Geneva, Switzerland, 1998; Available online: https://apps.who.int/iris/handle/10665/42046 (accessed on 22 June 2023).
- Schreiber, M.E.; Cozzarelli, I.M. Arsenic release to the environment from hydrocarbon production, storage, transportation, use and waste management. J. Hazard Mater. 2021, 411, 125013. [Google Scholar] [CrossRef]
- Sun, G.T.; Zhou, J.X. Application of Machine Learning Algorithms to Classification of Pb–Zn Deposit Types Using LA–ICP–MS Data of Sphalerite. Minerals 2022, 12, 1293. [Google Scholar] [CrossRef]
- Manta, D.S.; Angelone, M.; Bellanca, A.; Neri, R.; Sprovieri, M. Heavy metals in urban soils: A case study from the city of Palermo (Sicily), Italy. Sci. Total Environ. 2002, 300, 229–243. [Google Scholar] [CrossRef]
- Silva, H.F.; Silva, N.F.; Oliveira, C.M.; Matos, M.J. Heavy Metals Contamination of Urban Soils-A Decade Study in the City of Lisbon, Portugal. Soil Syst. 2021, 5, 27. [Google Scholar] [CrossRef]
- NN. Pravilnik o Zaštiti Poljoprivrednog Zemljišta od Onečišćenja. Narodne Novine. 2014. Available online: https://narodne-novine.nn.hr/clanci/sluzbeni/full/2014_01_9_167.html (accessed on 22 June 2023).


| Valid N | Mean | Median | Sum | Minimum | Maximum | Range | Variance | Std. Dev. | |
|---|---|---|---|---|---|---|---|---|---|
| MS | 125 | 0.373680 | 0.245000 | 46.71000 | 0.054000 | 3.027000 | 2.973000 | 0.178747 | 0.422785 |
| Cluster—No. 1 | Cluster—No. 2 | Cluster—No. 3 | |
|---|---|---|---|
| MS | 0.638480 | 2.111600 | 0.212526 |
| . | No. 1 | No. 2 | No. 3 |
|---|---|---|---|
| No. 1 | 0.000000 | 2.170083 | 0.181437 |
| No. 2 | 1.473120 | 0.000000 | 3.606481 |
| No. 3 | 0.425954 | 1.899074 | 0.000000 |
| Valid N | Mean | Median | Sum | Minimum | Maximum | Range | Variance | Std. Dev. | |
|---|---|---|---|---|---|---|---|---|---|
| MS-Lab | 25 | 0.442120 | 0.319000 | 11.05300 | 0.052000 | 2.423000 | 2.371000 | 0.272685 | 0.522193 |
| Cluster No. 1 | Cluster No. 2 | Cluster No. 3 | |
|---|---|---|---|
| MS-Lab | 1.633000 | 0.422364 | 0.137091 |
| No. 1 | No. 2 | No. 3 | |
|---|---|---|---|
| No. 1 | 0.000000 | 1.465640 | 2.237744 |
| No. 2 | 1.210636 | 0.000000 | 0.081381 |
| No. 3 | 1.495909 | 0.285273 | 0.000000 |
| Locality | Distance |
|---|---|
| Činovnička livada—donji dio šuma | 0.290000 |
| Prisavlje uz Savu (1) | 0.500000 |
| Sljeme vrh—livada | 0.790000 |
| Locality | Distance |
|---|---|
| Borongaj cesta-šuma | 0.060636 |
| Crkva Sv. Jakov | 0.081364 |
| Činovnička livada—dno (2) | 0.035364 |
| Poglavarstvo grada Zagreba (2) | 0.115364 |
| Jakuševec istok (2) | 0.101364 |
| JANAF terminal Žitnjak | 0.014636 |
| Jaruga Rebar—Kozjak (1) | 0.073364 |
| Maksimir blizu Bukovačke | 0.103364 |
| Park pravednika među narodima. jaruga | 0.460636 |
| Strossmayerov trg | 0.013364 |
| Trnjanski nasip (2) | 0.012364 |
| Locality | Distance |
|---|---|
| Autocesta. petlja Hrušćica | 0.030091 |
| Bauhaus Buzin | 0.043091 |
| Bejzbol klub Jarun uz Savu (3) | 0.038091 |
| Bundek istok | 0.033909 |
| Grubišnopoljski put—Rudeš | 0.110909 |
| Jakuševec sredina (2) | 0.025091 |
| Mala Mlaka uz vodocrpilište (1) | 0.070909 |
| Mikuševa—Dubec. 0–2 cm | 0.085091 |
| Novi Jelkovec 0–2 cm | 0.071091 |
| Šire područje oko ustave Kunišćak | 0.011909 |
| Tuškanac. livada | 0.064909 |
| Sample Name | Element | Al | As | B | Ba | Ca | Cd | Co | Cr | Cu | Fe | K | Li | Mg | Mn | Na | Ni | Pb | Sb | Sr | Zn |
|---|---|---|---|---|---|---|---|---|---|---|---|---|---|---|---|---|---|---|---|---|---|
| Autocesta petlja Hrušćica | 7107 | 3.70 | 1.95 | 55.0 | 63,370 | 0.39 | 5.76 | 14.05 | 17.14 | 15,567 | 936 | 13.52 | 13,584 | 444 | 22.75 | 19.37 | 15.21 | 1.22 | 49.46 | 59.7 | |
| Bauhaus Buzin | 8865 | 4.94 | 3.76 | 57.3 | 65,982 | 0.50 | 8.29 | 17.28 | 20.55 | 19,513 | 1079 | 18.63 | 15,449 | 627 | 17.34 | 26.98 | 17.82 | 1.30 | 42.32 | 60.0 | |
| Bejzbol Klub Jarun Uz Savu (3) | 5561 | 2.45 | 2.06 | 40.7 | 58,844 | 0.38 | 4.73 | 10.75 | 14.22 | 13,453 | 946 | 10.95 | 13,776 | 442 | 7.27 | 14.89 | 15.45 | 0.88 | 32.17 | 52.1 | |
| Borongaj cesta-šuma | 14,757 | 9.08 | 1.34 | 46.4 | 6024 | 0.57 | 18.97 | 34.02 | 44.94 | 32,471 | 1311 | 25.97 | 5125 | 766 | 5.65 | 38.11 | 20.79 | 4.20 | 13.71 | 73.1 | |
| Bundek-istok | 11,806 | 3.18 | 3.14 | 93.8 | 24,978 | 0.57 | 18.27 | 36.81 | 34.82 | 26,024 | 1520 | 14.28 | 9175 | 665 | 7.06 | 30.52 | 21.93 | 3.86 | 26.83 | 73.3 | |
| Crkva Sv. Jakov | 16,895 | 1.61 | 0.77 | 79.4 | 7073 | 0.86 | 23.51 | 71.53 | 54.73 | 25,735 | 626 | 15.28 | 6947 | 861 | 2.55 | 41.04 | 68.82 | 6.00 | 18.41 | 85.4 | |
| Činovnička livada—donji dio—šuma | 19,627 | 2.42 | 1.46 | 53.1 | 4609 | 0.93 | 23.42 | 49.14 | 33.31 | 30,134 | 726 | 17.93 | 5051 | 1334 | 8.64 | 26.99 | 43.93 | 6.71 | 16.29 | 92.5 | |
| Činovnička livada—dno (2) | 17,985 | 2.84 | 1.37 | 70.0 | 2660 | 1.16 | 11.86 | 24.86 | 31.13 | 25,659 | 897 | 25.61 | 4984 | 1519 | 23.16 | 18.41 | 67.00 | 2.50 | 9.08 | 110.7 | |
| Poglavarstvo grada Zagreba (2) | 8922 | 4.92 | 3.24 | 83.2 | 49,963 | 0.54 | 9.09 | 21.00 | 28.11 | 17,905 | 960 | 15.37 | 13,560 | 577 | 28.42 | 23.81 | 42.98 | 1.98 | 31.97 | 87.7 | |
| Grubišnopoljski put—Rudeš | 10,857 | 5.44 | 4.01 | 80.8 | 35,585 | 0.56 | 9.71 | 22.55 | 36.74 | 22,132 | 992 | 16.81 | 10,786 | 587 | 10.19 | 28.28 | 32.56 | 2.13 | 23.85 | 94.5 | |
| Jakuševec Istok (2) | 6730 | 3.76 | 3.85 | 56.4 | 60,186 | 0.38 | 7.68 | 16.53 | 18.06 | 16,171 | 917 | 10.44 | 11,971 | 425 | 20.28 | 17.33 | 20.30 | 1.78 | 43.66 | 110.4 | |
| Jakuševec Sredina (2) | 5147 | 3.12 | 1.24 | 92.8 | 82,694 | 0.37 | 4.58 | 15.37 | 17.11 | 12,038 | 787 | 12.26 | 14,452 | 331 | 20.10 | 14.24 | 42.99 | 1.63 | 42.63 | 69.0 | |
| Janaf Terminal Žitnjak | 2929 | 1.53 | 0.91 | 54.5 | 60,634 | 0.44 | 9.63 | 14.25 | 12.52 | 9770 | 325 | 5.70 | 12,988 | 211 | 13.03 | 46.20 | 45.20 | 1.09 | 32.42 | 85.8 | |
| Jaruga Rebar—Kozjak (1) | 15,450 | 4.75 | 7.35 | 135.4 | 9418 | 0.75 | 12.14 | 29.20 | 45.63 | 25,123 | 1904 | 14.31 | 2789 | 368 | 11.56 | 18.54 | 39.08 | 2.28 | 30.90 | 130.6 | |
| Potok u Maksimiru blizu Bukovačke | 11,748 | 6.00 | 2.56 | 93.1 | 17,372 | 0.67 | 19.17 | 35.01 | 31.76 | 27,881 | 1166 | 12.46 | 6878 | 880 | 8.70 | 23.57 | 60.30 | 3.27 | 22.39 | 89.6 | |
| Mala Mlaka—uz vodocrpilište (1) | 13,293 | 6.71 | 6.40 | 84.6 | 40,083 | 0.74 | 11.41 | 23.86 | 47.76 | 24,904 | 1542 | 23.35 | 10,909 | 825 | 26.12 | 35.93 | 31.09 | 1.63 | 29.95 | 86.1 | |
| Mikuševa ulica—Dubec. 0–2 cm | 14,993 | 4.98 | 3.48 | 91.2 | 9016 | 0.64 | 8.30 | 30.10 | 25.85 | 22,960 | 1308 | 18.67 | 3974 | 285 | 7.59 | 32.16 | 18.25 | 2.09 | 47.76 | 66.2 | |
| Novi Jelkovec. 0–2 cm | 18,496 | 4.40 | 2.98 | 92.2 | 9744 | 0.73 | 7.09 | 34.85 | 28.27 | 26,461 | 1338 | 20.32 | 4244 | 219 | 6.14 | 31.48 | 19.90 | 1.95 | 48.48 | 77.7 | |
| Park Pravednika među narodima—jaruga | 14,292 | 12.07 | 8.31 | 79.1 | 23,999 | 0.71 | 14.16 | 36.19 | 37.47 | 25,872 | 2033 | 19.27 | 7679 | 595 | 21.04 | 57.11 | 25.96 | 2.63 | 33.78 | 85.2 | |
| Prisavlje—uz Savu (1) | 7675 | 6.20 | 2.50 | 203.9 | 82,630 | 0.72 | 5.88 | 25.30 | 26.37 | 17,616 | 684 | 13.24 | 13,279 | 392 | 104.63 | 18.53 | 34.22 | 1.96 | 81.11 | 127.7 | |
| Sljeme Vrh—livada | 17,470 | 0.33 | 0.79 | 73.6 | 8048 | 0.95 | 26.30 | 49.14 | 46.35 | 35,025 | 1468 | 17.44 | 5488 | 1641 | 25.19 | 25.37 | 65.45 | 6.75 | 19.43 | 153.2 | |
| Strossmayerov Trg | 9977 | 6.04 | 3.80 | 118.5 | 46,635 | 0.62 | 12.48 | 27.12 | 43.03 | 21,675 | 1108 | 15.09 | 11,520 | 692 | 30.36 | 25.04 | 58.45 | 3.25 | 37.08 | 100.2 | |
| Šire područje oko Ustave Kunišćak | 16,021 | 6.31 | 4.45 | 114.0 | 10,058 | 1.02 | 12.87 | 28.23 | 31.47 | 28,312 | 1328 | 23.20 | 5940 | 849 | 7.40 | 37.66 | 32.25 | 1.89 | 14.50 | 82.7 | |
| Trnjanski nasip (2) | 9524 | 4.42 | 3.48 | 99.0 | 33,054 | 0.60 | 8.09 | 21.93 | 26.93 | 17,140 | 1383 | 11.80 | 8040 | 463 | 23.80 | 31.25 | 36.52 | 2.15 | 31.06 | 108.1 | |
| Tuškanac-livada | 14,391 | 6.17 | 0.81 | 93.6 | 5075 | 0.40 | 10.33 | 27.00 | 20.53 | 22,357 | 652 | 16.34 | 3567 | 355 | 11.06 | 17.62 | 77.83 | 2.06 | 9.57 | 58.7 | |
| Mikuševa ulica—Dubec. 2–4 cm | 13,841 | 4.81 | 2.18 | 92.1 | 7390 | 0.65 | 7.85 | 27.21 | 24.75 | 22,314 | 961 | 16.74 | 3727 | 272 | 4.73 | 30.52 | 19.06 | 1.50 | 45.19 | 64.0 | |
| Novi Jelkovec. 15–25 cm | 21,964 | 6.01 | 3.41 | 104.9 | 8768 | 0.90 | 9.42 | 40.79 | 33.25 | 31,012 | 1474 | 23.94 | 4561 | 329 | 14.94 | 35.74 | 20.89 | 2.32 | 49.31 | 85.7 | |
| Valid N | Mean | Median | Sum | Minimum | Maximum | Range | Variance | Std. Dev. | |
|---|---|---|---|---|---|---|---|---|---|
| Al | 27 | 12,456.38 | 13,293.04 | 336,322.3 | 2929.395 | 21,963.72 | 19,034.33 | 23,708,144 | 4869.10 |
| As | 27 | 4.75 | 4.81 | 128.2 | 0.329 | 12.07 | 11.74 | 6 | 2.40 |
| B | 27 | 3.02 | 2.98 | 81.6 | 0.774 | 8.31 | 7.53 | 4 | 1.94 |
| Ba | 27 | 86.60 | 84.61 | 2338.3 | 40.669 | 203.86 | 163.19 | 1073 | 32.76 |
| Ca | 27 | 30,884.88 | 23,999.33 | 833,891.7 | 2660.019 | 82,693.63 | 80,033.61 | 687,813,701 | 26,226.20 |
| Cd | 27 | 0.66 | 0.64 | 17.8 | 0.367 | 1.16 | 0.79 | 0 | 0.21 |
| Co | 27 | 11.89 | 9.71 | 321.0 | 4.580 | 26.30 | 21.72 | 36 | 5.97 |
| Cr | 27 | 29.04 | 27.12 | 784.1 | 10.752 | 71.53 | 60.78 | 171 | 13.08 |
| Cu | 27 | 30.84 | 31.13 | 832.8 | 12.523 | 54.73 | 42.21 | 125 | 11.17 |
| Fe | 27 | 22,786.01 | 22,959.73 | 615,222.2 | 9770.359 | 35,024.52 | 25,254.16 | 40,204,133 | 6340.67 |
| K | 27 | 1124.87 | 1078.96 | 30,371.4 | 324.710 | 2033.26 | 1708.55 | 155,497 | 394.33 |
| Li | 27 | 16.63 | 16.34 | 448.9 | 5.703 | 25.97 | 20.27 | 24 | 4.92 |
| Mg | 27 | 8534.94 | 7678.73 | 230,443.4 | 2788.817 | 15,448.99 | 12,660.17 | 16,525,554 | 4065.16 |
| Mn | 27 | 627.89 | 576.95 | 16,953.0 | 211.495 | 1640.70 | 1429.21 | 140,427 | 374.74 |
| Na | 27 | 18.14 | 13.03 | 489.7 | 2.551 | 104.63 | 102.08 | 366 | 19.12 |
| Ni | 27 | 28.40 | 26.99 | 766.7 | 14.240 | 57.11 | 42.87 | 104 | 10.19 |
| Pb | 27 | 36.82 | 32.56 | 994.2 | 15.207 | 77.83 | 62.62 | 350 | 18.70 |
| Sb | 27 | 2.63 | 2.09 | 71.0 | 0.877 | 6.75 | 5.87 | 3 | 1.60 |
| Sr | 27 | 32.72 | 31.97 | 883.3 | 9.079 | 81.11 | 72.03 | 251 | 15.85 |
| Zn | 27 | 87.77 | 85.66 | 2369.9 | 52.092 | 153.21 | 101.12 | 578 | 24.03 |
| Al | As | B | Ba | Ca | Cd | Co | Cr | Cu | Fe | K | Li | Mg | Mn | Na | Ni | Pb | Sb | Sr | Zn | |
|---|---|---|---|---|---|---|---|---|---|---|---|---|---|---|---|---|---|---|---|---|
| MS in situ | 0.22 | −0.25 | −0.23 | 0.15 | −0.14 | 0.52 | 0.54 | 0.34 | 0.32 | 0.35 | −0.01 | 0.06 | −0.13 | 0.74 | 0.45 | −0.09 | 0.48 | 0.63 | −0.18 | 0.75 |
| MS lab | 0.21 | −0.18 | −0.15 | 0.07 | −0.12 | 0.38 | 0.60 | 0.41 | 0.34 | 0.39 | 0.07 | −0.01 | −0.13 | 0.63 | 0.36 | 0.04 | 0.37 | 0.68 | −0.12 | 0.69 |
| Element/City | Zagreb—Current Study | Palermo [39] | Lisbon [40] | Ljubljana [40] | World Average (16 Cities) [40] |
|---|---|---|---|---|---|
| Pb | Min-max: 15.21–77.83 Mean: 36.82; Median: 32.56 | Min-max: 57–2516 Median: 253 | Min-max: 0.55–12.2 Mean: 8.5 | Min-max: 30–57 Mean: 40 | Min-max: nd–5469 Mean: 84.1 |
| Zn | Min-max: 52.09–153.21 Mean: 87.77; Median: 85.66 | Min-max: 52–433 Median: 151 | - | - | - |
| Cu | Min-max: 12.52–54.73 Mean: 30.84; Median: 31.13 | Min-max: 10–344 Median: 77 | - | - | - |
| Cd | Min-max: 0.37–1.16 Mean: 0.66; Median: 0.64 | Min-max: 0.27–3.80 Median: 0.84 | Min-max: 0.11–1.04 Mean: 0.41 | - | Min-max: nd–20.3 Mean: 0.396 |
| Cr | Min-max: 10.75–71.53 Mean: 29.04; Median: 27.12 | Min-max: 12–100 Median: 39 | Min-max: 9.61–88.5 Mean: 51.5 | Min-max: 24–66 Mean: 41 | Min-max: nd–1586 Mean: 55.6 |
| Co | Min-max: 4.58–26.30 Mean: 11.89; Median: 9.71 | Min-max: 1.5–14.8 Median: 6.5 | - | - | - |
| Ni | Min-max: 14.24–57.11 Mean: 28.40; Median: 26.99 | Min-max: 7.0–38.6 Median: 19.1 | Min-max: 9.77–120.4 Mean: 62.4 | Min-max: 30–56 Mean: 39 | Min-max: nd–727 Mean: 34.6 |
| Soil Type/Element | Cd | Cr | Cu | Hg | Ni | Pb | Zn |
|---|---|---|---|---|---|---|---|
| Sandy soil | 0.0–0.5 | 0–40 | 0–60 | 0.0–0.5 | 0–30 | 0–50 | 0–60 |
| Powdery–loamy soil | 0.5–1.0 | 40–80 | 60–90 | 0.5–1.0 | 30–50 | 50–100 | 60–150 |
| Clay soil | 1.0–2.0 | 80–120 | 90–120 | 1.0–1.5 | 50–75 | 100–150 | 150–200 |
Disclaimer/Publisher’s Note: The statements, opinions and data contained in all publications are solely those of the individual author(s) and contributor(s) and not of MDPI and/or the editor(s). MDPI and/or the editor(s) disclaim responsibility for any injury to people or property resulting from any ideas, methods, instructions or products referred to in the content. |
© 2023 by the authors. Licensee MDPI, Basel, Switzerland. This article is an open access article distributed under the terms and conditions of the Creative Commons Attribution (CC BY) license (https://creativecommons.org/licenses/by/4.0/).
Share and Cite
Frančišković-Bilinski, S.; Peco, J.; Sakan, S.; Đorđević, D.; Inđić, D. Magnetic and Geochemical Properties of Zagreb City Area Soils. Minerals 2023, 13, 1481. https://doi.org/10.3390/min13121481
Frančišković-Bilinski S, Peco J, Sakan S, Đorđević D, Inđić D. Magnetic and Geochemical Properties of Zagreb City Area Soils. Minerals. 2023; 13(12):1481. https://doi.org/10.3390/min13121481
Chicago/Turabian StyleFrančišković-Bilinski, Stanislav, Josip Peco, Sanja Sakan, Dragana Đorđević, and Dejan Inđić. 2023. "Magnetic and Geochemical Properties of Zagreb City Area Soils" Minerals 13, no. 12: 1481. https://doi.org/10.3390/min13121481
APA StyleFrančišković-Bilinski, S., Peco, J., Sakan, S., Đorđević, D., & Inđić, D. (2023). Magnetic and Geochemical Properties of Zagreb City Area Soils. Minerals, 13(12), 1481. https://doi.org/10.3390/min13121481