Abstract
As Bayan Obo rare-earth tailings, which are generated after the production of mineral products with the raw ore from different mining areas, are considered secondary resources rich in valuable elements such as F, Fe, REE, and Nb, an effective method is urgently needed to recover such valuable elements for resource recycling and environmental conservation. A mineralogical analysis can enable process diagnosis, design, and optimization and is the key to comprehensively utilizing valuable elements. Hence, detailed mineralogical characterization is necessary as a starting point to develop a feasible processing flowsheet. In this study, various detection methods, namely inductively coupled plasma-optical emission spectrometry (ICP), X-ray Fluorescence Spectrometer (XRF), X-ray powder diffractometer (XRD), scanning electron microscopy system with an energy dispersive spectrometer (SEM-EDS), mineral liberation analysis (MLA), and electron probe microanalysis (EPMA), were applied to conduct detailed mineralogical characterization of Bayan Obo rare-earth tailings, and the occurrence state of Sc in the main Sc-bearing minerals was studied using density functional theory (DFT). The results showed that Fe mainly occurs in hematite, riebeckite, ankerite, siderite, and pyrite, with contents of 50.15 wt%, 27.94 wt%, 8.34 wt%, 4.92 wt%, and 5.59 wt%, respectively. Nearly all F occurs in 26.8 wt% fluorite. The main rare-earth minerals are bastnasite, apatite, and monazite (La), with contents of 5.0%, 5.0%, and 1.6% in Bayan Obo rare-earth tailings, respectively. Notably, 48.47%, 21.70%, 10.34%, and 10.28% of niobium element occurs in nioboaeschynite, pyrochlore, dingdaohengite, and ilmenorutile, respectively. Scandium was detected in five minerals, namely aegirine, riebeckite, monazite, ilmenorutile, and niobite, with average contents of 0.04 wt%, 0.22 wt%, 0.06 wt%, 0.06 wt%, and 1.58 wt%, respectively. According to the DFT analysis, the state of Sc in aegirine is different from that in riebeckite. Scandium in aegirine mainly substitutes Fe or enters the interstitial lattice site, while Sc in riebeckite tends to replace Fe. Based on these results, a process for recovering valuable elements from tailings is proposed.
1. Introduction
In recent decades, attention to rare-earth mineral resources has increased worldwide [1,2]. The growing demand for green technologies has led to the large-scale application of rare-earth elements in advanced electronic products and increased the demand for rare-earth elements in the world’s major economies, including the United States, the European Union, the United Kingdom, and Japan [3,4], with an estimated annual growth rate of 3.7% to 8.6% [5,6]. Deposits of high-grade rare-earth elements continue to be depleted. China’s reserves have declined significantly over the past 50 years, despite being the world’s richest country in rare-earth resources [6]. Therefore, there is an urgent need to exploit practical technology to recover rare-earth resources effectively from large quantities of rare-earth tailings with a high content [7].
Bayan Obo tailing pond, one of the world’s largest rare-earth tailing ponds [8], contains tailings generated since the 1960s, at the rate of 386,000 tpa [9,10,11,12]. Currently, the tailing pond covers approximately 12 km2 and stores approximately 200 million tons of tailings [13,14,15,16,17]. Tailings contain a large amount of iron, rare-earth elements, fluorine, Niobium, and other elements, which are a valuable secondary resource [18,19,20]. However, reprocessing tailings with methods such as recycling is difficult because of their low grade, fine particle sizes, and complex mineralogy among other factors [21]. Currently, the utilization of Bayan Obo tailings is still in the laboratory research stage. The main treatment options include physical separation, as well as hydrometallurgical and pyrometallurgical treatments [6,15,20,22,23,24,25,26,27]. In a typical Bayan Obo tailing treatment process, physical operations such as grinding, screening, magnetic force, flotation, gravity separation, and density-based separation are used as pretreatments to release and concentrate metallic parts (MFs) and non-metallic fractions (NMFs) [28].
The effective utilization of tailings and the optimal processing method depend on the mineral species, correlations and interlocking between minerals, and metal distribution characteristics [29]. The process mineralogy of tailings helps to provide essential information for recovery research [28,30]. Therefore, it is necessary to study the process mineralogy of tailings.
Process mineralogy is a widely accepted integrated discipline that combines quantitative (and qualitative) mineralogy and metallurgy [31,32,33]. The aim is to optimize metallurgical processes, reduce operating costs, and improve metal recovery through the comprehensive characterization of precursor ore mineralogy, mineral assemblages, grain size, and texture. Therefore, process mineralogy is commonly applied to grade and recovery optimization in the working process and has been applied to many deposit types, including rare-earth elements.
This study aims to contribute to the current knowledge by providing detailed characteristics of the occurrence states of valuable elements in tailings and their associations with physical enrichment and hydrometallurgical extraction, which may be a possible option for processing these resources. To fully understand the characteristics of the tailings, advanced characterization methods such as MLA, EPMA, XRD, and ICP were used in this study to analyze the process parameters of rare-earth ore, including element content, mineral composition, the occurrence state of elements, mineral particle size distribution, mineral combination, and deionization. The possible combination of Sc in the minerals was obtained by combining the DFT calculation results. Detailed basic theoretical data are provided for further improvement in the relevant beneficiation process, the recovery of other valuable minerals, and the comprehensive utilization of tailings.
2. Materials and Reagents
Bayan Obo rare-earth tailings, provided by Baotou Iron and Steel (Group) Co., Ltd. of China (Baotou, Inner Mongolia, China), were sourced from the tailing pond of Bayan Obo and homogenized. Subsequently, 100 g dried rare-earth tailing sample was screened into different size fractions, namely +200 mesh, 200–250 mesh, 250–325 mesh, 325–400 mesh, 400–500 mesh, and −500 mesh, and placed in an oven at 105 °C for 48 h to reduce the error caused by the moisture in the sample. All dried samples were weighed and stored in zip-lock bags for later use.
Mineral phase analysis of the dried samples, which were ground to less than 250 mesh, was performed using an X-ray powder diffractometer (D8 Advance, Brock AXS GmbH, Bruker, Billerica, MA, USA). The operating conditions were Cu Kα radiation of λ = 1.54060 Å as the excitation source, with 40 kV accelerating voltage, 40 mA current, a constant step of 0.019°, and a counting time of 1 s for each step for 2-theta, varying from 5° to 90°. The diffraction pattern was analyzed using the X Pert HighScore plus analysis software (version 5.1, Malvern Panalytical, Malvern, UK) equipped with the International Centre for Diffraction Data (ICDD) database.
The particle size distribution of Bayan Obo rare-earth tailings was analyzed using a Malvern laser particle size analyzer (Mastersizer 3000, Malvery Instruments Ltd., Alemlo, The Netherlands), which can accurately quantify the morphological characteristics of non-spherical and non-smooth particles by processing the optical signals of different detection windows and obtaining the fractal dimension of sample particles for measurement to describe the effectiveness of the space occupied by the most complex shapes. The powdered sample was added to 50 mL of deionized water and placed in an ultrasonic instrument (20 kW) for 30 s. A 500 mL measuring cup filled with 2/3 deionized water was placed in the analyzer. Subsequently, the fully dispersed samples were slowly added to the measuring cup. The working parameters were as follows: red light was the main light source, blue light was the auxiliary light source, and the injection stirring speed was 3000 rpm.
The dried 1.0 g mineral powder was placed into a cylindrical plastic mold with a diameter of 30 mm. Subsequently, a 10:1 mixture of epoxy resin and curing agent was mixed with the sample, followed by rapid agitation for approximately 3 min to remove air. Subsequently, the processed mold was placed in the oven at 35 °C for 8 h to obtain the MLA resin sample. The curing sample was fixed in the polisher (MP-2G100A) purchased from Shandong Honghong Instrument Equipment Co., Ltd., with 25 N of polishing strength and 500 r/min of revolving speed to make the cut surface of the mineral smooth enough after 600, 800, 1200, 1500, and 2000 abrasive paper in turn. The polished samples were cleaned with distilled water inside a microwave ultrasonic cleaner for 5 min, removed, dried, and used for MLA and EPMA analyses.
Further mineralogical characterization, such as the association and distribution of each mineral and element in Bayan Obo rare-earth tailings, was performed using a Type-250 automatic mineral liberation analyzer (MLA) (FEI Company, Hillsboro, OR, USA). The analyzer was equipped with a suit of back-scattered scanning electron microscopy (SEM) system, an energy-dispersive spectrometry (EDS) probe, and a suit of MLA software. The operation conditions were as follows: the working distance was 11.6 mm, the frame resolution was 500 pixels, the probe current was 10 nA, and the electron beam accelerating voltage was 25 kV.
To accurately obtain the chemical composition of trace mineral elements, the polished samples were analyzed with a JEOL JXA-iSP-100 Electron Probe Microanalyzer equipped with five wavelength-dispersive spectrometers (WDSs) at the Laboratory of Guangzhou Tuoyan Analytical Technology Co., Ltd., in Guangdong Province, China. The operating conditions for the quantitative WDS analysis included an accelerating voltage of 15 kV, a probe beam current of 10 nA, and a 5–10 µm beam spot size. The peak counting time was 10 s for F, K, P, Na, Ca, and Fe and 20 s for Al, Si, Mg, Mn, Ti, S, and Cl. The background counting time was half the peak counting time for the high- and low-energy background positions. The following standards were used: BaF2(F), quartz (Si), olivine (Mg), orthoclase (K), BaSO4(S), TiO2(Ti), Fe3O4(Fe), MnO2(Mn), albite (Na), spodumene (Al), NaCl(Cl), and apatite (Ca and P).
The precise quantification of trace elements, such as Sc, in Bayan Obo rare-earth tailings was performed using an inductively coupled plasma emission spectrometer (ICP-OES, PQ9000, Analytik Jena GmbH, Jena, Germany). The solid tailing samples were dissolved in the solution and prepared according to the following steps:
First, 0.2 g of solid dried sample was mixed with 6 mL of HCl solution, 2 mL of HNO3 solution, and 2 mL of HF solution, and the mixture was then placed into a Teflon microwave digestion tank.
The tank was sealed and placed in a digestion instrument (WX-8000, Preekem Scientific Instruments Co., Ltd., Shanghai, China), and digestion was conducted according to the procedure, with the holding temperature set at 120 °C for 3 min under 15 bar pressure, 150 °C for 3 min under 20 bar pressure, 180 °C for 3 min under 30 bar pressure, 200 °C for 3 min under 40 bar pressure, and 220 ℃ for 45 min under 45 bar pressure.
The tank was removed after cooling and lowering pressure, and then the opened tank was heated to 160 °C, the solvent was evaporated to the size of a soybean (~0.25 mL), and finally the solution was moved to the volumetric bottle for the ICP-OES test.
Epoxy resin, curing agent (ethanediamine, NH2CH2CH2NH2), and single-crystal diamond polishing solution (0.5 μm) were analytically pure products and were purchased from Shanghai McLean Biochemical Technology Co., Ltd., Shanghai, China.
3. Results and Discussion
3.1. Composition Analysis of Bayan Obo Rare-Earth Tailings
3.1.1. Chemical Composition
The major element compositions of Bayan Obo rare-earth tailings are listed in Table 1. The main components of the tailings are CaO, Fe2O3, SiO2, and F, accounting for 30.50 wt%, 20.40 wt%, 13.10 wt%, and 14.20 wt%, respectively. The total rare-earth oxides, including La2O3, CeO2, and Nd2O3, exceed 2.5 wt%. Because of their high prices, 0.11% of Nb and 137.91 ppm of Sc are the most valuable elements in tailings. The total content of the main impurities, such as MnO, Al2O3, MgO, Na2O, and SiO2, is greater than 20 wt%, which seriously affects the grade of fluorite and iron concentrates and increases the cost of purification.

Table 1.
Component analysis results of the samples (wt%).
3.1.2. Mineral Constituent and Particle Size Distribution
To comprehensively assess the residual value of tailings, it is necessary to know their mineral compositions and their distribution across particle sizes. Mineral composition determines the valuable components of the tailings and the particle size distribution is a proxy for the degree of dissociation of the target minerals. These factors determine the selection of beneficiation methods.
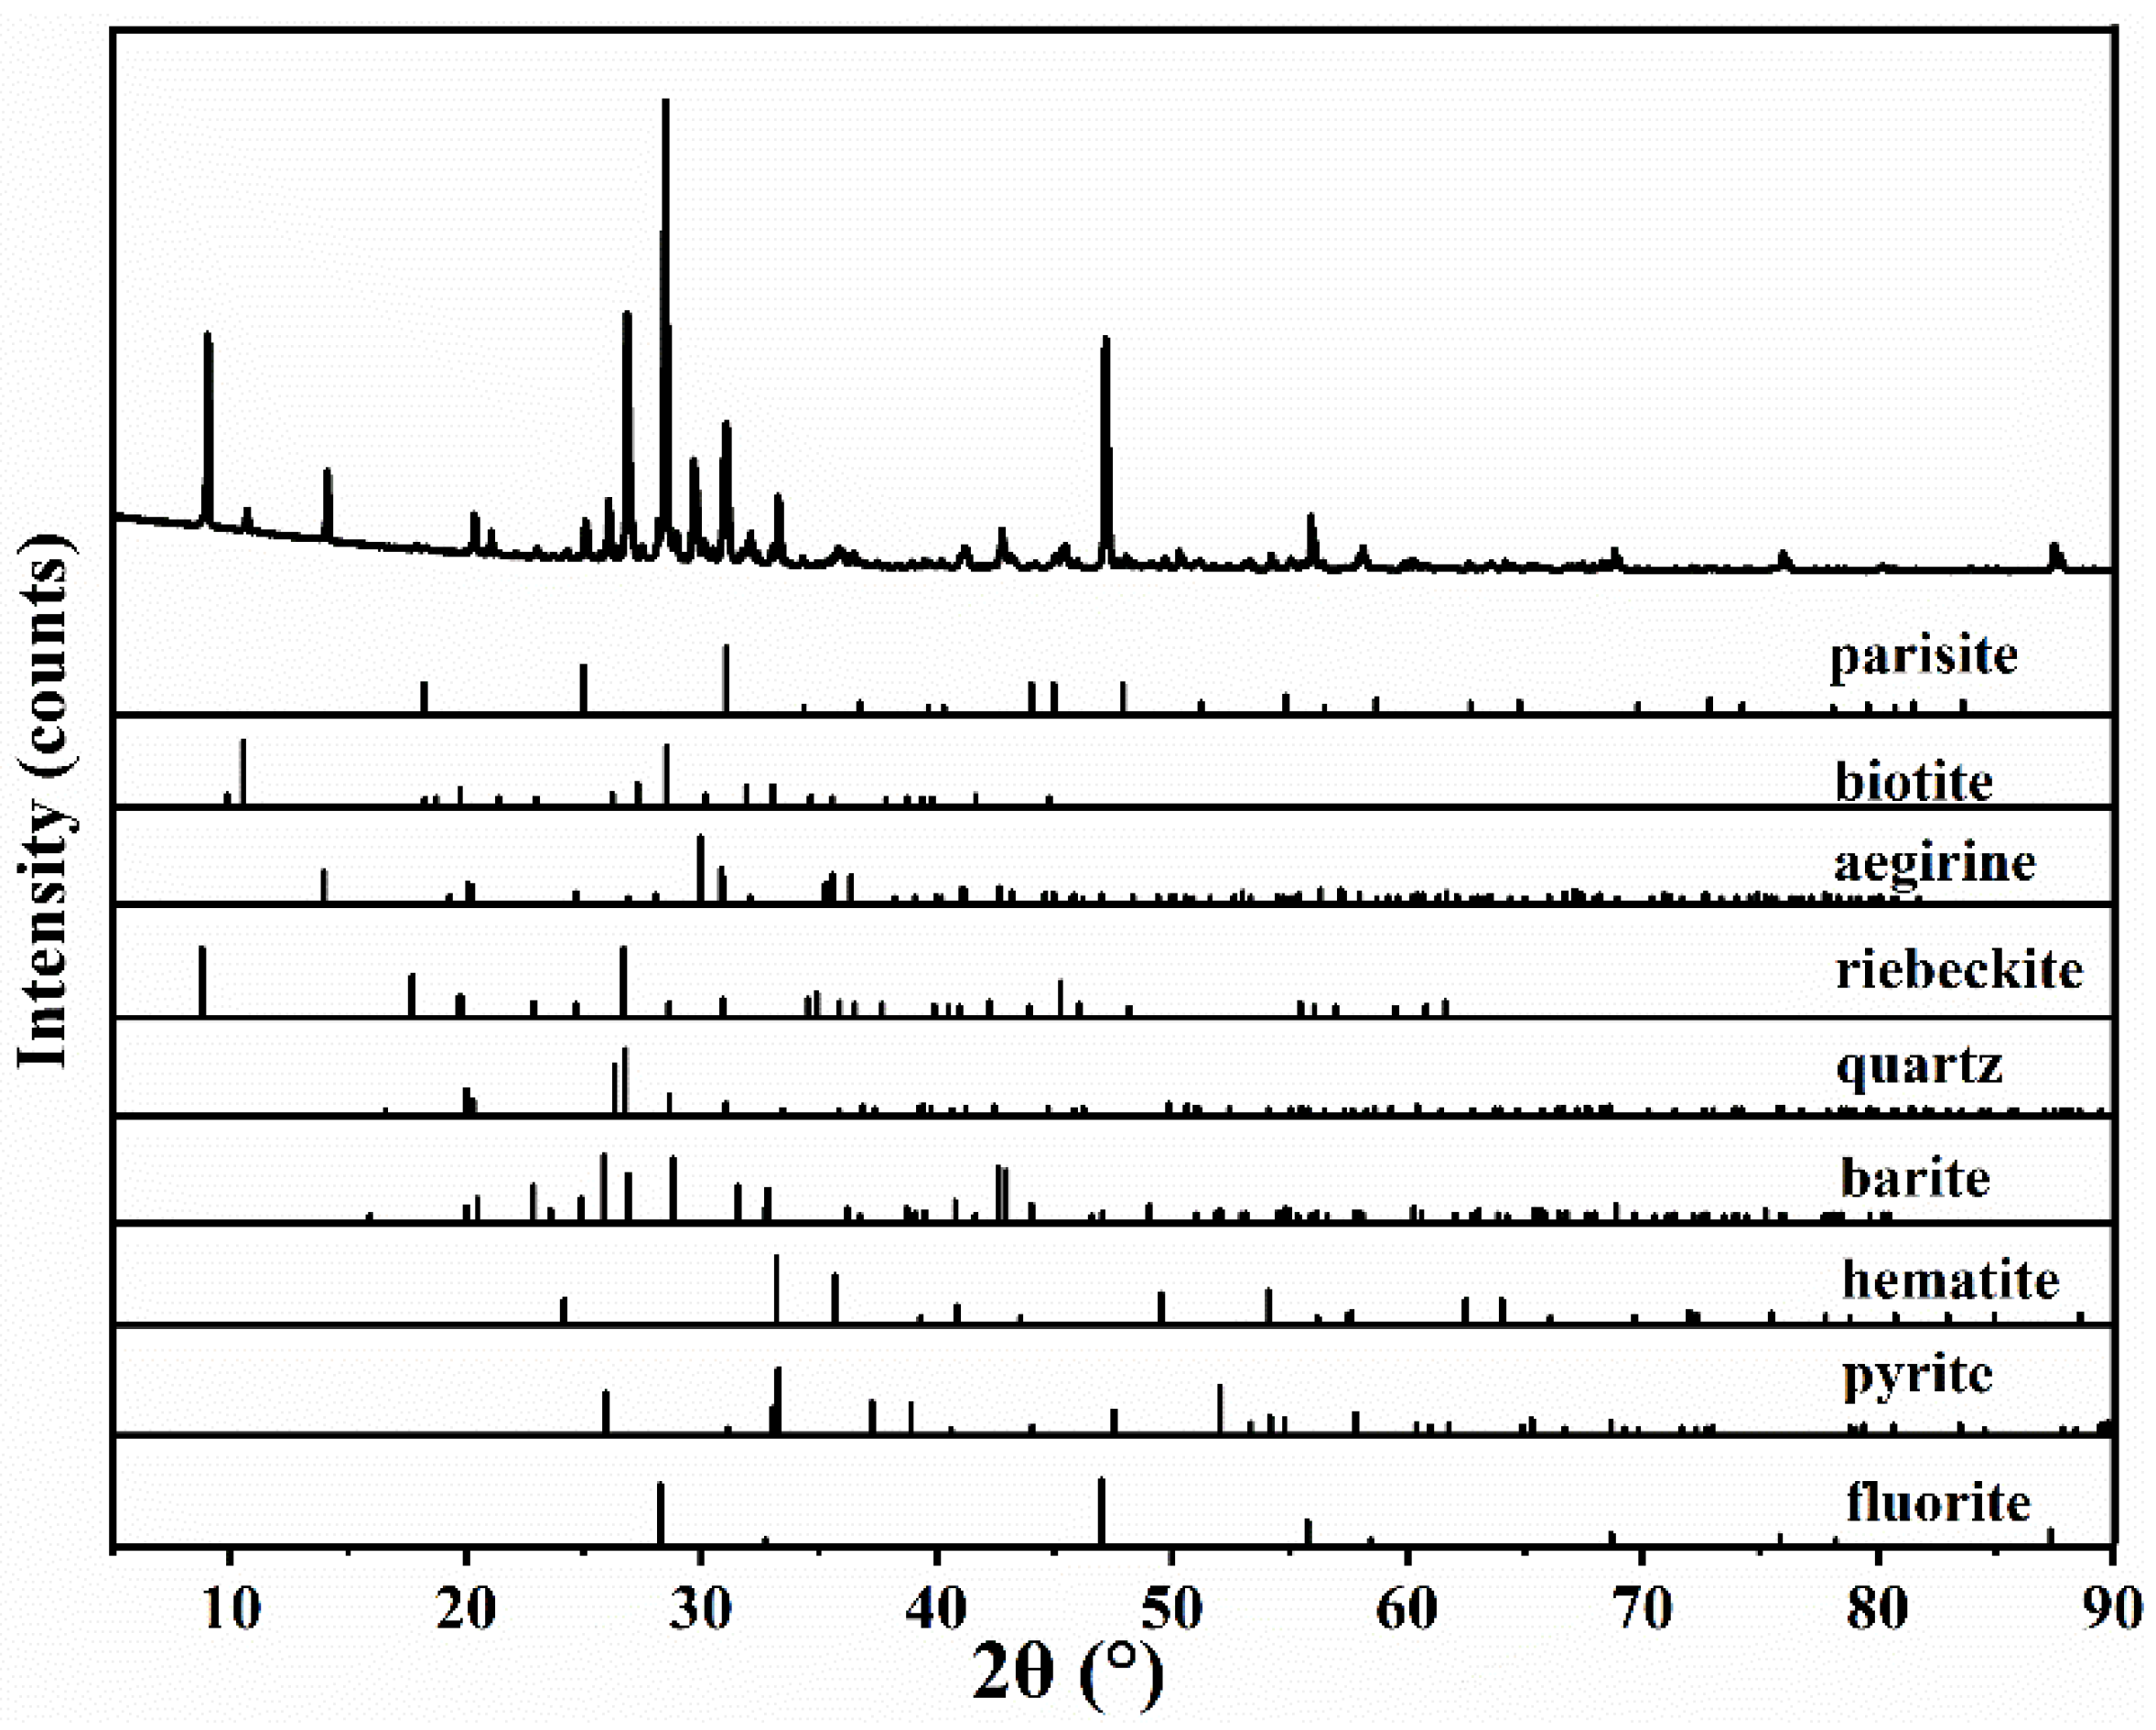
The XRD analysis results of Bayan Obo rare-earth tailings, shown in Figure 1, reveal that the main mineral phases are bastnasite ((Ce, La)[CO3]F), quartz (SiO2), biotite (K2Mg6(Al2Si6O20)(OH)4), aegirine (NaFeSi2O6), riebeckite (AB2C5T8O22W2, A = Na, K, Ca, Pb, and Li; B = Na, Ca, Mn2+, Fe2+, Mg, and Li; C = Mg, Fe2+, Mn2+, Al, Fe3+, Ti4+, and Li; T = Si, Al, Ti4+, and Be; W = (OH), F, Cl, and O2−), barite (BaSO4), hematite (Fe2O3), pyrite (FeS2), and fluorite (CaF2). Although XRD is an important means of characterizing mineral phases, it can determine the existence of a phase but not its absence. The limit of detection (LOD) of XRD is influenced by many factors, such as dispersion, crystallinity, and the type of substance being detected. XRD can usually detect mineral phases with more than 5% content, indicating that the tailings contain at least one of the phases shown in Figure 1. Furthermore, different mineral formation environments result in differences in the elemental content of the same mineral, thus changing the XRD spectrum peaks, and the ICDD database does not contain all spectral peaks. Also, XRD cannot determine the specific elemental content in a mineral. Additional detection methods, such as EPMA and MLA, are required to detect the minerals contained in tailings and the content of each element in them.
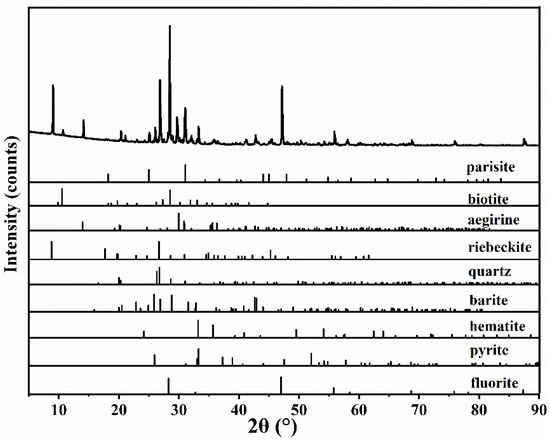
Figure 1.
XRD pattern of the dried and fine-grained Bayan Obo rare-earth tailings.
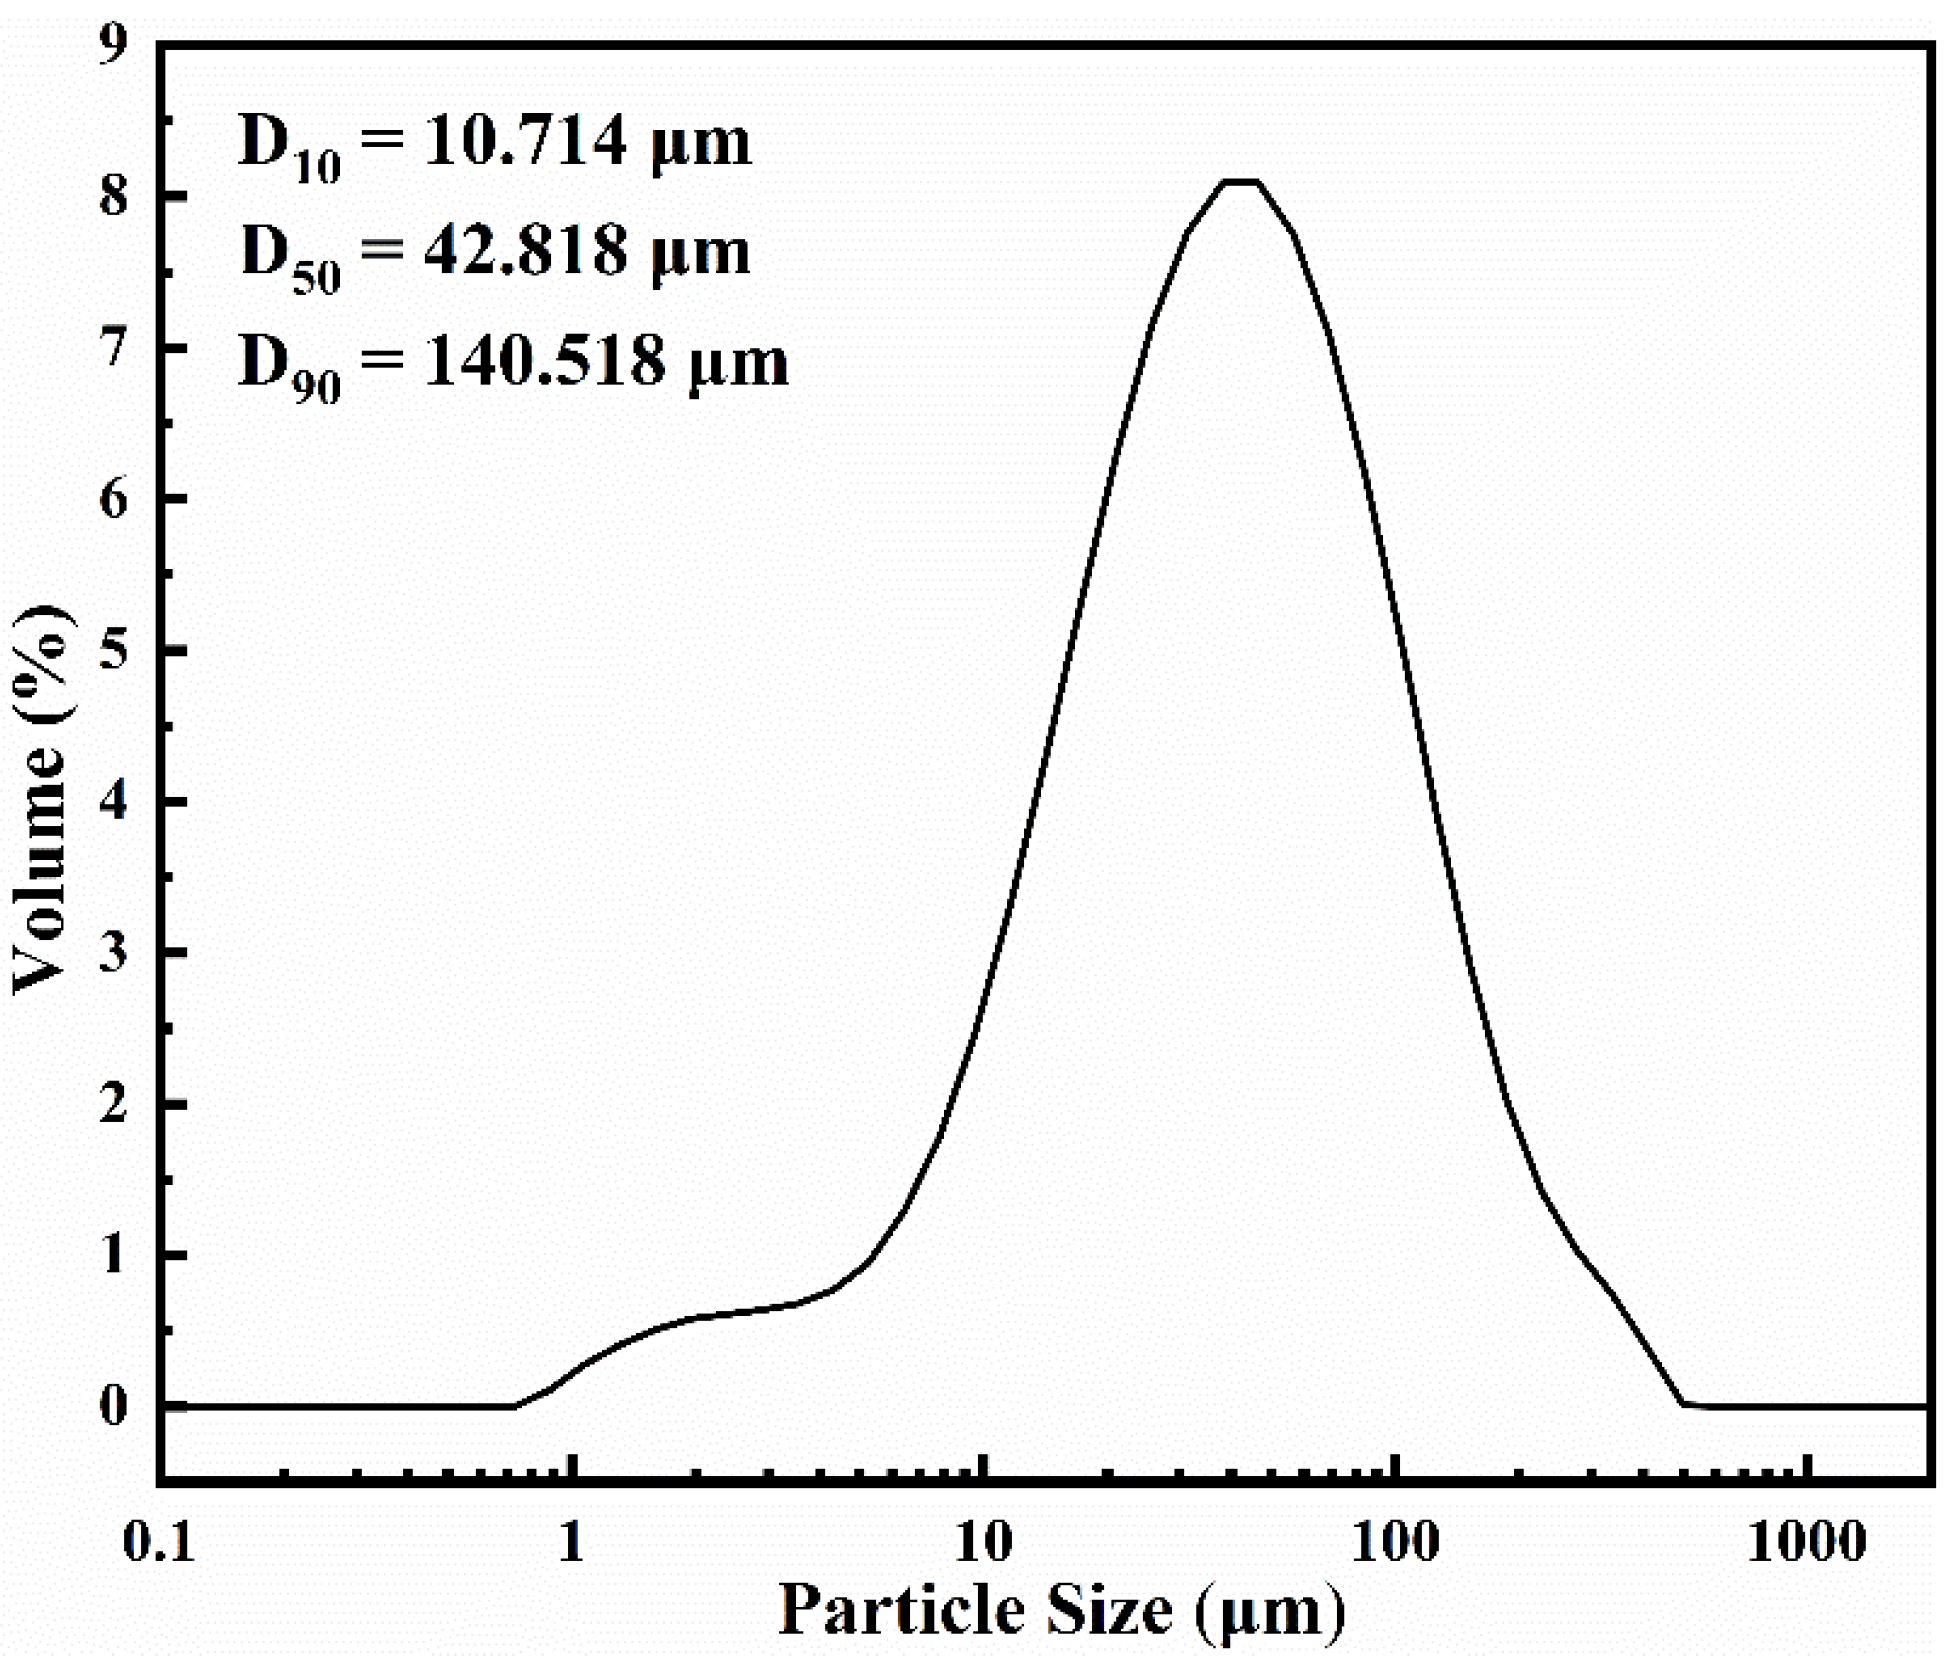
The particle size distribution of Bayan Obo rare-earth tailings is shown in Figure 2, where only one asymmetrical peak is observed. All particles are above 500 μm, but the content in the range of 0.70–140.52 μm is 90%, and that in the range of 0.70–42.82 μm is 50%, indicating that the tailings are dominated by fine tailings.
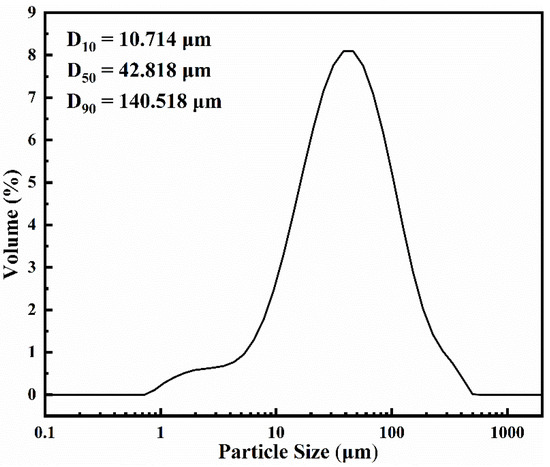
Figure 2.
Particle size distribution of Bayan Obo rare-earth tailings.
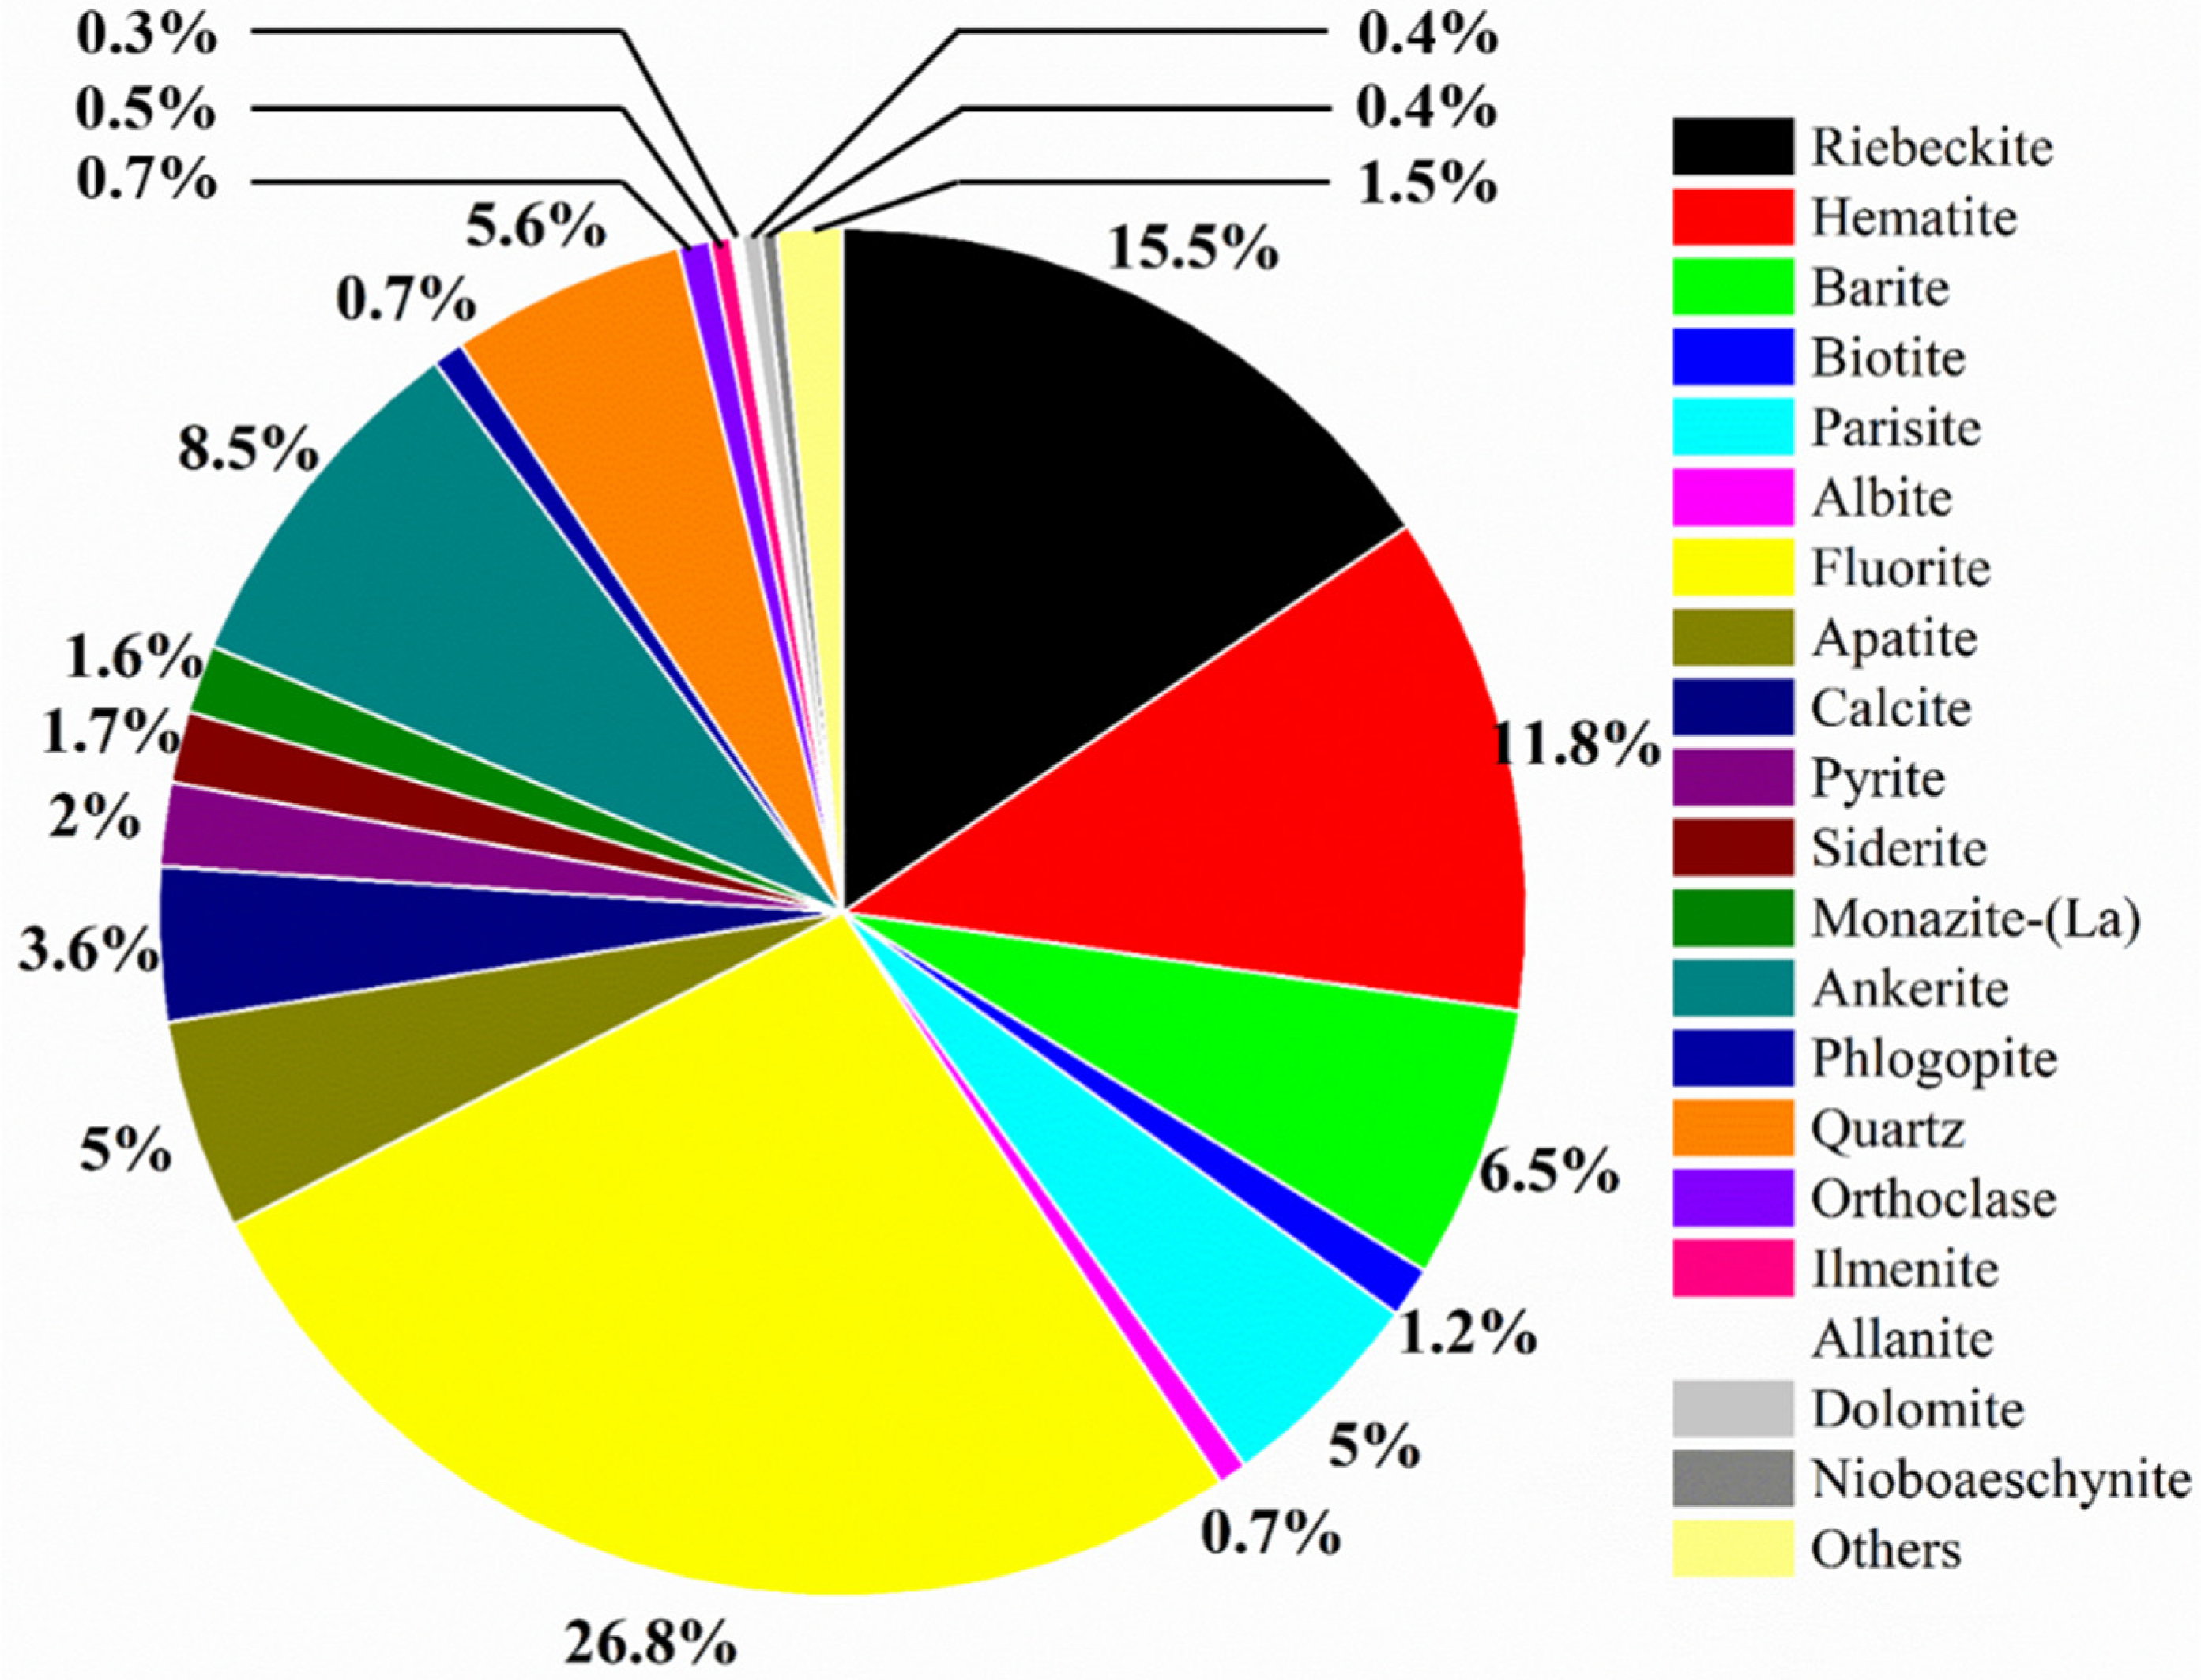
The mineral compositions and contents of the tailings are shown in Figure 3. The iron minerals in the tailings are mainly hematite, siderite, ankerite, and pyrite, with contents of 11.8%, 1.7%, 8.5%, and 2.0%, respectively. The main rare-earth minerals are bastnasite, apatite, and monazite, with contents of 5.0%, 5.0%, and 1.6%, respectively. The silicate minerals are mainly biotite, riebeckite, and small quantities of albite and phlogopite, with contents of 1.2%, 15.5%, 0.7%, and 0.7%, respectively. The mineral with the highest content in the tailings is fluorite, and there are still large amounts of quartz and barite, with contents of 26.8%, 6.5%, and 5.6%, respectively. Both riebeckite and aegirine are single-chain silicate minerals with similar structures and similar contrast imaging under back-scattered electrons (BSEs). Therefore, they were classified into one category in this study. MLA images of Bayan Obo rare-earth tailings are shown in Figure 4, which is a detailed visual demonstration of Figure 3.

Figure 3.
Mineral composition and contents in minerals associated with Bayan Obo tailings (wt%).
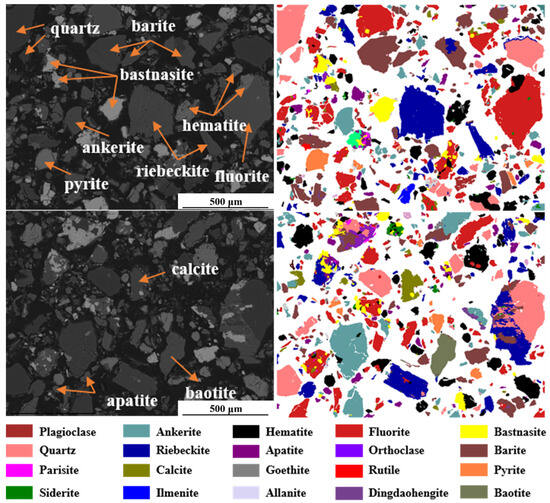
Figure 4.
MLA images of Bayan Obo rare-earth tailings.
3.1.3. Distribution of Valuable Elements in Minerals
The valuable elements in Bayan Obo tailings include F, REE, Fe, Sc, and Nb. Therefore, the occurrence states of these elements in tailings are discussed in this study.
Iron in Bayan Obo tailings mainly occurs in the form of independent minerals, such as hematite, riebeckite, ankerite, siderite, and pyrite, with contents of 50.15 wt%, 27.94 wt%, 8.34 wt%, 4.92 wt%, and 5.59 wt%, respectively. The majority of the F was found in fluorite (97.20%). However, it was also found in bastnasite in trace amounts. Bayan Obo rare-earth deposits mainly consist of light rare-earth elements. In this study, the distributions of La and Ce were used instead of the distribution of rare earth. Cerium mainly occurs in dingdaohengite, monazite, allanite, bastnasite, and wollastonite, with contents of 6.52 wt%, 14.11 wt%, 3.87 wt%, 72.78 wt%, and 2.72 wt%, respectively. Lanthanum mainly occurs in monazite, bastnasite, and wollastonite, with contents of 42.17 wt%, 56.03 wt%, and 1.8 wt%, respectively. Notably, 86.89% of La and 98.20% of Ce in Bayan Obo rare-earth tailings occur in bastnasite and monazite, respectively. Therefore, the states of bastnasite and monazite as the main minerals of rare-earth occurrence are discussed later. Niobium was primarily found in nioboaeschynite (48.47 wt%), pyrochlore (21.70 wt%), dingdaohengite (10.34 wt%), and ilmenorutile (10.28 wt%), and also in baotite in trace amounts, as shown in Table 2.
Table 2.
Distribution of F, REE, Fe, Sc, and Nb in Bayan Obo tailings.
The results of the MLA software analysis were based on the qualitative mineral composition of the EDS scans. Regarding the low precision of EDS, which has a detection limit of about 0.5%, Sc has no independent mineral in the Bayan Obo ore and only hosts in the lattice of other minerals in the form of homomorphism, and its content is low. Thus, the analytical detection means of EDS and MLA cannot be used to study the occurrence state of Sc.
An electron probe microanalyzer (EPMA) uses a focused, high-energy electron beam to bombard the solid sample surface and stimulate the characteristic X-rays and a variety of electronic signals (such as secondary electrons and backscattered electrons) to perform qualitative and quantitative analyses of the elements in situ and morphological observations of the sample. It is the most basic in situ microbeam microzone analysis instrument used in the fields of mineralogy, petrology, geochemistry, mineral deposit science, comparative planetology, and materials science. An EPMA, with an analytical region of less than 1 μm and a detection limit of approximately 100 ppm, was used to determine the occurrence of Sc in various minerals in Bayan Obo tailings.
The EPMA test results for the six silicate minerals are presented in Table 3. The presence of Sc was detected only in chain silicates (aegirine and riebeckite), in which SiO4 tetrahedrons are connected by sharing oxygen to form a continuous chain, and they are absent in silicates with other structures. Although some EPMA data are not zero, the values’ reliability is deemed low because they are less than the detection limit. Therefore, they were not adopted in this paper.
Table 3.
EPMA test results of the seven silicate minerals.
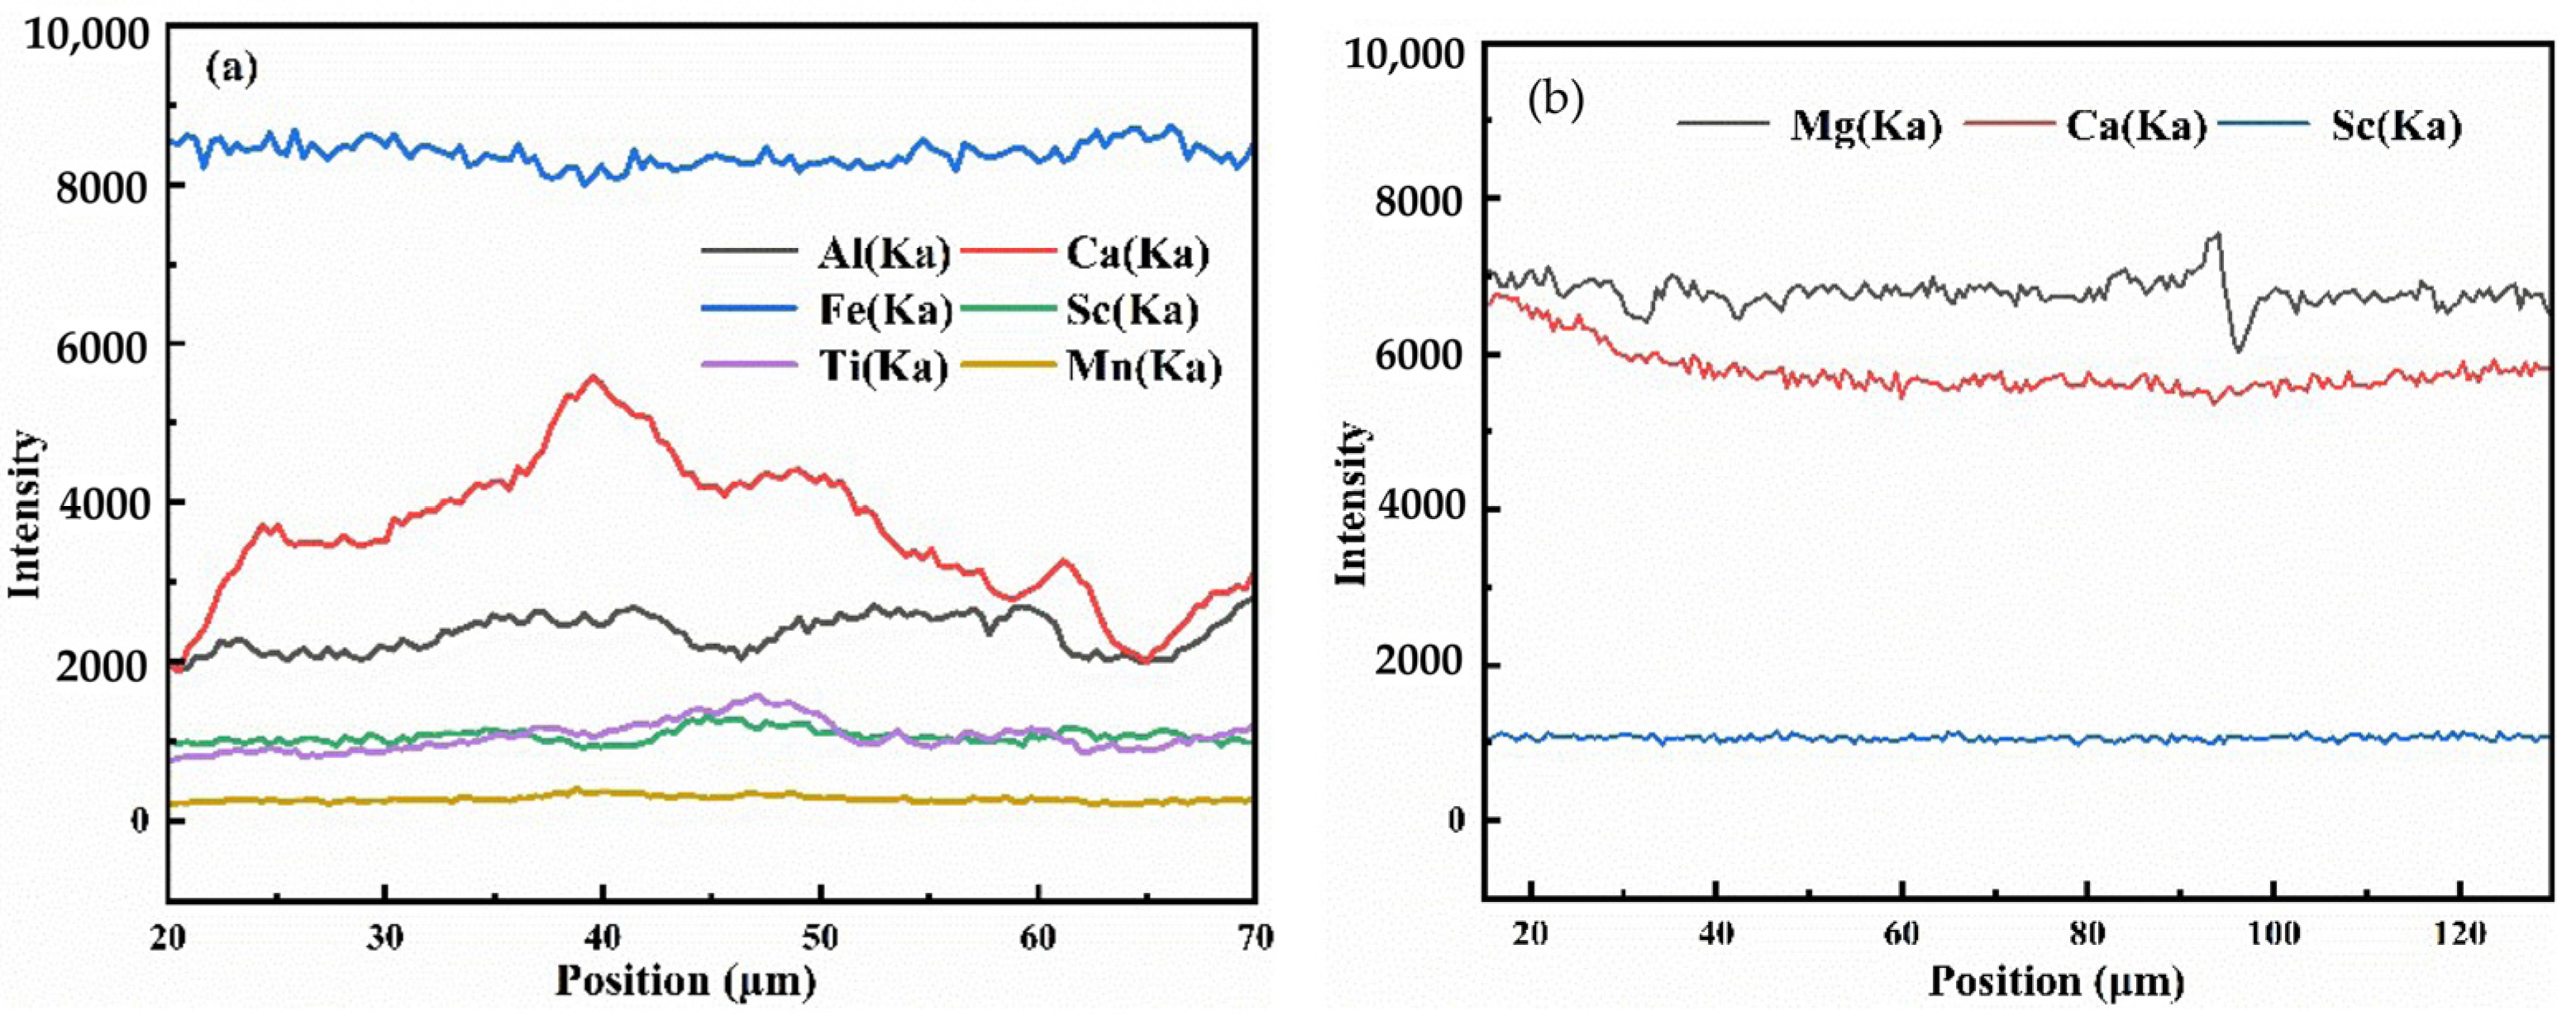
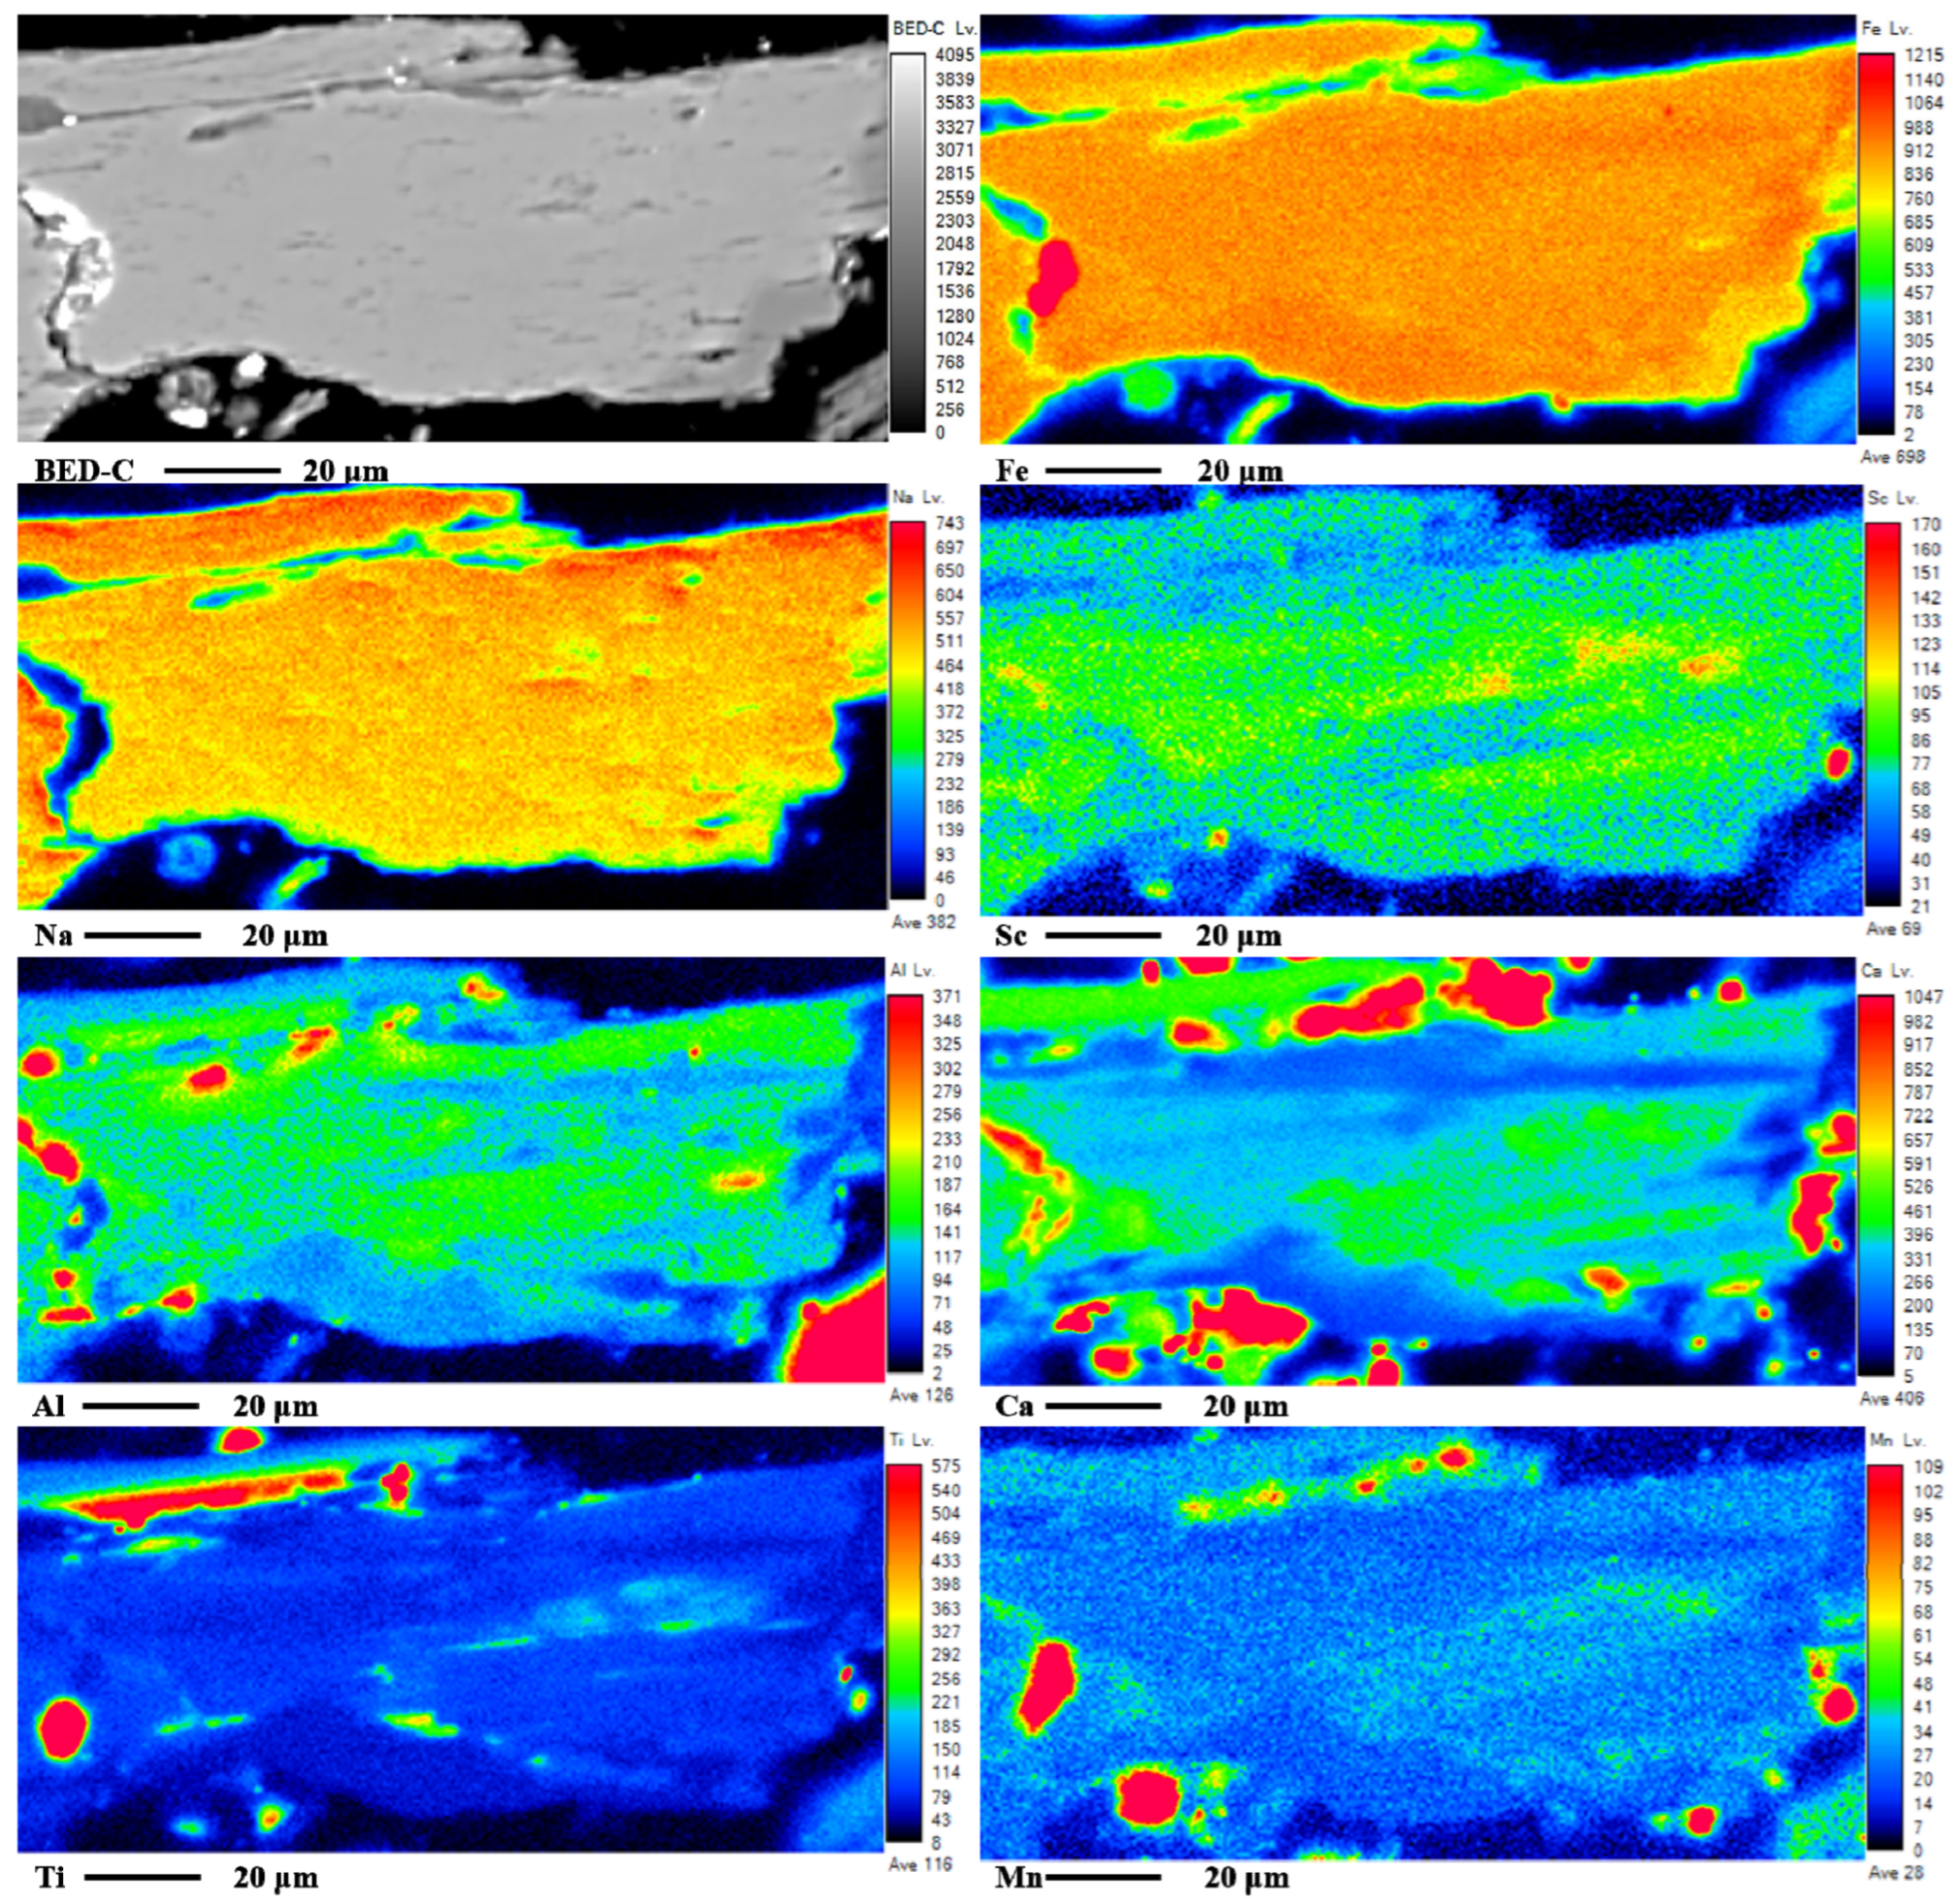
The content of Sc2O3 in aegirine was 0%–0.156%, and the average of the 19 samples was 0.037%. The chemical formula of aegirine was calculated according to the average content of each element as follows: Na0.948Ca0.097Mg0.038Al0.031Sc0.001Fe3+0.885Si2O5.992F0.016. The distribution of Sc in aegirine was investigated using EPMA line scanning and mapping, as shown in Figure 5a and Figure 6. Sc is uniformly distributed in the individual aegirine spots, and the difference in composition is mainly due to the different aegirine spots.
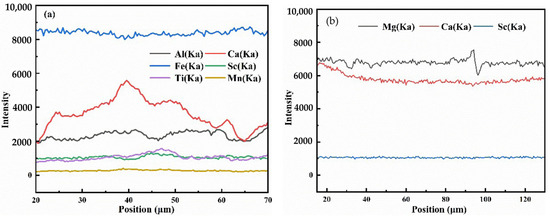
Figure 5.
EPMA line scans of (a) aegirine and (b) riebeckite.

Figure 6.
EPMA mapping of aegirine.
The content of Sc2O3 in riebeckite was 0%–2.298%, and the average of the 21 samples was 0.222%. The chemical formula of riebeckite was calculated based on the average content of each element as follows:
(Ca0.83Na0.104K0.369Mn0.302)Na2(Fe0.3853+Fe1.3932+Mg2.935Al0.073Sc0.029Ti0.004)[Si8O22](OH)0.852F1.148.
The distribution of Sc in riebeckite was investigated using EPMA line scanning and mapping, as shown in Figure 5b and Figure 7. The distribution of Sc in riebeckite is similar to that in aegirine. This may be because the ionic radius of Sc is similar to that of metal ions such as Fe3+ and Al3+. Therefore, there is a possible competitive relationship in the formation of minerals. Scandium is in contact with various fluorine-bearing minerals during high-temperature and high-pressure geological activities, resulting in the formation and disruption of complex fluoride of Sc. In the cooling process, F combines with calcium ions to form fluorite (CaF2) precipitates, whereas Sc forms a solid solution of aegirine and riebeckite with metal ions such as Na+ and Fe3+. This could be the reason why Sc exists uniformly in aegirine and riebeckite and Sc-bearing minerals are associated with fluorite [34]. The complex of aluminum and fluorine ions is also stable during the formation of silicates with high Al content, such as feldspar and mica. However, unlike Sc, aluminum has tetrahedral coordination and can easily enter feldspar and mica. This may explain why Sc does not exist in feldspar and mica.
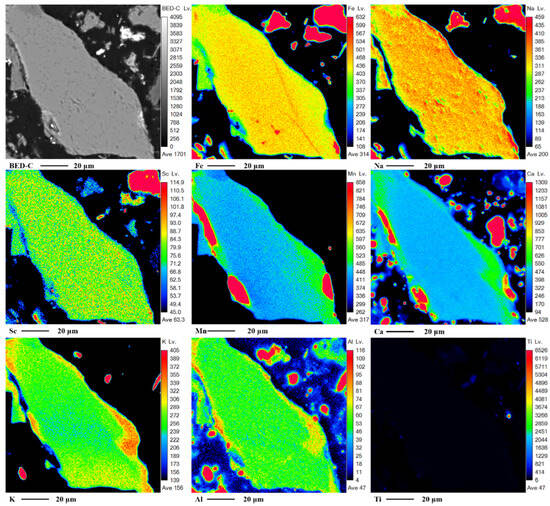
Figure 7.
EPMA mapping of riebeckite.
The EPMA test results for the four rare-earth minerals are listed in Table 4. Among them, only monazite contained Sc, and the content of Sc2O3 was 0%–0.152%. The chemical formula of monazite was calculated according to the average content of each element as follows: (Eu0.001Sm0.013Er0.001Y0.002Ce0.495Nd0.197Th0.008La0.244Pr0.046Gd0.002Sc0.002)PO4. The total value of the highest content of each element was 73.78% higher than that of the lowest content because the contents of the major elements La, Ce, Nd, and Pr were significantly different, with 353.75%, 36.78%, 187.93, and 74.90%, respectively. This finding may be attributed to the presence of two types of monazite. However, the content of Sc2O3 in both types of monazite did not seem to have a significant effect.
Table 4.
EPMA test results of the four rare-earth minerals.
The EPMA test results for the eight iron-bearing minerals are listed in Table 5. Among these, Sc2O3 was detected in two types of Nb-bearing minerals, namely ilmenorutile and niobite, with contents of 0%–0.122% and 0.575%–2.112%, respectively. The presence of Sc appears to be strongly related to Nd, which is consistent with Yang’s result [35]. The chemical formula of niobite was calculated according to the average content of each element as follows: (Fe0.59Mn0.38Sc0.02)Nb2O6. The chemical formula of ilmenorutile could not be obtained because of its complex composition. Among the other iron-bearing minerals, only one ilmenite sample contained Sc, and its EPMA results were 0.335% MgO, 0.305% Nb2O5, 3.821% MnO, 44.307% FeO, 50.611% TiO2, 0.146% V2O3, and 0.038% Sc2O3. The composition, except for Sc2O3, was not significantly different from other ilmenite samples. Therefore, we speculated that there was no Sc2O3 in ilmenite, which is consistent with Yang’s result [35].
Table 5.
EPMA test results of 8 iron-bearing minerals.
The EPMA test results for fluorite and calcite are listed in Table 6. No Sc2O3 was detected in these two minerals. In this study, the mineral with the highest Sc content in Bayan Obo tailings was niobite, with a content of 1.58%, and the highest content of a single point was riebeckite, with a content of 2.30%. The content of Sc in different minerals and different samples of the same mineral varied greatly, and the content of Sc2O3 was less than 0.10% in most samples. Only five minerals were confirmed to contain Sc, and the content of Sc2O3 in descending order was niobite, riebeckite, ilmenorutile, monazite, and aegirine. In conclusion, very low amounts of Sc are dispersed in the Bayan Obo deposit, which is consistent with previous findings. However, the results differ from those of previous studies in the following points: (1) Our result regarding niobite is consistent with previous studies, showing a relative richness of Sc. However, the average Sc content was found to be 1.58%, which is higher than that measured by predecessors (0.22%, 0.67%, and 1.26%) [36]. (2) Previous researchers found ilmenorutile to have the highest scandium content [37].
Table 6.
EPMA test results of other minerals.
However, the average scandium content in ilmenorutile was only 0.06% in this work, whereas Yang did not detect the presence of Sc in ilmenorutile [35]. (3) Aegirine was considered to be the richest Sc among the silicates [38], but the Sc content of riebeckite (0.22%) was much higher than that of aegirine (0.037%) in this study. (4) For the same sample, the content of Sc2O3 was uniformly distributed, which was not observed in a previous study. This may be related to the conditions of mineral formation.
3.2. Grain Size Distribution of Valuable Minerals
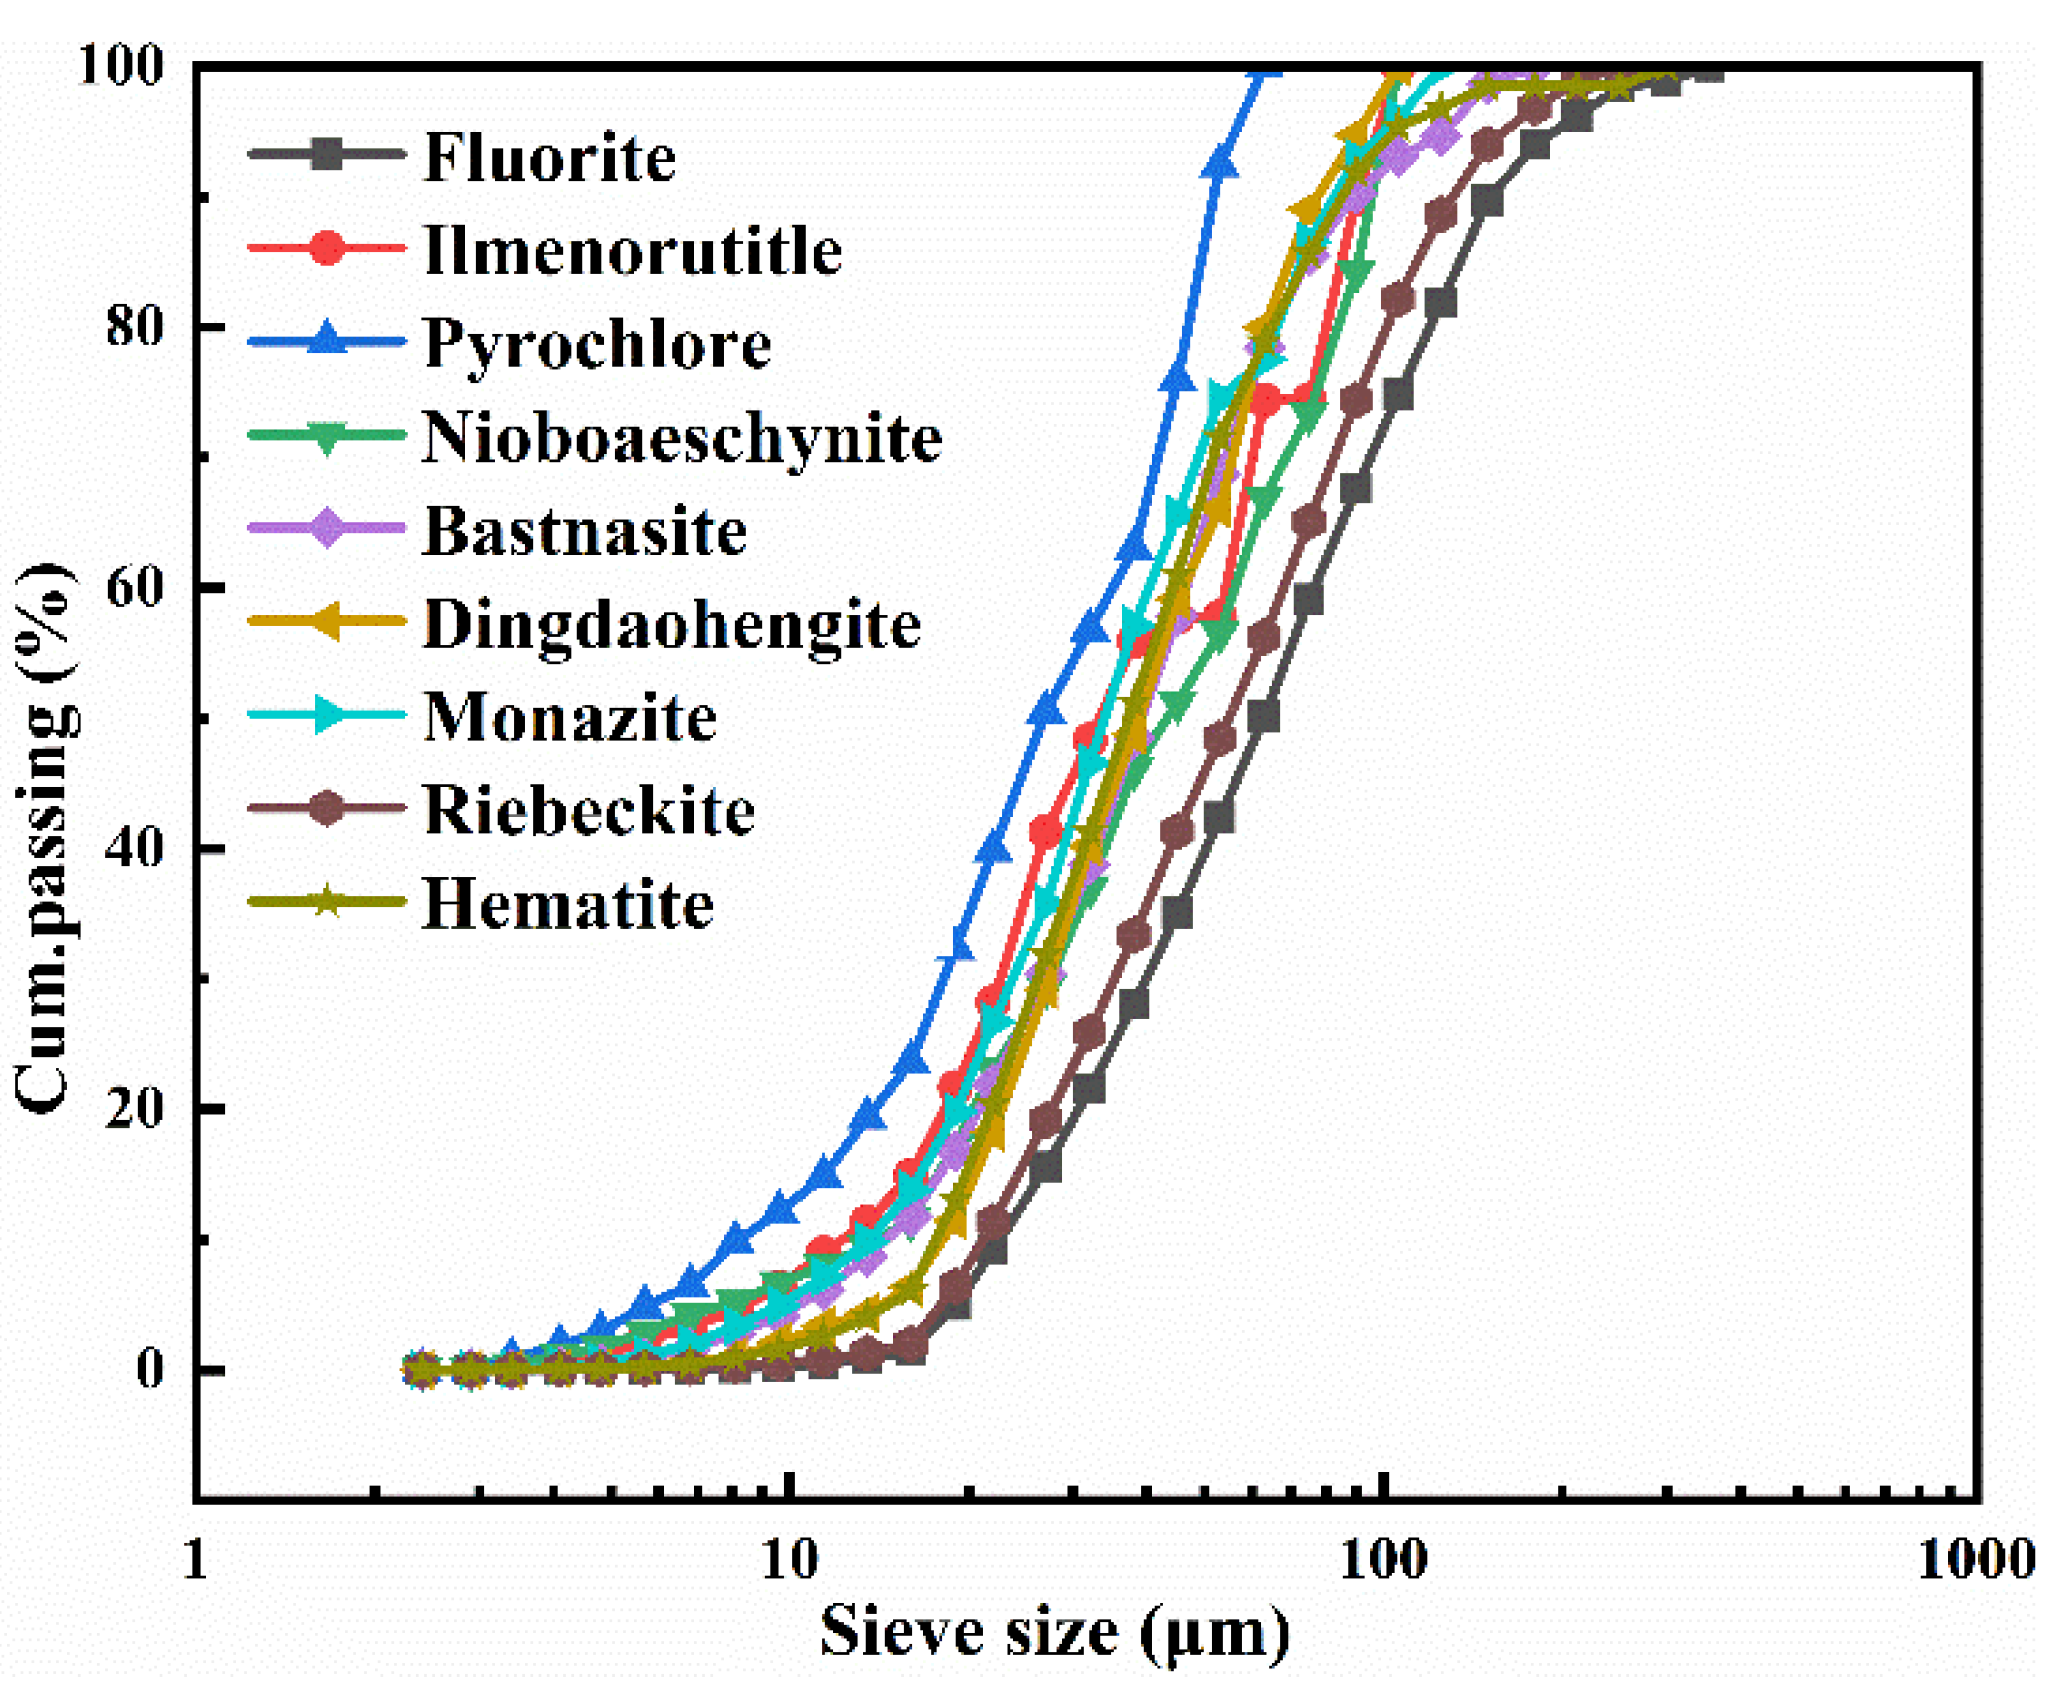
An important factor in mineral flotation is the particle size, and −75 μm is generally taken as a reference. Therefore, with 75 μm as the dividing line, the proportions of fluorite, ilmenorutile, nioboaeschynite, bastnasite, dingdaohengite, monazite, riebeckite, and hematite below 75 μm are 59.11%, 74.4%, 73.38%, 85.50%, 89.04%, 86.56%, 65.08, and 85.62%, respectively. All pyrochlore particles are below −75 μm, and their specific distributions are listed in Table 7 and Figure 8. Due to the large particles of Fe- and F-bearing minerals, further grinding is required to recover iron and fluorine via flotation. The proportions of fluorite, ilmenorutile, pyrochlore nioboaeschynite, bastnasite, dingdaohengite, monazite, riebeckite, and hematite below 20 μm are 9.20%, 21.68%, 32.33%, 17.26%, 16.82%, 11.48%, 19.79, 6.45%, and 13.05%, respectively. The proportions of ilmenorutile, pyrochlore, and nioboaeschynite below 10 μm are 6.35%, 12.14%, and 6.66%, respectively. For physical beneficiation, minerals with particle size greater than 10 μm are easy to recover, while minerals with particle size in the range of 5–10 μm are difficult to recover, and the mineral particle size is less than 5 μm, which belongs to mud ore and is extremely difficult to recover. Therefore, Niobium-bearing minerals are generally fine, which seriously affects the recovery of niobium using flotation.
Table 7.
Particle size distributions of the main valuable minerals in Bayan Obo tailings (%).
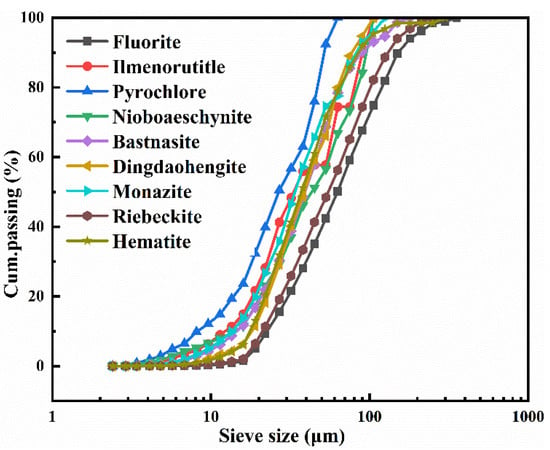
Figure 8.
Cumulative particle size distributions of the main valuable minerals.
3.3. The Main Valuable Minerals’ Association
The free-exposed surface area method was used to analyze the association of monomer minerals, and the results are shown in Table 8. Overall, 79.39% of the fluorite was liberated, and non-liberated and partially liberated fluorite contents were closely associated with bastnasite, monazite, barite, riebeckite, hematite, siderite, ankerite, and calcite with associations of 5.32%, 1.01%, 1.38%, 3.39%, 0.74%, 1.68%, 2.28%, and 0.99%, respectively. Hence, 6.33% of the fluorite was associated with rare-earth minerals, and 8.09% of fluorite was dispersed in iron-bearing minerals. The flotation of fluorite significantly influenced the recovery of Fe and rare-earth elements but had minimal influence on the recovery of Nb and Sc. Therefore, further grinding was needed to reduce the association with other minerals and increase the degree of liberation.
Table 8.
Intergrowth of the main valuable minerals (%).
Monazite and bastnasite were liberated at 54.14% and 47.85%, respectively. Only 4.65% of the monazite and 7.02% of the bastnasite were associated with the REE-bearing mineral apatite, which could be floated and recovered together with monazite. Notably, 8.56% of monazite and 6.59% of bastnasite were associated with silicate minerals, and 16.64% and 15.05% of monazite were dispersed in fluorite and Fe-bearing minerals, respectively. In addition, 24.36% and 10.78% of bastnasite were dispersed in fluorite and Fe-bearing minerals, respectively. Hence, fluorite and Fe-bearing minerals significantly affected the flotation of monazite and bastnasite. However, bastnasite and monazite with apatite should be extracted separately. Since scandium is mainly present in silicate minerals, 1.27% of riebeckite is bonded with fluorite, so the flotation of fluorite has little influence on the recovery of Sc, and scandium mainly exists in flotation tailings. Nb-bearing minerals mainly include nioboaeschynite, pyrochlore, and ilmenorutile, which are 10.19%, 16.59%, and 11.75% bonded with fluorite, respectively. Therefore, the flotation of fluorite has a certain impact on the recovery of Nb, and part of Nb enters the flotation concentrate.
Fluorite, barite, apatite, bastnasite, and quartz were associated with 9.36%, 1.19%, 1.35%, 2.17%, and 2.37% of hematite, respectively, affecting the grade of the Fe concentrate. Hematite (6.19%) was dispersed in other Fe-bearing minerals, such as riebeckite, siderite, and ankerite. The extraction of hematite had little effect on Sc extraction but did not affect Nb extraction.
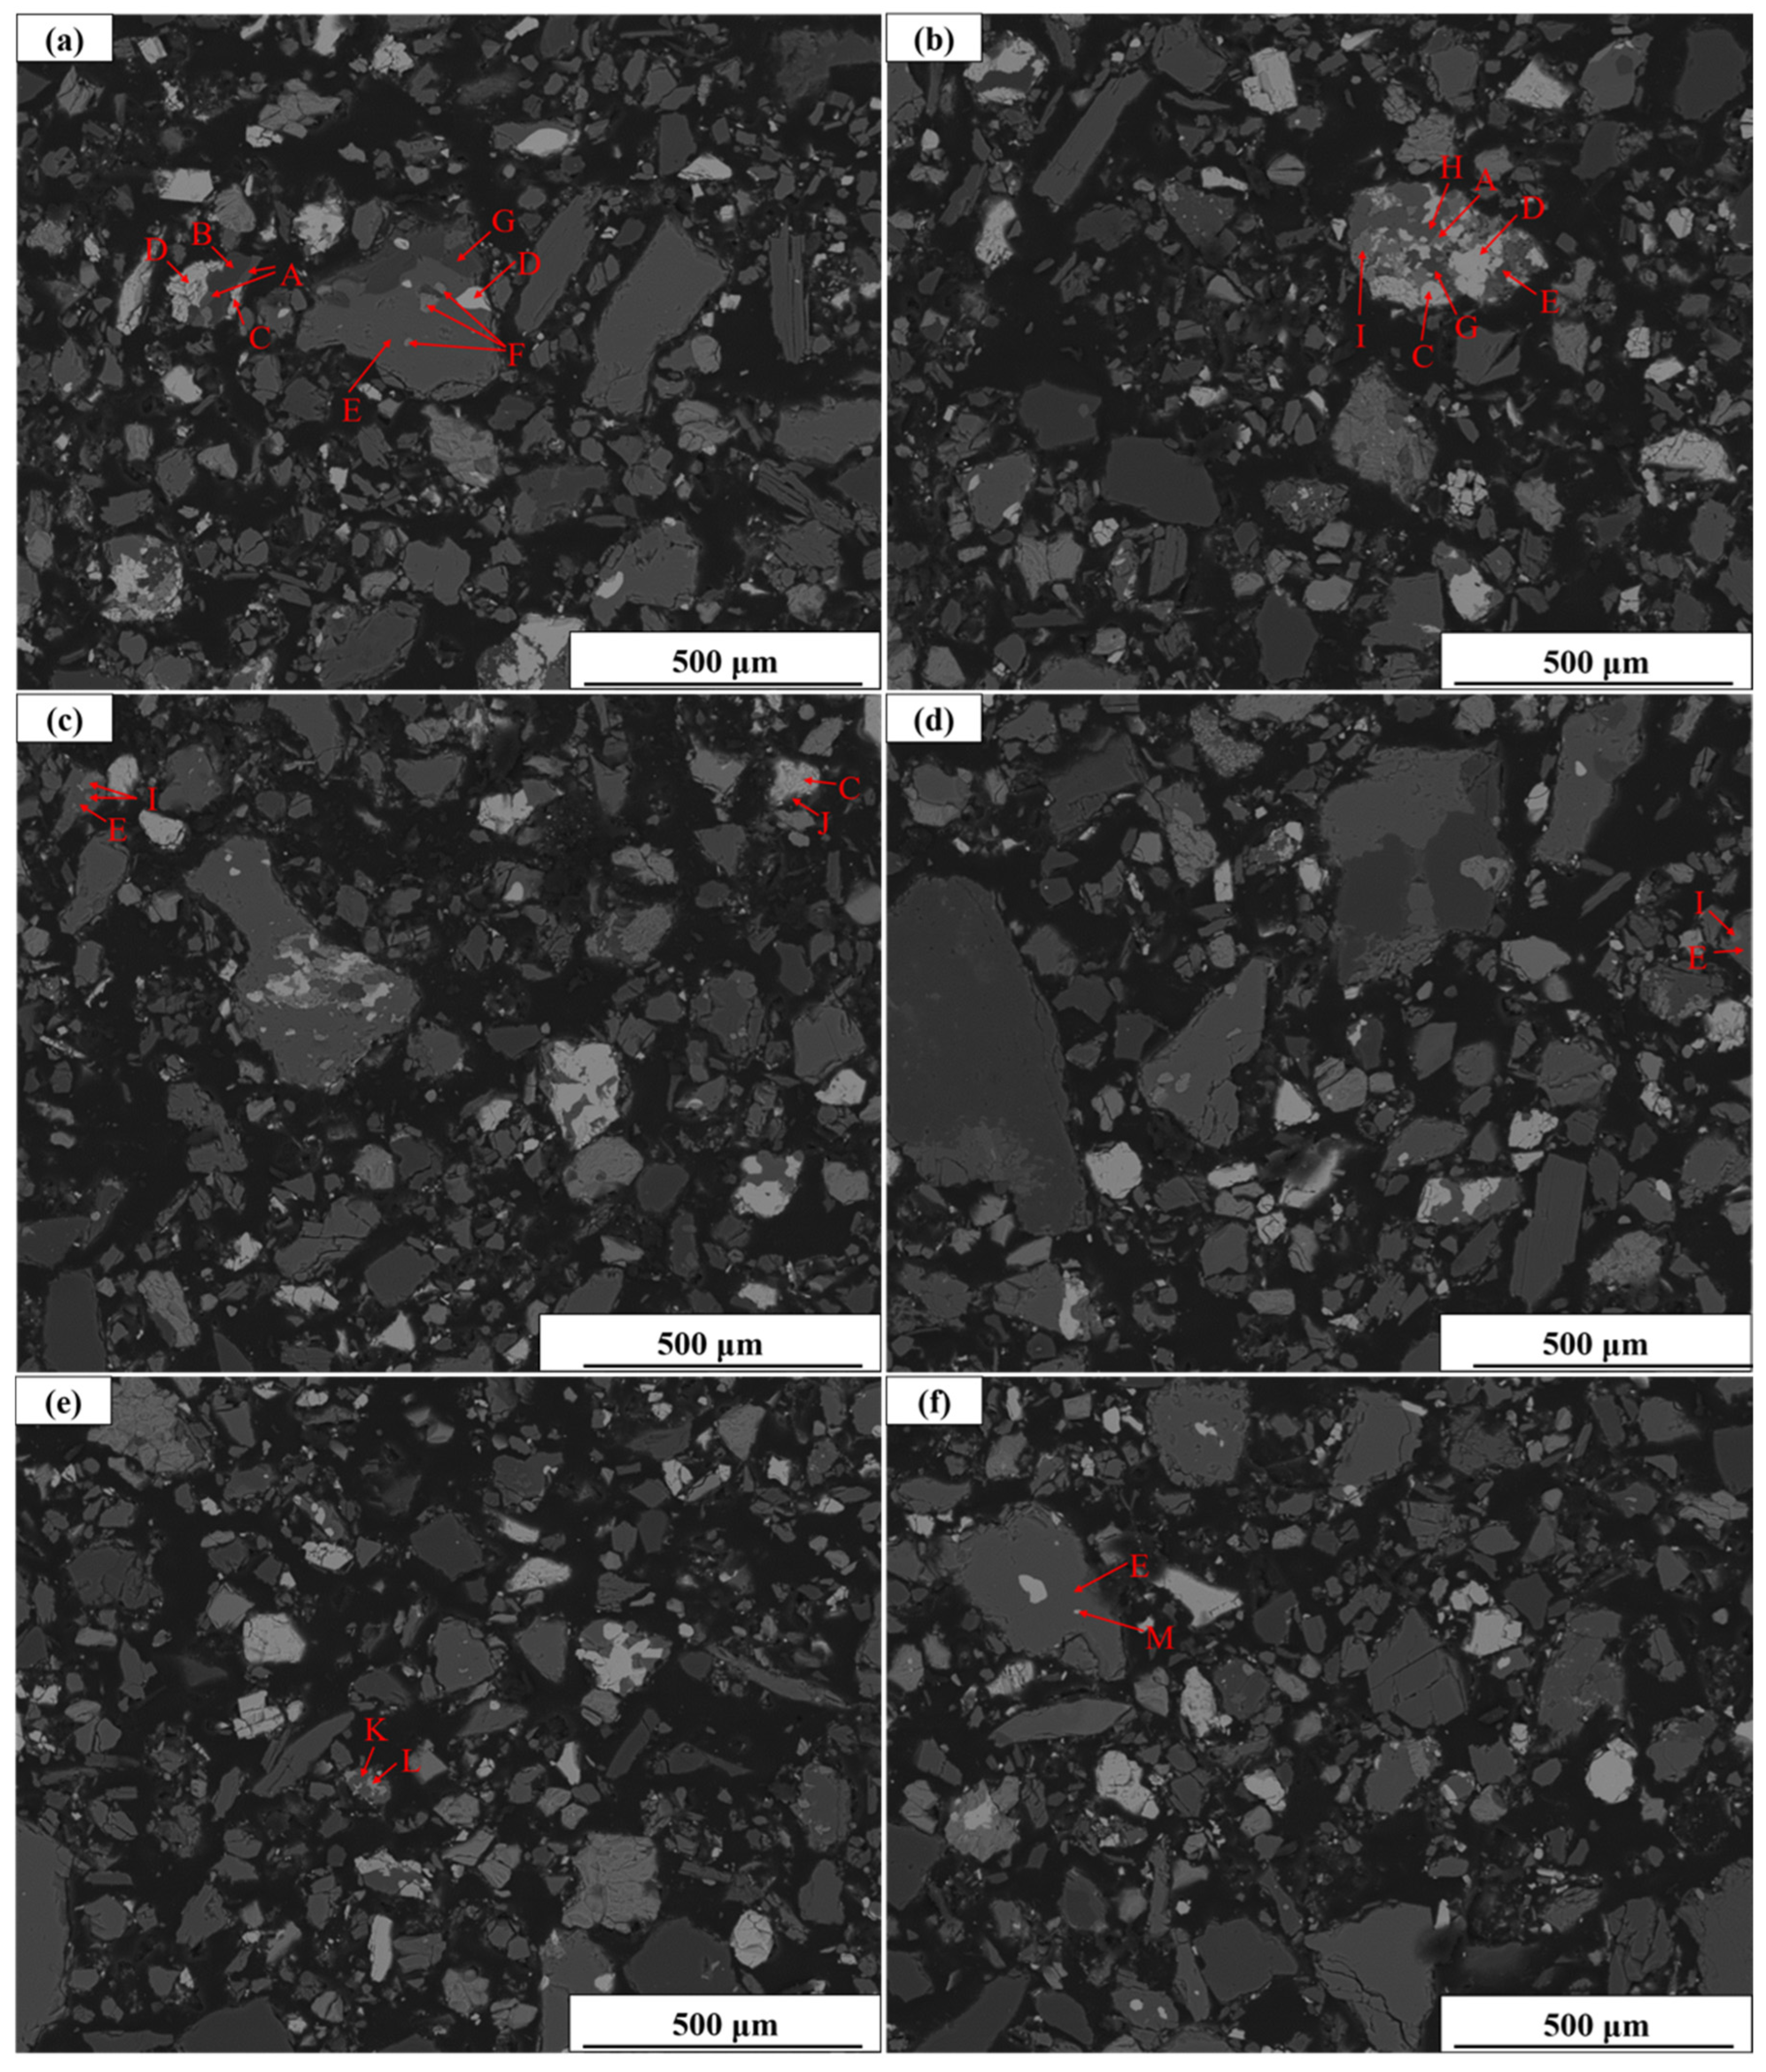
The liberation of Nb-bearing minerals, especially pyrochlore and ilmenorutile, was very low, at 38.98 and 45.72, respectively. Only 1.03%, 2.80%, and 5.42% of nioboaeschynite, pyrochlore, and ilmenorutile were associated with other Nb-bearing minerals, respectively. Hence, Nb enrichment was difficult to achieve. The BSE images of Bayan Obo rare-earth tailings are shown in Figure 9, which provide a visual illustration of the complex symbiotic relationships between minerals.

Figure 9.
BSE images of Bayan Obo rare-earth tailings: A, riebeckite; B, quartz; C, carite; D, bastnasite; E, fluorite; F, hematite; G, ankerite; H, apatite; I, ilmenorutile; J, dingdaohengite; K, pyrochlore; L, nioboaeschynite and M, monazite. (a–f) are SEM images of different field of view.3.4. Density Functional Theory Study of the Occurrence State of Sc in Aegirine Lattice.
Since both Nb and Sc are partially present in ilmenorutile, Nb enrichment is accompanied by Sc enrichment to a certain extent. In total, 82.67% of the riebeckites are liberated. Therefore, Sc can be enriched by pretreatment. However, the distribution of Sc is highly scattered, and extraction is extremely difficult.
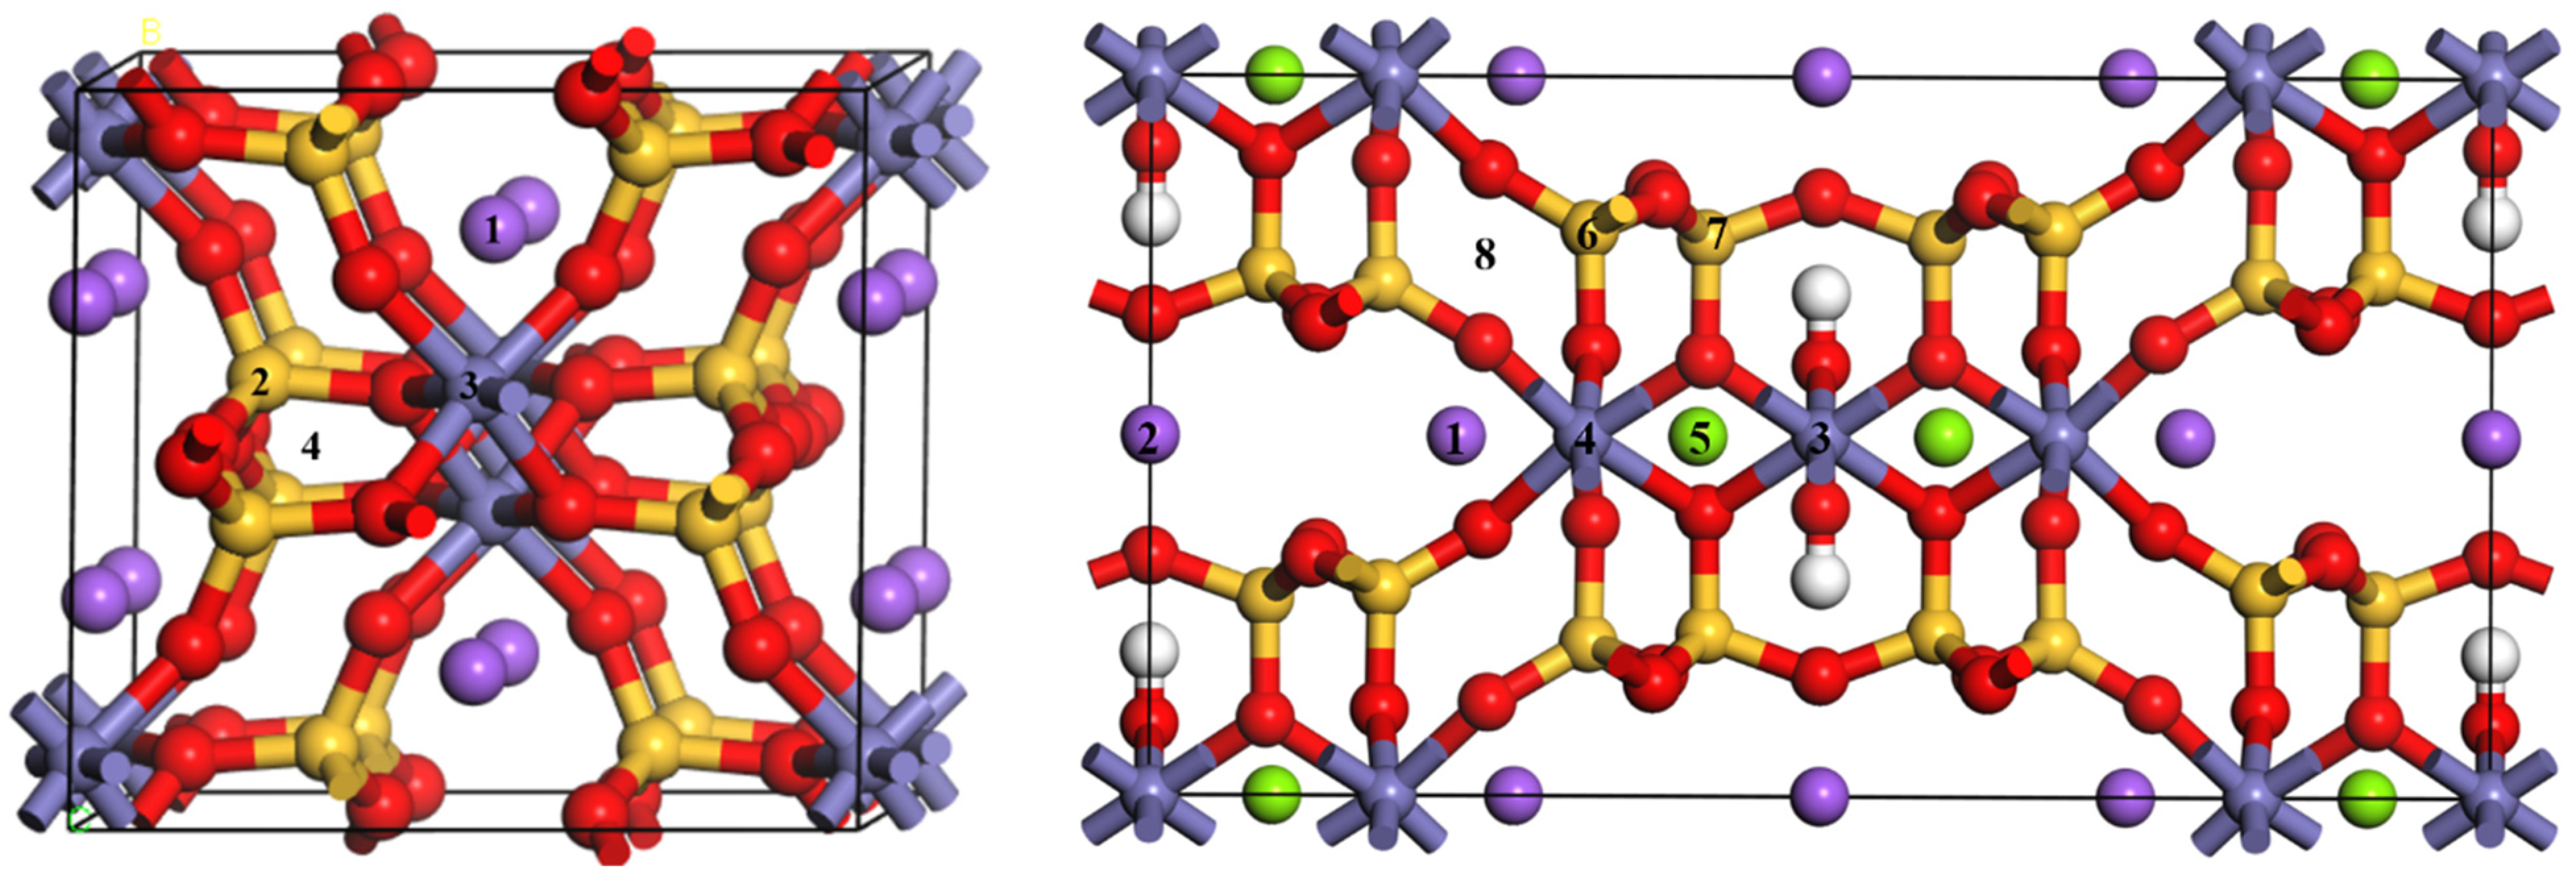
Density functional theory (DFT), which is a universal tool to predict the properties of molecules and condensed matter based on first principles [39,40], was used in this work to verify the occurrence state of Sc in aegirine. The simulated computations were conducted with the DFT-based Cambridge Serial Total Energy Package (CASTEP) code of the Materials Studio software (Materials Studio 2016, BIOVIA, San Diego, CA, USA) [41]. The valence electronic configurations of Na, Fe, O, Si, Mg, and Sc were [Ne]3s1, [Ar]3d8, [He]2s22p4, [Ne]3S23p2, [Ne]3s2, and [Ar]3d14s2, respectively. The generalized gradient approximation with Perdew–Burke–Ernzerhof (GGA-PBE) was selected to calculate the exchange and correlation energies of electron–electron interactions with 400 eV of cut-off energy [42,43,44,45]. Other parameters were set as 2.0 × 10⁻⁶ eV/atom of energy tolerance, 2 × 2 × 2 grid of Brillouin zone, 0.05 eV/Å of force tolerance, and 0.002 Å of displacement tolerance [46]. As shown in Figure 10, a 1 × 1 × 2 supercell of aegirine and riebeckite is formed, and one Sc atom is substituted with one atom or in the interstitial lattice site. The structures were optimized according to the aforementioned parameters. The structural optimization was deemed complete when these parameters satisfied the convergence standard, and the calculation results were satisfactory.
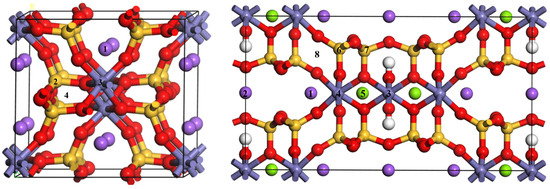
Figure 10.
Possible doping sites of 1 × 1 × 2 supercell aegirine (left) and 1 × 1 × 2 supercell riebeckite (right). The red ball represents the O atom, the purple ball represents the Na atom, the yellow ball represents the Si atom, the green ball represents the Mg atom, the white ball represents the H atom, and the lilac ball represents the Fe atom. One Sc substitutes one Na1, Si2, Fe3, and interstitial lattice site4 of left, one Sc substitutes one Na1, Na2, Fe3, Fe4, Mg5, Si6, Si7, and interstitial lattice site8 of right.
3.4. Formation of Sc in Aegirine Lattice
The formation energy (ΔE), which is used to analyze and compare the difficulty of formation with different impurity defects, refers to the energy required for an Sc atom to merge into the aegirine crystal and is calculated using the following formula [41,47]:
where Eimpurity is the energy of aegirine with impurity defects; Eperfect is the energy of the perfect aegirine; x is the Na atom, Fe atom, or Si atom in aegirine; y is the Sc atom of the impurity; and Ex and Ey are the energies of the x atom and y atom, respectively. In the case of doping in a lattice gap, Ex = 0 eV. Under the same calculation conditions, the smaller the value of ΔE, the greater the possibility of the corresponding doping form. The four doping forms that represent the four occurrence states of Sc in aegirine and riebeckite are as follows:
ΔE = Eimpurity + Ex − Eperfect − Ey
The Crystallographic Information File (cif) of aegirine and riebeckite was downloaded from the American Mineralogist Crystal Structure Database (AMCSD) [48,49], and the lattice parameters of aegirine were a = 9.6554 Å, b = 8.7952 Å, c = 10.5884 Å, α = 90°, β = 107.396°, and γ = 90°. After optimization, the lattice parameters were a = 9.5727 Å, b = 8.7007 Å, c = 10.6098 Å, α = 89.999°, β = 108.499°, and γ = 90°, which were very close to the experimental values in the literature [50,51]. The formation energies of Reactions (2)–(5) are shown in Table 9. The smallest of the four formation energies was −8.60 eV of Reaction (5), indicating that the most likely Sc doping occurred in the aegirine interstitial lattice site. In addition, the value of −6.88 eV for Reaction (3) was relatively small, indicating that Sc may also have a high probability of being present in aegirine upon Fe doping. The formation energies of Reactions (2) and (4) were −3.72 eV and 0.03 eV, respectively. This was much higher than those of the other reactions, indicating that Sc had a small chance of substituting Na and Si. Notably, the values of Reactions (2), (3) and (5) were negative, indicating that it was not very difficult for Sc to enter the aegirine cells under normal temperature and pressure.
Table 9.
Formation energy (ΔE) of the Sc in aegirine and the lattice parameters of different cells containing Sc.
The lattice parameters of riebeckite were a = 9.860 Å, b = 18.070 Å, c = 5.333 Å, α = 90°, β = 105.48°, and γ = 90°. After optimization, the lattice parameters were a = 9.873 Å, b = 17.735 Å, c = 5.307 Å, α = 90.000°, β = 103.390°, and γ = 90°, which were very close to the experimental values in the literature [52]. The formation energies of Reactions (6)–(10) are shown in Table 10. Since Na, Fe, and Si in riebeckite had two different sites each, there were a total of eight alternative sites, as shown in Figure 10. The formation energies of Reaction (7) in two different Fe sites were −5.05 eV and −6.26 eV, respectively, indicating that Sc may also have a high probability of being present in riebeckite upon Fe doping. The formation energies of Reaction (10) was 1.92 eV, indicating that it was very difficult for Sc doping in the riebeckite interstitial lattice site.
Table 10.
Formation energy (ΔE) of Sc in riebeckite and the lattice parameters of different cells containing Sc.
The lattice parameters of different cells containing Sc are listed in Table 9 and Table 10. The results showed that the cell volumes of aegirine with Sc for Fe, Si, and the interstitial lattice site were 849.78 Å3, 851.81 Å3, and 851.724 Å3, respectively, which were greater than the 838.015 Å3 of perfect cell volume. This phenomenon also appeared in the Sc doping of riebeckite. This may be because the ionic radius of Sc3+ (~81 Å) is larger than those of Fe3+ (~64 Å) and Si4+ (~42 Å) [53]. Therefore, the replacement of Sc for Na reduced the cell volume of aegirine because of the smaller ionic radius of Sc3+ (~81 Å) than Na+ (~95 Å).
3.5. Proposed Flowsheet for Comprehensive Utilization of Tailings
A feasible process for the comprehensive utilization of Bayan Obo rare-earth tailings was designed based on the study of process mineralogical characterization, as shown in Figure 11. The flowsheet includes physical, pyrometallurgical, and hydrometallurgical processes.
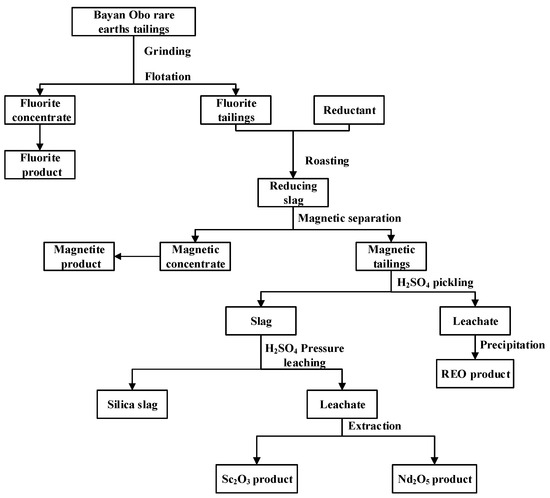
Figure 11.
Flowsheet for comprehensive utilization of tailings.
Since 97.20% of the F element exists in 26.8% of the fluorite in Bayan Obo rare-earth tailings, the monomer dissociation of fluorite is 79.39%, and the fluorite particles above 53 μm account for 57.67%; therefore, further grinding is needed to reduce the size of the fluorite particles and increase the liberation of the fluorite. The ground pulp is floated to produce a fluorite concentrate and tailings that are enriched in Fe, REE, Nb, and Sc. Because Sc mainly occurs in silicate minerals and some Nb-bearing minerals, in which it exists only in minor amounts, Sc and Nb need further enrichment. Hematite in the fluorite flotation tailings was magnetized (transformed to magnetite) by roasting under reducing conditions. Magnetite was then separated from the tailings via magnetic separation, enriching the residual tailings in REE and Nb. REE in tailings is mainly found in bastnasite, which can be decomposed at low temperatures by dilute acid, whereas minerals containing Sc and Nb are not easily decomposed at low temperatures. Therefore, more than 70% of REE can be recovered via low-temperature acid pickling. Finally, the pickled slag is leached under pressure to obtain a solution containing Nb, Sc, and non-toxic Si slag, which can be used as building materials. The entire process makes full use of valuable elements in tailings and is environmentally friendly.
4. Conclusions
Detailed mineralogical and chemical analyses of Bayan Obo rare-earth tailings were conducted with MLA, EPMA, XRD, ICP, and other analytical techniques. Valuable elements in the tailings include Fe, Fe, REE, and Nb; based on their deportment, a feasible flowsheet was proposed for their recovery. The mineralogical parameters provide theoretical guidance and reference values for improving the beneficiation process of this type of tailing and the recycling of other valuable minerals.
There are numerous minerals in Bayan Obo tailings with complex symbiosis, with 97.2% of F present in fluorite and 50.15% of Fe in hematite, which was easily separated through magnetization. Bastnasite contained more than 60% REE, and nioboaeschynite contained 48.47% Nb. Sc was primarily found in aegirine, riebeckite, monazite, ilmenorutile, and niobite, with the highest average content of 1.85% in niobite. The DFT calculation results showed that Sc existed in the form of Fe substitution or intergranular doping in aegirine with a high probability.
Author Contributions
Conceptualization, H.Y. and T.Q.; formal analysis, D.S.; investigation, D.S. and X.D.; funding acquisition, H.Y. and T.Q.; resources, H.Y.; data curation, X.D., D.S., Y.D., W.D. and Z.Y.; writing—original draft preparation, D.S.; writing—review and editing, H.Y. and T.Q.; visualization, D.S.; supervision, H.Y. and T.Q.; project administration, H.Y. and T.Q. All authors have read and agreed to the published version of the manuscript.
Funding
The Key Deployment Project of the Chinese Academy of Sciences (ZDRW-CN-2021-3); the “Open Competition Mechanism to Select the Best Candidates” project of Ganzhou in 2021 (E239A001); and Independent deployment Project of Jiangxi Institute of Rare Earth Research, CAS (E055A002).
Data Availability Statement
Not applicable.
Acknowledgments
This work was supported by the Key Deployment Project of the Chinese Academy of Sciences (ZDRW-CN-2021-3), the “Open Competition Mechanism to Select the Best Candidates” project of Ganzhou in 2021 (E239A001), and Independent deployment Project of Jiangxi Institute of Rare Earth Research, CAS (E055A002). This research was also supported by the advanced computing resources provided by the Supercomputing Center of the USTC.
Conflicts of Interest
The authors declare no conflict of interest.
References
- Sobri, N.A.; Yunus, M.Y.B.M.; Harun, N. A review of ion adsorption clay as a high potential source of rare earth minerals in Malaysia. Mater. Today Proc. 2023; in press. [Google Scholar] [CrossRef]
- Antoniassi, J.L.; Uliana, D.; Contessotto, R.; Kahn, H.; Ulsen, C. Process mineralogy of rare earths from deeply weathered alkali-carbonatite deposits in Brazil. J. Mater. Res. Technol. 2020, 9, 8842. [Google Scholar] [CrossRef]
- Sarker, S.K.; Bruckard, W.; Haque, N.; Roychand, R.; Bhuiyan, M.; Pramanik, B.K. Characterization of a carbonatite-derived mining tailing for the assessment of rare earth potential. Process Saf. Environ. Prot. 2023, 173, 154. [Google Scholar] [CrossRef]
- Li, J.; Li, M.; Zhang, D.; Gao, K.; Xu, W.; Wang, H.; Geng, J.; Huang, L. Clean production technology of Baiyun Obo rare earth concentrate decomposed by Al(OH)3-NaOH. Chem. Eng. J. 2020, 382, 122790. [Google Scholar] [CrossRef]
- Alonso, E.; Sherman, A.M.; Wallington, T.J.; Everson, M.P.; Field, F.R.; Roth, R.; Kirchain, R.E. Evaluating rare earth element availability: A case with revolutionary demand from clean technologies. Environ. Sci. Technol. 2012, 46, 3406. [Google Scholar] [CrossRef] [PubMed]
- Lan, X.; Gao, J.; Li, Y.; Guo, Z. A green method of respectively recovering rare earths (Ce, La, Pr, Nd) from rare-earth tailings under super-gravity. J. Hazard Mater. 2019, 367, 473. [Google Scholar] [CrossRef]
- Shahbaz, A. A systematic review on leaching of rare earth metals from primary and secondary sources. Miner. Eng. 2022, 184, 107632. [Google Scholar] [CrossRef]
- Huang, X.; Deng, H.; Zheng, C.; Cao, G. Hydrogeochemical signatures and evolution of groundwater impacted by the Bayan Obo tailing pond in northwest China. Sci. Total. Environ. 2016, 543, 357. [Google Scholar] [CrossRef]
- Yu, X.-L.; Bai, L.; Wang, Q.-C.; Liu, J.; Chi, M.-Y.; Wang, Z.-C. Recovery of Rare Earths, Niobium, and Thorium from the Tailings of Giant Bayan Obo Ore in China. Metall. Mater. Trans. B 2012, 43, 485. [Google Scholar] [CrossRef]
- Huang, X.; Cao, G.; Liu, J.; Prommer, H.; Zheng, C. Reactive transport modeling of thorium in a cloud computing environment. J. Geochem. Explor. 2014, 144, 63. [Google Scholar] [CrossRef]
- Han, Y.; Gao, P.; Li, Y. Perspective of the comprehensive utilization of Bayan Obo’s oxide ores by direct reduction. Metalmine 2009, 395, 1. [Google Scholar]
- Qin, Y.; Ma, Y.; Li, N. Research Overview of Bayan Obo Tailings Pond and its Resource Utilization. Multipurp. Util. Miner. Resour. 2020, 226, 100. [Google Scholar]
- Wang, L.; Zhong, B.; Liang, T.; Xing, B.; Zhu, Y. Atmospheric thorium pollution and inhalation exposure in the largest rare earth mining and smelting area in China. Sci. Total. Environ. 2016, 572, 1. [Google Scholar] [CrossRef] [PubMed]
- Wang, L.; Liang, T. Accumulation and fractionation of rare earth elements in atmospheric particulates around a mine tailing in Baotou, China. Atmos. Environ. 2014, 88, 23. [Google Scholar] [CrossRef]
- Zhou, Y.; Liu, J.; Cheng, G.; Xue, X.; Yang, H. Carbothermal reduction followed by sulfuric acid leaching of Bayan Obo tailings for selective concentration of iron and rare earth metals. Sep. Purif. Technol. 2021, 271, 118742. [Google Scholar] [CrossRef]
- Bao, X.; Wang, Z.; Su, Z. Thermodynamic analysis on roasting decomposition of Bayan Obo tailings for recovery of Sc2O3 using CaCl2—Carbon. Chin. J. Rare Met. 2016, 40, 275. [Google Scholar]
- Zhang, B.; Xue, X.; Yang, H. A novel process for recovery of scandium, rare earth and niobium from Bayan Obo tailings: NaCl-Ca(OH)2-coal roasting and acid leaching. Miner. Eng. 2022, 178, 107401. [Google Scholar] [CrossRef]
- Zhang, B.; Liu, C.; Li, C.; Jiang, M. Separation and recovery of valuable metals from low-grade REE–Nb–Fe ore. Int. J. Miner. Process. 2016, 150, 16. [Google Scholar] [CrossRef]
- Liu, Z.; Sun, L.; Zhao, H.; Xiang, T.; Qiu, J.; Jiang, M. Isothermal phase diagram of CaO–SiO2–Nb2O5-5 wt% Fe2O3–TiO2 system at 1200 °C. Ceram. Int. 2022, 48, 31636. [Google Scholar] [CrossRef]
- Zheng, Q.; Bian, X.; Wu, W.-y. Iron recovery and rare earths enrichment from Bayan Obo tailings using Coal-Ca(OH)2-NaOH roasting followed by magnetic separation. J. Iron Steel Res. Int. 2017, 24, 147. [Google Scholar] [CrossRef]
- Zheng, Q.; Wu, W.; Bian, X. Investigations on mineralogical characteristics of rare earth minerals in Bayan Obo tailings during the roasting process. J. Rare Earths 2017, 35, 300. [Google Scholar] [CrossRef]
- Binnemans, K.; Jones, P.T.; Blanpain, B.; Van Gerven, T.; Pontikes, Y. Towards zero-waste valorisation of rare-earth-containing industrial process residues: A critical review. J. Clean. Prod. 2015, 99, 17. [Google Scholar] [CrossRef]
- Cao, Z.; Cao, Y.; Qu, Q.; Zhang, J.; Mu, Y. Separation of bastnäsite from fluorite using ethylenediamine tetraacetic acid as depressant. Miner. Eng. 2019, 134, 134. [Google Scholar] [CrossRef]
- Li, W.; Chen, J.; Zhou, W.; Han, Y.; Shan, Y. Effect of bastnaesite as reductant on hematite reduction during in-situ suspension magnetization roasting of refractory iron ore under neutral atmosphere. Int. J. Min. Sci. Technol. 2022, 32, 877. [Google Scholar] [CrossRef]
- Lan, X.; Gao, J.; Xue, K.; Xu, H.; Guo, Z. A new finding and technology for selective separation of different REEs from CaO-SiO2-CaF2-P2O5-Fe3O4-RE2O3 system. Sep. Purif. Technol. 2022, 293, 121121. [Google Scholar] [CrossRef]
- Zhang, B.; Xue, X.; Huang, X.; Yang, H.; Chen, G. Study on recycling and leaching valuable elements from Bayan Obo tailings. Metall. Res. Technol. 2019, 116, 114. [Google Scholar] [CrossRef]
- Zhang, Y.; Lin, H.; Dong, Y. Comprehensive recovery of iron, niobium, rare earth and fluorite in Bayan Obo Tailings. Chin. J. Rare Met. 2017, 41, 799. [Google Scholar]
- Wang, F.; Zhao, Y.; Zhang, T.; Duan, C.; Wang, L. Mineralogical analysis of dust collected from typical recycling line of waste printed circuit boards. Waste Manag. 2015, 43, 434. [Google Scholar] [CrossRef]
- Al-Khirbash, S.A. Mineralogical characterization of low-grade nickel laterites from the North Oman Mountains: Using mineral liberation analyses–Scanning electron microscopy-based automated quantitative mineralogy. Ore Geol. Rev. 2020, 120, 103429. [Google Scholar] [CrossRef]
- Zhang, T.; He, Y.; Wang, F.; Ge, L.; Zhu, X.; Li, H. Chemical and process mineralogical characterizations of spent lithium-ion batteries: An approach by multi-analytical techniques. Waste Manag. 2014, 34, 1051. [Google Scholar] [CrossRef]
- Brough, C.P.; Warrender, R.; Bowell, R.J.; Barnes, A.; Parbhakar-Fox, A. The process mineralogy of mine wastes. Miner. Eng. 2013, 52, 125. [Google Scholar] [CrossRef]
- Lotter, N.O.; Kormos, L.J.; Oliveira, J.; Fragomeni, D.; Whiteman, E. Modern Process Mineralogy: Two case studies. Miner. Eng. 2011, 24, 638. [Google Scholar] [CrossRef]
- Baum, W. Ore characterization, process mineralogy and lab automation a roadmap for future mining. Miner. Eng. 2014, 60, 69. [Google Scholar] [CrossRef]
- Pezzotta, F. Scandium silicates from the Baveno and Cuasso al Monte NYF-granites, Southern Alps (Italy): Mineralogy and genetic inferences. Am. Mineral. 2005, 90, 1442. [Google Scholar] [CrossRef]
- Bo, Y.; Li, Y.; Meng, W. Application of electron probe Microanalyzer in exploring the occurrence characteristics of scandium in different minerals of the Bayan Obo deposit. Rock Miner. Anal. 2022, 41, 185. [Google Scholar]
- Shimazaki, H.; Yang, Z.; Miyawaki, R.; Shigeoka, M. Scandium-Bearing Minerals in the Bayan Obo Nb-REE-Fe Deposit, Inner Mongolia, China. Resour. Geol. 2008, 58, 80. [Google Scholar] [CrossRef]
- Liang, Y.B. Distribution characteristics and comprehensive utilization of scandium in Bayan Obo deposit. Chin. Rare Earths 1986, 7, 54. [Google Scholar]
- Li, C.; Li, X.; Xu, G. Technology development and industrialization of resources comprehensive utilization of intergrowth and associated ore in Baiyun Obo. Chin. Rare Earths 2015, 36, 151. [Google Scholar]
- Mkhonto, P.P.; Zhang, X.; Lu, L.; Xiong, W.; Zhu, Y.; Han, L.; Ngoepe, P.E. Adsorption mechanisms and effects of thiocarbamate collectors in the separation of chalcopyrite from pyrite minerals: DFT and experimental studies. Miner. Eng. 2022, 176, 107318. [Google Scholar] [CrossRef]
- Segall, M.D.; Lindan, P.J.; Probert, M.A.; Pickard, C.J.; Hasnip, P.J.; Clark, S.J.; Payne, M.C. First principles simulation ideas illustrations and the CASTEP code. J. Phys. Condens. Matter 2002, 14, 2717. [Google Scholar] [CrossRef]
- Yang, X.; Li, Y.; Chen, J. DFT study of the occurrence state of In and the correlation of In and Fe in sphalerite. Miner. Eng. 2022, 183, 107596. [Google Scholar] [CrossRef]
- Al Roman, A.; Rahman, M.M.; Hossain, K.; Das, S.; Ahmed, F. Development of high-performance ScS2 monolayer as cathode material: A DFT analysis. Solid State Commun. 2022, 352, 114828. [Google Scholar] [CrossRef]
- Perdew, J.P.; Burke, K.; Ernzerhof, M. Generalized Gradient Approximation Made Simple. Phys. Rev. Lett. 1996, 77, 3865. [Google Scholar] [CrossRef] [PubMed]
- Chen, Y.; Chen, J.; Guo, J. A DFT study on the effect of lattice impurities on the electronic structures and floatability of sphalerite. Miner. Eng. 2010, 23, 1120. [Google Scholar] [CrossRef]
- Heda, N.L.; Kumar, K.; Sharma, V.; Ahuja, U.; Dalela, S.; Ahuja, B.L. Impact of Co doping on electronic response, momentum densities and localisation of d electrons of TiO2: Compton profiles and first-principles calculations. Mater. Today Commun. 2023, 34, 105144. [Google Scholar] [CrossRef]
- Chen, J.; Wang, J.; Li, Y.; Liu, M.; Liu, Y.; Zhao, C.; Cui, W. Effects of surface spatial structures and electronic properties of chalcopyrite and pyrite on Z-200 selectivity. Miner. Eng. 2021, 163, 106803. [Google Scholar] [CrossRef]
- Nishidate, K.; Yoshizawa, M.; Hasegawa, M. Energetics of Mg and B adsorption on polar zinc oxide surfaces from first principles. Phys. Rev. B 2008, 77, 1. [Google Scholar] [CrossRef]
- Luo, Y.; Ou, L.; Chen, J.; Zhang, G.; Jin, S.; Xia, Y.; Zhu, B.; Zhou, H. DFT insights into the sulfidation mechanism of Fe-impurity smithsonite. Miner. Eng. 2021, 170, 107057. [Google Scholar] [CrossRef]
- Tian, M.; Gao, Z.; Khoso, S.A.; Sun, W.; Hu, Y. Understanding the activation mechanism of Pb2+ ion in benzohydroxamic acid flotation of spodumene: Experimental findings and DFT simulations. Miner. Eng. 2019, 143, 106006. [Google Scholar] [CrossRef]
- Secco, L.; Guastoni, A.; Nestola, F.; Redhammer, G.J.; Dal Negro, A. Crystal chemistry of aegirine as an indicator of P-T conditions. Mineral. Mag. 2018, 71, 321. [Google Scholar] [CrossRef]
- Sebakhy, K.O.; Vitale, G.; Pereira-Almao, P. Dispersed Ni-Doped Aegirine Nanocatalysts for the Selective Hydrogenation of Olefinic Molecules. ACS Appl. Nano Mater. 2018, 1, 6269. [Google Scholar] [CrossRef]
- Pacella, A.; Andreozzi, G.B.; Ballirano, P. Crystal chemical and structural characterization of fibrous tremolite from Ala di Stura (Lanzo Valley, Italy). Period. Di Mineral. 2008, 77, 51–62. [Google Scholar]
- Thongyong, N.; Chanlek, N.; Srepusharawoot, P.; Takesada, M.; Cann, D.P.; Thongbai, P. Experimental study and DFT calculations of improved giant dielectric properties of Ni2+/Ta5+ co-doped TiO2 by engineering defects and internal interfaces. J. Eur. Ceram. Soc. 2022, 42, 4944. [Google Scholar] [CrossRef]


Disclaimer/Publisher’s Note: The statements, opinions and data contained in all publications are solely those of the individual author(s) and contributor(s) and not of MDPI and/or the editor(s). MDPI and/or the editor(s) disclaim responsibility for any injury to people or property resulting from any ideas, methods, instructions or products referred to in the content. |
© 2023 by the authors. Licensee MDPI, Basel, Switzerland. This article is an open access article distributed under the terms and conditions of the Creative Commons Attribution (CC BY) license (https://creativecommons.org/licenses/by/4.0/).