Abstract
Kagem emerald mine in Zambia is deemed to the largest open-pit emerald mine with extremely high economic value and market share in the world. To meet the market demand for tracing the origin of emeralds, 30 emeralds from the region were tested, and some discoveries were made compared to previous studies. This study provides a full set of data through standard gemological properties, inclusions, color characteristics, advanced spectroscopic and chemical analyses, including Raman, micro micro-UV-Vis-NIR, FTIR, and LA-ICP-MS. The most common inclusions in Kagem emeralds are two-phase inclusions, which exhibit elongated, hexagonal, oval, irregular shapes or appear as negative crystals with incomplete hexagonal prism. These inclusions consist of H2O or H2O + CO2 (liquid) and CO2 + N2 or CO2 + N2 + CH4 (gas). Mineral inclusions typically include actinolite, graphite, magnetite, and dolomite. Black graphite encased in actinolite in Kagem emeralds is first reported. The FTIR spectrum of Kagem emeralds reveals that the absorption of type II H2O is stronger than that of type I H2O, indicating the presence of abundant alkali metals, which was confirmed through chemical analysis. Kagem emeralds contain high levels of Na (avg. 16,440 ppm), moderate-to-high Cs (avg. 567 ppm), as well as low-to-moderate levels of K (avg. 185 ppm) and Rb (avg. 14 ppm) concentrations.
1. Introduction
Emerald is the green variety of beryl colored by chromium and vanadium, and its ideal chemical formula is Be3Al2SiO18. The traditional classification system for emerald deposits has been expanded upon by Giuliani et al. (2019) [1]. Emerald occurrences and deposits were reclassified into two main types: tectonic magmatic-related (Type I) and tectonic metamorphic-related (Type II), and further subdivided into seven sub-types based on the host rock types. The Kafubu deposit in Zambia was classified as Type IA, associated with mafic-ultramafic rocks.
Zambia is one of the most significant emerald sources worldwide, second only to Colombia. Kagem emerald mine is located in the Ndola Rural Emerald Restricted Area and lies south of Kitwe and west of Ndola, in Zambia’s Copperbelt Province (Figure 1). Kagem Mine is considered the world’s largest single open-pit emerald mine, accounting for approximately 25%–30% of global emerald production, with a potential mine life of 22 to 2044 years [2]. Besides the Kagem Mine, there are other larger mines in the Kafubu area, including Kamakanga, Grizzly, and Chantete [3,4].
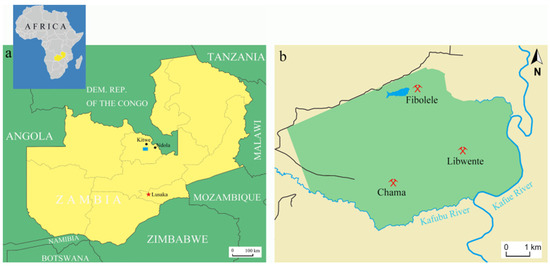
Figure 1.
(a) Zambia is a landlocked country located in the southern part of Africa, the capital is Lusaka. Kagem Mine (blue rectangle) is located in north-central Zambia, near the Kafubu River in the Ndola Rural Emerald Restricted Area (NRERA); (b) There are three operating pits in the Kagem Mine: Chama, Libwente, and Fibolele. Picture: Ran Gao.
Bank (1974) [5] proposed that the necessary chromic element in emeralds, chromium, comes from the magnetite in talc-magnetite schist. Koivula (1982) [6] was the first to report on the presence of tourmaline as inclusion in Zambian emeralds. Sliwa & Nguluwe (1984) [7] described the geological setting of Zambian emeralds. Seifert et al. (2004a) [8] first provided quantitative geochemical, petrological, and mineralogical data on the major rock types of the Kafubu emerald deposits. Seifert et al. (2004b) [9] conducted a comprehensive study of the environmental impact of the emerald mines in the Kafubu area. Zwaan et al. (2005) [3] first reported the Musakashi area, a new emerald deposit initially worked by local miners in 2002 [10]. In 2014, GIA Lab conducted a field exploration of the history, region geology, mining methodology, processing, operation, and auction of the Kagem Mine and published a detailed report [11]. However, detailed studies on the inclusion, spectroscopy, and chemical composition of Kagem emerald still need to be completed [12].
We received a batch of emerald samples from the Kagem Mine, Zambia in September 2022. This article provides a brief overview of the history and region geology of the Kagem Mine and a detailed research of gemological properties, inclusions, UV-Vis-NIR, FTIR, and chemical composition analysis. These analyses can effectively differentiate our materials from those sourced from other significant emerald localities.
2. Geological Setting
The Kagem emerald concession covers an area of approximately 46 square kilometers within a 200-square-kilometer productive zone and comprises the current operating Chama open pit mine and the bulk sampling pits at Libwente and Fibolelem [3].
The Kafubu area is located geologically at the center of the transcontinental Pan-African belts in central-southern Africa. The Crustal evolution is thought to be related to three successive orogenic events: the Ubendian, Irumide and Lufilian (Pan-African) [13,14,15]. The Kafubu emerald deposits occur within metamorphic rocks of the Muva Supergroup that date back to around 1700 Ma [million years ago] [16,17]. Muva Supergroup overlays the basement granite gneisses, consisting of footwall mica schist, talc-magnetite schist, amphibolite, and quartz-mica schist from bottom to top. The entire crustal domain subsequently underwent folding, thrusting, and metamorphism during the Pan-African orogeny, peaking at 530 Ma [18].
Emerald mineralization of the Kagem Mine is hosted by the talc-magnetite schist, which contains talc-chlorite-actinolite-magnetite schists (Figure 2) [7,14]. These schists were identified as metamorphosed komatiites—Mg-rich ultramafic rocks [9]. During the late stages of the Pan-African orogeny, the talc-magnetite schist was intruded by beryllium-rich pegmatite dykes (typically 2–10 m thick) [19,20]. These pegmatites appear as feldspar-quartz-muscovite bodies or as minor quartz-tourmaline veins and are believed to be related to neighbouring granitic rocks [7]. The steeply inclined pegmatite dykes and quartz tourmaline veins typically trend north to south or northwest to southeast.
The emerald mineralization in the Kagem Mine results from the interaction between metabasites and pegmatites and their accompanying hydrothermal fluids [9,19]. Emeralds are found in the phlogopite reaction zone (typically 0.5–3 m wide) between the talc-magnetite schist and the pegmatites and in the quartz-tourmaline veins, which produces gem-quantity emeralds, but only a tiny percentage [3]. In the reaction zone, talc-magnetite schist provided the important chromophore of chromium, while the pegmatites provided the beryllium. Emerald was formed under the proper pressure, temperature conditions (400–600 MPa and 590–630 °C) and chemical environment around 500 Ma [9,21]. The area subsequently underwent intense shearing and folding during the Lufilian orogeny, which may account for the fracturing and opacity of many emerald crystals [7].
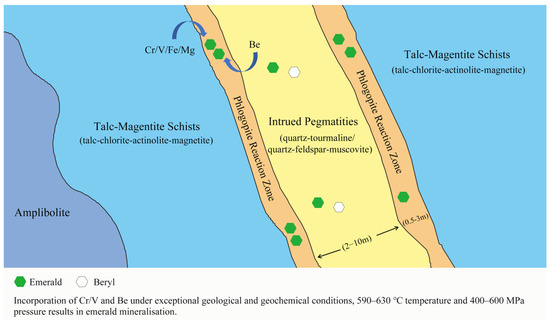
Figure 2.
Schematic representation of the metasomatic reaction zone between the talc-magnetite schists and the pegmatite formed common beryl and gem-quality emeralds. Modified from [22].
3. History
There are two major emerald areas in Zambia, including Musakashi and Kafubu areas. The Musakashi area was first reported in 2005. The emeralds from this area were characterized by their intense bluish-green color and multiphase inclusions, which were similar to the emeralds found in Muzo, Colombia [3,10,23]. Beryl was first discovered in the Kafubu area in 1928 by two geologists named Dicks and Baker. Some small exploration works were carried out during the 1940s and 50s’ [7]. Zambia’s Geological Survey Department mapped the Miku area and verified the deposit in 1971 [13,14]. After new occurrences were discovered in the 1970s, the Kafubu area became a significant producer of fine-quality emeralds. Because of the dramatic expansion of production and extensive illegal mining, the Government relocated the local population and established a restricted zone called the Ndola Rural Emerald Restricted Area [9]. In 1980, Kagem Mining Ltd. (55% owned by the Zambian Government) was authorized to explore and mine the Kafubu area in the same year [9].
In 2004, the British public-listed Gemfields Resources PLC began systematic exploration near the Pirala mine, south of the Ndola River, and discovered significant emerald deposits. Gemfields was awarded a management contract there in 2007. In the following year, Gemfields acquired 75% ownership of the mine, the remainder being held by the Government [11].
Kagem is primarily an open-pit mine, which presents the advantage of providing accessibility to every carat of emerald (Figure 3). After the surrounding rock is removed, miners utilize hammers and chisels to recover the emeralds. Any extracted production goes into a red production box (Figure 4). Since 2010, the Kagem Mine has been responsible for approximately 50% of emerald production in Zambia. Despite the high production volume, only a small portion of gem-quality emeralds are available for exportation In 2022, the Kagem Mine produced a total of 37.2 million carats of emeralds and beryl, including 259,500 carats of premium emeralds [24].
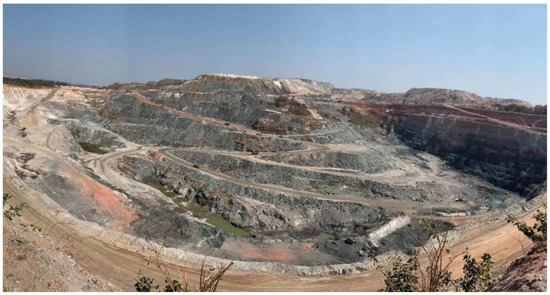
Figure 3.
The Kagem Mine is the world’s largest open-pit mine for emeralds and is located in the Ndola Rural District, Copperbelt Province, Zambia. Photo by Xiangjie Xiao.
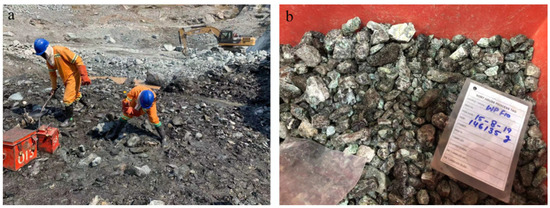
Figure 4.
(a) Miners use hammers and chisels to extract emeralds from the rock in the reaction zone; (b) The collected emeralds were in a secure box. Photo by Xiangjie Xiao.
Colored gemstone auctions have become a major source of revenue for the Gemfields Group. The company established its proprietary grading system to assess each gem according to its individual characteristics (size, color, shape and clarity) and implemented a pioneering auction and trading platform. The auctions were divided into two quality ranges: one for higher quality (HQ) emeralds and one for commercial quality (CQ, formerly known as lower-quality before 2016) emeralds [2]. The auctions are held in multiple cities, including Jaipur, Johannesburg, Lusaka, London, Dubai and Singapore [24]. Gemfields had held 43 auctions of emerald and beryl mined at Kagem up to November 2022 and generated $899 million in aggregate revenues [24]. The per-carat price for HQ and CQ emeralds in 43 auctions has been recorded (Figure 5a,b). The specific auction mix and the quality of the lots offered at each auction vary in characteristics such as size, color and clarity due to changes in mined production and market demand. Overall, the price of emeralds showed a clear upward trend, with HQ emeralds increasing from an initial $4.40 per-carat (July 2009) to a peak of $155.90 (May 2022) per-carat and CQ emeralds rising from an initial $0.31 per-carat (January 2010) to a highest $9.37 per-carat (April 2022). The value and demand for emeralds are rising steadily.
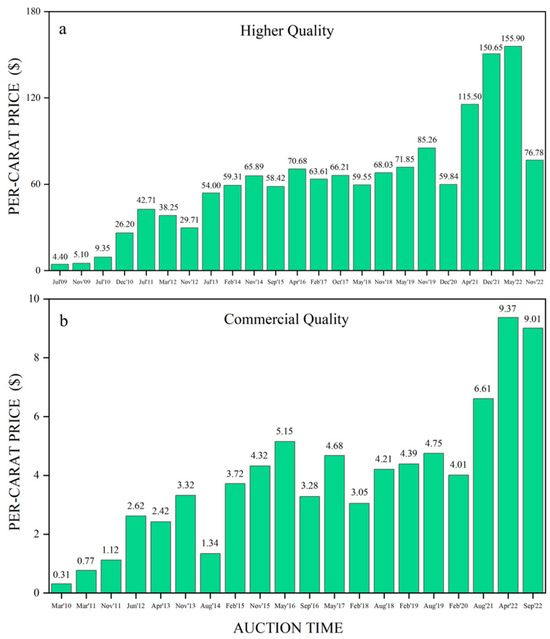
Figure 5.
(a) The per-carat price (calculated as: received/total weight sold) for higher quality emeralds from the Kagem Mine at auctions has been tracked since July 2009; (b) The per-carat price for commercial quality emeralds from the Kagem Mine at auctions has been recorded since March 2010. Auction data from [24].
4. Materials and Methods
A total of 30 transparent faceted emeralds (K1-30) were acquired from a gem trader who had visited the Kagem Mine and collected them (Figure 6). According to the GIA’s classification scheme, the emeralds we obtained belong to E-type samples [25]. There was no visible color zoning in the speciments although few contained some dark inclusions, and a few dark inclusions were visible, and five crystals were treated with oil and wax fillings.
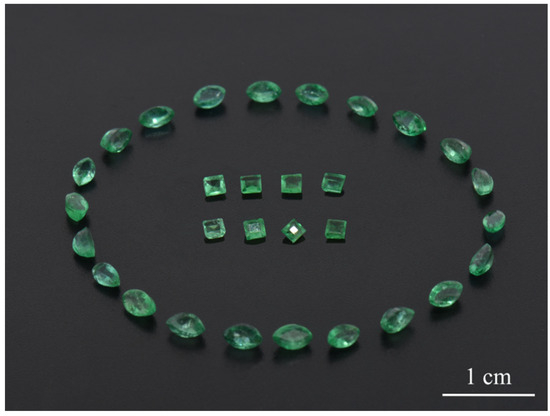
Figure 6.
Thirty faceted emeralds from the Kagem Mine, Zambia (the average weight was 0.15 ct). Photo by Ran Gao.
Standard gemological properties were obtained on all the samples. Refractive indices and birefringence were obtained with a gem refractometer (FGR-003A, FABLE, Shenzhen, China). UV fluorescence was examined under a UV lamp with long-wave (365 nm) and short-wave (254 nm) light in a darkened box. We also tested their reaction under the Chelsea filter (FCF-25, FABLE, Shenzhen, China). Dichroism was observed and photographed under a polarizing film (FID-1, FABLE, Shenzhen, China). Specific gravity was determined by the hydrostatic method. Internal features were observed and photographed by a Leica M205A microscopic system. In some cases, a polarizing microscope was used as well.
Inclusions were identified using a JASCO NRS-7500 Series Confocal Raman Microscope (JASCO, Tokyo, Japan) with 532 nm and 457 nm lasers at the Gemmological Institute, China University of Geosciences, Wuhan. Solid inclusions were identified in the 2000–100 cm−1 range with the 532 nm laser using a grating of 600 grooves/mm. Two-phase inclusions were identified in the 4000–100 cm−1 range with the 457 nm laser using a grating of 600 grooves/mm. The laser power was around 10 mW. Three scans with 15 s integration time for each scan were taken for a single spectrum. The Raman shift was calibrated with monocrystalline silicon (at 521 cm−1).
UV-Vis-NIR spectra were recorded by a Jasco MSV–5200 micro-spectrometer (JASCO, Tokyo, Japan) in the range of 300–900 nm, at a scan speed of 200 nm/min at the Gemmological Institute, China University of Geosciences, Wuhan. The optical aperture was set at 100 nm and 0.5 nm data interval. The black cross center of the faceted sample, when viewed through a polarizing mirror, indicates the C-axis. Polarized spectra of each oriented sample were collected to obtain ordinary ray (o-ray) and extraordinary ray (e-ray) absorption spectra.
Fourier-transform infrared spectroscopy (FTIR) was performed using a Bruker VERTEX 80 FTIR spectrometer (BRUKER OPTICS, Billerica, MA, USA), using 32 scans and 4 cm−1 spectral resolution at the Gemmological Institute, China University of Geosciences, Wuhan. The scanning ranges were 9000–4000 cm−1 in transmission mode.
Trace element contents were analyzed by laser ablation-inductively coupled plasma-mass spectrometry (LA-LCP-MS) using an Agilent 7700 ICP-MS combined with a GeoLas 193 nm laser (Agilent, Singapore) at Wuhan SampleSolution Technology Co., Ltd., Wuhan, China. We set the laser fluence at 9 J/cm2 with a 6 Hz repetition rate and the laser spot size at 44 μm diameter. Each analysis incorporated a background acquisition time of approximately 20–30 s, followed by 50 s of ablation. Element concentrations were calibrated against multiple reference materials (BCR-2G, BHVO-2G, and BIR-1G) without using an internal standard, and Al was chosen as the normalizing element [26]. Standard reference material NIST 610 glass was also applied to time-drift correction. The standard for LA-ICP-MS measurements is that the calibration values of the monitored reference materials agree within the error range within the recommended values. Quality control deviations: Major elements within 5% uncertainty and trace elements within 10% uncertainty. Two to three spots per sample were analyzed.
5. Results
5.1. Gemological Properties
The gemological properties of emeralds from the Kagem Mine are summarized in Table 1. The emeralds ranged from green to blueish green, and some displayed an attractive saturated bluish-green color. The refractive indices varied from 1.578–1.591 for ne and 1.589–1.597 for no with birefringence between 0.004 and 0.008. These values are higher than most of the significant emerald deposits. Specific gravity values ranged from 2.67 to 2.86. The emeralds from the Kagem Mine were typically inert to long- and short-wave UV radiation. The emeralds showed no reaction under the Chelsea filter. Dichroism was medium to strong yellowish green (o-ray) and bluish green (e-ray).

Table 1.
Gemological properties of emeralds from Kagem Mine, Zambia.
5.2. Microscopic Characteristics
Two-phase inclusions with a gas bubble were commonly found in the Kagem emeralds, displaying various shapes: rectangular, elongated, hexagonal, oval, or irregular shapes (Figure 7a). Some two-phase inclusions occurred as isolated negative crystals along a healed fissure plane, with an incomplete hexagonal prism shape (Figure 7b). At room temperature, the gas bubbles typically occupy approximately one-third of the volume of the cavity hosting the two-phase inclusions. Raman analysis confirmed that the liquid phase of the two-phase inclusions primarily consisted of water or a liquid mixture of H2O and CO2. The gas components included CO2 + N2 or CO2 + N2 + CH4 (Figure 8). There was a two-phase inclusion with liquid and solid phases, and the latter was identified as dolomite (peaks at 174, 296, and 1095 cm−1) by Raman analysis (arrow 1 in Figure 7a). It is worth noting that a hexagonal multi-phase inclusion, containing a gas bubble and an obvious solid phase in an aqueous solution, is rare in Kagem emeralds (arrow 2 in Figure 7a).
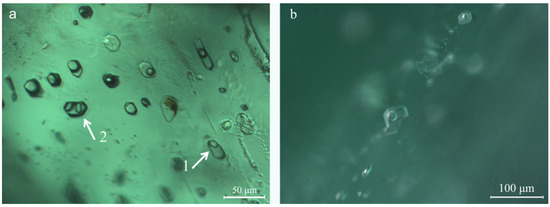
Figure 7.
(a) Two-phase inclusions with various shapes, a two-phase inclusion with solid phase and a hexagonal three-phase inclusion (indicated by white arrows 1, 2); (b) Two-phase inclusions appear as negative crystals with an incomplete hexagonal prism. Photomicrographs by Ran Gao.
Various mineral inclusions were observed in Kagem emeralds under the standard gemological microscope. Colorless needle-like minerals of varying lengths were seen in many samples and identified as actinolite through Raman analysis (Figure 9a). Black jagged minerals, identified by Raman analysis as graphite, were visible in the actinolite needles (Figure 9a). Occasionally, graphite appeared in oval or irregular shapes. Densely distributed black mineral crystals (Figure 9b), which appeared hexagonal or rectangular under high magnification, were identified using Raman spectroscopy as magnetite. Similar magnetite inclusions were also found in emeralds from Davdar, China [27]. A colorless transparent crystal was identified as dolomite via Raman spectroscopy (Figure 9c). Partly healed fissures displayed intense iridescent colors (Figure 9d).
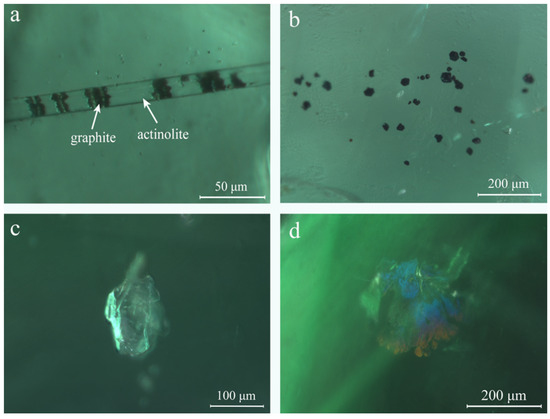
Figure 9.
Various mineral inclusions were observed in Kagem emeralds. (a) Black jagged graphites were wrapped inside a colorless needle-like growth tube, identified using Raman spectroscopy as actinolite; (b) Cluster of black magnetite appeared in the form of hexagons or rectangles under high magnification; (c) An isolated colorless crystal was consistent with the Raman spectrum of dolomite; (d) Obvious iridescent colors in partly healed fissures. Photomicrographs by Ran Gao.
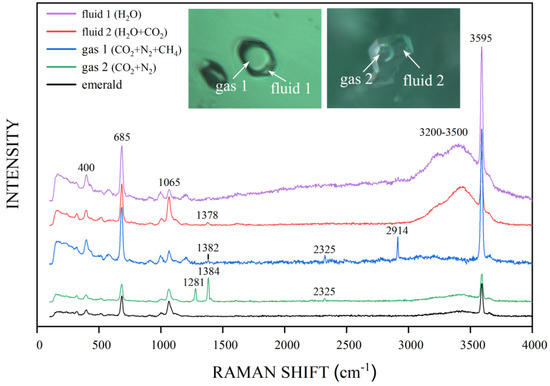
Figure 8.
Two-phase inclusions with a gas bubble in emeralds from Kagem Mine. Emerald: peaks at 400, 685 and 1065 cm−1; CO2: peaks at 1281 and 1378–1384 cm−1; N2: peak at 2325 cm−1; CH4: peak at 2914 cm−1; H2O in the inclusion: bands from 3200–3500 cm−1; H2O in structure channel: peak at 3595 cm−1 [28,29]. Spectra are offset vertically for clarity. Photomicrographs by Ran Gao.
5.3. UV-Vis-NIR Spectroscopy
Representative UV-Vis-NIR absorption spectra of the emeralds from the Kagem Mine are illustrated in Figure 10. Although the intensities varied among the samples, all exhibited the same bands for the ordinary and extraordinary rays. Specifically, the ordinary ray (o-ray) showed bands at 372, 430, 610, 637, and 840 nm, as well as a doublet at 681 and 684 nm. The bands at 430, 610, and 840 nm were broad and the positions were estimated. The extraordinary ray (e-ray) displayed bands at 372, 427, 625, 640, 662, 684, and 840 nm, the absorbance of a peak at 372 nm was weaker than its o-ray counterpart.
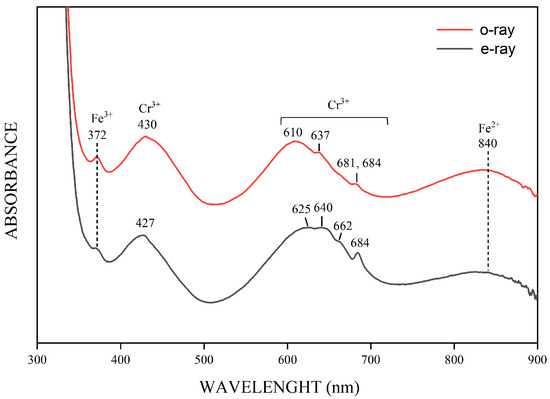
Figure 10.
Representative UV-Vis-NIR spectra were collected on sample K-3, which has 2652 ppm Cr, 267 ppm V, and 8759 ppm Fe. The spectra indicate the presence of Cr3+, Fe2+, and Fe3+. The intensities or positions of the Chromophore elements varied in different spectral orientations. The spectra are offset vertically for clarity.
The bands at 430 and 610 nm (o-ray) and 427, 625 and 640 nm (e-ray), as well as the peak at 684 nm (e-ray), indicated the presence of Cr3+, which causes the green color in emerald [30,31]. Additional, weaker peaks at 637, 662 and the doublet at 681 and 684 nm were also associated with the presence of Cr3+. The broad absorption bands from 600 to 750 nm were possibly linked to Fe3+-Fe2+ charge transfer [32]. Moreover, the peak at 372 nm indicated the presence of Fe3+, and the band at 840 nm was caused by Fe2+ [3,10,30,33], showing weaker intensity than the bands caused by Cr3+. The UV-Vis-NIR spectra feature differs from some previous [10,34,35], but is similar to other scholars’ findings [3,36].
5.4. Infrared Spectrometry
The near-infrared (NIR) spectrum of the emeralds was mainly related to the existing mode of H2O molecules in the channel (Figure 11). H2O molecules in the c-channels have been mainly classified as type I or type II water with their twofold axis perpendicular or parallel to the crystal c-axis, respectively [37].
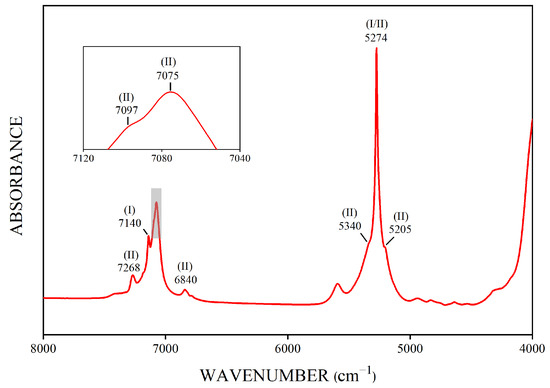
Figure 11.
The representative FTIR spectrum of Kagem emeralds shows some significant bands caused by the vibrations of type I or type II H2O molecules in the channels of the emerald structure. This graph displays that the spectral band intensities of type II H2O molecules are higher than those of type I H2O molecules in Kagem emeralds.
In the NIR range of 8000–4000 cm−1, the absorption spectrum bands of emeralds are predominantly attributed to the combined frequency and double-frequency vibration of structural water [38]. The most obvious band at 5274 cm−1 was caused by the combined frequency of bending (ν2) and antisymmetric stretching (ν3) modes of type I or II H2O molecules [38,39]. The sharp bands at 7097–7075 cm−1 doublet, slightly weak bands at 6840 and 7268 cm−1, and two small shoulder bands at 5340 and 5205 cm−1 near the 5274 cm−1 band were assigned to type II H2O molecules, which were associated with alkali ions in the channels of the emerald structure. The relatively strong band at 7140 cm−1 was related to the overtone frequency absorption of type I water, whereas other spectral bands of type I water, such as 7275 and 6820 cm−1 [38,40], were too weak to be discernible.
5.5. Trace Element Analysis
Twenty faceted emeralds from the Kagem Mine were analyzed by LA-ICP-MS, three spots for each sample and calculated their average values. The results are shown in Table 2.
Table 2.
Chemical composition (in ppm) of Kagem emeralds, obtained by LA-ICP-MS.
The Kagem emeralds for this study tended to have abundant alkali metals Li, Na, K, Rb, and Cs. Total alkali element concentrations ranged from 14,227 to 18,634 ppm (avg. 17,405 ppm). The dominant alkali metal was Na, which ranged from 13,812 to 17,408 ppm, averaging 16,437 ppm. The emeralds also contained a significant amount of Mg and Fe, ranging from 13,348 to 17,225 ppm (avg. 15,645 ppm) and from 4822 to 14,159 ppm (avg. 9713 ppm), respectively. Compared to the concentrations of Sc we measured (97–1534 ppm, avg. 436 ppm), analyses of emeralds by Saeseaw et al. (2014) [10] display relatively low Sc (12–75 ppm, avg. 31 ppm) in emeralds from Kafubu area. Cr (540–4844 ppm, avg. 2034 ppm), the most crucial chromophore in emeralds, was higher than V (197–529 ppm, avg. 307 ppm).
6. Discussion
6.1. Inclusion Characteristics of Kagem Emeralds
The rectangular and hexagonal shapes of the two-phase inclusions found in Kagem emerald were consistent with the multi-phase inclusion characteristics observed in schist-hosted emerald deposits, such as those found in Brazil, Russia, and most African deposits. We updated the component of the gas phase in two-phase inclusions. It is not monolithic and can contain not only CO2 but also occasionally N2 and CH4. Multi-phase inclusions with a solid phase were rare. H2O-NaCl-CO2 type inclusions were not found in our samples. Black graphite encased in actinolite was first observed in Kagem emeralds. The occurrence of abundant black magnetite and transparent dolomite further demonstrates a direct association between the internal characteristics of gemstones and their geological background. The talc-magnetite schist contained high concentrations of Fe and Mg.
6.2. Fe2+ Absorption Band in UV-Nis-NIR Spectroscopy
The Fe content in Table 2 represents the total Fe acquired by LA-ICP-MS, including Fe3+ and Fe2+. Kagem emeralds showed the weaker Fe2+-related absorption band in the NIR region compared to the bands caused by Cr3+. However, a lack of correlation was found between the intensity of the Fe2+-related band and the total Fe content [41]. Divalent metal ions (Me2+), such as Mg2+ and Fe2+, can substitute for Al3+ in the emerald structure. In order to maintain charge balance, the channels must be occupied by alkali ions such as Na+, K+, Rb+, and Cs+ (mainly Na+) [1,42], as follows:
Al3+ = Me2+ + Na+,
Moreover, the linear positive correlation between Na+ content and the sum of divalent cations is approximately 1:1 [41], thereby Fe2+ concentration can be calculated by the following equations:
Na+ppma = Fe2+ppma + Mg2+ppma,
To clarify, ppma represents parts per million by atom, Eam represents the average atomic mass of emerald chemical formula, and Xam represents the atomic mass of elements (Na, Mg and Fe).
The proportion of Fe2+ in the total Fe we calculated varied from 5.37% to 59.33%. A part of Fe2+ generated intervalence charge transfer with Fe3+, and this portion of Fe2+ did not affect the band in the NIR region. Additionally, the content of Cr3+ was a crucial factor to consider. We found a positive relationship between the Fe2+ to Cr3+ content ratio and the intensity ratio of the Fe2+-related band at 840 nm to the Cr3+-related band at 610 nm (o-ray). We speculated that the weaker band of Fe2+ in our samples was due to the low Fe2+ to Cr3+ value ratio. The concentration of Fe2+ can be roughly determined based on the content of bivalent cations and alkali metals. However, when discussing the relative strength of the Fe2+-related absorption band, the concentration of Cr3+ and V3+ should also be considered.
6.3. Channel Water Types of Kagem Emerald
Alkali metal ions, water and other macromolecules that exist within the structural channel of emeralds can maintain the charge balance and structural stability of minerals. The concentration of alkali metal ions affects the type of emerald channel water. In the presence of alkali ions, the axis of symmetry of adjacent H2O molecules is changed from perpendicular to parallel to the c-axis due to the electrostatic attraction between the charged cation and the oxygen of the H2O molecule [39].
Kagem emeralds, dominated by Na, contain abundant alkali metal ions (avg. 17,405 ppm). The NIR spectra of Kagem emeralds (Figure 11) revealed that the bands for type II H2O at 7097–7075 cm−1 doublet were more intense than those for type I H2O at 7140 cm−1. Moreover, the shoulder bands at 5340 and 5205 cm−1 were closer to 5274 cm−1 and were more obvious with higher proportions of type II H2O. As mentioned above, Kagem emeralds dominate type II H2O and the Kagem Mine belongs to one of three mineralization environment types—alkali-rich type (other types include alkali-poor and transition) [38]. Similar emeralds were found in Swat Valley, Pakistan, Goias, Brazil, and most African deposits.
6.4. Origin Traceability Analysis
A log-log plot of Rb versus Cs content can separate the Kagem mine from emeralds of all other significant deposits (Figure 12). Kagem emeralds exhibit low-to-moderate Rb values and moderate-to-high Cs, with a slight overlap with emeralds from Ural, Russia. Emeralds from Malipo, China, and Chitral, Pakistan display high Cs content, while Zimbabwean and Madagascan samples exhibit high Rb value. The emeralds from Colombia show very low Rb and Cs values. The plotted points of the two China deposits can be easily separated by their Cs content.
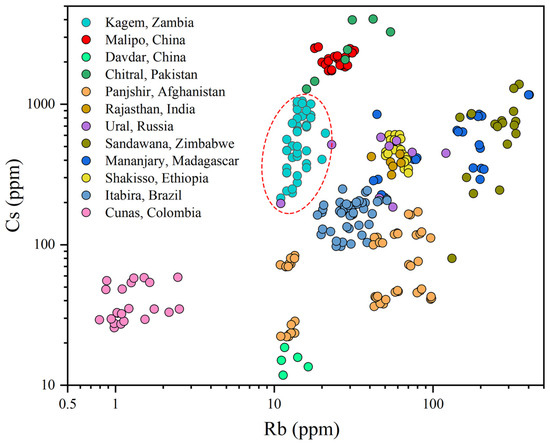
Figure 12.
A log-log plot displays the Rb versus Cs contents in emeralds from twelve different localities. Kagem emeralds (within the red dashed) show moderate-to-high Cs values and low-to-moderate Rb. Other sources are from [42,43,44,45,46,47,48,49,50,51].
A better separation between the Kagem Mine and other significant emerald localities can be made by plotting Na versus K (Figure 13). Kagem emeralds display high Na values combined with low-to-moderate K, despite a slight overlap with emeralds from Sandawana, Zimbabwe and Shakisso, Ethiopia, which have relatively high K. Emeralds from Madagascar, Ethiopia, Zimbabwe, and India, all of which belong to Type IA occurrences [1], contain high Na value over 10,000 ppm. The emeralds from Panjshir, Afghanistan exhibit a broad range of Na and K values in this plot. A log-log plot of Fe versus Zn was created to better distinguish our samples from those in Zimbabwe and Ethiopia (Figure 14). The samples from Kagem show relatively low Zn value.
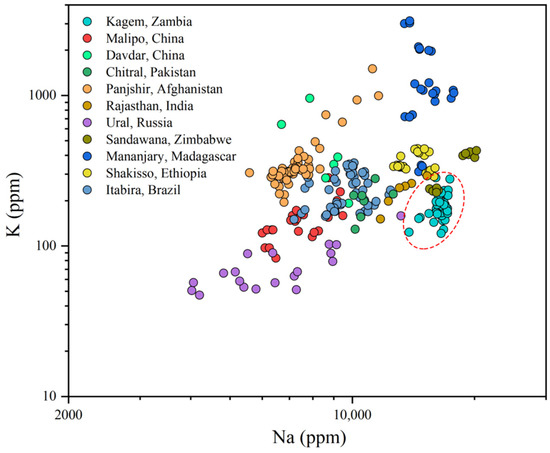
Figure 13.
A Na vs K plot shows the relatively high Na and low-to-moderate K concentrations in Kagem emeralds (within the red dashed) compared to the other significant deposits. Sources for some of the data are the same as in Figure 12.
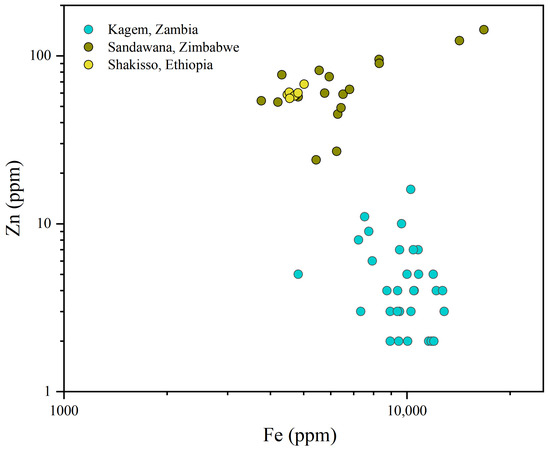
Figure 14.
The log binary graph of Fe and Zn shows that Kagem emeralds are not similar to those from Zimbabwe and Ethiopia in this data and can be distinguished. Data source: [43,51].
7. Conclusions
The origin tracing of emeralds requires sufficient samples as support, and new features have been discovered with the advancement of research methods. On the basis of previous research, this study provides new discoveries on Kagem emeralds, including the inclusion, spectral characteristics and chemical analyses.
Two-phase inclusions are common in Kagem emeralds, with the fluid phase containing H2O or liquid mixtures of H2O + CO2, and the gas phase consisting of combinations of CO2 + N2 or CO2 + N2 + CH4. A special two-phase inclusion with a solid phase has been identified as dolomite. Raman spectroscopy analysis revealed that Kagem emeralds contain a variety of solid inclusions, including actinolite, graphite, magnetite, and dolomite. Kagem emeralds typically show a conspicuous band caused by Fe2+ in the NIR region, and its relative intensity is affected by various elements. Kagem emeralds contain moderate-to-high Cs content (avg. 567 ppm) and low-to-moderate Rb (avg. 14 ppm) content. Additionally, they tend to exhibit high Na values (avg. 16,440 ppm) combined with low-to-moderate K (avg. 185 ppm). The projection diagram of Rb vs. Cs, Na vs. K, and Fe vs. Zn can distinguish the Kagem Mine from other significant emeralds deposits.
Author Contributions
Conceptualization, R.G. and Q.C.; formal analysis, R.G.; investigation, R.G. and Q.C.; writing—original draft preparation, R.G.; writing—review and editing, Q.C., Y.L. and H.H.; supervision, Q.C. All authors have read and agreed to the published version of the manuscript.
Funding
This research was funded by the Hubei Gem & Jewelry Engineering Technology Center (No. CIGTXM-03-202201 and No. CIGTXM-04-S202107), the Fundamental Research Funds for National University, China University of Geosciences (Wuhan) (No. CUGDCJJ202221), the Philosophy and Social Science Foundation of Hubei Province (No. 21G007), NSFC funding (No. 41874105).
Data Availability Statement
All supporting data and computational details are available on written request. These data are stored by the main author of this article.
Acknowledgments
We are grateful to Xiangjie Xiao for providing emerald samples and photographs of the deposit.
Conflicts of Interest
The authors declare no conflict of interest.
References
- Giuliani, G.; Groat, L.A.; Marshall, D.; Fallick, A.E.; Branquet, Y. Emerald Deposits: A Review and Enhanced Classification. Minerals 2019, 9, 105. [Google Scholar] [CrossRef]
- Gemfields Group Limited 2022. Interim Report 2022. Available online: https://senspdf.jse.co.za/documents/2022/jse/isse/GMLE/Interim22.pdf (accessed on 13 September 2022).
- Zwaan, J.C.; Seifert, A.; Vrána, S.; Laurs, B.; Anckar, B.; Simmons, W.; Falster, A.; Lustenhouwer, W.; Koivula, J.; Garcia-Guillerminet, H. Emeralds from the Kafubu Area, Zambia. Gems Gemol. 2005, 41, 116–148. [Google Scholar] [CrossRef]
- Zhang, Y.; Yu, X.-Y. Inclusions and Gemological Characteristics of Emeralds from Kamakanga, Zambia. Minerals 2023, 13, 341. [Google Scholar] [CrossRef]
- Bank, H. The emerald occurrence of Miku, Zambia. J. Gemmol. 1974, 14, 8–15. [Google Scholar]
- Koivula, J. Tourmaline as an Inclusion in Zambian Emeralds. Gems Gemol. 1982, 18, 225–227. [Google Scholar] [CrossRef]
- Sliwa, A.S.; Nguluwe, C.A. Geological setting of Zambian emerald deposits. Precambrian Res. 1984, 25, 213–228. [Google Scholar] [CrossRef]
- Seifert, A.; Vrána, S.; Lombe, D.K.; Mwale, M. Impact Assessment of Mining of Beryl Mineralization on the Environment in the Kafubu Area; Problems and Solutions. Geol. Surv. Czech Rep. 2004, 1, 63. [Google Scholar]
- Seifert, A.; Žáček, V.; Vrána, S.; Pecina, V.; Zacharias, J.; Zwaan, J.C. Emerald mineralization in the Kafubu area, Zambia. Bull. Geosci. 2004, 79, 1–40. [Google Scholar]
- Saeseaw, S.; Pardieu, V.; Sangsawong, S. Three-Phase Inclusions in Emerald and Their Impact on Origin Determination. Gems Gemol. 2014, 50, 114–132. [Google Scholar] [CrossRef]
- Hsu, T.; Lucas, A.; Pardieu, V.; Gessner, R. A Visit to the Kagem Open-pit Emerald Mine in Zambia. Gems Gemol. Available online: http://www.gia.edu/gia-news-research-kagem-emerald-mine-zambia (accessed on 22 July 2022).
- Behling, S.; Wilson, W.E. The kagem emerald mine: Kafubu area, Zambia. Mineral. Rec. 2010, 41, 59–67. [Google Scholar]
- Hickman, A.C.J. The Miku emerald deposit. Geol. Surv. Zambia Econ. Rep. 1972, 27, 35. [Google Scholar]
- Hickman, A.C.J. The Geology of the Luanshya Area. Geol. Surv. Zambia Rep. 1973, 46, 32. [Google Scholar]
- Tembo, F.; Kambani, S.; Katongo, C.; Simasiku, S. Draft Report on the Geological and Structural Control of Emerald Mineralization in the Ndola Rural Area, Zambia; University of Zambia, School of Mines: Lusaka, Zambia, 2000; p. 72. [Google Scholar]
- Daly, M.; Unrug, R. The Muva Supergroup of Northern Zambia: A craton to mobile belt sedimentary sequence. Trans. Geol. Soc. S. Afr. 1982, 85, 155–165. [Google Scholar]
- Waele, B.D.; Wingate, M.T.D.; Mapani, B.; Fitzsimons, I. Untying the Kibaran knot: A reassessment of Mesoproterozoic correlations in southern Africa based on SHRIMP U-Pb data from the Irumide belt. Geology 2003, 31, 509–512. [Google Scholar] [CrossRef]
- John, T.; Schenk, V.; Mezger, K.; Tembo, F. Timing and PT Evolution of Whiteschist Metamorphism in the Lufilian Arc-Zambezi Belt Orogen (Zambia): Implications for the Assembly of Gondwana. J. Geol. 2004, 112, 71–90. [Google Scholar] [CrossRef]
- Cosi, M.; Debonis, A.; Gosso, G.; Hunziker, J.; Martinotti, G.; Moratto, S.; Robert, J.P.; Ruhlman, F. Late proterozoic thrust tectonics, high-pressure metamorphism and uranium mineralization in the Domes Area, Lufilian Arc, Northwestern Zambia. Precambrian Res. 1992, 58, 215–240. [Google Scholar] [CrossRef]
- Parkin, J. Geology of the St. Francis Mission and Musakashi River Areas. Explanation of Degree Sheet 1226 NE and SE Quarters and Part of 1126 SE Quarter. Geol. Surv. Zambia Rep. 2000, 80, 49. [Google Scholar]
- Holland, T.; Blundy, J. Non-ideal interactions in calcic amphiboles and their bearing on amphibole-plagioclase thermometry. Contrib. Mineral. Petrol. 1994, 116, 433–447. [Google Scholar] [CrossRef]
- Gemfields Group Limited 2015. A Competent Persons Report on the Kagem Emerald Mine, Zambia. Available online: https://www.gemfieldsgroup.com/wp-content/uploads/2018/08/U6512_Kagem_Report_v14R.pdf (accessed on 22 September 2022).
- Pardieu, V.; Detroyat, S.; Sangsawong, S.; Saeseaw, S. In Search of Emeralds from the Musakashi Area of Zambia. InColor 2015, 6–12. [Google Scholar]
- Gemfields Group Limited 2023. Operational Market Update For the year ended 31 December 2022. Available online: https://www.gemfieldsgroup.com/operational-market-update-31-december-2022/?upf=dl&id=13426 (accessed on 12 February 2023).
- Vertriest, W.; Palke, A.C.; Renfro, N.D. Field gemology: Building a research collection and understanding the development of gem deposits. Gems Gemol. 2019, 55, 490–511. [Google Scholar] [CrossRef]
- Liu, Y.; Hu, Z.; Gao, S.; Günther, D.; Xu, J.; Gao, C.; Chen, H. In situ analysis of major and trace elements of anhydrous minerals by LA–ICP–MS without applying an internal standard. Chem. Geol. 2008, 257, 34–43. [Google Scholar] [CrossRef]
- Cui, D.; Liao, Z.; Qi, L.; Zhou, Z. Update on inclusions in emeralds from Davdar, China. Gems Gemol. 2020, 56, 543–545. [Google Scholar]
- Frezzotti, M.L.; Tecce, F.; Casagli, A. Raman spectroscopy for fluid inclusion analysis. J. Geochem. Explor. 2012, 112, 1–20. [Google Scholar] [CrossRef]
- Hu, Y.; Lu, R. Color Characteristics of Blue to Yellow Beryl from Multiple Origins. Gems Gemol. 2020, 56, 54–65. [Google Scholar] [CrossRef]
- Wood, D.L.; Nassau, K. The characterization of beryl and emerald by visible and infrared absorption spectroscopy. Am. Mineral. 1968, 53, 777–800. [Google Scholar]
- Schmetzer, K.; Berdesinski, W.; Bank, H. Über die Mineralart Beryll, ihre Farben und Absorptionsspektren. Z. Der Dtsch. Gemmol. Ges. 1974, 23, 5–39. [Google Scholar]
- Schmetzer, K. Letter: Comment on analysis of three-phase inclusions in emerald. Gems Gemol. 2014, 50, 316–319. [Google Scholar]
- Platonov, A.N.; Taran, M.N.; Minko, O.E.; Polshyn, E.V. Optical absorption spectra and nature of color of iron-containing beryls. Phys. Chem. Miner. 1978, 3, 87–88. [Google Scholar]
- Saeseaw, S.; Renfro, N.; Palke, A.; Sun, Z.; McClure, S. Geographic Origin Determination of Emerald. Gems Gemol. 2019, 55, 614–646. [Google Scholar] [CrossRef]
- Weng, X. The study on Gemological and Mineralogical Characteristics of Zambia Emerald. Master’s Thesis, China University of Geosciences, Beijing, China, 2014. (In Chinese with English Abstract). [Google Scholar]
- Pardieu, V.; Sharma, A.; Sangsawong, S.; Raynaud, V.; Luetrakulprawat, S. Emeralds from Zambia. Gamma Gaz. 2021, 1, 38–61. [Google Scholar]
- Wood, D.; Nassau, K. Infrared Spectra of Foreign Molecules in Beryl. J. Chem. Phys. 1967, 47, 2220–2228. [Google Scholar] [CrossRef]
- Qiao, X.; Zhou, Z.; Schwarz, D.; Qi, L.; Gao, J.; Nong, P.; Lai, M.; Guo, K.; Li, Y. Study of the Differences in Infrared Spectra of Emerald from Different Mining Areas and the Controlling Factors. Can. Mineral. 2019, 57, 65–79. [Google Scholar] [CrossRef]
- Zheng, Y.; Yu, X.; Xu, B.; Zhang, T.; Wu, M.; Wan, J.; Guo, H.; Long, Z.; Chen, L.; Qin, L. Water Molecules in Channels of Natural Emeralds from Dayakou (China) and Colombia: Spectroscopic, Chemical and Crystal Structural Investigations. Crystals 2022, 12, 331. [Google Scholar] [CrossRef]
- Mashkovtsev, R.; Thomas, V.; Fursenko, D.; Zhukova, E.; Uskov, V.; Gorshunov, B. FTIR spectroscopy of D2O and HDO molecules in the c-axis channels of synthetic beryl. Am. Mineral. 2016, 101, 175–180. [Google Scholar] [CrossRef]
- Hu, Y. Characteristics of Crystal Chemistry and Its Application to Nomenclature and Classification of Beryl. Ph.D. Thesis, China University of Geosciences, Wuhan, China, 2022. (In Chinese with English Abstract). [Google Scholar]
- Cui, D.; Liao, Z.; Qi, L.; Qian, Z.; Zhou, Z. A Study of Emeralds from Davdar, North-Western China. J. Gemmol. 2020, 37, 374–392. [Google Scholar] [CrossRef]
- Zwaan, J.C. Gemology, geology and origin of the Sandawana emerald deposits, Zimbabwe. Scr. Geol. 2006, 131, 1–211. [Google Scholar]
- Bidny, A.; Baksheev, I.; Popov, M.; Anosova, M. Beryl from deposit of the Ural Emerald Belt, Russia: ICP-MS-LA and infrared spectroscopy study. Moscow Univ. Geol. Bull. 2011, 66, 108–115. [Google Scholar] [CrossRef]
- Hu, Y.; Lu, R. Unique Vanadium-Rich Emerald from Malipo, China. Gems Gemol. 2019, 55, 338–352. [Google Scholar] [CrossRef]
- Karampelas, S.; Alshaybani, B.; Mohamed, F.; Sangsawong, S.; Al-Alawi, A. Emeralds from the Most Important Occurrences: Chemical and Spectroscopic Data. Minerals 2019, 9, 561. [Google Scholar] [CrossRef]
- Romero-Ordóñez, F.H.; González-Duran, A.F.; Garcia-Toloza, J.; Cohen, J.; Cedeño-Ochoa, C.; González, H.; Sarmiento, L. Mineralogy and Fluid Inclusions of the Cunas Emerald Mine, Maripí, Boyacá, Colombia. Earth Sci. Res. J. 2021, 25, 139–156. [Google Scholar] [CrossRef]
- Chen, Q.; Bao, P.; Li, Y.; Shen, A.; Gao, R.; Bai, Y.; Gong, X.; Liu, X. A Research of Emeralds from Panjshir Valley, Afghanistan. Minerals 2022, 13, 63. [Google Scholar] [CrossRef]
- Hanser, C.S.; Gul, B.; Häger, T.; Botcharnikov, R. Emerald from the Chitral Region, Pakistan: A New Deposit. J. Gemmol. 2022, 38, 234–252. [Google Scholar] [CrossRef]
- Qin, L.-J.; Yu, X.-Y.; Guo, H.-S. Fluid Inclusion and Chemical Composition Characteristics of Emeralds from Rajasthan Area, India. Minerals 2022, 12, 641. [Google Scholar] [CrossRef]
- Huang, Z.; Li, G.; Weng, L.; Zhang, M. Gemological and Mineralogical Characteristics of Emerald from Ethiopia. Crystals 2023, 13, 233. [Google Scholar] [CrossRef]
Disclaimer/Publisher’s Note: The statements, opinions and data contained in all publications are solely those of the individual author(s) and contributor(s) and not of MDPI and/or the editor(s). MDPI and/or the editor(s) disclaim responsibility for any injury to people or property resulting from any ideas, methods, instructions or products referred to in the content. |
© 2023 by the authors. Licensee MDPI, Basel, Switzerland. This article is an open access article distributed under the terms and conditions of the Creative Commons Attribution (CC BY) license (https://creativecommons.org/licenses/by/4.0/).