Article

Mineralogy of Agates with Amethyst from the Tevinskoye Deposit (Northern Kamchatka, Russia)

by
Evgeniya N. Svetova
1,
Galina A. Palyanova
2,*,
Andrey A. Borovikov
2,
Viktor F. Posokhov
3 and
Tatyana N. Moroz
2
1
Institute of Geology, Karelian Research Centre of Russian Academy of Sciences, Pushkinskaya St. 11, 185910 Petrozavodsk, Russia
2
Sobolev Institute of Geology and Mineralogy, Siberian Branch of Russian Academy of Sciences, Akademika Koptyuga Pr., 3, 630090 Novosibirsk, Russia
3
Dobretsov Geological Institute, Siberian Branch of Russian Academy of Sciences, Sakh’yanovoi St. 6a, 670047 Ulan-Ude, Russia
*
Author to whom correspondence should be addressed.
Minerals 2023, 13(8), 1051; https://doi.org/10.3390/min13081051
Submission received: 22 July 2023 / Revised: 5 August 2023 / Accepted: 7 August 2023 / Published: 9 August 2023
(This article belongs to the Special Issue Gem Characterisation)

Abstract

:
The Tevinskoye agate deposit is located in the North of the Kamchatka peninsula (Russia) and represented by agate-bearing Eocene basaltic and andesitic rocks of the Kinkilsk complex. Agate mineralization occurs in lavas and tuffs as amygdales, geodes, lenses and veins, which are the main sources of the resupply of coastal agate placers. The present study aimed to perform a comprehensive mineralogical, geochemical, and O-isotope investigation of amethyst-bearing agates, and to evaluate data concerning the origin of mineralization and the conditions for amethyst formation. Agates exhibit spectacular textures, with variation in the sequence of silica filling of amygdales and geodes. The mineral composition of the agates is mainly represented by micro- and macro-crystalline quartz, amethyst, length-fast and zebraic chalcedony, moganite, goethite, and clinoptilolite. Carbonate forms individual bands in the outer zones of some agates. The presence of small amounts of native copper, covellite, chalcopyrite and pyrite is a feature of these agates. Copper and iron mineralization are probably typomorphic features related to the host rock composition. The measured values of crystallite size (525–560 Å) and the high moganite content (up to 50%) of agate with amethyst are evidenced by the young age (~45 Ma) of agate-hosting rocks. Agate formation temperatures (21–229 °C) were calculated from the O-isotope composition of chalcedony (+19.6 to +25.5‰), quartz (+18.1 to +22.3‰), and amethyst (+18.2 to +21.5‰). The cold-water monophase fluid inclusions revealed in amethyst crystals suggest that the mineralizing fluids have low temperatures (<100 °C) and low salinity. Magnetite grains in host rock, together with goethite inclusions identified within the amethyst crystals, point to a change in redox conditions and the presence of iron in the agate-forming fluids, which entered the quartz lattice during crystallization and influenced the formation of the violet color.

1. Introduction

Agates are famous, beautiful, and fascinating stones found all around the world. Amethyst is a quartz variety often used in jewelry [1,2]. There are amethyst deposits located in Southern Rhodesia (Mwakambiko), Brazil (states of Rio Grande do Sul, Minas Gerais and Bahia/Brezheno, Jacobina, Santo Se), Uruguay (departments of Takuarembo, Artigas, Salto and Paysandu), Namibia (Brandberg), India (Decan), USA (Creed and Cripple Creek), Madagascar, Sri Lanka, Mexico (in the districts of Guanajuato, Guerraro and Las Vigas), Canada (Thunder Bay), South Korea, Zambia, Greece, Italy, Czech Republic, Slovakia, Romania, Bulgaria, Russia, and other countries [3,4]. In Europe, famous amethyst localities include Idar–Oberstein, Baden–Baden and Erzgebirge (Germany), Osilo in Sardinia (Italy), Pribram (Czech Republic), Schemnitz and Kremnitz (Slovakia), Ros, Montana, Sacarâmb, Baia Sprie and Cavnik (Romania), Madjarovo (Bulgaria), and Greece (Kassiteres–Sapes, Kirki, Kornofolia, on Lesvos and Milos Islands) [3,4,5]. In Russia, amethyst deposits are Vatikha, Talyan, Obman, Khasavarka (Urals), Cape Korabl (the Kola Peninsula), Rusavkino (Moscow region), Karadag (Crimea), etc.
However, most of the above deposits do not belong to agate deposits. It should be noted that amethyst is not particularly common at agate deposits. The most famous deposits of agates with amethyst are Brazilian and Uruguayan deposits [6,7,8,9,10]. Amethysts are found in agates in Morocco (Sidi Rahal) [11], the Ijevan deposit (Tavush region, Armenia), in some agate occurrences of Russia-Nepsky (Irkutsk region), Mulina Gora (Chita region), Sededen, Olskoe plateau (Magadan region), Belorechenskoye (Northern Timan), Tulguba (Onega Basin) [12,13,14,15,16], etc. Amethyst is usually found in the form of crystals and their intergrowths inside agate geodes, in amygdales, and in the cracks of volcanic rocks. Despite the large number of deposits in Russia, the sites are not developed and are mothballed or abandoned. Amethyst occurrences in agates are regarded as potential deposits for possible future exploitation [17].
Amethyst forms in a wide variety of environments [3,4]. Amethyst crystallization conditions are still a matter of scientific debate. The complex process of agate formation is not yet completely understood [18,19,20,21].
The Tevinskoye deposit of agates with amethyst in coastal placers was discovered in 1982, north of Cape Tevi in the interfluve of the Mainkaptal and Eltavayam rivers that flow into the Sea of Okhotsk in the western part of the Kamchatka peninsula. Placers of agates are located on the sea beaches of the Shelikhov Bay, the width of which at low tide reaches 100 m or more. During tidal processes, the sand and gravel components are washed off the surface of the beaches and agate-bearing boulder–pebble deposits are exposed. Many collection samples of agates with amethyst from the Tevinskoye deposit (further in the text «Tevi agates») are presented in many mineralogical and geological museums of Russia (A.E. Fersman Mineralogical Museum, Moscow; Central Siberian Geological Museum, Geological Museum SNIIGGiMS, scientific and educational center «Evolution of the Earth», Novosibirsk; Scientific Museum of V&S FEB RAS, Museum of Volcanoes «Volcanarium», Petropavlovsk-Kamchatsky). The Tevinskoye agate deposit is included in the list of specially protected natural areas of the Kamchatka peninsula.
There are no data on the mineralogy and formation conditions of Tevi agates in the literature. The present study aimed to evaluate data concerning the origin of mineralization and the conditions for amethyst formation. Of particular interest was the characterization of mineral composition, the identification of silica polymorphs, the study of the isotopic composition of the fluids that formed the agates, and the estimation of the temperature at which amethyst forms in agates. The article provides new data on the mineralogical and geochemical features of Tevi agates from Kamchatka peninsula and substantiates the conditions for the genesis of amethyst in agates.

2. Geological Setting

The Tevinskoye agate deposit is located on the eastern coast of the Shelekhov Bay of the Sea of Okhotsk, 120 km northeast of the Palana village in the western part of the Kamchatka Peninsula (Figure 1A). The deposit is represented by a series of agate-bearing fields associated with the Eocene volcanic rocks of the Kinkilsk complex [22]. The volcanic rocks of the Kinkilsk complex are widespread along the Sea of Okhotsk coast from Cape Khairyuzov and the Anadyrka River mouth (Cape Kinkil) to Podkagernaya Bay and along Shelikhov Bay, as well as along the western slope of the Sredinnyi Range of the Kamchatka Isthmus. These rocks have been sufficiently studied [23,24,25]. The volcanics of the Kinkilsk complex inherited the distribution of the earlier (Paleocene) volcanic fields, overlapping their highly deformed older rocks with a sharp angular unconformity.

2.1. Host Rocks

The volcanic rocks are represented by the subaerial lavas of differentiated basalt–andesidacite–rhyolite associations, lavabreccias, and blocky agglomerate tuffs [23]. In terms of (Na2O + K2O)–SiO2 ratio, these rocks are moderately potassic calc–alkaline. The texture of the rocks is porphyritic, with abundant phenocrysts. Phenocrysts in basalts and andesite-basalts are represented by plagioclase-two-pyroxene paragenesis, amphibole appears in andesites, and biotite and quartz are present in dacites and rhyolites. Oxide minerals are represented by ilmenite, magnetite, and titanomagnetite. Volcanic–sedimentary sequences are locally distributed and represented by interbedded vitroclastic tuffs and tuffites, often with lenses of mineral and brown coals, and coaly tuff siltstones. The secondary alterations of the rocks are pronounced unevenly and are generally insignificant, while the areas with local hydrothermal alteration occur as quartz veinlets and lenses [23,25].
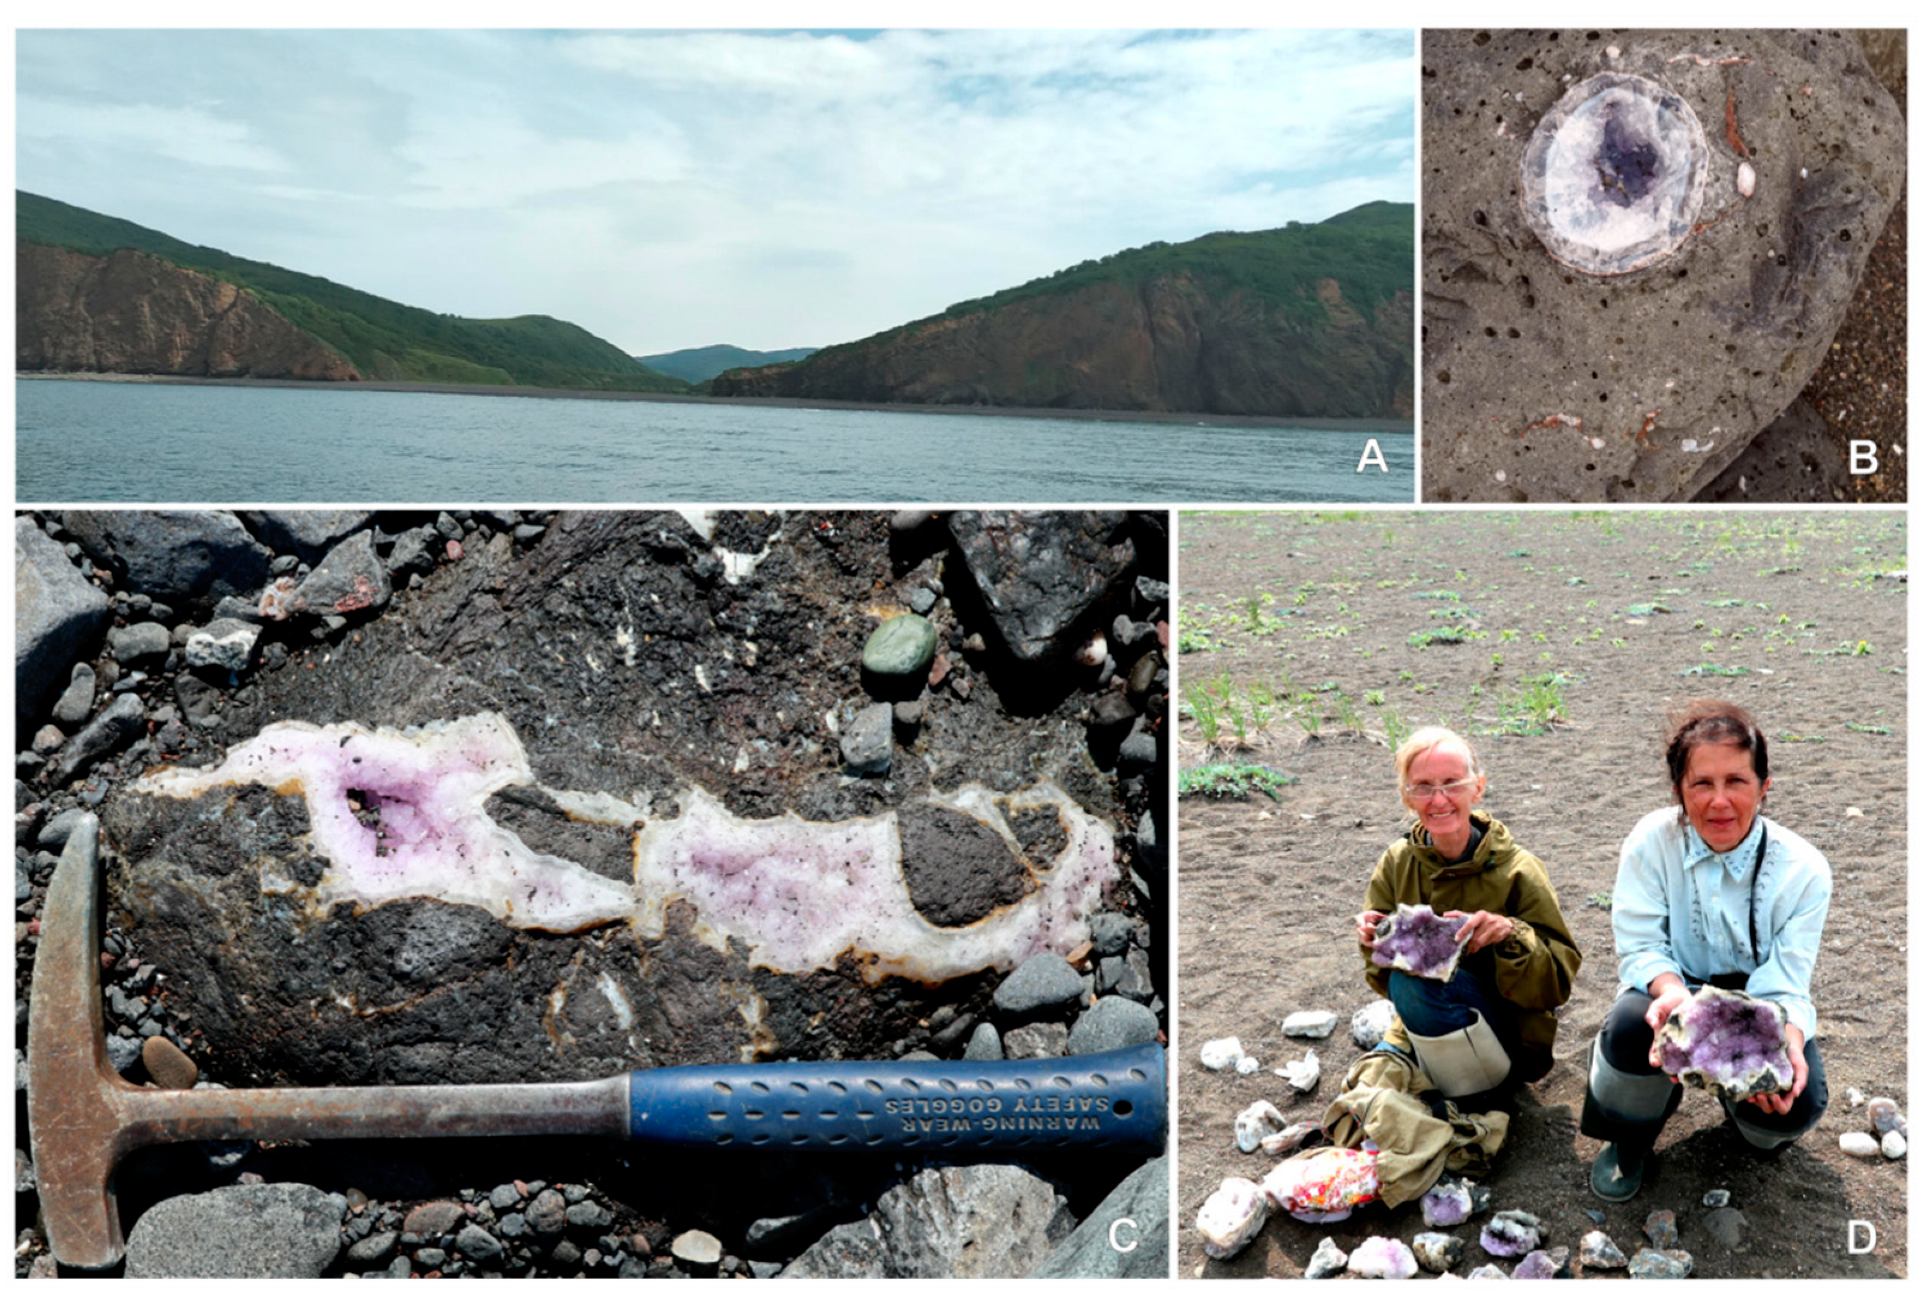
At the studied area (Cape Tevi), the most complete section of the complex is represented by volcanic rocks that unconformably overlie the Upper Cretaceous terrigenous rocks (Figure 1B) [24]. In this area, the lower part of the section is formed by amphibole–biotite dacites and rhyolites, which are replaced upward by two-pyroxene andesites and basalts. Subvolcanic rocks are widespread and presented by low-power dolerite sills [25]. The visible thickness of the section reaches up to 1500 m.
The K–Ar age of the volcanic rocks of the Kinkilsk complex is estimated as Middle–Upper Eocene (53–45 Ma) [23], while the age of volcanics from Cape Tevi is ca. 45 Ma [25]. The geodynamics of the Early Paleogene magmatism, represented in the Kamchatka region by calc-alkaline series, suggest their formation in an active continental margin setting [25].

2.2. Tevinskoye Deposit Description

The studied area is located a little north of Cape Tevi within the area of two coastal placers: Eltavayam and Mainkaptal (Figure 1B and Figure 2A). The total length of beaches in the placers area is 6.5 km [22]. The coastal cliffs are up to 300 m high. Formed by lava flows, breccias, and tuffs of the Kinkilsk complex, the cliffs contain a large number of agate amygdales and geodes, mineralized gas vesicles and cavities (Figure 2B,C), vein chalcedony, amethyst-like quartz, and calcite. They are the main source of replenishment of coastal agate placers. Agate geodes with quartz, amethyst or quartz-carbonate filling are present in the placers of primary industrial importance. Moss agates (translucent, bluish, and bluish-gray chalcedony with black manganese dendrites) and technical agate are also found. These are colored in light gray tones, sometimes with brownish, yellowish or bluish tints. The area of the Eltavayam placer is 45,000 m2, and reserves of technical agate are estimated at 900 kg, jewelry and ornamental agate are estimated at 315 kg, and moss agate is estimated at 180 kg. The area of the Mainkaptal placer is 61,000 m2, the reserves of technical agate are estimated to be 1037 kg, those of jewelry and ornamental stand agate are estimated at 427 kg, and those of moss are estimated at 61 kg [22].

3. Materials and Methods

Agates with amethysts were collected during a field season in 2021. Ten representative samples of agates with amethyst, with sizes varying from 3 to 25 cm and different textures, were selected for inclusion in research. Polished and thin sections, as well as powder samples, were prepared from agate fragments for use in analytical investigation. Petrographic (optical microscopy and SEM-EDS), XRD, and Raman spectroscopy investigations of the agates were carried out at the Institute of Geology, Karelian Research Centre, RAS (IG KRC RAS, Petrozavodsk, Russia). Polished thin sections of the agates were examined using transmitted light microscopy on a Polam-211 optical microscope. SEM-EDS investigations were carried out by using a VEGA II LSH (Tescan, Brno, Czech Republic) scanning electron microscope with EDS INCA Energy 350 (Oxford Instruments, Oxford, UK) on the carbon-coated polished thin section and chips of agate samples. Analyses were performed at the following parameters: W cathode, 20 kV accelerating voltage, 20 mA beam current, 2 µm beam diameter, and counting time of 90 s. The following standards were used: calcite, albite, MgO, Al2O3, SiO2, FeS2, wollastonite, Fe, Zn, and InAs. SEM-EDS quantitative data were obtained and used in the determination of the analysis accuracy via processing performed using the Microanalysis Suite Issue 12, INCA Suite version 4.01 (Oxford Instruments, Oxford, UK).
Powder XRD analysis was carried out using a Thermo Scientific ARL X’TRA (Thermo Fisher Scientific, Ecublens, Switzerland) diffractometer (CuK-radiation, voltage 40 kV, current 30 mA). Chalcedony and amethyst crystal samples from agate were scanned for review in the range of 5–156° 2θ at a scanning step of 0.40° 2θ/min. Diffractograms in the 66–69° and 25–28° 2θ ranges were recorded at a scanning step of 0.2° 2θ/min to obtain more precise measurements of parameters of diffraction reflections. X-ray phase and structural analyses were carried out using the program pack Win XRD, ICCD (DDWiew2008). Agate samples were hand-ground to obtain grain sizes < 50 μm. The detection limit for XRD phase identification was 3 wt.%.
Raman spectroscopy was used to identify and characterize SiO2 polymorphs at the local zones of banded agates. Raman spectroscopy analysis was conducted on a dispersive Nicolet Almega XR Raman spectrometer (Thermo Fisher Scientific, Waltham, MA, USA), using the 532 nm wavelength of Nd-YAG laser (Thermo Fisher Scientific, Waltham, MA, USA). The spectra were collected at 2 cm–1 spectral resolution. A confocal microscope with a 50× objective lens was used to focus an excitation laser beam on the sample and to collect a Raman signal from an area with a diameter of 2 µm. Raman spectra were acquired in the 85–1200 cm−1 spectral region, with 30 s exposition time and laser power of 10 mW. The curve-fitting algorithm in the OMNIC software (v.8.2., Thermo Fisher Scientific, Waltham, MA, USA) was used to fit the spectra in the 400–550 cm−1 range using peaks of moganite at 502 cm−1 and quartz at 465 cm− 1. Raman spectral data, such as peak position and band area (i.e., integrated area), were determined by fitting the spectra with Lorentzian functions. For the calculation of moganite concentrations, we used a calibration curve provided by Götze et al. [26].
The infrared spectroscopy study was performed using a FT-801 FTIR spectrometer (NPF Simex, Novosibirsk, Russia) at the Petrozavodsk State University (Petrozavodsk, Russia). Analyses were carried out on a doubly polished wafer of agate with a thickness of about 1 mm. IR spectra were recorded from a square aperture, limiting the studied sample surface to an area of 1 cm2. The spectra were recorded in transmission geometry at room temperature in the range of 2400–4000 cm–1 (0.5 cm–1 spectral resolution, 50 scans).
SEM-EDS, Raman spectroscopy, cryo- and thermometry were also carried out in the Analytical Centre for Multielemental and Isotope Research of the Sobolev Institute of Geology and Mineralogy, Russian Academy of Sciences (Novosibirsk, Russia). Chemical analyses of mineral phases were carried out using a MIRA LMU electron scanning microscope (Tescan Orsay Holding, Brno–Kohoutovice, Czech) with an INCA Energy 450þ X-Max energy-dispersion spectrometer (Oxford Instruments Nanoanalysis Ltd., Abingdon, UK). The operation conditions were: an accelerating voltage of 20 kV, a probe current of 1 nA and a spectrum recording time of 15 to 20 s. Raman spectra of goethite, pyrite and clinoptilolite were recorded on a Horiba Jobin Yvon LabRAM HR800 spectrometer, with a 1024-pixel liquid nitrogen-cooled charge-coupled device (LN/CCD) detector used for the excitation of 532 nm wavelengths from a frequency-doubled Nd:YAG laser operating at 1064 nm. Raman spectra were collected in a backscattering geometry using an Olympus BX41 microscope at a fixed orientation of the crystal, with the incident laser polarization perpendicular to the surface. The spectral resolution of the recorded Stokes Raman spectra was set to ~3.0 cm−1 at a Raman shift of 1300 cm−1. This resolution was achieved by using one grating with 1800 grooves/mm, equivalent to 150 μm slits, and a pinhole. Using the microscope with an Olympus 50× objective lens of WD = 0.37 mm and with a 0.75 numerical aperture for the visible spectral range produces a focal spot diameter of ~2 μm. The power of the laser radiation used was set to about 0.5 mW on the sample to avoid sample heating. The absence of sample heating was tested via comparison with the Raman spectra. The absence of sample heating was tested by comparison with the Raman spectra recorded at 7 and 0.3 mW power of the incident laser beam at the sample. The majority of the spectra were recorded using a neutral density filter, D = 1. The spectrometer was wavenumber calibrated with a silicon standard. Cryo- and thermometry methods were used to determine the temperatures of phase transitions in fluid inclusions in quartz (a THMSG-600 microthermal chamber from “Linkam” with a measurement range of −196/+600 °C). The total concentrations of salts in the solutions of fluid inclusions and their belonging to one or another water–salt system were determined using the cryometry method [27,28,29].
The isotope composition of oxygen, as O2, was defined by a FINNIGAN MAT 253 gas mass spectrometer at the Dobretsov Geological Institute of Siberian Branch of Russian Academy of Sciences (Ulan-Ude, Russia) using a double system of inflow in a classic variant (standard–sample). To determine δ18O values, the samples were prepared using laser fluorination with the “laser ablation with oxygen extraction from silicates” mode in the presence of a BrF5 reagent according to the method of [30]. Only pure minerals (as fragments), with a total weight of 1.5–2.5 mg, were used for oxygen isotope analysis. The calculations of δ18O were performed using the international standards NBS-28 (quartz) and NBS-30 (biotite). The accuracy of the obtained data was checked via regular measurements of an inner standard GI-1 (quartz) and a laboratory standard Polaris (quartz) of IGEM RAS. The analytical precision for δ18O was (1s) ± 0.2 ‰.

4. Results

4.1. Macro- and Microscopic Observation

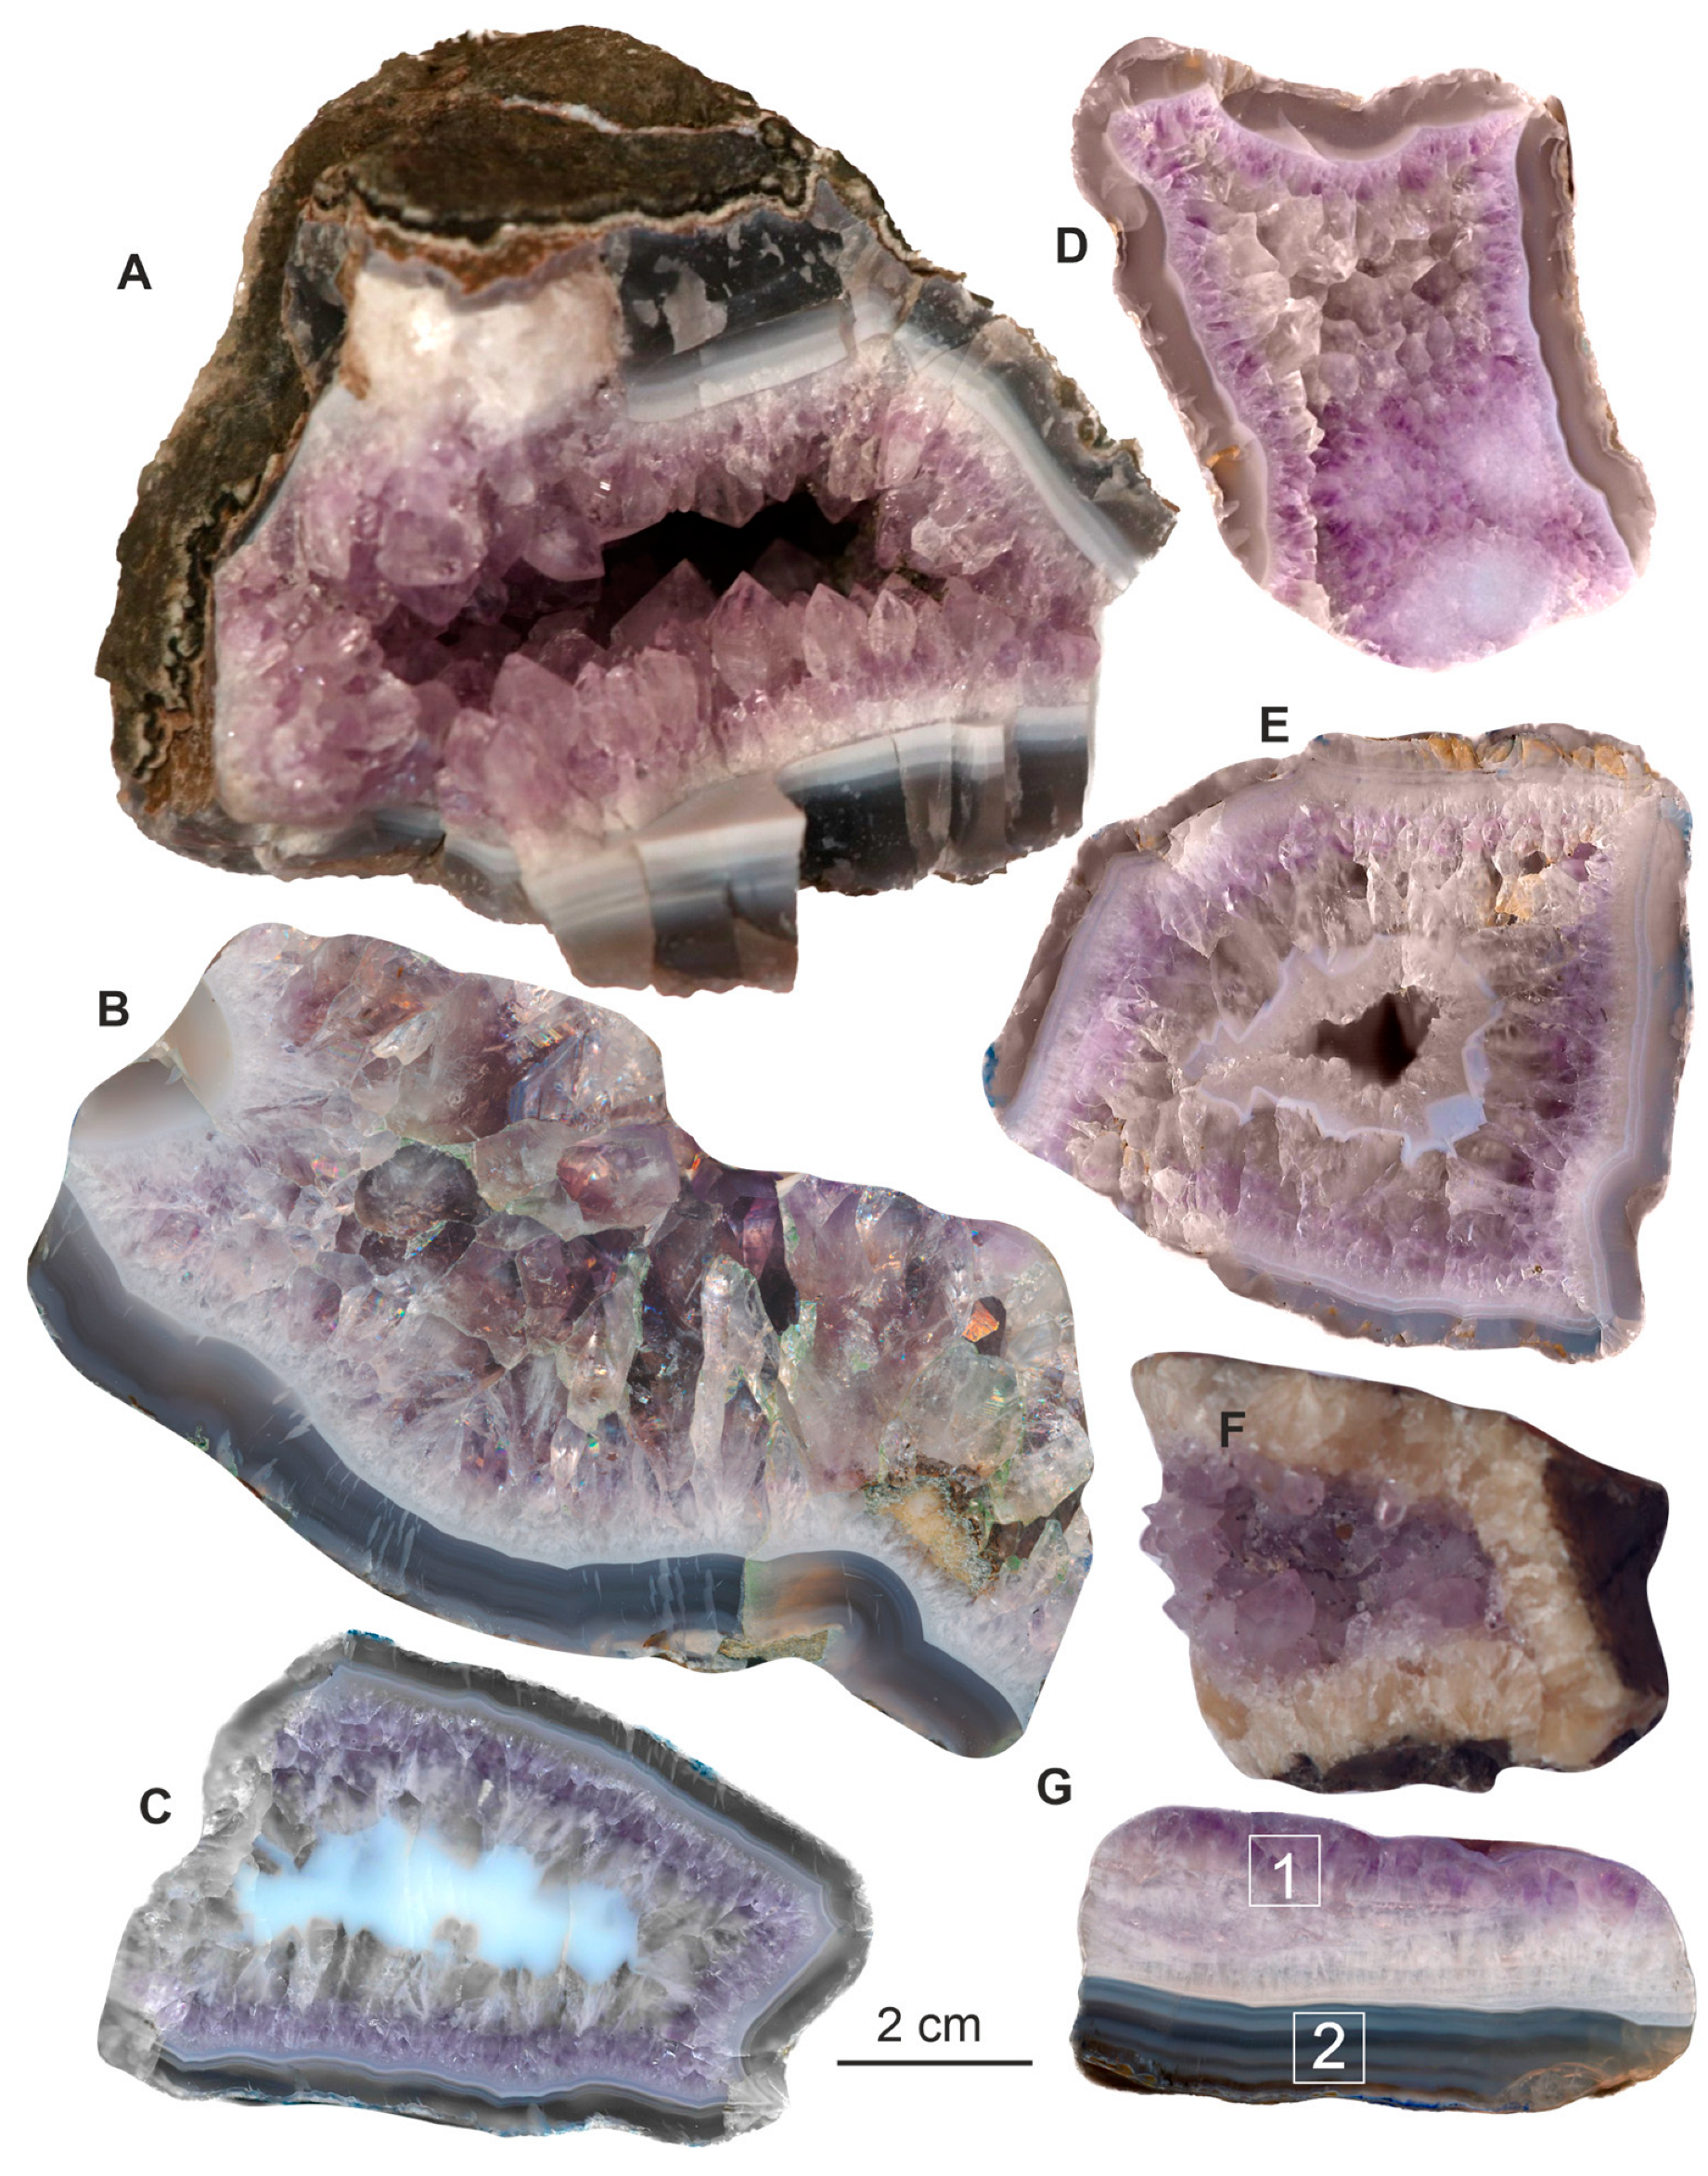
Agate amygdales and geodes with amethyst exhibit rounded or lens-like shapes (Figure 2B,C). The mean size of the agates ranges from 3 to 12 cm, and large samples with a size of up to 30 cm occur rarely (Figure 2D). Agates mostly display monocentric concentrically zoned (Figure 3A,E,C). The outer parts of agates are characterized by a fine-banding texture and they display alternate light-gray and white-colored layers, with thickness varying from 0.5 mm to 1 cm (Figure 3A,B,G). The banded area is followed to the inside of the geode by quartz crystals. Amethyst crystals with sizes of up to 3 cm along c-axis encrusted central agate cavities as overgrowth on colorless and milky-white quartz (Figure 3A,B). The violet amethyst color commonly increases in quartz crystals towards the agate center. Sometimes amethyst can compose the individual intermediate layer between outer banded and internal crystalline agate zones (Figure 3C,E). In some agates, thick carbonate (calcite) layers form the outer zone (Figure 3F). The marginal rim of the agates at the point of contact with the host rock often comprises zeolite crystals.
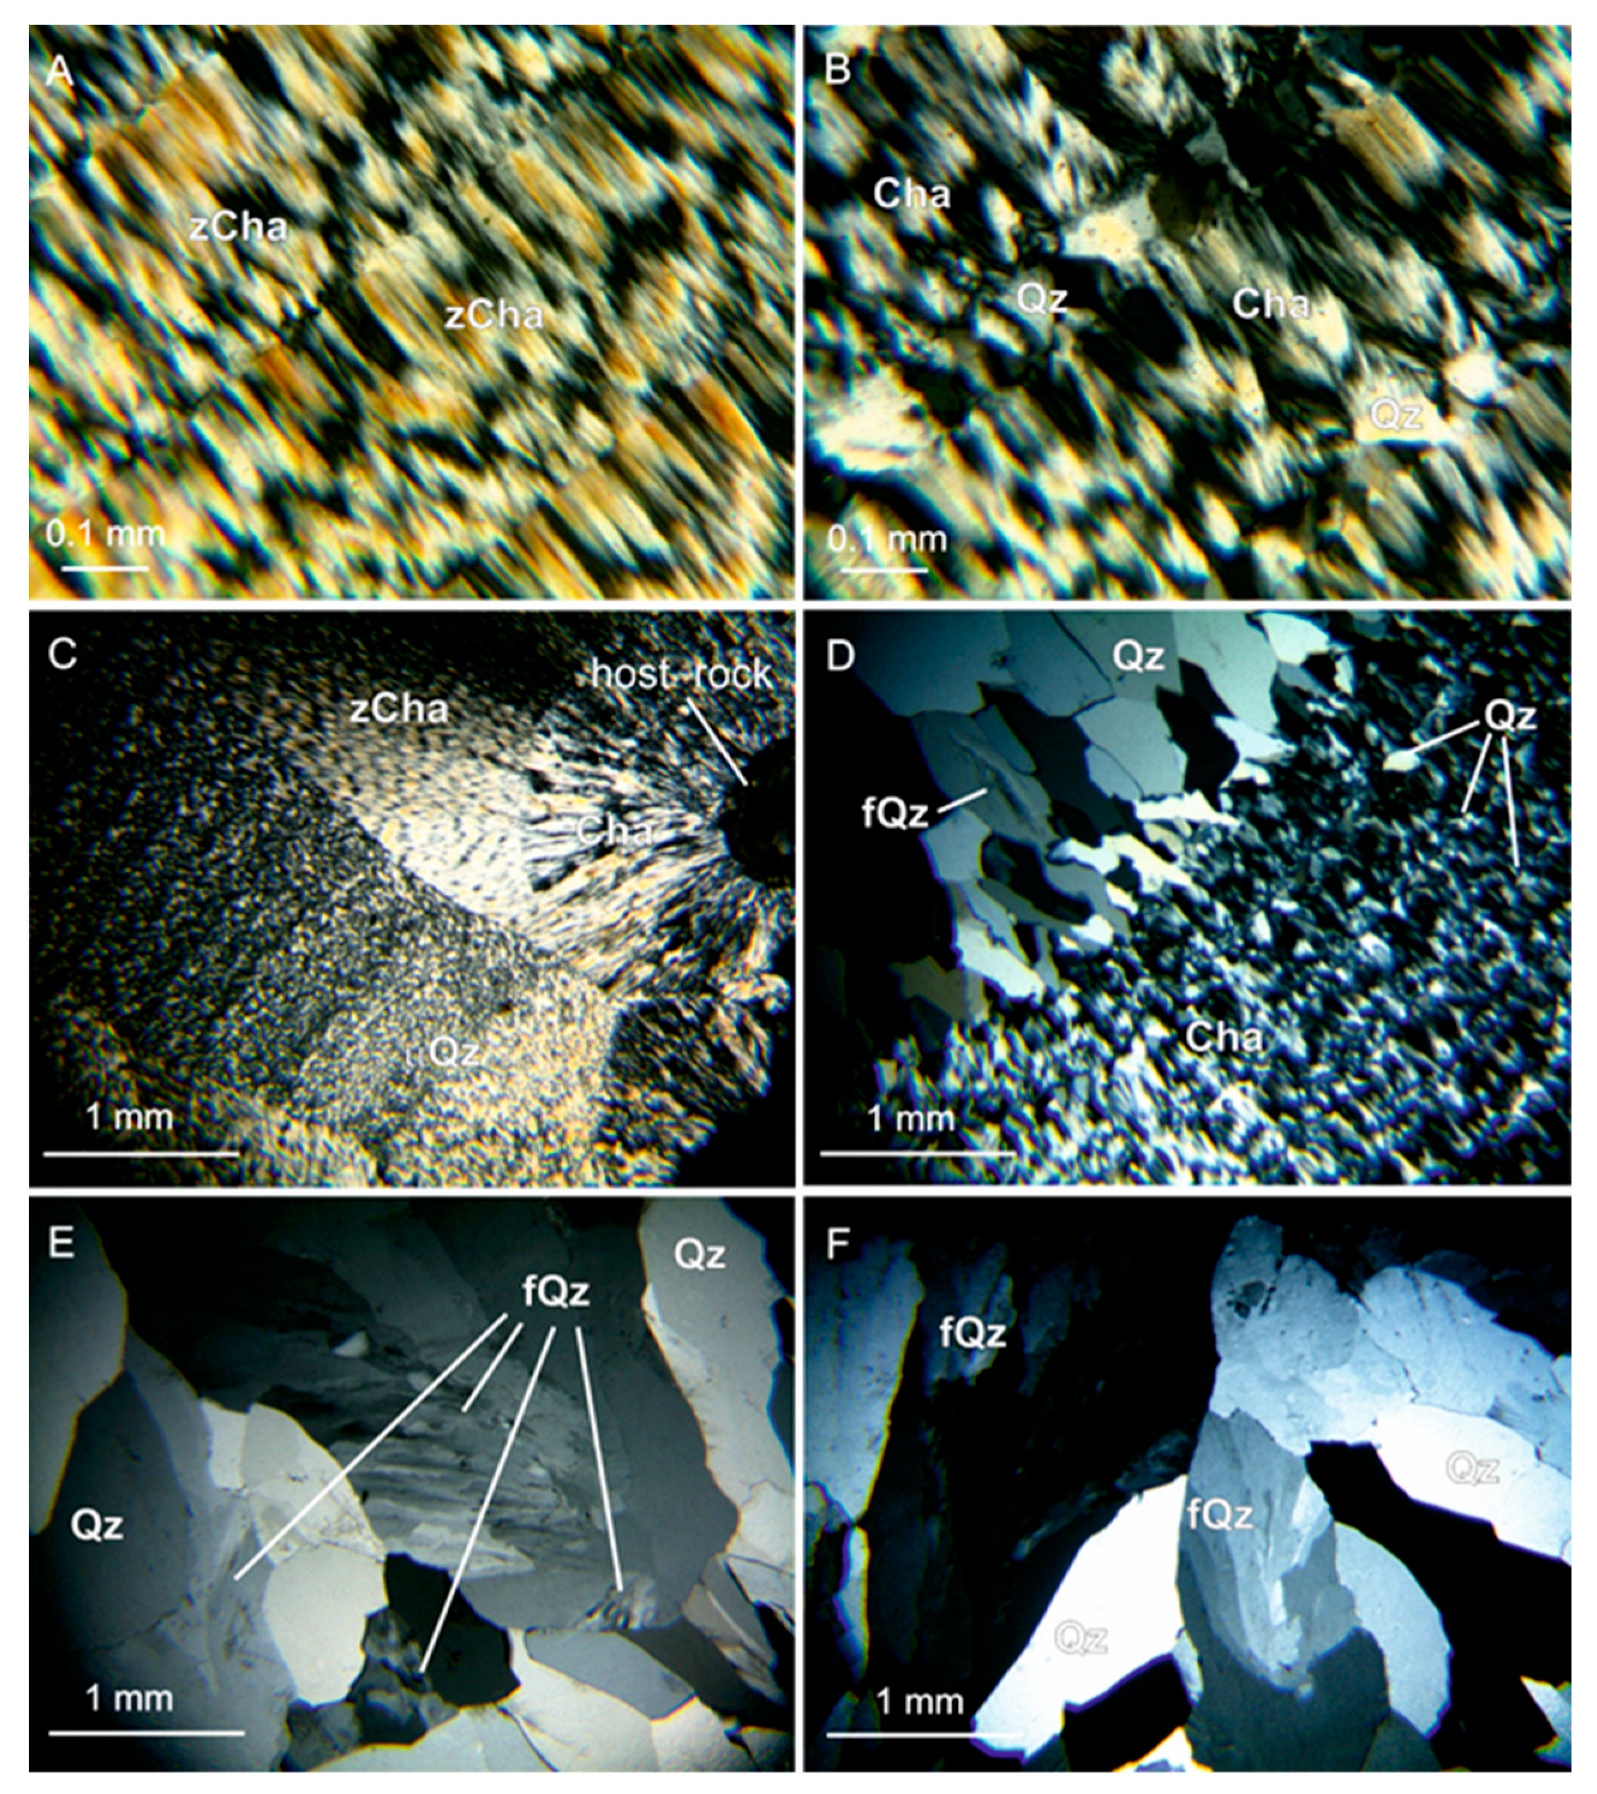
Petrographic study has shown that visible silica banding of external parts of agates, corresponding to the beginning of crystallization, is represented by alternating-length fast chalcedony (with the c-axis oriented perpendicular to the fibre direction) and zebraic chalcedony (length-fast with a helical twisting of fibres along fibre direction) layers with thicknesses ranging from 50 to 300 µm (Figure 4A). The boundaries of layers correspond to the temporal gap in silica deposition and are often marked by thin interlayers of differently oriented macrocrystalline quartz (Figure 4B). Parallel-layered agate zones are usually preceded by the radiation of fibrous radial aggregates towards the agate core. The nucleation centers for these aggregates are mineral grains on the walls of host rocks (Figure 4C). Radial fibrous length-fast chalcedony and zebraic chalcedony are often associated with microcrystalline quartz (Figure 4C). The transition zone between banded chalcedony and crystalline quartz has a distinct boundary (Figure 4D). In the direction of growth of euhedral and subhedral quartz grains, oriented with long axes perpendicular to the layers of chalcedony, a gradual increase in their size is observed (Figure 4D). The crystallization sequence is completed by comb-shaped amethyst crystals. Some prismatic quartz crystals under crossed polars display feathery appearances (Figure 4D,E,F). These microtextures are characterized by subgrains, which appear as splintery or feathery patterns due to slight optical differences in maximum extinction positions [31]. The subgrains of feathery textures are usually elongated in parallel to each other in the crystal growth direction. The accumulation of fluid inclusions is commonly associated with feathery textures in the studied quartz. Iron oxide/hydroxide inclusions occasionally occur within both chalcedonic bands and quartz crystal areas.

4.2. SEM-EDS Investigation

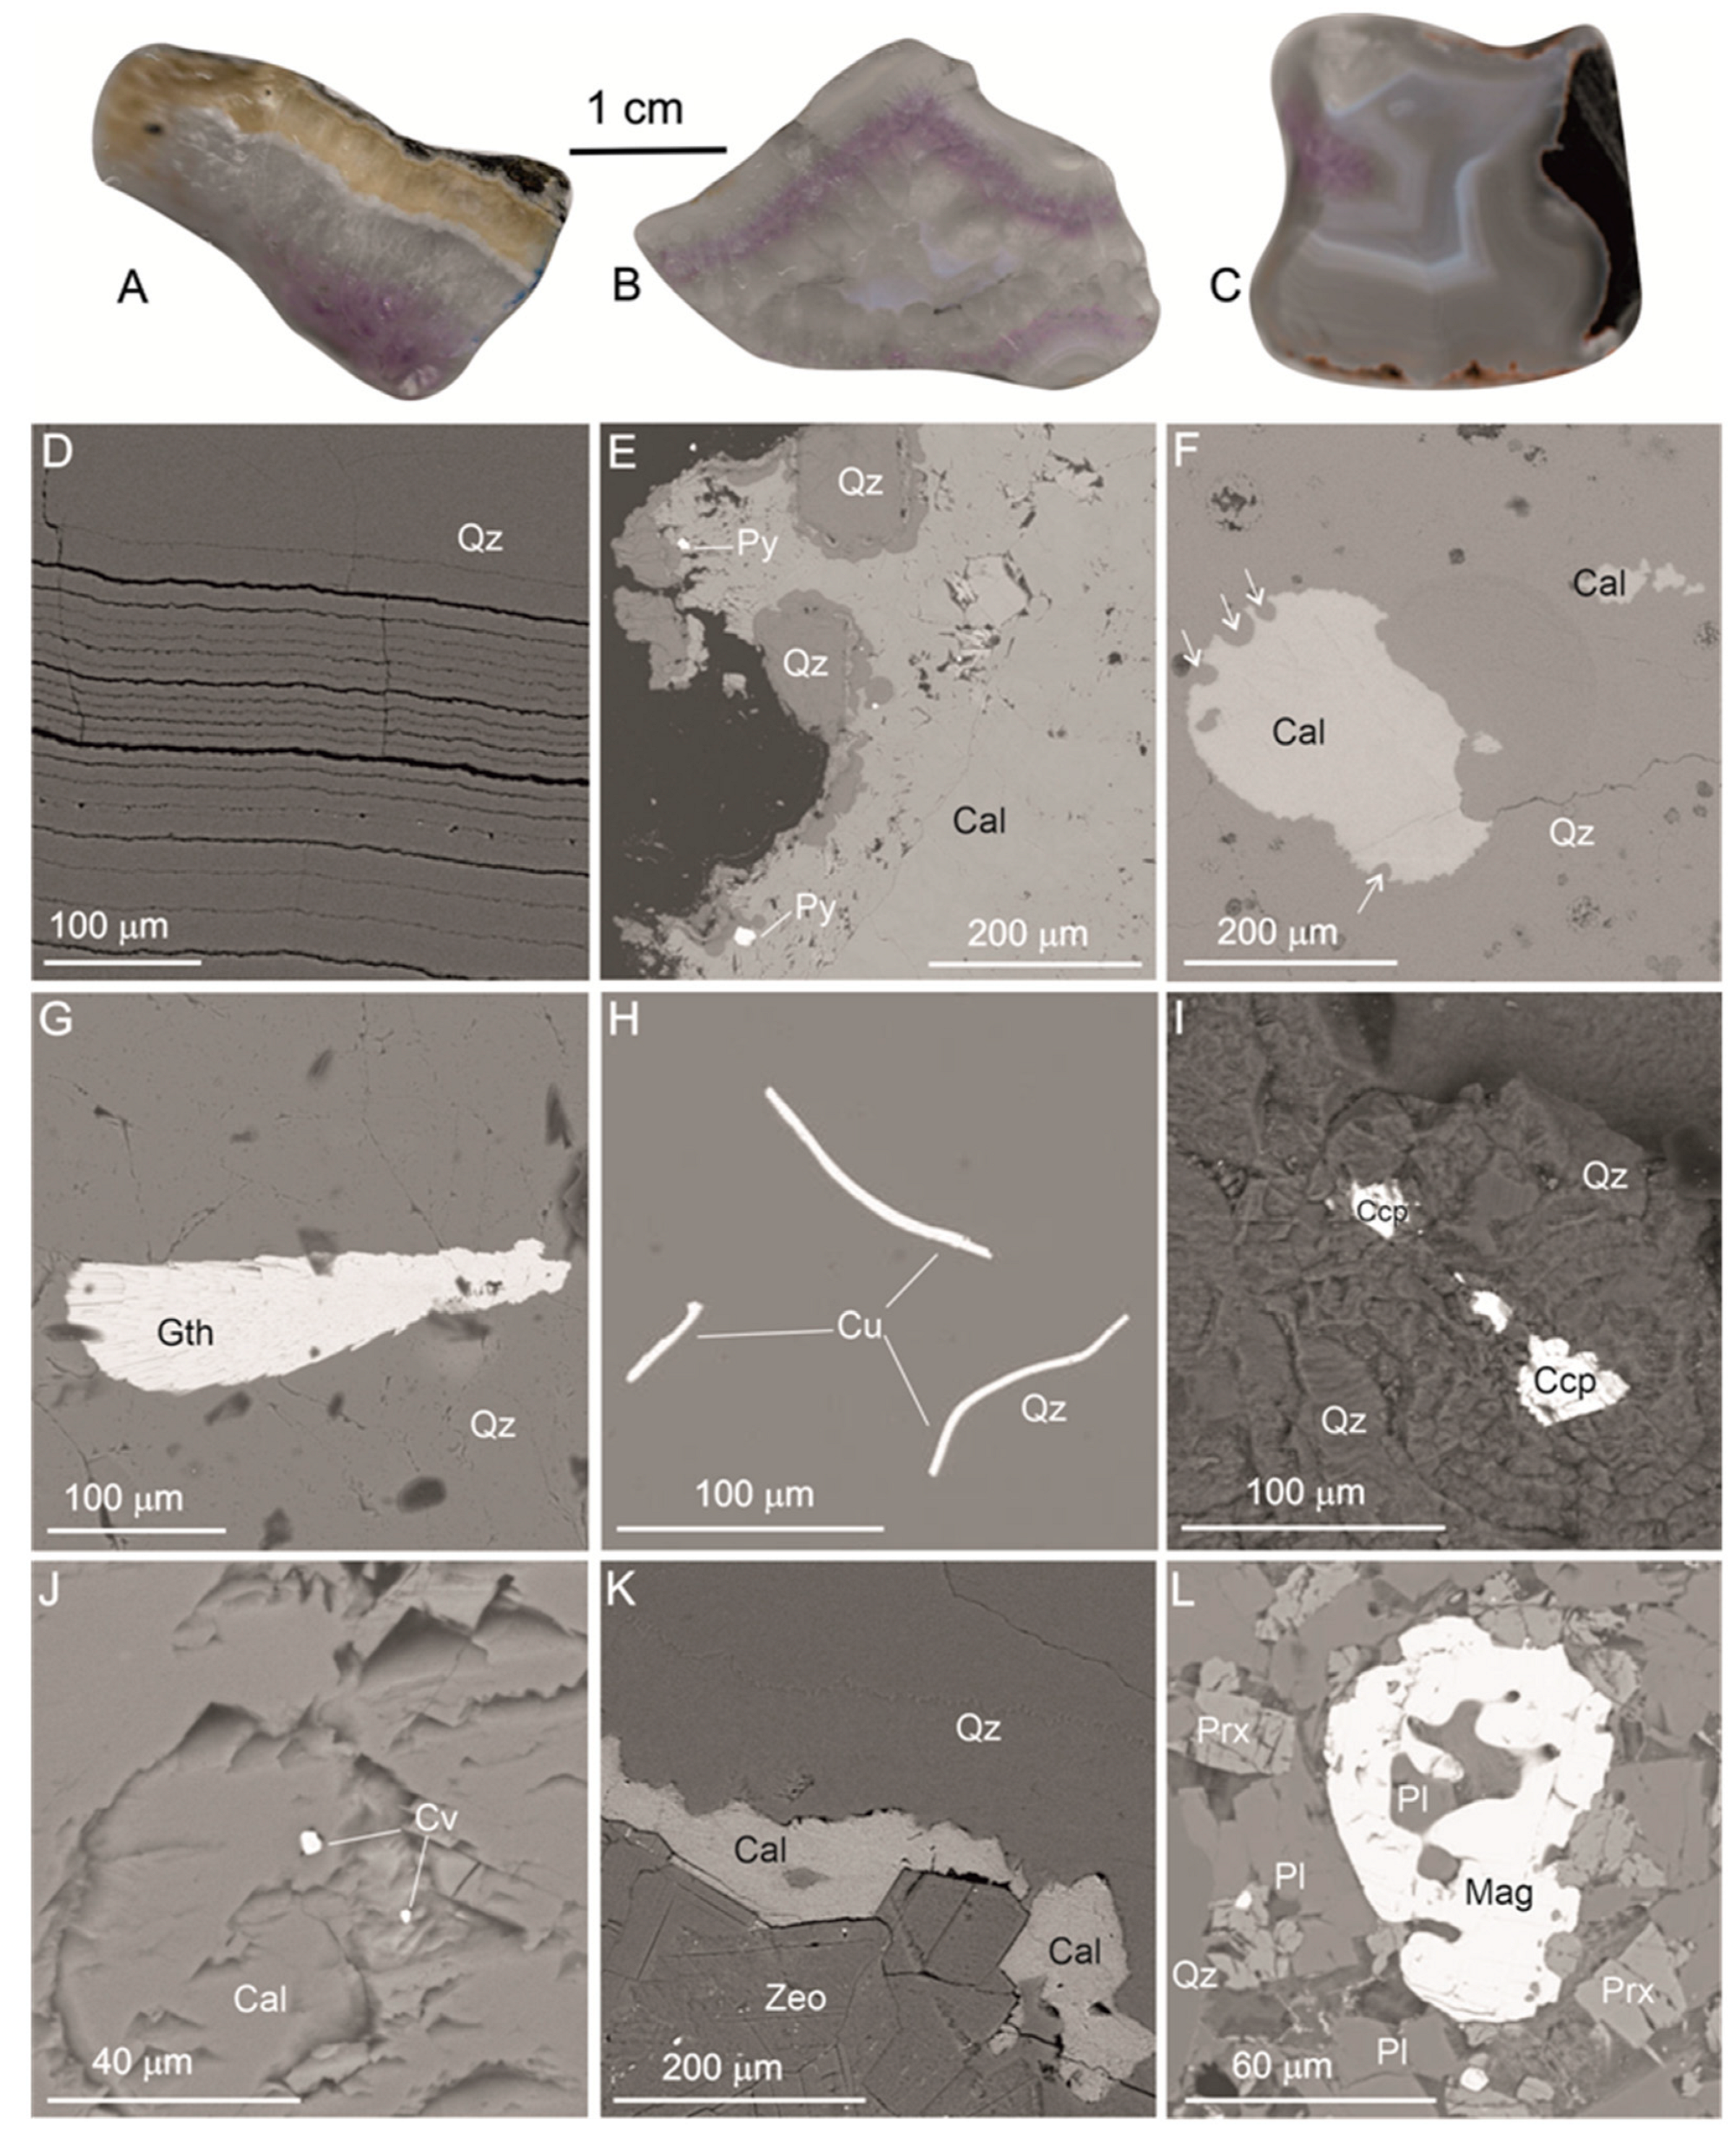
SEM-EDS investigation of three typical agate samples (Figure 5A) was performed to provide more evidence concerning the micromineral composition of agates. The scanning of fine-banded agate areas revealed that individual bands are characterized by various microporosities (Figure 5D). The most frequent mineral inclusions were recognized as Mn-enriched (up to 2.5 wt.%) calcite. They are expressed in the form of both thick bands (Figure 3G) and microinclusions in quartz with a size of up to 300 μm (Figure 5E,F). Randomly distributed spherical- and paniculate-shaped aggregates of growths of needle-like goethite crystals, with sizes varying from 100 to 300 μm, were observed within the quartz and amethyst crystals (Figure 5G). Rare filamentous inclusions of native copper with sizes of 5 × 50 −150 μm (Figure 5H), sporadic chalcopyrite inclusions of 10 up to 50 μm in size, and singular covellite grains (Figure 5I,J) were recognized in the silica matrix. Ni-enriched (up to 0.4 wt.%) pyrite inclusions were observed within the calcite band at the external area of the agate (Figure 5A,E). In addition, large prismatic zeolite (clinoptilolite) crystals associated with calcite are frequently present at the point of contact with the host rock (Figure 5K). The identification of goethite and clinoptilolite was confirmed using Raman spectroscopy (see Section 4.4). We also observed brecciated textures, with fragments of host rock detached from the agate wall and cemented via agate. Magnetite, plagioclase, pyroxene, ilmenite, and amphibole were found within these fragments and in the host rock (Figure 5L).
Additionally, SEM investigation of the surface morphology of the agate chips revealed the presence of different internal microstructures. Textures caused by well-shaped quartz crystals with sizes up to 150 µm (Figure 6A), as well as textures with an unclear granular surface (Figure 6B), are the most typical of the examined agate. The absence of a petrographically revealing fibrous texture of chalcedony is unexpected.

4.3. X-ray Diffraction

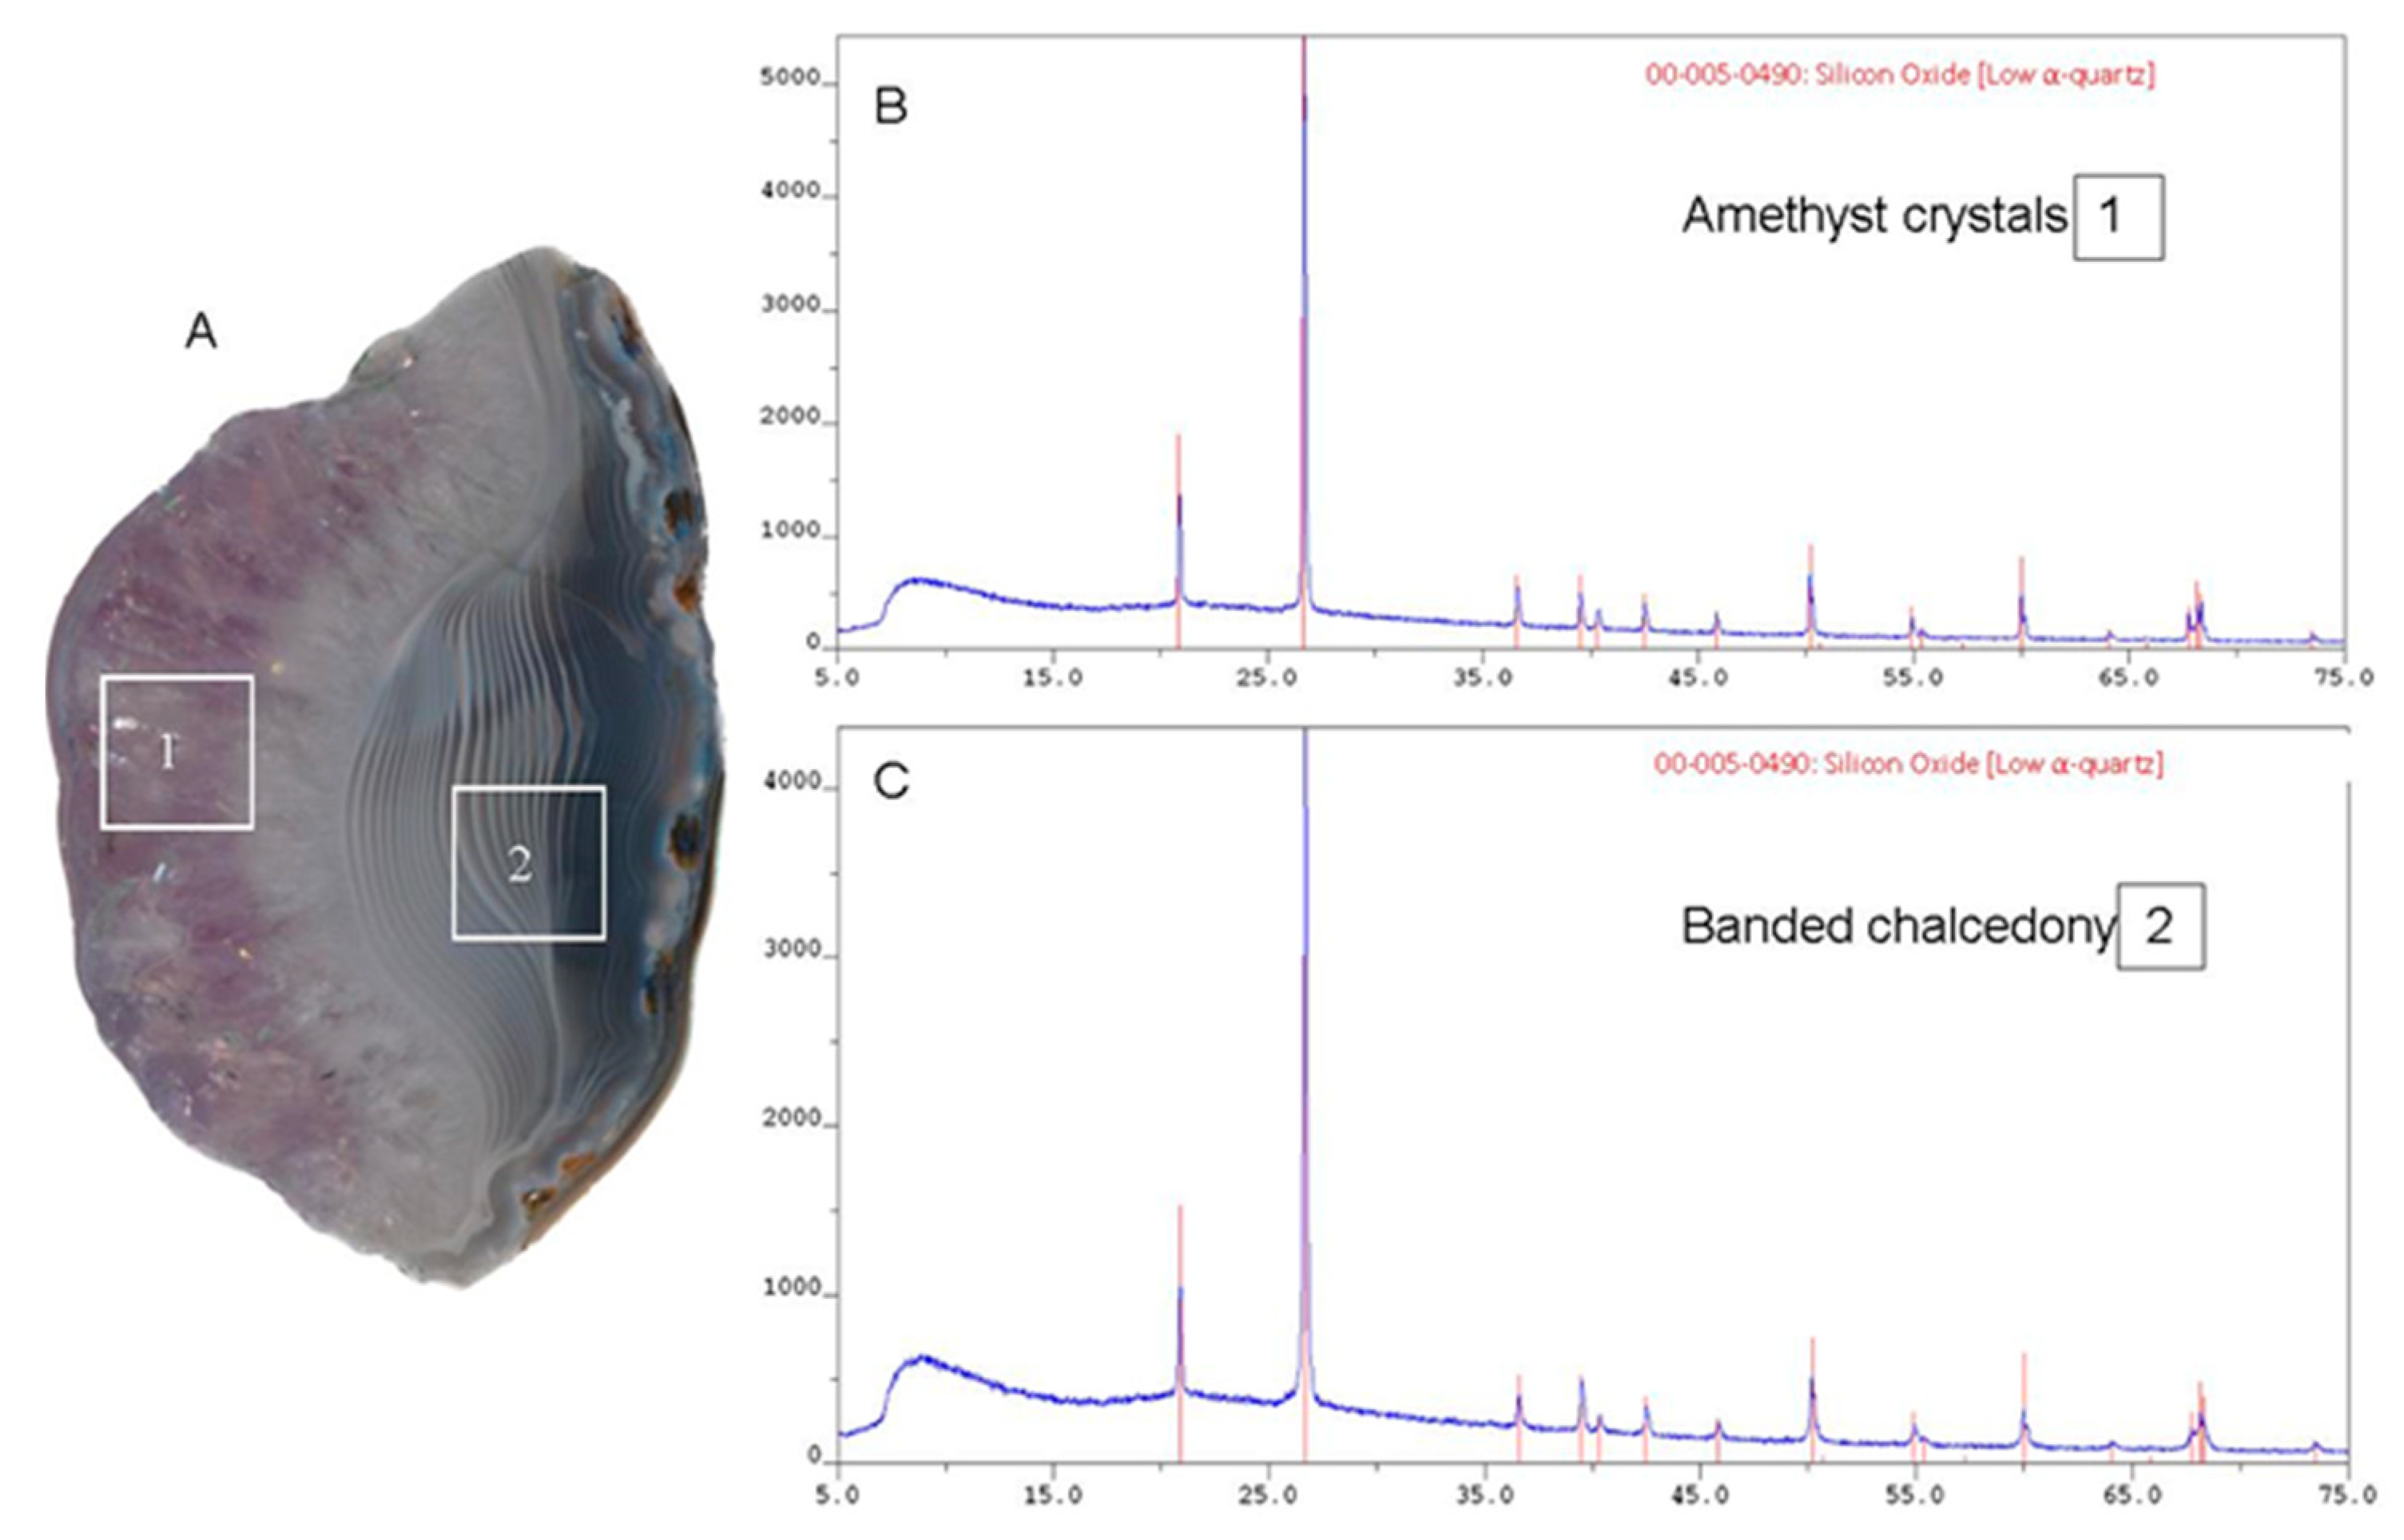
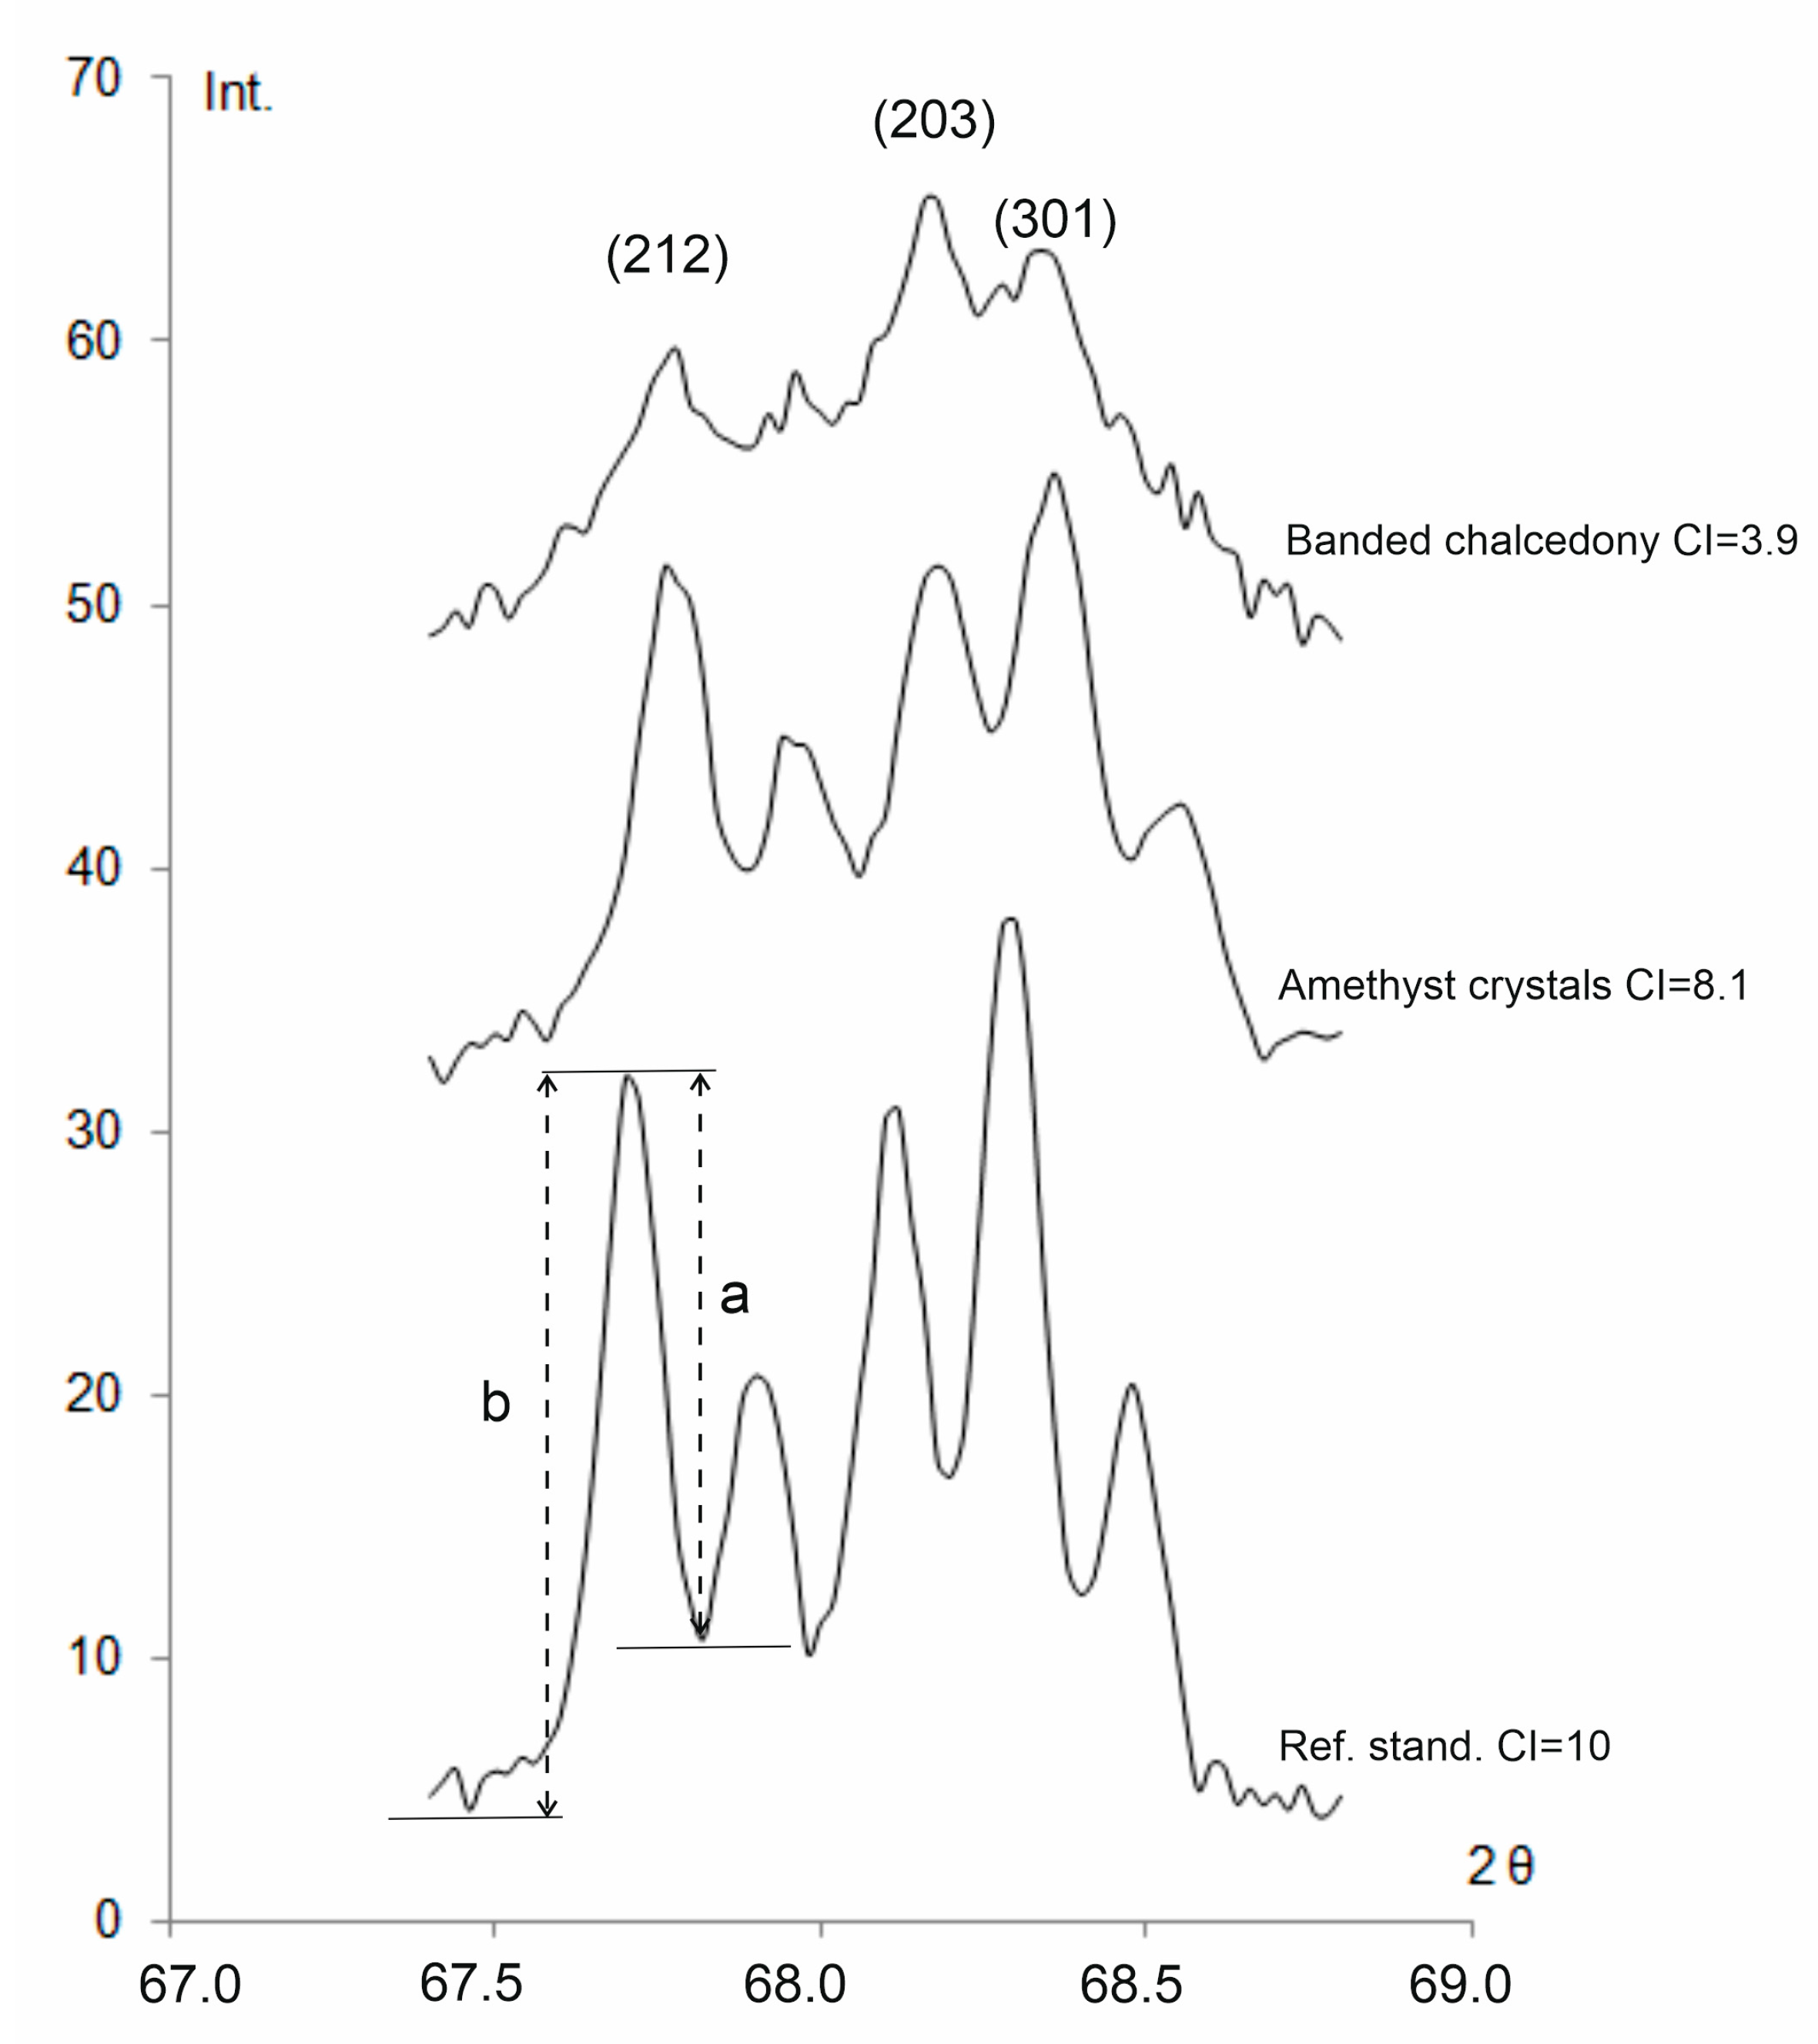
X-ray powder diffraction was applied to determine the structural parameters of banded chalcedony and amethyst crystal zones of agate sample (Figure 7A). Only peaks corresponding to alpha-quartz have been identified in the X-ray diffraction patterns in both cases (Figure 7B,C). Their differences are a slight broadening and a change in the intensity of some reflections (Figure 8).
The relative intensities of reflection on the X-ray diffraction pattern are used for the calculation of a quartz crystallinity index value (CI). The CI of examined samples is defined, following the specifications of Murata and Norman [32], based on the peak resolution in the (212) reflection at 2θ 68° as CI = 10Fa/b, where the scaling factor F is 1.2 (Figure 8). A quartz crystal from the hydrothermal metamorphogenic veins of the Subpolar Urals (Russia) [33] served as a reference standard, with CI = 10. The diffractogram of amethyst crystals is characterized by well-developed 2θ reflections (212), (203), (301) and higher CI values (8.1) as compared to banded chalcedony, with a CI of 3.9 (Figure 8, Table 1).
The mean crystallite size (Cs) of the samples was determined using the Scherrer equation: Cs = Kλ/(βcosθ). The shape factor K was taken as 0.9, λ was the wavelength of Cu-Kα1 radiation (1.540562 Å), and β was the full width at the half maximum (FWHM) of the peak (101) at 2θ ≈ 26.6°. Cs (101) was taken to be representative of the average crystallite diameter. The mean crystallite sizes in examined amethyst and banded chalcedony samples were 525 and 560 Å, respectively (Table 1).

4.4. Raman Spectroscopy

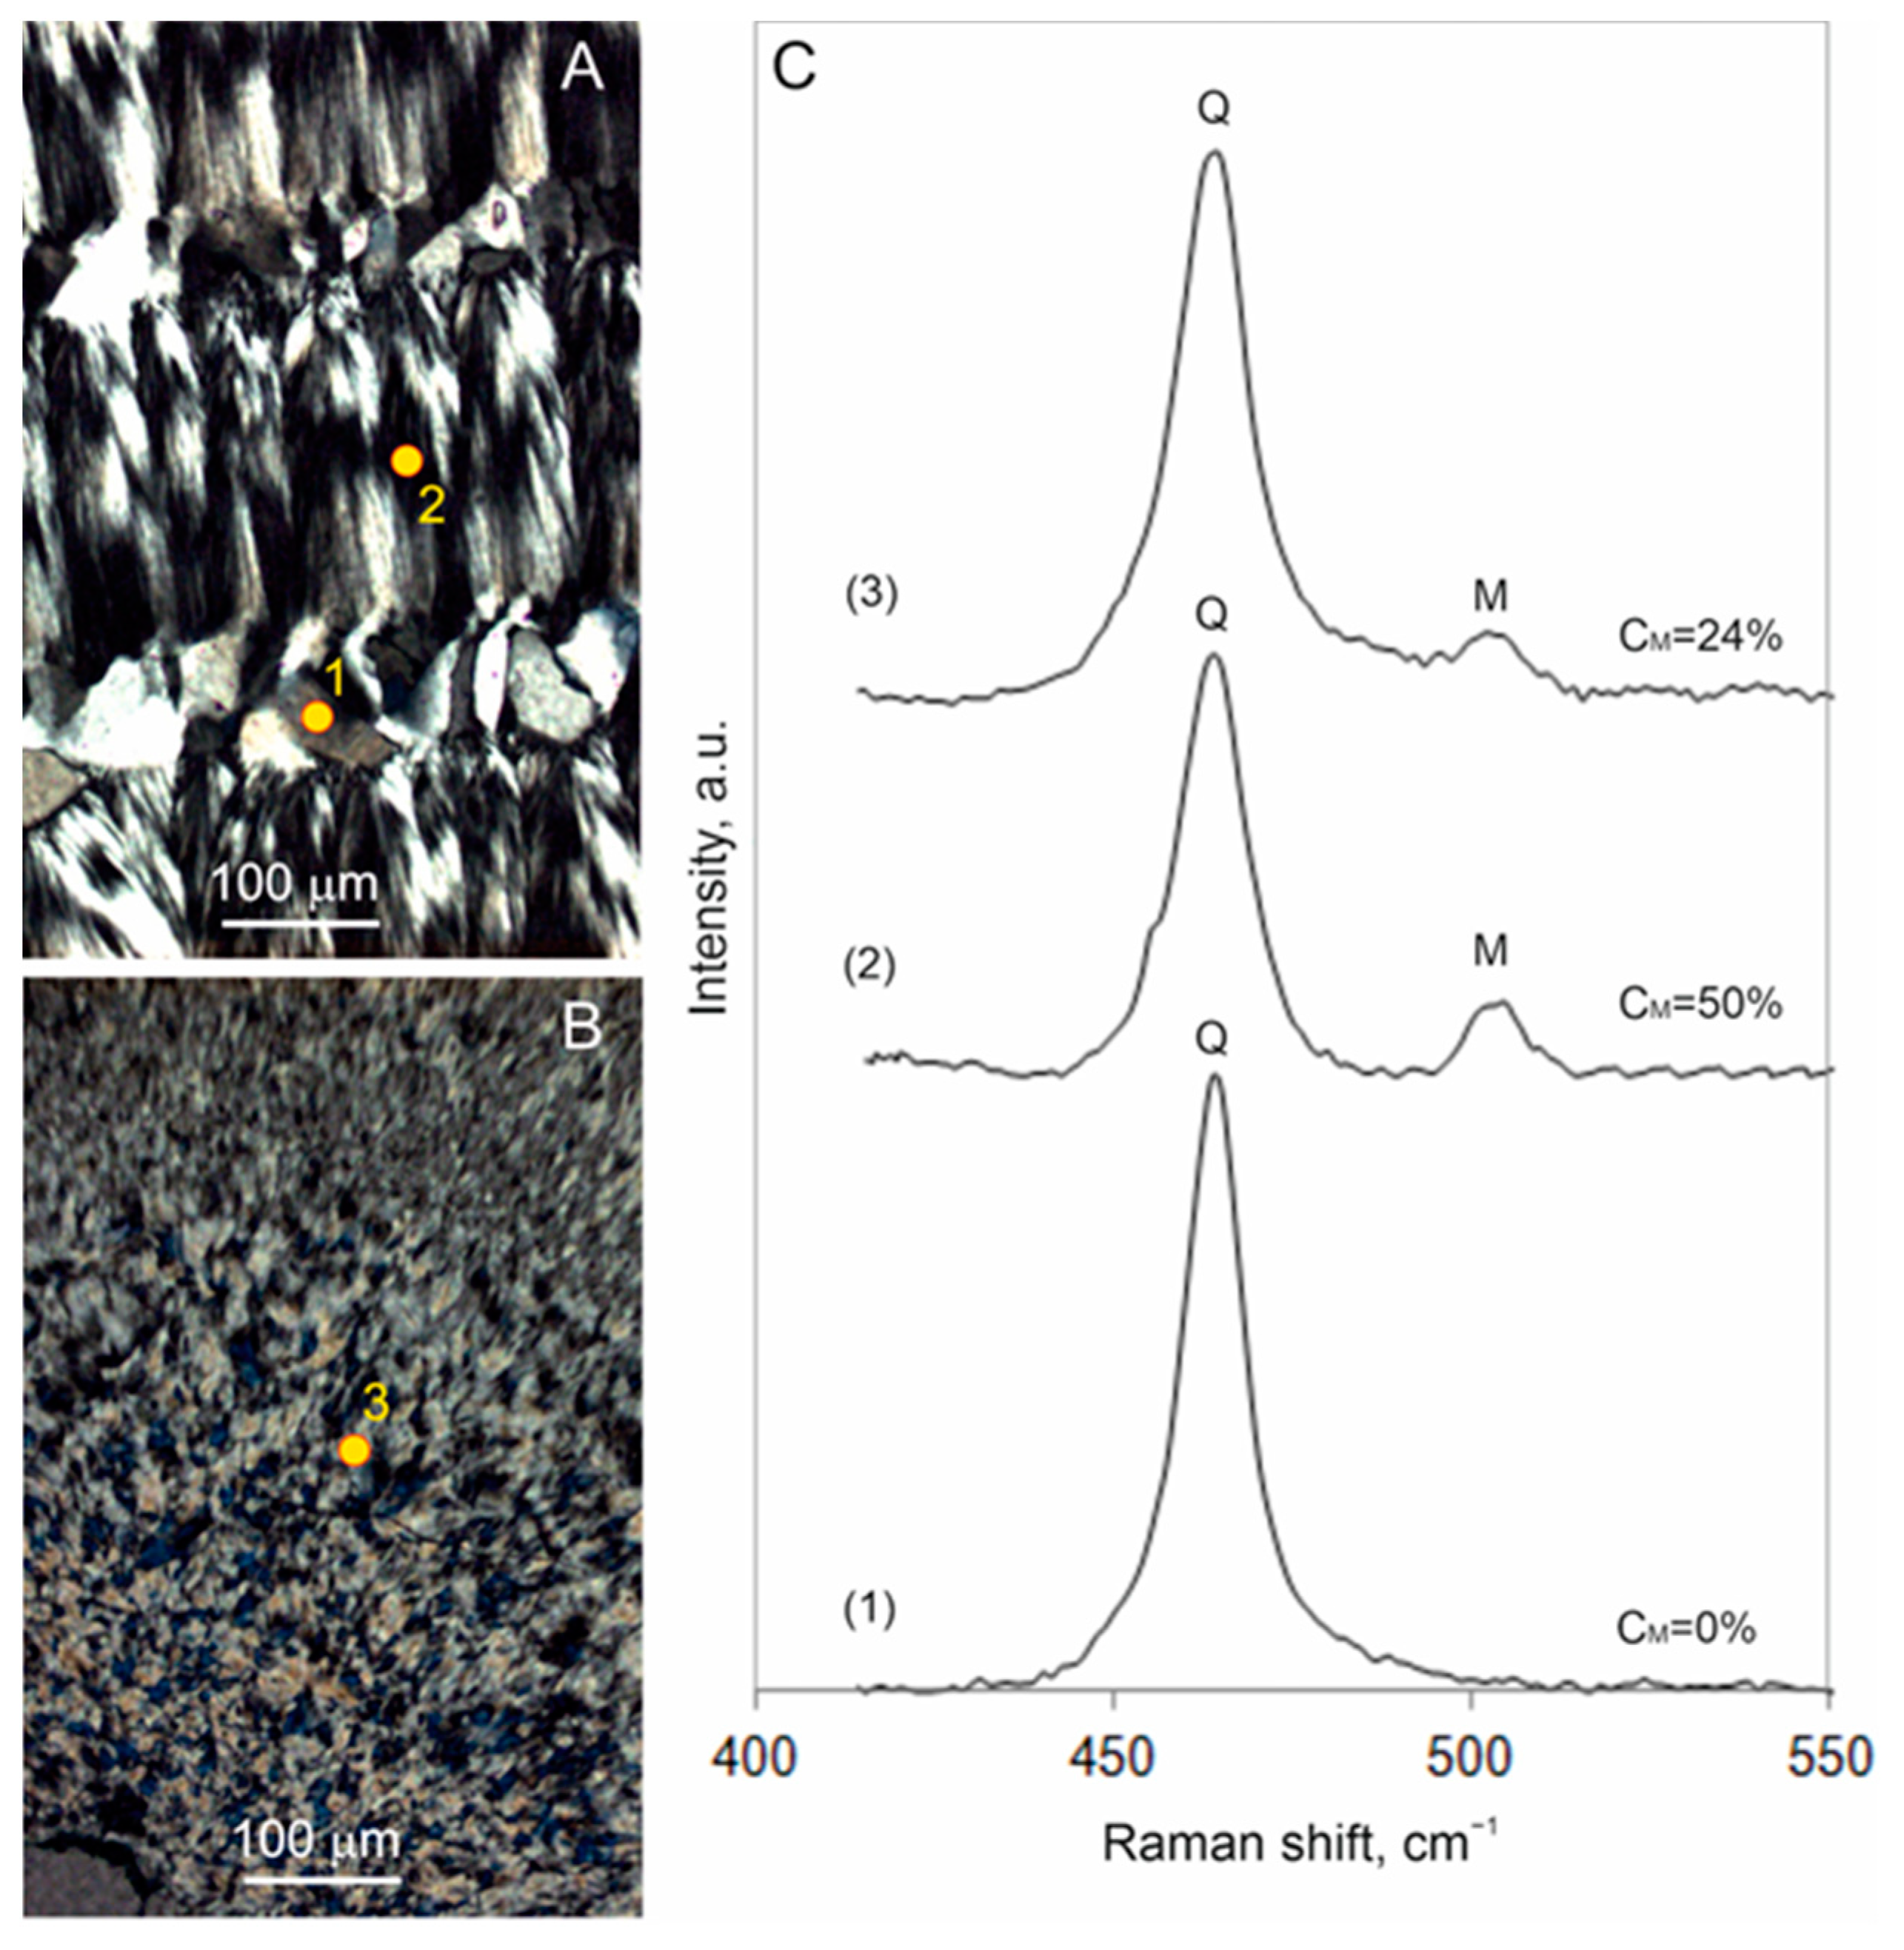
Raman micro-spectroscopy was used to identify silica polymorphs across the agate sample. The Raman spectra for macrocrystalline quartz from the thin interlayer within the chalcedony banded area (Figure 9A,C, point 1) show characteristic alpha-quartz bands at 465, 353, 208, and 127 cm−1. It is noteworthy that the Raman spectra of fibrous chalcedony area display the occurrence of an additional, less intense band at 502 cm−1, which is attributed to the presence of the unstable monoclinic SiO2 modification moganite (Figure 9A,C, point 2). The 502 cm−1 band is also observed in the Raman spectra of microcrystalline quartz zones at the point of contact with the host rock (Figure 9B,C, point 3). Using the algorithm proposed by Götze et al. [26], based on the measurement of the intensity ratio of moganite and α-quartz bands I(502)/I(465), the local moganite content in moganite-rich area was calculated. The maximum ratios I(502)/I(465) were found in fibrous chalcedony layers, varying between 3.9%–19% (Table S1). According to the calibration curve [26], these values correspond to moganite content of 20%–50%. For microcrystalline quartz area, the intensity ratio I(502)/I(465) ranges from 3.4 to 6.6%, corresponding to a moganite content of 15%–22% (Table S1). According to our data, moganite is absent in the areas composed of macrocrystalline quartz, including prismatic colorless and amethyst crystals. No moganite has been found within the quartz with feathery textures (Figure 4E,F).
Local Raman spectroscopy analyses confirmed the presence of clinoptilolite phases in Tevi agates, which have been identified using their main Raman broad bands located at 412 and 478 cm−1 [34] (Figure 10C). Randomly distributed growths of needle-like crystals in agates (Figure 10A) were identified as goethite by their characteristic Raman bands at 166, 205, 245, 300, 387, 418, 479, 551 and 683 cm−1 (Figure 10C). Mineral inclusions occurring as clusters within the silica matrix were evidenced as pyrite by the presence of its marker bands at 344, 379 and 431 cm−1 [35] (Figure 10B,C). The small band at 325 cm−1 can arise from the marcasite admixture [35].

4.5. IR Spectroscopy

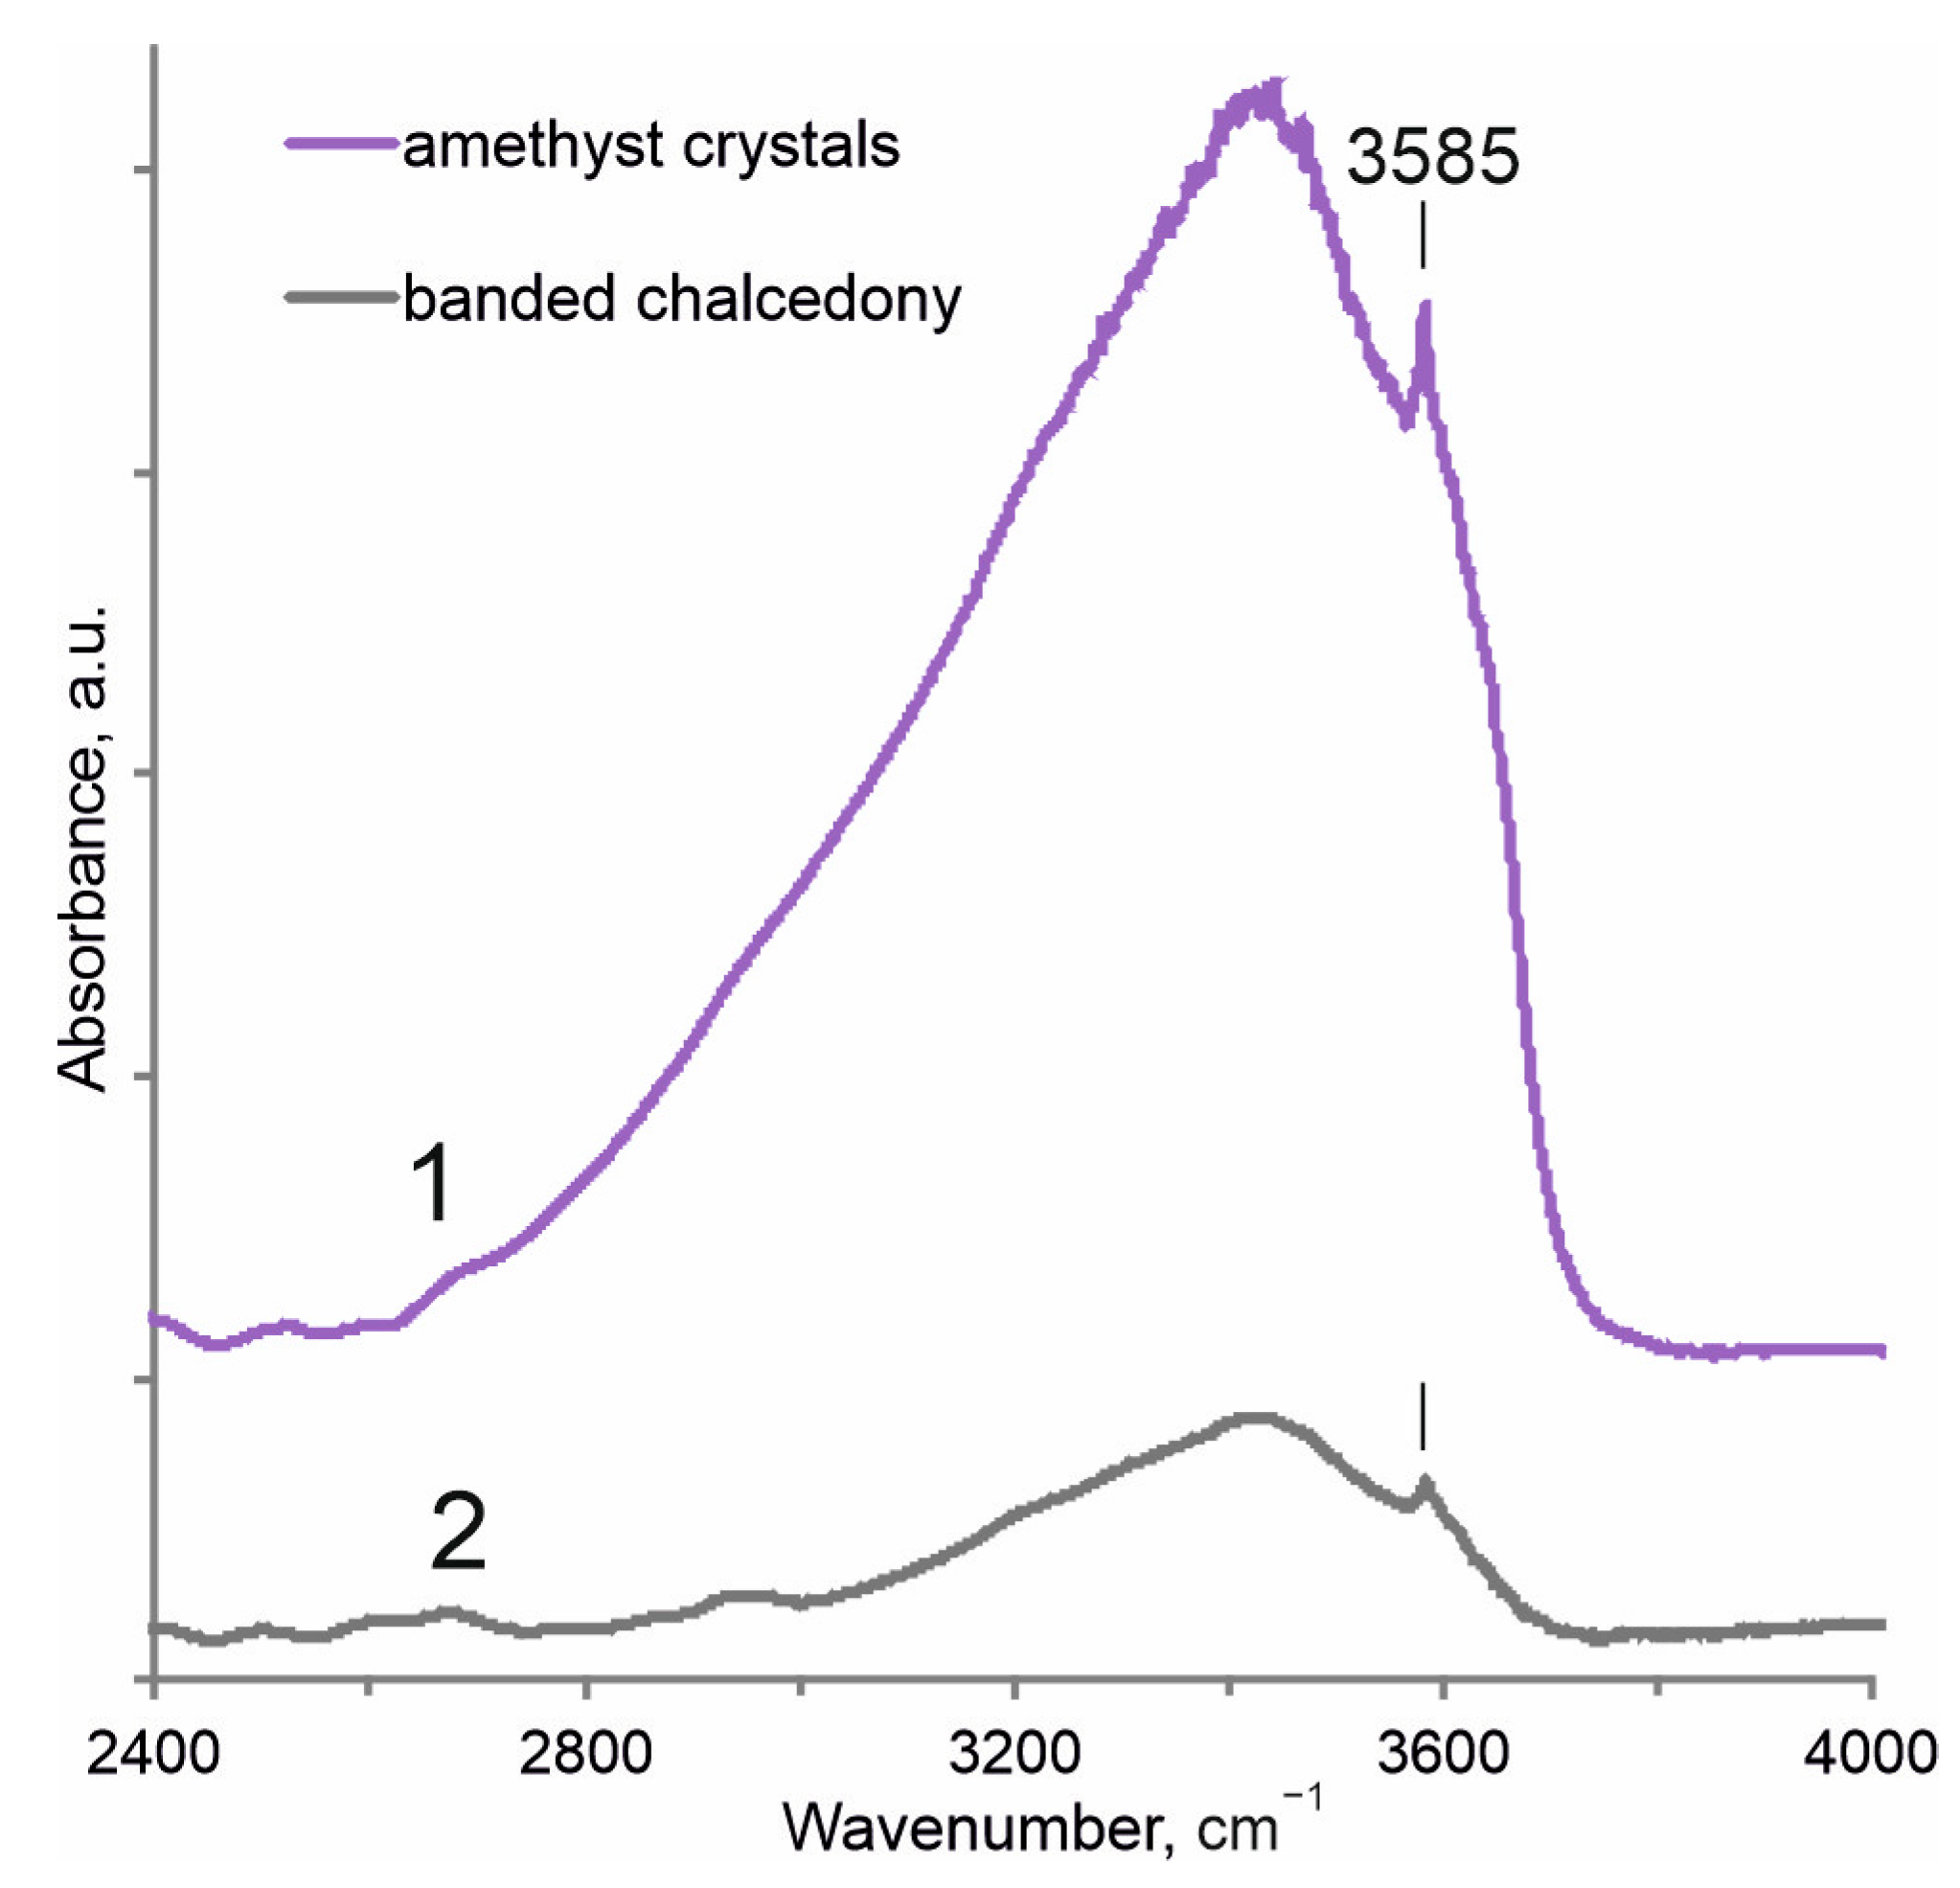
FT-IR spectroscopic investigation was applied to analyze water speciation of the two areas (banded and amethyst) of the Tevi agate sample, as shown in Figure 3G. The IR spectra on the principal water-stretching region (2800–3800 cm−1) in both cases are represented by an asymmetric broad absorption band near 3400 cm−1 and a shoulder near 3260 cm−1 (Figure 11). These bands are attributed to symmetric and asymmetric O–H stretching vibrations in water molecules. Molecular water in quartz and chalcedony can be contained in micropores and fluid inclusions [36,37]. The intensity of the 3400 cm−1 band is proportional to the content of molecular water. The IR spectrum of the amethyst area shows a much higher intensity of the water band in comparison with the banded area. Additionally, both spectra show a relatively sharp band at 3585 cm−1 on the background of a broad band. The assignment of this band is considered in the Discussion section.

4.6. Fluid Inclusions

Fluid inclusions in doubly polished thin sections of amethyst crystals, taken from selected Tevi agate samples (Figure 3A,B,G), were analyzed. Predominantly cold-water monophase fluid inclusions, 5–20 μm in size, were revealed in all samples (Figure 12). They are isometric or elongated in shape, with crystallographic elements. It is assumed that such monophase inclusions are captured at temperatures below 100 °C from hydrothermal fluids of low salinity (not more than 1–3 wt.% NaCl-equivalent) [6,7,38]. Similar fluid monophase inclusions were found in not only colorless quartz and amethyst, but also in calcite, barite and gypsum in Brazilian agates with amethyst [38].

4.7. Oxygen Isotope Composition

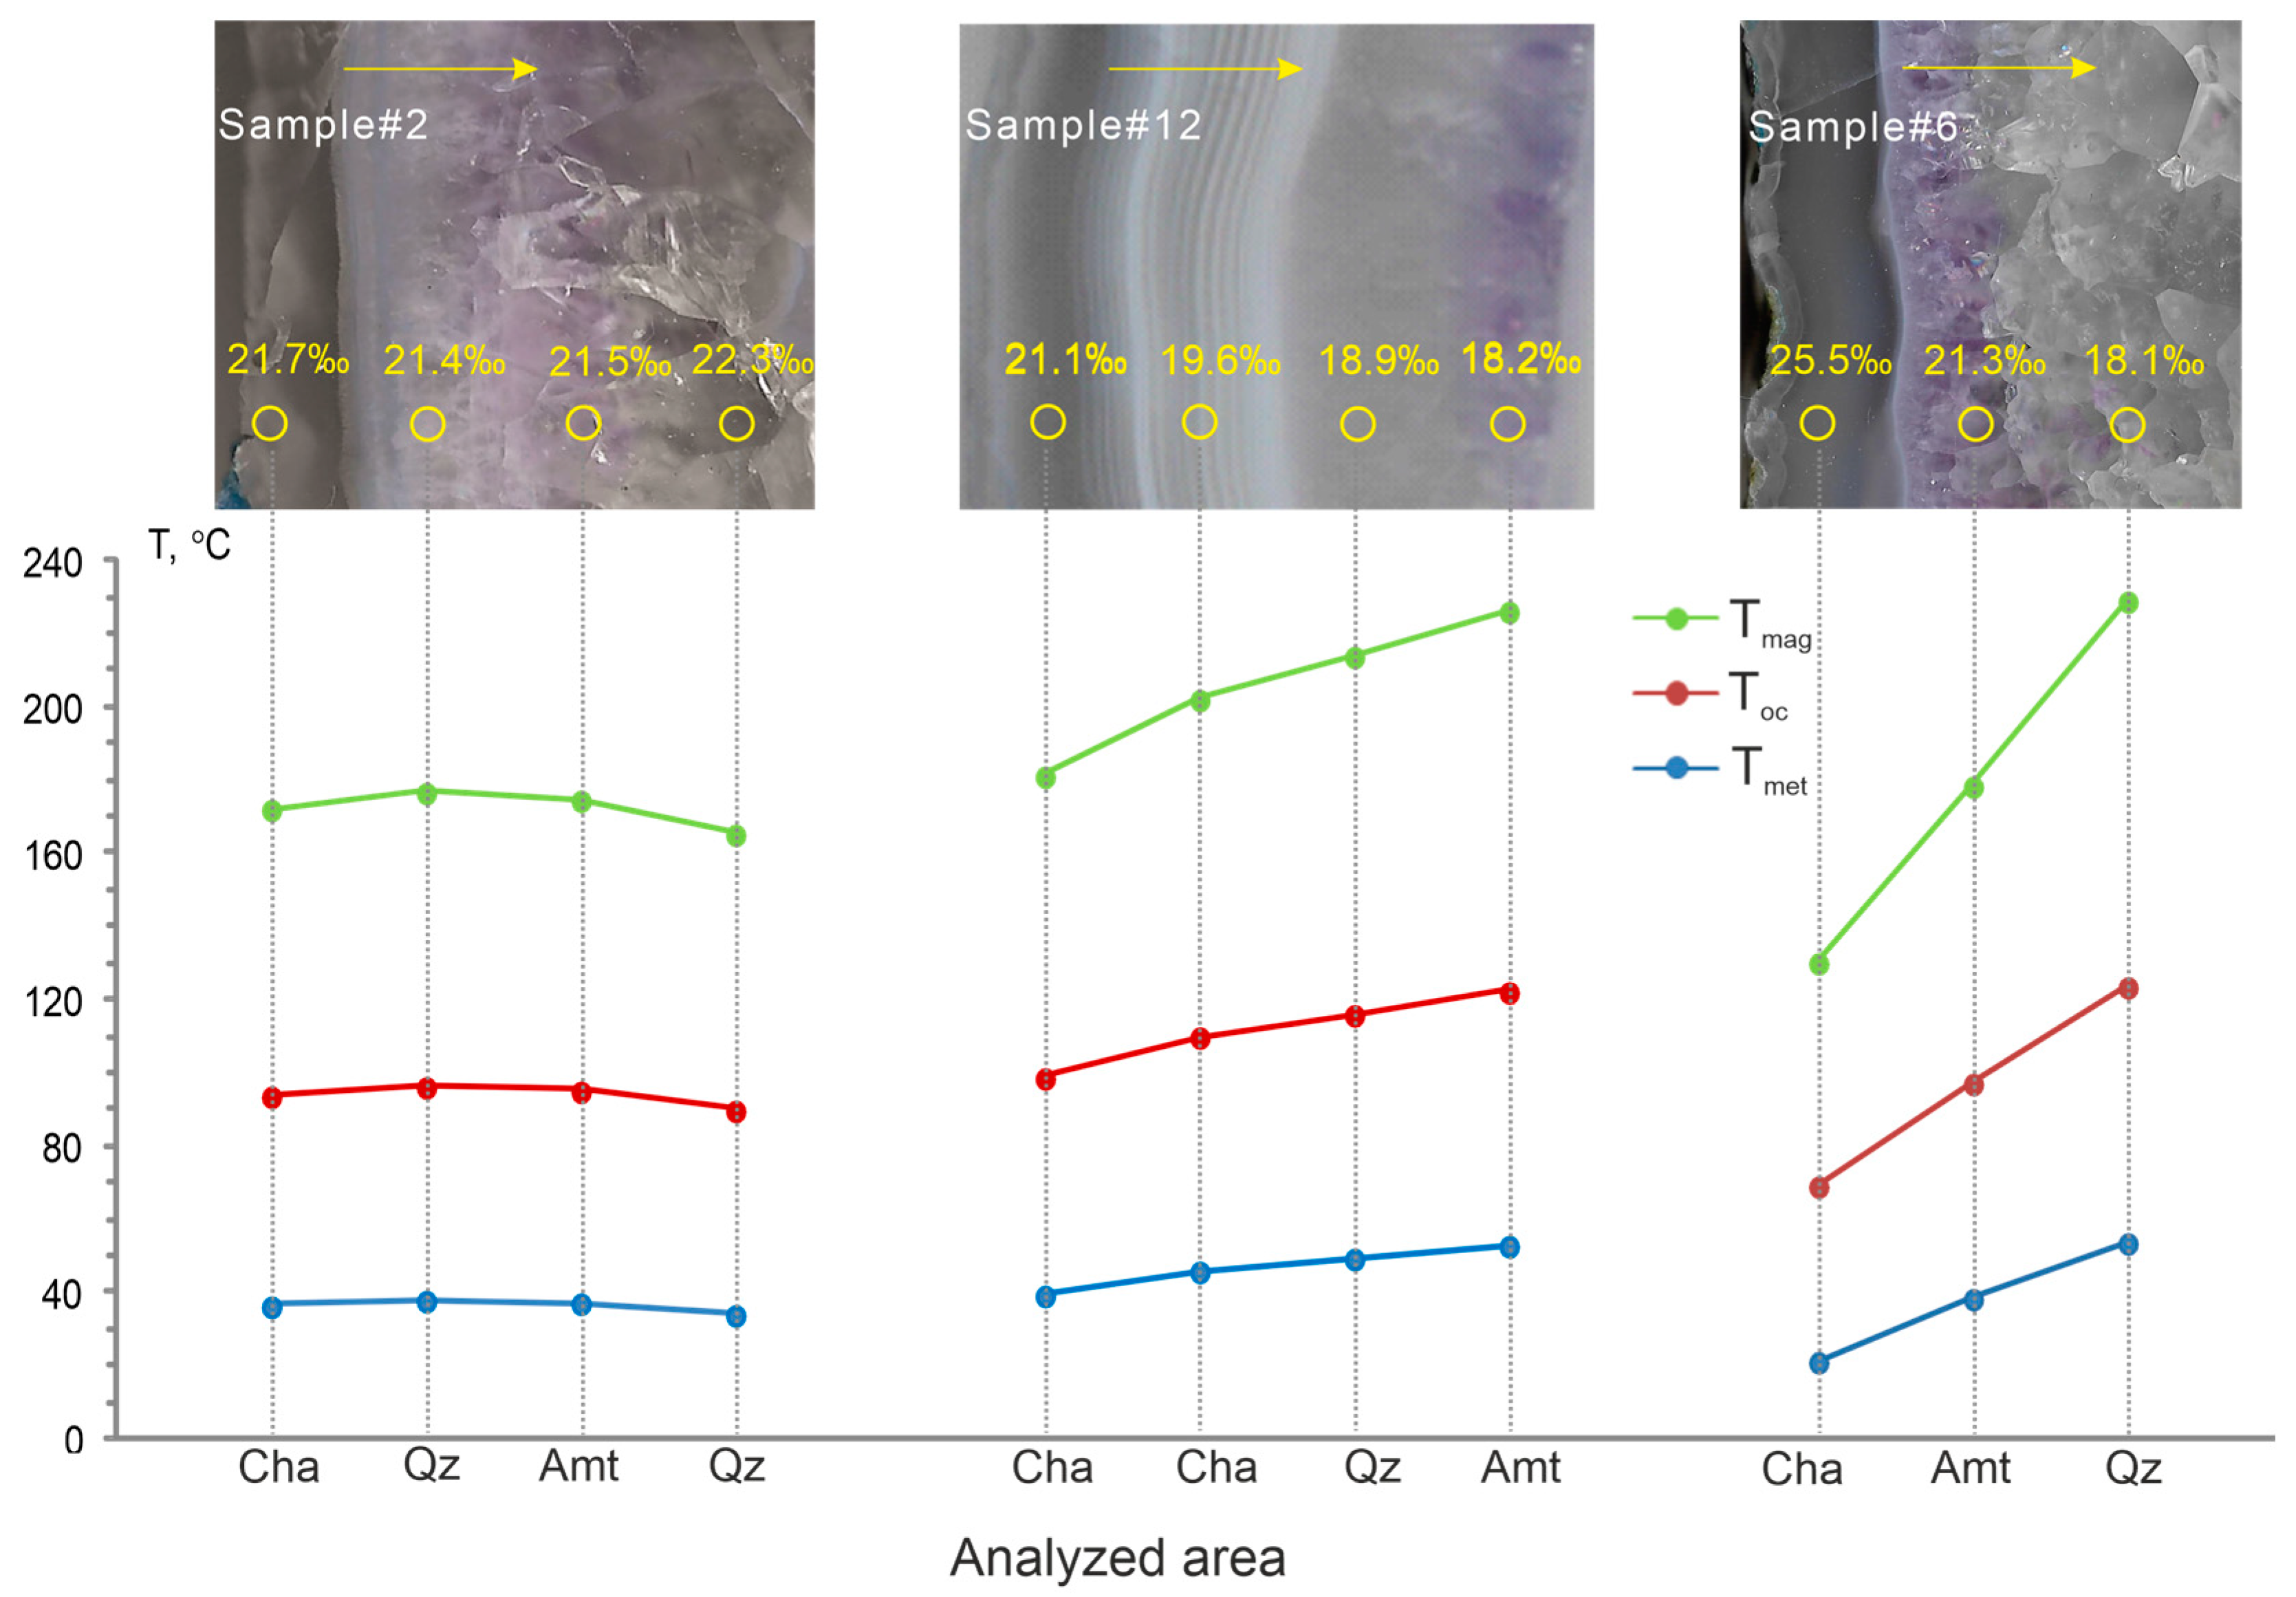
To specify the equilibrium formation temperature of Tevi agates, oxygen isotope analyses were performed on the profiles of three concentrically banded agate samples with different band sequences (Figure 13). In sample#6, the silica sequence is represented by fibrous chalcedony, amethyst, and quartz. In sample#2, it is composed of fibrous chalcedony, milky-white quartz, amethyst, and colorless quartz. Conversely, in sample#12, it consists of banded chalcedony as well as colorless quartz and is completed with amethyst. In general, the measured values δ18O in silica bands range from +18.1 to +25.5 ‰ (Table 2).
The results of oxygen isotope analyses in the profiles of sample#6 and #12 reveal heterogeneities in the oxygen isotope composition for individual mineral zones (Table 2, Figure 13). A gradual decrease in the heavy isotope O18 in the direction of agate growth from the outer chalcedony band to the center is observed. It is noteworthy that sample#2, with a different sequence of silica phases, is characterized by an almost-homogeneous isotopic composition along the profile, with a slight increase in the presence of O18 isotope in the central part. This portion of the sample is composed of colorless quartz (Table 2, Figure 13).
To reconstruct the conditions of agate formation and to explain the isotopic compositions of the Tevi agates, it is necessary to know the formation temperature, and/or the O-isotope composition of the mineral-forming fluid [39]. However, no precise data about the formation temperatures and O-isotope composition of the fluids have been obtained from the fluid inclusion study of Tevi agates. Therefore, the formation temperature of each mineral zone of agates was estimated using three different sources: meteoric water (−10‰), oceanic water (0‰), and magmatic water (+8‰). The equation of Matsuhisa et al. [39] was used to calculate the isotope fractionation temperature: δ18O = 1000 ln αQW = 3.34 (106 T−2) − 3.31, where αQW is the O-isotope fractionation factor between quartz and water, T is the temperature in Kelvin. The calculations showed the formation temperatures of agates from 21 to 229 °C (chalcedony 21–202 °C, quartz 34–229 °C, amethyst 37–214 °C) (Table 2).

5. Discussion

Agates with amethyst have been recognized in the Eocene volcanic rocks of the Kinkilsk complex of Northern Kamchatka (Russia). They are represented by basalt–andesite–dacite lavas, tuffs, breccias and agglomerates. These agates usually occur as infills of gas vesicles in massive lava flows and cavities in agglomerate tuffs. Additionally, they are also often observed as rounded fragments in coastal placers of the bay.

5.1. Micro-Texture of Agate and Amethyst

The Tevi agates exhibit diversified internal microtextures due to the individual bands composed of micro- and macro-crystalline quartz, length-fast chalcedony, and zebraic chalcedony. The feathery textures revealed in comb-shaped quartz crystals within the agates are typical of many hydrothermal quartz veins. The origin of these textures could be explained by (1) the epitaxial overgrowth of small quartz crystals on large existing quartz crystals [31] and (2) re-crystallization from water-rich microcrystalline silica polymorphs (moganite and/or chalcedony) [40,41,42]. In the present study, X-ray powder diffraction analysis only revealed alpha quartz in both amethyst crystals and banded chalcedony areas. However, local Raman spectroscopy analyses showed an admixture of moganite within the outer agate zones. The distribution of moganite within individual silica bands is not homogenous. Elevated moganite content was identified within the length-fast chalcedony (up to 50%) and microcrystalline quartz zones (up to 22%), whereas moganite was not found in macrocrystalline quartz areas. The variations in moganite content in individual bands are likely accompanied by different porosity, which can then be revealed under a microscope (Figure 5D). The absence of moganite reflections on the X-ray diffractograms of banded chalcedony area may be explained by the presence of moganite nanocrystals or moganite nano-range lamellae that are not large enough (in the sense of coherently scattering lattice domains) to be detected via X-ray diffractometry, but which are detected using vibrational spectroscopy [26]. Thus, the variation in textural characteristics, including zoned distribution of fibrous chalcedony, moganite, micro- and macro-crystalline quartz, provides evidence for multi-stage deposition of silica due to a fluctuation in physico-chemical conditions during agate formation.
The relationship between agate-bearing rock age and corresponding moganite concentration was described by Moxon and co-authors [43,44,45]. The moganite content in the agates sharply decreases with the increasing age of host rocks from 13 to 60 Ma, and then remains approximately constant up to 410 Ma. In the ancient agates, moganite occurs in trace amounts or is not detected. The high moganite concentration in the Tevi agates is evidently determined by the young age (~45 Ma) of host rocks.
A correlation between the main crystallite size in agates and age of the host rocks was provided by T. Moxon [46]. The measured values of crystallite size (525–560 Å) for examined agates with amethyst from Eocene volcanics are significantly lower than those previously obtained for agates from Paleoproterozoic (2100–1920 Ma) [16] and Mesoproterozoic (1485–1460 Ma) [47] volcanics of the Fennoscandian Shield (700–1050 Å and 638–751 Å, respectively), just lower values (960–1120 Å) were obtained for agates of Proterozoic and Archean metamorphosed hosts from western Australia [48] (Figure 14). The crystallite size for the Tevi agates is consistent with the values (536–567 Å) obtained for agates in hosts aged from 1100 to 412 Ma [43]. It should be noted that the changes in moganite content and quartz crystallite size with respect to host age is due to the release of structural silanol water [20].

5.2. Water in Quartz and Chalcedony

According to the IR spectroscopy, the signal of molecular water in the amethyst area of agate is significantly higher than that in the banded one, which is probably due to the abundance of fluid inclusions within the amethyst crystals. Besides molecular water, quartz and chalcedony usually contain some other OH defects. For example, Al-OH and Li-OH complexes arise from the substitution of Si4+→Al3+ and Si4+→Li3+ in SiO4 tetrahedra, where H+ acted as a compensator of the missing positive charge [36]. Therefore Al-related (3431, 3379 cm−1) and Li-related (3480 cm–1) OH- bands may be overlapped by the broad band of molecular water in the IR spectrum of amethyst and contribute to total signal intensity. It should be noted that IR spectra were recorded using a square aperture, limiting the studied sample surface to an area of 1 cm2 so that the IR spectra display the summary water characteristics of the analyzed areas. The distribution of molecular water in the banded area of agates is not homogenous. The spatial water distribution across the growing sequence (presented by the alternation of moganite-rich and moganite-poor chalcedony layers, and macrocrystalline quartz) of the agate sample from the Allumiere-Tolfa volcanic district (Latium, Italy) was studied by Conte and his colleagues using coupled Raman and FT-IR micro-spectroscopy [49]. In particular, these authors revealed an anticorrelation between the moganite content and water signal. Moreover, the IR spectrum, recorded from the macrocrystalline quartz layer, showed a lower intensity of water signal in comparison with chalcedonic layers, contrasting with our data. The 3585 cm−1 infrared absorption band is occasionally observed in natural and synthetic rock crystals, including amethysts [50]. It was also recognized in the IR spectra of agates from young volcanic hosts, but has not been found in the IR spectra of agates in volcanics aged from 1100 to 89 Ma [44,48,49]. Up to now, the assignment of this band has been quite vague. One of the proposed explanations for this band is a «hydrogarnet [4H]Si defect (Si4+→4H+)» [51,52]. The presence of the band at 3585 cm−1 (Figure 11) is also related to the stretching vibrations of OH groups in the Si-OH silanol groups, which appear when the SiO2 bond is broken [53]. Stünitz and co-authors [54] experimentally proved that the appearance of the 3585 cm−1 band in the IR spectrum of a deformed natural milky quartz crystal is a consequence of the redistribution of fluid inclusions. These authors showed that primary fluid inclusions up to 100 µm in size, occurring after experimental deformation (recrystallization) of quartz crystals at 900 and 1000 °C, were transformed into structurally bound OH defects inside dislocations. These showed a clear band at 3585 cm−1 in the IR spectra. The 3585 cm−1 band in the IR spectra of examined agate with amethyst can be associated with the recrystallization of quartz observed in thin sections as feathery microtextures within some quartz crystals (Figure 4E,F). Moreover, the data provided by Conte with colleagues [49] point to a coevolution of the molecular water and Si-OH silanol components in chalcedony and quartz of studied agates.

5.3. Mineral Assemblage of Amethyst-Bearing Agate Occurrences

Most agates consist of more than one silica phase [19]. The mineral composition of Tevi agates with amethyst is dominated by micro- and macro-crystalline alpha quartz, length-fast and zebraic chalcedony, and moganite. Besides the different silica phases, other minerals are formed with agates. Carbonates and zeolites are typical minerals in volcanic agates. Mn-rich calcite and clinoptilolite are present in the outer zone of some agates at the point of contact of chalcedony with the host rock (Figure 5A,E,J,K). Iron oxide (magnetite) is observed in the host rock and hydroxide (goethite) is present in the amethyst zone (Figure 5G,L and Figure 10A). Native copper, covellite, chalcopyrite and Ni-enriched pyrite form rare micro-inclusions that are found in the agates and reflect the host rock composition. Copper minerals and, especially, native copper are rare mineral phases in agates [55]. They have been identified in some deposits (the Ayaguz agate deposit (East Kazakhstan); the Wolverine Mine, Wolverine, Houghton County, Michigan (USA); Rudno near Krzeszowice in Lower Silesia (Poland) and others). The simultaneous presence of native copper, Cu sulfide (covellite, CuS), and Cu–Fe sulfide (chalcopyrite, CuFeS2) was revealed in Tevi agates. A similar association native copper with Cu- and Cu–Fe-sulfides and Cu-oxide (cuprite, CuO) was reported for amethyst-free agates from the Avacha Bay Eastern Kamchatka (Russia) [55,56,57]. Native copper together with Cu- and Cu–Fe-sulphides associated with hematite and pyrite have been observed in the amethyst obtained from the Thunder Bay mine (Canada) [58]. Copper minerals are absent in agate geodes derived from the Amethysta do Sul (Brazil) and Ijevan (Armenia) deposits, which are similar in both morphology and texture to examined agates and to agate geodes from Artigas and Los Catalanes (Uruguay) and like amethysts from the Boudi deposit (Morocco) (Table 3) [7,10,11,38,59,60]. The copper mineralization is probably a typomorphic feature of copper-rich agates that can be related to the composition of the volcanic host rocks. A distinctive characteristic of Amethysta do Sul Brazilian agate geodes compared to other amethyst-containing agates is the abundance of minerals of the sulfate class (barite, anhydrite, gypsum) [38,61]. A common feature of many amethyst-bearing agates is the abundance of Fe-oxides and/or Fe-hydroxides, indicating the significant role of iron in the amethyst-forming fluid (Table 3).

5.4. T,P,X-Conditions of Amethyst Formation in Agate Geodes in Altered Volcanic Rocks

There are several studies that have investigated fluid inclusions in amethysts from agate geodes in altered volcanic rocks [6,7,10,38]. For example, Morteani et al. [7] determined that the amethyst-bearing geodes in the flood basalts of the Arapey formation at Artigas (Uruguay) were formed as protogeodes by bubbles of CO2-rich basalt. These bubbles were derived from the artesian water of the Guaranı aquifer and were present in the footwall of these basalts. The temperature of amethyst formation is estimated from fluid inclusion data to be between 50 and 120 °C. The crystallization of late calcite typically occurs on top of the amethyst crystals at a much lower temperature and from cold surficial water of about 20 °C. Commin-Fischer et al. [6] reported that the amethyst-bearing geodes from Serra Geral Formation basalts (Brazil) were formed at a temperature lower than 100 °C, probably lower than 50 °C, and with fluid salinity as high as 3 wt.% NaCl-eq. Gilg et al. [38] determined that amethyst and colorless quartz in amethyst-bearing geodes in Ametista do Sul (Brazil) were formed at temperatures between 40 and 80 °C, while different calcite generations and late gypsum precipitated at temperatures below 45 °C. They revealed that the variation in homogenization temperatures and in δ18O values of amethyst showed evidence of repeated pulses of ascending hydrothermal fluids of up to 80–90 °C. According to the results of these studies amethyst of the Brazilian and Uruguayan deposits crystallized at temperatures from 50 to 130 °C, the salinity of mineral-forming fluids varied from 0.3 to 5.6 wt.% NaCl eq. The main salt component of the fluid was NaCl. The pressure upon filling the geode with silica was estimated to range from 0.21 to 0.29 kbar (Table 4).
The estimated crystallization temperatures of amethyst in hydrothermal veins are much higher and range from 139 to 420 °C, while the salinity of mineral-forming fluids is higher, up to 34 wt.% NaCl eq. [9,17,63,64,65]. The fluids, in addition to NaCl, often contain KCl, Fe, Mn, SO42-, CO2, CH4, and N2. The pressure of mineral formation varies from 0.2 to 5.5 kbar (Table 4).
Amethyst was synthesized in hydrothermal environments that differ from natural conditions in terms of their chemical composition. Aqueous solutions of ammonium fluoride (salinity 15 wt.%) were mainly used, as well as solutions of K2CO3 with the addition of Fe, Mn, Li, and Co impurities to improve the color of the amethyst. The appearance of amethyst coloration of synthetic crystals occurred when exposed to ionizing radiation. The T and P ranges of synthesis were limited by temperatures from 150 to 500 °C at pressures from 0.13 to 1.2 kbar [66,67,68] (Table 4).
The variations in the O-isotope composition of individual bands (chalcedony, amethyst, quartz) of concentrically banded Tevi agate (Table 2, Figure 13) can be associated with the long geological period of their formation, during which the temperature and isotopic composition of the environment can change. It should also be taken into account that the isotopic composition of the volcanic hosts significantly differs from that of agates. The case when quartz has lower δ18O values compared to chalcedony (samples #6 and #12 in Figure 13) suggests that it either formed at the same temperature as chalcedony in the presence of a fluid with a lower 18O/16O ratio compared to chalcedony, or crystallized at higher temperatures but in the presence of the same fluid and, therefore, at a different time. Similar O-isotope ratios between chalcedony and associated quartz have been observed in some studies [69,70,71]. Götze and his colleagues [70] suggested that variation in the O-isotope composition within single agate samples can be explained either by the kinetic effects during isotope fractionation (e.g., the agate formation from a solution via an amorphous interstage) or by mixing process of meteoric and magmatic fluids.

5.5. Genesis of Amethyst in Agates

The observed mineral assemblage of examined agates suggests a preferred formation under low-temperature conditions. The appearance of zeolites and calcite can be a result of alteration processes of the volcanic host rocks and emphasizes that, besides enormous amounts of SiO2, Al, Fe, Ca, Na, and K are also released during these processes [19]. The presence of clinoptilolite in association with quartz (or chalcedony) characterizes a low-temperature (~90–130° C) stage of zeolite facies metamorphism of agate hosts [72] (p. 19). The hydrothermal fluids that formed quartz druses were apparently enriched in iron. At the beginning of the crystallization of colorless crystals, iron was pushed into the residual solution. As they grew, the concentration of iron gradually increased and eventually led to the formation of amethyst with inclusions of goethite [73]. Simultaneously with amethyst, in the heads of colorless quartz crystals, needle-like aggregates of goethite crystallized on the surfaces of its faces (Figure 5G). Hematite and (or) goethite/hydrogoethite are permanent inclusions in amethyst of agates (Table 3). Carbonates (calcite, siderite, and ankerite), iron sulfides (pyrite, marcasite), sulfates (barite, anhydride, and gypsum), and fluorite are found in agates with amethyst at some deposits (Table 3). Judging by the mineral associations (Table 3), the composition of liquid inclusions in amethyst crystals (Table 4), as well as the results of temperature estimation based on the obtained data on O-isotope composition (Table 2), hydrothermal solutions were low-temperature, low-concentrated, oxidized, and essentially siliceous with a high iron content. In the anionic part of the solutions, chloride ions, and to a lesser extent bicarbonate and sulfate ions, played a significant role.
Amethyst comes in an attractive violet color with a reddish or bluish tint. This was originally interpreted as being a result of the presence of Fe3+, which turns into Fe4+ after irradiation and substitutes for Si4+ in a deformed tetrahedral position [74]. However, recent studies questioned this result and, by using modern analytical techniques, like EPR, Mössbauer and synchrotron X-ray absorption spectroscopy, attributed the coloration of amethyst to the presence of Fe3+ [75,76,77,78]. It is generally accepted that amethyst is formed by irradiation, in which Fe3+ loses electrons and forms a new Fe4+ color center responsible for its violet color [74]. Amethyst requires oxidizing conditions to incorporate Fe3+, which may be the result of mixing of oxidized meteoric and/or seawater with ascending hydrothermal fluids [79]. Natural radiation can be probably explained by the moderate concentrations of uranium and thorium in the surrounding volcanic wall rocks. The contents of U (1.4–2.2 ppm) and Th (3–5.39 ppm) in the volcanics of Cape Tevi [25] are higher than their Clarke values in basalts—0.6 and 2.2 ppm, respectively [80]. Shallow underwater conditions most likely predominated in studied areas, adding sea and meteoric water to the hydrothermal fluids.

6. Conclusions

The present contribution provides the first detailed mineralogical investigation of amethyst-bearing agates from the Tevinskoye deposit associated with the Middle–Upper Eocene volcanics within the Kinkilsk complex of Northern Kamchatka (Russia). The study aimed to characterize the agate with amethyst and obtain data for the reconstruction of the conditions for their genesis. The field observation showed that agate mineralization mainly occurs in lavas and tuffs as amygdales, geodes, lenses and veins, which are the main source of resupply of coastal agate placers.
The examined agates exhibit diversified internal microtextures due to the individual bands composed of micro- and macro-crystalline quartz, length-fast chalcedony, and zebraic chalcedony. Elevated moganite content was revealed in some length-fast chalcedony bands (up to 50%) and microcrystalline quartz zones (up to 22%), forming the outer agate rim. Conversely, in macrocrystalline quartz areas, including the amethyst crystals, it was not found.
The agates with amethyst from the Tevinskoye deposit are similar in mineralogy to the agates from Cretaceous volcanic rocks of Ijevan (Armenia) and Ametista do Sul deposits (Brazil) and some other occurrences. Their mineral assemblages are presented by chalcedony, quartz, amethyst, goethite, calcite, and zeolites. The presence of minor amounts of native copper, covellite, chalcopyrite, as well as Mn-enriched calcite and Ni-enriched pyrite is a feature of the Tevi agates. The copper and iron mineralization is probably a typomorphic feature related to the composition of volcanic host rocks.
Ametyst in Tevi agates could be formed at a low temperature (<100 °C) from low-salinity fluids under an oxidizing environment. The presence of goethite inclusions in amethyst points to a high iron concentration in the agate-forming fluid.

Supplementary Materials

The following supporting information can be downloaded at: https://www.mdpi.com/article/10.3390/min13081051/s1, Table S1. Fitting parameters for the Raman spectra of moganite-rich layers from banded agate sample in the 400–550 cm−1 range.

Author Contributions

Conceptualization, data curation, writing, E.N.S. and G.A.P.; field investigation, G.A.P.; analytical investigation, E.N.S., G.A.P., A.A.B., V.F.P. and T.N.M.; visualization, E.N.S. and G.A.P.; supervision, G.A.P. All authors have read and agreed to the published version of the manuscript.

Funding

This research was funded by state assignment to the Sobolev Institute of Geology and Mineralogy, Siberian Branch of RAS and Institute of Geology, Karelian Research Centre of RAS.

Data Availability Statement

All data are contained within the article and Supplementary Materials.

Acknowledgments

We thank G. Rychagova and I. Rychagov, participants in field investigations at the Tevinskoye agate deposits. Our thanks also go to Inina I.S. (IG KRC RAS, Petrozavodsk, Russia) and Pikulev V.B. (Petrozavodsk State University, Petrozavodsk, Russia) for their assistance with X-ray diffraction and FT-IR spectroscopy data collection. We are grateful to N.S. Karmanov and M.V. Khlestov (The Analytical Center for Multi-elemental and Isotope Research in the IGM SB RAS (Novosibirsk, Russia) for electron microprobe data. We would like to deeply acknowledge three anonymous reviewers for their careful revisions and for their comments, which helped us to improve the manuscript.

Conflicts of Interest

The authors declare no conflict of interest.

References

  1. Götze, J. Chemistry, textures and physical properties of quartz—Geological interpretation and technical application. Mineral. Mag. 2009, 73, 645–671. [Google Scholar] [CrossRef]
  2. Götze, J.; Möckel, R. Quartz: Deposits, Mineralogy and Analytics; Springer: Berlin/Heidelberg, Germany, 2012. [Google Scholar]
  3. Guidelines for the Search and Prospective Assessment of Deposits of Colored Stones (Jewelry, Ornamental, Decorative Facing); v.1. Amethyst; Mingeo USSR: Moscow, Russia, 1974; p. 43. (In Russian)
  4. Lieber, W. Amethyst: Geschichte, Eigenschaften, Fundorte; Christian Weise Verlag: München, Germany, 1994; 188p. [Google Scholar]
  5. Klemme, S.; Berndt, J.; Mavrogonatos, C.; Flemetakis, S.; Baziotis, I.; Voudouris, P.; Xydous, S. On the Color and Genesis of Prase (Green Quartz) and Amethyst from the Island of Serifos, Cyclades, Greece. Minerals 2018, 8, 487. [Google Scholar] [CrossRef] [Green Version]
  6. Commin-Fischer, A.; Berger, G.; Polvé, M.; Dubois, M.; Sardini, P.; Beaufort, D.; Formoso, M.L.L. Petrography and chemistry of SiO2 filling phases in the amethyst geodes from the Serra Geral Formation deposit, Rio Grande do Sul, Brazil. J. S. Am. Earth Sci. 2010, 29, 751–760. [Google Scholar] [CrossRef]
  7. Morteani, G.; Kostitsyn, Y.; Preinfalk, C.; Gilg, H.A. The genesis of the amethyst geodes at Artigas (Uruguay) and the paleohydrology of the Guarani aquifer: Structural, geochemical, oxygen, carbon, strontium isotope and fluid inclusion study. Int. J. Earth Sci. 2010, 99, 927–947. [Google Scholar] [CrossRef]
  8. Hartmann, L.A.; Duarte, L.C.; Massonne, H.J.; Michelin, C.; Rosenstengel, L.M.; Bergmann, M.; Theye, T.; Pertille, J.; Arena, K.R.; Duarte, S.K.; et al. Sequential opening and filling of cavities forming vesicles, amygdales and giant amethyst geodes in lavas from the southern Paraná volcanic province, Brazil and Uruguay. Int. Geol. Rev. 2012, 54, 1–14. [Google Scholar] [CrossRef]
  9. Duarte, L.C.; Hartmann, L.A.; Vasconcelos, M.A.Z.; Medeiros, J.T.N.; Theye, T. Epigenetic formation of amethyst-bearing geodes from Los Catalanes gemological district, Artigas, Uruguay, southern Paraná Magmatic Province. J. Volcanol. Geotherm. Res. 2009, 184, 427–436. [Google Scholar] [CrossRef]
  10. Duarte, L.C.; Hartmann, L.A.; Ronchi, L.H.; Berner, Z.; Theye, T.; Massonne, H.J. Stable isotope and mineralogical investigation of the genesis of amethyst geodes in the Los Catalanes gemological district, Uruguay, southernmost Paraná volcanic province. Miner. Depos. 2011, 46, 239–255. [Google Scholar] [CrossRef]
  11. Pršek, J.; Dumańska-Słowik, M.; Powolny, T.; Natkaniec-Nowak, L.; Toboła, T.; Zych, D.; Skrepnicka, D. Agates from WesternAtlas (Morocco)—Constraints from Mineralogical and Microtextural Characteristics. Minerals 2020, 10, 198. [Google Scholar] [CrossRef] [Green Version]
  12. Godovikov, A.A.; Ripinen, O.I.; Motorin, S.G. Agates; Nedra: Moscow, Russia, 1987; p. 368. (In Russian) [Google Scholar]
  13. Goncharov, V.I.; Gorodinsky, M.E.; Pavlov, G.F.; Savva, N.E.; Fadeev, A.P.; Vartanov, V.V.; Gunchenko, E.V. Chalcedony of North.-East. of the USSR; Science: Moscow, Russia, 1987; p. 192. (In Russian) [Google Scholar]
  14. Rozhkova, V.V. Morphology and properties of the North Timan agates. Proc. Inst. Geol. Komi Phil. Acad. Sci. USSR 1984, 46, 70–77. (In Russian) [Google Scholar]
  15. Sedov, B.M. Upper Olsky Agates; Okhotnik, Russia, 2019; 244p. [Google Scholar]
  16. Svetova, E.; Svetov, S. Mineralogy and Geochemistry of Agates from Paleoproterozoic Volcanic Rocks of the Karelian Craton, Southeast Fennoscandia (Russia). Minerals 2020, 10, 1106. [Google Scholar] [CrossRef]
  17. Voudouris, P.; Melfos, V.; Mavrogonatos, C.; Tarantola, A.; Götze, J.; Alfieris, D.; Maneta, V.; Psimis, I. Amethyst Occurrences in Tertiary Volcanic Rocks of Greece: Mineralogical, Fluid Inclusion and Oxygen Isotope Constraints on Their Genesis. Minerals 2018, 8, 324. [Google Scholar] [CrossRef] [Green Version]
  18. Kigai, I.N. The genesis of agates and amethyst geodes. Can. Miner. 2019, 57, 867–883. [Google Scholar] [CrossRef]
  19. Götze, J.; Möckel, R.; Pan, Y. Mineralogy, Geochemistry and Genesis of Agate—A Review. Minerals 2020, 10, 1037. [Google Scholar] [CrossRef]
  20. Moxon, T.; Palyanova, G. Agate Genesis: A Continuing Enigma. Minerals 2020, 10, 953. [Google Scholar] [CrossRef]
  21. Palyanova, G. Editorial for Special Issue “Agates: Types, Mineralogy, Deposits, Host Rocks, Ages and Genesis”. Minerals 2021, 11, 1035. [Google Scholar] [CrossRef]
  22. Slyadnev, B.I.; Borovtsov, A.K.; Burmakov, Y.A.; Sidorenko, V.I.; Sapozhnikova, L.P.; Tararin, I.A.; Badredinov, Z.G.; Surikov, S.N.; Sidorov, M.D.; Sidorov, E.G.; et al. State Geological Map of the Russian Federation. Scale 1: 1,000,000 (Third Generation). Series Koryaksko-Kurilskaya. Sheet O-57—Palana. Explanatory Letter. St. Petersburg: VSEGEI Cartographic Factory, 2013. 296p. (In Russian). Available online: https://www.vsegei.ru/ru/info/pub_ggk1000-3/Koryaksko-Kurilskaya/o-57.php (accessed on 10 January 2023).
  23. Fedorov, P.I.; Kovalenko, D.V.; Bayanova, T.B.; Serov, P.A. Early Cenozoic Magmatism in the Continental Margin of Kamchatka. Petrology 2008, 16, 261–278. [Google Scholar] [CrossRef]
  24. Fedorov, P.I.; Kovalenko, D.V.; Ageeva, O.A. Western Kamchatka–Koryak Continental-Margin Volcanogenic Belt: Age, Composition, and Sources. Geochem. Int. 2011, 49, 768–792. [Google Scholar] [CrossRef]
  25. Fedorov, P.I.; Kovalenko, D.V.; Perepelov, A.B.; Dril, S.I. Composition of sources of the Kinkil complex of western Kamchatka according to isotope-geochemical data. Bull. KRAUNC Earth Sci. 2019, 1, 54–72. [Google Scholar] [CrossRef]
  26. Götze, J.; Nasdala, L.; Kleeberg, R.; Wenzel, M. Occurrence and distribution of “moganite” in agate/chalcedony: A combined micro-Raman, Rietveld, and cathodoluminescence study. Contrib. Mineral. Petrol. 1998, 133, 96–105. [Google Scholar] [CrossRef]
  27. Borisenko, A.S. Analysis of the Salt Composition of solutions of gas-liquid inclusions in minerals by cryometry. In The Use of Methods of Thermobarogeochemistry in the Search and Study of Ore Deposits; Laverov, N.P., Ed.; Nedra: Moscow, Russia, 1982; pp. 37–47. (In Russian) [Google Scholar]
  28. Roedder, E. Fluid inclusions. Rev. Mineral. 1984, 12, 79–108. [Google Scholar]
  29. Bodnar, R.J.; Vityk, M.O. Interpretation of microthermometric data for NaCl–H2O fluid inclusions. In Fluid Inclusions in Minerals: Methods and Applications; De Vivo, B., Frezzotti, M.L., Eds.; Virginia Polytechnic Inst State Univ: Blacksburg, VA, USA, 1994; pp. 117–131. [Google Scholar]
  30. Sharp, Z.D. A laser-based microanalytical method for the in-situ determination of oxygen isotope ratios of silicates and oxides. Geochim. Cosmochim. Acta 1990, 54, 1353–1357. [Google Scholar] [CrossRef]
  31. Dong, G.; Morrison, G.; Jaireth, S. Quartz textures in epithermal veins, Queensland—Classification, origin, and implication. Econ. Geol. 1995, 90, 1841–1856. [Google Scholar] [CrossRef]
  32. Murata, J.; Norman, M.B. An index of crystallinity for quartz. Am. J. Sci. 1976, 276, 1120–1130. [Google Scholar] [CrossRef]
  33. Kuznetsov, S.K.; Svetova, E.N.; Shanina, S.N.; Filippov, V.N. Minor Elements in Quartz from Hydrothermal-Metamorphic Veins in the Nether Polar Ural Province. Geochemistry 2012, 50, 911–925. [Google Scholar] [CrossRef]
  34. Tsai, Y.-L.; Huang, E.; Li, Y.-H.; Hung, H.-T.; Jiang, J.-H.; Liu, T.-C.; Chen, H.-F. Raman Spectroscopic Characteristics of Zeolite Group Minerals. Minerals 2021, 11, 167. [Google Scholar] [CrossRef]
  35. White, S.N. Laser Raman spectroscopy as a technique for identification of seafloor hydrothermal and cold seep minerals. Chem. Geol. 2009, 259, 240–252. [Google Scholar] [CrossRef]
  36. Kats, A. Hydrogen in Alpha-quartz. Philips Res. Rep. 1962, 17, 201–279. [Google Scholar]
  37. Aines, R.D.; Rossman, G.R. Water in minerals? A peak in the infrared. Geophys. Res. 1984, 89, 4059–4071. [Google Scholar] [CrossRef]
  38. Gilg, H.A.; Krüger, Y.; Taubald, H.; van den Kerkhof, A.M.; Frenz, M.; Morteani, M. Mineralisation of amethyst-bearing geodes in Ametista do Sul (Brazil) from low-temperature sedimentary brines: Evidence from monophase liquid inclusions and stable isotopes. Miner. Depos. 2014, 49, 861–877. [Google Scholar] [CrossRef]
  39. Matsuhisa, Y.; Goldsmith, J.R.; Clayton, R.N. Oxygen isotopic fractionation in the system quarz-albite–anorthite-water. Geochim. Cosmochim. Acta 1979, 43, 1131–1140. [Google Scholar] [CrossRef]
  40. Sander, M.V.; Black, J.E. Crystallization and recrystallization of growth-zoned vein quartz crystals from epithermal systems; implications for fluid inclusion studies. Econ. Geol. 1988, 83, 1052–1060. [Google Scholar] [CrossRef]
  41. Marinova, I.; Ganev, V.; Titorenkova, R. Colloidal origin of colloform-banded textures in the Paleogene low-sulfidation Khan Krum gold deposit, SE Bulgaria. Miner. Depos. 2014, 49, 49–74. [Google Scholar] [CrossRef]
  42. Yilmaz, T.I.; Duschl, F.; Di Genova, D. Feathery and network-like filamentous textures as indicators for the re-crystallization of quartz from a metastable silica precursor at the Rusey Fault Zone, Cornwall, UK. Solid Earth 2016, 7, 1509–1519. [Google Scholar] [CrossRef] [Green Version]
  43. Moxon, T.; Rios, S. Moganite and water content as a function of age in agate: An XRD and thermogravimetric study. Eur. J. Mineral. 2004, 4, 693–706. [Google Scholar] [CrossRef]
  44. Moxon, T.; Reed, S.J.B.; Zhang, M. Metamorphic effects on agate found near the Shap granite, Cumbria: As demonstrated by petrography, X-ray diffraction spectroscopic methods. Miner. Mag. 2007, 71, 461–476. [Google Scholar] [CrossRef]
  45. Moxon, T.; Carpenter, M.A. Crystallite growth kinetics in nanocrystalline quartz (agate and chalcedony). Miner. Mag. 2009, 73, 551–568. [Google Scholar] [CrossRef]
  46. Moxon, T. Agates: A study of ageing. Eur. J. Mineral. 2002, 14, 1109–1118. [Google Scholar] [CrossRef]
  47. Svetova, E.N.; Svetov, S.A. Agates from Mesoproterozoic Volcanics (Pasha–Ladoga Basin, NW Russia): Characteristics and Proposed Origin. Minerals 2023, 13, 62. [Google Scholar] [CrossRef]
  48. Moxon, T.; Nelson, D.R.; Zhang, M. Agate recrystallization: Evidence from samples found in Archaean and Proterozoic host rocks, Western Australia. Aust. J. Earth Sci. 2006, 53, 235–248. [Google Scholar] [CrossRef]
  49. Conte, A.; Della Ventura, G.; Rondeau, B.; Romani, M.; Guidi, M.C.; La, C.; Napoleoni, C.; Lucci, F. Hydrothermal genesis and growth of the banded agates from the Allumiere-Tolfa volcanic district (Latium, Italy). Phys. Chem. Miner. 2022, 49, 39. [Google Scholar] [CrossRef]
  50. Li, J.; Zheng, Y.; Liu, X.; Li, G.; Yu, X.; Wang, Y.; Li, H.; Liu, H.; Shan, G.; Li, T.; et al. Thermal Process of Rock Crystal: Cause of Infrared Absorption Band at 3585 cm−1. Crystals 2021, 11, 1083. [Google Scholar] [CrossRef]
  51. Aines, R.D.; Kirby, S.H.; Rossman, G.R. Hydrogen speciation in synthetic quartz. Phys. Chem. Miner. 1984, 11, 204–212. [Google Scholar] [CrossRef]
  52. Stalder, R.; Konzett, J. OH-defects in quartz in the system quartz–albite–water and granite–water between 5 and 25 kbar. Phys. Chem. Miner. 2012, 39, 817–827. [Google Scholar] [CrossRef]
  53. Fukuda, J. Water in Rocks and Minerals—Species, Distributions, and Temperature Dependences. In Infrared Spectroscopy—Materials Science, Engineering and Technology; Tohoku University: Sendai, Japan, 2012. [Google Scholar] [CrossRef] [Green Version]
  54. Stünitz, H.; Thust, A.; Heilbronner, R.; Behrens, H.; Kilian, R.; Tarantola, A.; Fitz Gerald, J.D. Water redistribution in experimentally deformed natural milky quartz single crystals-Implications for H2O-weakening processes. J. Geophys. Res. Solid Earth 2017, 122, 866–894. [Google Scholar] [CrossRef] [Green Version]
  55. Palyanova, G.; Sidorov, E.; Borovikov, A.; Seryotkin, Y. Copper-Containing Agates of the Avacha Bay (Eastern Kamchatka, Russia). Minerals 2020, 10, 1124. [Google Scholar] [CrossRef]
  56. Sidorov, E.G.; Kutyev, F.T.; Anikin, P.P. Native Copper Agates of the Kuril-Kamchatka Province. In Native Metals in Postmagmatic Formations; Yakutsk Publishing House: Yakutsk, Russia, 1985; pp. 72–73. (In Russian) [Google Scholar]
  57. Saveliev, D.P. A scattering of agates at Cape Vertikalny, Eastern Kamchatka. Bull. Kamchatka Reg. Assoc. Educ. Sci. Cent. Ser. Earth Sci. 2020, 47, 3. [Google Scholar] [CrossRef]
  58. McArthur, J.R.; Jennings, E.A.; Kissin, S.A.; Sherlock, R.L. Stable-isotope, fluid-inclusion, and mineralogical studies relating to the genesis of amethyst, Thunder Bay Amethyst Mine, Ontario. Can. J. Earth Sci. 2011, 30, 1955–1969. [Google Scholar] [CrossRef]
  59. Khakimov, A.K. Some features of the mineralogy and genesis of agate bodies in the Ijevan region of Armenia. News High. Educ. Inst. Geol. Explor. 1965, 7, 45–56. (In Russian) [Google Scholar]
  60. Troilo, F.; Harfi, A.; El Bittarello, E.; Costa, E. Amethyst from Boudi, Morocco. Gems Gemmol. 2015, 51, 32–40. [Google Scholar] [CrossRef]
  61. Gilg, H.A.; Morteani, G.; Kostitsyn, Y.; Preinfalk, C.; Gatter, I.; Strieder, A.J. Genesis of amethyst geodes in basaltic rocks of the Serra Geral Formation (Ametista do Sul, Rio Grande do Sul, Brazil): A fluid inclusion, REE, oxygen, carbon, and Sr isotope study on basalt, quartz, and calcite. Miner. Depos. 2003, 38, 1009–1025. [Google Scholar] [CrossRef]
  62. Kile, D.E. Mineralogy of the Amethyst Mines in the Thunder Bay Area, Thunder Bay, Ontario, Canada. Rocks Miner. 2019, 94, 306–343. [Google Scholar] [CrossRef]
  63. Dumańska-Słowik, M.; Toboła, T.; Jarmołowicz-Szulc, K.; Naglik, B.; Dyląg, J.; Szczerba, J. Inclusion study of hourglass amethyst from Boudi (Morocco) by Raman microspectroscopy and microthermometric measurements. Spectrochim. Acta Part A Mol. Biomol. Spectrosc. 2017, 187, 156–162. [Google Scholar] [CrossRef] [PubMed]
  64. Yang, K.H.; Yu, S.H.; Lee, J.D. A fluid inclusion study of an amethyst deposit in the Cretaceous Kyongsang Basin, South Korea. Mineral. Mag. 2001, 65, 477–487. [Google Scholar] [CrossRef]
  65. Frishman, N.I. Stage and formation conditions of amethyst in “Cape Korabl” deposit. Proc. Fersman Sci. Sess. GI KSC RAS. 2015, 12, 339–341. [Google Scholar]
  66. Balitsky, V.S.; Machina, I.B.; Mar’in, A.A.; Shigley, J.E.; Rossman, G.R.; Lu, T. Industrial growth, morphology and some properties of bi-colored amethyst-citrine quartz (ametrine). J. Cryst. Growth 2000, 212, 255–260. [Google Scholar] [CrossRef]
  67. Balitsky, V.S.; Balitskaya, L.V.; Balitsky, D.V.; Semenchenko, S.P.; Humenny, M.V. A Method for Growing Quartz or Amethyst Crystals or Amethyst Druse by the Hydrothermal Method of Temperature Difference in Aqueous Solutions of Ammonium Fluoride. RU 2707771, 29 November 2019. (In Russian). [Google Scholar]
  68. Zebrev, Y.N.; Chernaya, T.N.; Konovalov, N.I.; Novoselov, V.P.; Oleinik, N.A.; Abdrafikov, S.N.; Popolitov, V.I.; Pisarevsky, Y.V. Method for Obtaining Synthetic Amethyst. RU 2040596 C1, 25 July 1995. (In Russian). [Google Scholar]
  69. Harris, C. Oxygen-isotope zonation of agates from Karoo volcanics of the Skeleton Coast, Namibia. Am. Mineral. 1989, 74, 476–481. [Google Scholar]
  70. Götze, J.; Tichomirowa, M.; Fuchs, H.; Pilot, J.; Sharp, Z.D. Geochemistry of agates: A trace element and stable isotope study. Chem. Geol. 2001, 175, 523–541. [Google Scholar] [CrossRef]
  71. Shen, M.; Lu, Z.; He, X. Mineralogical and Geochemical Characteristics of Banded Agates from Placer Deposits: Implications for Agate Genesis. ACS Omega 2022, 7, 23858–23864. [Google Scholar] [CrossRef]
  72. Spiridonov, E.M.; Ladygin, V.M.; Yanakieva, D.Y.; Frolova, J.V.; Semikolennykh, E.S. Agates in Metavolcanics. Bulletin of the Russian Federal Property Fund. 2014, 71p. (In Russian). Available online: https://www.rfbr.ru/rffi/ru/bulletin/o_1923809#8 (accessed on 10 January 2023).
  73. Merino, E.; Wang, Y.; Deloule, E. Genesis of agates in flood basalts; twisting of chalcedony fibers and trace-element geochemistry. Am. J. Sci. 1995, 295, 1156–1176. [Google Scholar] [CrossRef]
  74. Rossman, G.R. Colored varieties of the silica minerals. Rev. Mineral. 1994, 29, 433–467. [Google Scholar]
  75. Czaja, M.; Kądziołka-Gaweł, M.; Konefał, A.; Sitko, R.; Teper, E.; Mazurak, Z.; Sachanbińskiet, M. The Mossbauer spectra of prasiolite and amethyst crystals from Poland. Phys. Chem. Miner. 2017, 44, 365–375. [Google Scholar] [CrossRef] [Green Version]
  76. Dedushenko, S.K.; Makhina, I.B.; Mar’in, A.A.; Mukhanov, V.A.; Perfiliev, Y.U.D. What oxidation state of iron determines the amethyst colour? Hyperfine Interact. 2004, 156, 417–422. [Google Scholar] [CrossRef]
  77. Di Benedetto, F.; Innocenti, M.; Tesi, S.; Romanelli, M.; D’Acapito, F.; Fornaciai, G.; Montegrossi, G.; Pardi, L.A. A Fe K-edge XAS study of amethyst. Phys. Chem. Miner. 2010, 37, 283–289. [Google Scholar] [CrossRef]
  78. SivaRamaiah, G.; Lin, J.; Pan, Y. Electron paramagnetic resonance spectroscopy of Fe3+ ions in amethyst: Thermodynamic potentials and magnetic susceptibility. Phys. Chem. Miner. 2011, 38, 159–167. [Google Scholar] [CrossRef]
  79. Fournier, R.O. The behaviour of silica in hydrothermal solutions. Geology and geochemistry of epithermal systems. Rev. Econ. Geol. 1985, 2, 45–61. [Google Scholar]
  80. Taylor, S.R. Abundance of chemical elements in the continental crust: A new table. Geochim. Cosmochim. Acta 1964, 28, 1273–1285. [Google Scholar] [CrossRef]
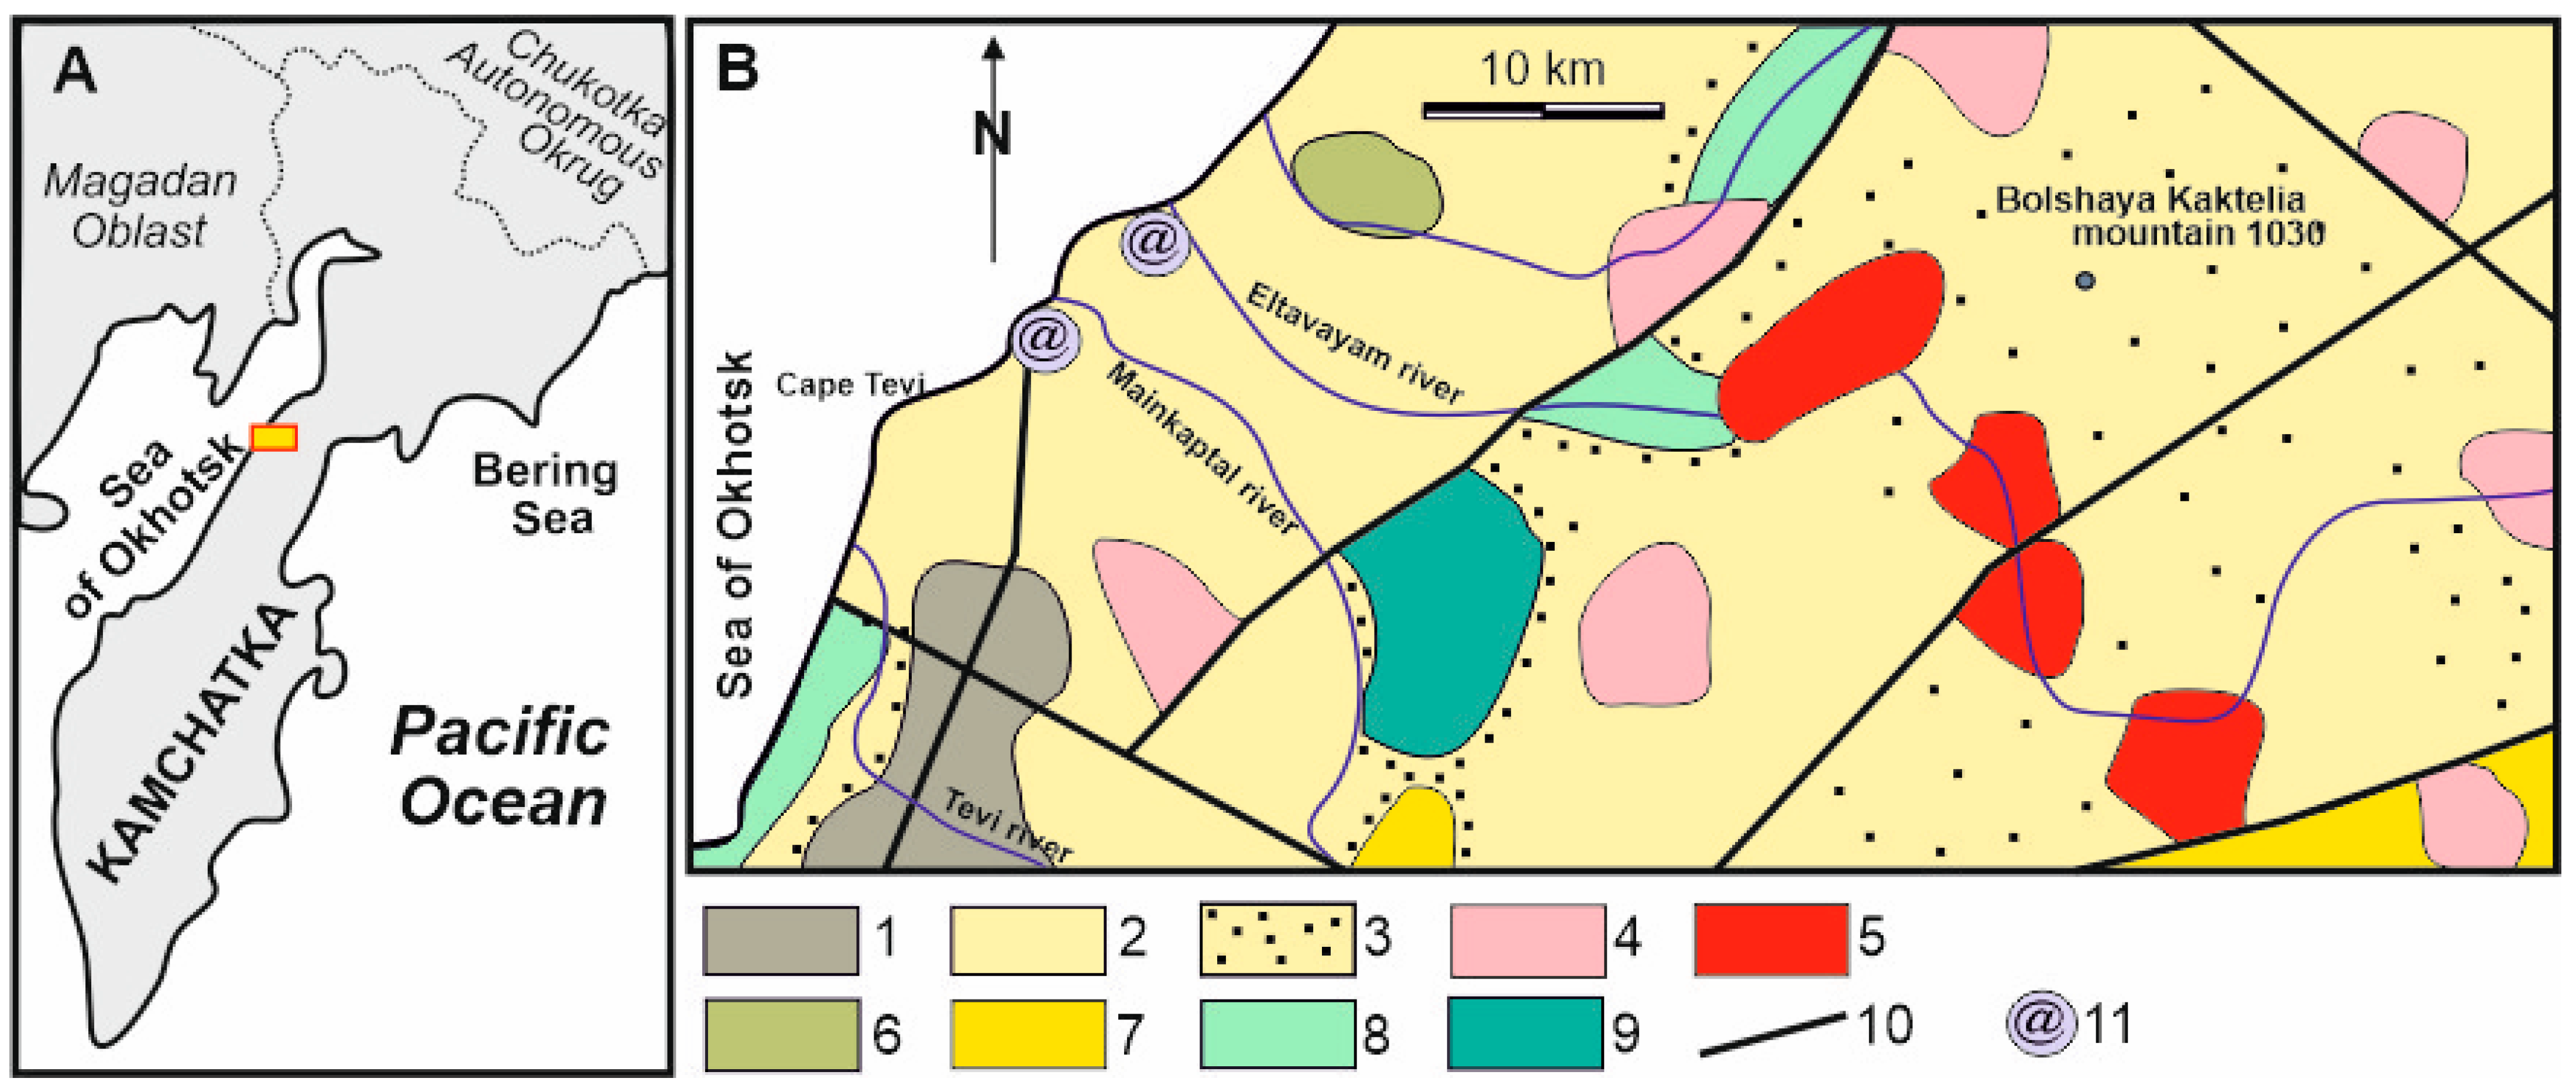
Figure 1. (A) Location of the studied area. (B) Simplified geological map of the Tevinskoe agate deposit area based on [22,23,24,25]. Legend: Quaternary glacial sediments: 1—unlayered blocky-pebble-boulder loams and sandy loams, clays with gruss, crushed stone and boulders clays. Eocene–Oligocene subvolcanics rocks: 2—andesitobasalts; 3—dacites; 4—basalts. Middle–Upper Eocene: 5—amphibole–biotite dacites and rhyolites, two-pyroxene andesites and basalts; 6—vitroclastic tuffs and tuffites with mineral and brown coals, coaly tuff-siltstones; 7—dacites, rhyolites, andesites, their tuffs, ignimbrite and tuffites. Cretaceous–Paleogene: 8—sandstones and siltstones with interbeds and lenses of coaly argillites, concretions of carbonate sandstones and marls. Upper Cretaceous: 9—argillites, sandstones, siltstones, siliceous rocks; 10—faults; 11—sampling agate placers of the Tevinskoye deposit.
Minerals 13 01051 g001
Figure 2. Field outcrop photographs illustrating the Tevinskoye agate deposit in the Eocene volcanic rocks within the Kinkilsk complex of Northern Kamchatka. (A) View of coastal outcrops of volcanics with agate placers in the bay; (B) rounded agate amygdule with amethyst in the amygdaloidal basalt (size 9 cm × 10 cm); (C) lens-shaped agates with amethyst infill cavities in the agglomerate tuff; (D) examples of collected agate samples with amethysts.
Minerals 13 01051 g002
Figure 3. Photographs of agates with amethyst from the Tevinskoye deposit (Northern Kamchatka, Russia). (A) Concentrically banded agate with cavities incrusted by large amethyst crystals; (B) polished fragment of amethyst druse overgrown on fine-banded chalcedony; (CE) concentrically zoned agate amygdales with alternating bands of chalcedony, amethyst, colorless and milky-white quartz; (F) fragment of agate amygdule with amethyst and thick yellowish carbonate band; (G) cross section of agate, illustrating fine-banded chalcedony external zone with successive overgrowth of milky-white quartz and amethyst. The areas of IR spectroscopy analysis are marked with white squares (see Section 4.5).
Minerals 13 01051 g003
Figure 4. Micrographs of agates with amethyst from the Tevinskoye deposit in transmitted light with crossed polars showing a variety of petrographic silica textures. (A) Rhythmical banding composed of zebraic chalcedony layers within the outer agate zone; (B) alternating bands of length-fast chalcedony fibers and macrocrystalline quartz grains; (C) radial fibrous length-fast chalcedony accompanied by polygonal-shaped aggregates of zebraic chalcedony and microcrystalline quartz at the point of contact with host rocks; (D) smooth transition from banded agate to prismatic quartz crystals, which increases in size towards the geode center; (E,F) internal parts of the agates comprising euhedral prismatic quartz with feathery microtextures developed within the crystals. Abbreviations: Cha—length-fast chalcedony; zCha—zebraic chalcedony; Qz—macrocrystalline quartz; µQz—microcrystalline quartz; fQz—quartz with feathery microtexture.
Minerals 13 01051 g004
Figure 5. Photographs of the SEM-EDS-examined polished agate sections (AC) and BSE images (DL), illustrating mineral assemblages of agates with amethyst from the Tevinskoye deposit. (D) variations in porosity between chalcedony and macrocrystalline quartz (Qz) in outer agate zone; (E) Ni-rich pyrite (Py) inclusions accompanied by calcite (Cal) layer at the point of contact with host rock; (F) Mn-rich calcite aggregate, which is partially corroded by silica (arrows); (G) paniculate-shaped growth of needle-like goethite (Gth) crystals; (H) filamentous native copper (Cu) inclusion in quartz matrix; (I) grains of chalcopyrite (Ccp) surrounded by quartz; (J) grains of covellite (Cv) in calcite matrix; (K) prismatic crystals zeolite/clinoptilolite (Zeo) associated with calcite and quartz at the point of contact with host rock; and (L) main rock-forming minerals of the agate host volcanics: pyroxene (Prx), plagioclase (Pl), magnetite (Mag), and quartz. Images (D,I,K) correspond to agate sample identified by the X-ray diffraction (Section 4.3); images (E,F) correspond to sample from photo (A); image (G) corresponds to sample from photo (B); and images (H,J,L) correspond to sample from photo (C).
Minerals 13 01051 g005
Figure 6. BSE images illustrating surface morphology of agate chip. (A) Transition zone of the banded chalcedony to well-shaped quartz crystals; (B) texture caused by granular surface of the outermost agate zone.
Minerals 13 01051 g006
Figure 7. Photograph of agate with amethyst (A) and diffractograms corresponding to the amethyst crystals (B) and banded chalcedony (C) areas in the range of 5–75 °2θ. The samples areas selected for XRD analysis are marked squares on (A). The red lines on (B,C) point to peaks corresponding to alpha-quartz.
Minerals 13 01051 g007
Figure 8. Selected sections of X-ray diffractograms with the 2θ 68° quintuplet peak of the banded chalcedony and amethyst crystals from agate sample (Figure 7A) with added reference-standard rock crystal (Ref. std., Subpolar Urals). a and b parameters are measured for crystallinity index (CI) calculation.
Minerals 13 01051 g008
Figure 9. Micrographs (transmitted light mode with cross polars) and Raman spectra of local analyses of banded area composed of fibrous chalcedony and micrograined quartz (A), and microcrystalline quartz area (B) at the boundary with host rock. Raman spectra (1–3) on (C) correspond to analytical spots, which are marked by yellow circles on the photos. Spectrum (1) shows the main characteristic, i.e., symmetric stretching-bending vibrations of α-quartz (Q) at 465 cm−1, whereas spectra (2,3) show the peaks of α-quartz (Q) and moganite (M) at 502 cm−1. CM is moganite content.
Minerals 13 01051 g009
Figure 10. Micrographs (reflected light mode) and Raman spectra of mineral inclusions in Tevi agates with amethyst: growth of needle-like goethite crystals (A,C); pyrite (B,C); clinoptilolite (C).
Minerals 13 01051 g010
Figure 11. IR spectra corresponding to amethyst crystals (1) and banded chalcedony (2) areas of the agate sample shown in Figure 3G.
Minerals 13 01051 g011
Figure 12. Monophase fluid inclusions in the amethyst crystal from Tevi agate (Figure 3G). L—liquid phase.
Minerals 13 01051 g012
Figure 13. Equilibrium crystallization temperature of individual bands of agate samples with various bands sequences. The yellow arrows point to the growth direction of the agates, open cycles are analyzed areas. Cha is chalcedony, Amt is amethyst, and Qz is quartz. Calculated temperatures for fractionation with meteoric water (Tmet), oceanic water (Toc) and magmatic water (Tmag).
Minerals 13 01051 g013
Figure 14. Crystallite growth in agate as a function of age. Data (circles) for agate hosts 3480–38 Ma from different regions of the world, with added data (triangles) for Paleoproterizoic (Onega Basin) and Mesoproterozoic (Ladoga Basin) agate hosts of Fennoscandian Shield (Russia) and for examined Tevi agate (rhomb). Markers are the mean crystallite size for each region [16,43,48].
Minerals 13 01051 g014
Table 1. Unit cell parameters, crystallite size (Cs) and crystallinity index (CI) of crystalline quartz and banded chalcedony areas.
Samplea ± Δa, Åc ± Δc, ÅV, Å3Cs, ÅCI
Amethyst crystals area4.9138 ± 0.00015.4054 ± 0.0002113.035258.1
Banded chalcedony area4.9140 ± 0.00015.4059 ± 0.0001113.055603.9
Quartz crystal, ref. std.4.9133 ± 0.00015.4052 ± 0.0001113.0093510
Table 2. Oxygen isotope composition and calculated temperatures of isotope equilibration (agate formation) of different silica phases in agate samples.
Analysis PointsBands Characterizationδ18OSMOW (‰)Tmet (°C)Toc (°C)Tmag (°C)
#6_1fibrous chalcedony (rim)25.52169130
#6_2amethyst21.33997179
#6_3quartz (core)18.154124229
#2_1fibrous chalcedony (rim)21.73694172
#2_2quartz21.43896177
#2_3amethyst21.53795175
#2_4quartz (core)22.33490165
#12_1chalcedony (rim)21.13999181
#12_2banded chalcedony19.646110202
#12_3amethyst18.949116214
#12_4quartz (core)18.253122226
Note. The temperatures are calculated according to [39] for fractionation with meteoric water (−10%), oceanic water (0%) and magmatic water (+8%).
Table 3. Summary of mineral assemblages of some amethyst and amethyst-bearing agate occurrences.
Amethyst OccurrencesHost RocksAgeMineral AssemblageReferences
Tevinskoye (Russia)Basalts, andesites, dacitesEoceneChalcedony, quartz, amethyst, native copper, covellite, chalcopyrite, Ni-pyrite, goethite, calcite, and clinoptilolite.our data
Amethysta do Sul (Brazil)Basalts, andesitesEarly
Cretaceous
Chalcedony, quartz, amethyst, celadonite, pyrite, goethite, anhydrite, calcite, gypsum, barite, and fluorite.[38,61]
Arttigas (Uruguay)- ″ -- ″ -Chalcedony, quartz, amethyst, celadonite, goethite, and calcite.[7]
Los Catalanes (Uruguay)- ″ -Chalcedony, quartz, amethyst celadonite, calcite, fluorite, pyrite–in geodes;
zeolites–in amygdales.
[10]
Thander Bay and Blue Point (Canada, Ontario)Silicified mudstone brecciaProterozoicQuartz, amethyst, barite, calcite, rutile, native copper, chalcopyrite, galena, marcasite, pyrite, sphalerite, hematite, goethite, kaolinite, and smectite.[58,62]
Boudi (Morocco)Siltstone, sandstoneLower CambrianQuartz, amethyst, moganite, hematite, calcite-covered amethyst crystals.[11,60]
Ijevan (Armenia)Tuffs, tuffsandstonesLate
Cretaceous
Chalcedony, quartz, amethyst, calcite, goethite, heulandite. Mordenite and chlorite are rare.[59]
Table 4. T,P,X-conditions of amethyst formation in agate geodes occurring within the altered volcanic rocks and in hydrothermal veins.
DepositsAmethyst OccursT °CSalinity,
wt.% NaCl eq.
P (κbar)References
Artigas (Uruguay)geodes50–120- ″ -- ″ -[7]
Serra Geral (Brazil)geodes<1000.9–5.6- ″ -[6]
Ametista do Sul (Brazil)geodes95–1305.3–0.30.21–0.29[38]
Artigas, Uruguaygeodes, breccia100–150- ″ -1.2–5.5[9]
Boudi (Morocco)veins191–4455.71–13.940.64–1.31[63]
Silver Hill (Greece)- ″ -189–2050.9–2.1- ″ -[17]
Kassiteres (Greece)- ″ -211–2750.5–3.4- ″ -- ″ -
Megala Therma (Greece)- ″ -219–2463.1–4.8- ″ -- ″ -
Chondro Vouno (Greece)- ″ -204–2215.3–8.0- ″ -- ″ -
Kalogries (Greece)- ″ -139–2093.4–5.6- ″ -- ″ -
Eonyang (South Korea)miarolitic cavities in the aplite156–33334–41–1.5[64]
Cape Korabl (Russia)stockworks, veins, breccias260–20- ″ -- ″ -[65]
Note. - ″ - no data.
Disclaimer/Publisher’s Note: The statements, opinions and data contained in all publications are solely those of the individual author(s) and contributor(s) and not of MDPI and/or the editor(s). MDPI and/or the editor(s) disclaim responsibility for any injury to people or property resulting from any ideas, methods, instructions or products referred to in the content.