Abstract
The early Ordovician location of the Qaidam Block remains unclear, mainly due to the sparse paleomagnetic data to quantitatively determine the coeval position. The early Ordovician limestone is widespread in the northern Qaidam Block providing an ideal window to obtain a paleomagnetic result. The results derived from the limestone are, however, frequently constrained by the hydrothermal fluid activities after the strata formed and complex magnetic minerals in the samples. Therefore, systematic petrological and rock magnetic studies were conducted to identify the content and composition of magnetic minerals in the limestone samples from the early Ordovician Duoquanshan Formation in the northern Qaidam Block. The rock magnetic and petrologic results show that the magnetic carriers in the limestone samples are dominated by magnetite with a small amount of pyrrhotite, goethite, and hematite. These results are consistent with the characteristics of stepwise demagnetization. Combined with the results published previously, the secondary remanence component carried by pyrrhotite might be produced by thermal fluid or magma active by the multiple Tethys evolution.
1. Introduction
The formation of the Tibetan Plateau has been considered to be constructed by the accretion of a series of continental fragments, ophiolitic mélanges, and interoceanic islands onto the southwestern flank of the North China Block from the Paleozoic, recording a more complicated accretion-collision history of multi- Tethyan ocean basins (Figure 1a) [1,2,3,4,5,6,7,8,9,10,11,12]. The Qaidam Block (QB), located in the northernmost Tibetan Plateau, bridges the East Kunlun Orogenic system to the south and the Qilian Orogenic Belt to the north (Figure 1b). A wealth of geologic investigations mostly based on igneous and metamorphic geology have been undertaken in the QB, with an attempt for a better understanding of the geologic history of the northern Tibetan Plateau in response to the subduction and closure of the Proto- to Paleo-Tethys Ocean during the Paleozoic Periods [10,13,14,15,16]. However, controversies still remain due to the unclear paleographic location of the QB in this period.
When paleolongitude is indeterminate, paleomagnetism is the only quantitative method to reconstruct the paleo-position of continental blocks [17]. Quantitatively constraining the paleo-latitudinal position before the QB collision with the Qilian Block is of great significance to understanding the convergence process of the northern Tibetan Plateau and the closure process of the Tethys Ocean. The reliable paleomagnetic data from the QB are mostly acquired from the Cenozoic strata to constrain the effects on the uplift of the Tibetan Plateau [18,19,20]. There is a scarcity of paleomagnetic data of QB during the Paleozoic, especially the early Ordovician period. Nevertheless, significant differences between the published early Ordovician paleomagnetic data still remain, for instance, Yang et al. (1992) reported the paleomagnetic data of the sedimentary rock to constrain that the QB located at 13.7° S [21], whereas coeval data derived from limestone suggest that the QB was situated near the equator (2.9° N) [22] or the low-latitude zone in the northern hemisphere (7.4° N) [23]. The early Ordovician limestone is widespread in the northern Qaidam Block providing an ideal window to obtain a paleomagnetic result. The results derived from the limestone are, however, frequently affected by complex magnetic minerals and hydrothermal activities after the strata formed, which limited access to reliable paleomagnetic data. Thus, ascertaining magnetic mineral assemblages of limestone is the basis for obtaining a reliable interpretation of remanent magnetization.
To identify the content and composition of the magnetic carriers in limestone, in this study, systematic rock magnetic, petrological and paleomagnetic studies were carried out on the samples from the early Ordovician Duoquanshan Formation in the northern Qaidam Block. The rock magnetic and petrologic results show that the magnetic carriers in the limestone samples are dominated by magnetite with a small amount of pyrrhotite, goethite and hematite. These results are consistent with the characteristics of stepwise demagnetization. Combining with the results published previously, the secondary remanence component carried by pyrrhotite was identified, and the mechanism for this remagnetization component was also discussed in this paper.

Figure 1.
(a) Tectonic framework of China and location of the northern Qaidam Block (modified from Yan et al., 2019) [24]; (b) Simplified geological map of the northern Qaidam Block showed the locations of sampled sections (modified from Regional geological survey report of Qinghai Province, 1978, 1980) [25,26].
2. Geological Background and Sampling
The Qaidam Block (QB), in the northern Tibetan Plateau (Figure 1a), is important to understand the tectonic history of the Tibetan Plateau. The QB is bounded by the Songpan-Ganzi Orogen in the south and separated from the North China Block in the north by the Qilian Orogen and the Tarim Block in the west by the Altun Tagh Fault (Figure 1a). Most of the QB is covered by very thick Cenozoic coverage [27], which added to the difficulty of knowing the Phanerozoic history of QB. However, in the north of the QB, the Olongbuluke terrane, the Phanerozoic sedimentary succession is well exposed, including the Paleozoic marine successions and Mesozoic to Cenozoic terrane succession (Figure 1b) [28,29,30,31,32,33,34,35,36]. In the Olongbuluke terrane, there are three obvious unconformities between middle Ordovician with Carboniferous, early Permian with Jurassic, and lower Cretaceous with Cenozoic in Phanerozoic which response to a collision between QB with OLT and Qiangtang Block with QB and the accretion of the Lhasa Block onto the southern Eurasian margin [30,31,34,35,36,37]. No metamorphism and little magmatism have been found in OLT during the Phanerozoic [28].
The Ordovician strata are well exposed in the Dameigou, Shihuigou, and Olongbuluke areas (Figure 1b and Figure 2a–c) and are composed of the Duoquanshan Formation and Shihuigou Formation [25,26]. The Duoquanshan Formation is parallel unconformity with Cambrian and integrated with the Shihuigou Formation. It mainly comprises thick carbonates, thin to medium bedded limestone, and black shale from bottom to top, representing carbonate platforms to abyssal facies [33,38]. Abundant early to middle Ordovician fossils of Gastropoda (e.g., Ecculiomphalus sp., Pararaphistoma sp., Maclurites sp.), Cephalopoda (e.g., Hopeioceras sp., Coreanoceras sp., Manchuroceras sp., Burenoceras, Dakeoceras, Walcottoceras), Brachiopoda (e.g., Finckelnburgia sp.), and graptolites (e.g., Didymograptus hirundo, Phyllograptus, Isograptus) have been found in the Duoquanshan Formation [2,3,39,40,41]. Combined with the stratigraphic contact relationship and fossils assembly, the Duoquanshan Formation should represent Tremadocian to Dapingian deposits [33].
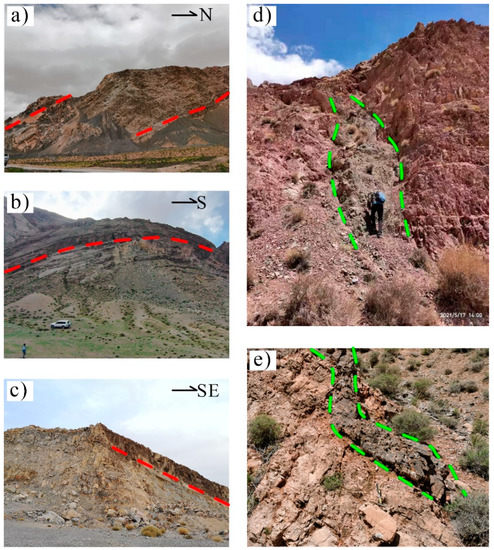
Figure 2.
Photographs showing the sampled sections of Duoquanshan Formation from section A (a), section B (b), section C (c), and the porphyritic diorite dikes from section C (d,e). (The red dotted line represents bedding, and the green dotted line represents the intrusive boundary between the porphyritic diorite dikes and the Cambrian).
Based on systematic fieldwork, we collected the 21 limestone samples of the Duoquanshan Formation from the Shihuigou, Dameigou, and Olongbuluke sections (Figure 2a,b,c) (sections ID, A, B, C, respectively) in the Olongbuluke area (37.5° N, 96.04° E), northern Qaidam Block, Tibetan Plateau (Figure 1b). The oriented samples were collected by a portable gasoline-powered drill and oriented using both sun and magnetic compasses. All oriented cores with 2.54 cm in diameter were cut into standard specimens (2.2 cm long) in the laboratory for further research.
3. Rock Magnetism
Rock magnetic experiments were designed to characterize the magnetic mineralogical carriers of remanence. Rock magnetic studies are mainly based on physical parameters of magnetic minerals, such as magnetic susceptibility, Curie temperature, coercivity, and magnetization intensity, to determine the content and composition of magnetic minerals in rocks [42]. In this study, isothermal remanent magnetization (IRM), the thermal demagnetization of the three-axis IRM, magnetic susceptibility versus temperature (k-T), and low-temperature cycling of SIRM warming experiments were performed on 21 samples from the Dameigou, Shihuigou, and Olongbuluke sections. The experiments were carried out in the Paleomagnetic Laboratory of Northwest University (Xi’an) and the State Key Laboratory of Loss and Quaternary of the Institute of Earth and Environment, and the Chinese Academy of Sciences (Xi’an), respectively.
3.1. Isothermal Remanent Magnetization (IRM) Experiment
Isothermal remanent magnetization (IRM) acquisition curves and back-field demagnetization of saturation IRM (SIRM) can be used to determine the coercivity level of the magnetic carriers in the sample and to analyze the contribution of different magnetic components to the SIRM. IRM experiments were performed with an ASC IM-10-30 pulse magnetizer and JR-6A magnetometer. The data of IRM acquisition curves were processed using Rema6 of the Agico series. However, IRM acquisition curves could not reveal the coercivity characteristics of each type of magnetic carrier preserved in the sample. We applied a method of analyzing IRM acquisition curves based on cumulative log Gaussian analysis [43]. The cumulative Gaussian (CLG) curve model was applied to semi-quantitatively detect the contribution of different coercivities of magnetic minerals to the SIRM [43,44].
The IRM acquisition curves of the samples from the Shihuigou section (section ID: A), as displayed in Figure 3a, revealed a gradual increase before 0.5 T, then, the curves grow steadily with the applied field increase and fail to reach saturation even at 2.5 T. In addition, the back-field demagnetization curves intersect the horizontal axis above −0.5 T, which shows that the high coercivity minerals are preserved in these samples. Three coercivity components of typical samples from section A were obtained by analyzing the coercivity spectrum of the CLG model. The results of the linear acquisition plot (LAP) (Figure 3c,d) and gradient acquisition plot (GAP) (Figure 3e,f) show that the mean values of the lower coercivity component (component 1), intermediate coercivity component (component 2), and high coercivity component (component 3) are interpreted to be <0.08, 0.3–0.5, and >1 T, respectively. Component 1 and component 3 contribute up to 80% of the whole SIRM, whereas component 2 only accounts for ~20%. Therefore, we infer that the high and low coercivity components predominate in samples of section A.
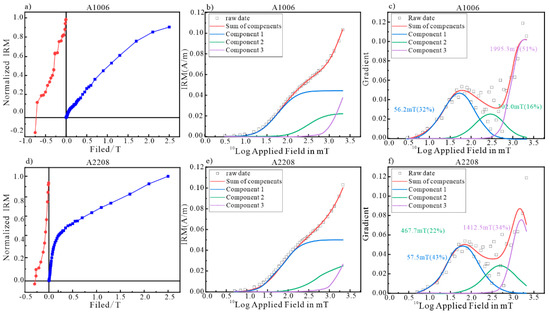
Figure 3.
Rock magnetic analyses of the isothermal remanent magnetization (IRM) for the representative samples from the Duoquanshan Formation in the Shihuigou section. Acquisition curves of IRM and backfield demagnetization curves of IRM (a,d); LAP curves (b,e) and GAP curves (c,f) from Cumulative Log Gaussian analysis.
The IRM acquisition curves of the samples from the Dameigou section (section ID: B) increased significantly at the initial steps of the applied field and reached more than 80% of SIRM before 0.2 T (Figure 4a,b), and the sharp reduction of the SIRM accompanying the progressive increase of the reverse field suggests that the coercivity of magnetic minerals in the samples are all less than 0.2 T. All these indicate the low coercivity magnetic minerals as the main remanence carriers preserved in these samples. The results of the cumulative Gaussian curve model analysis (Figure 4c–f) are consistent with the characteristics of both IRM and reverse field demagnetization curves. Since component 1 accounts for up to 85% of the SIRM for the samples, signaling that low coercivity magnetic carriers are predominant.
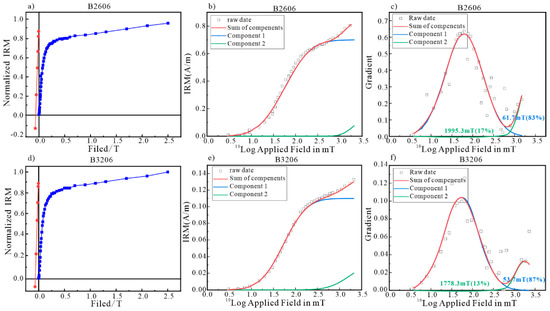
Figure 4.
Rock magnetic analyses of the IRM for the representative samples from the Dameigou section. Acquisition curves of IRM and back-field demagnetization curves of IRM (a,d); LAP curves (b,e) and GAP curves (c,f) from Cumulative Log Gaussian analysis.
The IRM acquisition curves of the Olonglubuke section (section ID: C) show similar characteristics to the Shihuigou section (Figure 5a,b). For section C, the IRM acquisition curves indicate a sharp increase in magnetization before 1T, followed by a gradual increase of magnetization until saturation at 2.5 T. The IRM acquisition curve requires three IRM components for a good fit (Figure 5c–f): The soft component (component 1) provides 10% of the SIRM for the samples. The intermediate component (component 2) and a hard component (component 3) contribute up to 80% of the SIRM, demonstrating the predominant position of high and intermediate coercivity magnetic carriers in these samples.
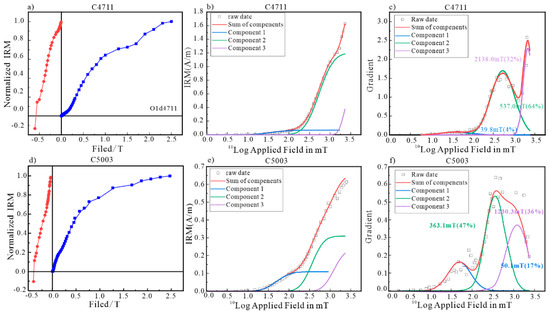
Figure 5.
Rock magnetic analyses of the IRM for the representative samples from the Oulongbuluke section. Acquisition curves of IRM and back-field demagnetization curves of IRM (a,d); LAP curves (b,e) and GAP curves (c,f) from Cumulative Log Gaussian analysis.
3.2. The Stepwise Thermal Demagnetization of the Three-Axis IRM
Minerals with different distributions of coercivities generally have different unblocking temperatures [45,46], thus, the stepwise thermal demagnetization of the three-axis IRM was applied to identify the content of magnetic minerals based on the different coercivity fractions of IRM and unblocking temperature. ASC IM-10-3 impulse magnetizers generated direct current magnetic fields of 2.5, 0.4, and 0.1 T, which were applied to the Z-, Y-, and X-axes of the samples to detect hard medium, and soft magnetic components [46]. Stepwise thermal demagnetization and measurement were performed by TD-48 thermal demagnetization furnace and JR-6A magnetometer, respectively. We processed the three-axis IRM curves using Rema6 of the Agico series software.
The three-axis IRM curves (Figure 6a,b) of the Dameigou section (No. A) show that the thermal demagnetization curves of hard components decreased abruptly below 100 °C, which is indicative of goethite [47]. A small decrease of the median fraction at the range of 300–330 °C suggests that the iron-sulfides (e.g., pyrrhotite, melnikovite) are preserved in the samples. Additionally, the intensities of the soft and medium components decreased and reached zero at ~560–580 °C, and the hard component unblocked at 620–680 °C, implying the coexistence of magnetite and hematite. The magnetic minerals in these samples appear to be dominated by magnetite and hematite, with a small amount of goethite and pyrrhotite.
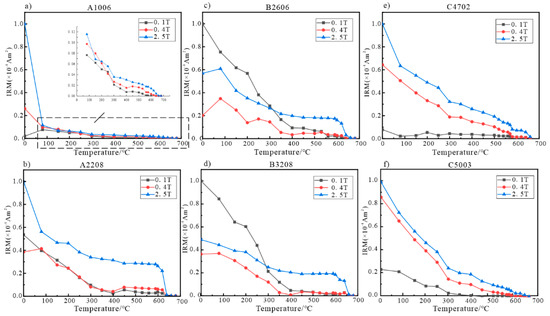
Figure 6.
Thermal demagnetization of the IRM in three orthogonal axes for the representative samples from section A (a,b), section B (c,d), and section C (e,f).
The three-axis IRMs (Figure 6c,d) of the Shihuigou section indicate that soft and medium components are dominant and progressively erased from room temperature to 580 °C, regarded as a magnetite signal. The hard component, followed by a modest rise, eventually unblocked at about 680 °C, is clearly due to hematite. These samples are dominated by magnetite with low coercivity and hematite with high coercivity.
The three-axis IRM (Figure 6e,f) of the Olongbuluke section shows hard and medium components are dominant. The hard component drops at 100 °C, indicating the presence of goethite. At 680 °C, the hard component fractions are ultimately demagnetized, indicating the presence of hematite. Additionally, the intensities of the medium components decreased to zero at 580 °C, thus implying the existence of magnetite. The medium and soft components exhibited a dramatic reduction at roughly 320 °C and are thought to be carried by pyrrhotite with a wide range of coercivities [48]. Therefore, the magnetic minerals in these samples contain magnetite, hematite, goethite, and pyrrhotite.
3.3. Magnetic Susceptibility Versus Temperature (k-T) Experiment
The magnetic susceptibility versus temperature (k-T) exhibits distinct characteristics according to the variation of magnetic susceptibility (k) with temperature (T) for different magnetic carriers [49]. The analysis of k-T curves could identify the content of magnetic carriers and mineral phase transition [45,50]. In this study, representative specimens were crushed to the powder and were used to measure volume-normalized high-temperature magnetic susceptibility k. The k-T experiments were conducted by an MFK2 susceptibility meter with a CS-4 temperature control system. Susceptibility was measured upon heating from room temperature to 700 °C and then cooled down to room temperature in an argon atmosphere. The processing of k-T curves was carried out by Safyr6, Cureval8 of the Agico series.
The k-T curves of the limestone samples are displayed in Figure 7. All samples have very low initial magnetic susceptibility, whereas the magnetic susceptibility significantly increased after the heating process. In addition, the value of magnetic susceptibility in cooling curves is considerably higher than in heating curves at the same temperature point. These irreversible features for magnetic susceptibility are interpreted as the conversion of magnetic minerals, for instance, other Fe-bearing minerals with low magnetization, like maghemite or hematite, changed into magnetite with high magnetization intensity or produced new magnetite particles with relatively minor size during the heating process [51,52,53,54]. Furthermore, the heating curves of all samples slightly increased between 400 and 500 °C, which might be caused by iron-containing clay minerals or iron sulfides (e.g., pyrrhotite, melnikovite) transformed into magnetite [55,56,57]. The magnetic minerals appear to contain magnetite and hematite since the heating curves decay to near zero at about 560 °C or 660 °C.
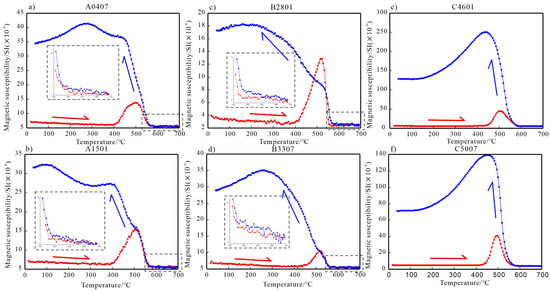
Figure 7.
k-T curves (The red/blue solid line is heating/cooling curves) of representative samples from section A (a,b), section B (c,d), and section C (e,f).
3.4. Low-Temperature Magnetic Properties
Some magnetic mineralogy has specific conversion points at low temperatures, for instance, the Morin transition of hematite at 250–260 K [57], the 34 K transition of pyrrhotite [58], the Verwey transition of magnetite at 120 K [59]. In this study, low-temperature cycling (LTC) of SIRM warming experiments was performed with an MPMS low-temperature magnetic measurement system (instrument sensitivity 5 × 10⁻¹¹ Am2) by powder samples. The powder sample is first cooled to a low temperature (e.g., 5 K) in zero field. Place the sample in an external field (e.g., 5 T) to allow the sample to acquire SIRM. Then, the field-cooled (FC) remanence curve was obtained by measuring the decrease of remanence with the increase in temperature. For zero-field-cooled (ZFC) curves, an external field was reapplied to the sample to acquire a new SIRM at 300 K, then, the sample was cooled to a low temperature in zero field and the remanence of ZFC was measured from 5 to 300 K.
The low-temperature magnetic properties curves of the Duoquanshan Formation are displayed in Figure 8. The FC curves are higher than the ZFC curves, which is often attributed to the significant contribution of goethite [60]. The remanence decays continuously, and almosthalf of the low-temperature remanence is removed at the initial stage of the warming process, indicating that more than half of the ferromagnetic minerals are superparamagnetic and do not contribute to NRM [61]. The derivatives of the FC curves for all samples exhibit a slight change in magnetization associated with the Verwey transition at 120 K, indicating the presence of magnetite in these samples. Furthermore, the derivatives of the FC curves for samples from the Shihuigou and Olongbuluke sections show a slight drop of remanence below 40 K (Figure 8a,c,d,f). These transition points should be the 34 K transition of pyrrhotite [58]. However, this transition is very weak, possibly because the pyrrhotite particles are not large enough [62].
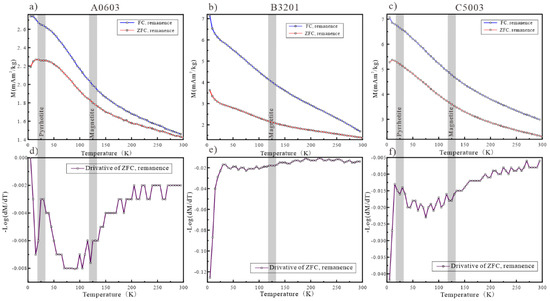
Figure 8.
FC-ZFC variation during low-temperature demagnetization measurements and derivative of ZFC of representative samples from section A (a,d), section B (b,e), and section C (c,f).
4. Petrology
4.1. Optical Microscope Observation
The thin section plays a vital role in studying the mineral composition, genesis, symbiotic relationship, and metasomatism of rocks, as well as the structural features. We performed a detailed microscopic observation on typical samples using a microscope at the State Key Laboratory of Continental Dynamics, Northwest University (Xi’an, China).
Detailed petrological observations under plane-polarized light of thin sections reveal that the samples are mainly composed of bioclast and interstitial material, and the micrite, calcite, and porphyritic dolomitization are usually visible (Figure 9). According to the morphological characteristics of bioclasts, it is speculated that they may be trilobites, algae, and brachiopod fossil fragments, the size is generally 0.5–1 mm, and the distribution is disorderly (Figure 9a,c,e,g,i–k). In the interior of these rocks, many different sizes of cracks have been found filled with calcite (Figure 9c,e,i–k). The opaque minerals are very common as accessory phases in all samples (Figure 9b). In reflected light, magnetite with off-white (Figure 9d,h,l) and pyrrhotite with tawny colors could be observed (Figure 9l). In general, according to the composition of minerals, the rocks from the Shihuigou section can be classified as bioclast-bearing packstone, and the rocks from the Dameigou section and the Olongbuluke section can be classified as bioclast-bearing micritic limestones.
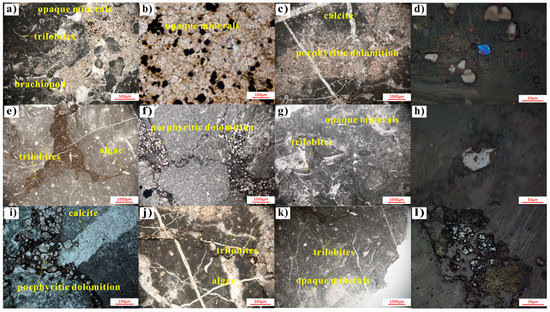
Figure 9.
Microscopic images of representative samples from sections A (a–d), section B (e–h), and section C (i–l).
4.2. SEM (Scanning Electron Microscope) and EDS (Energy Dispersive Spectrometer)
To confirm the interpretation of magnetic minerals based on the rock magnetic analyses above, the SEM (scanning electron microscope) with EDS (Energy Dispersive Spectrometer) was utilized to directly observe the magnetic minerals at the State Key Laboratory of Continental Dynamics, Northwest University (Xi’an, China), and the results are presented in Figure 10.
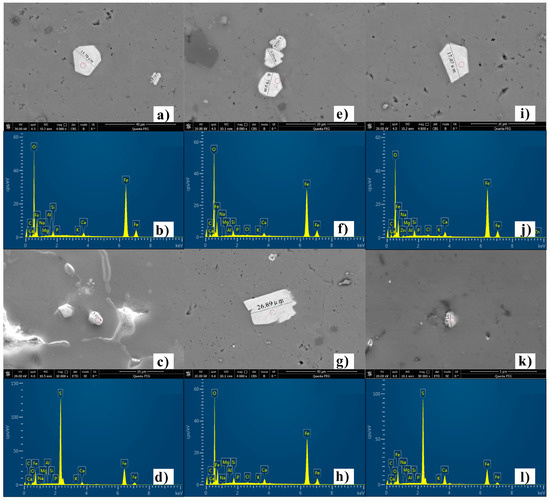
Figure 10.
Scanning electron microscope (SEM) images and the results of the energy dispersive spectroscopy (EDS) analyses of the samples from the Shihuigou section (a–d), Daimeigou section (e–h), Oulongbuluke section (i–l).
The SEM images observation with EDS analysis confirmed that iron oxides are the main magnetic carriers in most samples (Figure 10a,e,g,i). Most iron oxide minerals exhibit euhedral to irregular shapes and range between 10 and 30 μm in size (Figure 10). However, some iron sulfide grains at sizes 0.5 to 1 μm have also been found (Figure 10c,l). According to the EDS analysis (Figure 10b,d,f,h,i,j) and combined with the rock magnetism described in the previous sections, the iron oxide and iron sulfide minerals are magnetite and pyrrhotite, respectively. All the iron oxide minerals and matrix have distinct borders, and no oxidized edges, significant alignment, and cracking have been found, implying that the iron oxide minerals in the samples are most likely to be unaffected by subsequent chemical or tectonic activity.
5. Demagnetization Results
The direction and intensity of the demagnetization behaviors curves could provide helpful information about the content of magnetic carriers in the samples. Therefore, stepwise thermal remanence cleaning was carried out on standard-size specimens using a TD48 furnace for the low-temperature part (below 300 °C) with an interval of 50–80 °C, whereas for the high-temperature part with a smaller interval of 10–25 °C, and remanent magnetizations were measured using a 2G-755 superconducting (cryogenic) magnetometer. We used PMGSC software to analyze the demagnetization results [63].
Obvious multi-components were illustrated by demagnetization curves and normalized magnetic moment versus temperature of representative samples in Figure 11. Two components were presented by the samples from the Shihuigou section (Figure 11e,f), and the low-temperature component (LTC) was erased at the beginning of demagnetization (NRM-200 °C). The directions of remanent magnetization change after 200 °C, and the high-temperature component (HTC) stepwise decayed toward the origin at a temperature interval from 500 °C to 550 °C. Based on the magnetic results, we suggest that the HTC was carried by the magnetite. For the samples from the Olongbuluke and Dameigou sections (Figure 11a–d,g–j), except the LTC and HTC, a new component (medium-temperature component, MTC) was obtained in the temperature intervals between 200 °C and 340 °C. The magnetization intensity of this component shows a sharp decline during 200–340 °C in the normalized magnetic moment versus temperature curves (Figure 11g,h). The direction of MTC is different from both LTC and HTC and obtained from the medium temperature zone, which corresponds to the unblocking temperature zone of pyrrhotite. Combined with the results from rock magnetism and petrology, we speculate that the MTC might be carried by pyrrhotite. It is noted that the magnetic intensity of hematite in the limestone samples is too weak to contribute to the remanent magnetization, therefore, the hematite signal is unobserved in the demagnetization diagrams. For the detailed direction of LTC, MTC, and HTC, we will focus on different scientific issues and address them in the coming up paper.
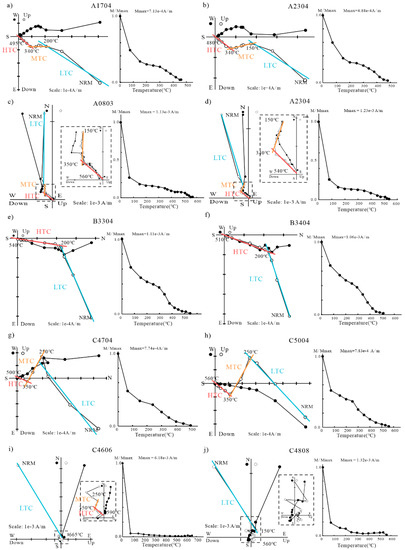
Figure 11.
Demagnetization diagrams and normalized magnetic moment versus temperature of representative samples from section A (a–d), section B (e,f), and section C (g–j). The red points in orthogonal vector plots were used for fitting the medium-temperature components, solid and open circles represent horizontal and vertical projections. All diagrams are plotted in geographic coordinates.
6. Discussion
6.1. The Magnetic Mineral Assemblage in Limestone Samples of the Duoquanshan Formation
Limestone, as the crucial material to preserve the reliable magnetic signal of a geomagnetic field, is less prone to compaction and considered immune from inclination shallowing. It, however, usually contains the complex magnetic assemblage that is liable for remagnetization induced by enhanced temperature, chemical alteration, or secondary mineral growth [51,52,60,64,65,66,67,68]. The early Ordovician limestone is widespread in the Olongbuluke area, northern Qaidam Block providing an ideal window to obtain a paleomagnetic result which is the basis for understanding the closure process of Proto-Tethys. Thus, it is the main reason for identifying the content and composition of magnetic minerals in limestone samples to obtain reliable paleomagnetic data.
According to the back-field demagnetization of SIRM, IRM curves, and its CLG model analysis, the major magnetic minerals in the Dameigou section samples are low coercivity minerals, whereas the Shihuigou section samples are high and low coercivity minerals, and the Olongbuluke section samples are high and intermediate coercivity minerals. Moreover, the results of three-axis IRM curves, k-T, and LTC of SIRM warming experiments converge to reveal that the magnetite and hematite as predominant magnetic carriers preserved in the samples of the Dameigou section, except the magnetite and hematite, the goethite and pyrrhotite also observed in the samples from the Shihuigou and Olongbuluke sections. In addition, EDS results suggest that iron oxides are the magnetic carrier in the Dameigou samples, whereas the iron oxides and iron sulfides co-exist in the samples from the Shihuigou and Olongbuluke sections. These results are based on demagnetization behaviors. The HTC of all samples stepwise decayed toward the origin at a temperature interval from 500 °C to 550 °C. MTC was only isolated from the samples of the Shihuigou and Olongbuluke sections.
Combined with the characteristics of demagnetization, the rock magnetic and petrologic results, therefore, we conclude that the early Ordovician samples could be divided into two groups. (1) The magnetic mineral assemblage in the samples from the Dameigou section is dominated by magnetite and hematite. (2) While the magnetic carriers in the samples from the Shihuigou and Olongbuluke sections are magnetite with a small amount of hematite, goethite, and pyrrhotite.
6.2. Mechanism of the Remagnetization
Pyrrhotite is generally regarded as a secondary magnetic mineral and is associated with remagnetization [69,70,71]. In an oxidizing environment, due to tectonic extrusion, chemical reactions, etc., minerals undergo phase transitions, and the primary magnetic minerals in rocks are transformed into secondary pyrrhotite [48,72,73,74]. As we discussed in 6.1, the magnetic mineral assemblages in the samples of the Dameigou section are different from that of the Shihuigou and Olongbuluke sections. In addition, the medium-temperature component (MTC) was isolated only from the Shihuigou and Olongbuluke sections between the 200 and 340 °C temperature intervals, which might be carried by the pyrrhotite. Therefore, a regional scale remagnetization event was detected by the MTC in the Shihuigou and Olongbuluke sections which recorded the information on the geomagnetic field when the remagnetization component formed.
One reason is that the natural remanent component preserved in the Duoquanshan limestone is remagnetized by remote effects of the uplift of the Tibetan Plateau. Optical microscopic observation (Figure 9) indicated that the calcite-filled veins, not cut through the fossils, are developed well in all the samples, which preserved the remagnetization components carried. These fluid circulations from the veins were active by multi-stage subductions, continental-continental collision, and intracontinental convergence during the formation process of the Tibetan Plateau, which accompanied the expansion and closure of multiple Tethyan ocean basins [75,76,77]. During this process, the orogenic fluid circulation through low-water carbonates with high porosity most likely aided the process of remagnetization [78]. Tectonic fluids can be pushed by gravity or tectonically produced overpressures and move through tectonic surfaces or aquifers [78]. Additionally, sedimentary rocks have high porosities, which are conducive to the migration and retention of orogenic fluids and thermal or fluid chemistry interactions with the original rock [79].
Another reason might be that the remagnetization component might be produced by the local distribution of magmatic rocks. The formation of these magmatic rocks might be associated with the intra-continental extension after the closure of the Proto- or Paleo-Tethys Ocean basin. The intrusion of porphyritic diorite dikes was observed in the Olongbuluke section (Figure 2d,e). These magmatic rocks were intruded into the Cambrian and Ordovician sedimentary strata in the Olongbuluke section [38]. The increase of local thermal anomaly caused by the magma activity perhaps led to acquiring remagnetization. When the thermal anomaly reaches the temperature requirement for the phase transition of rock minerals, the magnetic minerals are reformed and preserved in the sample, resulting in remagnetization. When pyrite is heated to 350–500 °C, the mineral transformation will occur. Pyrrhotite is usually an intermediate product of the thermal oxidation of pyrite [69,71].
7. Conclusions
- Rock magnetic and petrological studies were conducted on the early Ordovician limestone samples from the northern Qaidam block. The results show that the predominant magnetic carrier of the Dameigou section is magnetite and hematite, while the Shihuigou and Olongbuluke sections are goethite, pyrrhotite, hematite, and magnetite.
- The difference in demagnetization behaviors was exhibited by the samples from three sections. The samples from the Dameigou section exhibited two components (low- and high-temperature components), while the Shihuigou and Olongbuluke sections showed three components (a new medium-temperature component was detected). The medium-temperature component carried by the pyrrhotite may have been remagnetized by orogenic fluid and/or magma activity.
Author Contributions
Conceptualization, X.D.; methodology, D.Z., S.L., L.X.; software, T.W., B.W., N.J.; formal analysis, X.D.; investigation, X.D.; resources, X.C., D.Z., T.L., H.W.; writing—original draft preparation, X.D.; writing—review and editing, Y.Z.; visualization, T.W., B.W., N.J.; supervision, Y.Z.; project administration, Y.Z.; funding acquisition, Y.Z. All authors have read and agreed to the published version of the manuscript.
Funding
This research was funded by [the National Natural Science Foundation of China] grant number [42074075, 42274097, 91855211]. And the APC was funded by [the National Natural Science Foundation of China] grant number [42074075].
Data Availability Statement
The data presented in this study are available on request from the corresponding author.
Acknowledgments
The authors would like to thank the editors and recommenders for their comments and insightful comments, which have led to a better version of our work.
Conflicts of Interest
The authors declare no conflict of interest.
References
- Ren, J.S.; Xiao, L.W. Lifting the mysterious veil of the tectonics of the Qinghai-Tibet Plateau by 1:250000 geological mapping. Geol. Bull. China 2004, 23, 1–11. [Google Scholar]
- Allégre, C.J.; Courtillot, V.; Tapponnier, P.; Hirn, A.; Mattauer, M.; Coulon, C.; Jaeger, J.J.; Achache, J.; Schärer, U.; Marcoux, J.; et al. Structure and evolution of the Himalaya–Tibet orogenic belt. Nature 1984, 307, 17–22. [Google Scholar] [CrossRef]
- Dewey, J.F. Extensional collapse of orogens. Tectonics 1988, 7, 1123–1139. [Google Scholar] [CrossRef]
- Yin, A.; Harrison, T.M. Geologic Evolution of the Himalayan-Tibetan Orogen. Annu. Rev. Earth Planet. Sci. 2000, 28, 211–280. [Google Scholar] [CrossRef]
- Pan, G.; Wang, L.; Li, R.; Yuan, S.; Ji, W.; Yin, F.; Zhang, W.; Wang, B. Tectonic evolution of the Qinghai-Tibet Plateau. J. Asian Earth Sci. 2012, 53, 3–14. [Google Scholar] [CrossRef]
- Ding, L.; Li, Z.Y.; Song, P.P. Core Fragments of Tibetan Plateau from Gondwanaland United in Northern Hemisphere. Bull. Chin. Acad. Sci. 2017, 32, 945–950. [Google Scholar]
- Song, S.G.; Zhang, L.F.; Niu, Y.L.; Su, L.; Song, B.; Liu, D.N. Evolution from Oceanic Subduction to Continental Collision: A Case Study from the Northern Tibetan Plateau Based on Geochemical and Geochronological Data. J. Petrol. 2006, 47, 435–455. [Google Scholar] [CrossRef]
- Song, S.; Niu, Y.; Su, L.; Zhang, C.; Zhang, L. Continental orogenesis from ocean subduction, continent collision/subduction, to orogen collapse, and orogen recycling: The example of the North Qaidam UHPM belt, NW China. Earth-Sci. Rev. 2014, 129, 59–84. [Google Scholar] [CrossRef]
- Zhao, Z.F.; Liu, Z.B.; Chen, Q. Melting of subducted continental crust: Geochemical evidence from Mesozoic granitoids in the Dabie-Sulu orogenic belt, east-central China. Asian Earth Sci. 2017, 145, 260–277. [Google Scholar] [CrossRef]
- Dong, Y.; He, D.; Sun, S.; Liu, X.; Zhou, X.; Zhang, F.; Zhao, Y.; Cheng, B.; Zhao, G.C.; Li, J. Subduction and accretionary tectonics of the East Kunlun orogen, western segment of the Central China Orogenic System. Earth-Sci. Rev. 2018, 186, 231–261. [Google Scholar] [CrossRef]
- Wang, Q.Y.; Dong, Y.J.; Pan, Y.M.; Liao, F.X.; Guo, X.W. Early Paleozoic Granulite-Facies Metamorphism and Magmatism in the Northern Wulan Terrane of the Quanji Massif: Implications for the Evolution of the Proto-Tethys Ocean in Northwestern China. Earth Sci. 2018, 29, 1081–1101. [Google Scholar] [CrossRef]
- Fu, C.L.; Yan, Z.; Xiao, W.J.; Wang, B.Z.; Niu, M.L.; Li, X.C.; Yu, L.J. Identification and geological significance of the Early Paleozoic Tianjunnanshan remnant ocean basin in the Zongwulong belt, Ne Tibetan Plateau. Acta Petrol. Sin. 2021, 37, 2401–2418. [Google Scholar]
- Zhang, C.; Bader, T.; Zhang, L.F.; Roermund, H.V. The multi-stage tectonic evolution of the Xitieshan terrane, North Qaidam orogen, western China: From Grenville-age orogeny to early-Paleozoic ultrahigh-pressure metamorphism. Gondwana Res. 2017, 41, 290–300. [Google Scholar] [CrossRef]
- Zuza, A.V.; Wu, C.; Reith, R.C.; Yin, A.; Li, J.H.; Zhang, J.Y.; Zhang, Y.X.; Wu, L.; Liu, W.C. Tectonic evolution of the Qilian Shan: An early Paleozoic orogen reactivated in the Cenozoic. GSA Bull. 2018, 130, 881–925. [Google Scholar] [CrossRef]
- Li, S.; Chung, S.L.; Hou, Z.Q.; Chew, D.; Wang, T.; Wang, B.D.; Wang, Y.B. Early Mesozoic Magmatism Within the Tibetan Plateau: Implications for the Paleo-Tethyan Tectonic Evolution and Continental Amalgamation. Tectonics 2019, 38, 3505–3543. [Google Scholar] [CrossRef]
- Wan, B.; Chu, Y.; Chen, L.; Liang, X.F.; Zhang, Z.Y.; Ao, S.J.; Talebian, M. Paleo-Tethys subduction induced slab-drag opening the Neo-Tethys: Evidence from an Iranian segment of Gondwana. Earth-Sci. Rev. 2021, 221, 103788. [Google Scholar] [CrossRef]
- Huang, B.; Yan, Y.; Piper, J.D.; Zhang, D.; Yi, Z.; Yu, S.; Zhou, T. Paleomagnetic constraints on the paleogeography of the East Asian blocks during Late Paleozoic and Early Mesozoic times. Earth-Sci. Rev. 2018, 186, 8–36. [Google Scholar] [CrossRef]
- Chen, Y.; Gilder, S.; Halim, N.; Cogné, J.P.; Courtillot, V. New paleomagnetic constraints on central Asian kinematics: Displacement along the Altyn Tagh fault and rotation of the Qaidam Basin. Tectonics 2002, 21, 6-1–6-19. [Google Scholar] [CrossRef]
- Sun, Z.M.; Yang, Z.Y.; Pei, J.L.; Yang, T.S.; Wang, X.S. New Early Cretaceous paleomagnetic data from volcanic and red beds of the eastern Qaidam Block and its implications for tectonics of Central Asia. Earth Planet. Sci. Lett. 2006, 243, 268–281. [Google Scholar] [CrossRef]
- Dupont-Nivet, G.; Butler, R.F.; Yin, A.; Chen, X.H. Paleomagnetism indicates no Neogene rotation of the Qaidam Basin in northern Tibet during Indo-Asian collision. Geology 2002, 30, 263–266. [Google Scholar] [CrossRef]
- Yang, H.X.; Yu, H.M.; Li, P.W. Palaeomagnetic study of Chaidam palte and its evolution. Chang. Univ. Earth Sci. 1992, 22, 420–426. [Google Scholar]
- Wu, H.N.; Liu, C.Y.; Zhang, X.H.; Ren, Z.L. Discuss the tectonic evolution of Qaidam Block by paleomagnetic evidence. Sci. China. Ser. D Earth Sci. 1997, 27, 9–14. [Google Scholar]
- Yan, Z.; Fu, C.; Aitchison, J.C.; Buckman, S.; Niu, M.; Cao, B.; Sun, Y.; Guo, X.; Wang, Z.Q.; Zhou, R. Retro-foreland basin development in response to Proto-Tethyan Ocean closure, NE Tibet Plateau. Tectonics 2019, 38, 4229–4248. [Google Scholar] [CrossRef]
- Qinghai Bureau of Geology and Mineral Resources (BGMR). Regional Geological Investigation of the Tuosuhu Area; Unpublished scientific report as a part of the Regional Geology of Qinghai Province; Geological Publishing House: Beijing, China, 1978; pp. 1–124. [Google Scholar]
- Qinghai Bureau of Geology and Mineral Resources (BGMR). Regional Geological Investigation of the Huaitoutala Area; Unpublished scientific report as a part of the Regional Geology of Qinghai Province; Geological Publishing House: Beijing, China, 1980; pp. 1–127. [Google Scholar]
- Cao, Y.; Sun, Z.M.; Pei, J.L.; Li, H.B.; Xu, W.; Zhang, L. Paleomagnetic constraints on the Early Ordovician paleogeographical position of the Qaidam Block. Acta Geol. Sin. 2021, 95, 1448–1458. [Google Scholar]
- Cheng, F.; Jolivet, M.; Hallot, E.; Zhang, D.; Zhang, C.; Guo, Z. Tectono-magmatic rejuvenation of the Qaidam craton, northern Tibet. Gondwana Res. 2017, 49, 248–263. [Google Scholar] [CrossRef]
- Dai, K.; Liu, C.L.; Xiao, D.Q.; Ma, Y.S.; Peng, Y.; Zhang, X.; Zheng, C.; Zhang, Y.F.; Sun, J.P. The tectonic deformation and evolution of the Olongbluke area in Eastern Qaidam Basin. Earth Sci. Front. 2016, 23, 033–044. [Google Scholar]
- Qian, T.; Wang, Z.X.; Liu, Y.Q.; Liu, S.F.; Gao, W.L.; Li, W.P.; Hu, J.J.; Li, L.L. Provenance analysis of the Jurassic northern Qaidam Basin: Stratigraphic succession and LA-ICP-MS geochronology. Sci. Sin. Terrae 2018, 48, 224–242. [Google Scholar]
- Qian, T.; Wang, Z.; Wang, Y.; Liu, S.; Gao, W.; Li, W. Jurassic evolution of the Qaidam Basin in western China: Constrained by stratigraphic succession, detrital zircon U-Pb geochronology and Hf isotope analysis. GSA Bull. 2021, 133, 2291–2318. [Google Scholar] [CrossRef]
- Qian, T.; Li, W.P.; Gao, W.L.; Jiang, W. A preliminary study on post-orogenesis of the North Qaidam tectonic belt during the Early Paleozoic by provenance analysis of the Devonian sediments. Acta Geol. Sin. 2021, 95, 1–17. [Google Scholar]
- Sun, J.; Dong, Y.; Ma, L.; Peng, Y.; Chen, S.; Du, J.; Jiang, W. Late Paleoproterozoic tectonic evolution of the Olongbuluke Terrane, northern Qaidam, China: Constraints from stratigraphy and detrital zircon geochronology. Precambrian Res. 2019, 331, 105349. [Google Scholar] [CrossRef]
- Sun, J.; Dong, Y.; Jiang, W.; Ma, L.; Chen, S.; Du, J.; Peng, Y. Reconstructing the Olongbuluke Terrane (northern Tibet) in the end-Neoproterozoic to Ordovician Indian margin of Gondwana. Precambrian Res. 2020, 348, 105865. [Google Scholar] [CrossRef]
- Sun, J.P.; Dong, Y.P.; Ma, L.C.; Chen, S.Y.; Jiang, W. Devonian to Triassic tectonic evolution and basin transition in the East Kunlun-Qaidam area, northern Tibetan Plateau: Constraints from stratigraphy and detrital zircon U-Pb geochronology. GSA Bull. 2022, 134, 1967–1993. [Google Scholar] [CrossRef]
- Chen, S.; Bi, M.; Sun, J.; Zhang, Y.; Zhuang, Y.; Liu, J.; Wang, F.; Ma, S. Mixed sedimentary characteristics and controlling factors of Upper Paleozoic Group in Northern Qaidam Basin. Geol. Bull. China 2016, 35, 282–292. [Google Scholar]
- Wang, T.; Zhou, Y.N.; He, W.D.; He, L.; Cheng, X.; Deng, X.H.; Zhang, D.M.; Wei, B.T.; Jiang, N.; Wu, H.N. Provenance change in Carboniferous-early Permian sedimentary successions in the North Qaidam tectonic belt, northern Tibetan Plateau: Implications for the Kunlun oceanic plate subduction process. J. Asian Earth Sci. 2022, 240, 105434. [Google Scholar] [CrossRef]
- Xiao, A.C.; Yu, L.; Xiong, G.Y.; Zhang, J.Y.; Zhang, Y.S.; Wu, L.; Zhao, H.F.; Qin, S.H. Triassic retroarc foreland basin in southern Qilian area: Evidence from sedimentary filling and tectonics. Acta Petrol. Sin. 2021, 37, 2385–2400. [Google Scholar]
- Ma, S.; Chen, S.Y.; Jia, B.B.; Sun, J.P.; Wang, F.; Zeng, H.Y. Sedimentary characteristics and controlling factors of the Early Ordovician platform-slope-basin in the northern margin of the Qaidam Basin. Earth Sci. Front. 2018, 25, 185–197. [Google Scholar]
- Chen, Q.; Li, H.P.; Dong, Y.P.; Feng, Q.; He, D.F.; Chen, H. Redefinition of the Cambrian-Ordovician strata in the Olongbuluck area, northern margin of the Qaidam basin. Geol. Explor. 2013, 49, 825–835. [Google Scholar]
- Lai, C.G. Cephalopoda of the Duoquanshan Formation from Shihuigou, Ulan, Qinghai Province. Bull. Inst. Geol. Chin. Acad. Geol. Sci. 1985, 2, 109–117. [Google Scholar]
- Zhao, G.Z. Study of the Lower Ordovician in the northeastern margin of the Qaidam Basin, Qinghai Province. Qinghai Geol. 1986, 2, 1–11. [Google Scholar]
- Zhu, G.K. Paleomagnetism—Fundamentals, Principles, Methods, Results, and Applications; Beijing China Science Publishing & Media Ltd. (CSPM): Beijing, China, 2005; pp. 1–256. [Google Scholar]
- Kruiver, P.P.; Dekkers, M.J.; Heslop, D. Quantification of magnetic coercivity components by the analysis of acquisition curves of isothermal remanent magnetization. Earth Planet. Sci. Lett. 2001, 189, 269–276. [Google Scholar] [CrossRef]
- Stockhausen, H. Some new aspects for the modelling of isothermal remanent magnetization acquisition curves by cumulative log Gaussian functions. Geophys. Res. Lett. 1998, 25, 2217–2220. [Google Scholar] [CrossRef]
- Ao, H.; Deng, C.L. Review in the identification of magnetic minerals. Prog. Geophys. 2007, 22, 432–442. [Google Scholar]
- Lowrie, W. Identification of ferromagnetic minerals in a rock by coercivity and unblocking temperature properties. Geophys. Res. Lett. 1990, 17, 159–162. [Google Scholar] [CrossRef]
- Yan, Y.; Duan, L.; Liang, S.; Wang, J.; Huang, B.; Zheng, W.; Zhang, P. Paleomagnetic Constraint on the Carboniferous Paleoposition of Indochina and Its Implications for the Evolution of Eastern Paleo-Tethys Ocean. Tectonics 2020, 39, e2020TC006168. [Google Scholar] [CrossRef]
- Dekkers, M.J.; Mattéi, J.L.; Fillion, G.; Rochette, P. Grain-size dependence of the magnetic behavior of pyrrhotite during its low-temperature transition at 34 K. Geophys. Res. Lett. 1989, 16, 855–858. [Google Scholar] [CrossRef]
- Hrouda, F. A technique for the measurement of thermal changes of magnetic susceptibility of weakly magnetic rocks by the CS-2 apparatus and KLY-2 Kappabridge. Geophys. J. Int. 1994, 118, 604–612. [Google Scholar] [CrossRef]
- VanVelzen, A.J.; Dekkers, M.J. The incorporation of thermal methods in mineral magnetism of loess-paleosol sequence: A brief overview. Chin. Sci. Bull. 1999, 44, 53–63. [Google Scholar]
- Aubourg, C.; Pozzi, J.P.; Kars, M. Burial, claystones remagnetization and some consequences for magnetostratigraphy. Geol. Soc. Lond. Spec. Publ. 2012, 371, 181–188. [Google Scholar] [CrossRef]
- Zegers, T.E.; Dekkers, M.J.; Bailly, S. Late Carboniferous to Permian remagnetization of Devonian limestones in the Ardennes: Role of temperature, fluids, and deformation. J. Geophys. Res. Solid Earth 2003, 108, 2357. [Google Scholar] [CrossRef]
- Huang, W.; Lippert, P.C.; Jackson, M.J.; Dekkers, M.J.; Zhang, Y.; Li, J.; Guo, Z.; Kapp, P.; van Hinsbergen, D.J.J. Remagnetization of the Paleogene Tibetan Himalayan carbonate rocks in the Gamba area: Implications for reconstructing the lower plate in the India-Asia collision. J. Geophys. Res. Solid Earth 2017, 122, 808–825. [Google Scholar] [CrossRef]
- Huang, W.; Lippert, P.C.; Jackson, M.J.; Dekkers, M.J.; Zhang, Y.; Li, J.; Guo, Z.; Kapp, P.; van Hinsbergen, D.J.J. Reply to comment by Z. Yi et al. on “Remagnetization of the Paleogene Tibetan Himalayan carbonate rocks in the Gamba area: Implications for reconstructing the lower plate in the India-Asia collision”. J. Geophys. Res. Solid Earth 2017, 122, 4859–4863. [Google Scholar] [CrossRef]
- Roberts, A.P.; Florindo, F.; Larrasoaña, J.C.; O’Regan, M.A.; Zhao, X. Complex polarity pattern at the former Plio–Pleistocene global stratotype section at Vrica (Italy): Remagnetization by magnetic iron sulphides. Earth Planet. Sci. Lett. 2010, 292, 98–111. [Google Scholar] [CrossRef]
- Dunlop, D.J.; Özdemir, Ö.; Schmidt, P.W. Paleomagnetism and paleothermometry of the Sydney Basin 2. Origin of anomalously high unblocking temperatures. J. Geophys. Res. Solid Earth 1997, 102, 27285–27295. [Google Scholar] [CrossRef]
- Morin, J. Magnetic Susceptibility of αFe2O3 and αFe2O3 with Added Titanium. Phys. Rev. 1950, 78, 819. [Google Scholar] [CrossRef]
- Moskowitz, B.M.; Frankel, R.B.; Walton, S.A.; Dickson, D.P.; Wong, K.K.W.; Douglas, T.; Mann, S. Determination of the preexponential frequency factor for superparamagnetic maghemite particles in magnetoferritin. J. Geophys. Res. Solid Earth 1997, 102, 22671–22680. [Google Scholar] [CrossRef]
- Verwey, E. Electronic Conduction of Magnetite (Fe3O4) and its Transition Point at Low Temperatures. Nature 1939, 144, 327–328. [Google Scholar] [CrossRef]
- Guyodo, Y.; Mostrom, A.; Lee Penn, R.; Banerjee, S.K. From nanodots to nanorods: Oriented aggregation and magnetic evolution of nanocrystalline goethite. Geophys. Res. Lett. 2003, 30. [Google Scholar] [CrossRef]
- Huang, W.T.; Jackson, M.J.; Dekkers, M.J.; Zhang, Y.; Zhang, B.; Guo, Z.; Dupont-Nivet, G. Challenges in isolating primary remanent magnetization from Tethyan carbonate rocks on the Tibetan Plateau: Insight from remagnetized Upper Triassic limestones in the eastern Qiangtang block. Earth Planet. Sci. Lett. 2019, 523, 115695. [Google Scholar] [CrossRef]
- Yan, Y.; Huang, B.; Zhang, D.; Charusiri, P.; Veeravinantanakul, A. Paleomagnetic Study on the Permian Rocks of the Indochina Block and Its Implications for Paleogeographic Configuration and Northward Drifting of Cathaysialand in the Paleo-Tethys. J. Geophys. Res. Solid Earth 2018, 123, 4523–4538. [Google Scholar] [CrossRef]
- Enkin, R.J. Formation ET Déformation de L’Asie Depuis la Fin de Lère Primaire: Les Apports de L’éTude Paléomagnétique Des Formations Secondaires de Chine du Sud. Ph.D. Thesis, Univ de Paris, Paris, France, July 1990. [Google Scholar]
- Yang, Z.Y. Indosinian remagnetization of Permian limestone from the Khorat basin, Thailand. Acta Geophys. Sin. 1996, 39, 173–181. [Google Scholar]
- Yang, Z.Y.; Ma, X.H.; Sun, Z.M.; Huang, B.C. Remagnetization of the Early Paleozoic rocks from the southern part of the Huabei basin I—Paleomagnetic result and its implications. Sci. China (Ser. D) 1998, 41, 20–27. [Google Scholar]
- Yang, Z.Y.; Ma, X.H.; Sun, Z.M.; Huang, B.C. Remagnetization of the Early Paleozoic rocks from the southern part of the Huabei basin II—Rock magnetic results. Sci. China (Ser. D) 1998, 41, 28–35. [Google Scholar]
- Liu, C.Y.; Li, S.H.; Deng, C.L.; Zhu, R.X. On the mechanism of remagnetization of Ordovician carbonates from the Yangtze Block, southwestern China. Chin. Geophys. 2013, 56, 579–591. (In Chinese) [Google Scholar]
- Cao, Y.; Sun, Z.M.; Li, H.B.; Ye, X.Z.; Pan, J.W.; Zhang, L.; Liu, D.L.; Liu, C.G. Paleomagnetic Study of the Late Triassic limestones in the western portion of the Qiangtang Block and its tectonic implications. Acta Geol. Sin. 2019, 93, 2463–2476. [Google Scholar]
- Dunlop, D.J.; Özdemir, Ö.; Clark, D.A.; Schmidt, P.W. Time-temperature relations for the remagnetization of pyrrhotite (Fe7S8) and their use in estimating paleotemperatures. Earth Planet. Sci. Lett. 2000, 176, 107–116. [Google Scholar] [CrossRef]
- Xu, H.L.; Ma, X.H.; Sun, Z.M.; Chen, K.Q. Magnetic minerals in carbonate rocks and their role in palaeogeographic study. J. Palaeogeogr. 2000, 2, 75–82. [Google Scholar]
- Sun, L.S.; Huang, B.C. New paleomagnetic result for Ordovician rocks from the Tarim Block, Northwest China and its tectonic implications. Chin. J. Geophys. 2009, 52, 1836–1848. [Google Scholar]
- Shi, C.D.; Zhu, R.X. Applications of research of iron sulphides in paleomagnetism and environmental magnetism. Prog. Geophys. 2000, 15, 91–97. (In Chinese) [Google Scholar]
- Menard, G.; Rochette, P. Utilisation de re aimantation postme´tamorphique pour une e´tude del’e´volution tectonique et thermique tardive dans lesAlpes occidentales (France). Bull. Socie Ologique Fr. 1992, 163, 381–392. [Google Scholar]
- Appel, E.; Müller, R.; Widder, R.W. Palaeomagnetic results from the Tibetan Sedimentary Series of the Manang area (north central Nepal). Geophys. J. Int. 1991, 104, 255–266. [Google Scholar] [CrossRef]
- Chen, X.; Xu, R.; Zheng, Y.Y.; Gao, S.B.; Cai, P.J.; Yu, J.Z.; Wang, Q.M. The geodynamic setting of Dulan eclogite-type rutile deposits in the North Qaidam orogen, western China. Ore Geol. Rev. 2019, 110, 102936. [Google Scholar] [CrossRef]
- Metcalfe, I. Multiple Tethyan ocean basins and orogenic belts in Asia. Gondwana Res. 2021, 100, 87–130. [Google Scholar] [CrossRef]
- Niu, M.L.; Cai, Q.R.; Li, X.C.; Yakymchuk, C.; Wu, Q.; Yuan, X.Y.; Sun, Y. Early Paleozoic tectonic transition from oceanic to continental subduction in the North Qaidam tectonic belt: Constraints from geochronology and geochemistry of syncollisional magmatic rocks. Gondwana Res. 2021, 91, 58–80. [Google Scholar] [CrossRef]
- Jackson, M.; Swanson-Hysell, N.L. Rock magnetism of remagnetized carbonate rocks: Another look. Geol. Soc. Lond. Spec. Publ. 2012, 371, 229–251. [Google Scholar] [CrossRef]
- Oliver, J. Fluids expelled tectonically from orogenic belts: Their role in hydrocarbon migration and other geologic phenomena. Geology 1986, 14, 99–102. [Google Scholar] [CrossRef]
Disclaimer/Publisher’s Note: The statements, opinions and data contained in all publications are solely those of the individual author(s) and contributor(s) and not of MDPI and/or the editor(s). MDPI and/or the editor(s) disclaim responsibility for any injury to people or property resulting from any ideas, methods, instructions or products referred to in the content. |
© 2022 by the authors. Licensee MDPI, Basel, Switzerland. This article is an open access article distributed under the terms and conditions of the Creative Commons Attribution (CC BY) license (https://creativecommons.org/licenses/by/4.0/).