Article

Resource Intensity Trends in the South African Ferrochrome Industry from 2007 to 2020

by
Reuben Dlamini
1 and
Harro von Blottnitz
2,*
1
Minerals-to-Metals, University of Cape Town, Rondebosch 7701, South Africa
2
Chemical Engineering Department, University of Cape Town, Rondebosch 7701, South Africa
*
Author to whom correspondence should be addressed.
Minerals 2023, 13(1), 44; https://doi.org/10.3390/min13010044
Submission received: 28 October 2022 / Revised: 6 December 2022 / Accepted: 13 December 2022 / Published: 27 December 2022
(This article belongs to the Special Issue Recent Developments in Mineral Processing at University of Cape Town)

Abstract

:
Processing resource requirements in mineral extractive industries tend to increase over time as ore grades decrease, which consequently increases the environmental footprint of operations and products. This phenomenon may be alleviated by cleaner production interventions. South Africa is the largest global supplier of chromium. This study investigates the impact of cleaner production process improvements on selected resource intensities of the South African ferrochrome industry. Sustainability data, available since the start of regular sustainability reporting in 2007, were used to compile resource intensity trends. This was followed by a review of industry capital projects relating to resource-use optimisation, interrogated in interviews with industry experts, to ascertain their effect on resource intensities. The emergence of a symbiotic relationship with the platinum-group metals industry was identified as a major development, with chromite ore intensity decreasing from 2.54 to 1.98 kg per kg ferrochrome. Electrical energy intensity was observed to decrease from 3.47 to 2.86 kWh per ton ferrochrome, mainly as a result of cleaner smelting technology, though cogeneration fired by furnace off-gases also contributed significantly. The introduction of cleaner production interventions in the South African ferrochrome industry was thus documented to have resulted in decreased resource use intensities.

Graphical Abstract

1. Introduction

Ferrochrome is an alloy of mostly iron and chromium, traded as an intermediate source of chromium, generally derived from the mining and smelting of chromite ore. Chromium gives alloys the quality of being resistant to corrosion [1]. This means that ferrochrome is an essential raw material in modern society because of the various applications in alloying metallic elements to produce steels and iron alloys such as stainless steel. Producing ferrochrome requires high energy inputs amongst other resource inputs common to the mineral extractives industry. The manner in which these resource inputs are used affects the profitability and sustainability of the industry. Operating efficiently requires an understanding of resources, the associated technology, and operational constraints (environmental, geological, etc.) [2].

1.1. Resource Intensity

Ekins et al. [3] referred to resources as elements of the physical world which can be used for the provision of goods and services. Numerous works have emphasised the importance of developing mineral resources sustainably [2,4,5]. In relation to manufacturing, the term ‘resource efficiency’ means optimising resource use and thereby reducing the impact on the natural environment upstream [6]. Resource intensity, described as input-to-output ratios, is a common measure of resource efficiency [6]. Resource intensity, in this study, is defined as the amount of resource used to produce a unit of product, as used by Mudd [7] and Spuerk et al. [6] even though it was not explicitly defined in either study. Resource requirements are influenced by ore grade and other operating conditions, which can be improved by applying emerging cleaner production technologies [8]. This study focuses on the resource intensity of the South African ferrochrome industry in the context of changing ore grade and cleaner production technology.
Declining available ore grades over time alongside resource efficiency principles have been studied in several mineral extractive industries [7,8,9,10,11], cf. Table S1. Northey et al. [12] have shown that regarding copper production, when the available ore grade declines, more ore is mined, and consequently, more resources are required to produce a unit of copper. Gold production also experienced increases in energy requirements, cyanide use, water use, mineral waste, and greenhouse gas emissions (GHEs) as a result of the decreasing ore grade [7]. In their study of the gold, silver, copper, lead, zinc, and nickel industries, Calvo et al. [8] found that ore grade decreasing over time had resulted in increased resource use, especially with regard to energy intensity and increased waste generation due to increasing depth and ventilation requirements over time. They show that these trends are a manifestation of the second law of thermodynamics (and thus generalisable): the higher the entropy in the feed material, the more energy will be needed in concentration. Indeed, the same phenomenon has been reported by Glaister and Mudd [10], who studied the platinum group metals (PGM) industry and concluded that decreases in ore grade and greater mining depths had resulted in increased unit energy consumption and GHEs. In the absence of new high-grade ore bodies, the ore grade from available known resources is expected to continue declining simultaneously with increasing ore complexity, making it more difficult to process ore [9]. Concerns over the processing implications of lower mined grade ores have also informed technology development and selection in the chromium sector [13,14], but to date, no studies have quantified such trends.
Even though the decreasing ore grade led to increasing resource intensities, advancements in technology and processing routes have positively influenced resource intensity. For instance, gold production underwent a resurgence owing to the advent of the carbon-in-pulp (CIP) process and the advancement of earth-moving and milling technology [7]. Hydrometallurgical process routes were found to be less energy and GHE intensive in comparison to pyrometallurgical process routes in copper production [12]. A life cycle analysis study into ferrochrome production by Gediga and Russ [15] stated that closed furnaces with preheating resulted in more energy-efficient production than open furnaces. It is also worth noting that higher-grade ores are exploited first with the expectation that technological advancements over time enable the feasible exploitation of lower-grade ores [12,16].
To date, no study has reported on resource intensity trends in the ferrochrome industry, in which South Africa is the largest supplier.

1.2. The Ferrochrome Industry

To understand the impact of operational improvements in the South African ferrochrome industry, this section outlines some of the processing limitations and operational routes used in the industry. Ferrochrome is manufactured through an energy-intensive process of the carbothermic reduction of chromium ore (chromite). Over 70% of the world’s viable chromite resources are in the Bushveld Igneous Complex (BIC), South Africa. Both underground and open-pit mining are practised. The abundance of chromite resources in South Africa, amongst other factors, has led to the development of the South African ferrochrome industry. The country’s production accounted for around 34% of global ferrochrome production in 2013. Most South African producers have smelting facilities and chromite mines within the BIC [17].

1.3. Beneficiation

The beneficiation route of ore depends on the characteristics of the ore. Typically, low-grade ores with less than 45% Cr2O3 (typically 20% to 30%) require concentration to about 55% by physical separation, often after comminution, whilst high-grade ores may only need hand sorting [18]. The comminution step is followed by separation, size classification, and concentration steps which may include screening, using hydrocyclones and spiral concentrators. The difference in chromium and gangue densities enables the concentration of the desired ore [13].
Chromite from South Africa is known to be low grade, brittle, and prone to result in fine ore during processing. The average distribution is approximately 75% fine ore, whilst the remainder is classified as lumpy ore [19]. Fine ore is known to cause dangerous blowouts and bed turnovers during smelting, whilst lumpy ore prevents these unwanted operating conditions [20]. In addition, the transport and use of fine ore results in high handling losses, and extraction in off-gas results in the clogging and the sintering of furnace burden [16]. Therefore, fine ore is often agglomerated by either briquetting or, more commonly, through pelletising and sintering. Agglomeration is also advantageous because it improves the cold and hot strength of the ore; cold strength is the measure of resistance to crumbling during handling, and hot strength is the resistance to disintegration from abrasive collisions and heat during smelting [21]. Briquettes are less common because they are susceptible to breaking down under heat during smelting, leading to reduced porosity and consequently reduced metal recoveries [19].

1.4. Smelting Processes

Pelletising consists of mixing fine chromite and a carbon fuel source such as coke in water with a binder (e.g., bentonite) in predetermined proportions to form pellets. The pellets are then sintered to improve their cold and hot strength [1]. Once sintered, the pellets are stored on the production site to be charged with reductants and fluxing materials in furnaces. Furnace charging may be preceded by a preheating and pre-reduction step. Preheating and pre-reduction reduce the electricity requirement for producing ferrochrome. In addition, pre-reduction decreases the high-grade reductant needed for smelting, enables the use of chromite fines, reduces electrical energy needs, and increases chromium recovery [22].
Even so, fine ore can be charged into an open furnace with direct current whilst lumpy, and agglomerated ore is often fed into closed furnaces with alternating current [19]. Due to environmental regulations from toxic particulate emissions and associated costs, the industry trend is to use closed furnaces more, further promoting the use of the agglomeration of fine ore [18]. The added advantage of the closed furnace is that the hot off-gas produced during smelting can be used for sintering pellets, preheating, and pre-reducing the furnace charge. This also reduces the cost of combusting coke or using gas burners for heat [21]. Alternatively, since the hot gas is also rich in carbon monoxide (CO), the gas can be combusted to generate electricity. At times, a combination of these CO-gas applications is used depending on the needs of the operation.

1.5. Developments in Ore Grades and Sources

Most South African producers have a vertically integrated ownership structure, i.e., they own their means of production across the value chain from mining, beneficiation, processing, and smelting through to marketing. This contributes to a competitive advantage, which is based on the ownership of the primary mineral resource. Lower Group 6 (LG6) and Middle Group 1 and 2 (MG1/2) chromite seams have been the most financially viable and consequently the most exploited resources for over 30 years in South Africa. However, due to prolonged exploitation, the ore grade available had gradually decreased from high chromium to iron (Cr:Fe) ratios of 3:1 in the 1970s to less than 2:1 in the 1980s. By the early 2000s, the LG6 and MG1/2 seams had only marginally higher Cr:Fe ratios (1.5-2 after beneficiation) compared to less than 1.4 after beneficiation for Upper Group 2 (UG2) chromite seams [16]. High Cr:Fe ratios are associated with high chromium (III) oxide (Cr2O3) concentrations in the chromite and ultimately high chromium concentration in the ferrochrome product [16].
The Cr:Fe ratio is the main determinant of chromium content in the ferrochrome product. Ferrochrome producers are only paid according to the mass content of chromium contained in ferrochrome. This used to make ores with low Cr:Fe ratios undesirable. However, the emergence of the argon oxygen decarburisation process to produce stainless steel from charged chrome enabled the use of chromite with lower grades. Smelter feeds with Cr:Fe ratios of 1.5 have been normal due to the availability of the technology for some time [16].
The platinum group metal (PGM) industry uses UG2 seams, and the resulting tailings from PGM producers’ beneficiation have been found to have a significant chromium content. Once the tailings are beneficiated, they can reach a chromium (Cr2O3) concentration of 40%, which is similar to some beneficiated LG6 and MG1/2 ores [16]. The concentrate produced is fine and not lumpy, thus necessitating agglomeration in the form of pelletising and sintering prior to being used in ferrochrome production [19].
The chromium concentrate from the PGM-beneficiated tailings has gained acceptance in the ferrochrome industry because it is cheaper to buy beneficiated UG2 PGM tailings, concentrate, pelletise, and sinter them than mining LG6 and MG1/2 ore and then pelletising and sintering them. Some LG6 and MG1/2 ore seams have been exploited for extended periods resulting in extensive depths, which significantly increases mining costs [18]. The profile of the chromium ore and technology used for ferrochrome production has thus changed significantly since the early 2000s, implying that resource intensities may have changed.

2. Methods and Data

The methods used in this research combine a quantitative assessment of resource intensities for the South African ferrochrome industry between 2007, when South African ferrochrome companies began consistently publishing sustainability reports, and 2020, when this investigation was concluded. An event history analysis of major changes in the industry was conducted and supported by interviews with selected industry experts to verify information in the public domain.
Energy, electricity, water, and ore resource intensities were compiled to produce resource intensity trends. Equation (1) was used to calculate resource intensity for this study:
Resource intensityi = (Quantity of resource input)i ÷ (Quantity of product)i
where the letter i refers to the production year, the numerator to the resource amount used, and total ferrochrome produced in the denominator, and quantities expressed in mass units. Variations in the trends would reveal changes in production operations.
Numerous mining companies publish sustainability results as part of their mandatory legal financial reporting. The Global Reporting Initiative (GRI) framework has been the most widely adopted set of reporting guidelines for standardising sustainability performance reporting within the mining and metals industry [7,8].
Data for calculating the resource intensity trends were collected from South African ferrochrome companies’ sustainability reporting from production year 2007 to 2020. Initially, a desktop study of the South African ferrochrome industry was undertaken to ascertain the major ferrochrome producers in South Africa and their capacity to establish the representation of results. It was assumed that the quality of reporting was similar enough for the comparison of the results.
Mudd [7] and Calvo et al. [8] have noted that sustainability reporting was often inconsistent with instances where the data were reported differently, aggregated, or not shown in successive reports of the same company. This adds complexity to the performance comparison. In such instances, where possible, other available data within the reports can be used to calculate the missing data points. Furthermore, Azapagic [2] suggests that mass balancing can be used to calculate required data points where applicable.
Determining the technological innovations that affected the resource intensities required that engineering projects in the South African ferrochrome industry be investigated. This was accomplished through an event history analysis (EHA) approach, which is a research technique aimed at identifying occurrences of interest within a history of events [23]. Projects were identified through a desktop study focusing on sustainability reporting, company publications, environmental impact assessment (EIA) reports, and news articles. Once identified, projects were recorded and categorised according to the resource intensity affected. Industry experts were also consulted concerning the industry and any changes they were aware of that affected resource intensities. Thematic analysis was used to analyse the drivers of the changes to measure improvements in resource intensity.
Experts were identified from the desktop study within related publications and then requested to participate as interviewees. Their affiliations and professional credentials are shown in Table 1.
A pseudonym code system was assigned to the participants, the organization type, and the role they were responsible for in their respective organisations, as shown in Table 1. The participants provided informed consent as per the approval from the Ethics in Research Committee of the Faculty of Engineering and the Built Environment at the University of Cape Town.

3. Results

The desktop study revealed the major South African ferrochrome producers and capacities as summarised in Table 2.
The industry has undergone significant consolidation after several producers were placed under business rescue, which is a South African statutory allowance for companies under financial distress to continue operating whilst under the guidance of a business rescue practitioner and protected from creditors [26]. Samancor, a privately owned company, acquired Hernic Ferrochrome, IFML, and ASA metals.
IFML and Merafe Resources (Glencore–Merafe) were the only companies identified by the authors to regularly report on their ferrochrome sustainability performance. Based on Table 2, Glencore and IFML accounted for about 50% of the total production capacity. Therefore, about 50% of South Africa’s production capacity was accounted for in this study.

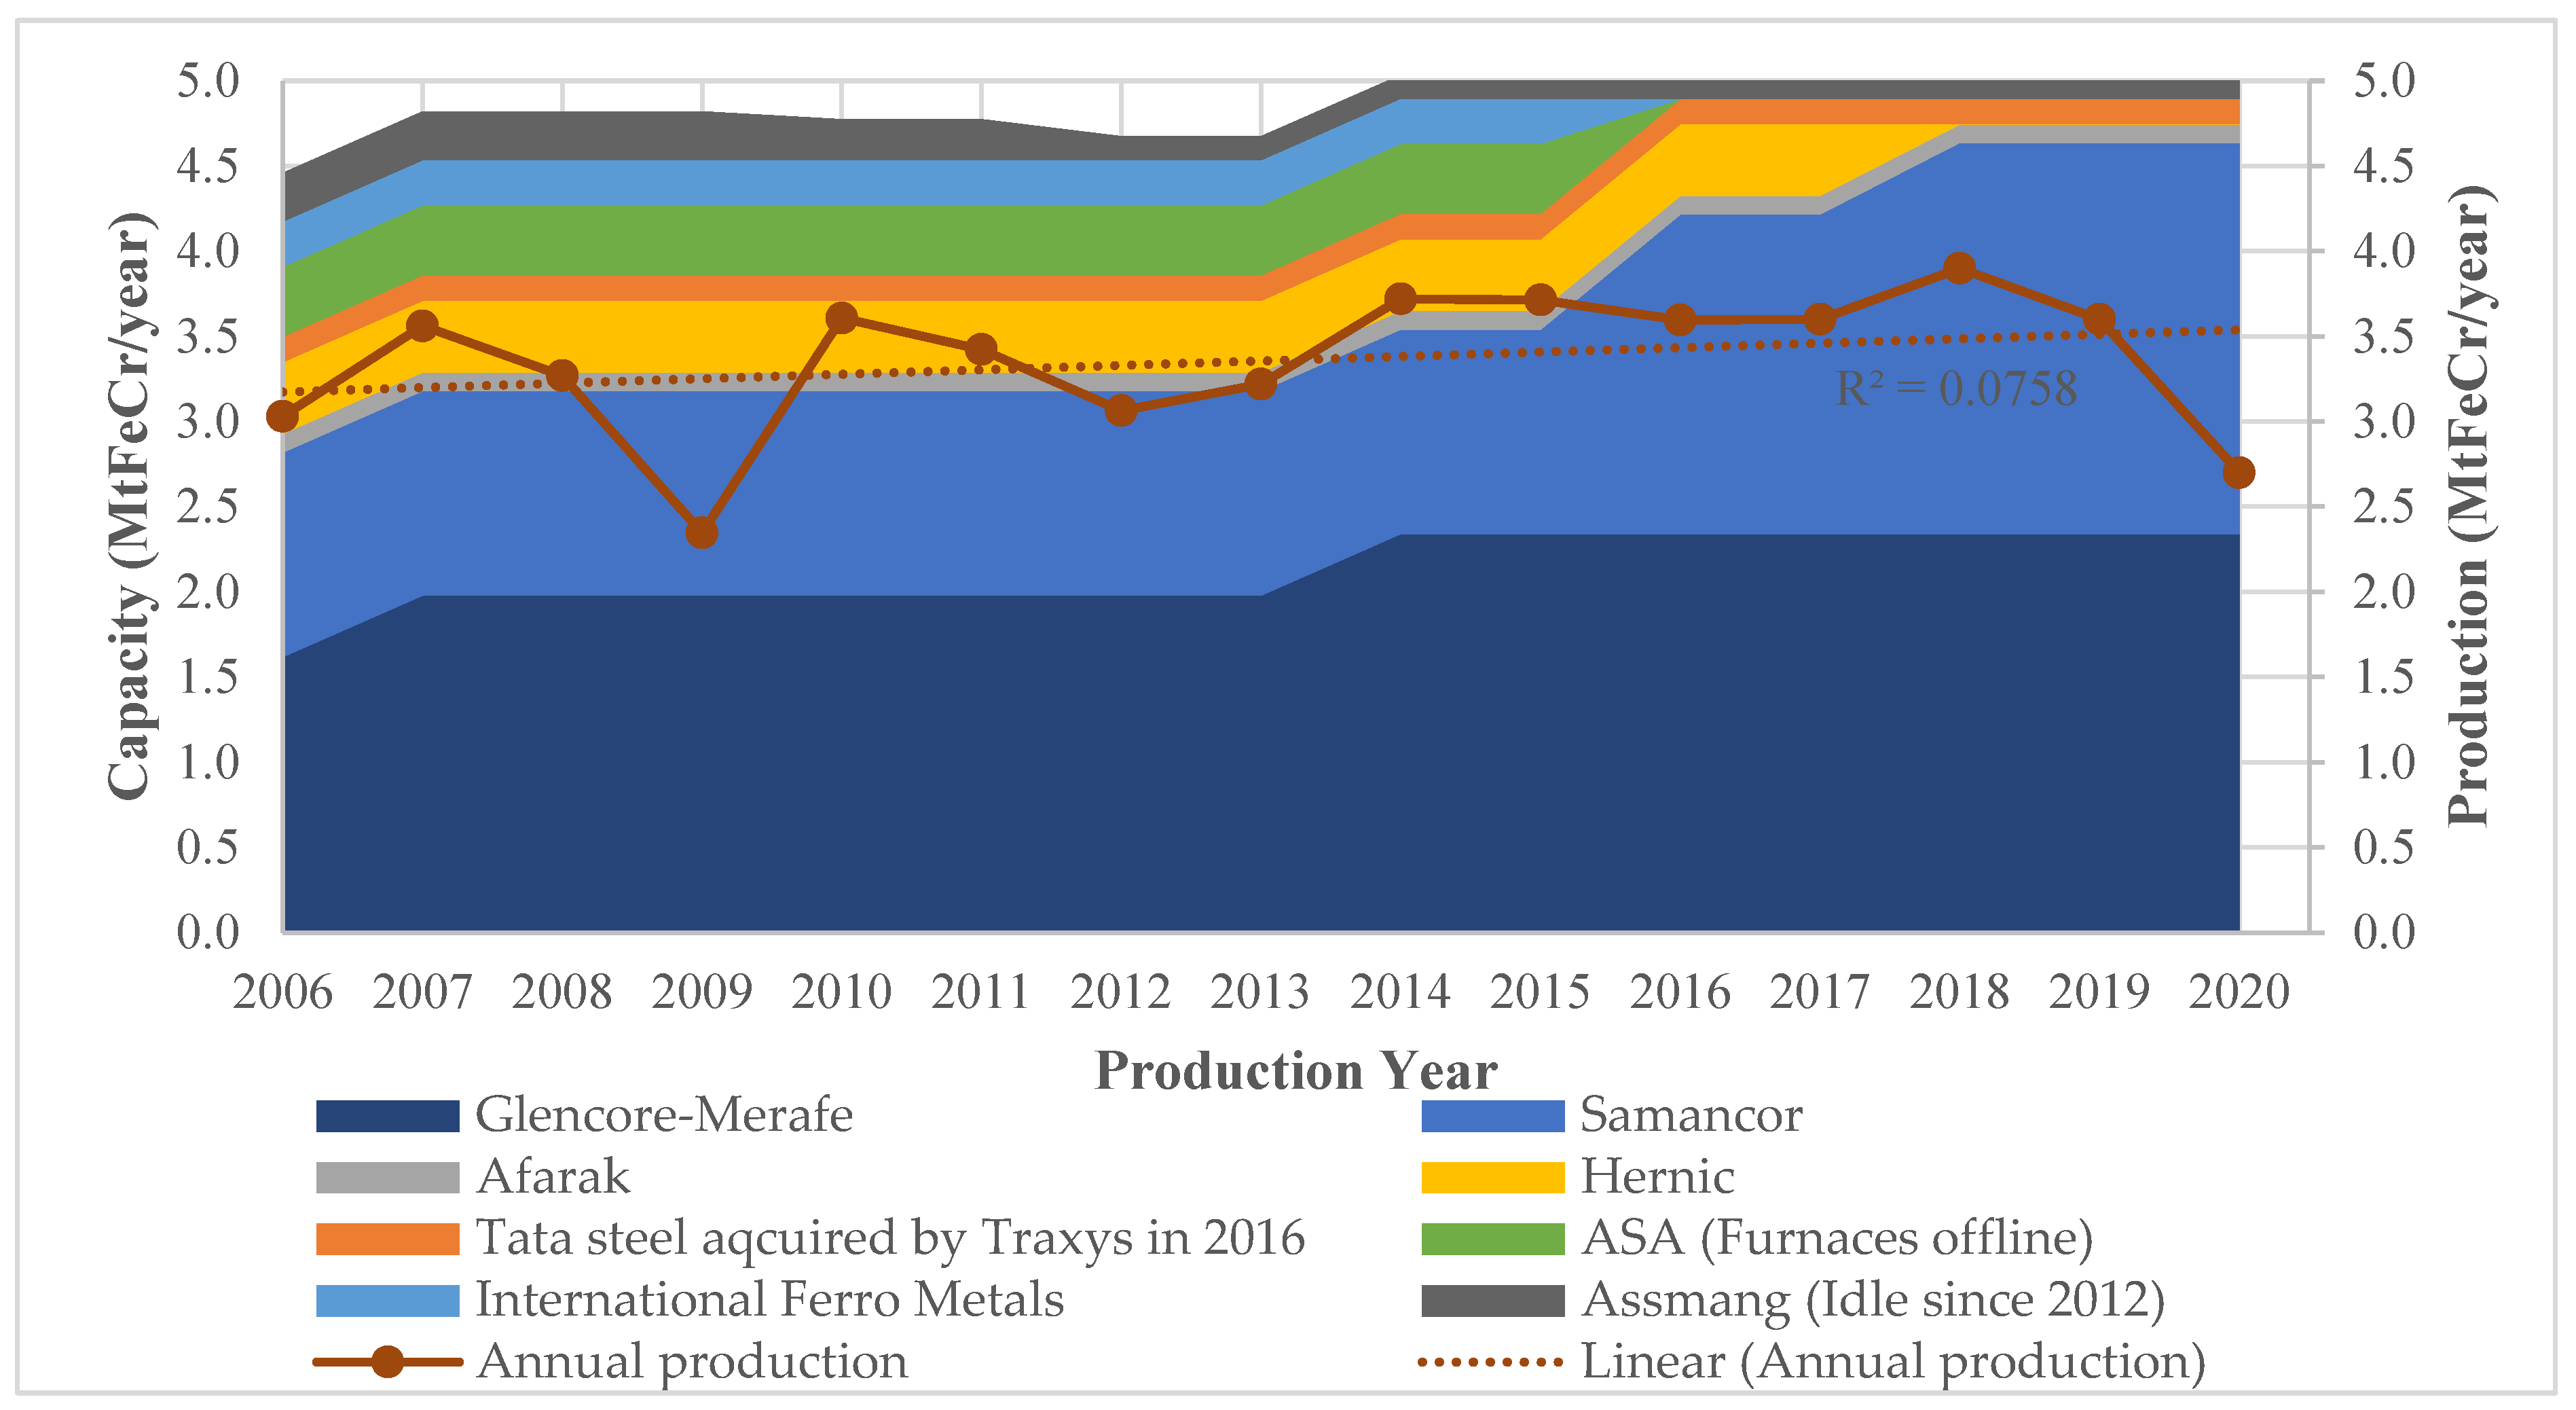
3.1. Production Trends

The ferrochrome production capacity and actual production by South African companies are shown in Figure 1 for the years 2006 to 2020.
The production results shown in Figure 1 indicate that there were fluctuations in the period under review. The declines were largely due to the financial crisis of 2007/8 and the recent COVID-19 pandemic in 2020. Although not evident in Figure 1, strike action in the South African PGM industry led to production inefficiencies as reported by Glencore–Merafe [31] and IFML [30] owing to non-ideal ore concentrate mixes. This was due to the co-dependency of the PGM, and the ferrochrome industries discussed in Section 3.2. Even with the strike action, ferrochrome production in 2014/15 did not vary significantly due to the companies owning their chromite mines. When comparing the production volumes between 2006 and 2020, there is a gradual increase in annual production as depicted by the upward slope of the trendline; however, the low R2 value reveals the fluctuating nature of the production.

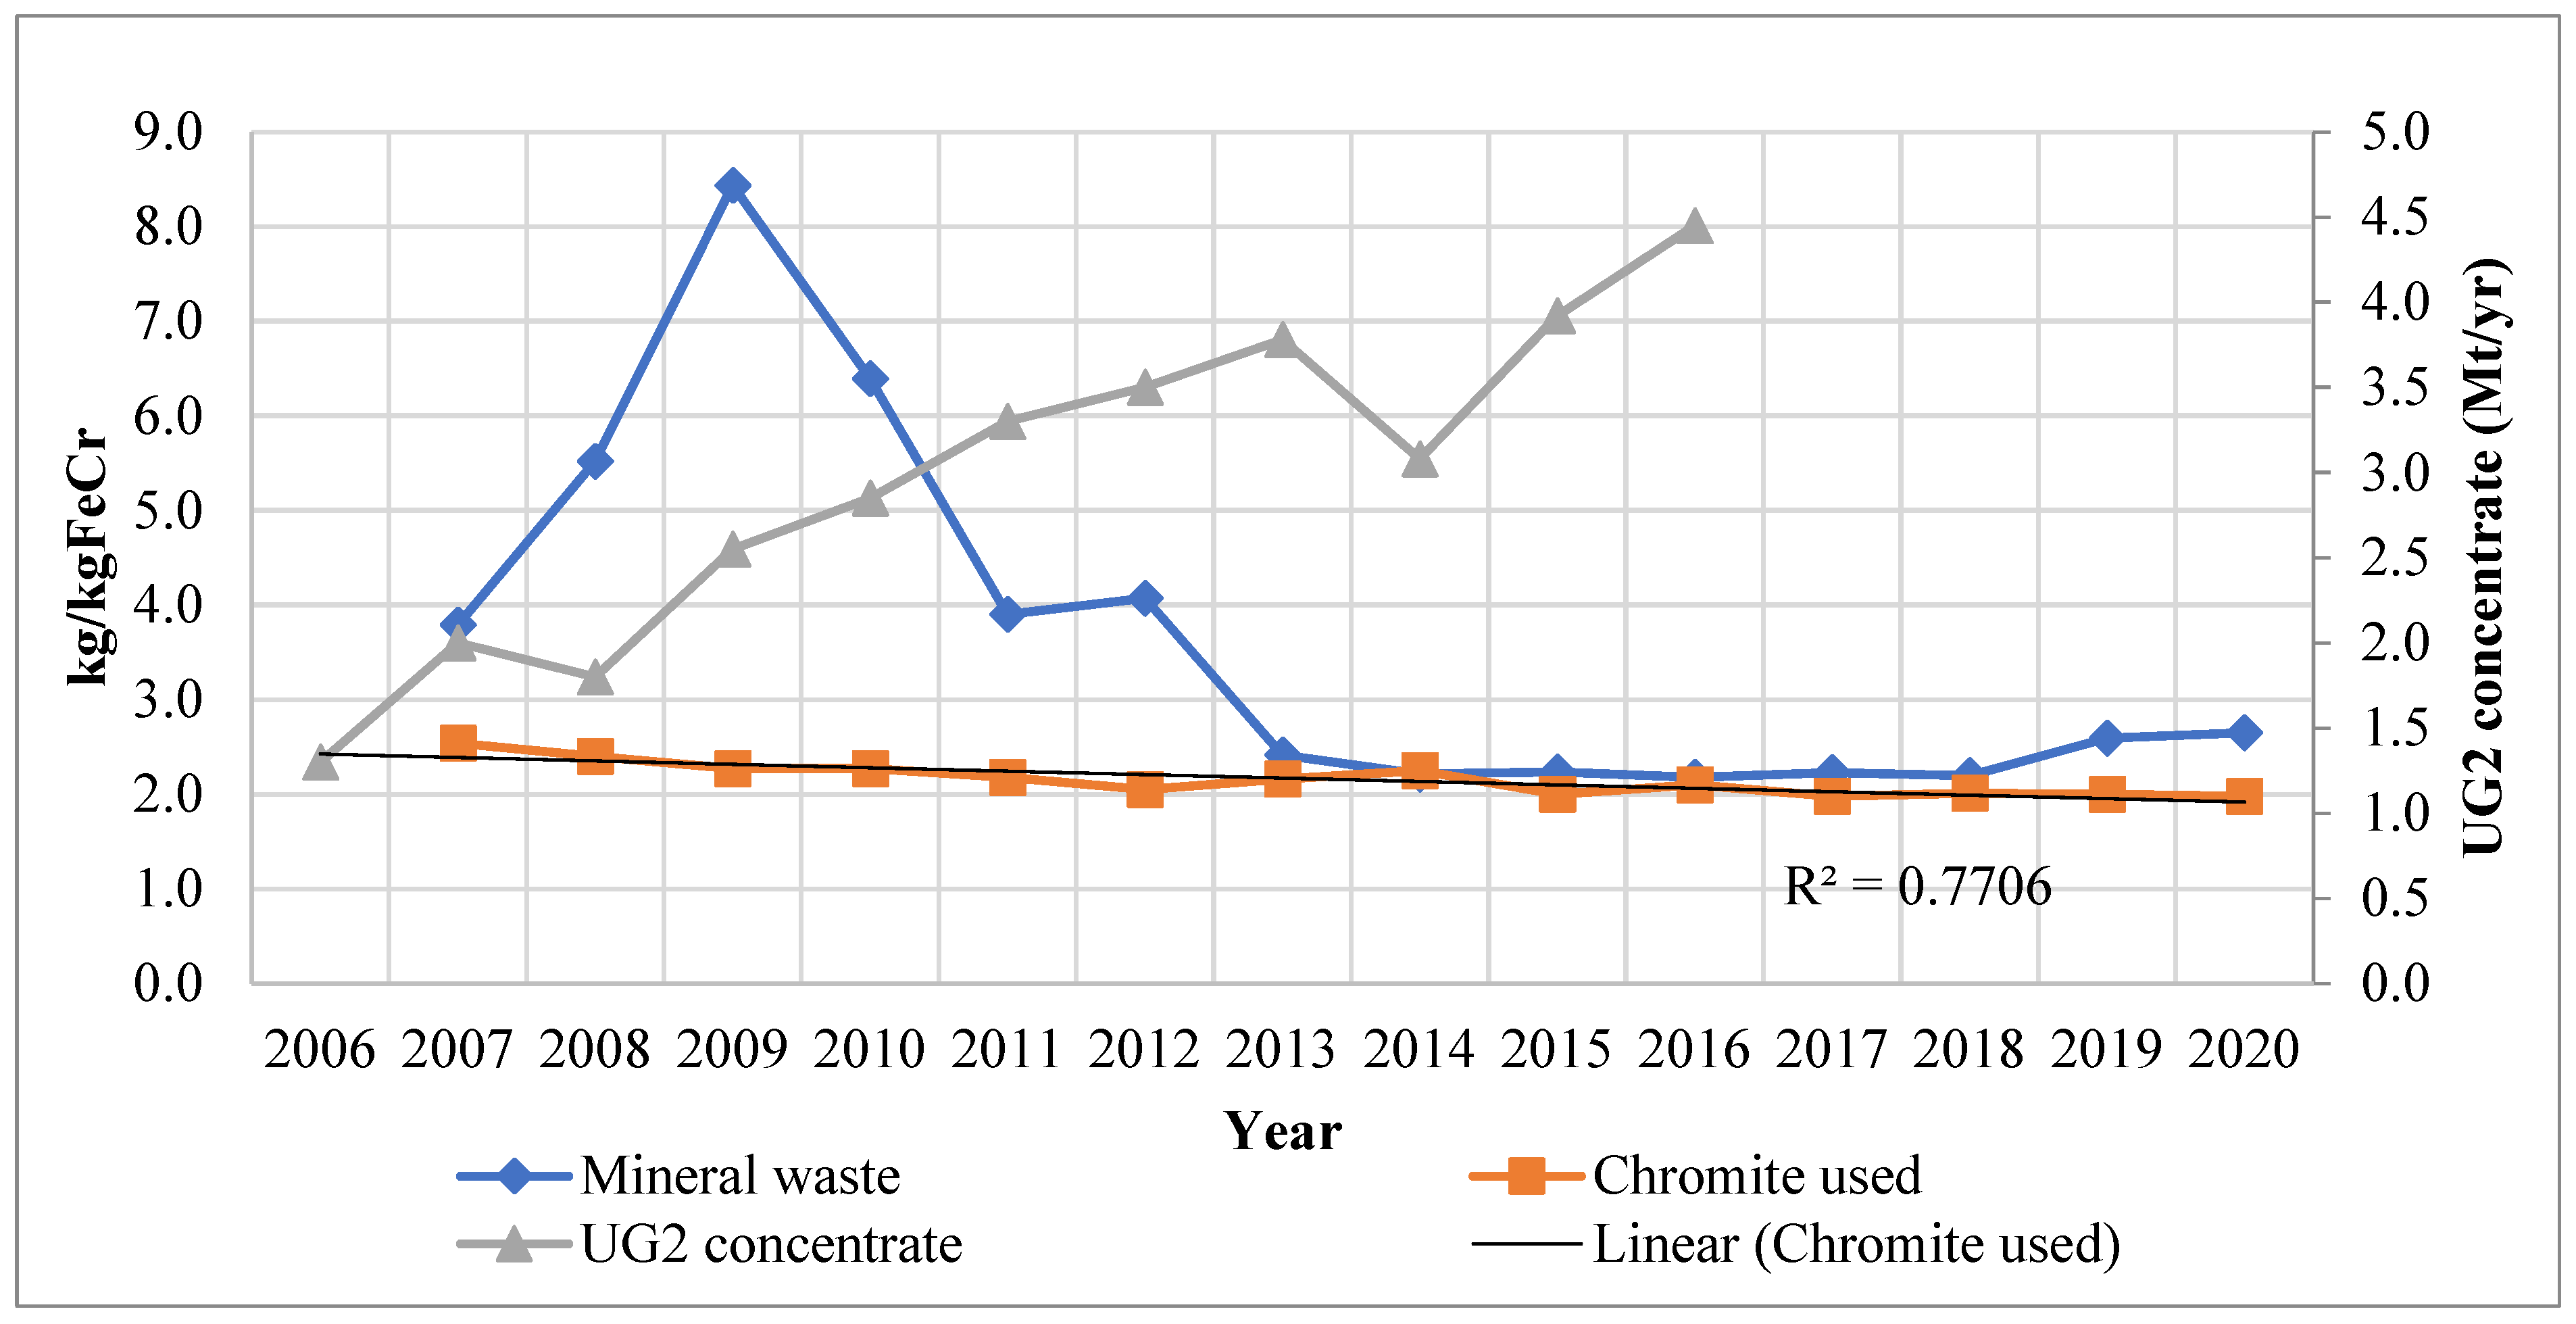
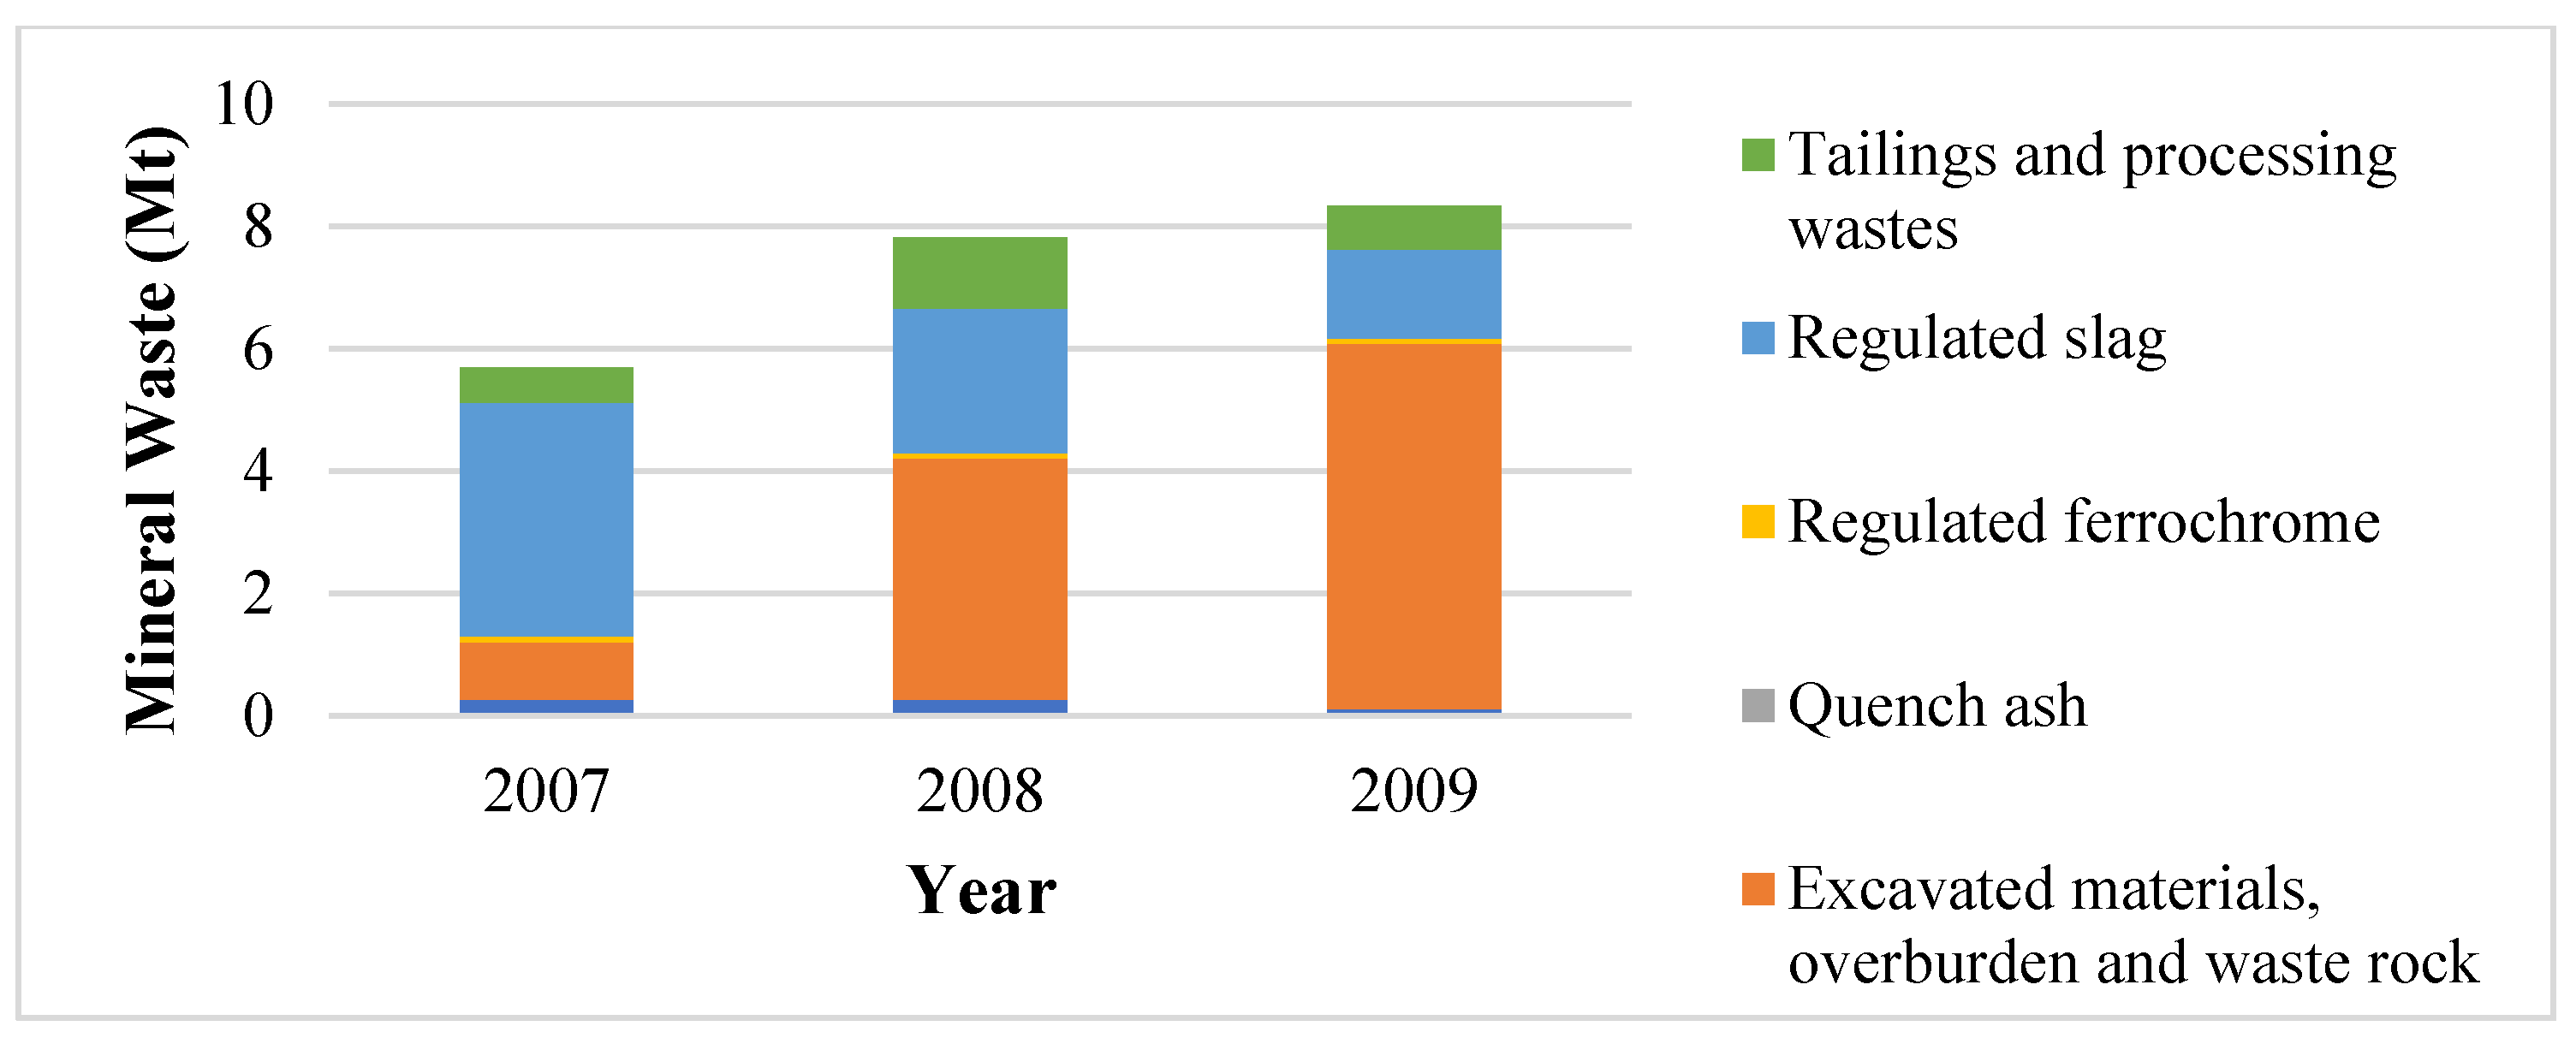
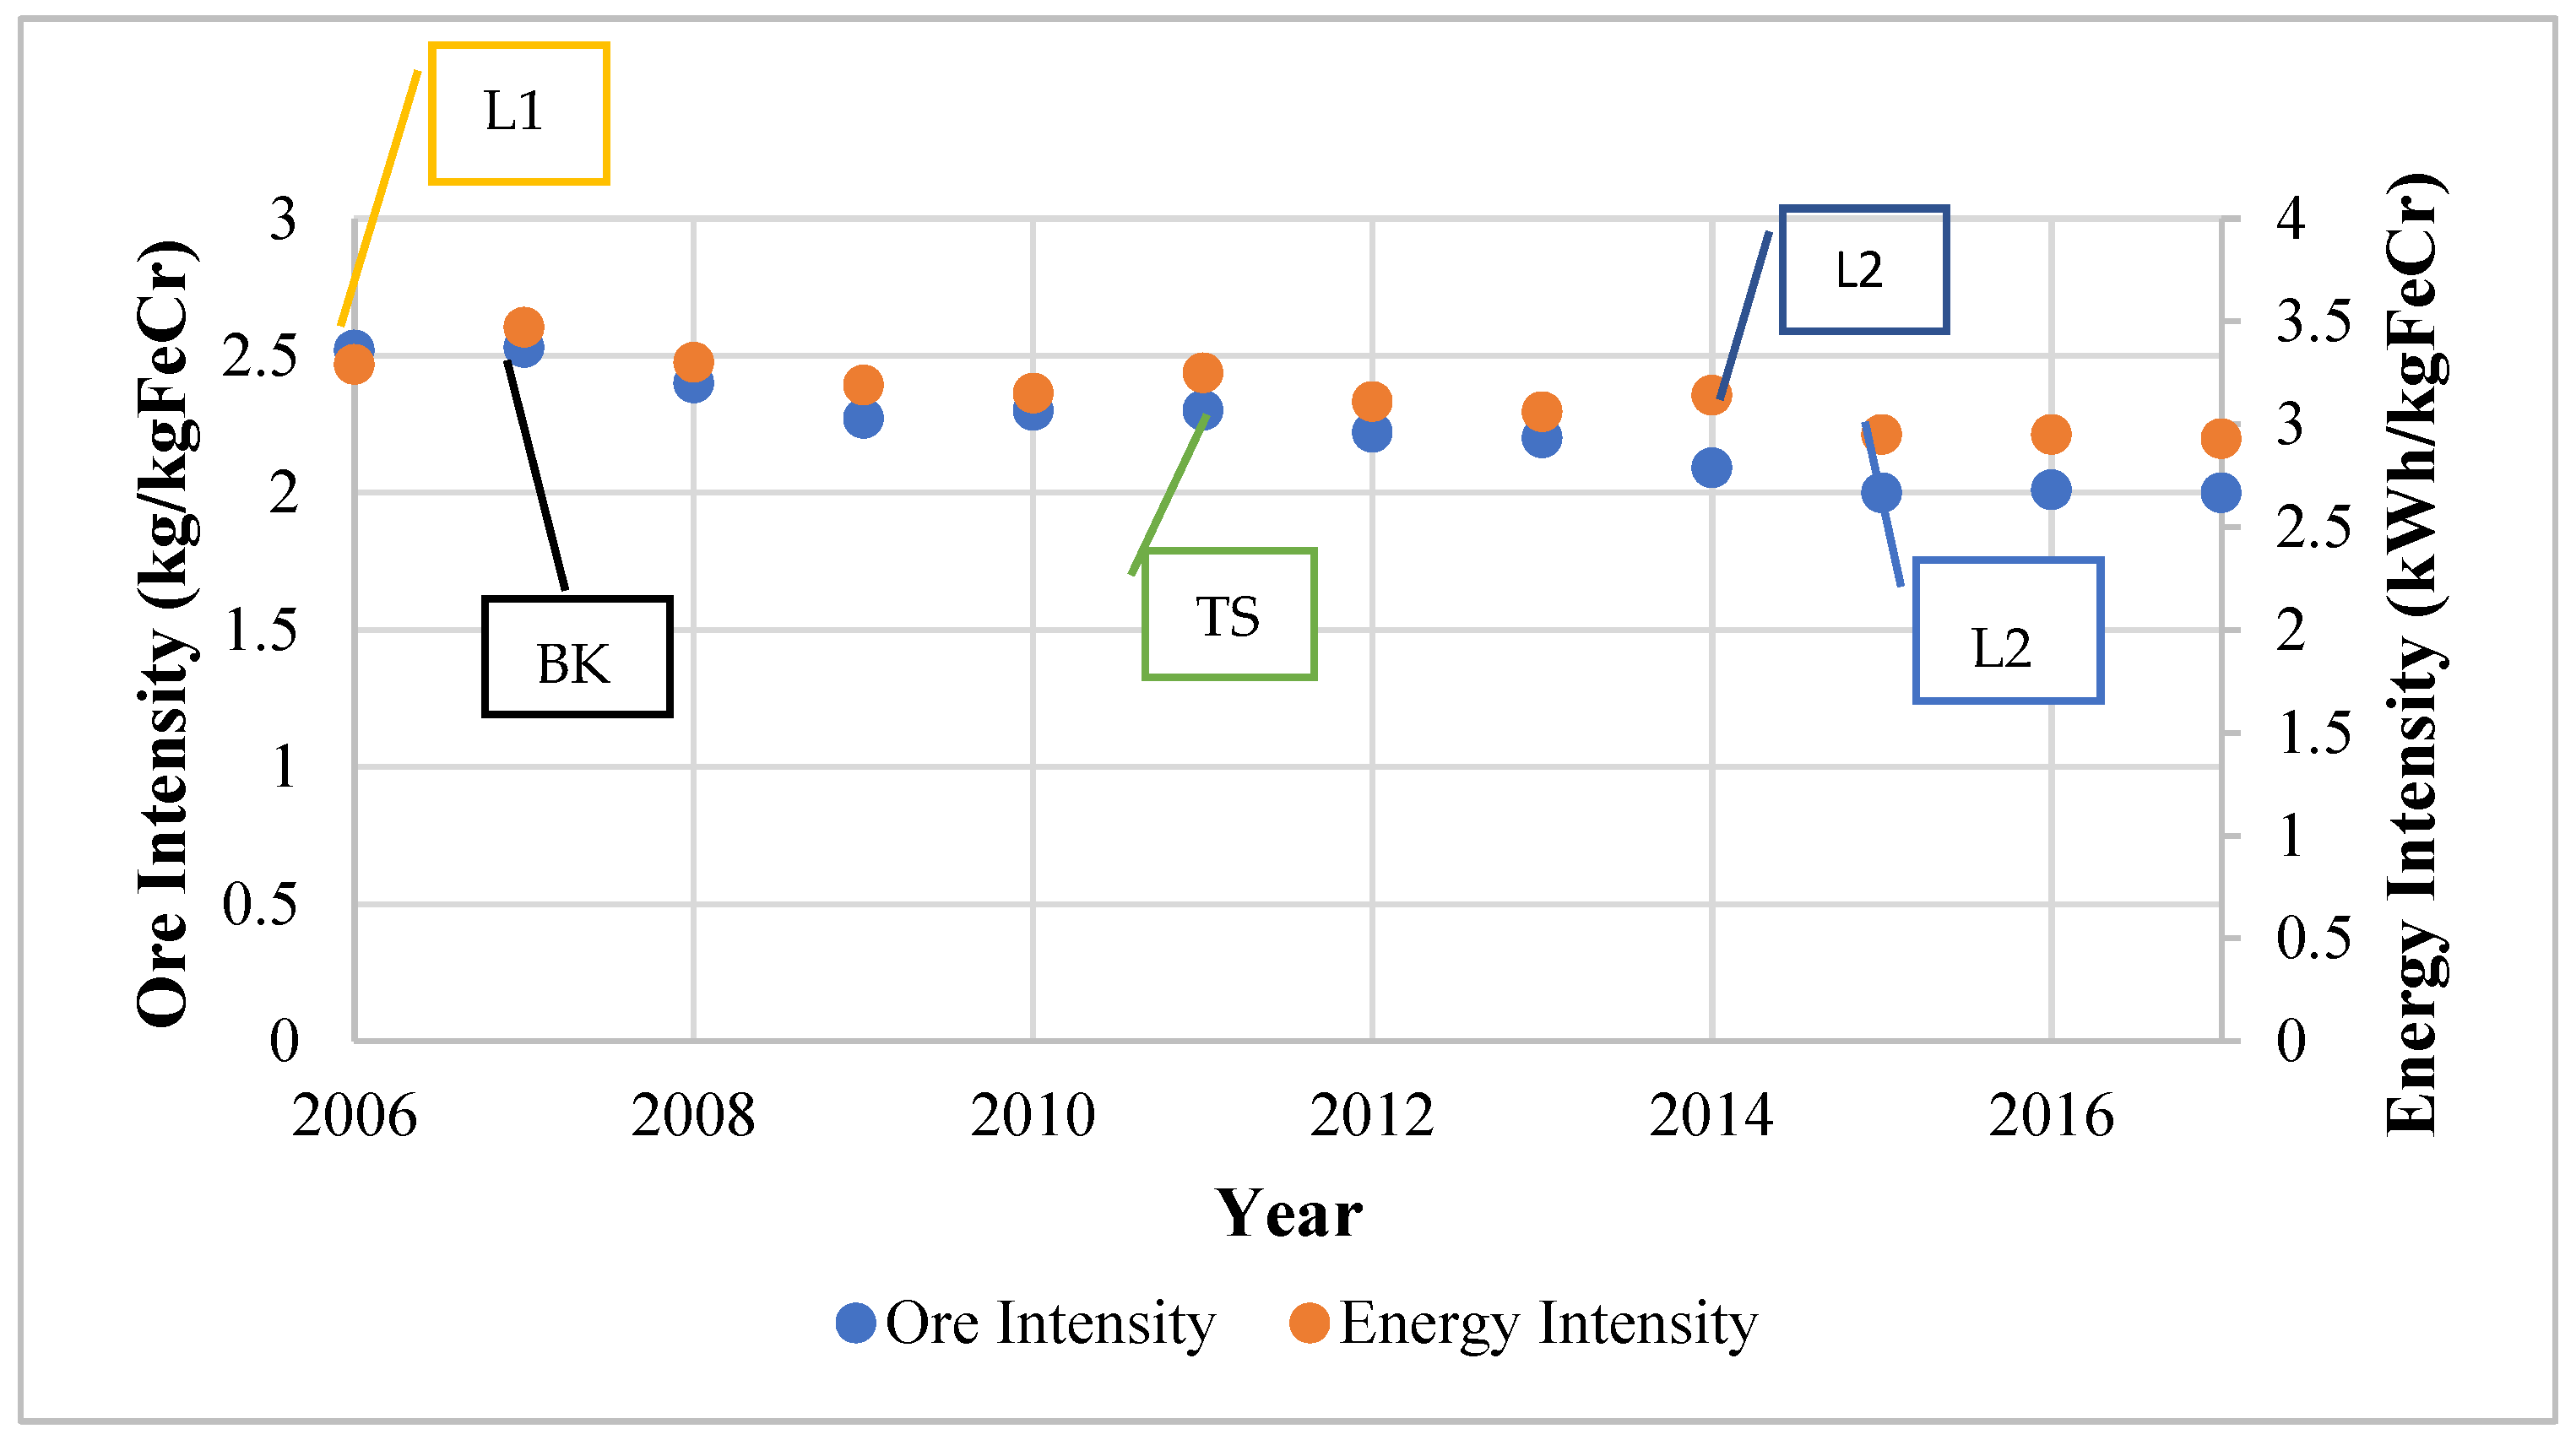
3.2. Ore intensity Trends

Glencore–Merafe’s ore intensity, UG2 production, and mineral waste trends are shown in Figure 2. Ore intensity is defined as the amount of chromium ore required to manufacture a unit of ferrochrome. The mineral waste produced per unit of ferrochrome produced is also shown. A decrease in ore intensity can be observed during the period, except between 2012 and 2014. The decrease has been attributed to the effect of several pellet and sintering projects as well as the use of more efficient furnace technology. The increase in 2014, on the other hand, was stated to be caused by the starting up of the Lion II furnaces, which were stated to require an above-average ore input as well as a non-optimal supply of UG2 chromium concentrate, alluded to in the previous section [31]. An increase in ore intensity was also cited by IFML [30] whereby strike action in the PGM industry disrupted the chrome concentrate supply to the ferrochrome industry. This led to the shutting down and restarting of furnaces and therefore increased ore demand requirements in those periods. In addition, chromite concentrate pellets composition is more easily controlled in comparison to concentrated ore which has not been agglomerated. This makes pellets superior for furnace operations as it enables a consistent furnace charge (FP1-EM and FP1-WM, personal communication 3 July 2018). Hence, the hampered supply of UG2 concentrate resulted in inconsistent non-optimal production conditions.
The ore intensity decreased by 20% between 2007 and 2017. The trendline confirms the intensity decrease, whilst the strong correlation supports this observation. In the same period, industry production was observed to increase. FP1-EM and FP1-WM (Personal communication 3 July 2018), as well as FP2-WM (personal communication 23 August 2018), confirmed the decrease in the ore intensity trend to be indicative of the industry; however, other companies may have higher overall intensities. Regarding Glencore–Merafe, the ore intensity decrease has been attributed to the commissioning of the Lion project, which uses Premus furnace technology, whilst the industry intensity decreases can be attributed to the application of pelletising and sintering technology. Premus technology used in the Lydenburg and Lion operations accounts for at least 40% of Glencore–Merafe’s smelting capacity [37].
The increased application of sintered pellet technology has occurred concurrently with the PGM UG2 chromium concentrate production increase. From Figure 2, a significant increase of 221% in UG2 chromium concentrate is noted over the period studied, averaging 15% p.a. There was a decrease in 2008, which was most likely due to the global financial crisis. The other observed decrease was in 2014 and was due to the strike action in the PGM industry limiting the supply. The increase in UG2 concentrate production was correctly anticipated by Cramer et al. [16] based on the combined cost of purchasing concentrate, pelletising and sintering the concentrated ore being cheaper for ferrochrome producers than incurring the combined costs of LG6 and MG1/2 chromite mining, beneficiation, and then pelletising and sintering. The lower production cost of using UG2 concentrate was instrumental in this regard: FP1-EM and FP1-WM (personal communication 2018, July 3) confirmed that the chromium concentrate was cheaper and that this had led to the industry increasing the sintering and pelletising capacity.
Chromium concentrate sourced from the PGM industry can be characterised as fine and therefore requiring agglomeration through sintering and pelletising prior to charging in furnaces for ferrochrome production. This makes it ‘lumpy’, which is advantageous for ferrochrome production [19]. As was stated previously, sintering and pelletising improve the cold and the hot strength, which results in improved efficiencies and fewer handling material losses. Section 3.4 discusses some of the projects in the industry that have led to improvements in intensities.
It follows that the mineral waste produced should have decreased in the same period. According to Figure 2, the mineral waste intensity increased two-fold from 2007 to 2009 and then decreased over three-fold through to 2013. Thereafter, there were fluctuations which were immaterial in comparison. The starting up of the Lion I furnaces and the shutting down and starting up of other furnaces during the 2007/8 financial crisis were stated to have significantly contributed to the surge in mineral waste produced. Moreover, differences in magnitude have been attributed largely due to changes in mineral waste classification and accounting (CF2-Dir, personal communication 9 October 2018). FP2-SS (personal communication 16 July 2018) stated that FP2 only monitors and records data on slag produced and not beneficiation waste such as tailings; however, it confirmed that starting up furnaces requires larger volumes of raw materials to produce a unit of ferrochrome in comparison to normal production conditions.
Be that as it may, when comparing the ore intensity and the mineral waste intensity in Figure 2, it can be observed that the mineral waste was greater than the ore intensity for the period studied. It has been noted in Section 1 that most South African ferrochrome producers have their own chromite mines, beneficiation, and furnace facilities. Furthermore, some of the chromite mined and beneficiated is sold and does not contribute to the companies’ ferrochrome production. FP1-EM and FP1-WM (personal communication 3 July 2018) confirmed that about 40% of mined chromite is sold, resulting in only 60% being used for ferrochrome production. It can be deduced that the mineral waste trend in Figure 2 would require additional information to determine the mineral waste produced directly from ferrochrome production in South Africa.
Therefore, the mineral waste as shown in Figure 2 also includes waste produced on-site from concentrated ore sold by the company but was not processed by the company to produce ferrochrome. Hence, the gains attained in ore intensity will not be reflected by the mineral waste accounting methods currently used by the company. Figure 3 shows the typical mineral waste produced by the Glencore–Merafe venture (formerly Xstrata–Merafe).
Figure 3 can be used to illustrate the scope of mineral waste resulting from South African ferrochrome producers’ operations and the necessity of additional information to determine mineral waste from ferrochrome production. The required information was not available to the authors during the completion of this study.

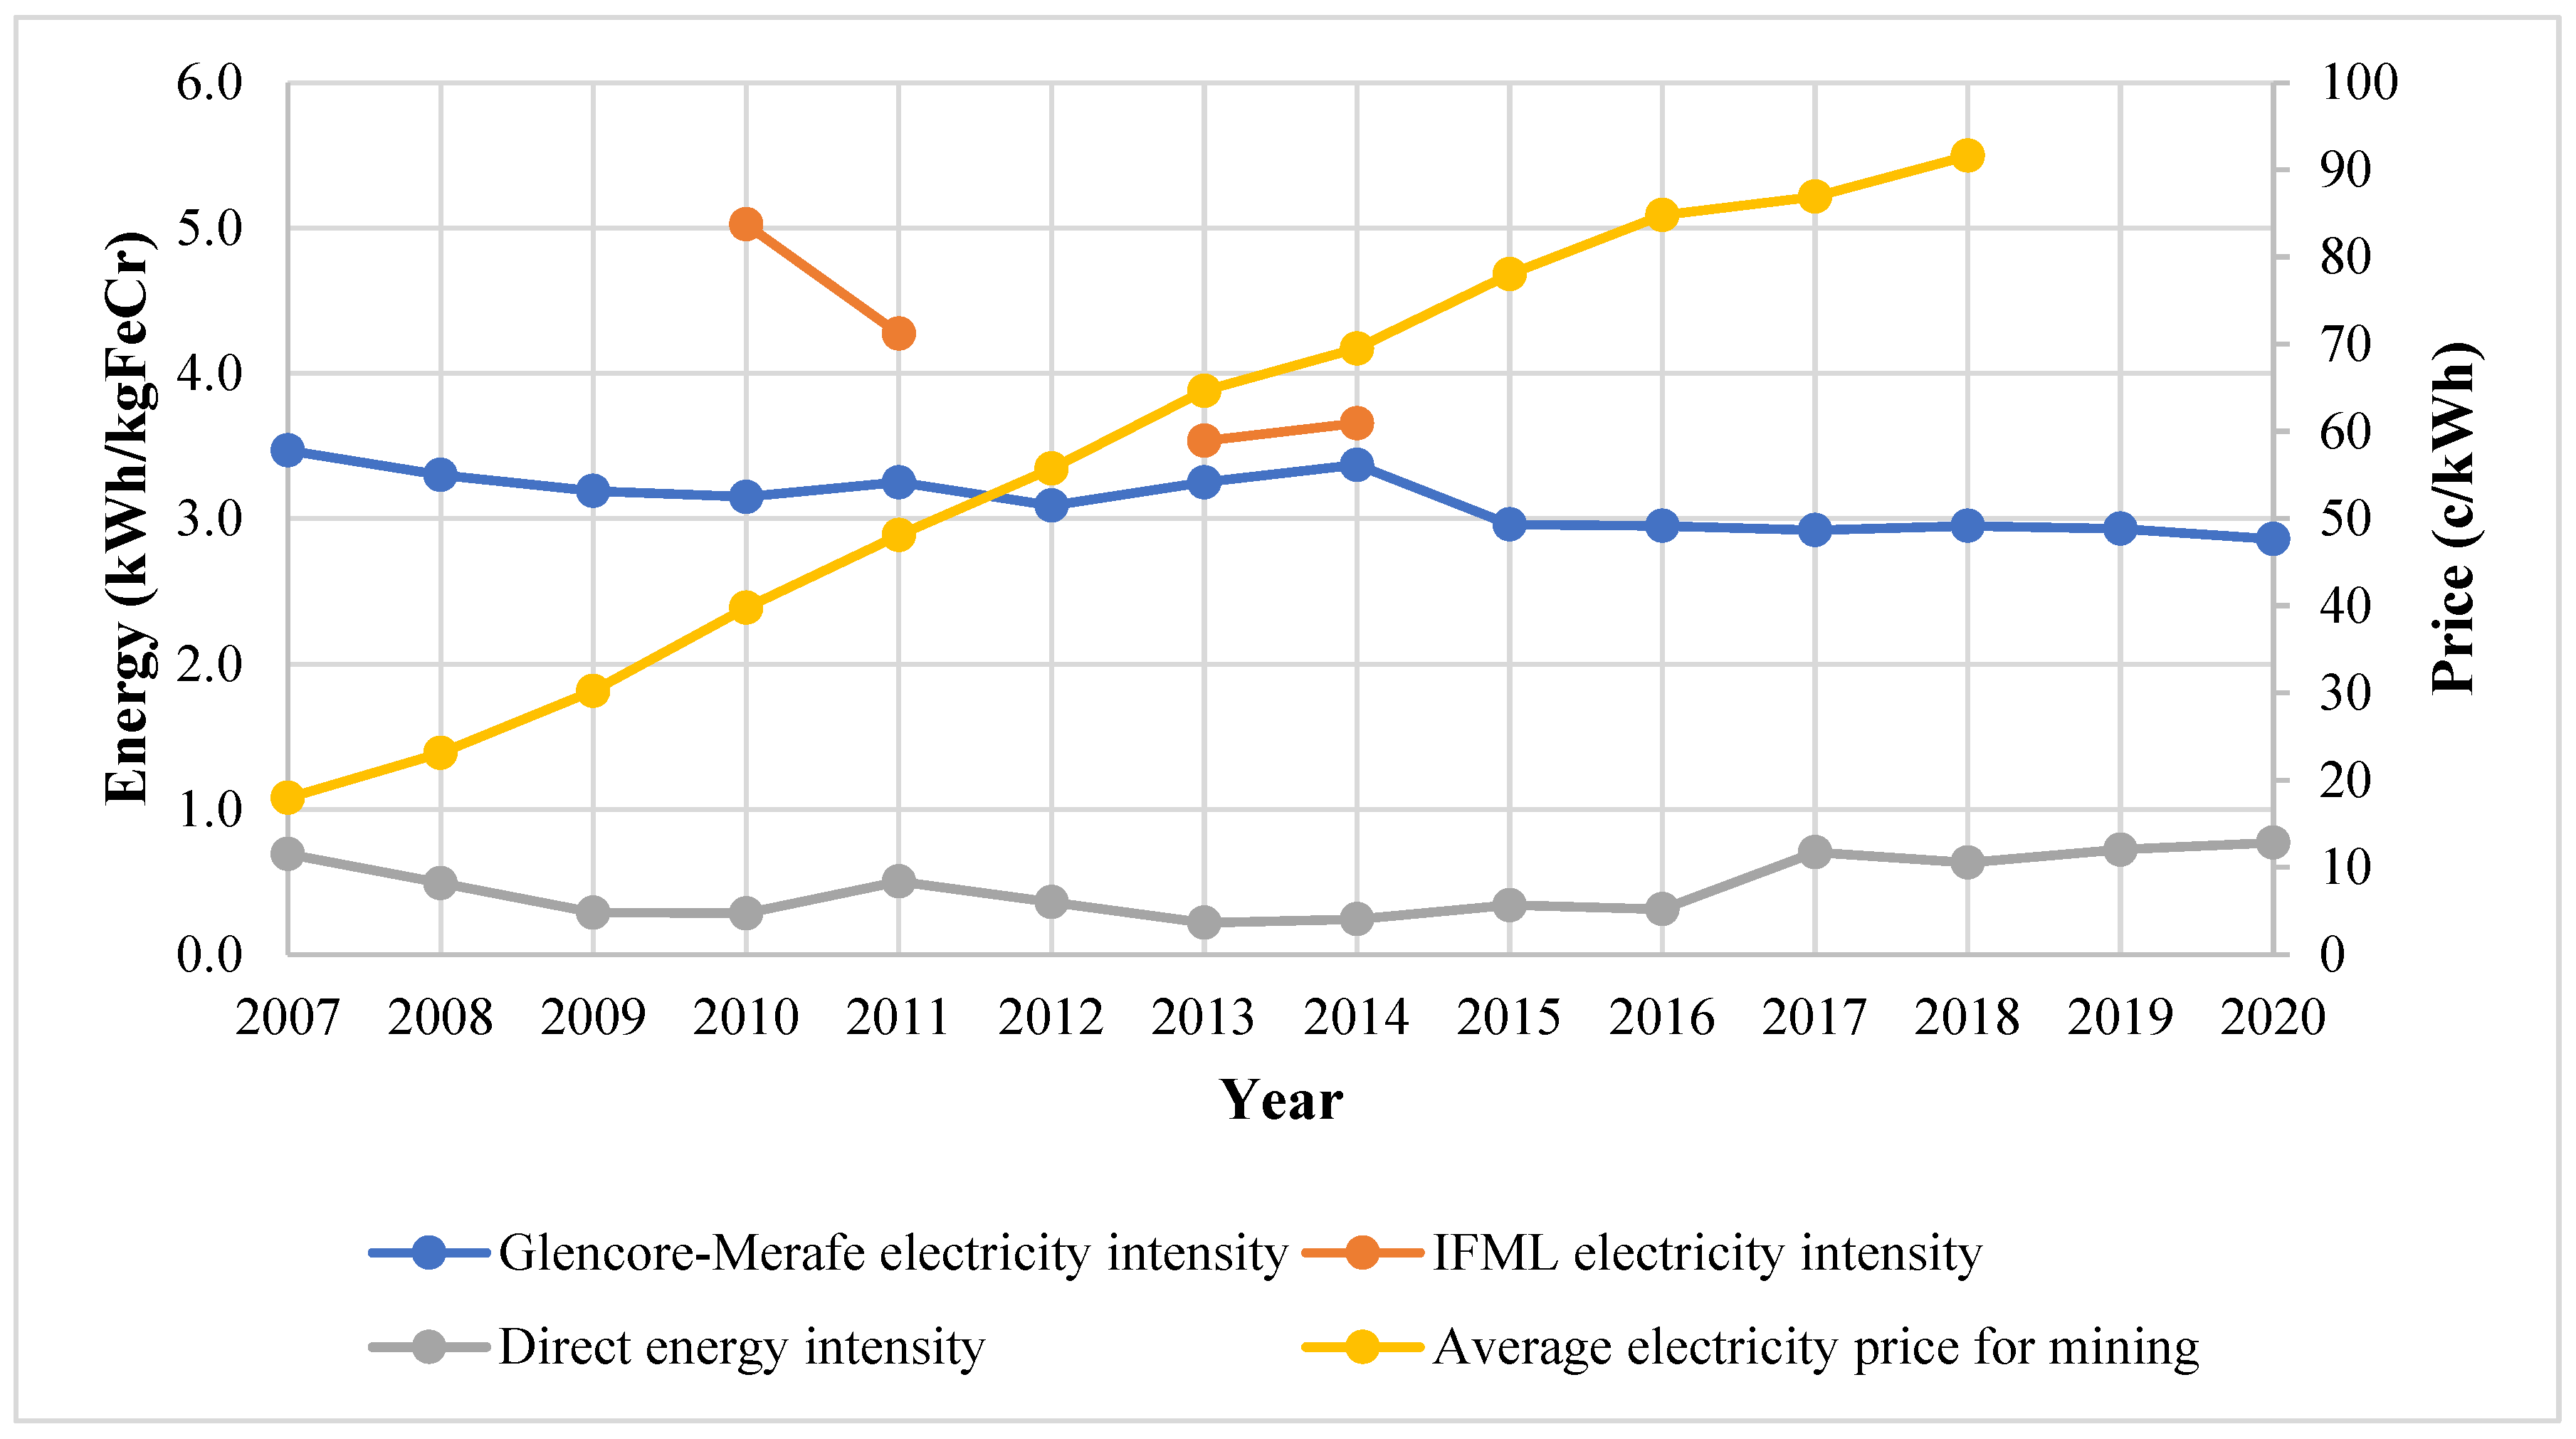
3.3. Energy Intensity Trends

The electricity and direct energy intensities and the average annual price of electricity sold to mining operations have been compiled as shown in Figure 4. Direct energy sources include coal, anthracite, and diesel. It is worth noting that the gaseous emissions from the furnaces have a significant carbon monoxide concentration and can be burned in the sintering operation or in gas turbines to supplement energy generation.
The electricity energy intensity is 3–5 times greater than the direct energy intensity. There is a discernible electricity intensity decrease for Glencore–Merafe, from 3.47 to 2.86 kWh/kg FeCr (17.6%) between 2007 and 2020. This was due to the improvements in ore preparation and the improved furnace technology discussed in Section 3.4. The average price of electricity sold to mining activities by Eskom [38] can be observed to have increased significantly from 17.99 to 91.64 c/kWh (400% change in nominal terms), which incentivised projects aimed at reducing electrical energy intensity.
IFML’s electricity intensity was noted to be greater than Glencore–Merafe’s. This may be an effect of production scale and the use of different production technologies (e.g., Premus furnaces vs. conventional smelters) or production routes. FP1-EM and FP1-WM (personal communication 3 July 2018) confirmed that the production scale influences the energy intensity and greater ferrochrome production volumes resulted in lower energy intensities. FP2-WM (personal communication, 23 August) concurred and further stated that the ferrochrome recipe also affected the intensity.
Between 2010 and 2011, there was a notable decrease of 16% in IFML’s electricity intensity which was due to the installation of cogeneration equipment and consequently decreasing electricity demand from the national grid. During cogeneration, hot furnace gas from chromite reduction is combusted owing to its high calorific value to produce electricity. It was noted that the equipment was not operating optimally at the time due to furnace leaks [35]. There was an increase in the electricity intensity of 0.12 kWh/kg FeCr for both IFML and Glencore–Merafe in 2014. The strike action by the PGM industry was cited as the main reason by both companies [30,31]. At the same time, Glencore was also starting the Lion II plant [31].
Gediga and Russ [15], who conducted a study for the International Chromium Development Association (ICDA), compared ferrochrome electrical intensities for several producers, including some from South Africa. In the study, electrical intensity varied between 3.08 and 4.85 kWh/kg FeCr and was largely dependent on the technology used. Open furnaces had an intensity of 4.23 ± 0.32 kWh/kg FeCr whilst closed furnaces with preheated ore had an intensity of 3.32 ± 0.24 kWh/kg FeCr and closed furnaces without preheated ore had an intensity of 4.38 ± 0.48 kWh/kg FeCr. The closed furnace enables the use of hot furnace gas to preheat ore. Pan [17] estimated a range of 3.3–3.8 kWh/kg FeCr for varying South African ore types. The reported electrical intensities by the companies are mostly within the ranges stated in these two studies, though since 2015, Glencore–Merafe has consistently performed better than these benchmarks. This excludes the period when IFML’s furnace roofs were leaking, causing non-optimal production. Hence, the effect of technology and ore can significantly affect electrical intensities.

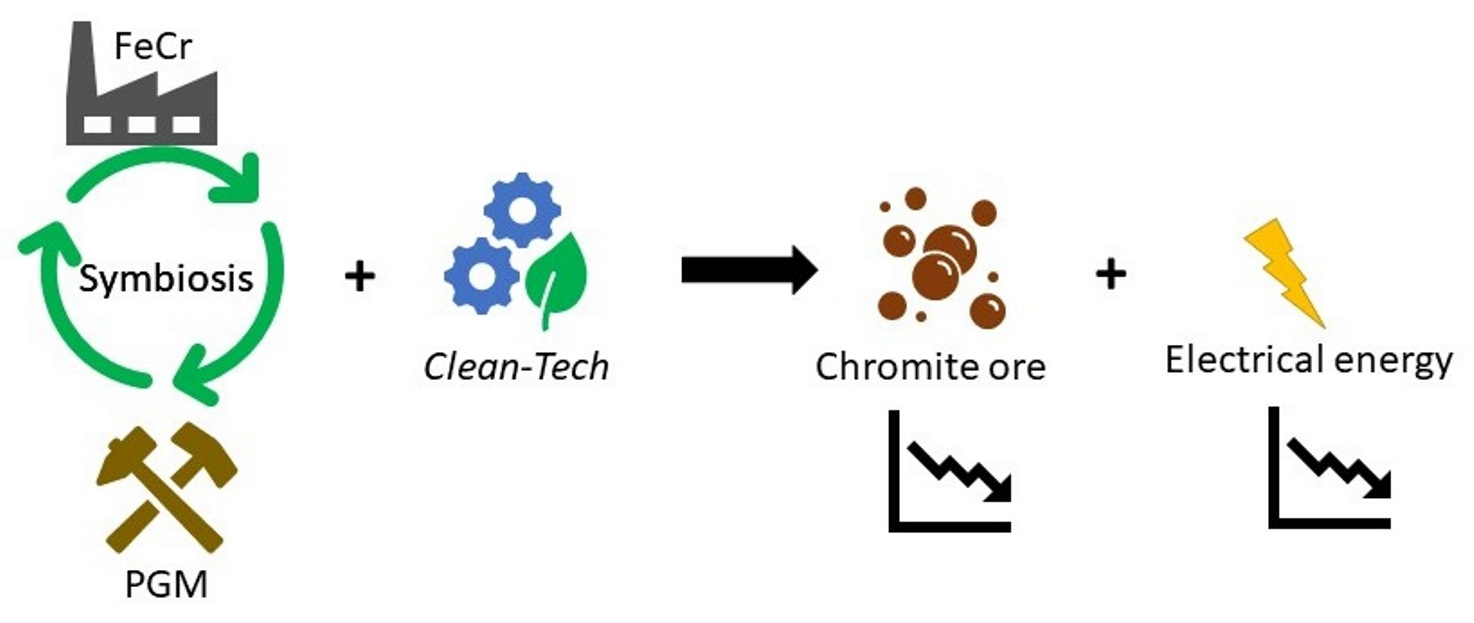
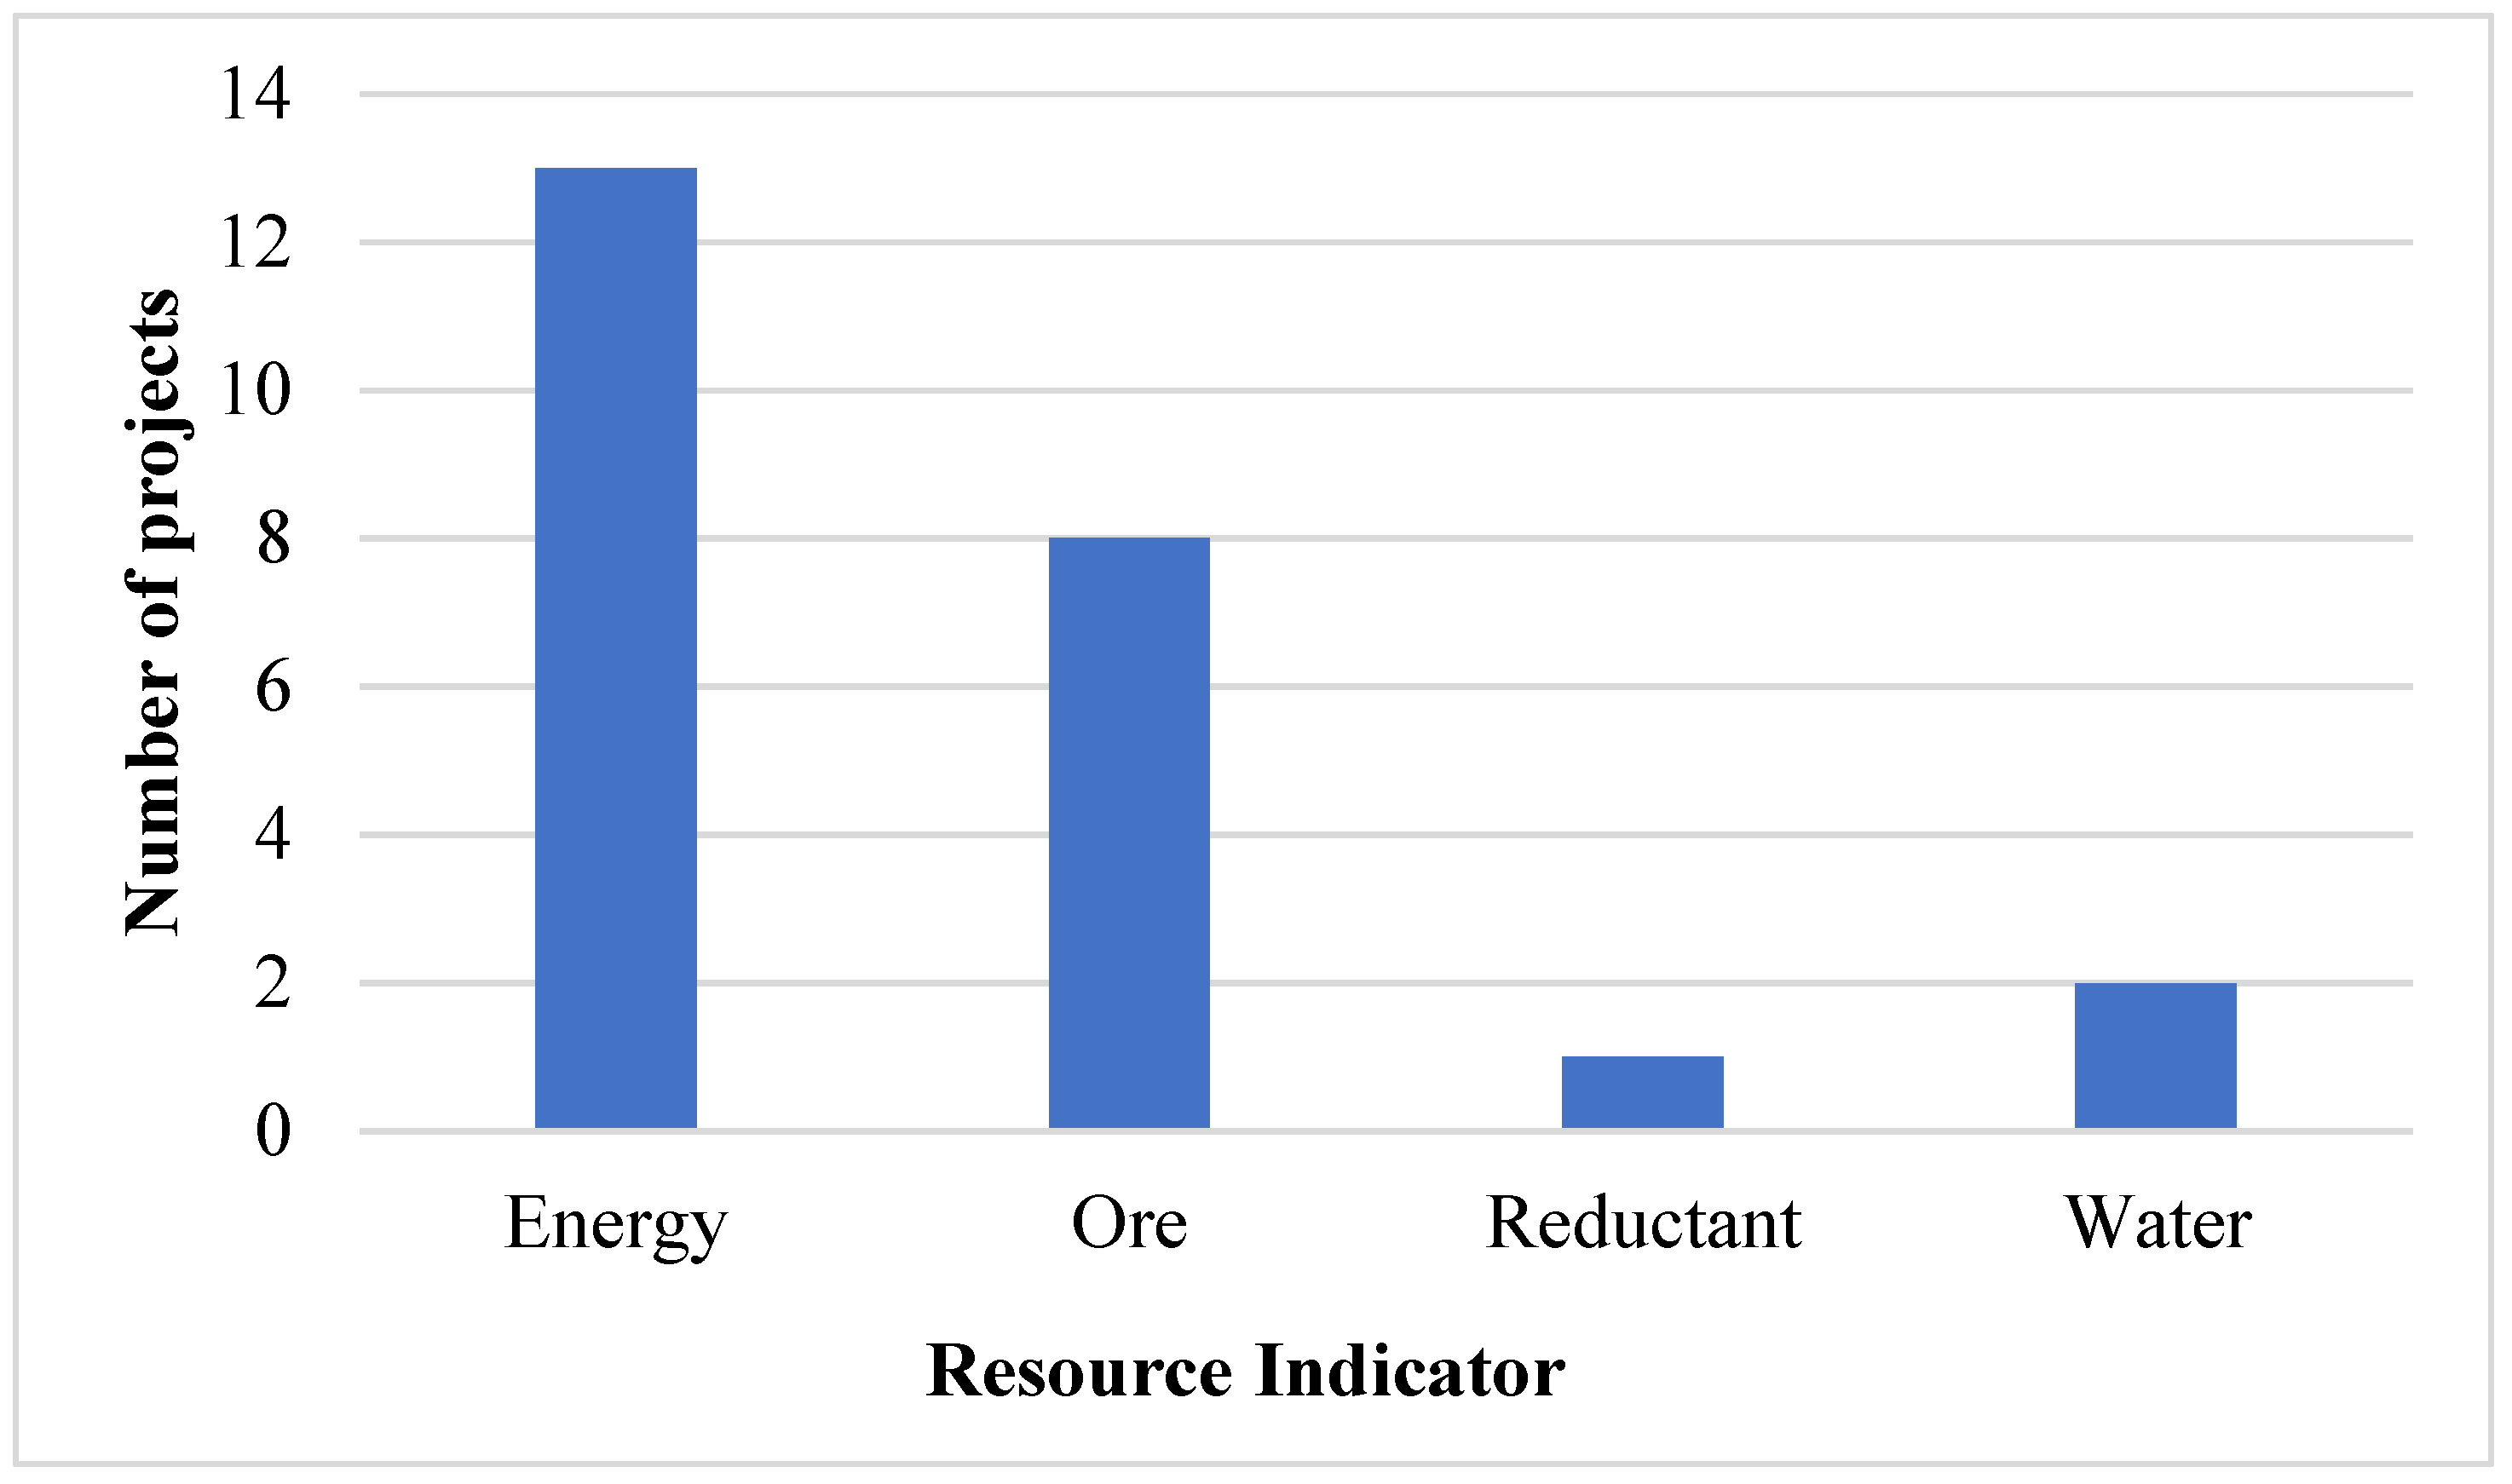
3.4. Industry Projects

Several operational changes in the industry affecting varying intensities have been identified and referred to as projects as depicted in Figure 5. These include the application of new technologies and changing operating routes which have resulted in changes in the intensities.
These projects are likely not exhaustive of change in the industry, but rather represent those identified by the authors from information in the public domain. Energy intensity projects, including Hernic Chrome’s conversion of two semi-open furnaces to closed furnaces in 2016 and IFML’s cogeneration project, were the most common, followed by those relating to ore intensity such as ASA Metal’s 2009 pelletising sintering plant and Glencore–Merafe’s 2007 Bokamoso pelletising and sintering plant. The two notable water intensity projects were the lining of water dams and canals by Glencore–Merafe and the installation of a water treatment plant by Samancor in 2010. The focus on energy was expected, as the increasing cost of electricity has been a concern regarding the profitability of the South African ferrochrome industry.
It is worth noting that some projects improved more than one aspect simultaneously. The Glencore Lion Project, which included the construction of two Premus submerged arc furnaces and pelletising and sintering facilities was reported to require less reductant and about 37% less energy per unit of ferrochrome in comparison to conventional furnaces [18]. The Premus furnace is a proprietary furnace regarded to be the world’s most cost-efficient and energy-efficient furnace [28]. Glencore–Merafe’s Bokamoso and Tswelopele sintering and pelletising plants have a collective capacity of 1.8 Mt/year of sintered pellets, whilst the Premus furnace capacity accounts for about 50% (1.1 Mt/year) of the company’s smelting capacity. An improvement of 21% in ore intensity and 11% in energy intensity were reported in the company’s Rustenburg operation after the installation of the Tswelopele pelletising and sintering plant. Figure 6 shows the cited developments that have occurred at Glencore–Merafe’s operations as well as the energy and ore intensities.
The events are shown as symbols; L1 and L2 are Lion I and II, which include Premus furnaces, whilst BK and TS are the Bokamoso and Tswelopele pelletising and sintering plants. The effect of the operational changes can be observed immediately in some instances, such as the Tswelopele plant, whilst other effects are not immediately evident due to external factors, such as the 2007/8 financial crisis and the 2014 PGM strike action.
In 2020, the industry announced plans to use improved efficiencies including the installation of 750 MW of self-generation energy sourced from solar, wind, and cogeneration [38]. Swedish Stirling, a company that supplies the PWR BLOK 400-F consisting of 14 Stirling engines, reported that it had received 241 orders for the engines, including orders from Samancor and Glencore. The engines use heat from furnace emissions to produce electricity with a 400 kW power rating and are stated to reduce smelting electricity demands from the national power utility by up to 15%. If regulatory limitations are overcome, the technology has the potential for mass application given the scalable modular design [39].

3.5. Ore Intensity

Ore intensity improvement projects have largely been due to pelletising and sintering endeavours. The projects include greenfield and brownfield projects [20]. This was largely due to the limited supply of lumpy ore and the advantages of sintered pellets with regard to reduced ore intensity and reduced electricity intensity. Furthermore, sourcing chromium concentrate from the PGM industry is cheaper for production than mined chromite. The use of UG2 PGM chromium concentrate by the ferrochrome industry has been the impetus for industrial projects such as the K1 and the K1.5 facilities in Kroondal near Rustenburg, South Africa. K1.5 is adjacent to K1, as depicted by the satellite image of the two facilities in Figure 7.
K1 is a PGM ore concentration plant operated by Sibanye Stillwater depicted by the area under the yellow square in Figure 7. K1 receives run-of-mine UG2 ore and beneficiates it to be used for further PGM processing. The tailings produced are then transferred to K1.5, which is a chromium concentration plant under the red square in Figure 7. The tailings from K1 typically have a Cr2O3 concentration of 20.5%. Once the tailings are concentrated in K1.5, the Cr2O3 concentration can reach 40%. The concentrate is then transported to a ferrochrome processing plant, where it is pelletised and sintered prior to being charged into a smelter. Projects such as these are an example of the acceptance of UG2 concentrate in ferrochrome production. The K1 concentration facility started operations in 1999 [41]; however, the research into producing chrome concentrate on the facility began around 2003 [42].
The use of K1′s waste stream (tailings) as feed into K1.5 to produce chromium concentrate can be regarded as a case of industrial symbiosis, i.e., the exchange of by-products and/or utilities by traditionally separate but co-located industries for a mutually beneficial advantage [43]. K1 receives financial gain and minimises the waste to be managed, whereas K1.5 receives raw material without mining. Economic or financial gain is considered a key feature of industrial symbiosis [43].
Anglo-American Platinum’s [41] business strategy plans include the expansion of chromium concentration facilities. FP1-EM and FP1-WM (personal communication 3 July 2018) stated that the industry has increased pellet use to attain higher efficiencies. FP2-WM (personal communication, 23 August) mentioned that FP2′s pellet production capacity had been increased to about 77% of the full production capacity. Furthermore, to attain better energy intensities, it was becoming necessary for the industry to use sintered pellets (FP2-WM, personal communication, 23 August). These developments may be related to the proposed plans by the South African government to support the local ferrochrome industry, i.e., by the introduction of a chrome ore export tax [44]. This is aimed at limiting the export of chrome ore prior to reduction into ferrochrome.

4. Discussion

4.1. Ore Grade and Its Relation to Ore Intensity

Trends in the mined chromite ore grade were not quantified in the results presented here, though all indications are that these continued a longer-term decline. Indeed, FP1-EM and FP1-WM (personal communication 3 July 2018) confirmed the increased use of cheaper chromite concentrate, which also has a lower Cr2O3 concentration, which would be expected to increase the ore intensity. Contrary to this, the ore intensities were shown to have decreased by 20%, primarily driven by an increase of 221% in the production of PGM chromium concentrate from PGM tailings.
There was no evidence found by the authors to suggest that new high-grade chromite had become available. A study to collate chromite ore grade trends should provide valuable corroboration for our work.
Beyond this notable increase in UG2 chromium concentrate being produced for the ferrochrome industry, changing technology and changes in operating conditions have been established as additional causes of the decrease in ore intensities. It was noted in Section 2 that the concentrate is usually pelletised and sintered, which results in reduced chromium losses before and during smelting, thus increasing chromium recoveries. In addition, concentrate is easier to control in terms of pellet composition which is more consistent and thus easier to process (FP1-EM and FP1-WM, personal communication 3 July 2018).
Ferrochrome producers were observed to have completed at least eight pelletising and sintering projects in the period reviewed. This uptake of sintering and pelletising technology has enabled producers to consume an increased amount of chromium concentrate from the PGM industry. In addition, purchasing chromium concentrate and then pelletising and sintering it is cheaper than mining LG6 and MG1/2 chromite seams, pelletising, and sintering. Thus, the decrease in ore intensity can be attributed to the increased use of PGM chromium concentrate supported by sintering and pelletising technology, leading to higher quality ore input and, consequently, higher metallurgical efficiencies. Ultimately, higher metallurgical efficiencies led to decreased ore intensity.
The Tswelopele project was reported to have resulted in a 21% reduction in Glencore–Merafes’s Rustenburg operations. The industrial symbiosis project in Kroondal between the PGM and ferrochrome industries is evidence of the acceptance and development of sintering and pelletising technology. Other companies, such as Anglo-American Platinum [41] (a PGM production company) have made commitments to investing in the expansion of PGM tailings concentration for ferrochrome production. Furthermore, the consulted professionals confirmed that this was an industry trend that had become necessary to manage costs. Therefore, due to the scarcity of lumpy ore, ferrochrome producers either opt for pelletised chrome concentrate or pelletised friable ore.

4.2. Energy Intensity

For the mining of chromite followed by smelting to produce ferrochrome, the electrical intensity is 3–5 times greater than the direct energy intensity. In the study period, there was no discernible net change in direct energy intensity even though there were fluctuations. With regard to electricity intensity trends, there was a noticeable decrease of about 17.6% in Glencore–Merafes’s operations, whilst IFML showed a decrease of 27% over the years for which this metric was reported.
Several factors, including ore quality (fine or lumpy), shutting down and starting up furnaces, and the furnace technology used, affected the electricity intensity trends. The ore grade decreasing could only be inferred. Starting up furnaces significantly increased energy intensity; however, it was not an ongoing process. The industry has been receiving an increasing volume of PGM chromium concentrate, and accordingly, increased the use of sintered pellets and benefits from associated energy intensity reduction, as was evident in Figure 5 and Figure 6. Furthermore, the operational changes across the industry have been confirmed by the experts consulted. The extent of the impact of the PGM industry on the ferrochrome industry can be seen during the 6-month-long 2014 strike, when there was a notable increase in the electricity intensity of both IFML and Glencore–Merafe. This was attributed to the strike action in the PGM industry causing a shortage in the supply of chromium concentrate.
In addition, energy intensity reduction projects were found to be the most common due to the strongly increasing price of South African electricity. Electricity costs constitute about 40% of production costs and therefore have a significant impact on profitability. The availability of hot furnace gas for preheating, pre-reduction, cogeneration, and at times heat for sintering translated into reduced energy intensities in the industry. IFML experienced a decrease of 16% in electricity intensity between 2010 and 2011 after operating a cogeneration plant at 65% capacity [29]. Glencore–Merafe completed the Lion project, which has been stated to include Premus furnace technology considered to be the most energy efficient in the world. The cumulative use of sintered pellets, the use of flue gas, and innovative furnace technology have contributed to the reduction in electricity intensity in the industry. In addition, the closure of semi-open furnaces by Hernic Ferrochrome demonstrates the significant advantage that closed furnaces have over open furnaces with regard to energy intensity.

5. Conclusions

From 2007 to 2020, the South African ferrochrome industry increased production by 18.9%, whilst the amount of chromite ore mined per ton of ferrochrome produced has reduced by 20%. These efficiency improvements have partly been enabled by the emergence of industrial symbioses with platinum-group metals mining companies, who provide chromium-rich tailings for beneficiation, pelletisation, and sintering for smelting by ferrochrome producers. Improvements in ore quality in the form of increased cold and hot strength have resulted in higher metallurgical efficiencies. The electrical energy intensity decreased by 17.6% over the review period. The increased use of closed furnaces, enabling the use of furnaces off gas for preheating, pre-reduction, and sintering has enabled these gains without increasing direct energy use significantly. In addition, the cogeneration of electricity from furnace gases has also contributed to the reductions in electricity intensity. Contrary to the expected increase in resource intensity due to declining ore grades, this industry has become more resource-efficient owing to it embracing industrial symbiosis, cleaner technology, and cleaner production methods.

Supplementary Materials

The following supporting information can be downloaded at: https://www.mdpi.com/article/10.3390/min13010044/s1, Table S1: Summary of similar previous studies reviewed to guide this study.

Author Contributions

Conceptualization, H.v.B. and R.D.; methodology, H.v.B. and R.D.; validation, R.D.; formal analysis, R.D.; investigation, R.D.; resources, H.v.B.; writing—original draft preparation, R.D.; writing—review and editing, H.v.B.; visualization, R.D.; supervision, H.v.B.; project administration, H.v.B.; funding acquisition, H.v.B. All authors have read and agreed to the published version of the manuscript.

Funding

This research was funded in part by the African Development Bank under grant no. SA_ZA_5500155009952, as part of the operation to generate knowledge and skills for sustainable mineral resource development in Africa, executed by the Minerals-to-Metals initiative at the University of Cape Town.

Data Availability Statement

Most of the data were sourced from company annual reports which have been referenced, supported by the contributions of industry experts as detailed in the article.

Acknowledgments

The authors wish to acknowledge and thank the reviewers and industry experts for their contributions towards the completion and publication of this article. The authors also wish to acknowledge and thank the support and contributions of colleagues, family, and friends.

Conflicts of Interest

The authors declare no conflict of interest.

References

  1. Gasik, M.I. Technology of chromium and its ferroalloys. In Handbook of Ferroalloys; Butterworth-Heinemann: Oxford, UK, 2013; pp. 267–316. [Google Scholar]
  2. Azapagic, A. Developing a framework for sustainable development indicators for the mining and minerals industry. J. Clean. Prod. 2004, 12, 639–662. [Google Scholar] [CrossRef]
  3. Ekins, P.; Hughes, N.; Brigenzu, S.; Arden Clark, C.; Fischer-Kowalski, M.; Graedel, T.; Hajer, M.; Hashimoto, S. Resource Efficiency: Potential and Economic Implications; Report of the International Resource Panel; United Nations Environment Program (UNEP): Paris, France, 2016. [Google Scholar]
  4. IIED. Breaking New Ground: Mining, Minerals, and Sustainable Development; Earthscan: London, UK, 2002. [Google Scholar]
  5. Laurence, D. Establishing a sustainable mining operation: An overview. J. Clean. Prod. 2011, 19, 278–284. [Google Scholar] [CrossRef]
  6. Spuerk, S.; Drobe, M.; Lottermoser, B.G. Evaluating resource efficiency at major copper mines. Miner. Eng. 2017, 107, 27–33. [Google Scholar] [CrossRef]
  7. Mudd, G. Global trends in gold mining: Towards quanitifying and resource sustainability? Resour. Policy 2007, 32, 42–56. [Google Scholar] [CrossRef]
  8. Calvo, G.; Mudd, G.; Valero, A.; Valero, A. Decreasing ore grades in global metallic mining: A theoretical issue or a global reality? Resources 2016, 5, 36. [Google Scholar] [CrossRef] [Green Version]
  9. Mudd, G.M. Sustainability and mine waste management—A snapshot of mining waste issues. In Proceedings of the Waste Management & Infrastructure Conference, Melbourne, Australia, 25 February–1 March 2007. [Google Scholar]
  10. Glaister, B.J.; Mudd, G.M. The environmental costs of platinum–PGM mining and sustainability: Is the glass half-full or half-empty? Miner. Eng. 2010, 23, 438–450. [Google Scholar] [CrossRef]
  11. Mudd, B.G.M. Sustainability reporting and the platinum group metals: A global mining industry leader? Platin. Met. Rev. 2012, 56, 2–19. [Google Scholar] [CrossRef]
  12. Northey, S.; Haque, N.; Mudd, G. Using sustainability reporting to assess the environmental footprint of copper mining. J. Clean. Prod. 2013, 40, 118–128. [Google Scholar] [CrossRef]
  13. Murthy, Y.R.; Tripathy, S.K.; Kumar, C.R. Chrome ore benenficiation challenges & Opportunities—A review. Miner. Eng. 2011, 24, 375–380. [Google Scholar]
  14. Nafziger, N.H. A review of the deposits and beneficiation of lower-grade chromite. J. S. Afr. Inst. Min. Metall. 1982, 82, 205–226. [Google Scholar]
  15. Gediga, J.; Russ, M. Life Cycle Inventory (LCI) Update of Primary Ferrochrome Production; International Chromium Development Association: Leinfelden-Echterdingen, Germany, 2007. [Google Scholar]
  16. Cramer, L.A.; Basson, J.; Nelson, L.R. The impact of platinum production from UG2 ore on ferrochrome production in South Africa. J. S. Afr. Inst. Min. Metall. 2004, 104, 517–527. [Google Scholar]
  17. Pan, X. Effect of South Africa chrome ores on ferrochrome production. In Proceedings of the International Conference on Mining, Mineral Processing and Metallurgical Engineering, Johannesburg, South Africa, 15–16 April 2013; pp. 106–110. [Google Scholar]
  18. Basson, J.; Curr, T.R.; Gericke, W.A. South Africa’s Ferro Alloys Industry-Present Status and Future Outlook; Macmillan India: New Delhi, India, 2007. [Google Scholar]
  19. Basson, J.; Daavittila, J. High carbon ferrochrome technology. In Handbook of Ferroalloys; Butterworth-Heinemann: Oxford, UK, 2013; pp. 317–363. [Google Scholar]
  20. Neizel, B.W.; Beakes, J.P.; van Zyl, P.G. Alteration of Chrome-to-Iron in Chromite Ore by Chlorination; North-West University: Potchefstroom, South Africa, 2010. [Google Scholar]
  21. Mc Dougall, I. Ferroalloys processing equipment. In Handbook of Ferroalloys; Butterworth-Heinemann: Oxford, UK, 2013; pp. 83–138. [Google Scholar]
  22. Dawson, N.F.; Edwards, R.I. Factors affecting the reduction rate of chromite. MINTEK 1987, 6, 12–19. [Google Scholar]
  23. Steele, F. Event History Analysis; Centre for Multilevel Modelling, Graduate School of Education, University of Bristol: Bristol, UK, 2005. [Google Scholar]
  24. Moorcroft, M. Tata Steel KZN to Pay Back the Money; Zululand Observer: Empangeni, South Africa, 2016. [Google Scholar]
  25. Pastour, D. Chrome and Ferrochrome Markets Recent Trends & Challenges; UNICHROME: Paris, France, 2018. [Google Scholar]
  26. IFML. Annual Financial Report of the Year Ended 30 June 2015. 2015. Available online: https://www.ifml.com/_/media/Files/I/International-Ferro-Metals/results-and-presentations/ifm-fy2015-annual-report.pdf (accessed on 16 April 2017).
  27. Merafe Resources. Integrated Annual Report 2009. 2009. Available online: http://www.meraferesources.co.za/pdf/reports/2009/ar_2009.pdf (accessed on 16 April 2017).
  28. Merafe Resources. Integrated Annual Report 2011. 2011. Available online: http://www.meraferesources.co.za/pdf/reports/2011/ar_2011.pdf (accessed on 16 April 2017).
  29. IFML. International Ferro Metals Limited Annual Report. 2011. Available online: http://files.investis.com/ifl/investor_centre/res_pres/ar_2011.pdf (accessed on 16 April 2017).
  30. IFML. Annual Report 2014. 2014. Available online: https://ifml.com/_/media/Files/I/International-Ferro-Metals/results-and-presentations/30-oct-2014-results.pdf (accessed on 16 April 2017).
  31. Merafe Resources. Integrated Annual Report 2014. 2014. Available online: http://www.meraferesources.co.za/reports/ir_2014/pdf/integrated-full-new.pdf (accessed on 4 April 2017).
  32. Merafe Resources. Integrated Annual Report 2015. 2015. Available online: http://www.meraferesources.co.za/reports/ir_2015/pdf/full-integrated.pdf (accessed on 16 April 2017).
  33. Merafe Resources. Integrated Annual Report 2017. 2017. Available online: http://www.meraferesources.co.za/reports/ir_2017/pdf/full-iar.pdf (accessed on 23 September 2017).
  34. Merafe Resources. Integrated Annual Report 2020. 2020. Available online: https://www.meraferesources.co.za/reports/ir-2020/pdf/full-integrated.pdf (accessed on 15 May 2021).
  35. Merafe Resources. Integrated Annual Report 2012. 2012. Available online: http://www.meraferesources.co.za/pdf/reports/2012/ar_2012.pdf (accessed on 16 April 2017).
  36. ICDA. Activity Report 2016. 2016. Available online: https://www.icdacr.com/download/ICDAActivityReport2016.pdf (accessed on 4 June 2018).
  37. Merafe Resources. Merafe Resource: Stakeholder Communication. 2017. Available online: https://www.meraferesources.co.za/pdf/presentations/2017/lion-site-visit.pdf (accessed on 16 April 2021).
  38. Cramer, M. Ferrochrome Commits to 750 MW Self-Generation, Junior Mining Support. 2020. Available online: https://www.engineeringnews.co.za/article/ferrochrome-industry-commits-to-750-mw-self-generation-junior-mining-support-2020-11-09/rep_id:4136 (accessed on 19 April 2021).
  39. Steyn, L. Business Day. 2021. Available online: https://www.businesslive.co.za/bd/companies/energy/2021-03-11-swedish-clean-tech-pilot-plant-opens-at-samancor-chrome/ (accessed on 19 April 2021).
  40. Google Maps. K1 and K1.5 Facilities, Rustenburg. 2019. Available online: https://www.google.com/maps/place/Kroondal+Mine/@-25.715034,27.3389868,779m/data=!3m1!1e3!4m5!3m4!1s0x0:0x8d6fb0233c94c1cb!8m2!3d-25.7136399!4d27.3193362 (accessed on 19 February 2019).
  41. Anglo-American Platinum. 2019. Available online: https://www.angloamericanplatinum.com/~/media/Files/A/Anglo-American-Group/Platinum/sustainability/platinum-tailings-storage-facilities-angloamerican-new.pdf (accessed on 20 January 2020).
  42. Nel, E.; Martin, C.; Raabe, H.; Theron, J. SGS Mineral Services: Media. 2004. Available online: https://www.sgs.com/-/media/global/documents/technical-documents/sgs-technical-papers/sgs-min-tp2004-02-pgm-ore-processing-at-ug-2-concentrator-in-south-africa.pdf (accessed on 4 April 2020).
  43. Jacobson, N.B. Industrial Symbiosis in Kalundborg, Denmark: A quantitative assessment of economic and environmental aspects. J. Ind. Ecol. 2006, 10, 239–255. [Google Scholar] [CrossRef]
  44. Reuters. 2020. Available online: Reuters.com/article/safrica-chrome-idUKL8N2HD30Y (accessed on 18 July 2021).
Figure 1. Ferrochrome production of South African companies between 2006 and 2020 [27,28,29,30,31,32,33,34].
Minerals 13 00044 g001
Figure 2. Chromite use and mineral waste for Glencore–Merafe; UG2 chromium concentrate production [32,33,34,35,36].
Minerals 13 00044 g002
Figure 3. Minerals waste classifications for Glencore–Merafe [27].
Minerals 13 00044 g003
Figure 4. Energy intensity trends and electricity price [28,29,30,33,35].
Minerals 13 00044 g004
Figure 5. Industry projects related to resource intensity between 2007 and 2017.
Minerals 13 00044 g005
Figure 6. Operational changes that have occurred observed from 2006 to 2017 at Glencore–Merafe ferrochrome sites [33]. L1 = Lion 1; BK = Bokamoso; TS = Tswelopele; L2 = Lion II.
Minerals 13 00044 g006
Figure 7. Satellite image of the K1 and K1.5 facilities at Kroondal, Rustenburg, South Africa [40].
Minerals 13 00044 g007
Table 1. Credentials of the South African ferrochrome industry experts that participated in this study.
Participant(s)Organisation TypeRole
FP1-EM and FP1-WMFerrochrome Producer 1Group Environmental Manager and General Works Manager
FP2-SSFerrochrome Producer 2Safety and Sustainable Development Head
FP2-WMFerrochrome Producer 2Production Manager
CF1-DirConsulting Firm 1Director
CF2-DirConsulting Firm 2Director
Table 2. Summary of South African ferrochrome producers in 2018 [24,25].
Company2006 Capacity (kt/Year)2020 Capacity
(kt/Year)
Glencore Merafe (Xstrata)16202340
Samancor Chrome Limited (Samancor)12002300
Tata KZN150150
Afarak
Includes Mogale alloys processing plant
110110
Hernic Ferrochrome420Acquired by Samancor
International Ferro Metals (IFML)267Acquired by Samancor
ASA Metals
(Newco)
410Acquired by Samancor
Assmang Chrome300Idle since 2012
Total South African capacity41744895
Disclaimer/Publisher’s Note: The statements, opinions and data contained in all publications are solely those of the individual author(s) and contributor(s) and not of MDPI and/or the editor(s). MDPI and/or the editor(s) disclaim responsibility for any injury to people or property resulting from any ideas, methods, instructions or products referred to in the content.

