Abstract
The article presents the results of the first study stage aimed at analyzing the luminescent properties of the main and minor minerals composing the apatite–nepheline ores and host rocks in the deposits of the Khibiny rock massif (Kola Peninsula, Russia). The main purpose of the work was a search of a stable identification feature providing fast and safe determination of fluorapatite in the mineral mixture of apatite–nepheline ores and solving technological tasks, namely sampling the borehole walls in open pits. The first stage includes studies carried out on pure mono-fractions of four minerals occurring in fluorapatite deposits and possessing obvious luminescent properties: fluorapatite, nepheline, calcite, and sodalite. The authors have revealed luminescence spectra of these minerals and established correlation of their spectral characteristics with the literature data and their consistency. However, the high intensity of sodalite luminescence in a wide band can complicate identification of fluorapatite by the luminescence spectrum in many cases. Therefore, it is reasonable to use the color and intensity of luminescence rather than spectral characteristics.
1. Introduction
1.1. General Information on a Deposit
The Khibiny massif is one of the largest alkaline ultrabasic intrusions in the world. It includes giant fluorapatite deposits and is one of the principal suppliers of fluorapatite concentrate to the Russian and world markets. Its geological structure is considered in a huge number of works and is briefly presented in this paper [1,2,3].
The Khibiny massif is a series of ring intrusions (Figure 1). The most distributed rocks are foyaites, including khibinites and lavochorrites (identified by a number of researchers as foyaite’s varieties), which make up more than 70% of its volume. The foyaite intrusion is divided into two approximately equal parts by a ring intrusion of melteigite–urtites and apatite–nepheline rocks, accompanied by a peculiar variety of nepheline syenites with a high content of potassium and poikilitic microstructure—rischorrites (the so-called Central ring). Apatite–nepheline and titanite–apatite rocks, being the main sources of fluorapatite, are connected with melteigite–urtites. The lenticular apatite–nepheline ore bodies are several meters to 2 km long and up to 200 m thick; they occur in melteigite–urtites near the contact of the latter with the overlying richorrites. Apatite–nepheline ores are fine- to medium-grained rocks with fluorapatite content from the first percent to practically continuous apatite ore. The ores possess a large number of textural varieties—spotted, banded, lenticular, massive, reticular, etc. The main developers of the Khibiny apatite deposits are the Kirovsky branch of Apatit JSC (Joint-Stok Company, Murmansk area, Kirovsk city, Russia) and NWPC (North-Western Phosphorous Company, Murmansk area, Koashva town, Russia).
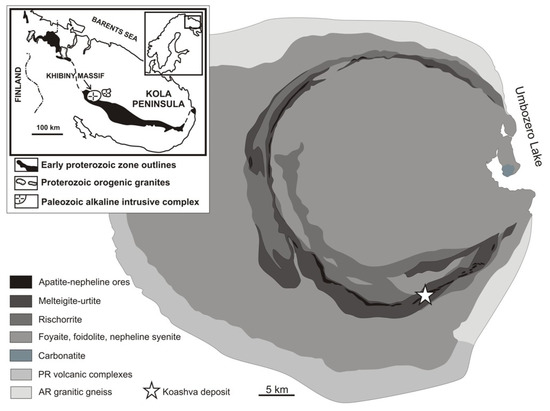
Figure 1.
Geology map of the Khibiny massif (modified from [1]).
1.2. Mining Design
Mining planning and design is implemented in software complexes that allow visualizing the location of ore bodies in the host rocks, assessing the qualitative and quantitative characteristics of ore, and planning mining operations. One of the main factors determining the effectiveness of mining planning, including excavation and loading operations, is the quality of information on the distribution of a useful component which is formed and corrected at all the operation stages: from exploration and drilling of exploratory boreholes for the deposit’s delineation to sampling drilling-and-blasting boreholes on a block being prepared for breaking. Figure 2 shows block models of drilling-and-blasting blocks illustrating the distribution of the useful component in the rock massif. The shades of grey of the single elements in the presented rock mass section (blasting block in the open-pit) characterizes P2O5 content.
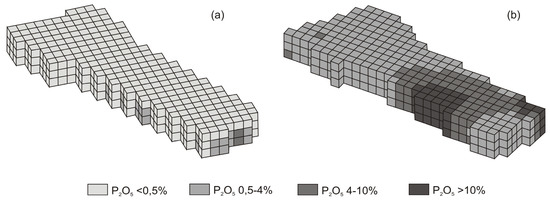
Figure 2.
Distribution of the useful component in the block model of a drilling-and-blasting block based on the data analysis of: (a) core drilling boreholes; (b) drilling cuttings.
The model of the drilling-and-blasting block, the distribution of the useful component determined by the data of core drilling (Figure 2a), mainly shows P2O5 content less than 0.5%, which is more than 92% of the block volume. The ore mass with such quality characteristics refers to the gangue and is sent to the dump. Poor ore, with P2O5 content up to 4%, occupies only 4% of the block, ordinary ores—about 2%, and rich ores are not presented at all. The use of drilling cuttings analysis results to estimate the distribution of the useful component on the block results in complete distribution of the component (Figure 2b). Most of the block (more than 50%) is represented by rock and poor ore with P2O5 content up to 4%, and the remaining part contains mainly crude (P2O5 content 4–10%) and rich (P2O5 content more than 10%) ores. The significant difference in the distribution of the useful component in the block (Figure 2) is not an isolated case. Such a situation is typical for the majority of operating blocks. It is difficult to say with certainty which of the information sources used most closely/realistically describes the distribution of the useful component in the studied rock mass section, and what data should be basis for the following operational decisions in planning transport-technological flows. In the first case, the accuracy of information on the distribution of the useful component is affected by the large distance between boreholes, namely the core drilling grid, as well as the sampling interval; in the second case, accuracy of information is influenced by the sampling methodology used for drilling cuttings sampling. The accepted sizes of a grid of detailed exploration boreholes are justified by the costs of geological exploration operations; grid densification is limited by the high cost and considerable time for sampling [4].
It has been established [5] that the geological borehole sampling distorts a picture of the real distribution of the useful component, namely, it underestimates the volume of rock inclusions, even at its minimum sampling interval, equal to 400 mm. The quantity of rock inclusions is one of the determining factors when choosing the technological measures providing the formation of the ore flow quality regulated by the dressing plant. The majority of mining enterprises, including open-pits of JSC “Apatit”, specify the boundaries and a location of ore bodies in the mined block on the basis of chemical analysis of drilling cuttings samples from blast-and-drilling boreholes.
The decrease in the level of reliability of information on the distribution of the useful component is determined by the influence of uncontrollable and controllable factors. The group of uncontrollable factors includes (i) natural factors associated with the heterogeneity of the strength characteristics of rocks comprising the studied block, presence of disturbed and fracture zones, and; (ii) weather conditions, including unstable wind conditions. The group of controllable factors contains the drilling cuttings sampling technique. Uncontrollable factors can cause uneven removal to the surface of drilling cuttings because of different rock hardness. For example, hardness factor according to Protodiakonov’s scale for spotty-banded apatite ore is 11, for urtite—15, for juvite—17, and for iolite—20. Correspondingly, different size of the drilling cuttings and its uncontrollable removal from the borehole head in constant wind and during gusts can also cause uneven release to the surface. Adopted sampling techniques with variations of drilling cuttings sampling point locations [6,7] provide a single value for the borehole—the average value of useful component content over the entire depth of the drilling-and-blasting borehole. It should be noted that the presence of uncontrollable factors complicates the sampling task: the formation of a representative sample for the studied borehole.
The task on increasing the reliability of information on the distribution of the useful component on the working block can be solved by using information obtained during the analysis of drilling-and-basting boreholes, namely the borehole walls. For example, for iron ore deposits, the solution is based on the presence of a stable feature—magnetic properties, allowing estimating the presence and content of iron by the value of magnetic susceptibility.
An example of successful application of interval sampling of boreholes with application of magnetic susceptibility logging is shown in [8], on the example of Lebedinsky Mining and Processing Combine. The paper presents the results of creation of geological 3D-models of blasting blocks based on measurement of iron contents in the borehole with frequency 10 cm. Application of interval sampling allowed the authors to interpret such objects complex for modeling, as “blind” dikes and hidden ore contacts with the host rock inside the block, as well as more accurately distinguish ore grades.
For apatite ores, such a feature can be the ability of fluorapatite to luminesce in interaction with various radiation types. The choice of this identification feature for the Khibiny apatite–nepheline ores (luminescence of the studied sample surface under the influence of X-ray radiation) is proved by high correlation between luminescence intensity and content of phosphorus pentoxide (P2O5) [5,9]. The Khibiny fluorapatite is enriched with rare-earth elements (up to 10–12%) [3,10], which is also favorable for luminescence observations [11]. The works [12,13,14,15,16,17] describe successful experience of fluorapatite X-ray luminescence application in lump preliminary processing. Analysis of literary sources [18,19,20,21,22,23,24,25,26,27] has shown the ability of fluorapatite to luminesce not only under the X-ray influence, but when it is irradiated by a UV light (ultraviolet light) source.
However, there is no information about application of such source for solving technological tasks of preliminary processing of apatite ores, and logging of exploration and drilling boreholes. Application of UV light as a source of luminescence excitation would allow excluding the influence of a harmful factor (X-ray radiation) on the personnel, simplifying the rules of equipment placement and operation (to exclude restrictions to operations with the use of X-ray radiation sources, to reduce the volume of authorization documents), and expanding the possible application, for example, when using borehole sampling.
The authors have measured luminescence spectra of mono-mineral fractions under the UV light source influence in order to confirm the results of the studies [18,19,20,21,22,23,24,25,26,27], to assess the potential and efficient application of the UV light source and form through its interaction with the mineral a stable identification feature that provides the fluorapatite definition in the mineral mixture from the Khibiny apatite–nepheline ores.
This approach to assessing the content of a useful component in apatite–nepheline ores of the Khibiny deposits is new. It was important to obtain the spectral characteristics of the main minerals of apatite–nepheline ores and host rocks and fix the luminescence of minerals in image, using the simplest and safest sources of luminescence excitation.
2. Materials and Methods
At the first study stage, the authors used monomineral fractions of the main (fluorapatite, nepheline) and minor (sodalite, calcite) minerals that make up apatite–nepheline ores and host rocks and have strong luminescence in UV light according to the literature [1,11,21]. Mineral grains were manually selected from the core samples of the Koashva deposit (Figure 1). The studied monomineral fractions consisted of 15 to 20 grains with a size of −3 + 1 mm. All mineral grains were confirmed by the Raman spectroscopy method using the Raman spectrometer EnSpectr R532 (by Spectr-M LLC, RAS Institute of Solid-State Physics, Chernogolovka, Russia) based on an Olympus BX43 optical microscope (by Olympus Corp., Tokyo, Japan). Wavelength is 532 nm, power—15 mW, objective—20×, exposure time—200 ms, number of repetitions—100. The obtained Raman spectra of minerals were compared with that from RRUFF database (Figure 3).
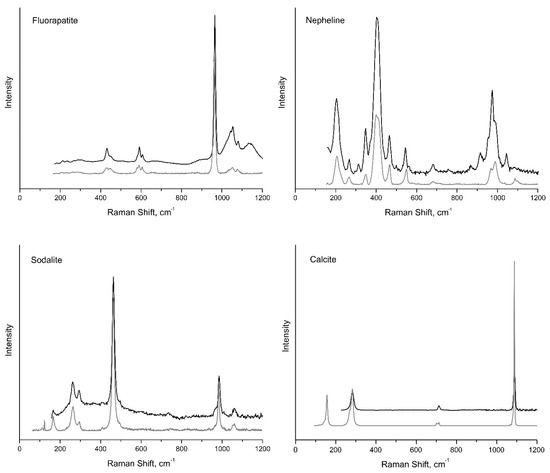
Figure 3.
Raman spectra of minerals: black spectra—this research, grey spectra—RRUFF database (fluorapatite R060333, nepheline R090059, sodalite R060354, calcite R150075).
The spectral characteristics of minerals’ luminescence represented in the collection of mono-mineral fractions were studied on the stand, including a UV light source, a luminescence spectra registration device, and an object table. A specially designed UV lamp based on DRP-5WLG45UV365 LEDs (Light Emitting Diodes) with a maximum wavelength of 365 nm was used as a UV light source (Figure 4). The choice of DRP-5WLG45UV365 LED is due to its spectral characteristics, power consumption (5 W), brightness (5–6 LM), availability for purchase and low cost, and safety for the environment. Additionally, the small size will allow that to be used in the future as part of a device (probe) for rapid analysis of the walls of drilling and blasting wells.
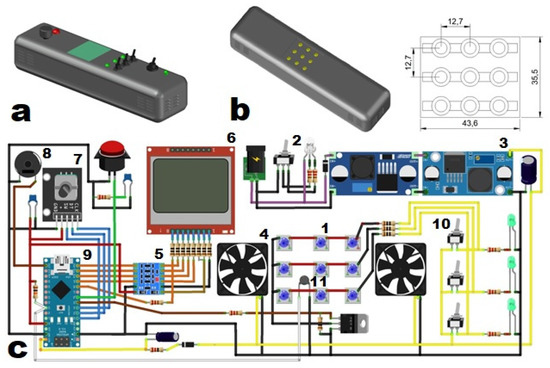
Figure 4.
UV light source based on LEDs: (a) total view; (b) LED layout, (c) circuit diagram: 1—DRP-5WLG45UV365 LEDs; 2—power connector with reverse polarity protection, toggle switch and circuit power indication; 3—adjustable DC-DC voltage converters; 4—ventilators; 5—bidirectional 4-channel converter of logic signal levels; 6—graphic LCD display Nokia 5110; 7—encoder; 8—buzzer; 9—Arduino Nano 3.0 microcontroller; 10—toggle switch; 11—thermistor.
Three rows of LEDs were used during measurements. It should be noted, the possible change of the number of simultaneously working rows of LEDs, regulation of the luminescence (encoder) intensity, as well as switch from constant to pulsed luminescence modes are provided on the system level.
The 5W LEDs used release a large thermal power during operation, causing the need to remove excess heat (heatsink, cooling fan) and to control temperature (thermistor, buzzer). The control and adjustment of the lamp modes, as well as the information output to the graphic LCD (Liquid Crystal Display) display Nokia 5110 is carried out with the Arduino Nano 3.0 microcontroller (Arduino Company, Torino, Italy) built on the basis of ATmega328.
The luminescence spectra of the studied samples were registered with the MS2001i mono-chromator. The luminescence light flux from the studied surface to the mono-chromator’s slit is transmitted with a flexible optic fiber (19 fibers, 100 µm) with characteristics as follows: numerical aperture Na = 0.12 ± 0.02; working spectral range 190–1200 nm. The transmission capacity of the optical fiber used in the entire operating spectral range at the attenuation coefficient less than 10 dB/km is 99.9%. The transmission range of the luminescence light flux to the mono-chromator’s slit in the developed stand is 2 m, which indicates its 100% transmission, without attenuation. A combination of colored optical ultraviolet filters was used to highlight the required spectral area of the primary light source. The selection of filters was carried out on the basis of the spectral curves of the internal transmission coefficient of glasses in a layer of various thicknesses, presented in the Soviet State Standard for colored optical glass. The UVS-5 filter was used to highlighting the spectral area in the range of 250–400 nm. The UVS-5 filter is located first to the UV light source. The second UVS-2 filter selects the spectral area in the range of 270–380 nm. Next, a UVS-8 filter is installed, which selects the spectral area in the range of 320–390 nm. Yellow glass (YG) is placed in front of the recording device (optical fiber inlet): YG-3, emitting the mercury spectrum line of 313 nm, and YG-1, absorbing the spectrum range up to 410 nm.
The luminescence spectral measurement time was 2 s and determined experimentally. Reducing the exposure time did not provide sufficient data for the spectra registration to minerals with low luminescence intensity (fluorapatite, calcite, nepheline). The increase in exposure time was accompanied by an increase in the spectral noise and more than tenfold excess of sodalite peaks to apatite that.
The cuvettes for mono-mineral fractions were made from black PLA plastic using 3D printing technology.
3. Results
The Figure 5 demonstrates the luminescence spectra of mono-mineral fractions of the main and minor minerals composing apatite–nepheline ores and host rocks, which can luminesce under the influence of UV light [1,11,21]. The given spectra illustrate the diversity of minerals not only in intensity, but also in their color determined by the wavelength (Figure 5 and Figure 6).
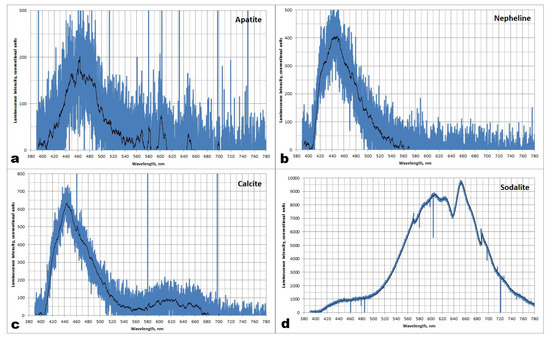
Figure 5.
Luminescence spectra of (a) fluorapatite; (b) nepheline; (c) calcite; (d) sodalite.
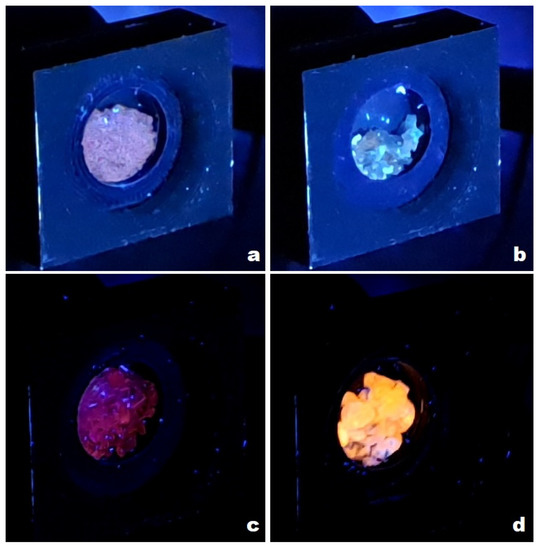
Figure 6.
Luminescence color of (a) fluorapatite; (b) nepheline; (c) calcite; (d) sodalite.
The studied fluorapatite sample demonstrates the maximum intensity in the blue area (448, 464, 471 nm). In the yellow, orange, and red areas, narrow bands with maxima at 568 nm and 581 nm, 602 nm and 608 nm, 648 nm, respectively, are fixed. Maximums in the analyzed spectral range (380 to 800 nm) of nepheline are observed in the blue area (448, 464, 473 nm). For calcite, the maximum luminescence intensity is registered in the blue area (455, 465 nm); a wide band is fixed in the green and yellow areas of the spectral range. Maximum values of sodalite luminescence intensity are observed in orange (605, 610 nm) and red areas (655, 690 nm).
Visual assessment of the studied mono-mineral fractions luminescence (Figure 6) confirms the presence of color differences: fluorapatite has pink-violet luminescence, nepheline—blue-green luminescence; calcite—pink-red luminescence; and sodalite possesses orange-yellow luminescence.
4. Discussion
The first study stage was carried out on pure mono-fractions of minerals from a particular deposit, in order to confirm the luminescence event in UV light primarily for fluorapatite and compare its spectral characteristics with other luminescent minerals. However, in nature, these minerals are components of rocks and ores, and often occur together.
The apatite-nepheline ratio in apatite–nepheline ores can be extremely diverse, and the host rocks (urtite–melteigite) consist of nepheline from 90% (urtite) to 10% (melteigite- jacupirangite). Sodalite is one of the main products of nepheline substitution and is also extremely common. The extremely strong luminescence in sodalite and the overlap of the ranges of the main spectra peaks with fluorapatite and calcite can complicate the use of the luminescence spectrum itself in many cases. However, Figure 6 clearly demonstrates the differences in color and intensity in the luminescence of these minerals.
Literature analysis of the luminescence spectra of the studied natural minerals occurring in the Kola Peninsula apatite deposits, in particular, in the Khibiny apatite–nepheline deposits, indicates a small number of studies on the minerals of this territory [18,19,20]. The variation of luminescent properties of fluorapatite and the luminescence color is connected with wide isomorphism possibilities of Mn2+, Fe2+, Sr2+, Ba2+, Pb2+, Ce3+, Pr3+, Nd3+, Sm3+, Eu2+, Tb3+, Dy3+, Er3+, Tm3+, Yb3+ ions in hexagonal structure of fluorapatite, presence of non-equivalent calcium positions (Ca1 and Ca2 with coordination number of 9 and 7 and C3 and C5 symmetry, respectively), as well as the effects of luminescence co-activation in various combinations [11,18,21,28,29,30,31].
The character of the spectrum of the studied sample is close to the spectrum of apatite from the Khibiny urtites, where the first peak located in the blue area occurs due to presence of Eu2+ ions in the crystal lattice; the second peak (in the orange area) is associated with presence of Mn2+ ions. The described lilac color of apatite luminescence close to the studied sample is associated with presence of these elements-luminogens [18].
The earlier studies of luminescent properties of fluorapatite and its possible application in pre-concentration [19,20] have also shown that the main contribution to fluorapatite luminescence under X-ray radiation is made by Mn2+ centers with maxima at 560 nm and 600 nm. According to [3], Mn2+ content in apatite from the Khibiny apatite–nepheline ores is 142 ppm on average, content of rare-earth elements is from 7000 ppm to 13,000 ppm, from which Eu2+ accounts for 44 ppm on average. The main rare earth elements are Ce, La, and Nd. Fluctuations of Mn and Eu contents are insignificant in diverse Khibiny apatite–nepheline ore bodies. It allows assuming stability of spectral characteristics of fluorapatite in different deposits of the Khibiny massif.
5. Conclusions
The first study stage was carried out on mono-fractions of some main minerals from the Khibiny apatite–nepheline ores under the influence of ultraviolet light with a maximum wavelength of 365 nm. The studies have registered spectral characteristics of fluorapatite, nepheline, sodalite, and calcite. The obtained luminescence spectra correlate well with previously published data. The study has confirmed the stable ability of fluorapatite to luminesce in ultraviolet light, which is associated with the peculiarity of its chemical composition—high content of REE and constant presence of Mn. However, overlapping of luminescence ranges of fluorapatite, sodalite, and calcite can complicate the definition of fluorapatite in the rock by luminescence spectra in the case when these minerals occur in the rock all together. Therefore, the main diagnostic feature is supposed to be the color of the luminescence and its intensity in the minerals.
The prospects of using the color and glow intensity as the main identification feature of fluorapatite are determined by the application scope. The luminescent properties of the minerals that make up the apatite–nepheline ores and host rocks of the Khibiny massif are applied in sampling the borehole walls, and in assessing the distribution of the useful component in the block being prepared for mining. The UV light source of luminescence excitation in minerals is the best suited for this aim due to its cheapness, simplicity of installation and maintenance, safety, and possibility to obtain data in-situ.
In the next working stage, the authors intend to study similarly lumps of the main rocks and ores occurring in the Khibiny apatite–nepheline deposits. It is also planned to modify the UV light source and recording device (video camera) for work in the limited borehole space and create software to process and analyze the camera images.
Author Contributions
Analysis of the luminescence spectra and color mono-minerals fractions, D.N.S. and A.A.K.; literature review, D.N.S. and A.A.K.; illustration preparations, D.N.S. and A.A.K.; diagnostics of the mono-minerals fractions by the Raman spectroscopy method, A.A.K.; design of the UV lamp based on DRP-5WLG45UV365 LEDs with a maximum wavelength of 365 nm, V.V.B.; mono-minerals fractions formation, D.A.A.; registration of the spectral characteristics of minerals luminescence and color represented, V.V.B. and D.A.A. All authors have read and agreed to the published version of the manuscript.
Funding
This research was funded by RSF (project No. 22-27-20153).
Data Availability Statement
Not applicable.
Acknowledgments
The authors are grateful to anonymous reviewers and the editor for their help on improving this paper.
Conflicts of Interest
The authors declare no conflict of interest.
References
- Dudkin, O.B.; Kozyreva, L.V.; Pomerantseva, N.G. Mineralogy of the Khibiny Apatite Deposits; Nauka Publish: Saint-Petersburg, Russia, 1964; p. 236. [Google Scholar]
- Yakovenchuk, V.N.; Ivanyuk, G.Y.; Pakhomovsky, Y.A.; Men’shikov, Y.P. Minerals of the Khibiny Massif; Earth Publish: Moscow, Russia, 1999; ISBN 5-900395-19-7. [Google Scholar]
- Kogarko, L. Chemical Composition and Petrogenetic Implications of Apatite in the Khibiny Apatite-Nepheline Deposits (Kola Peninsula). Minerals 2018, 8, 532. [Google Scholar] [CrossRef]
- LLC “Zoloto and Technologii”. Control of Grades during Mining of Deposits of Solid Minerals. Available online: https://zolteh.ru/technic/kontrol_soderzhaniy_pri_otrabotke_mestorozhdeniy_tverdykh_poleznykh_iskopaemykh/ (accessed on 1 October 2022).
- Pavlishina, D.N. Ore Quality Management Using Radiometric Methods for Monitoring the Content of Useful Components (on the Example of the Oleniy Ruchey Deposit). Ph.D. Thesis, Mining Institute KSC RAS, Apatity, Russia, 14 April 2016. [Google Scholar]
- Dunaev, V.A.; Yanitsky, E.B. Formation features of plume of drilling and blasting wells and distribution in it components regulating the quality of mineral resources (on the example of Kovdorsky apatite-staffelite deposit). Nauchnye Vedom. BelGU Seriya Estestv. Nauk. 2014, 10, 158–165. [Google Scholar]
- Yanitsky, E.B.; Dunaev, V.A. Rationale for technique of operational sampling apatite-staffelite ores of kovdorsky deposit. Min. Inf. Anal. Bull. Sci. Tech. J. 2015, 8, 87–97. [Google Scholar]
- Dvoryanskih, D.S.; Kosarev, A.D.; Zhiboedov, Y.V.; Shmonov, A.A. Interval logging in blast holes for 3D geological modeling of blasting blocks at Lebedinsky GOK. Gorn. J. 2022, 6, 55–58. [Google Scholar] [CrossRef]
- Pavlishina, D.N.; Vlasov, B.A.; Tereshchenko, S.V. Evaluation of the influence of excitation and registration of the apatite luminescence on the results of separating the khibiny poor apatit-containing ores. Fundam. I Prikl. Vopr. Gorn. Nayk 2017, 1, 208–214. [Google Scholar]
- Neradovsky, Y.N.; Kompanchenko, A.A.; Bazay, A.V.; Baybikova, Y.B. Study of the structural and chemical features of fluorapatite of the Khibiny Massif as a potential raw material for processing. Obogashchenie Rud 2020, 4, 14–20. [Google Scholar] [CrossRef]
- Gaft, M.; Reisfeld, R.; Panczer, G. Modern Luminescence Spectroscopy of Minerals and Materials; Springer: Berlin/Heidelberg, Germany, 2005. [Google Scholar] [CrossRef]
- Tereshchenko, S.V.; Shibaeva, D.N.; Alekseeva, S.A. X-Ray Luminescence Separation of Khibiny Low-Grade Apatite Ore. J. Min. Sci. 2019, 55, 124–133. [Google Scholar] [CrossRef]
- Tereshchenko, S.V.; Marchevskaya, V.V.; Shibaeva, D.N.; Aminov, V.N. Resource-saving dressing technology for apatite-nepheline ores of the Khibiny massif. Obogashchenie Rud 2018, 3, 32–38. [Google Scholar] [CrossRef]
- Lukichev, S.V.; Gromov, E.V.; Pavlishina, D.N.; Tereshchenko, S.V. Evaluating efficiency of ecologically balanced mining technology for strategic Partomchorr deposit in the Arctic zone of Russia. Gorn. J. 2017, 12, 57–62. [Google Scholar] [CrossRef]
- Tereshchenko, S.V.; Marchevskaya, V.V.; Chernousenko, E.V.; Rukhlenko, E.D.; Pavlishina, D.N.; Smolnyakov, A.A. Complex ore pretreatment in technology of low grade apatite-nepheline ore concentration. Min. Inf. Anal. Bull. Sci. Tech. J. 2015, 1, 35–41. [Google Scholar]
- Tereshchenko, S.V.; Denisov, G.A.; Marchevskaya, V.V. Radiometric Methods of Testing and Mineral Raw Material Separation; International Academy of Sciences of Ecology, Human Security and Nature (MANEB): Saint-Petersburg, Russia, 2005; p. 264. ISBN 5-93049-001-X. [Google Scholar]
- Tereshchenko, S.V.; Marchevskaya, V.V.; Maslov, A.D.; Golovanov, V.G.; Pogrebnyak, O.S. Formation of high-quality ore from mined ore mass is one of the conditions for rational technology of its processing. Vestn. MSTU. Proc. Murm. State Tech. Univ. 1998, 1, 111–118. [Google Scholar]
- Gorobets, B.S.; Rogozhin, A.A. Luminescence Spectra of Minerals. Guidebook; VIMS: Moscow, Russia, 2001; p. 316. ISBN 5-901837-01-0. [Google Scholar]
- Tereshchenko, S.V. Scientific Bases of Luminescent Separation of Mineral Raw Materials. Ph.D. Thesis, Saint Petersburg Northwestern State Technical University, Saint-Petersburg, Russia, 4 October 2005. [Google Scholar]
- Tereshchenko, S.V. Preconcentration of Substandard Ores Based on X-ray Luminescent Properties of Calcium-Containing Minerals. Ph.D. Thesis, Vladikavkaz, Russia, 1991. [Google Scholar]
- Izoitko, V.M. Technological Mineralogy and Ores Valuation; Nauka Publish: Saint-Petersburg, Russia, 1997. [Google Scholar]
- Shchapova, Y.V.; Votyakov, S.L.; Ivanov, V.Y.; Pustovarov, V.A. Apatite luminescence of crystal-bearing nests of the Subpolar Urals when excited by stationary X-ray and synchrotron radiation. In Proceedings of the XI All-Russian Youth Scientific Conference, Yekaterinburg, Russia, 25–28 May 2020. [Google Scholar]
- Rassulov, V.A. Luminescent Spectrometry of Zircon, Fluorite, Scheelite and Apatite as an Indicator of the Ore-Formational Type of Deposits. Ph.D. Thesis, Russian State Geological Prospecting University, Moscow, Russia, 22 December 2011. [Google Scholar]
- Gorobets, B.S.; Portnov, A.M. Deciphering the luminescence spectra of apatites from various deposits. Proc. Mineral. Mus. Estate A.E. Fersman 1971, 20, 70–75. [Google Scholar]
- Votyakov, S.L.; Kholodnov, V.V. X-ray in-situ thermal spectroscopy and monochromatic TSL in the study of the electronic subsystem and properties of natural apatite. In Proceedings of the XI All-Russian Youth Scientific Conference, Yekaterinburg, Russia, 25–28 May 2020. [Google Scholar]
- Votyakov, S.L.; Borisov, D.R.; Kholodnov, V.V.; Chashchukhina, V.A.; Krasnobaev, A.A. Luminescence as a basis for typification of apatites from various rocks and ores of the Urals. Yearbook 1995 1996, 74–78. [Google Scholar]
- Portnov, A.M.; Gorobets, B.S. Luminescence of apatite from various types of rocks. DAN SSSR 1969, 184, 199–202. [Google Scholar]
- Shchapova, Y.V.; Votyakov, S.I.; Mikhalevsky, G.B.; Ivanov, V.Y.; Pustovarov, V.A. Impurity luminescence centers in fluorapatite from quartz-bearing paragenesis according to photo-, cathode- and synchrotron-induced luminescence. Geodymamics Tectonophys. 2022, 13, 1–9. [Google Scholar] [CrossRef]
- Taraschan, A.N. Luminescence of Minerals; Naukova Dumka: Kiev, Ukraine, 1978; p. 296. [Google Scholar]
- Votyakov, S.L.; Krasnobaev, A.A.; Krohalev, V.Y. Problems of Applied Spectroscopy of Minerals; Nauka: Ekaterinburg, Russia, 1993; p. 235. [Google Scholar]
- Waychunas, G.A. Apatite Luminescence. Rev. Mineral. Geochem. 2002, 48, 701–742. [Google Scholar] [CrossRef]
Disclaimer/Publisher’s Note: The statements, opinions and data contained in all publications are solely those of the individual author(s) and contributor(s) and not of MDPI and/or the editor(s). MDPI and/or the editor(s) disclaim responsibility for any injury to people or property resulting from any ideas, methods, instructions or products referred to in the content. |
© 2022 by the authors. Licensee MDPI, Basel, Switzerland. This article is an open access article distributed under the terms and conditions of the Creative Commons Attribution (CC BY) license (https://creativecommons.org/licenses/by/4.0/).